apresentação do powerpoint fernandes phd... · vectores cav-2, nomeadamente ... bioprocesso com...
TRANSCRIPT


Bioprocess design of canine adenovirus vectors
for gene therapy applications
Paulo David Machado dos Santos Fernandes
Dissertation presented to obtain a Ph.D. degree in Engineering and Technology Sciences,
Biotechnology
Instituto de Tecnologia Química e Biológica António Xavier
Universidade Nova de Lisboa
Supervisor: Paula Marques Alves
Co-supervisor: Ana Sofia Coroadinha
With the financial support from FCT, under contract SFRH / BD / 70810 / 2010

ii
Bioprocess design of canine adenovirus vectors for gene therapy applications
By Paulo Fernandes
First edition:
Cover: MDCK cells in microcarriers infected with CAV-2 vectors.
ITQB-UNL/iBET Animal Cell Technology Unit
Instituto de Tecnologia Química e Biológica/
Instituto de Biologia Experimental e Tecnológica
Av. da República EAN, 2780-157 Oeiras, Portugal
http://tca.itqb.unl.pt
http://www.itqb.unl.pt
http://www.ibet.pt
Copyright ©2015 by Paulo Fernandes
All rights reserved
Printed in Portugal
iii
Supervisors:
Dr. Paula Marques Alves, CEO of iBET, Instituto de Biologia Experimental e Tecnológica
(iBET), Oeiras, Portugal; Invited associate professor at Faculdade de Ciências e
Tecnologia, NOVA university of Lisbon; Principal investigator and Director of Animal Cell
Tecnology Unit at Instituto de Tecnologia Química e Biológica (ITQB/UNL), Oeiras,
Portugal
Dr. Ana Sofia Coroadinha, Auxiliary investigator and Head of Cell line development and
molecular biotechnology laboratory, Animal Cell Technology Unit, iBET and ITQB/UNL,
Oeiras, Portugal
Jury:
Dr. Otto-Wilhelm Merten, Head of the Applied Vectorology and Innovation group of
Généthon, Généthon, Évry, France
Dr. Rubén Hernández-Alcoceba, Investigator of CIMA – Center for Applied Medical
Research, University of Navarra, Pamplona, Spain
Dr. Michael Parkhouse, Head of the Infections & Immunity group, IGC, Oeiras, Portugal
Prof. Manuel J. T. Carrondo, Professor of Chemical and Biochemical Engineering at
Faculdade de Ciências e Tecnologia, NOVA university of Lisbon; Director of iBET and
Head of the Engineering Cellular Applications Laboratory from Animal Cell Technology
Unit, iBET and ITQB/UNL, Oeiras, Portugal.

iv
Foreword
This thesis is the result of four years of research at the Animal Cell Technology Unit of
ITQB-UNL/iBET, Oeiras, Portugal, under the supervision of Paula Marques Alves and Ana
Sofia Coroadinha.
This dissertation aimed to contribute to the advance of gene therapy by developing and
optimizing the production of canine adenovirus type 2 vectors, and by understanding the
biological features modulating adenovirus vector propagation.
v
Acknowledgements
I would like to express my gratitude to all the people that contributed to this thesis and to
the hosting institutions, iBET and ITQB, for the excellent working conditions.
To my supervisor, Dr Paula M. Alves, for the opportunity to let me grow as a scientist in
animal cell technology unit (ACTU) and develop this work, for the example of dedication,
for the confidence, guidance, support, pragmatism and for granting me all the means to
work.
To my co-supervisor, Dr Ana Sofia Coroadinha, for the guidance, confidence and support,
for making me feel a peer and for pushing my enthusiasm to science.
To Dr Eric J. Kremer, from IGMM, Montpellier, France, for providing the materials
necessary to start the area of CAV-2 vectors at ACTU, for the time, enthusiasm, inspiration
and discussions during this journey.
To the financial support provided by Fundação para a Ciência e Tecnologia
(SFRH/BD/70810/2010) and by European Commission, through the FP7 project
BrainCAV.
To the key persons in any bioprocess developed at ACTU – Marcos Sousa (upstream
process) and Dr. Cristina Peixoto (downstream process) – for the guidance and support.
To former and current colleagues from ACTU for the technical help and great times I have
spent with you in these years. In particular, to Vanessa Bandeira, Carina Brilha, Rute
Castro, Sofia Rebelo, Filipa Rodrigues, Marta Silva, Daniel Simão and Hugo Soares.
Aos meus amigos de longa data, Francisca, André, Sofia e Mafalda, por todos os momentos
e aventuras que ajudam a recuperar energias e resolver problemas mesmo sem falar
deles. Em especial à Francisca pela companhia nesta caminhada de PhD students, por me
obrigar a apanhar ar, pelas conversas e gargalhadas importantes em não perder o foco e
continuar em frente. Ao grupo das sessões pós-laboratório no jardim do Cego – Francisca,
André e Raquel.
À Maria, pelo exemplo de genuidade, bondade e boa disposição, pelo carinho e pelo apoio
especial que faz com que tudo valha a pena.

vi
À minha maravilhosa Família, pelo exemplo de força, integridade, e pelo espírito positivo
mesmo nas situações mais difíceis. Em particular à minhas primas Armanda e Paulinha
pelo apoio especial neste último ano. À minha avó Pataca, à minha mãe e ao meu pai, pelo
altruísmo e sacrifício em dar a educação e a vida que sempre sonharam aos filhos. À
minha irmã Mónica, pelo exemplo de determinação e por mostrar o quão importante é o
pilar Família para ultrapassar qualquer obstáculo que nos apareça no caminho.
vii
Abstract
The potential of human adenovirus vectors as vehicles for gene transfer with clinical
applications in vaccination, cancer treatment and in many monogenic and acquired
diseases has been demonstrated in several studies and clinical trials. However, the
clinical use of these vectors can be limited by pre-existing humoral and cellular anti-
capsid immunity. One way to circumvent this bottleneck while keeping the advantages of
using adenovirus vectors is using non-human viruses such as Canine Adenovirus type 2
(CAV-2). Moreover, CAV-2 vectors present attractive features to develop potential
treatment of neurodegenerative and ocular disorders. While the interest in CAV-2 vectors
increases, scalable and robust production processes are required to meet the need for
preclinical and possibly clinical uses.
This PhD thesis aimed to develop and optimize the production process of CAV-2 vectors,
namely E1-deleted (ΔE1) and helper-dependent vectors (HDVs), by i) addressing
technical aspects to enable large-scale production compliant with the guidelines for
manufacturing clinical material and ii) understanding cell physiological state and virus
replication behind high production titers and product quality.
Being MDCK cells already approved by the regulatory agencies (FDA and EMA), the use of
MDCK-based cell lines can facilitate the acceptance of CAV-2 clinical grade production.
Accordingly, MDCK-E1 and MDCK-E1-Cre cell lines were established in Chapter II, with
titers comparable to those described for human adenovirus producing cells. In addition, a
clear correlation between E1 (mostly E1A) expression levels and CAV-2 production was
observed during clone characterization, corroborating the importance of evaluating E1
levels when screening and developing adenovirus producer cells.
The need of larger amounts of vectors requires a CAV-2 manufacturing protocol
compliant with process scales. To address this, in Chapter III bioprocess development for
ΔE1 CAV-2 vectors production in stirred tank bioreactors and serum-free medium was
done. To do so, two approaches were evaluated: i) using microcarriers technology (part
A) and ii) using cells adapted to grow in suspension (part B). While productivities in
microcarriers-based bioprocess were similar to those from monolayer static cultures,
serum was still necessary for cell attachment. The production process was completely
serum-free with cells adapted to suspension, although a slight decrease in cell specific
productivity was observed. Both processes developed constitute a progress in CAV-2
viii
vectors availability at larger scales, leveraging the manufacturing process of CAV-2
vectors to the level of human adenovirus vectors.
The HDV production system, that comprises the use of Cre recombinase-expressing cells
and infection schemes with two vectors (HDV and helper vector (HV)), is more complex
than ΔE1 vectors system. Therefore, special attention was paid to the propagation of
HDVs. HDV production was optimized by evaluating MDCK-E1-Cre cell line stability and
infection conditions in Chapter IV. MDCK-E1-Cre cells specific productivity decreased
with the increase of cell culture passage. Best infection conditions (defined MOI ratio
between HDV and HV) were sufficient to minimize HV contamination and surpass the
need of Cre-expressing cells. The amplifications performed under a defined MOI of HDV
and HV can be thus moved to MDCK-E1 cells, which presents a robust performance even
under high passage number (Chapter II and Chapter IV). Despite these advances, HDV
production yields were still lower than ΔE1 vectors. This was further explored in Chapter
V by monitoring HDV replication steps to understand what factors were still limiting
production yields. Replication progression was intensified during HDV production, as
genome replication occurred faster during HDV production, leading to higher and earlier
expression of structural proteins. Such high viral protein content was consistent with
increased cell death observed during production and contributed to the low volumetric
titers. The low infectivity of the HDVs generated suggested a defective maturation
process and/or increased levels of defective particles. Altogether, this study identifies
genome replication, viral protein synthesis and maturation as features to be modulated in
the pursuit of an optimal HDV production.
In conclusion, a bioprocess for CAV-2 vectors meeting the technical aspects for large-scale
and/or clinical material production was developed. Important bioprocess parameters
were defined and a better understanding of adenovirus replication and producer cell
physiology was achieved. This work contributes to the progress of gene therapy and
biotechnology by debottlenecking the availability of a new vector to clinical applications
and by improving the state-of-the-art on adenovirus manufacturing.
ix
Resumo
Os vectores adenovirais humanos têm demonstrado elevado potencial como veículos
para a transferência de genes. As suas aplicações clínicas são vastas, passando pelo
desenvolvimento de vacinas, tratamento de cancro e doenças monogénicas. No entanto, o
uso clínico destes vectores pode ser condicionado pela imunidade humoral e celular pré-
existente em pacientes, resultante da exposição a este tipo de vírus ao longo da vida. Este
problema pode ser ultrapassado com o uso de adenovírus não-humanos, tais como os
adenovírus caninos tipo 2 (CAV-2), que mantêm todas as vantagens associadas ao uso de
vectores adenovirais. Mais ainda, os vectores CAV-2 possuem características promissoras
para serem usados no desenvolvimento de tratamentos contra doenças
neurodenegerativas e oculares. Como tal, o interesse pelos vectores CAV-2 tem
aumentado, o que torna imperativo o desenvolvimento de processos de produção
robustos e escaláveis que possam ir de encontro à quantidade e qualidade necessárias de
material biológico para aplicação em ensaios pré-clínicos e clínicos.
Esta tese de doutoramento teve como objectivo desenvolver e optimizar a produção de
vectores CAV-2, nomeadamente vectores com delecção na região E1 (ΔE1) e vectores
helper-dependent (HDV), de modo a i) respeitar os aspectos técnicos que facilitam a
produção em larga-escala e/ou de material com grau clínico e ii) compreender a fisiologia
das células produtoras e a replicação viral para desenvolver um bioprocesso com
produtividade máxima.
As células MDCK, já usadas para produção de outros vírus e aprovadas pelas autoridades
reguladoras de produtos para uso humano (FDA e EMA), foram usadas no Capítulo II
para estabelecer linhas celulares produtoras de vectores CAV-2 (MDCK-E1 e MDCK-E1-
Cre). Os títulos de produção de CAV-2 com estas novas linhas celulares foram
semelhantes aos descritos para células produtoras de adenovírus humanos. Durante este
trabalho foi também observada uma correlação entre os níveis de E1 (principalmente
E1A) e produção de CAV-2, o que revela a importância da avaliação dos níveis de E1 no
rastreio e selecção de linhas celulares produtoras de vectores adenovirais.
A crescente procura de vectores CAV-2 torna necessário o desenvolvimento e
implementação de um protocolo de manufactura compatível com as escalas usadas em
bioprocesso. Nesse sentido, a produção foi transferida para biorreactores de tanque
agitado e para meio de cultura sem soro (Capítulo III) usando duas abordagens: i)
tecnologia de microcarriers, para permitir cultura de células aderentes em sistema

x
agitado (parte A) e ii) adaptação de células aderentes a crescimento em suspensão
(parte B). A produtividade de vectores CAV-2 no bioprocesso baseado em microcarriers
foi semelhante à obtida em culturas estáticas, no entanto foi necessário suplementar o
meio de cultura com soro para permitir a adesão das células aos microcarriers. O
bioprocesso com células adaptadas a suspensão ocorreu em condições livres de soro,
embora tenha resultado numa ligeira diminuição dos títulos volumétricos. Ambos os
bioprocessos permitem a produção de vectores CAV-2 a escalas maiores, tornando o
processo de manufactura equivalente ao usado para adenovírus humanos.
O sistema de produção de HDV, que inclui células produtoras a expressar Cre
recombinase e esquemas de co-infecção com dois vectores (HDV e vectores helper (HV)),
é mais complexo que o sistema de produção de vectores ΔE1. Por isso, a propagação de
HDV foi estudada em maior detalhe. Para definir os pontos-chave na produção de HDV, a
estabilidade da linha celular MDCK-E1-Cre e as condições de infecção foram avaliadas no
Capítulo IV. A produtividade específica das células MDCK-E1-Cre diminuiu com o
aumento do número de passagens em cultura. Por outro lado, a optimização da MOI de
HDV e de HV nas co-infecções foi suficiente para minimizar a contaminação de HV e, por
conseguinte, ultrapassar a necessidade de usar células que expressem Cre. Esta
observação indica que, usando uma MOI definida de HDV e de HV, a amplificação de HDV
pode ser transferida para células MDCK-E1, que apresentam maior robustez em termos
de performance, mesmo com passagens elevadas em cultura (Capítulo II e Capítulo IV).
Apesar destes avanços, a produção de HDV continua a ser inferior à de vectores ΔE1. Este
aspecto foi estudado no Capítulo V ao monitorizar a replicação de HDV para
compreender que factores estão a limitar a sua propagação. Curiosamente, o progresso da
replicação foi intensificado durante a produção de HDV. Mais especificamente, a
replicação de genomas foi mais rápida que aquela observada com vectores ΔE1, levando a
uma expressão precoce e mais elevada das proteínas virais. O conteúdo elevado de
proteínas virais foi consistente com um aumento da morte celular após infecção e
contribuiu para a diminuição dos títulos virais. Adicionalmente, a baixa infecciosidade
dos HDV produzidos sugere um processo defectivo de maturação. Em suma, este estudo
identificou a replicação do genoma viral, a síntese de proteínas virais e a produção de
partículas defectivas/maturação como aspectos a serem modulados para estabelecer uma
produção melhorada de HDV.

xi
Em conclusão, neste trabalho foi desenvolvido um bioprocesso para produção de vectores
CAV-2 compatível com os aspectos técnicos de produção em larga-escala e/ou de material
para uso clínico. Ao mesmo tempo, parâmetros relevantes para o sucesso do bioprocesso
foram definidos e combinados com um melhor conhecimento da replicação adenoviral e
da fisiologia da célula produtora. Como resultado, i) o estado da arte sobre a manufactura
de adenovírus foi melhorado e ii) a produção de vectores CAV-2 é agora compatível com
as escalas usadas em bioprocesso e com o desenvolvimento de material para uso humano,
o que constitui um avanço para o progresso da terapia génica e da biotecnologia.
xii
Thesis publications
Published:
1. Fernandes P, Almeida AI, Kremer EJ, Alves PM, Coroadinha AS. 2015. Canine helper-
dependent vectors production: implications of Cre activity and co-infection on adenovirus
propagation. Sci Rep. accepted (in press)
2. Fernandes P, Simão D, Guerreiro M, Kremer EJ, Coroadinha AS, Alves PM. 2015. Impact
of Adenovirus life cycle on the generation of canine helper-dependent vectors. Gene Ther.
Jan;22(11):40-9. http://dx.doi.org/10.1038/gt.2014.92
3. Fernandes P, Peixoto C, Santiago VM, Kremer EJ, Coroadinha AS, Alves PM, 2013.
Bioprocess development for canine adenovirus type 2 vectors. Gene Ther. Apr;20(4):353-
60. http://dx.doi.org/10.1038/gt.2012.52
4. Fernandes P, Santiago VM, Rodrigues AF, Tomás H, Kremer EJ, Alves PM, Coroadinha
AS. 2013. Impact of E1 and Cre on Adenovirus Vector Amplification: Developing MDCK CAV-
2-E1 and E1-Cre Transcomplementing Cell Lines. PLoS One. 2013;8(4):e60342.
http://dx.doi.org/10.1371/journal.pone.0060342
Submitted:
5. Fernandes P, Silva AC, Coroadinha AS, Alves PM. Propagation of Adenovirus vectors. In
D.T. Curriel (ed.) Adenoviral Vectors for Gene Therapy, 2nd edition, Academic Press
(submitted)
In preparation:
6. Fernandes P, Sousa MFQ, Kremer EJ, Coroadinha AS, Alves PM. Suspension MDCK-E1 cell
line for the manufacturing of CAV-2 vectors (in preparation)
Other publications in the scope of virus production:
7. Silva AC, Roldão A, Teixeira A, Fernandes P, Sousa MFQ, Alves PM 2015. Cell
immobilization for the production of viral vaccines. In: Al-Rubeai, Mohamed (Ed.), Animal
Cell Culture, Cell Engineering, Vol. 9, Springer. http://dx.doi.org/10.1007/978-3-319-
10320-4_17
8. Silva AC, Fernandes P, Sousa MFQ, and Alves PM. 2013. Scalable Production of
Adenovirus Vectors, p. 175-196. In M. Chillón and A. Bosch (ed.), Adenovirus, vol. 1089.
Humana Press. http://dx.doi.org/10.1007/978-1-62703-679-5_13

xiii
List of contents
Chapter I – Introduction ……………………………………………………………………………………………. 1
Chapter II – Developing MDCK CAV-2-E1 and E1-Cre transcomplementing cell lines …. 31
Chapter III – Upstream bioprocess development for E1-deleted CAV-2 vectors …………. 55
Part A – Production with adherent cells using microcarrier technology………... 57
Part B – Production with cells adapted to suspension …………………………………... 73
Chapter IV – Implications of Cre activity and co-infection on canine helper-dependent
vector production …………………………………………………………………………………………………….. 91
Chapter V –Impact of adenovirus life cycle on the generation of canine helper-dependent
vectors …………………………………………………………………………………………………………………... 113
Chapter VI – Discussion and perspectives ………………………………………………………………. 141
Appendix ………………………………………………………………………………………………………...……. 153

xiv

Chapter I
Introduction
This chapter is adapted from the book chapter:
Fernandes P, Silva AC, Coroadinha AS, Alves PM. Upstream bioprocess for adenovirus
vectors. David T Curiel (ed), Adenoviral vectors for gene therapy, Academic Press
(under review)
Chapter I
2
Contents
1. Gene therapy ................................................................................................................................................. 3
2. Adenovirus vectors for gene therapy ................................................................................................. 3
2.1. Structure and genome ............................................................................................................................ 4
2.2. Infection and replication cycle ........................................................................................................... 4
3. Manufacturing of adenovirus vectors ................................................................................................ 5
3.1. Adenovirus vectors and producer cells .......................................................................................... 5
3.1.1. 1st generation vectors ................................................................................................................... 6
3.1.2. Conditionally-replicating vectors ............................................................................................ 7
3.1.3 2nd generation vectors ................................................................................................................... 7
3.1.4. 3rd generation vectors ................................................................................................................... 8
3.1.5. Novel adenovirus vectors ............................................................................................................ 9
3.2. Upstream process for adenovirus vectors ................................................................................. 10
3.2.1. Cell culture and adenovirus production process ........................................................... 11
3.2.2. Adenovirus seed stocks ............................................................................................................. 12
3.2.3. The infection process and harvest strategy ..................................................................... 13
3.2.4. Productivity of Adenovirus vector manufacturing ....................................................... 14
3.2.5. Adenovirus production at high cell density ..................................................................... 14
3.2.6. Physical parameters and process monitoring................................................................. 15
3.3. Production process of helper-dependent vectors .................................................................. 16
3.4. Downstream process for adenovirus vectors .......................................................................... 17
4. Concerns in the manufacturing of adenovirus vectors for product release .................. 18
4.1. Extraneous agents ................................................................................................................................ 18
4.2. Replication competent adenovirus ............................................................................................... 19
4.3. Vector genetic stability ....................................................................................................................... 19
4.4. Quantity and potency .......................................................................................................................... 20
5. Scope of the thesis ................................................................................................................................... 20
6. Author contribution ................................................................................................................................ 21
7. References ................................................................................................................................................... 22
Introduction
3
1. Gene therapy
Gene therapy is defined as the transfer of genetic material into an individual’s cells or
tissues, treating or preventing a disease. After three decades of research, gene therapy is
currently considered solid (1), showing success in the clinic with an emphasis on rare,
inherited disorders including hemophilia (2), Leber Congenital Amaurosis (3-5) and X-
linked severe combined immunodeficiency (6). Moreover, a critical milestone was
achieved with the market authorization from European Medicines Agency of Glybera
(alipogene tiparvovec), an adeno-associated virus based product to treat deficiency in
lipoprotein lipase in patients with a severe form of hyperglyceridemia (7). Included in
gene therapy is also the sub-field of oncolytic virotherapy. In fact, most of the clinical
trials in gene therapy have been aimed at the treatment of cancer. Oncolytic virotherapy
utilises viruses capable of specifically targeting and replicating in tumor cells and causing
cell lysis, thereby killing the infected tumor cells (8). In some cases, these viruses are
modified to deliver suicide genes or immunostimulatory cytokines to enhance the
immune response against cancer.
Although nonviral approaches are becoming increasingly common to perform gene
delivery (9), viral vectors remain by far the most popular approach, having been used in
more than 70% of the trials performed to date (http://www.abedia.com/wiley/). Among
these, the top most used are based on: i) adenovirus, ii) retrovirus, iii) vaccinia virus, iv)
adeno-associated virus, v) poxvirus, vi) lentivirus and vii) herpes simplex virus. Worth
mentioning the emerging interest on vectors from adeno-associated viruses and
lentivirus, as depicted by the research dedicated to these vectors and growth rate of use
(9).
2. Adenovirus vectors for gene therapy
Viral vectors are currently the most efficient tools for in vivo gene transfer. Due to their in
vivo efficiency, adenovirus vectors (AdV) are used more often than any other vector in
clinical trials, in which the human adenovirus vector (HAdV) serotypes 5 and 2 are the
most characterized ones among all other serotypes of the same family (10, 11).
Adenovirus wide cell tropism in quiescent and non-quiescent cells, its inability to
integrate the host genome and its high production titre (12) make AdV very good
candidates for human gene therapy.
Chapter I
4
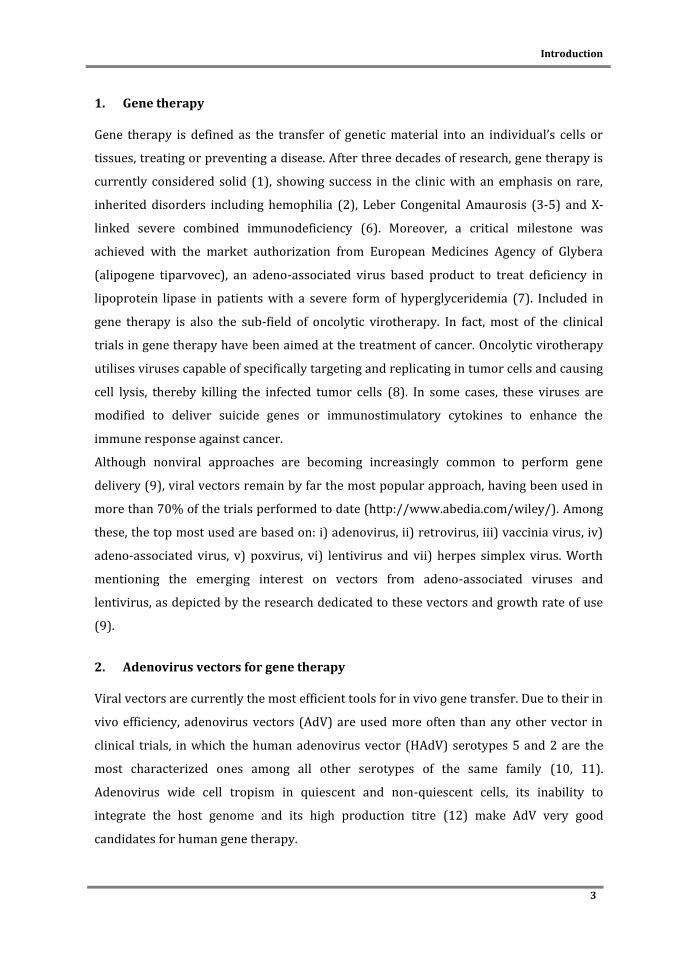
2.1. Structure and genome
Adenoviruses are non-enveloped, icosahedral viruses of 60 to 90 nm with a linear double
stranded DNA genome of ~36 kbp. The genome can be divided in two sets of
transcriptional units: early genes that are expressed before the onset of viral DNA
replication, and late genes which are preferentially expressed after viral DNA replication
(Figure 1). This classification also defines the early and late phase of the infectious cycle.
E1A is the first gene to be expressed following infection and is involved in the
transcription of the other viral early genes. The mRNAs of major late transcription unit
are grouped into five families (L1-L5) which are dependent on the activation of major late
promoter during viral DNA replication.
Figure 1. Schematic representation of wild-type adenovirus genome and the different generations of non-replicating vectors. E1 to E4: early region transcript units; L1 to L5: late region transcprits unit; ITR: inverted terminal repeats; MLP: major late promoter; Ψ: packaging signal; GOI: gene-of-interest.
2.2. Infection and replication cycle
The sequential uptake process relies on an initial contact with cellular receptors
responsible for attachment (13) and internalization of the virus particle (14).
Internalization occurs by receptor-mediated endocytosis (15). Once in the cytosol, the
virion is transported via microtubuli towards the nucleus. Meanwhile, the particle is
dismantled by an ordered elimination of structural proteins so that when it reaches the
nuclear membrane, only the core particle is left. Adenovirus uncoating culminates with
the release of the viral DNA into the nucleus via nuclear pore complexes (16). The early
genes are responsible for expressing mainly non-structural, regulatory proteins (17).
ITR
E1A/E1BMLP
E3L1 to L5
E2B E2A E4ITR
Ψ
ITR
∆E1 ∆E3Ψ
GOI ITR
ITR
∆E1 ∆E3Ψ
GOI ITR
∆E2B ∆E2A ∆E4
ITR
Ψ
GOI and stuffer DNA ITR
Wild-type
1st generation
2nd generation
3rd generation
Introduction
5
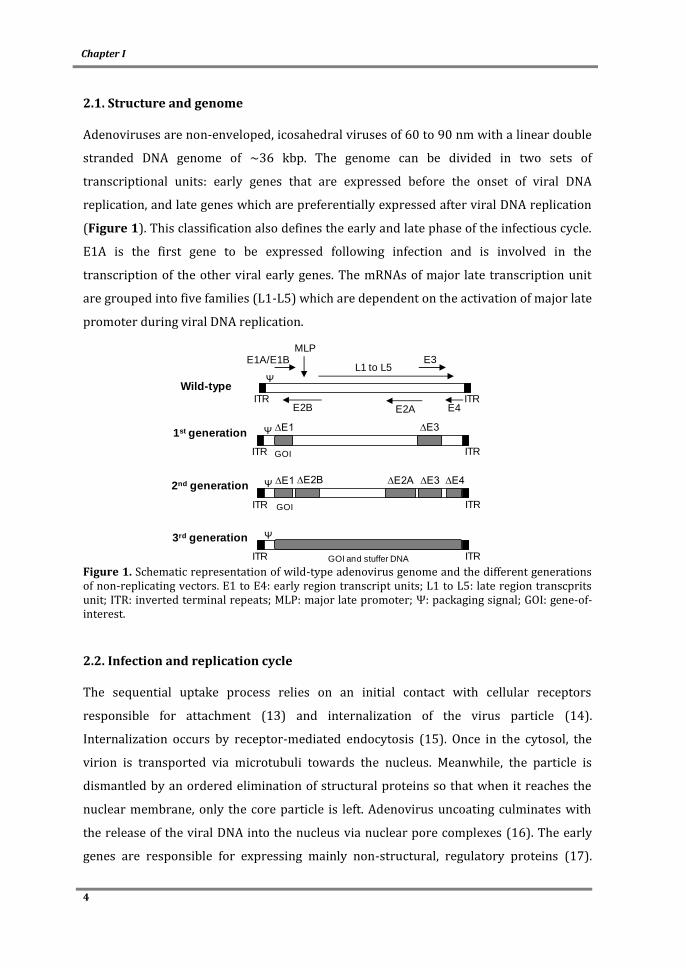
These proteins alter the expression of host proteins that are necessary for DNA synthesis,
activate other early genes (such as the virus-encoded DNA polymerase) and avoid
premature death of the infected cell by the host-immune defenses. During viral genome
replication, late phase transcription is activated (17). This infection phase is mainly
focused on producing capsid proteins and packaging the replicated viral genomes;
structural proteins are assembled into virions, viral DNA is packaged and viruses are
released from the cell as a result of virus induced cell lysis (Figure 2).
Figure 2. Adenovirus replication cycle. Briefly, after cell binding (1), the mature viral particle is internalized and transported towards the nucleus (2). During this transport, the particle is dismantled by an ordered elimination of some structural proteins and culminates with the delivery of the viral genome into the nucleus via nuclear pore complexes. Once in the nucleus, early genes are expressed (3, 4) and viral DNA replication starts (5). Late phase of infection is then activated and structural proteins expressed (6, 7). These proteins are likely assembled into empty virions (8), followed by the packaging of viral genome (9). Finally, viral particles are subjected to a maturation process becoming infectious (10) and cell lysis is accomplished (11).
3. Manufacturing of adenovirus vectors
3.1. Adenovirus vectors and producer cells
The development of adenovirus vectors is based on modifications of wild type genome
mainly by removing viral gene(s) and adding expression cassettes with the gene(s) of
Chapter I
6
interest (GOI). While these viral genes are essential for virus replication, to propagate
adenovirus vectors it is necessary the establishment of producer cell lines, i.e. cells
expressing the viral elements deleted from the vector genome. The adenovirus vectors
that are non-replicating in a clinical setting and strictly used for gene transfer can be
categorized as first, second or third generation vectors, depending on the extension of
viral genes removed (Figure 1). The conditionally-replicating vectors are another
category of adenovirus vectors and are designed to specifically target, propagate and
deliver gene(s) in cancer cells.
3.1.1. 1st generation vectors
The majority of adenovirus vectors used for gene therapy or many other therapeutic
purposes are non-replicating, in which the E1 region is deleted from the genome often in
combination with E3, providing space for the insertion of expression cassettes. Such
adenovirus vectors are denominated as first generation or E1-deleted (∆E1) vectors. E1
region can be divided in E1A and E1B subunits and codes for products involved in the
activation of other early and late genes expression and in making host cells more
amenable to initiate virus propagation (i.e. inhibition of antiviral response and apoptosis)
(18-24). Therefore, to produce ∆E1 vectors a producer cell line containing adenovirus E1
sequences is necessary to complement these functions. On the other hand E3 region,
which is involved in antagonizing host defense mechanisms, is not essential for viral
amplification in vitro (25). Together, the deletion of E1 and E3 permits a transgene insert
capacity up to 8.2 kb. HEK 293 represents the traditional cell line used to trans-
complement the lack of E1 and produce adenovirus vectors. Because of the significant
homology of first-generation adenovirus vectors with the HEK 293 DNA, the main
disadvantage in using HEK293 is its potential to generate replication-competent
adenoviruses (RCA), raising safety concerns in a therapeutic product (26-30). To avoid
this, several cell lines were established under the rational of reducing the homology of
viral DNA sequences incorporated in cell line with viral vectors genome (reviewed in
(31)). Following this effort, PER.C6 represents the first cell line in which the generation of
RCA is abolished and typical adenovirus yields are ensured (32).
HEK293 cell line was generated with sheared HAdV-5 DNA, however the current strategy
to generate producer cell lines for E1 complementation is through the incorporation of
the contiguous sequences of E1A and E1B sequences into the cell line genomes. Strategies
Introduction
7
to minimize any recombination between viral genome and cell DNA were further
developed and involve the integration of E1A and E1B into producer cell genome at
separate locations (33, 34). E1 complementing cell lines are the backbones for the
remaining producer cells used for other adenovirus vectors.
3.1.2. Conditionally-replicating vectors
Conditionally-replicating adenovirus vectors, being also denominated oncolytic
adenoviruses, have been employed for cancer treatment to specifically target and
replicate in cancer cells (8, 35, 36). The lytic nature of adenovirus replication directly kills
tumor-infected cells, releasing the associated antigens. On the other hand, progeny
viruses can be spread throughout a tumor, further infecting and destroying other cancer
cells.
The construction of oncolytic adenoviruses is based on the deletion or modification of
viral gene functions that are critical to viral replication in normal cells, but dispensable in
tumor cells. This includes insertion of mutations in E1A region (37, 38), or deletion of
E1B (39, 40) from wild-type genome, to target cancer cells with defects in the
retinoblastoma (Rb) and p53 pathways, respectively, as these pathways are defective in
most human tumors. Another strategy in targeting oncolytic adenoviruses replication in
cancer cells involves the control of E1 transcription by using tumor or tissue specific
promoters such as prostate-specific enhancer/promoter for prostate cancer (41), or E2F-
I for cancer cells with a defective Rb pathway (42). In addition to these modifications,
these vectors can further incorporate genes encoding immune stimulatory factors to
boost the anti-tumor immunity (reviewed in (8)), giving rise to the so-called armed-
vectors and to one of the most promising gene delivery systems for cancer therapy.
Production of oncolytic adenoviruses is similar to first generation vectors, in which E1
functions are provided by the producer cell line. Therefore, cell lines already established
for first generation vectors are used to the manufacture of these vectors and include HeLa
(43), A549 (44), HEK293 and PER.C6 (45).
3.1.3 2nd generation vectors
Although the removal of E1 region renders the virus replication-defective, the delivery of
high doses of first generation vectors and/or the presence of E1-like factors in many cells
can lead to the expression of other viral proteins in vivo (31, 46-48). This can induce a
Chapter I
8
strong immune response, reducing the efficacy of these vectors. To circumvent that,
further deletions in E2 and/or E4 regions were explored, leading to the establishment of
2nd generation vectors. The E2 region (E2A and E2B subunits) codes for three proteins
essential for viral replication: DNA-binding protein (DBP) transcribed from E2A subunit,
terminal protein and viral DNA polymerase from E2B subunit (49). E4 products modulate
transcription, the cell-cycle, cell signaling and DNA repair and are essential for productive
virus infection (50), but only one of the ORF3 or ORF6 is required for successful virus
production in cell culture (51, 52).
Given the toxicity associated with E2 and E4 viral products, most of the cell lines for 2nd
generation vectors rely on the use of an inducible system (reviewed in (31)). Similarly to
1st generation vectors, the majority of E1/E2 and E1/E4 complementary producer cells
lines use HEK 293 as parental cell line.
Despite the sophisticated systems available for 2nd generation vectors manufacturing,
including vector construct and incorporation of inducible systems in the producer cell
lines, the use of these vectors remains without advances. In general, reduced production
yields are obtained for vectors with multiple deletions. In fact, when compared to first
generation vectors, the yields of these vectors can be reduced, and no major
improvement in toxicity is observed in vivo (31, 53-58). Moreover, the transgene
expression of these vectors is also described as unstable, which probably made 3rd
generation vectors a more suitable choice to that end (reviewed in (59)).
3.1.4. 3rd generation vectors
3rd generation vectors, also known as gutted or gutless, high capacity or helper-
dependent vectors (HDVs), are the most advanced adenovirus vectors. They are devoid of
all viral coding genes, only harbouring on their genome the essential cis-acting elements:
inverted terminal repeats (ITRs) and packaging signal. This allows the insertion of
therapeutic gene or genes up to ~37 kb. Additional stuffer DNA is included to render
vector genome size similar to wild-type and maintain viral particle stability (60). Apart of
their increased safety, the use of these vectors result in long-term transgene expression
(reviewed in (59)). To produce these vectors, while E1 functions are provided by the
producer cell line, the remaining functions are provided by an helper vector (HV). In fact,
the need of a HV increases the complexity of production system and it is the main
disadvantage of these type of vectors. Adding HV to the production system implicates the
Introduction
9
production of both HDV and HV, raising the need to reomove HV contamination from the
final product. To date, the most elegant way to prevent HV propagation is the approach
described by Parks et al. in which the HV packaging signal is flanked by loxP sites, and
under the expression of Cre-recombinase the HV genome is cleaved (hampering its
encapsidation) and HV particles production is minimized (61). Thus, besides E1,
producer cell lines for HDV have to further express Cre recombinase. Following same
approach, FLPe recombinase system is also used to minimize HV contamination (62, 63).
Similarly to E1 transcomplementing cell lines, the most common producer cell lines using
recombinase system are derived from HEK 293 cells, although PER.C6 cells are also used
to that purpose (reviewed in (31)). Despite these efforts in HDV production system, two
major bottlenecks are still found when considering the use of HDV in patients: i) HV
contamination is still not fully eliminated and ii) HDV production yield still faces the need
of multiple amplification steps and inconsistency in infectious particles yields (discussed
in section 3.3). Despite these bottlenecks, the increased cassette incorporation, improved
expression and lower immunity is still pushing their further development (59).
3.1.5. Novel adenovirus vectors
While most research on vector development is based on the utilization of human
adenovirus serotypes 5 and 2, over 80% of the adult population has been naturally
exposed to these viruses (64). Therefore, pre-existing humoral and cellular immunity
may preclude efficient gene transfer when these adenovirus vectors are used (65-70).
Apart of limitations in therapeutic efficacy (71), immune responses against the vector
may result in a number of undesirable side effects, including liver toxicity (72) and
systemic inflammatory response syndrome due to repeated vector administration (73).
Eliminating liver tropism and the epitopes involved in viral proteins recognition by
neutralizing antibodies has been proposed to reduce the immune response. Alternatively,
vectors based on low seroprevalence AdVs can be also be used to circumvent the pre-
existing immunity. In addition, the diversity of AdV protein isoforms and their variety of
ligand-receptor interactions found in the different serotypes can also be the basis to
target different cell types (70). Adenovirus vectors derived from alternative human and
non-human serotypes, to which the human population has a lower or no prevalence of
neutralizing antibodies, are being currently investigated.

Chapter I
10
Human subgroup B adenoviruses, and in particular serotypes 11 and 35, are being used
to develop adenovirus vectors (reviewed in (31)). Typically, E1 (both E1A and E1B)-
deleted vectors from these serotypes cannot replicate in regular E1 producer cell lines
already established for serotype 5 vectors, although E1A-deleted vectors can be
propagated in PER.C6 cells (74). These vectors are therefore produced by modifying the
typical 1st generation cell lines already available (75-78) or replacing vectors genes by
HAdV5 sequences to permit viral propagation on unmodified cell lines, such as PER.C6
(79).
Several non-human adenoviruses derived from bovine, simian, porcine, ovine, murine
and canine sources have been used as backbone to develop E1-deleted vectors for gene
therapy or vaccine purposes (reviewed in (70)). For the majority of non-human vectors,
specialized E1 producer cells have been developed to propagate these vectors, such as
bovine kidney or fetal retinal cells expressing Bovine or human adenovirus E1 sequences
(80), or canine kidney cells expressing the canine adenovirus type 2 (CAV-2) E1 (81, 82).
Chimpanzee derived vectors of subgroup E can be produced on HEK293 cells already
developed (83, 84). However, similarly to HAdV11 and HAdV35, chimpanzee derived
vectors of subgroup B cannot be propagated on these cells, and a chimeric strategy is
used to allow propagation in HEK293 cells (85, 86). CAV-2 derived vectors are probably
the best described and advanced non-human vectors (87). The ability to preferentially
transduce neurons combined with a remarkable capacity of axonal transport, make CAV-
2 vectors candidates for the treatment of neurodegenerative diseases (88). Furthermore,
3rd generation CAV-2 vectors were already developed and tested in animal models,
confirming their potential for gene transfer based therapies (89, 90).
3.2. Upstream process for adenovirus vectors
An adenovirus production process starts by growing the cell line of choice to the desired
cell density for infection followed by the inoculation of an adenovirus stock to initiate the
infection and virus production cycle (Figure 3) (91). The need for significant amounts of
clinical grade adenovirus vectors, which in some cases may reach 1013 total
particles/patient (1011 infectious particles/patient), requires efficient and robust
processes for production and purification at large-scale compliant with good
manufacturing practices (GMP)(12). From a scalable point-of-view, the production of
adenovirus vectors encompasses several bioengineering aspects that must be carefully
Introduction
11
undertaken to maximize bioprocess yields and reduce production costs. In this section,
process considerations for the adenovirus production will be discussed mostly focusing
on first generation vectors, as the main bioprocess advances have been achieved with
these vectors.
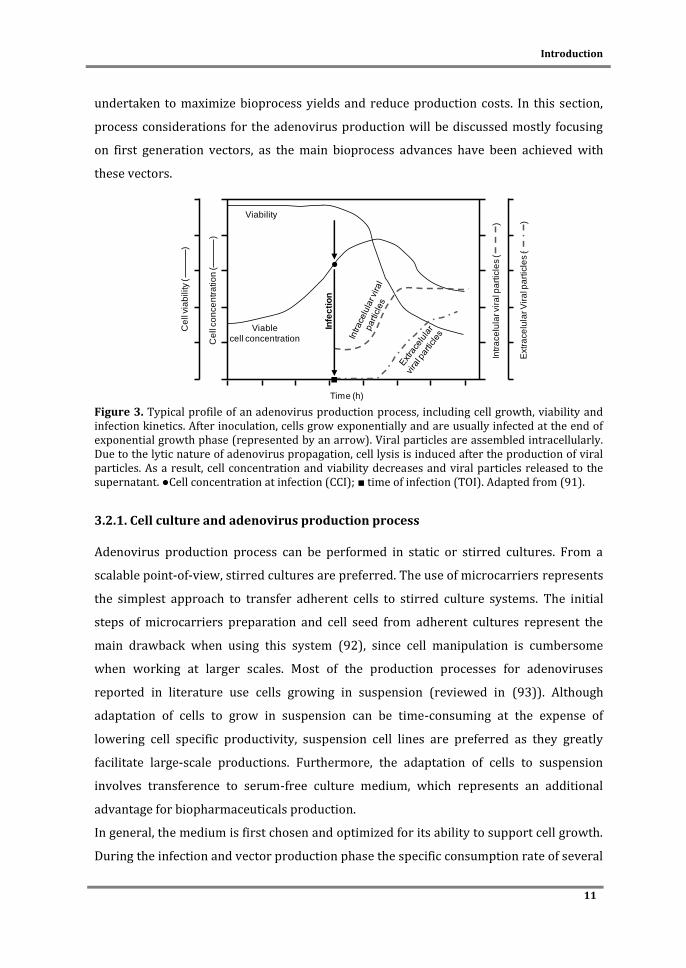
Figure 3. Typical profile of an adenovirus production process, including cell growth, viability and infection kinetics. After inoculation, cells grow exponentially and are usually infected at the end of exponential growth phase (represented by an arrow). Viral particles are assembled intracellularly. Due to the lytic nature of adenovirus propagation, cell lysis is induced after the production of viral particles. As a result, cell concentration and viability decreases and viral particles released to the supernatant. ●Cell concentration at infection (CCI); ■ time of infection (TOI). Adapted from (91).
3.2.1. Cell culture and adenovirus production process
Adenovirus production process can be performed in static or stirred cultures. From a
scalable point-of-view, stirred cultures are preferred. The use of microcarriers represents
the simplest approach to transfer adherent cells to stirred culture systems. The initial
steps of microcarriers preparation and cell seed from adherent cultures represent the
main drawback when using this system (92), since cell manipulation is cumbersome
when working at larger scales. Most of the production processes for adenoviruses
reported in literature use cells growing in suspension (reviewed in (93)). Although
adaptation of cells to grow in suspension can be time-consuming at the expense of
lowering cell specific productivity, suspension cell lines are preferred as they greatly
facilitate large-scale productions. Furthermore, the adaptation of cells to suspension
involves transference to serum-free culture medium, which represents an additional
advantage for biopharmaceuticals production.
In general, the medium is first chosen and optimized for its ability to support cell growth.
During the infection and vector production phase the specific consumption rate of several
Viability
Viable cell concentration
Infe
cti
on
Ce
ll c
on
ce
ntr
atio
n (
)
Ce
ll v
iab
ility (
)
Extr
ace
lula
r V
ira
l pa
rtic
les (
)
Intr
ace
lula
r vir
al p
art
icle
s (
)
Time (h)

Chapter I
12
medium components is increased, and need to be taken into account when defining the
final medium formulation. Also, cells cultured with media containing animal serum
should be avoided. The undefined composition and high batch-to-batch variability of
serum, together with its potential source of contaminations, raises safety concerns and
hinders the standardization of cell culture processes for the production of
biopharmaceuticals (94). Almost all media manufacturers commercialize serum-free
formulations designed and optimized for specific cell lines and/or final product.
The majority of scalable adenovirus manufacturing processes are performed in stirred-
tank bioreactors both for microcarriers and suspension cultures (93). Technological
advances in disposable equipments, such as single-use Wave and stirred tank bioreactors,
have been shown by several companies (e.g. GE Healthcare, Sartorius, PBS). The use of
such systems poses several advantages for GMP production by avoiding the need of
cleaning and sterilization validation and alleviating facility requirements. Therefore, the
increasing use of disposable equipments for adenovirus manufacturing is anticipated.
3.2.2. Adenovirus seed stocks
AdV viral particles must be rescued from the initial vector genome construct. This is
usually performed by linearization of vector genome from the plasmid, and transfection
of producer cells. Viruses are then harvested once cytopathic effect is evident or, as
alternative, 2-3 days after transfection. This procedure is typically performed in static
culture conditions. When working with producer cells easily transfectable and first
generation vectors, the rescue of viral particles after this transfection step is relatively
high, and one or two more production rounds are performed to amplify the amount of
viral vectors and establish a purified viral seed stock. In such cases, scalable production
processes are usually established once a purified viral seed stock is obtained. When
developing viral vectors that typically present low productivities, such as HDV, process
development is defined from the transfection step to the final viral seed stock production
to maximize working-scale and volumetric productivity in all steps and minimize the
number of amplifications required to produce sufficient viral material (91) (discussed in
section 3.3.).
For GMP production, the purified viral seed stock must be certified and tested to confirm
the absence of adventitious agents (see section 4.1). On the other hand, the use of well
established purified viral seed stocks is advised even for research purposes as it ensures

Introduction
13
reproducibility between different production batches. Therefore, determination of viral
particles, physical to infectious particles ratio and selection of best storage conditions are
carefully undertaken to ensure that particles properties from viral seed stock are
maintained (95-99).
3.2.3. The infection process and harvest strategy
Production process starts once producer cells are growing, being infected afterwards and
the newly produced adenoviruses harvested and the end of process (Figures 2 and 3).
Defining best process-related parameters, such as multiplicity of infection (MOI), cell
concentration at infection (CCI), time of infection (TOI) and time of harvest (TOH) is
determinant to ensure an optimal production process. Because adenovirus infections are
relatively fast and lytic, processes are established as single-round infections with MOI > 1
to ensure that all cells are infected. Although MOI > 1 needs to be established, infecting
the cells with more virus than those optimally required may have a negative effect on
cells viability, compromising virus productivity. TOI or CCI is usually selected when cells
are at exponential growth phase. For adherent, static cultures, cells are infected when 60-
80% confluence is achieved, while for stirred cultures the typical cell densities range used
for adenovirus production is 0.5-1 x 10⁶ cells/mL in batch mode with medium exchange
at infection. To produce adenovirus above this cell density and maintain cell specific-
productivity, fed-batch or perfusion modes must be added to the bioprocess (discussed in
section 3.2.5.).
After infection, the cell growth is arrested within 24 hpi. Viral DNA replication and virus
assembly occurs between 10-24 hpi and 20-48 hpi, respectively. As virus production
progresses, cell viability decreases after 24 hpi. Typically, at 48 hpi, when the volumetric
virus productivity reaches its plateau, the cell viability is around 40-80%. At this point, a
percentage of the virus (between 10-50%) has already been released from lysed cells, but
the rest of the virus remains intracellular. The cultivation process can proceed further
with no significant increase in virus production, but with a significant increase in virus
found in the culture medium. Harvest timing and method can be tailored to the entire
bioreaction bulk, or only to the intra- or extracellular fractions. The remaining cells are
lysed either by freeze-thaw cycles (100, 101) or using a detergent (102, 103).
Chapter I
14
3.2.4. Productivity of Adenovirus vector manufacturing
One of the most attractive features for adenovirus vectors, namely ∆E1-deleted vectors,
is the high production yields obtained when compared to other viral vectors. Typically,
titers of ∆E1-deleted vectors range from 103 to 104 IP per cell, whereas genome-
containing particles are one log higher (reviewed in (93)). Considering the usual CCI used
for adenovirus production, this corresponds to a volumetric productivity of 109 – 1010
IP/mL or 1010 – 1011 PP/mL. Worth mentioning that such yields are dependent on
adenovirus vector construct and culture conditions. Some production processes for HDV
are described as holding relatively low specific (102 IP/cell) and volumetric (108 IP/mL)
titers (104, 105) or inconsistent PP:IP ratios (106) (see section 3.3). In addition, cell
specific productivity under batch mode is limited to CCI below 1x10⁶ cells/mL; producing
adenoviruses above this cell concentration results in lower specific yields (see section
3.2.5). Finally, cell physiological state can also impact the infectivity of the newly
produced adenoviruses. Indeed, when producing adenoviruses with MOI higher than the
optimal, the resulting PP:IP ratio tends to increase.
3.2.5. Adenovirus production at high cell density
In a batch operation mode, the cell density at infection is a very important parameter as it
impacts virus production. In fact, the narrow range for an optimal infection cell density
between 0.5-1.0x10⁶ cells/mL is well documented (reviewed elsewhere (91)): a drop in
specific productivity at higher cell densities occurs even though medium formulations
allow cell growth up to 5 x 10⁶ cells/mL. This is often referred to as the “cell density
effect”. While this phenomenon is not totally understood, the decrease in productivity is
thought to be due to limitations in a nutrient critical for virus propagation, accumulation
of inhibitory byproducts, or a combination of both (107). Following this hypothesis, the
typical approach to maintain cell-specific productivity at increased cell densities consists
of exchanging medium at infection time. This operation mode, widely used for viral vector
production, enables maximum cell-specific productivity up to 2x10⁶ cells/mL. The main
limitation of such approach is the incorporation of a medium exchange/cell separation
step. While at scales of few liters, this is relatively easy to perform by centrifugation,
when dealing with hundreds or thousands of liters such manipulation is highly
cumbersome. At these scales, fed-batch or perfusion are more feasible approaches.
Introduction
15
Several fed-batch approaches were devoted to adenovirus production based on the
control or addition of glutamine, glucose and aminoacids (108-110). Despite the
simplicity to implement, most of the fed-batch strategies towards maintaining cell-
specific productivity have failed.
Perfusion processes are capable of achieving high cell densities, through a continuous
renewal of fresh medium, providing new nutrients and diluting/removing inhibiting-
byproducts. Therefore, perfursion must be such that nutrient supply and byproducts
removal rates are sufficient to ensure robust cell performance at increasing cell
concentration. The perfusion rates described for adenovirus production can range from
0.5 to 3 culture volumes per day (V/day), being 2 V/day the rate mostly used (43, 111-
113). When compared to low cell density batch productions, specific productivity of 293
cells infected at 3 – 6x10⁶ cells/mL was maintained, which constituted a 5-fold increase in
the final production yield (111, 113). The highest cell density tested to successfully
produce adenoviruses under perfusion mode is described in (43) using Hela cells at 107
cells/mL.
Other efforts were made to better understand the cell density effect. The specific
metabolic demands of producer cells during growth and virus production have been
analyzed through a metabolic flux analysis approach, showing that a favorable metabolic
state for adenovirus production should have an increase in glycolytic and TCA fluxes
(113, 114), and in ATP production rates upon infection. This state is also extended to
perfusion modes (113). Furthermore, it was demonstrated that a decrease in the
proportion of cells in S phase was related to a decrease in specific productivity at high cell
densities (115). Following this observation, the synchronization of HEK293 cells
chemically or by lowering temperature led to an enrichment of cells in S phase and up to
a 7.3 fold increase in AdV cell specific titer (116). Despite these insights, perfusion modes
still remain the best strategy to successfully produce AdV at high cell densities.
3.2.6. Physical parameters and process monitoring
Physical parameters such as temperature, pH and dissolved oxygen are usually well
established when manufacturing AdV at larger scales. The impact of such parameters on
AdV production has been previously reviewed (91, 93), therefore only optimal values
used to produce AdV are discussed.
Chapter I
16
Production of adenoviruses is typically set to cell growth temperature of 37°C, although
previous works showed that by decreasing the temperature to 35°C an improvement in
virus production can be obtained. The common pH values for adenoviruses have been
established as 7.2 – 7.3. On the other hand, production of canine adenoviruses in stirred
tank bioreactor at pH 7.4 showed production yields similar to human adenoviruses.
Despite the lack of reports addressing the effect of dissolved oxygen (DO) on adenovirus
production, most of the controlled processes set DO to values higher than 30% (92, 93).
Small-scale productions are typically monitored with offline sampling. While such offline
methods can be used to monitor some parameters, such as cell concentration and pH,
online methods are very useful for stirred-tank bioreactor productions at large-scale,
specially to select TOI and TOH. The cell/infection status can be monitored through a
variety of noninvasive online measurements. In particular, cell density can be estimated
by the oxygen uptake rate and the capacitance levels (113, 117, 118), as they can also be
used to monitor infection kinetics and confirm the maximum productivity point and
harvest timing.
3.3. Production process of helper-dependent vectors
Despite the potential of HDV, extensive use of such vectors for gene transfer experiments
has been restrained by two main bottlenecks: production yields and HV contamination.
Similarly to first generation vectors, HDV particles need to be rescued from linearized
plasmid after transfecting producer cells. To provide all the viral elements required for
HDV replication, cells must be also infected with HV (see section 3.1.4.). Typically, low
yields from this initial step are obtained and/or multiple rounds of HDV production are
needed until the desired vectors titer is achieved. Reducing the number of amplifications
is a primary condition to establish a robust production process. This also minimizes the
possibility of recombination between HV/HDV and producer cell line, avoiding the
occurrence of RCA, packaging-competent or recombinant HV, which have a propagation
advantage when compared to HDV (119, 120). Therefore, the most significant advances
for scalable production of HDV are designed early in the transfection step to maximize
volumetric productivity and set amplification rounds to its minimum (105).
The importance of recombinase system, such as Cre/loxP, with high levels of Cre to avoid
HV propagation is unquestionable (121). In fact, considering that the remaining HV
contaminant was due to limiting Cre levels that permitted HV to escape packaging signal

Introduction
17
excision (121), major advances were made to increase the levels of recombinase during
HDV production (106). Moreover, the definition of optimal MOI ratio showed a critical
impact either in maximizing HDV propagation, but also in reducing HV contamination.
The use of high HV MOI, besides being unnecessary and even negative for HDV
production (104), implicates the development of alternative designs to attain higher
levels of Cre than those supported by the cell line to reduce HV contamination (106).
Further, this also leads to the accumulation of higher levels of excised helper DNA
molecules (after Cre recombinase excision), increasing the chance of recombination
between viral vectors. In fact, some authors showed that these helper DNA molecules,
being prone to rearrangements, contributed to the generation of recombination between
viral vectors, in which helper vectors with rearranged genomes had a growth advantage
(120). In addition, some studies show a relatively high and/or great inconsistency in
maintaining PP:IP ratios among different preparations of same HDV (106, 122). Special
attention must be paid to this, as the PP:IP ratio of clinical grade adenoviruses is limited
by Food and Drug Administration (see section 4.4.).
3.4. Downstream process for adenovirus vectors
Since downstream processing is not in the scope of this work, only a brief overview is
presented. Traditional purifications of adenovirus vectors are performed by cesium
chloride (CsCl) density gradient ultracentrifugation. While useful for preparations at
laboratory scales, scalable purification of adenovirus vectors relies on membrane and
chromatographic processes (91, 123, 124). The main aim of downstream processing is to
eliminate contaminants, either process related (e.g., bovine serum albumin, Benzonase,
extractables, and leachables) or product related (e.g., host cell proteins, DNA,
proteoglycans, and glycosaminoglycans); other product-related impurities include free
proteins, aggregates, and empty capsids (125). The ultimate goal is to obtain a product
with high purity, potency, and quality, which can meet the stringent guidelines of the
regulatory authorities, such as the FDA and EMA. After harvesting and prior purification
two main steps are employed to production bulk: cell lysis, to release intracellular
adenoviruses and increase the yield, and genomic DNA breakdown, to facilitate DNA
removal. Purification can then be divided in three major steps: clarification,
concentration/purification and polishing. A suitable clarification step should remove cell
debris and large aggregates and can be performed by centrifugation, widely used at

Chapter I
18
laboratory scales, or continuous flow centrifugation and microfiltration at industrially
relevant scales (91, 123, 126, 127). The concentration/purification step aims to reduce
the stream volume and facilitate the upfront equipment and materials. In this step, low
molecular weight proteins, fragmented DNA and other impurities are further removed
and ultrafiltration or chromatography columns are usually employed (91, 123, 128). The
step of polishing is usually performed using chromatographic processes and applied to
remove remaining impurities closely related to the product of interest (91, 128). The final
step for the production of GMP-grade adenovirus product is a filtration using a 0.2 μm
sterile membrane. In the final product, host cell DNA and protein levels should be bellow
the specifications set by the European Pharmacopoeia (Ph. Eur 5.2.3) and the World
Health Organization (WHO expert Committee on Biological Standardization, WHO
Technical Report Series 878, 47th report, 1998) (124).
4. Concerns in the manufacturing of adenovirus vectors for product release
Commonly to vaccines for human use, release of adenovirus vectored products includes
tests for potency, general safety, sterility, purity, identity, and constituent materials. In
addition, screening for bacterial endotoxins and pyrogens are added when the product is
intended for use by injection (U.S. Pharmacopeial Convention and USP-NF bulletin,
http://www.usp.org). Every biopharmaceutical has its own characteristics that are
considered when developing and qualifying these tests. Therefore this section is focused
in the tests connected to the upstream manufacturing process of adenovirus vectors:
extraneous agents, RCAs, vector genetic stability and quantity/potency.
4.1. Extraneous agents
Viral inactivation and clearance steps are generally performed in the production of
inactivated vaccines which contribute in removing potential extraneous agents from final
product. However, these procedures cannot be applied in adenovirus vectors for gene
therapy, as their bioactivity is critical to gene transfer. Safety strategies need to be thus
implemented to lower the risk of introduction and carryover of contaminants, such as
extraneous agents, adventitious viruses, and transmissible spongiforme encephalopathy
causing agents. According to good manufacturing practices, a track record of all the
materials used in construction and manufacturing of adenovirus vectors must be kept.
Master cell banks and master viral seeds must be extensively tested to confirm the

Introduction
19
absence of adventitious viruses according to the ICH Q5A and Q5D guidelines. The use of
animal-derived components should be avoided as much as possible, as it represents a
potential source of contamination (94). In situations where the use of animal components
is unavoidable, excellent traceability and testing are performed to discard any risk of
enter and transfer of extraneous agents to the manufacturing process. The screening for
adventitious has relied on the use of in vitro infectivity assays, in vivo studies and specific
polymerase chain reaction (PCR) tests. More recently, massive parallel sequencing has
been also applied to this end (129).
4.2. Replication competent adenovirus
Contamination of clinical batches with RCA is an important safety concern. Possible
consequences range from increased local inflammatory responses and tissue damage due
to uncontrolled systemic replication in immune-compromised individuals. Although the
issue of RCA formation by homologous recombination was solved by the introduction of
new cell lines like PER.C6 (see section 3.1), regulatory agencies still require testing to
confirm their absence in clinical batches (124). The maximum contamination level is set
to 1 RCA per 3x10¹⁰ VP and is based on the current FDA guidelines for HAdV5 vectors
(FDA Gene Therapy Letter, 2000). The detection of replicating virus is based on the
screening for cytopatic effect (CPE) after inoculating non-complementing cell lines. CPE
positive results are then confirmed by a more specific assay such as PCR or
immunofluorescence (130).
4.3. Vector genetic stability
To confirm product stability throughout the manufacturing process, genetic stability of
the viral vector is tested. To demonstrate this, viral vector is propagated for a number of
passages beyond the level used in production, generally 5 passages (more information at
U.S. Pharmacopeial Convention and USP-NF bulletin, http://www.usp.org). Mutation
frequency in replication-deficient adenovirus is considered rare, however such analysis is
important to evaluate that transgene region and corresponding expression is maintained,
and critical when considering the use of oncolytic adenoviruses, which, unlike gene
transfer-strict vectors, are intended to further propagate in a clinical setting (45).
Extended propagation permits the detection of any recombinant or mutant vector that
Chapter I
20
have a replication advantage over the target vector. For this purpose, PCR detection
combined with sequence analysis of PCR fragments can be used for screening any
variations in transgene sequence that might occur (124).
4.4. Quantity and potency
Quantification of viral particles is important for monitoring yields during process
development, but also in final product to control of the amount of viral protein injected
within an acceptable safety window. Typically, absorvance measurements are used to
quantify physical particles based in the correlations between adenovirus preparations
and absorvance at 260 nm described by Maizel et al. (1968). While these measurements
require purified and concentrated preparations, alternative methods have been
developed to allow adenovirus quantification during process development and,
simultaneously, improve the limit of detection (see bellow) (91).
Adenovirus vectors exert their clinical effect by transducing target cells. Therefore,
quantification of infectious particles is required during the overall production process, for
product release, and stability assessments of viral preparations. In fact, a parameter
considered to represent the quality of preparations is the ratio between the amount of
physical and infectious particles. For gene therapy programs using adenoviruses, PP:IP
ratio must be <30:1 (FDA Gene Therapy Letter, 2000).
Standard plaque assays or tissue culture infectious dose (TCID50) assays using
complementing cell lines can be employed to quantify infectious titers. To improve
accuracy and precision of these assays, alternative methods can be applied which are
based in quantitative PCR techniques or in the detection of the transgene expression.
5. Scope of the thesis
The central objective of this PhD thesis was to develop a scalable production process for
∆E1 and HD CAV-2 vectors using MDCK derived cell lines as producer cells, assuring
optimal cell performance and maximum productivity. Critical cell culture and virus
infection parameters were studied and combined with a better understanding of cell
physiological state and viral cycle steps behind a successful production process.
To accomplish this, the work was organized according to the following:
(I) Evaluate MDCK derived cell lines as cell substrates for the production of CAV-2 vectors.
Introduction
21
Since MDCK cells are accepted in Food and Drug Administration (FDA) and European
Medicine Agency (EMA) and used for the production of many viral vaccines, the use of an
MDCK-based cell lines would facilitate the regulatory approval for the clinical grade
production of CAV-2 vectors. Accordingly, MDCK-E1 and MDCK-E1-Cre cell lines were
established (Chapter II).
(II) Develop a scalable production process for CAV-2 vectors
The need for significant amounts of clinical grade adenovirus vectors, which in some
cases may reach 1013 total particles/patient or 1011 infectious particles/patient, requires
efficient and robust processes for production and purification at large-scale compliant
with good manufacturing practices (GMP) (12). Therefore, current lab-scale protocols
must be adapted and transferred to a scalable stirred culture system (Chapter III).
(III) Establish best infection conditions for HD CAV-2 production
Process optimization for ΔE1 vectors is relatively straightforward. However, given the
production system complexity, special attention must be paid to HDV propagation. Using
the Cre/loxP system, producer cells must express Cre-recombinase, which can be toxic to
cells (131), and production is performed under co-infection. Therefore, cell line stability
and co-infection conditions must be well defined to ensure production process
reproducibility (Chapter IV).
(IV) Identify the limitations in HD CAV-2 vectors production from an adenovirus replication
cycle perspective.
Despite the potentialities of HDV for gene therapy, one important bottleneck is the yields,
which compromises process scale-up, viral particles quality and its availability to pre and
clinical trials. Still, the low productive viral cycle of HDV has been somehow neglected
(Chapter V).
6. Author contribution
Paulo Fernandes wrote this chapter based on the referred bibliography.

Chapter I
22
7. References
1. Naldini, L. 2009. Medicine. A comeback for gene therapy. Science 326:805-806. 2. Nathwani, A. C., E. G. Tuddenham, S. Rangarajan, C. Rosales, J. McIntosh, D. C. Linch,
P. Chowdary, A. Riddell, A. J. Pie, C. Harrington, J. O'Beirne, K. Smith, J. Pasi, B. Glader, P. Rustagi, C. Y. Ng, M. A. Kay, J. Zhou, Y. Spence, C. L. Morton, J. Allay, J. Coleman, S. Sleep, J. M. Cunningham, D. Srivastava, E. Basner-Tschakarjan, F. Mingozzi, K. A. High, J. T. Gray, U. M. Reiss, A. W. Nienhuis, and A. M. Davidoff. 2011. Adenovirus-associated virus vector-mediated gene transfer in hemophilia B. N Engl J Med 365:2357-2365.
3. Bainbridge, J. W., A. J. Smith, S. S. Barker, S. Robbie, R. Henderson, K. Balaggan, A. Viswanathan, G. E. Holder, A. Stockman, N. Tyler, S. Petersen-Jones, S. S. Bhattacharya, A. J. Thrasher, F. W. Fitzke, B. J. Carter, G. S. Rubin, A. T. Moore, and R. R. Ali. 2008. Effect of gene therapy on visual function in Leber's congenital amaurosis. N Engl J Med 358:2231-2239.
4. Maguire, A. M., F. Simonelli, E. A. Pierce, E. N. Pugh, Jr., F. Mingozzi, J. Bennicelli, S. Banfi, K. A. Marshall, F. Testa, E. M. Surace, S. Rossi, A. Lyubarsky, V. R. Arruda, B. Konkle, E. Stone, J. Sun, J. Jacobs, L. Dell'Osso, R. Hertle, J. X. Ma, T. M. Redmond, X. Zhu, B. Hauck, O. Zelenaia, K. S. Shindler, M. G. Maguire, J. F. Wright, N. J. Volpe, J. W. McDonnell, A. Auricchio, K. A. High, and J. Bennett. 2008. Safety and efficacy of gene transfer for Leber's congenital amaurosis. N Engl J Med 358:2240-2248.
5. Testa, F., A. M. Maguire, S. Rossi, E. A. Pierce, P. Melillo, K. Marshall, S. Banfi, E. M. Surace, J. Sun, C. Acerra, J. F. Wright, J. Wellman, K. A. High, A. Auricchio, J. Bennett, and F. Simonelli. 2013. Three-year follow-up after unilateral subretinal delivery of adeno-associated virus in patients with Leber congenital Amaurosis type 2. Ophthalmology 120:1283-1291.
6. Hacein-Bey-Abina, S., J. Hauer, A. Lim, C. Picard, G. P. Wang, C. C. Berry, C. Martinache, F. Rieux-Laucat, S. Latour, B. H. Belohradsky, L. Leiva, R. Sorensen, M. Debre, J. L. Casanova, S. Blanche, A. Durandy, F. D. Bushman, A. Fischer, and M. Cavazzana-Calvo. 2010. Efficacy of gene therapy for X-linked severe combined immunodeficiency. N Engl J Med 363:355-364.
7. Bryant, L. M., D. M. Christopher, A. R. Giles, C. Hinderer, J. L. Rodriguez, J. B. Smith, E. A. Traxler, J. Tycko, A. P. Wojno, and J. M. Wilson. 2013. Lessons learned from the clinical development and market authorization of Glybera. Human gene therapy. Clinical development 24:55-64.
8. Choi, I. K., and C. O. Yun. 2013. Recent developments in oncolytic adenovirus-based immunotherapeutic agents for use against metastatic cancers. Cancer gene therapy 20:70-76.
9. Ledley, F. D., L. M. McNamee, V. Uzdil, and I. W. Morgan. 2014. Why commercialization of gene therapy stalled; examining the life cycles of gene therapy technologies. Gene Ther 21:188-194.
10. McConnell, M. J., and M. J. Imperiale. 2004. Biology of adenovirus and its use as a vector for gene therapy. Hum Gene Ther 15:1022-1033.
11. Tatsis, N., and H. C. Ertl. 2004. Adenoviruses as vaccine vectors. Mol Ther 10:616-629. 12. Dormond, E., M. Perrier, and A. Kamen. 2009. From the first to the third generation
adenoviral vector: what parameters are governing the production yield? Biotechnol Adv 27:133-144.
13. Soudais, C., S. Boutin, S. S. Hong, M. Chillon, O. Danos, J. M. Bergelson, P. Boulanger, and E. J. Kremer. 2000. Canine adenovirus type 2 attachment and internalization: coxsackievirus-adenovirus receptor, alternative receptors, and an RGD-independent pathway. J Virol 74:10639-10649.
14. Wickham, T. J., P. Mathias, D. A. Cheresh, and G. R. Nemerow. 1993. Integrins alpha v beta 3 and alpha v beta 5 promote adenovirus internalization but not virus attachment. Cell 73:309-319.

Introduction
23
15. Nemerow, G. R., and P. L. Stewart. 1999. Role of alpha(v) integrins in adenovirus cell entry and gene delivery. Microbiology and molecular biology reviews : MMBR 63:725-734.
16. Greber, U. F., M. Suomalainen, R. P. Stidwill, K. Boucke, M. W. Ebersold, and A. Helenius. 1997. The role of the nuclear pore complex in adenovirus DNA entry. EMBO J 16:5998-6007.
17. Russell, W. C. 2000. Update on adenovirus and its vectors. J Gen Virol 81:2573-2604. 18. Berk, A. J. 1986. Functions of adenovirus E1A. Cancer surveys 5:367-387. 19. Rao, L., M. Debbas, P. Sabbatini, D. Hockenbery, S. Korsmeyer, and E. White. 1992.
The adenovirus E1A proteins induce apoptosis, which is inhibited by the E1B 19-kDa and Bcl-2 proteins. Proceedings of the National Academy of Sciences of the United States of America 89:7742-7746.
20. Gallimore, P. H., and A. S. Turnell. 2001. Adenovirus E1A: remodelling the host cell, a life or death experience. Oncogene 20:7824-7835.
21. Moran, E. 1993. DNA tumor virus transforming proteins and the cell cycle. Current opinion in genetics & development 3:63-70.
22. Berk, A. J. 1986. Adenovirus promoters and E1A transactivation. Annual review of genetics 20:45-79.
23. Debbas, M., and E. White. 1993. Wild-type p53 mediates apoptosis by E1A, which is inhibited by E1B. Genes & development 7:546-554.
24. Schmitz, M. L., A. Indorf, F. P. Limbourg, H. Stadtler, E. B. Traenckner, and P. A. Baeuerle. 1996. The dual effect of adenovirus type 5 E1A 13S protein on NF-kappaB activation is antagonized by E1B 19K. Molecular and cellular biology 16:4052-4063.
25. Doerfler, W., and P. Böhm. 1995. The Molecular repertoire of adenoviruses. Springer. 26. Lochmuller, H., A. Jani, J. Huard, S. Prescott, M. Simoneau, B. Massie, G. Karpati, and
G. Acsadi. 1994. Emergence of early region 1-containing replication-competent adenovirus in stocks of replication-defective adenovirus recombinants (delta E1 + delta E3) during multiple passages in 293 cells. Hum Gene Ther 5:1485-1491.
27. Hehir, K. M., D. Armentano, L. M. Cardoza, T. L. Choquette, P. B. Berthelette, G. A. White, L. A. Couture, M. B. Everton, J. Keegan, J. M. Martin, D. A. Pratt, M. P. Smith, A. E. Smith, and S. C. Wadsworth. 1996. Molecular characterization of replication-competent variants of adenovirus vectors and genome modifications to prevent their occurrence. J Virol 70:8459-8467.
28. Smith, J. G., and S. L. Eck. 1999. Molecular characterization of an adenoviral vector resulting from both homologous and nonhomologous recombination. Cancer gene therapy 6:475-481.
29. Zhu, J., M. Grace, J. Casale, A. T. Chang, M. L. Musco, R. Bordens, R. Greenberg, E. Schaefer, and S. R. Indelicato. 1999. Characterization of replication-competent adenovirus isolates from large-scale production of a recombinant adenoviral vector. Hum Gene Ther 10:113-121.
30. Murakami, P., E. Pungor, J. Files, L. Do, R. van Rijnsoever, R. Vogels, A. Bout, and M. McCaman. 2002. A single short stretch of homology between adenoviral vector and packaging cell line can give rise to cytopathic effect-inducing, helper-dependent E1-positive particles. Hum Gene Ther 13:909-920.
31. Kovesdi, I., and S. J. Hedley. 2010. Adenoviral producer cells. Viruses 2:1681-1703. 32. Fallaux, F. J., A. Bout, I. van der Velde, D. J. van den Wollenberg, K. M. Hehir, J.
Keegan, C. Auger, S. J. Cramer, H. van Ormondt, A. J. van der Eb, D. Valerio, and R. C. Hoeben. 1998. New helper cells and matched early region 1-deleted adenovirus vectors prevent generation of replication-competent adenoviruses. Hum Gene Ther 9:1909-1917.
33. Farson, D., L. Tao, D. Ko, Q. Li, D. Brignetti, K. Segawa, D. Mittelstaedt, T. Harding, D. C. Yu, and Y. Li. 2006. Development of novel E1-complementary cells for adenoviral production free of replication-competent adenovirus. Mol Ther 14:305-311.
34. Howe, J. A., P. Pelka, D. Antelman, C. Wilson, D. Cornell, W. Hancock, M. Ramachandra, J. Avanzini, M. Horn, K. Wills, S. Sutjipto, and R. Ralston. 2006.
Chapter I
24
Matching complementing functions of transformed cells with stable expression of selected viral genes for production of E1-deleted adenovirus vectors. Virology 345:220-230.
35. Liu, T. C., E. Galanis, and D. Kirn. 2007. Clinical trial results with oncolytic virotherapy: a century of promise, a decade of progress. Nature clinical practice. Oncology 4:101-117.
36. Choi, J. W., J. S. Lee, S. W. Kim, and C. O. Yun. 2012. Evolution of oncolytic adenovirus for cancer treatment. Advanced drug delivery reviews 64:720-729.
37. Heise, C., T. Hermiston, L. Johnson, G. Brooks, A. Sampson-Johannes, A. Williams, L. Hawkins, and D. Kirn. 2000. An adenovirus E1A mutant that demonstrates potent and selective systemic anti-tumoral efficacy. Nat Med 6:1134-1139.
38. Lamfers, M. L., J. Grill, C. M. Dirven, V. W. Van Beusechem, B. Geoerger, J. Van Den Berg, R. Alemany, J. Fueyo, D. T. Curiel, G. Vassal, H. M. Pinedo, W. P. Vandertop, and W. R. Gerritsen. 2002. Potential of the conditionally replicative adenovirus Ad5-Delta24RGD in the treatment of malignant gliomas and its enhanced effect with radiotherapy. Cancer Res 62:5736-5742.
39. Bischoff, J. R., D. H. Kirn, A. Williams, C. Heise, S. Horn, M. Muna, L. Ng, J. A. Nye, A. Sampson-Johannes, A. Fattaey, and F. McCormick. 1996. An adenovirus mutant that replicates selectively in p53-deficient human tumor cells. Science 274:373-376.
40. Freytag, S. O., K. R. Rogulski, D. L. Paielli, J. D. Gilbert, and J. H. Kim. 1998. A novel three-pronged approach to kill cancer cells selectively: concomitant viral, double suicide gene, and radiotherapy. Hum Gene Ther 9:1323-1333.
41. Yu, D. C., Y. Chen, J. Dilley, Y. Li, M. Embry, H. Zhang, N. Nguyen, P. Amin, J. Oh, and D. R. Henderson. 2001. Antitumor synergy of CV787, a prostate cancer-specific adenovirus, and paclitaxel and docetaxel. Cancer Res 61:517-525.
42. Bristol, J. A., M. Zhu, H. Ji, M. Mina, Y. Xie, L. Clarke, S. Forry-Schaudies, and D. L. Ennist. 2003. In vitro and in vivo activities of an oncolytic adenoviral vector designed to express GM-CSF. Molecular Therapy 7:755-764.
43. Yuk, I. H., M. M. Olsen, S. Geyer, and S. P. Forestell. 2004. Perfusion cultures of human tumor cells: a scalable production platform for oncolytic adenoviral vectors. Biotechnol Bioeng 86:637-642.
44. Longley, R., Jr., L. Radzniak, M. Santoro, Y.-S. Tsao, R. G. Condon, P. Lio, M. Voloch, and Z. Liu. 2005. Development of a Serum-free Suspension Process for the Production of a Conditionally Replicating Adenovirus using A549 Cells. Cytotechnology 49:161-171.
45. Working, P. K., A. Lin, and F. Borellini. 2005. Meeting product development challenges in manufacturing clinical grade oncolytic adenoviruses. Oncogene 24:7792-7801.
46. Nevins, J. R. 1981. Mechanism of activation of early viral transcription by the adenovirus E1A gene product. Cell 26:213-220.
47. Gaynor, R. B., and A. J. Berk. 1983. Cis-acting induction of adenovirus transcription. Cell 33:683-693.
48. Imperiale, M. J., H. T. Kao, L. T. Feldman, J. R. Nevins, and S. Strickland. 1984. Common control of the heat shock gene and early adenovirus genes: evidence for a cellular E1A-like activity. Molecular and cellular biology 4:867-874.
49. Swaminathan, S., and B. Thimmapaya. 1995. Regulation of Adenovirus E2 Transcription Unit, p. 177-194. In W. Doerfler and P. Böhm (ed.), The Molecular Repertoire of Adenoviruses III, vol. 199/3. Springer Berlin Heidelberg.
50. Weitzman, M. D. 2005. Functions of the adenovirus E4 proteins and their impact on viral vectors. Frontiers in bioscience : a journal and virtual library 10:1106-1117.
51. Bridge, E., and G. Ketner. 1989. Redundant control of adenovirus late gene expression by early region 4. J Virol 63:631-638.
52. Huang, M. M., and P. Hearing. 1989. Adenovirus early region 4 encodes two gene products with redundant effects in lytic infection. J Virol 63:2605-2615.
53. Gao, G. P., Y. Yang, and J. M. Wilson. 1996. Biology of adenovirus vectors with E1 and E4 deletions for liver-directed gene therapy. J Virol 70:8934-8943.
54. Lusky, M., M. Christ, K. Rittner, A. Dieterle, D. Dreyer, B. Mourot, H. Schultz, F. Stoeckel, A. Pavirani, and M. Mehtali. 1998. In vitro and in vivo biology of recombinant adenovirus vectors with E1, E1/E2A, or E1/E4 deleted. J Virol 72:2022-2032.

Introduction
25
55. O'Neal, W. K., H. Zhou, N. Morral, E. Aguilar-Cordova, J. Pestaner, C. Langston, B. Mull, Y. Wang, A. L. Beaudet, and B. Lee. 1998. Toxicological comparison of E2a-deleted and first-generation adenoviral vectors expressing alpha1-antitrypsin after systemic delivery. Hum Gene Ther 9:1587-1598.
56. Christ, M., B. Louis, F. Stoeckel, A. Dieterle, L. Grave, D. Dreyer, J. Kintz, D. Ali Hadji, M. Lusky, and M. Mehtali. 2000. Modulation of the inflammatory properties and hepatotoxicity of recombinant adenovirus vectors by the viral E4 gene products. Hum Gene Ther 11:415-427.
57. Brough, D. E., C. Hsu, V. A. Kulesa, G. M. Lee, L. J. Cantolupo, A. Lizonova, and I. Kovesdi. 1997. Activation of transgene expression by early region 4 is responsible for a high level of persistent transgene expression from adenovirus vectors in vivo. J Virol 71:9206-9213.
58. Wang, Q., G. Greenburg, D. Bunch, D. Farson, and M. H. Finer. 1997. Persistent transgene expression in mouse liver following in vivo gene transfer with a delta E1/delta E4 adenovirus vector. Gene Ther 4:393-400.
59. Segura, M. M., R. Alba, A. Bosch, and M. Chillon. 2008. Advances in helper-dependent adenoviral vector research. Curr Gene Ther 8:222-235.
60. Parks, R. J., and F. L. Graham. 1997. A helper-dependent system for adenovirus vector production helps define a lower limit for efficient DNA packaging. J Virol 71:3293-3298.
61. Parks, R. J., L. Chen, M. Anton, U. Sankar, M. A. Rudnicki, and F. L. Graham. 1996. A helper-dependent adenovirus vector system: removal of helper virus by Cre-mediated excision of the viral packaging signal. Proceedings of the National Academy of Sciences of the United States of America 93:13565-13570.
62. Ng, P., C. Beauchamp, C. Evelegh, R. Parks, and F. L. Graham. 2001. Development of a FLP/frt system for generating helper-dependent adenoviral vectors. Mol Ther 3:809-815.
63. Umana, P., C. A. Gerdes, D. Stone, J. R. Davis, D. Ward, M. G. Castro, and P. R. Lowenstein. 2001. Efficient FLPe recombinase enables scalable production of helper-dependent adenoviral vectors with negligible helper-virus contamination. Nat Biotechnol 19:582-585.
64. Garnett, C. T., D. Erdman, W. Xu, and L. R. Gooding. 2002. Prevalence and quantitation of species C adenovirus DNA in human mucosal lymphocytes. J Virol 76:10608-10616.
65. Bangari, D. S., and S. K. Mittal. 2006. Current strategies and future directions for eluding adenoviral vector immunity. Current gene therapy 6:215-226.
66. Paillard, F. 1997. Advantages of non-human adenoviruses versus human adenoviruses. Human gene therapy 8:2007-2009.
67. Thomas, C. E., D. Birkett, I. Anozie, M. G. Castro, and P. R. Lowenstein. 2001. Acute direct adenoviral vector cytotoxicity and chronic, but not acute, inflammatory responses correlate with decreased vector-mediated transgene expression in the brain. Mol Ther 3:36-46.
68. Yang, Y., Q. Su, and J. M. Wilson. 1996. Role of viral antigens in destructive cellular immune responses to adenovirus vector-transduced cells in mouse lungs. Journal of virology 70:7209-7212.
69. Sumida, S. M., D. M. Truitt, A. A. Lemckert, R. Vogels, J. H. Custers, M. M. Addo, S. Lockman, T. Peter, F. W. Peyerl, M. G. Kishko, S. S. Jackson, D. A. Gorgone, M. A. Lifton, M. Essex, B. D. Walker, J. Goudsmit, M. J. Havenga, and D. H. Barouch. 2005. Neutralizing antibodies to adenovirus serotype 5 vaccine vectors are directed primarily against the adenovirus hexon protein. J Immunol 174:7179-7185.
70. Lopez-Gordo, E., Podgorski, II, N. Downes, and R. Alemany. 2014. Circumventing antivector immunity: potential use of nonhuman adenoviral vectors. Hum Gene Ther 25:285-300.
71. Kuriyama, S., K. Tominaga, M. Kikukawa, T. Nakatani, H. Tsujinoue, M. Yamazaki, S. Nagao, Y. Toyokawa, A. Mitoro, and H. Fukui. 1998. Inhibitory effects of human sera on adenovirus-mediated gene transfer into rat liver. Anticancer research 18:2345-2351.
72. Vlachaki, M. T., A. Hernandez-Garcia, M. Ittmann, M. Chhikara, L. K. Aguilar, X. Zhu, B. S. Teh, E. B. Butler, S. Woo, T. C. Thompson, H. Barrera-Saldana, and E. Aguilar-

Chapter I
26
Cordova. 2002. Impact of preimmunization on adenoviral vector expression and toxicity in a subcutaneous mouse cancer model. Mol Ther 6:342-348.
73. Raper, S. E., N. Chirmule, F. S. Lee, N. A. Wivel, A. Bagg, G. P. Gao, J. M. Wilson, and M. L. Batshaw. 2003. Fatal systemic inflammatory response syndrome in a ornithine transcarbamylase deficient patient following adenoviral gene transfer. Mol Genet Metab 80:148-158.
74. Seshidhar Reddy, P., S. Ganesh, M. P. Limbach, T. Brann, A. Pinkstaff, M. Kaloss, M. Kaleko, and S. Connelly. 2003. Development of adenovirus serotype 35 as a gene transfer vector. Virology 311:384-393.
75. Vogels, R., D. Zuijdgeest, R. van Rijnsoever, E. Hartkoorn, I. Damen, M. P. de Bethune, S. Kostense, G. Penders, N. Helmus, W. Koudstaal, M. Cecchini, A. Wetterwald, M. Sprangers, A. Lemckert, O. Ophorst, B. Koel, M. van Meerendonk, P. Quax, L. Panitti, J. Grimbergen, A. Bout, J. Goudsmit, and M. Havenga. 2003. Replication-deficient human adenovirus type 35 vectors for gene transfer and vaccination: efficient human cell infection and bypass of preexisting adenovirus immunity. J Virol 77:8263-8271.
76. Gao, W., P. D. Robbins, and A. Gambotto. 2003. Human adenovirus type 35: nucleotide sequence and vector development. Gene Ther 10:1941-1949.
77. Sirena, D., Z. Ruzsics, W. Schaffner, U. F. Greber, and S. Hemmi. 2005. The nucleotide sequence and a first generation gene transfer vector of species B human adenovirus serotype 3. Virology 343:283-298.
78. Stone, D., S. Ni, Z. Y. Li, A. Gaggar, N. DiPaolo, Q. Feng, V. Sandig, and A. Lieber. 2005. Development and assessment of human adenovirus type 11 as a gene transfer vector. J Virol 79:5090-5104.
79. Havenga, M., R. Vogels, D. Zuijdgeest, K. Radosevic, S. Mueller, M. Sieuwerts, F. Weichold, I. Damen, J. Kaspers, A. Lemckert, M. van Meerendonk, R. van der Vlugt, L. Holterman, D. Hone, Y. Skeiky, R. Mintardjo, G. Gillissen, D. Barouch, J. Sadoff, and J. Goudsmit. 2006. Novel replication-incompetent adenoviral B-group vectors: high vector stability and yield in PER.C6 cells. J Gen Virol 87:2135-2143.
80. van Olphen, A. L., S. K. Tikoo, and S. K. Mittal. 2002. Characterization of bovine adenovirus type 3 E1 proteins and isolation of E1-expressing cell lines. Virology 295:108-118.
81. Kremer, E. J., S. Boutin, M. Chillon, and O. Danos. 2000. Canine adenovirus vectors: an alternative for adenovirus-mediated gene transfer. J Virol 74:505-512.
82. Fernandes, P., V. M. Santiago, A. F. Rodrigues, H. Tomas, E. J. Kremer, P. M. Alves, and A. S. Coroadinha. 2013. Impact of E1 and Cre on adenovirus vector amplification: developing MDCK CAV-2-E1 and E1-Cre transcomplementing cell lines. PLoS One 8:e60342.
83. Farina, S. F., G. P. Gao, Z. Q. Xiang, J. J. Rux, R. M. Burnett, M. R. Alvira, J. Marsh, H. C. Ertl, and J. M. Wilson. 2001. Replication-defective vector based on a chimpanzee adenovirus. J Virol 75:11603-11613.
84. Roy, S., G. Gao, Y. Lu, X. Zhou, M. Lock, R. Calcedo, and J. M. Wilson. 2004. Characterization of a family of chimpanzee adenoviruses and development of molecular clones for gene transfer vectors. Hum Gene Ther 15:519-530.
85. Roy, S., Y. Zhi, G. P. Kobinger, J. Figueredo, R. Calcedo, J. R. Miller, H. Feldmann, and J. M. Wilson. 2006. Generation of an adenoviral vaccine vector based on simian adenovirus 21. J Gen Virol 87:2477-2485.
86. Roy, S., D. S. Clawson, O. Lavrukhin, A. Sandhu, J. Miller, and J. M. Wilson. 2007. Rescue of chimeric adenoviral vectors to expand the serotype repertoire. J Virol Methods 141:14-21.
87. Bru, T., S. Salinas, and E. J. Kremer. 2010. An update on canine adenovirus type 2 and its vectors. Viruses 2:2134-2153.
88. Soudais, C., C. Laplace-Builhe, K. Kissa, and E. J. Kremer. 2001. Preferential transduction of neurons by canine adenovirus vectors and their efficient retrograde transport in vivo. Faseb J 15:2283-2285.
Introduction
27
89. Soudais, C., N. Skander, and E. J. Kremer. 2004. Long-term in vivo transduction of neurons throughout the rat CNS using novel helper-dependent CAV-2 vectors. FASEB J 18:391-393.
90. Lau, A. A., T. Rozaklis, S. Ibanes, A. J. Luck, H. Beard, S. Hassiotis, K. Mazouni, J. J. Hopwood, E. J. Kremer, and K. M. Hemsley. 2012. Helper-dependent canine adenovirus vector-mediated transgene expression in a neurodegenerative lysosomal storage disorder. Gene 491:53-57.
91. Altaras, N. E., J. G. Aunins, R. K. Evans, A. Kamen, J. O. Konz, and J. J. Wolf. 2005. Production and formulation of adenovirus vectors. Adv Biochem Eng Biotechnol 99:193-260.
92. Silva, A., P. Fernandes, M. Q. Sousa, and P. Alves. 2014. Scalable Production of Adenovirus Vectors, p. 175-196. In M. Chillón and A. Bosch (ed.), Adenovirus, vol. 1089. Humana Press.
93. Silva, A. C., C. Peixoto, T. Lucas, C. Kuppers, P. E. Cruz, P. M. Alves, and S. Kochanek. 2010. Adenovirus vector production and purification. Curr Gene Ther 10:437-455.
94. Falkner, E., H. Appl, C. Eder, U. M. Losert, H. Schoffl, and W. Pfaller. 2006. Serum free cell culture: the free access online database. Toxicol In Vitro 20:395-400.
95. Croyle, M. A., B. J. Roessler, B. L. Davidson, J. M. Hilfinger, and G. L. Amidon. 1998. Factors that influence stability of recombinant adenoviral preparations for human gene therapy. Pharm Dev Technol 3:373-383.
96. Croyle, M. A., X. Cheng, and J. M. Wilson. 2001. Development of formulations that enhance physical stability of viral vectors for gene therapy. Gene Ther 8:1281-1290.
97. Obenauer-Kutner, L. J., P. M. Ihnat, T. Y. Yang, B. J. Dovey-Hartman, A. Balu, C. Cullen, R. W. Bordens, and M. J. Grace. 2002. The use of field emission scanning electron microscopy to assess recombinant adenovirus stability. Hum Gene Ther 13:1687-1696.
98. Evans, R. K., D. K. Nawrocki, L. A. Isopi, D. M. Williams, D. R. Casimiro, S. Chin, M. Chen, D. M. Zhu, J. W. Shiver, and D. B. Volkin. 2004. Development of stable liquid formulations for adenovirus-based vaccines. J Pharm Sci 93:2458-2475.
99. Cruz, P. E., A. C. Silva, A. Roldao, M. Carmo, M. J. Carrondo, and P. M. Alves. 2006. Screening of novel excipients for improving the stability of retroviral and adenoviral vectors. Biotechnol Prog 22:568-576.
100. Huyghe, B. G., X. Liu, S. Sutjipto, B. J. Sugarman, M. T. Horn, H. M. Shepard, C. J. Scandella, and P. Shabram. 1995. Purification of a type 5 recombinant adenovirus encoding human p53 by column chromatography. Hum Gene Ther 6:1403-1416.
101. Blanche, F., B. Cameron, A. Barbot, L. Ferrero, T. Guillemin, S. Guyot, S. Somarriba, and D. Bisch. 2000. An improved anion-exchange HPLC method for the detection and purification of adenoviral particles. Gene Ther 7:1055-1062.
102. Zhang, S., C. Thwin, Z. Wu, and T. Cho. 2001. US Patent 6,194,191 B1. 103. Goerke, A. R., B. C. To, A. L. Lee, S. L. Sagar, and J. O. Konz. 2005. Development of a
novel adenovirus purification process utilizing selective precipitation of cellular DNA. Biotechnol Bioeng 91:12-21.
104. Dormond, E., M. Perrier, and A. Kamen. 2009. Identification of critical infection parameters to control helper-dependent adenoviral vector production. J Biotechnol 142:142-150.
105. Dormond, E., A. Meneses-Acosta, D. Jacob, Y. Durocher, R. Gilbert, M. Perrier, and A. Kamen. 2009. An efficient and scalable process for helper-dependent adenoviral vector production using polyethylenimine-adenofection. Biotechnol Bioeng 102:800-810.
106. Gonzalez-Aparicio, M., I. Mauleon, P. Alzuguren, M. Bunuales, G. Gonzalez-Aseguinolaza, C. San Martin, J. Prieto, and R. Hernandez-Alcoceba. 2011. Self-inactivating helper virus for the production of high-capacity adenoviral vectors. Gene Ther 18:1025-1033.
107. Nadeau, I., and A. Kamen. 2003. Production of adenovirus vector for gene therapy. Biotechnol Adv 20:475-489.
Chapter I
28
108. Nadeau, I., A. Garnier, J. Cote, B. Massie, C. Chavarie, and A. Kamen. 1996. Improvement of recombinant protein production with the human adenovirus/293S expression system using fed-batch strategies. Biotechnol Bioeng 51:613-623.
109. Nadeau, I., P. A. Gilbert, D. Jacob, M. Perrier, and A. Kamen. 2002. Low-protein medium affects the 293SF central metabolism during growth and infection with adenovirus. Biotechnol Bioeng 77:91-104.
110. Ferreira, T. B., A. L. Ferreira, M. J. Carrondo, and P. M. Alves. 2005. Effect of re-feed strategies and non-ammoniagenic medium on adenovirus production at high cell densities. J Biotechnol 119:272-280.
111. Henry, O., E. Dormond, M. Perrier, and A. Kamen. 2004. Insights into adenoviral vector production kinetics in acoustic filter-based perfusion cultures. Biotechnol Bioeng 86:765-774.
112. Cortin, V., J. Thibault, D. Jacob, and A. Garnier. 2004. High-titer adenovirus vector production in 293S cell perfusion culture. Biotechnol Prog 20:858-863.
113. Henry, O., M. Perrier, and A. Kamen. 2005. Metabolic flux analysis of HEK-293 cells in perfusion cultures for the production of adenoviral vectors. Metab Eng 7:467-476.
114. Nadeau, I., D. Jacob, M. Perrier, and A. Kamen. 2000. 293SF metabolic flux analysis during cell growth and infection with an adenoviral vector. Biotechnol Prog 16:872-884.
115. Zhang, C. H., T. B. Ferreira, P. E. Cruz, P. M. Alves, M. Haury, and M. J. T. Carrondo. 2006. The importance of 293 cell cycle phase on adenovirus vector production. Enzyme and Microbial Technology 39:1328-1332.
116. Ferreira, T. B., R. Perdigao, A. C. Silva, C. Zhang, J. G. Aunins, M. J. Carrondo, and P. M. Alves. 2009. 293 cell cycle synchronisation adenovirus vector production. Biotechnol Prog 25:235-243.
117. Garnier, A., J. Cote, I. Nadeau, A. Kamen, and B. Massie. 1994. Scale-up of the adenovirus expression system for the production of recombinant protein in human 293S cells. Cytotechnology 15:145-155.
118. Monica, T. J., T. Montgomery, J. L. Ayala, G. M. Schoofs, E. M. Whiteley, G. Roth, J. J. Garbutt, S. Harvey, and F. J. Castillo. 2000. Monitoring adenovirus infections with on-line and off-line methods. Biotechnol Prog 16:866-871.
119. Sandig, V., R. Youil, A. J. Bett, L. L. Franlin, M. Oshima, D. Maione, F. Wang, M. L. Metzker, R. Savino, and C. T. Caskey. 2000. Optimization of the helper-dependent adenovirus system for production and potency in vivo. Proc Natl Acad Sci U S A 97:1002-1007.
120. Ahn, M., A. Gamble, S. R. Witting, J. Magrisso, S. Surendran, S. Obici, and N. Morral. 2013. Vector and helper genome rearrangements occur during production of helper-dependent adenoviral vectors. Human gene therapy methods 24:1-10.
121. Ng, P., C. Evelegh, D. Cummings, and F. L. Graham. 2002. Cre levels limit packaging signal excision efficiency in the Cre/loxP helper-dependent adenoviral vector system. J Virol 76:4181-4189.
122. Kreppel, F., V. Biermann, S. Kochanek, and G. Schiedner. 2002. A DNA-based method to assay total and infectious particle contents and helper virus contamination in high-capacity adenoviral vector preparations. Hum Gene Ther 13:1151-1156.
123. Vicente, T., J. P. Mota, C. Peixoto, P. M. Alves, and M. J. Carrondo. 2011. Rational design and optimization of downstream processes of virus particles for biopharmaceutical applications: current advances. Biotechnol Adv 29:869-878.
124. Vellinga, J., J. P. Smith, A. Lipiec, D. Majhen, A. Lemckert, M. van Ooij, P. Ives, C. Yallop, J. Custers, and M. Havenga. 2014. Challenges in manufacturing adenoviral vectors for global vaccine product deployment. Hum Gene Ther 25:318-327.
125. Lee, D. S., B. M. Kim, and D. W. Seol. 2009. Improved purification of recombinant adenoviral vector by metal affinity membrane chromatography. Biochem Biophys Res Commun 378:640 -644.
126. Puig, M., J. Piedra, S. Miravet, and M. M. Segura. 2014. Canine adenovirus downstream processing protocol. Methods Mol Biol 1089:197-210.

Introduction
29
127. Jungbauer, A. 2013. Continuous downstream processing of biopharmaceuticals. Trends Biotechnol 31:479-492.
128. Segura, M. M., A. A. Kamen, and A. Garnier. 2011. Overview of current scalable methods for purification of viral vectors. Methods Mol Biol 737:89-116.
129. Onions, D., and J. Kolman. 2010. Massively parallel sequencing, a new method for detecting adventitious agents. Biologicals 38:377-380.
130. Marzio, G., E. Kerkvliet, J. A. Bogaards, S. Koelewijn, A. De Groot, L. Gijsbers, G. J. Weverling, R. Vogels, M. Havenga, J. Custers, M. G. Pau, J. Y. Guichoux, J. Lewis, and J. Goudsmit. 2007. A replication-competent adenovirus assay for E1-deleted Ad35 vectors produced in PER.C6 cells. Vaccine 25:2228-2237.
131. Loonstra, A., M. Vooijs, H. B. Beverloo, B. A. Allak, E. van Drunen, R. Kanaar, A. Berns, and J. Jonkers. 2001. Growth inhibition and DNA damage induced by Cre recombinase in mammalian cells. Proc Natl Acad Sci U S A 98:9209-9214.

Chapter I
30
Chapter II
Developing MDCK CAV-2-E1 and E1-Cre
Transcomplementing Cell Lines
This chapter is adapted from:
Fernandes P, Santiago VM, Rodrigues AF, Tomás H, Kremer EJ, Alves PM, Coroadinha AS.
(2013) Impact of E1 and Cre on Adenovirus Vector Amplification: Developing MDCK CAV-2-
E1 and E1-Cre Transcomplementing Cell Lines. PLoS ONE 8(4): e60342.

Chapter II
32
Abstract
Adenovirus vectors have been extensively studied through the manipulation of viral
genome. However, little attention is being paid to their producer cell-lines; cells are
selected according to virus yields, neglecting the expression profile of
transcomplementing gene products underlying cell performance. This work evaluates the
impact of E1 (E1A and E1B) and Cre recombinase levels in the production of E1-deleted
and helper-dependent canine adenovirus type 2 (CAV-2) vectors using MDCK cells. E1A
and E1B gene expression and Cre activity were evaluated in different cell clones and
compared with the corresponding cell productivity and susceptibility to oxidative stress
injury. CAV-2 production was proportional to E1A expression (the highest levels of E1A
corresponding to productivities of 3000-5000 I.P./cell), while E1B prolonged host cell
viability after infection, conferring protection against apoptosis. Cre recombinase
counteracted E1B anti-apoptotic properties, however viral production was maintained
under high levels of Cre. Yet, Cre recombinase side effects can be reduced using cell lines
with lower Cre-activities, without compromising the excision efficiency of helper vector
packaging signal. These results highlight the influence of transcomplementing gene
products on CAV-2 producer cell line performance, and the ability to express high levels
of E1A and E1B as an important feature for cell line establishment and high adenovirus
titers.
Developing MDCK CAV-2-E1 and E1-Cre Transcomplementing Cell Lines
33
Contents
1. Introduction ............................................................................................................................................... 34
2. Materials and Methods .......................................................................................................................... 35
2.1. Plasmids .................................................................................................................................................... 35
2.2. Cell lines and culture media. ............................................................................................................ 36
2.3. Vectors ....................................................................................................................................................... 36
2.4. Establishment of MDCK-E1 and MDCK-E1-Cre clones. ........................................................ 37
2.5. E1 Gene expression analysis ............................................................................................................ 37
2.6. Cre activity ............................................................................................................................................... 38
2.7. Oxidative stress induction and cell viability assessment .................................................... 39
2.8. CAVGFP, JB∆5 and HD CAVGFP amplification by MDCK cells ........................................... 39
2.9. Infectious vectors titration ............................................................................................................... 40
2.10. Statistical analysis .............................................................................................................................. 40
3. Results ........................................................................................................................................................... 41
3.1. E1 gene expression and ΔE1 CAV-2 amplification ................................................................. 41
3.2. Cre expression in MDCK-E1 and HD CAV-2 amplification .................................................. 43
3.3. Physiological implications of E1 and Cre on ΔE1 and HD CAV-2 vectors producer
cell lines ............................................................................................................................................................. 46
4. Discussion.................................................................................................................................................... 48
5. Acknowledgments and author contribution ................................................................................ 51
6. References ................................................................................................................................................... 51
Chapter II
34
1. Introduction
Adenovirus vectors (AdV) are efficient gene transfer vectors due to the ability to
efficiently infect a wide variety of quiescent and proliferating cell types leading to high-
level gene expression (1). These vectors have been extensively studied for gene therapy
applications, where the AdV genome has been progressively modified from the wild-type
to improve its safety and efficacy in therapeutic applications. However, little attention has
been paid to the producer cell lines. So far, the main efforts during cell line development
are focused in avoiding the generation of replicative-competent adenovirus (RCA) by
sophisticated designs of the transforming plasmid; afterwards, cell lines that allow high-
titers of AdV are selected (reviewed in (2)). Thus, the expression profile of
transcomplementing genes behind cell lines performance has been neglected.
Most replication-defective adenovirus vectors require, for manufacturing and replication,
a cell line that expresses the adenoviral E1 functions in trans. E1 region codes for two
subunits – E1A and E1B – important to direct cellular and viral gene expression to enable
a productive virus cycle (3). E1A function is crucial for viral DNA replication; it
transactivates other early units and deregulates various cell cycle controls. E1A gene is
composed by two exons and several E1A polypeptides are produced following alternative
splicing of a primary RNA transcript. The most abundant E1A proteins are derived from
differentially spliced 12S and 13S mRNA that give rise to two proteins of variable size,
depending on the adenovirus serotype and species, and act as major regulators of early
viral transcription activating other early promoter regions (3, 4). Adenovirus E1A gene
expression products stimulate infected cells to enter S phase of the cell cycle and provide
an intracellular environment for viral replication. The E1A also contributes to the
transforming ability attributed to the virus, but requires the expression of E1B (5, 6). E1B
gene encodes two major proteins generally designated according to adenovirus
terminology by E1B 19 kDa and E1B 55 kDa, whose main functions are inhibition of
apoptosis, protection of viral and cellular DNA from degradation during infection and
further intracellular environment modification, to make the cell more hospitable to viral
protein production and viral DNA replication (7-10).
From vectors with the deletion of the E1 region to helper-dependent AdV with the
deletion of viral genes, an enhanced capacity for a gene therapeutic insertion from ~7 kb
to ~36 kb has been achieved (11). Helper-dependent vectors (HDV) harbors the inverted
terminal repeats (ITRs), where replication starts, the packaging signal (Ψ), and an
Developing MDCK CAV-2-E1 and E1-Cre Transcomplementing Cell Lines
35
expression cassette. For that reason, their production requires trans-acting elements
provided by an helper vector (usually a ∆E1 vector) after co-infecting cells. To prevent
helper vector (HV) packaging, during HDV production, the Ψ sequence can be removed by
flanking the Ψ with recombinase recognition sequences that are recognized by the
recombinase stably expressed in the transcomplementing cell line. Therefore, the
transcomplementing cell line must also express a recombinase, such as Cre recombinase
(12-14).
In this work, we studied the impact of E1 expression in the development of MDCK-E1 and
MDCK-E1-Cre cell lines for E1-deleted and HD canine adenovirus type 2 (CAV-2) vectors.
Although human AdV is generally the preferred prototype vector backbone, memory
immunity (humoral and cellular) may limit the efficiency in humans (15-21). One
alternative to circumvent this drawback, while keeping other AdV advantages, is the use
of non-human adenovirus. CAV-2 vectors, showing longer transgene expression due to
the absence of neutralizing CAV-2 antibodies in the serum of healthy human individuals
(20-23), preferentially transduce neurons and have a remarkable capacity of axonal
transport, making them promising tools for the treatment of neurodegenerative diseases
(22, 24, 25). To investigate the production of CAV-2 vectors under different levels of E1
(E1A and E1B) different cell-clones were analyzed. This work confirms similar function of
adenovirus E1 proteins, predicted by conserved sequences (26). We show that viral
replication was influenced by the levels of E1A and E1B gene products. Higher levels of
Cre recombinase, although counteracting E1B anti-apoptotic properties, had no effect on
viral yields. Mechanisms underlying virus production and its relationship with E1A, E1B
and Cre are discussed in the context of cell line development.
2. Materials and Methods
2.1. Plasmids
For the transfection of MDCK with E1 genes, pCI-neo plasmid backbone containing CAV-2
E1A gene under the CMV promoter control and CAV-2 E1B gene under the control of its
own promoter was used and named pCI-NeoK9 (16, 20). E1 region corresponds to the
sequence 354- 3609 bp available in GenBank accession no. J04368 (20). Additionally, pCI-
NeoK9 confers neomycin resistance allowing the selection of cells after transfection. Cre

Chapter II
36
recombinase expression was obtained with pZeoCre plasmid (23) conferring Zeocin
resistance and in which Cre was cloned under the control of SV40 promoter.
2.2. Cell lines and culture media.
MDCK cells (ECCAC, Nr 84121903), MDCK-E1 clones and MDCK-E1-Cre subclones were
grown in Dulbecco’s Modified Eagle’s Medium (DMEM) (Gibco, Paisley, UK)
supplemented with 10% (v/v) FBS (Gibco). Dog Kidney cells expressing E1 from CAV-2
(DKZeo) and expressing E1 and Cre (DKCre) (20, 23) were used as control cells and
maintained in serum-supplemented DMEM (Gibco). All cells were maintained at 37⁰ C in
a humidified atmosphere air containing 5% CO2.
Cell concentration and viability was determined by the trypan blue exclusion method
using a 0.1% (v/v) solution prepared in PBS and counting cells in a Fuchs-Rosenthal
haemacytometer (Brand, Wertheim, Germany).
2.3. Vectors
CAVGFP, JB∆5 and HD CAVGFP are vectors derived from CAV-2 strain Toronto A 26/61,
GenBank U77082. CAVGFP (20) and HD CAVGFP (25) are E1-deleted (ΔE1) and HD
vectors, respectively, and contain an eGFP expression cassette. JB∆5 is a helper vector
containing loxP flanking the packaging domains and a RSV-lacZ expression cassette (25).
For CAVGFP and JB∆5 viral stocks preparation, 150 cm2 T-flasks with DKZeo cells at a
confluency of 80 - 90% were infected with a MOI of 5 infectious particles (I.P.) per cell
with medium exchange at the time of infection. 40 hours post infection (hpi) cells were
collected and lysed with 0.1% (v/v) Triton 100 (Sigma-Aldrich, Steinhein, Germany) in
Tris-HCl 10 mM, pH 8. The lysate was clarified by centrifugation at 3000 g during 10 min
at 4ºC and purified by CsCl gradients as described previously (20). The purified vectors
were stored in phosphate buffered saline (PBS) with 10% (v/v) glycerol in aliquots at -
85ºC. HD CAVGFP viral stock used in this work was prepared from a purified HD CAVGFP
obtained as described previously (25). Then, two amplification rounds were performed
by infecting DKCre cells, using an MOI ratio between HD CAVGFP and JB∆5 of 5 to 1. Viral
vectors from the second amplification round were purified as mentioned above.

Developing MDCK CAV-2-E1 and E1-Cre Transcomplementing Cell Lines
37
2.4. Establishment of MDCK-E1 and MDCK-E1-Cre clones.
MDCK cells were transfected in suspension using 10 µg of polyethylenimine (PEI)
(Polysciences, Eppelheim, Germany) per 1×10⁶ cells, with the plasmid pCI-NeoK9 (4µg).
Selection was performed in medium containing 500 µg/mL of Geneticin (G418)
(Invivogen, Toulouse, France). This cell population was cloned by limiting dilution with
50% (v/v) conditioned medium, 20% FBS (v/v) and 250 µg/mL of G418 (Invivogen). 121
clones were isolated. MDCK-E1-Cre subclones were generated using a similar protocol;
after transfecting MDCK-E1#106 cell clone with pZeoCre, the cells were selected using
500 µg/mL of Zeocin (Invivogen) followed by cloning by limiting dilution.
2.5. E1 Gene expression analysis
RNA samples were extracted from 1 × 10⁶ cells of MDCK, DKZeo and MDCK-E1 clones
using RNeasy mini kit (QIAGEN, Germantown, MD, USA). cDNA synthesis from extracted
RNA was performed using “Transcriptor first strand cDNA synthesis kit” (Roche
Diagnostics, Mannheim, Germany). cDNA synthesis mix was prepared to the
manufacturer’s indicated end-concentrations. Amplification of cDNA was performed
using Fast Start PCR Master kit (Roche Diagnostics). Detection of E1A and E1B (for E1B
19 kDa and E1B 55 kDa) genes was performed using the following primers: for E1A gene
sense primer sequence 5’-CCGCGCAATCTCCATGATTA-3’ and antisense primer sequence
5’-AGTGCTCGCACTCGAATCAG-3’; for E1B 19 kDa sense primer sequence 5’-
TACTTTGTCGCCTGGATTTT-3’ and antisense primer sequence 5’-
CTGTCTACCTCTATTTTCCAGC-3’ and for E1B 55 kDa sense primer sequence 5’-
CACACTTTAGAAATGCCCAG-3’ and antisense primer sequence 5’-
CCGTAACCCTAATCTTAGAA-3’. The primers used for E1A gene were designed to consider
both mRNA transcripts originating E1A 12S and E1A 13S RNAs, since they amplify in
exon 1 containing CR1 and CR2 regions present in both transcripts (Figure 1). E1B codes
for two unrelated proteins, the 19 kDa and 55 kDa proteins, with partially overlapping
reading frames. Thus two different pairs of primers against non-overlapping regions
accounting for the two different mRNA transcripts were designed (Figure 1). GAPDH
(Glyceraldehyde 3-phosphate dehydrogenase) was selected as the endogenous control
gene and was amplified using sense primer sequence 5’-AACATCATCCCTGCTTCCAC-3’
and antisense primer sequence 5’-GACCACCTGTTCCTCAGTGT-3’.

Chapter II
38
For LightCycler real time PCR a master mix with the following reaction components was
prepared to the indicated end-concentrations: 2 µL LightCycler master (Fast start DNA
master SYBR Green I; Roche Diagnostics), 2.4 µL MgCl2 (3 mM), 2 µL forward and reverse
primer (0.3 µM), and 9.6 µL PCR grade water. LightCycler master mix was distributed into
the LightCycler capillaries (18 µL each) and either 2 µL of pCI-neoE1K9, pGAPDH
(standard curves for E1 and GAPDH gene) or cDNA was added. The following LightCycler
run protocol was used: denaturation program (95ºC, 10 minutes); amplification and
quantification program repeated 40 times (95ºC for 10 seconds; 60ºC (E1A gene) and
55ºC (E1B 19 kDa, E1B 55 kDa) for 10 seconds; 72ºC for 9 seconds); melting curve
program (95ºC 0 seconds; 65ºC for 15 seconds; 95ºC 0 seconds); and finally a cooling
step to 40ºC. The results obtained were analyzed with LightCycler software 4.1 (Roche
Diagnostics).
Figure 1 – Schematic representation of the DNA E1 region used to express in MDCK-E1 transcomplementing cells and the predicted major mRNA and protein derived from E1A and E1B genes. Predicted mRNAs and proteins were inferred by sequence homology (26) with human adenovirus. E1A 32 kDa and 28 kDa are translated from 13S and 12S mRNAs from E1A respectively. E1B 55 kDa is translated from 22S mRNA and E1B 19 kDa protein can be translated from the 22S or 13S mRNAs from E1B. Grey dashes underlying the mRNA products represent the generated PCR amplicon in the expression analysis of E1A and E1B genes. One set of primers was designed to assess E1A expression since it is expected that most generated splicing transcripts will contain the initial 5’ region of exon 1. Two sets of primers were design for E1B to confirm the formation of mRNA transcripts containing the 55 KDa open reading frames.
2.6. Cre activity
Relative Cre activity was assessed by the luciferase activity generated by the adenovirus
vector AdMA19 after infecting cells (27). AdMA19 contains the luciferase cDNA under
CMV exon 1 exon 2intron
E1A
19 kDa
55 kDa
E1B
13S 22S
13S
pIX
32 kDa
28 kDa
55 kDa
19 kDa
Predicted proteins:
DNA:
Predicted mRNA:
12S
Developing MDCK CAV-2-E1 and E1-Cre Transcomplementing Cell Lines
39
control of the human cytomegalovirus promoter but separated from it by an extraneous
spacer sequence composed by a series of initiation and stop codons in several reading
frames. This translational “start/stop sign”, flanked by loxP, disrupts translation. If the
cell clone expresses Cre, the stop sign is floxed out and translation proceeds leading to
luciferase expression. Briefly, cells were seeded in 24 well-plates in quadruplicates and
infected the day after with 20 I.P./cell of AdM19 with medium exchange. Twenty-four hpi,
cells were counted and lysed to release luciferase, both in duplicates. The resulting
supernatant was collected and the light units were quantified with a Modulus
Luminometer from Turner Biosystems (Sunnyvale, CA, USA) after adding luciferin and
normalized to the cell concentration.
2.7. Oxidative stress induction and cell viability assessment
The susceptibility to oxidative stress injury was assessed by analyzing tert-butyl
hydroperoxide induced death rates. Briefly, cells were inoculated at 0.8 x 10⁴ cells/cm2 in
24 well plates. At the 2nd day of culture, when cells reached approximately 90% of
confluence, tert-butyl hydroperoxide (Sigma) was added in increasing concentrations
ranging from 1.3 to 608.4 μM. Cell viability was quantified 18 h later by negative
propidium iodide (Sigma) staining and IC50 values calculated by non-linear fitting with a
95% confidence interval using Graphpad Prism (Graphpad Software, Inc., La Jolla, CA,
USA) and same approach as the one previously described (28).
2.8. CAVGFP, JB∆5 and HD CAVGFP amplification by MDCK cells
Cell clones were screened for CAVGFP vector amplification in tissue-culture Petri dishes
with 10 cm diameter (BD Biosciences, USA). MDCK-E1 clones were seeded at
1.5×10⁴cells/cm2, infected the day after with a MOI of 5 I.P. and incubated for further 40
hours. CAVGFP vectors were collected using triton (Sigma-Aldrich) 0.1% (v/v) in Tris-
HCl, clarified at 3000 g for 10 min at 4ºC and stored at -85ºC until further analysis. To
evaluate the production decrease of helper JB∆5 under the presence of Cre, MDCK-E1-Cre
subclones, DKCre cells and corresponding parental cells were infected with 5 I.P./cell of
JB∆5 using the same protocol described above. The production assays for HD CAVGFP
was performed accordingly, by infecting cells with 5 I.P./cell of HD CAVGFP and 1 I.P./cell
of JB∆5.
Chapter II
40
2.9. Infectious vectors titration
Quantification of infectious CAVGFP and HD CAVGFP was performed by monitoring the
expression of GFP. MDCK cells were seeded in 24-well plates at 2 x 10⁴ cells/cm2 and
infected the day after using serial dilutions of viral suspensions in fresh DMEM (Gibco).
Infected cells were harvested 24 hpi and the percentage of GFP-positive cells determined
by flow cytometry (CyFlow Space, Partec, Germany). Two replicates were performed for
each dilution. CAVGFP titer was determined by multiplying the number of cells at
infection with the percentage of GFP expressing cells and the respective dilution factor.
Titration of infectious JB∆5 vectors was based in lacZ gene expression and β-
galactosidase activity by adapting a previously described protocol (29). Briefly, DKZeo
cells were seeded at 1 x 10⁵ cells/cm2 in 96-well plates. After 24 h, cells were infected
with serial dilutions of viral suspension. The day after, infected cells were fixed and
stained using a solution with X-gal (5-bromo-4-chloro-3-indolyl-b-D-galactopyranoside)
(Stratagene, La Jolla, CA, USA). Four replicates were performed for each dilution. JB∆5
titer was determined by counting the stained blue cells using an inverted phase contrast
microscope, multiplied by the dilution factor.
Productivities were shown as amplification ratio, corresponding to the ratio between I.P.
harvested and those used at infection (I.P. Out/I.P. In), or as cell specific viral titers,
corresponding to total I.P. normalized to cell concentration at virus harvesting time.
2.10. Statistical analysis
Statistics were performed using Microsoft Office Excel and Graphpad Prism software.
Data are presented as mean ± standard-deviation. Statistical significance was determined
by single factor Anova analysis with P value set at < 0.05.
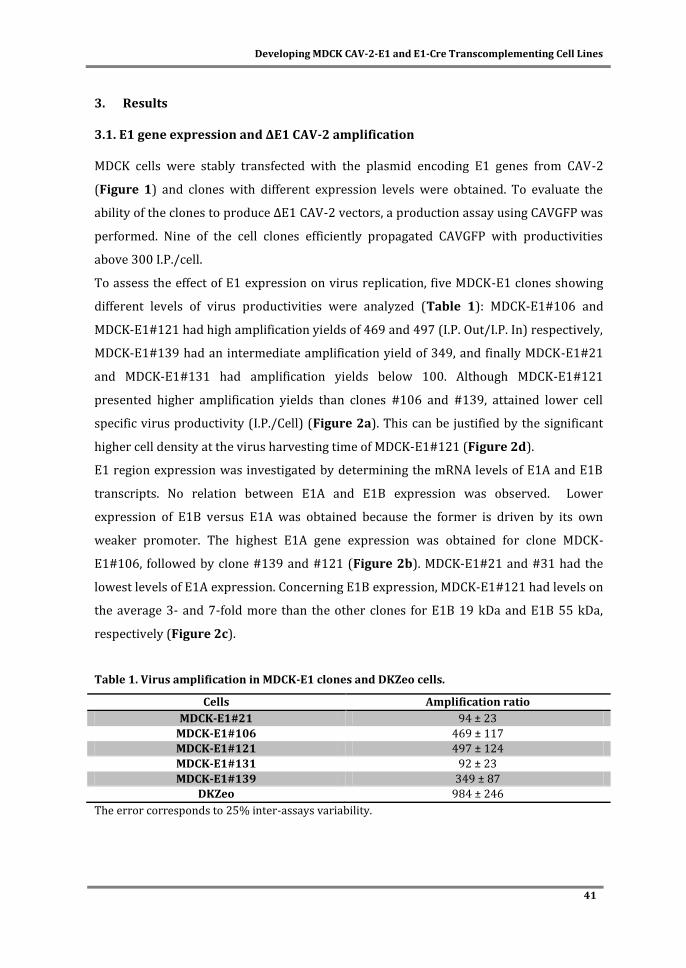
Developing MDCK CAV-2-E1 and E1-Cre Transcomplementing Cell Lines
41
3. Results
3.1. E1 gene expression and ΔE1 CAV-2 amplification
MDCK cells were stably transfected with the plasmid encoding E1 genes from CAV-2
(Figure 1) and clones with different expression levels were obtained. To evaluate the
ability of the clones to produce ΔE1 CAV-2 vectors, a production assay using CAVGFP was
performed. Nine of the cell clones efficiently propagated CAVGFP with productivities
above 300 I.P./cell.
To assess the effect of E1 expression on virus replication, five MDCK-E1 clones showing
different levels of virus productivities were analyzed (Table 1): MDCK-E1#106 and
MDCK-E1#121 had high amplification yields of 469 and 497 (I.P. Out/I.P. In) respectively,
MDCK-E1#139 had an intermediate amplification yield of 349, and finally MDCK-E1#21
and MDCK-E1#131 had amplification yields below 100. Although MDCK-E1#121
presented higher amplification yields than clones #106 and #139, attained lower cell
specific virus productivity (I.P./Cell) (Figure 2a). This can be justified by the significant
higher cell density at the virus harvesting time of MDCK-E1#121 (Figure 2d).
E1 region expression was investigated by determining the mRNA levels of E1A and E1B
transcripts. No relation between E1A and E1B expression was observed. Lower
expression of E1B versus E1A was obtained because the former is driven by its own
weaker promoter. The highest E1A gene expression was obtained for clone MDCK-
E1#106, followed by clone #139 and #121 (Figure 2b). MDCK-E1#21 and #31 had the
lowest levels of E1A expression. Concerning E1B expression, MDCK-E1#121 had levels on
the average 3- and 7-fold more than the other clones for E1B 19 kDa and E1B 55 kDa,
respectively (Figure 2c).
Table 1. Virus amplification in MDCK-E1 clones and DKZeo cells.
Cells Amplification ratio
MDCK-E1#21 94 ± 23
MDCK-E1#106 469 ± 117
MDCK-E1#121 497 ± 124
MDCK-E1#131 92 ± 23
MDCK-E1#139 349 ± 87
DKZeo 984 ± 246
The error corresponds to 25% inter-assays variability.

Chapter II
42
A correlation between E1A mRNA expression (Figure 2b) and cell specific viral
production (Figure 2a) can be observed, suggesting that higher E1A expression favors
vector production. On the other hand MDCK-E1#121 presented a 2-fold increase in viable
cells concentration at virus harvesting time (Figure 2d), which may indicate cell survival
advantages. E1B contribution for vector production may thus be indirect by preventing
loss of cell viability.
Figure 2 – Cell specific productivity and corresponding E1 gene expression of MDCK-E1 cell clones. a. Cell specific infectious viral titer produced in MDCK-E1 clones using DMEM 10% (v/v) FBS and 1% (v/v) NEAA. Error bars represent a 25% inter-assay variability error. b and c. Levels of mRNA E1A (b) and E1B expression (c) obtained for the different MDCK-E1 clones. The gene expression was determined by Real Time reverse transcriptase PCR and normalized to the housekeeping gene (GAPDH). Error bars represent a 10% variability error associated with the method. d. Cell concentration obtained for the different MDCK-E1 clones at virus harvest time. Cells were infected at the same cell concentration. Error bars represent the standard deviation of three independent experiments (n=3).
The long-term stability of E1 expression in MDCK-E1 clones was also assessed by
analyzing cells without antibiotic selection pressure with increasing subcultures
passages: low (passage 20), intermediate (passages 30 - 40) and high (passages 45 - 55)

Developing MDCK CAV-2-E1 and E1-Cre Transcomplementing Cell Lines
43
passages. Similar CAVGFP amplifications were obtained in the different cell passages of
most MDCK-E1 clones tested. However, for MDCK-E1#139 clone, a decrease in the viral
production was observed at high passages (Figure 3). Also, a 2-fold reduction in specific
productivity of our reference cell line DKZeo (20) at high cell passage was observed. The
highest cell culture passages tested for MDCK-E1#106 and DKZeo were 52 and 56,
respectively.
E1 gene expression was determined in the three different ranges of passages for MDCK-
E1#106 and MDCK-E1#139 (Figure 4). No significant variation in E1A expression with
the increasing cell passages of MDCK-E1#106 was observed (Figure 4a). However, a
gradual increase in E1B expression with increasing cell passages was observed for the
same cell clone (Figure 4a). A clear reduction on E1A expression during subculture was
observed for MDCK-E1#139, particularly at high passage, possibly explaining the drop in
viral production for this clone (Figure 4b). The expression of E1B was maintained in
MDCK-E1#139. A small decrease was observed in E1A expression of DKZeo cells at high
passage (data not shown).
Figure 4 – Levels of mRNA of E1A and E1B over increasing cell culture passages for MDCK-E1 clone #106 (a) and #139 (b). The gene expression was determined by Real Time reverse transcriptase PCR normalized to the housekeeping gene (GAPDH). Error bars represent a 10% variability error associated with the method.
3.2. Cre expression in MDCK-E1 and HD CAV-2 amplification
To amplify helper-dependent (HD) CAV-2 vectors, and avoid helper-vector (HV)
contamination, MDCK-E1 cells have to express Cre-recombinase. MDCK-E1#106, being

Chapter II
44
the clone with the highest CAV-2 productivity (Figures 2a and 3), was stably transfected
with Cre recombinase gene and several clones were obtained. Cre activity was
determined indirectly by infecting the subclones with AdMA19 (27), which when cleaved
in the loxP site expresses luciferase (see materials and methods section), and compared
with DKCre cells (Figure 5). In comparison to DKCre cells, 25% presented either equal or
higher Cre activity. The subclones with higher Cre activity presented lower cell growth
(data not shown).
Figure 5 – Cell specific Cre activity of MDCK-E1#106-Cre subclones and DKCre cells measured indirectly through a luciferase assay (see materials and methods). Error assumes 20% inter-assay variability.
To determine if high productivities are maintained after Cre expression, CAVGFP
production was evaluated in five subclones with different Cre activities: Cre#2, Cre#10,
Cre#19, Cre#16 and Cre#30. The results showed same range of productivities for all the
subclones tested (Table 2).
In the current HDV production protocol it is fundamental to avoid HV contamination (13,
14), via Cre excision of the packaging signal of HV genome. However, a relative level of
Cre activity is required to attain the effective excision levels. Thus, considering that
subclones and the corresponding parental cells present same capability to produce viral
vectors, we evaluated the excision efficiency of the packaging signal of JB∆5 (CAV-2 HV),
flanked by loxP, by analyzing its amplification in MDCK-E1-Cre subclones (Table 2).
MDCK-E1#106-Cre subclones presented a reduced amplification capacity of ~26-fold,
which is in the range of that obtained with DKCre cells. MDCK-E1#106-Cre#10 was the
exception, showing the highest fold-decrease among all MDCK-E1#106-Cre subclones. No
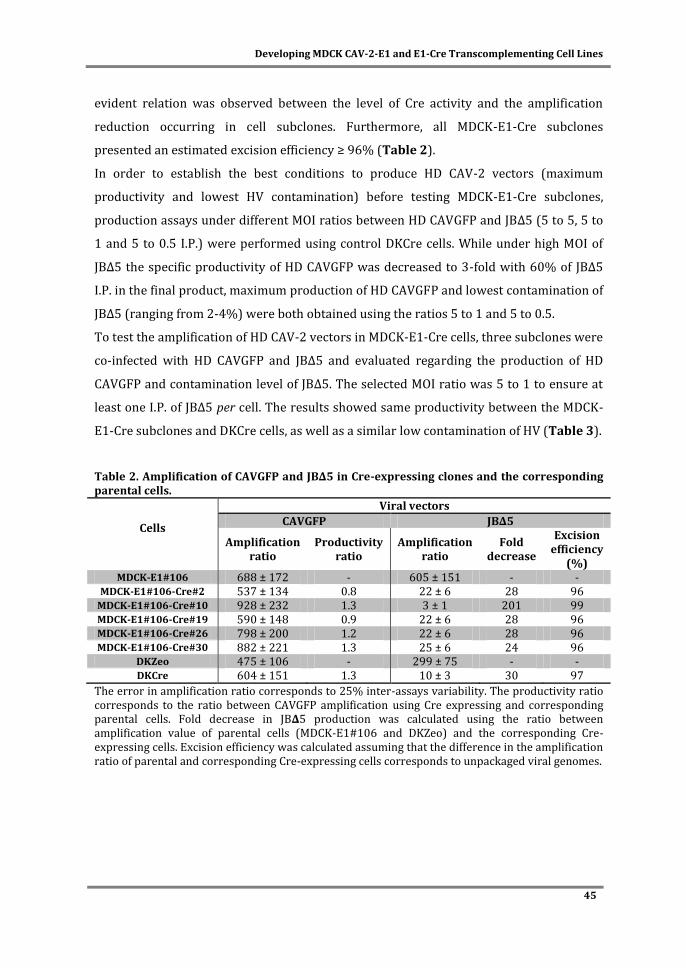
Developing MDCK CAV-2-E1 and E1-Cre Transcomplementing Cell Lines
45
evident relation was observed between the level of Cre activity and the amplification
reduction occurring in cell subclones. Furthermore, all MDCK-E1-Cre subclones
presented an estimated excision efficiency ≥ 96% (Table 2).
In order to establish the best conditions to produce HD CAV-2 vectors (maximum
productivity and lowest HV contamination) before testing MDCK-E1-Cre subclones,
production assays under different MOI ratios between HD CAVGFP and JBΔ5 (5 to 5, 5 to
1 and 5 to 0.5 I.P.) were performed using control DKCre cells. While under high MOI of
JB∆5 the specific productivity of HD CAVGFP was decreased to 3-fold with 60% of JB∆5
I.P. in the final product, maximum production of HD CAVGFP and lowest contamination of
JB∆5 (ranging from 2-4%) were both obtained using the ratios 5 to 1 and 5 to 0.5.
To test the amplification of HD CAV-2 vectors in MDCK-E1-Cre cells, three subclones were
co-infected with HD CAVGFP and JB∆5 and evaluated regarding the production of HD
CAVGFP and contamination level of JB∆5. The selected MOI ratio was 5 to 1 to ensure at
least one I.P. of JB∆5 per cell. The results showed same productivity between the MDCK-
E1-Cre subclones and DKCre cells, as well as a similar low contamination of HV (Table 3).
Table 2. Amplification of CAVGFP and JB∆5 in Cre-expressing clones and the corresponding parental cells.
Cells
Viral vectors
CAVGFP JB∆5
Amplification ratio
Productivity ratio
Amplification ratio
Fold decrease
Excision efficiency
(%) MDCK-E1#106 688 ± 172 - 605 ± 151 - -
MDCK-E1#106-Cre#2 537 ± 134 0.8 22 ± 6 28 96 MDCK-E1#106-Cre#10 928 ± 232 1.3 3 ± 1 201 99 MDCK-E1#106-Cre#19 590 ± 148 0.9 22 ± 6 28 96 MDCK-E1#106-Cre#26 798 ± 200 1.2 22 ± 6 28 96 MDCK-E1#106-Cre#30 882 ± 221 1.3 25 ± 6 24 96
DKZeo 475 ± 106 - 299 ± 75 - - DKCre 604 ± 151 1.3 10 ± 3 30 97
The error in amplification ratio corresponds to 25% inter-assays variability. The productivity ratio corresponds to the ratio between CAVGFP amplification using Cre expressing and corresponding parental cells. Fold decrease in JB∆5 production was calculated using the ratio between amplification value of parental cells (MDCK-E1#106 and DKZeo) and the corresponding Cre-expressing cells. Excision efficiency was calculated assuming that the difference in the amplification ratio of parental and corresponding Cre-expressing cells corresponds to unpackaged viral genomes.
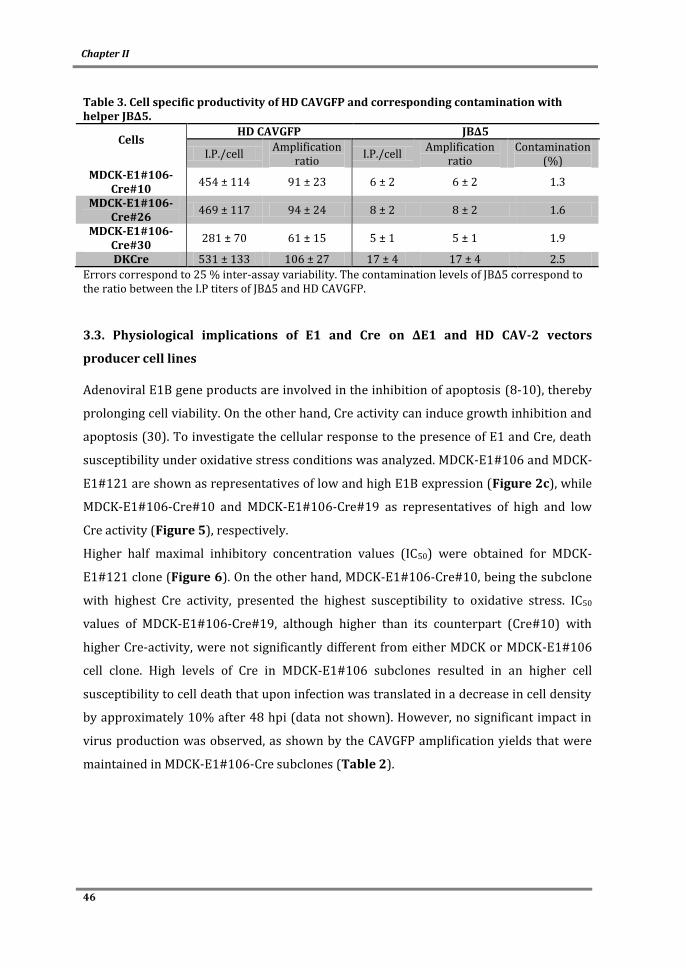
Chapter II
46
Table 3. Cell specific productivity of HD CAVGFP and corresponding contamination with helper JB∆5.
Cells HD CAVGFP JB∆5
I.P./cell Amplification
ratio I.P./cell
Amplification ratio
Contamination (%)
MDCK-E1#106-Cre#10
454 ± 114 91 ± 23 6 ± 2 6 ± 2 1.3
MDCK-E1#106-Cre#26
469 ± 117 94 ± 24 8 ± 2 8 ± 2 1.6
MDCK-E1#106-Cre#30
281 ± 70 61 ± 15 5 ± 1 5 ± 1 1.9
DKCre 531 ± 133 106 ± 27 17 ± 4 17 ± 4 2.5
Errors correspond to 25 % inter-assay variability. The contamination levels of JB∆5 correspond to the ratio between the I.P titers of JB∆5 and HD CAVGFP.
3.3. Physiological implications of E1 and Cre on ΔE1 and HD CAV-2 vectors
producer cell lines
Adenoviral E1B gene products are involved in the inhibition of apoptosis (8-10), thereby
prolonging cell viability. On the other hand, Cre activity can induce growth inhibition and
apoptosis (30). To investigate the cellular response to the presence of E1 and Cre, death
susceptibility under oxidative stress conditions was analyzed. MDCK-E1#106 and MDCK-
E1#121 are shown as representatives of low and high E1B expression (Figure 2c), while
MDCK-E1#106-Cre#10 and MDCK-E1#106-Cre#19 as representatives of high and low
Cre activity (Figure 5), respectively.
Higher half maximal inhibitory concentration values (IC50) were obtained for MDCK-
E1#121 clone (Figure 6). On the other hand, MDCK-E1#106-Cre#10, being the subclone
with highest Cre activity, presented the highest susceptibility to oxidative stress. IC50
values of MDCK-E1#106-Cre#19, although higher than its counterpart (Cre#10) with
higher Cre-activity, were not significantly different from either MDCK or MDCK-E1#106
cell clone. High levels of Cre in MDCK-E1#106 subclones resulted in an higher cell
susceptibility to cell death that upon infection was translated in a decrease in cell density
by approximately 10% after 48 hpi (data not shown). However, no significant impact in
virus production was observed, as shown by the CAVGFP amplification yields that were
maintained in MDCK-E1#106-Cre subclones (Table 2).
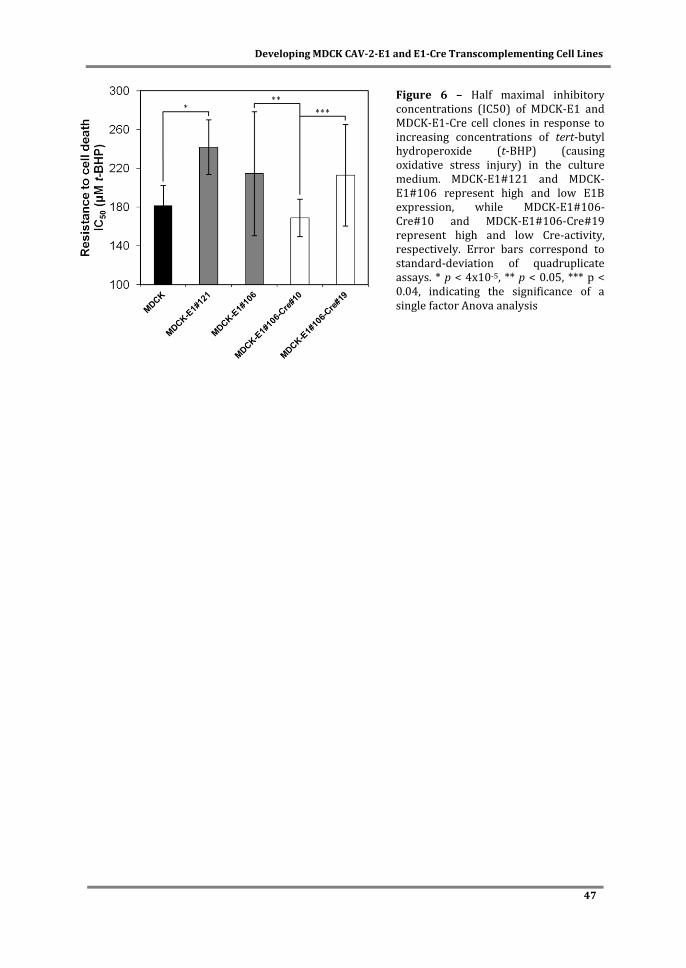
Developing MDCK CAV-2-E1 and E1-Cre Transcomplementing Cell Lines
47
Figure 6 – Half maximal inhibitory concentrations (IC50) of MDCK-E1 and MDCK-E1-Cre cell clones in response to increasing concentrations of tert-butyl hydroperoxide (t-BHP) (causing oxidative stress injury) in the culture medium. MDCK-E1#121 and MDCK-E1#106 represent high and low E1B expression, while MDCK-E1#106-Cre#10 and MDCK-E1#106-Cre#19 represent high and low Cre-activity, respectively. Error bars correspond to standard-deviation of quadruplicate assays. * p < 4x10⁻⁵, ** p < 0.05, *** p < 0.04, indicating the significance of a single factor Anova analysis

Chapter II
48
4. Discussion
Most replication-defective AdV require E1 transcomplementing cell lines that provide
E1A and E1B gene products essential for viral replication. The establishment of these
producer cell lines is mainly focused in developing cells that allow high-yield production,
while avoiding RCA generation (2). To our knowledge, the impact of E1A and E1B
expression levels on the production of AdV has never been investigated. To address this
issue, and given the attractive features of these vectors to fundamental neurobiological
questions and to develop potential treatment of neurodegenerative disorders (24, 25, 31,
32), we selected CAV-2 vectors production in MDCK-derived cell lines. Moreover, MDCK
cells are already approved by the regulatory authorities for the manufacture of vaccines
and thus representing a suitable cell substrate that might facilitate the regulatory
approval for the production of clinical grade CAV-2 vectors (33). Thus, the MDCK-derived
cell lines developed herein, holding production yields similar to the ones obtained with
the previously established DK cell lines, constitute a step forward for achieving that
purpose.
This work confirms the similar functions of E1A and E1B gene products from canine and
human adenoviruses, as extrapolated by sequence analogy. E1A encoded proteins from
adenovirus play an essential role in viral production by acting as transcriptional
activators of early viral genes (4), inducing cells to enter S-phase (34, 35) and allowing
the use of cellular DNA replication machinery to support viral DNA replication (3, 36).
Therefore, it is not surprising that high production yields were attained under high levels
of E1A transcripts (Figures 2a,b). When plotting E1A transcripts as a function of viral
production from the different MDCK-E1 clones, a linear tendency was obtained (r2= 0.99).
MDCK-E1#121 was an exception: the higher expression of E1B seemed to compensate
the intermediate level of E1A expression. MDCK-E1#121, showing the highest expression
of E1B among all clones tested, also presented less susceptibility to oxidative stress injury
(Figure 6) and higher cell concentration at virus harvesting time (Figure 2d). This
indicates the involvement of E1B in cell ability to hold stressful conditions such as
CAVGFP infection, which is supported by the functions dedicated to E1B gene products.
E1B 19 kDa and E1B 55 kDa proteins from human adenovirus can independently inhibit
the activation of apoptosis as a response to infection and foreign DNA replication (8, 37,
38). E1B 55 kDa also inhibits cellular mRNA export and promotes viral mRNA export and
translation during late infection (39). Therefore, the high levels E1B expression had also

Developing MDCK CAV-2-E1 and E1-Cre Transcomplementing Cell Lines
49
an effect on viral production by extending cell viability. More interestingly, MDCK-
E1#106 cell clone presented a concomitant increase on E1B expression with cell passages
(Figures 3 and 4a). This gradual increase of expression can be due to an epigenetic
mechanism started in a few cells, which conferred proliferating/anti-apoptotic selection
advantage. Considering the main principle to choose cell lines (high production of AdV)
and the direct relation between viral yields and E1A expression levels, the cell lines
usually selected are likely to attain high levels of E1A. On the other hand, it is not
guaranteed that these same cells hold appreciable E1B expression levels, due to its
indirect role on viral yields. This has not a major impact on the production of E1-deleted
AdV, however high expression of E1B should be pursued in scenarios where cell line has
to further express toxic products, such as Cre recombinase during helper-dependent
vectors (HDV) production.
Cre expression can result in a markedly reduced proliferation and genotoxic effects in
cultured cells (30). The aberrant activity on multiple pseudo loxP sites presented in
mammalian genomes (40) induces DNA double-strand breaks (DSBs) or nicks that are
converted to DSBs during DNA replication, leading to arrest of cells in G2/M phase
because of intolerable DNA damage (30). Indeed, MDCK-E1-Cre subclones with very high
Cre activity presented reduced growth rates and we were unable to maintain some of
them at long term in culture (data not shown). In addition to disturbed growth patterns,
the subclones with high Cre activity become more susceptible to cell death (Figure 6),
showing an average of 10% lower cell densities at virus harvesting time, in comparison
with MDCK-E1 parental cells. The anti-apoptotic improvement conferred by E1B was
decreased, and in this context, the impact of Cre should be further investigated under
higher levels of E1B. Despite these observations, the MDCK-E1-Cre subclones used in this
work attained reproducible growth rates and maximum cell concentrations similar to
MDCK-E1 parental cells (data not shown). More important, similar CAV-2 vector
production was observed between MDCK-E1-Cre and corresponding MDCK-E1 cells
(Table 2). Although we hypothesized that the inhibitory effects of Cre could be extended
to vector production, because adenoviruses inhibit key components of cellular DNA
damage response (41, 42), compromising the repair of the Cre-induced DSBs, these
findings showed no effect of Cre on infected cells productivity, probably due to the
inhibition of DNA damage response taking place later in the lytic cycle (42).

Chapter II
50
The ideal situation to avoid cytotoxicity would be the minimum possible level of Cre that
would ensure an efficient excision of the Ψ in the helper vector (HV) genome. Herein, the
excision efficiency of the HV was assessed in subclones presenting different Cre activities
(Table 2). Overall, all MDCK-E1#106-Cre cell subclones presented similar excision
efficiency (above 96%), suggesting that above a minimal level of Cre, the excision of HV
packaging signal is equal. However, in a situation where HV production is maximized,
either by different viral construct or improved E1 expression of producer cell lines, more
viral genomes would be replicated and the threshold of Cre for the same excision
efficiency would probably increase. Nevertheless, under the conditions assayed herein,
MDCK-E1-Cre cells are suitable producer cell lines, with similar excision efficiencies to
the ones obtained for human HV (43). Moreover, MDCK-E1-Cre clones attained
appreciable HD CAV-2 titers; the HD CAVGFP amplification corresponded to a volumetric
productivity of 1.5 – 4.0 x 10⁸ I.P./mL, which is similar to the one described for human
HDV (44, 45). The production of HD CAVGFP using 5 I.P./cell of this vector was
compromised when co-infection was performed with high MOI of JB∆5. In fact, the
negative effect of higher MOI of HV on HDV yield, together with the generation of higher
HV concentration, was already reported for human HDV by Dormond et al. (44). Thus,
lower MOI of JB∆5 was used to test MDCK-E1-Cre clones. Under these conditions, lower
amplification of HV was obtained, when comparing to what was observed in single
infections with high MOI (Tables 2 and 3). This may be due to the use of a non-optimal
MOI for HV replication or the presence of non-lethal mutations in HV packaging region
(24), further reducing DNA packaging in co-infection scenarios (23), such as the
production of HDV.
In this work, we show that the expression of E1 had an essential role in adenoviral vector
production, using CAV-2 as a case study. While E1A levels had a direct effect on viral
production, the expression of E1B conferred protection against cell death. The further
activity of Cre, although impairing cell growth and physiology, had no effect on viral
production and can be substantially reduced without compromising the excision of
packaging signal from HV. These findings highlight the need to understand the influence
of trans-complementing genes on the biology of host-cell and virus, providing important
knowledge to choose and design superior cell lines and enhance adenovirus yields.
Developing MDCK CAV-2-E1 and E1-Cre Transcomplementing Cell Lines
51
5. Acknowledgments and author contribution
The authors are grateful to Núria Viana and Telma Lança for their support in the initial
MDCK cell line transfections and screening. The authors acknowledge the financial
support received from the Fundação para a Ciência e a Tecnologia (FCT) – Portugal
(PTDC/BIO/69452/2006 and PTDC/EBB-BIO/118615/2010) and European Commission
through FP7 project BrainCAV (222992). P. Fernandes, A.F. Rodrigues and H. Tomás also
acknowledge FCT for their Ph.D. grants (SFRH/BD/70810/2010, SFRH/BD/48393/2008
and SFRH/BD/79022/2011, respectively).
Paulo Fernandes participated in the experimental setup and design, performed part of the
experiments, analyzed the data and wrote the chapter.
6. References
1. Bramson, J. L., F. L. Graham, and J. Gauldie. 1995. The use of adenoviral vectors for gene therapy and gene transfer in vivo. Current opinion in biotechnology 6:590-595.
2. Kovesdi, I., and S. J. Hedley. 2010. Adenoviral producer cells. Viruses 2:1681-1703. 3. Berk, A. J. 1986. Functions of adenovirus E1A. Cancer surveys 5:367-387. 4. Liao, Y., D. Yu, and M. C. Hung. 2007. Novel approaches for chemosensitization of breast
cancer cells: the E1A story. Advances in experimental medicine and biology 608:144-169. 5. Bernards, R., M. G. de Leeuw, A. Houweling, and A. J. van der Eb. 1986. Role of the
adenovirus early region 1B tumor antigens in transformation and lytic infection. Virology 150:126-139.
6. Houweling, A., P. J. van den Elsen, and A. J. van der Eb. 1980. Partial transformation of primary rat cells by the leftmost 4.5% fragment of adenovirus 5 DNA. Virology 105:537-550.
7. Curriel, D. T., and J. T. Douglas (ed.). 2002. Adenoviral Vectors for Gene Therapy. Academic Press, California, U.S.A.
8. Rao, L., M. Debbas, P. Sabbatini, D. Hockenbery, S. Korsmeyer, and E. White. 1992. The adenovirus E1A proteins induce apoptosis, which is inhibited by the E1B 19-kDa and Bcl-2 proteins. Proceedings of the National Academy of Sciences of the United States of America 89:7742-7746.
9. White, E. 1998. Regulation of Apoptosis by Adenovirus E1A and E1B Oncogenes. Seminars in Virology 8:505-513.
10. White, E., P. Sabbatini, M. Debbas, W. S. Wold, D. I. Kusher, and L. R. Gooding. 1992. The 19-kilodalton adenovirus E1B transforming protein inhibits programmed cell death and prevents cytolysis by tumor necrosis factor alpha. Molecular and cellular biology 12:2570-2580.
11. Dormond, E., M. Perrier, and A. Kamen. 2009. From the first to the third generation adenoviral vector: what parameters are governing the production yield? Biotechnol Adv 27:133-144.
12. Lieber, A., C. Y. He, I. Kirillova, and M. A. Kay. 1996. Recombinant adenoviruses with large deletions generated by Cre-mediated excision exhibit different biological properties compared with first-generation vectors in vitro and in vivo. J Virol 70:8944-8960.
13. Hardy, S., M. Kitamura, T. Harris-Stansil, Y. Dai, and M. L. Phipps. 1997. Construction of adenovirus vectors through Cre-lox recombination. J Virol 71:1842-1849.

Chapter II
52
14. Parks, R. J., L. Chen, M. Anton, U. Sankar, M. A. Rudnicki, and F. L. Graham. 1996. A helper-dependent adenovirus vector system: removal of helper virus by Cre-mediated excision of the viral packaging signal. Proc Natl Acad Sci U S A 93:13565-13570.
15. Bangari, D. S., and S. K. Mittal. 2006. Current strategies and future directions for eluding adenoviral vector immunity. Current gene therapy 6:215-226.
16. Klonjkowski, B., P. Gilardi-Hebenstreit, J. Hadchouel, V. Randrianarison, S. Boutin, P. Yeh, M. Perricaudet, and E. J. Kremer. 1997. A recombinant E1-deleted canine adenoviral vector capable of transduction and expression of a transgene in human-derived cells and in vivo. Human gene therapy 8:2103-2115.
17. Paillard, F. 1997. Advantages of non-human adenoviruses versus human adenoviruses. Human gene therapy 8:2007-2009.
18. Thomas, C. E., D. Birkett, I. Anozie, M. G. Castro, and P. R. Lowenstein. 2001. Acute direct adenoviral vector cytotoxicity and chronic, but not acute, inflammatory responses correlate with decreased vector-mediated transgene expression in the brain. Mol Ther 3:36-46.
19. Yang, Y., Q. Su, and J. M. Wilson. 1996. Role of viral antigens in destructive cellular immune responses to adenovirus vector-transduced cells in mouse lungs. Journal of virology 70:7209-7212.
20. Kremer, E. J., S. Boutin, M. Chillon, and O. Danos. 2000. Canine adenovirus vectors: an alternative for adenovirus-mediated gene transfer. J Virol 74:505-512.
21. Perreau, M., and E. J. Kremer. 2005. Frequency, proliferation, and activation of human memory T cells induced by a nonhuman adenovirus. J Virol 79:14595-14605.
22. Keriel, A., C. Rene, C. Galer, J. Zabner, and E. J. Kremer. 2006. Canine adenovirus vectors for lung-directed gene transfer: efficacy, immune response, and duration of transgene expression using helper-dependent vectors. J Virol 80:1487-1496.
23. Soudais, C., S. Boutin, and E. J. Kremer. 2001. Characterization of cis-acting sequences involved in canine adenovirus packaging. Mol Ther 3:631-640.
24. Soudais, C., C. Laplace-Builhe, K. Kissa, and E. J. Kremer. 2001. Preferential transduction of neurons by canine adenovirus vectors and their efficient retrograde transport in vivo. Faseb J 15:2283-2285.
25. Soudais, C., N. Skander, and E. J. Kremer. 2004. Long-term in vivo transduction of neurons throughout the rat CNS using novel helper-dependent CAV-2 vectors. FASEB J 18:391-393.
26. Shibata, R., M. Shinagawa, Y. Iida, and T. Tsukiyama. 1989. Nucleotide sequence of E1 region of canine adenovirus type 2. Virology 172:460-467.
27. Anton, M., and F. L. Graham. 1995. Site-specific recombination mediated by an adenovirus vector expressing the Cre recombinase protein: a molecular switch for control of gene expression. J Virol 69:4600-4606.
28. Rodrigues, A. F., M. R. Guerreiro, V. M. Santiago, C. Dalba, D. Klatzmann, P. M. Alves, M. J. Carrondo, and A. S. Coroadinha. 2011. Down-regulation of CD81 tetraspanin in human cells producing retroviral-based particles: tailoring vector composition. Biotechnology and bioengineering 108:2623-2633.
29. Coroadinha, A. S., R. Schucht, L. Gama-Norton, D. Wirth, H. Hauser, and M. J. Carrondo. 2006. The use of recombinase mediated cassette exchange in retroviral vector producer cell lines: predictability and efficiency by transgene exchange. J Biotechnol 124:457-468.
30. Loonstra, A., M. Vooijs, H. B. Beverloo, B. A. Allak, E. van Drunen, R. Kanaar, A. Berns, and J. Jonkers. 2001. Growth inhibition and DNA damage induced by Cre recombinase in mammalian cells. Proc Natl Acad Sci U S A 98:9209-9214.
31. Salinas, S., L. G. Bilsland, D. Henaff, A. E. Weston, A. Keriel, G. Schiavo, and E. J. Kremer. 2009. CAR-associated vesicular transport of an adenovirus in motor neuron axons. PLoS pathogens 5:e1000442.
32. Henaff, D., and S. Salinas. 2010. An endocytic CARriage tale: Adenoviruses internalization and trafficking in neurons. Virulence 1:188-191.
Developing MDCK CAV-2-E1 and E1-Cre Transcomplementing Cell Lines
53
33. Fernandes, P., C. Peixoto, V. M. Santiago, E. J. Kremer, A. S. Coroadinha, and P. M. Alves. 2013. Bioprocess development for canine adenovirus type 2 vectors. Gene Ther 20:353-360.
34. Gallimore, P. H., and A. S. Turnell. 2001. Adenovirus E1A: remodelling the host cell, a life or death experience. Oncogene 20:7824-7835.
35. Moran, E. 1993. DNA tumor virus transforming proteins and the cell cycle. Current opinion in genetics & development 3:63-70.
36. Berk, A. J. 1986. Adenovirus promoters and E1A transactivation. Annual review of genetics 20:45-79.
37. Debbas, M., and E. White. 1993. Wild-type p53 mediates apoptosis by E1A, which is inhibited by E1B. Genes & development 7:546-554.
38. Schmitz, M. L., A. Indorf, F. P. Limbourg, H. Stadtler, E. B. Traenckner, and P. A. Baeuerle. 1996. The dual effect of adenovirus type 5 E1A 13S protein on NF-kappaB activation is antagonized by E1B 19K. Molecular and cellular biology 16:4052-4063.
39. Blackford, A. N., and R. J. Grand. 2009. Adenovirus E1B 55-kilodalton protein: multiple roles in viral infection and cell transformation. Journal of virology 83:4000-4012.
40. Thyagarajan, B., M. J. Guimaraes, A. C. Groth, and M. P. Calos. 2000. Mammalian genomes contain active recombinase recognition sites. Gene 244:47-54.
41. Araujo, F. D., T. H. Stracker, C. T. Carson, D. V. Lee, and M. D. Weitzman. 2005. Adenovirus type 5 E4orf3 protein targets the Mre11 complex to cytoplasmic aggresomes. J Virol 79:11382-11391.
42. Baker, A., K. J. Rohleder, L. A. Hanakahi, and G. Ketner. 2007. Adenovirus E4 34k and E1b 55k oncoproteins target host DNA ligase IV for proteasomal degradation. J Virol 81:7034-7040.
43. Ng, P., C. Evelegh, D. Cummings, and F. L. Graham. 2002. Cre levels limit packaging signal excision efficiency in the Cre/loxP helper-dependent adenoviral vector system. J Virol 76:4181-4189.
44. Dormond, E., M. Perrier, and A. Kamen. 2009. Identification of critical infection parameters to control helper-dependent adenoviral vector production. J Biotechnol 142:142-150.
45. Dormond, E., A. Meneses-Acosta, D. Jacob, Y. Durocher, R. Gilbert, M. Perrier, and A. Kamen. 2009. An efficient and scalable process for helper-dependent adenoviral vector production using polyethylenimine-adenofection. Biotechnol Bioeng 102:800-810.

Chapter II
54

Chapter III
Upstream bioprocess development for
E1-deleted CAV-2 vectors
This chapter is adapted from:
Fernandes P, Peixoto C, Santiago VM, Kremer EJ, Coroadinha AS, Alves PM (2013)
Bioprocess development for canine adenovirus type 2 vectors. Gene Ther 20(4): 353-60.
Fernandes P, Sousa M, Kremer EJ, Coroadinha AS, Alves PM. Suspension MDCK-E1 cell line
for the manufacturing of CAV-2 vectors. (under preparation)

Part A
Production with adherent cells using
microcarrier technology
This chapter is adapted from:
Fernandes P, Peixoto C, Santiago VM, Kremer EJ, Coroadinha AS, Alves PM (2013)
Bioprocess development for canine adenovirus type 2 vectors. Gene Ther 20(4): 353-60.
Chapter III – Part A
58
Abstract
Canine adenovirus type 2 (CAV-2) vectors overcome many of the clinical immunogenic
concerns related to vectors derived from human adenoviruses (AdVs). In addition, CAV-2
vectors preferentially transduce neurons and efficient traffic via axons to afferent regions
when injected in brain. To meet the need for preclinical and possibly clinical uses,
scalable and robust production processes are required. CAV-2 vectors are currently
produced in E1-transcomplementing DK (dog kidney) cells, which might raise obstacles
in regulatory approval for clinical grade material production. Here a GMP-compliant
bioprocess was developed. An MDCK-E1 cell line, developed by our group, was grown in
scalable stirred tank bioreactors, using serum-free medium, and used to produce CAV-2
vectors. Vectors produced in MDCK-E1 cells were identical as those produced in DK cells
as assessed by SDS-page and DLS measurements (diameter and Zeta potential).
Productivities of ~109 infectious particles (IP)/mL and 2 x 10³ IP/cell were possible.
These results constitute a step towards a scalable process for CAV-2 vectors production
compliant with clinical material specifications.

Production with adherent cells using microcarrier technology
59
Contents
1. Introduction ............................................................................................................................................... 60
2. Materials and methods .......................................................................................................................... 61
2.1. Cell lines and Culture Media ............................................................................................................ 61
2.2. Cell Growth Assays ............................................................................................................................... 61
2.3. Cell concentration determination.................................................................................................. 62
2.4. ΔE1 CAV-2 vector stock preparation ........................................................................................... 62
2.5. CAVGFP production assays ............................................................................................................... 62
2.6. Titration of infectious CAVGFP particles .................................................................................... 63
2.7. Measurement of total CAVGFP particles by Real Time-PCR (RT-PCR) ......................... 63
2.8. Protein profile of CAVGFP by SDS-PAGE and western blot ................................................ 64
2.9. Size and Electrodynamics measurements of CAVGFP .......................................................... 64
2.10. Bioreactor culture and CAVGFP production .......................................................................... 64
3. Results ........................................................................................................................................................... 65
3.1. MDCK-E1 transcomplementing cells for the production of a ∆E1 CAV-2 vector ..... 65
3.2. Effect of culture medium on cell growth and vector production under static
conditions ......................................................................................................................................................... 66
3.3. Production optimization under stirring conditions .............................................................. 67
3.3.1. Effect of cell inoculum and microcarrier type on cell growth .................................. 67
3.3.2. Effect of time of harvest on virus yield .............................................................................. 68
3.3.3. Stirred tank bioreactor for ∆E1 CAV-2 production ...................................................... 68
4. Discussion.................................................................................................................................................... 69
5. Acknowledgements and author contribution ............................................................................. 71
6. References ................................................................................................................................................... 71
Chapter III – Part A
60
1. Introduction
Viral vectors are currently the most efficient tools for in vivo gene transfer. Due in part to
their in vivo efficiency, adenovirus vectors (AdV) are used more often than any other
vector in clinical trials (http://www.wiley.com/legacy/wileychi/genmed/clinical/).
Several characteristics make this diverse family of vectors attractive, namely wide cell
tropism in quiescent and non-quiescent cells, the poor ability to integrate the host
genome and the high production titers obtained in culture (1). However, gene transfer
efficacy and the clinical use of human AdV can be hampered by the pre-existing humoral
and cellular immunity in most humans (2, 3).
Canine adenovirus type 2 (CAdV-2, or more common referred to as CAV-2) is probably
the best characterized nonhuman adenovirus vector (2-5). The paucity of neutralizing
antibodies and memory T cells in humans and efficient gene delivery obtained for E1-
deleted (∆E1) CAV-2 vectors in the central nervous system, make these viruses promising
tools for human gene therapy (2, 5). The extraordinary ability to preferentially transduce
neurons combined with a remarkable capacity of axonal transport, make CAV-2 vectors
candidates for the treatment of neurodegenerative diseases (6).
The need for significant amounts of clinical grade adenovirus vectors, which in some
cases may reach 1013 total particles/patient or 1011 infectious particles/patient, requires
efficient and robust processes for production and purification at large-scale compliant
with good manufacturing practices (GMP) (1). Therefore, current lab-scale protocols
must be adapted and transferred to a scalable stirred culture system
Moreover, cells cultured with media containing animal serum should be avoided. The
undefined composition and high batch-to-batch variability of serum, together with its
potential source of contaminations, raises safety concerns and hinders the
standardization of cell culture processes for the production of biopharmaceuticals (7).
To date, CAV-2 vectors have been produced in a cell-line generated from dog kidney (DK)
(2). However these cells are not regulated for biopharmaceuticals production, which
precludes the potential clinical use of CAV-2 vectors. Recently, we developed a CAV-2 E1-
trascomplementing cell-line based in MDCK. MDCK cells are accepted in Food and Drug
Administration (FDA) and European Medicine Agency (EMA) and used for the production
of many viral vaccines. In fact, recently, a cell based flu vaccine produced in MDCK was
launched in the market by Novartis (Optaflu®). Thus, the use of an MDCK-based cell-line
would facilitate the regulatory approval for the production of CAV-2 vectors.

Production with adherent cells using microcarrier technology
61
Here, MDCK-E1 cells grown in microcarriers was used as host cells for viral production in
stirred tank bioreactors. The impact of upstream parameters, such as cell inoculum
concentration, microcarrier type on cell growth and time of harvesting on total viral
productivity were evaluated. Our results constitute a significant step in a scalable CAV-2
vector production
2. Materials and methods
2.1. Cell lines and Culture Media
DKZeo cells, generated from DK cell line as described by Kremer et al. (6), were
maintained in DMEM (Gibco, Paisley, UK) with 10% (v/v) fetal bovine serum (FBS)
(Gibco) and 1% (v/v) non-essential amino acids (Sigma-Aldrich, St. Louis, MO, USA).
MDCK-E1 cells were obtained by transfecting MDCK (ECCAC 841211903) with pCI-neo
plasmid (Promega, Madison, WI, USA) harboring E1 gene from CAV-2, using similar
approach to the one described for DKZeo cells.(2, 8). MDCK-E1 cells were cultivated in
MEM (Sigma) with 10% (v/v) FBS, 2 mM glutamine (Gibco) and 1% (v/v) non-essential
amino acids (Sigma). These cells were sequentially adapted to Optipro serum-free
medium (Gibco) with 4 mM glutamine (Gibco) by increasing the percentage of Optipro
medium in subculture passages. Cells were subcultured twice a week in 150 cm2 t-flasks
and maintained in an incubator with humidified atmosphere of 5% CO2 in air at 37ºC. For
splitting or collecting cells, the monolayer was washed with PBS, incubated with 0.25%
trypsin-EDTA (Gibco) at 37ºC until detachment started to become evident (up to 15 min)
and cells suspended in culture medium. Cells were seeded directly using culture media
containing FBS (MEM and DMEM), or pelleted at 300 g during 10 min and re-suspended
in fresh medium when serum-free medium was used.
2.2. Cell Growth Assays
MDCK-E1 growth assays in static cultures were performed using an inoculum of 1 x 10⁴
cells/cm2 in 25 cm2 t-flasks with a working volume of 10 mL.
The stirred cultures were performed in 125 mL spinner flasks (Wheaton, Millville, NJ,
USA) previously siliconized with a solution of dimethyldichlorosilane in toluene (Merck,
Darmstadt, Germany) to prevent sticking of cells and microcarriers to the flasks walls.
Chapter III – Part A
62
Two non-porous microcarriers, Cytodex 3 and Cytodex 1 (GE Healthcare, Uppsala,
Sweden), were prepared according to the manufacturers’ instructions. The growth curves
were performed using an inoculum of 1 x 10⁵ and 2 x 10⁵ cells/mL, a microcarrier
concentration of 2 and 3 mg/mL and a stirring of 50 rpm.
2.3. Cell concentration determination
Cells were counted using a Fuchs–Rosenthal haemocytometer chamber with the trypan
blue exclusion method. In static cultures, cells were counted directly from cell suspension
after trypsin detachment. In stirred/microcarriers cultures, a similar procedure was
adapted. From 1 mL sample, microcarriers were let to settle-down and supernatant
removed (~800 μL). PBS was added in same volume to wash cells and removed after new
microcarriers settle-down. Equal volume of trypsin was added, cells were incubated at
37ºC until evident detachment, suspended by pipetting up and down and finally counted.
2.4. ΔE1 CAV-2 vector stock preparation
CAVGFP, an E1-deleted CAV-2 vector, was prepared as described previously (2). For
stock preparation, 150 cm2 t-flasks with DKZeo cells at a confluency of 80 - 90% were
infected with a MOI of 5 (ip) and medium exchange at time of infection. 40 hours post
infection (hpi) cells were collected and lysed with 0.1% (v/v) Triton 100x (Sigma-
Aldrich). The lysate was clarified by centrifugation at 3 000 g during 10 min at 4ºC and
purified by CsCl gradients as described previously (2). The purified vectors were stored
in phosphate buffered saline (PBS) with 10% (v/v) glycerol in aliquots at -85ºC. The
ip/physical particles (pp) ratio was 1:21 based on FACS analysis and Real-Time PCR.
2.5. CAVGFP production assays
The infection assays were performed in tissue-culture (TC) Petri dishes with 10 cm
diameter (BD Biosciences, Franklin Lakes, NJ, USA) and 125 ml spinner vessels
(Wheaton). A MOI of 5 was used and the medium was exchanged at the time of infection.
When using TC Petri dishes 8 x 10⁴ cells/cm2 were seeded and infected 24h after with a
cell confluence of 80 - 90% and a working volume of 10 mL. In spinner flasks cultures 1 x
105 cells/mL and 2 x 10⁵ cells/mL were inoculated using MEM and Optipro media,
respectively. Cells were infected at the end of the exponential growth phase (approx. 48
h). Extracellular viruses were collected from the cell supernatant. Intracellular viruses

Production with adherent cells using microcarrier technology
63
were collected by disrupting cells in a known volume of lysing buffer (Tris/HCl 10 mM,
pH 8.0 and 0.1% (v/v) Triton-X 100). The resulting intracellular and extracellular
samples were clarified at 3000 g for 10 min at 4ºC and stored at -85ºC.
2.6. Titration of infectious CAVGFP particles
Quantification of infectious particles was performed by monitoring the expression of GFP
reporter gene using slightly modifications to the method described by Ferreira et al. (9).
Briefly, 8 x 10⁴ MDCK-E1 cells were seeded in 24-well plates and infected with serial
dilutions of viral suspensions. Cells were trypsin-detached 24 hpi and the percentage of
GFP-positive cells determined by flow cytometry (CyFlow Space, Partec, Münster,
Germany).
2.7. Measurement of total CAVGFP particles by Real Time-PCR (RT-PCR)
CAVGFP DNA was extracted and purified by High Pure Viral Nucleic Acid Kit (Roche
Diagnostics, Penzberg, Germany). Previously purified and quantified plasmid coding for
the E1-deleted CAV-2 vector genome (pJB19) (10) was used as standard.
Amplifications were performed by the Light Cycler system with ‘‘Fast Start Master SYBR
Green I kit’’ (Roche Diagnostics) based on the method developed previously (11). For a 20
µL PCR reaction, 10 µL DNA templates and 10 µL of mastermix were added to each
capillary. The mastermix content was 3 mM MgCl2 and 0.5 µM of each primer. The
forward primer used was 5’AAATATACAGGACAAAGAGGTGTGG3’ and the reverse
5’GAACTCGCCCTGTCGTAAAA3’. The standard program was performed according in Light
Cycler RT-PCR (Roche Diagnostics) and analyzed using the Light Cycler software. A
standard curve was obtained by linear regression analysis of the threshold cycle (Ct)
value (y axis) versus the log of the initial copy number present in each sample dilution (x
axis). PCR efficiency (E) was calculated as E= 10(-1/slope) – 1 and corresponded to 2.021.
The error associated was 0.0849. The PCR limit of detection was ~1 x 10²
copies/reaction, detected using 40 cycles. The viral DNA loss during DNA
extraction/purification showed to be constant and was further considered to calculate
physical particles concentration (11).

Chapter III – Part A
64
2.8. Protein profile of CAVGFP by SDS-PAGE and western blot
Viral particles were precipitated in absolute ethanol at -20ºC overnight, centrifuged at
10.000 g for 10 min and concentrated in the SDS-PAGE loading-buffer at 30 μg of protein
per total volume to apply on gel. SDS-PAGE was performed according to NuPAGE®
Novex® Bis-Tris Mini Gels protocol using the Xcell SureLock™ equipment (Invitrogen).
Western blot analysis was carried out using a polyclonal rabbit anti-CAV-2 primary
antibody (12). Proteins were revealed via BCIP/NBT substrate (Pierce) after incubation
with an alkaline phosphatase conjugated anti-rabbit secondary antibody (Sigma-Aldrich).
2.9. Size and Electrodynamics measurements of CAVGFP
Size and zeta potential of viral particles were determined by dynamic light scatering
(DLS) using a Zetasizer Nano-ZS Series ZEN3600 equipped with a 633nm He-Ne laser
(Malvern, Worcestershire, UK). Zeta potential was measured using a 40 μl sample in 660
μl 10 mM phosphate buffer (Sigma-Aldrich) for pH ranging from 3 to 10 in 10x10 mm
plastic cuvette (Sarstedt, USA) using a dip-cell (Malvern). Particles size was determined
using the same sample and buffer volumes at pH 8.
2.10. Bioreactor culture and CAVGFP production
MDCK-E1 cells were cultivated in siliconized 2 L stirred tank bioreactors (Biostat Q-Plus,
Sartorius Stedim Biotech, Goettingen, Germany) equipped with 3-blade impellers, under
defined conditions (working volume: 1.5 L; pH: 7.4; temperature: 37ºC; surface aeration
at 40% pO2; agitation rate: 50 - 60 rpm). Cells (2 x 10⁵ cells/mL) were seeded on 3
mg/mL of Cytodex 1 microcarriers placed inside glass bottles and transferred to
bioreactor vessels. Culture medium Optipro was supplemented with 5% (v/v) FBS during
inoculation (12 h). Then, a complete medium replacement was done by stopping agitation
and letting microcarriers settle-down. After 2 days cultivation (1 x 10⁶ cells/mL), the
medium was exchanged to regular Optipro (without FBS) and cells were infected with
MOI 5.

Production with adherent cells using microcarrier technology
65
3. Results
The ability of MDCK-E1 cells to produce CAV-2 particles of correct size, charge and SDS
profile was evaluated by comparison with viral vector production in DKZeo cells. The
impact of serum-free (SF) Optipro medium on cellular growth and viral production was
also assessed by comparing the results obtained with serum-supplemented (SS) MEM.
Moreover, to develop a scalable process, the best inoculation strategy (cell concentration
inoculum and microcarrier type) for improved cell growth and the best time of harvest
for maximum virus productions yield in stirring conditions were evaluated and
confirmed in 2 L bioreactor.
3.1. MDCK-E1 transcomplementing cells for the production of a ∆E1 CAV-2 vector
To evaluate MDCK-E1 cell line potential for CAV-2 vectors production, specific
productivity/amplification of CAVGFP and its physical characteristics were investigated.
DKZeo cells were used as control because they are currently used for the production of
these vectors; vectors were produced in both cell lines using DMEM culture medium.
Similar cell specific productivities and infectious particles amplification were obtained for
both cell lines (Table 1). No significant difference in particles size, charge or protein SDS
profile was detected for viral particles produced with DKZeo and MDCK-E1 (Figure 1).
These results suggest that MDCK-E1 cells are suitable for CAV-2 vectors production.
Table 1. Effect of producer cell line on production and properties of viral particles
Criteria MDCK-E1 DKZeo MDCK-E1
Serum-free conditions
Cell specific productivity (ip/cell) 2 345 ±
5861
2 605 ± 6511
2 223 ± 5561
Amplification (ip out/ip in) 469 ± 1171 521 ± 1301 445 ± 1381
Total physical particles per ip in purified preparations
21 ± 61 17 ± 51 26 ± 81
Viral particles diameter (nm) 116 ± 172 115 ± 172 n.d.
1 Standard deviation of triplicate measurements; 2 Assumes 15% standard instrument error associated with the measurement. n.d.: non-determined.
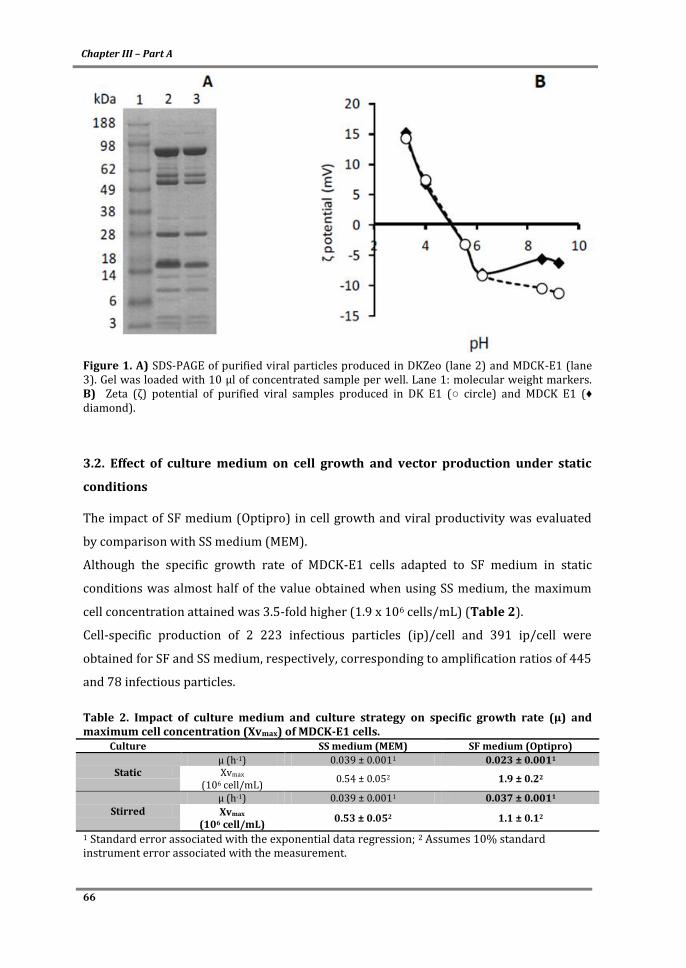
Chapter III – Part A
66
Figure 1. A) SDS-PAGE of purified viral particles produced in DKZeo (lane 2) and MDCK-E1 (lane 3). Gel was loaded with 10 μl of concentrated sample per well. Lane 1: molecular weight markers. B) Zeta (ζ) potential of purified viral samples produced in DK E1 (○ circle) and MDCK E1 (♦ diamond).
3.2. Effect of culture medium on cell growth and vector production under static
conditions
The impact of SF medium (Optipro) in cell growth and viral productivity was evaluated
by comparison with SS medium (MEM).
Although the specific growth rate of MDCK-E1 cells adapted to SF medium in static
conditions was almost half of the value obtained when using SS medium, the maximum
cell concentration attained was 3.5-fold higher (1.9 x 10⁶ cells/mL) (Table 2).
Cell-specific production of 2 223 infectious particles (ip)/cell and 391 ip/cell were
obtained for SF and SS medium, respectively, corresponding to amplification ratios of 445
and 78 infectious particles.
Table 2. Impact of culture medium and culture strategy on specific growth rate (µ) and maximum cell concentration (Xvmax) of MDCK-E1 cells.
Culture SS medium (MEM) SF medium (Optipro)
Static µ (h-1) 0.039 ± 0.0011 0.023 ± 0.0011 Xvmax
(106 cell/mL) 0.54 ± 0.052 1.9 ± 0.22
Stirred µ (h-1) 0.039 ± 0.0011 0.037 ± 0.0011
Xvmax (106 cell/mL)
0.53 ± 0.052 1.1 ± 0.12
1 Standard error associated with the exponential data regression; 2 Assumes 10% standard instrument error associated with the measurement.

Production with adherent cells using microcarrier technology
67
3.3. Production optimization under stirring conditions
3.3.1. Effect of cell inoculum and microcarrier type on cell growth
The effect of inoculum concentration in stirred cultures was evaluated in SS and SF
medium testing two concentrations: 1 x 10⁵ cells/mL and 2 x 10⁵ cells/mL. The ability of
Cytodex 1 and Cytodex 3 to support cell growth in serum-free medium was also
evaluated.
MDCK-E1 cells did not attach to microcarriers when SF medium was used. To overcome
this and promote cell adhesion, 5% (v/v) FBS was added. After 12 h this culture medium
was replaced by regular SF medium (without FBS).
Maximum cell concentration obtained for both culture media and cell inoculums tested is
shown in Figure 2. The highest cell concentration was obtained for SF medium at
approximately 50 h of culture using an inoculum of 2 x 10⁵ cells/mL. No differences were
observed between the two microcarriers evaluated as assessed by total cell number and
viability. Moreover, a similar range of total cell concentration was obtained for static or
stirred cultures using both culture media (Table 2).
Figure 2. Maximum cell concentration obtained in spinner flasks using different cell inoculums in serum-supplemented (SS) and serum-free (SF) media. All experiences were performed with MDCK-E1 and Cytodex 1 except in ♦ (diamond) where Cytodex 3 was used. Medium exchange was performed after cell attachment (12 h) and considered to exclude any effect of serum on cell growth under stirring conditions. Error bars represent error associated with the measurement (~10%).

Chapter III – Part A
68
3.3.2. Effect of time of harvest on virus yield
After infecting cells, the maximum number of infectious particles was achieved between
24 and 36 hpi (Figure 3A), the majority being in the intracellular fraction. At this time,
infectious particles amplification ratio of 21 and 28, corresponding to 132 ip/cell and 141
ip/cell, were obtained for MDCK-E1 cells in SF medium and SS medium, respectively.
3.3.3. Stirred tank bioreactor for ∆E1 CAV-2 production
Taking into account the results obtained in spinner vessels (2.3.1 and 2.3.2) MDCK-E1
cells were cultivated in a 2 L stirred tank bioreactor using an inoculum of 2 x 10⁵ cells/mL
and 3 mg/mL of Cytodex 1 microcarriers. Maximum cell concentration of 1.1 x 10⁶
cells/mL was obtained being the maximum infectious particles productivity obtained at
24 – 36 hpi. However, in bioreactor an amplification ratio of 256 was attained
corresponding to a volumetric productivity of 1.8 x 10⁹ ip/mL (Figure 3B).
Figure 3. A) Amplification ratio of infectious particles along time after infecting MDCK-E1 cells in spinner flasks with serum supplemented medium and serum-free medium. Between 24 and 36 hpi most of viable cells attained attached to microcarriers. Error bars represent standard deviation of triplicate measurements. B) Volumetric productivity (ip/mL) obtained with MDCK-E1 cultured in static cultures (T-Flasks) and bioreactor (in Cytodex 1) using serum supplemented medium and serum-free medium. Viral vectors were collected at 40 hpi and 36 hpi in static and bioreactor cultures, respectively. Error bars represent standard deviation of triplicate measurements.

Production with adherent cells using microcarrier technology
69
4. Discussion
The potential of CAV-2 vectors for fundamental and clinical gene transfer and the
amounts needed require a robust and scalable bioprocess. MDCK cells are accepted by the
FDA and EMEA as producer cells for clinical grade vaccines and recombinant protein. In
this study, an MDCK derived cell-line was used to produce ∆E1 CAV-2 vectors using
serum-free medium.
Productivities and the impact on viral particles were consistent with the robustness of
MDCK-E1 cells to produce ∆E1 CAV-2 vectors when compared with DKZeo cells.
The main differences in MDCK-E1 cells performance observed between SF Optipro and SS
MEM is likely due to the more complex composition of SF medium. Cells cultured in SF
medium, although showing slower growth rates, can achieve higher cell concentration
since more nutrients and/or nutrients concentration are available. Moreover, a similar
range of cell specific productivity was obtained when using cells cultivated in a richer
serum supplemented medium, namely DMEM.
Adaptation of cells to SF medium affected the cell specific grown as adherent monolayer
in static cultures. However, for stirring conditions similar growth rates were observed,
when compared with MDCK-E1 cells growing in SS medium. This observation suggested a
relation between agitation and promotion of cell growth rate when SF medium was used.
Serum provides many factors that promote cell adhesion. Although several reports in the
literature describe effective cell attachment to microcarriers, for different cell types
including MDCK (13), in commercially available serum free SF formulations, we were not
able to accomplish this for the MDCK-E1 cells used herein. Attachment was only
significant in the presence of serum, being possible to remove it afterwards without
compromising virus productivity. From a biopharmaceutical production process
perspective, the use of animal compounds, namely serum, should be avoided. However, as
the serum was only required for the cell attachment phase (inoculation) and was washed
out by two complete medium replacement steps, the content of serum during bioprocess
cell growth, virus infection and virus production phases was low and the risks associated
with its use significantly reduced.
In contrast to the reported cultivation of MDCK cells in microcarrier under stirring
conditions, we observed similar maximum cell concentration using Cytodex 1 or Cytodex
3 without significant cell detachment during growth (13, 14). In studies using MDCK cells
for influenza production, growth rates of about 0.02 to 0.035 h-1 and maximum cell

Chapter III – Part A
70
concentrations of 1.1 x 10⁶ – 1.3 x 10⁶ cells/mL obtained 4 and 5 - 6 days after inoculation
using SS and SF medium, respectively, were reported (13, 15, 16). In our hands, the same
range of maximum cell concentration was obtained. However, the higher specific growth
and shorter lag phase may have been responsible for a maximum cell concentration
attained only 2 days after inoculating same cell number. Host cell-line effect was
excluded, because a similar performance was observed between MDCK-E1 cells and
MDCK progenitor cell line under same conditions (data not shown). These discrepancies
may be due to the different culture media used in each study. Moreover, these variations
in specific growth rate and maximum cell concentrations should be viewed in the context
of cell metabolic state. From a bioprocess perspective, the need for higher cell
concentration to increase volumetric productivity is expected; thus the next step towards
CAV-2 vectors production process is to design a feeding strategy to obtain high MDCK-E1
cells concentration, while maintaining the corresponding cell-specific virus yield.
Although this is a nonhuman adenovirus, the mechanisms underlying viral replication
cycle and its production are similar (2, 6, 17). Therefore, a high MOI was used for vector
production assays. In most reports, typical titers range from 104 to 105 adenovirus total
particles per cell, while infectious particles are 1 log lower (2, 18, 19). Although high viral
productivity is obtained using SF medium with adherent monolayer cells in static
cultures, the fast decrease of pH after infecting cells in spinner cultures may be
responsible for the 20-fold lower productivity. By controlling pH in 2 L stirred tank
bioreactor during process validation, the productivity can be restored to yields
comparable with in static cultures. The optimal harvest times described for adenoviruses
are in the range of 40-48 hpi (20, 21).However, under stirring conditions the maximum
yield of ∆E1 CAV-2 was attained earlier. Considering that similar cell-specific productivity
was obtained in 2 L stirred tank bioreactor (24 - 36 hpi) and static cultures (40 hpi), we
speculate that stirring promotes MDCK cell metabolic activity, which ultimately leads to
faster virus production.
In conclusion, MDCK-E1 cells were an efficient producer cell line for ∆E1 CAV-2 vectors.
Cultivation of MDCK-E1 cells in stirred tank bioreactor readily reached a viable cell
concentration, and a high ∆E1 CAV-2 specific productivity at 36 hpi. For manufacturing
purposes, faster cell growth and earlier virus production time point improve process
economics.
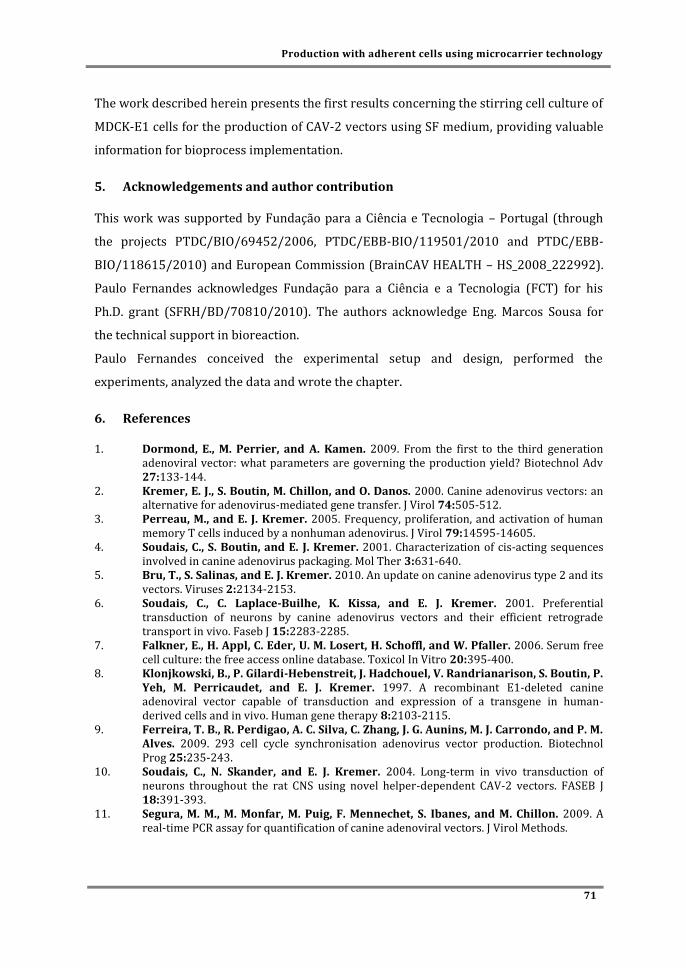
Production with adherent cells using microcarrier technology
71
The work described herein presents the first results concerning the stirring cell culture of
MDCK-E1 cells for the production of CAV-2 vectors using SF medium, providing valuable
information for bioprocess implementation.
5. Acknowledgements and author contribution
This work was supported by Fundação para a Ciência e Tecnologia – Portugal (through
the projects PTDC/BIO/69452/2006, PTDC/EBB-BIO/119501/2010 and PTDC/EBB-
BIO/118615/2010) and European Commission (BrainCAV HEALTH – HS_2008_222992).
Paulo Fernandes acknowledges Fundação para a Ciência e a Tecnologia (FCT) for his
Ph.D. grant (SFRH/BD/70810/2010). The authors acknowledge Eng. Marcos Sousa for
the technical support in bioreaction.
Paulo Fernandes conceived the experimental setup and design, performed the
experiments, analyzed the data and wrote the chapter.
6. References
1. Dormond, E., M. Perrier, and A. Kamen. 2009. From the first to the third generation adenoviral vector: what parameters are governing the production yield? Biotechnol Adv 27:133-144.
2. Kremer, E. J., S. Boutin, M. Chillon, and O. Danos. 2000. Canine adenovirus vectors: an alternative for adenovirus-mediated gene transfer. J Virol 74:505-512.
3. Perreau, M., and E. J. Kremer. 2005. Frequency, proliferation, and activation of human memory T cells induced by a nonhuman adenovirus. J Virol 79:14595-14605.
4. Soudais, C., S. Boutin, and E. J. Kremer. 2001. Characterization of cis-acting sequences involved in canine adenovirus packaging. Mol Ther 3:631-640.
5. Bru, T., S. Salinas, and E. J. Kremer. 2010. An update on canine adenovirus type 2 and its vectors. Viruses 2:2134-2153.
6. Soudais, C., C. Laplace-Builhe, K. Kissa, and E. J. Kremer. 2001. Preferential transduction of neurons by canine adenovirus vectors and their efficient retrograde transport in vivo. Faseb J 15:2283-2285.
7. Falkner, E., H. Appl, C. Eder, U. M. Losert, H. Schoffl, and W. Pfaller. 2006. Serum free cell culture: the free access online database. Toxicol In Vitro 20:395-400.
8. Klonjkowski, B., P. Gilardi-Hebenstreit, J. Hadchouel, V. Randrianarison, S. Boutin, P. Yeh, M. Perricaudet, and E. J. Kremer. 1997. A recombinant E1-deleted canine adenoviral vector capable of transduction and expression of a transgene in human-derived cells and in vivo. Human gene therapy 8:2103-2115.
9. Ferreira, T. B., R. Perdigao, A. C. Silva, C. Zhang, J. G. Aunins, M. J. Carrondo, and P. M. Alves. 2009. 293 cell cycle synchronisation adenovirus vector production. Biotechnol Prog 25:235-243.
10. Soudais, C., N. Skander, and E. J. Kremer. 2004. Long-term in vivo transduction of neurons throughout the rat CNS using novel helper-dependent CAV-2 vectors. FASEB J 18:391-393.
11. Segura, M. M., M. Monfar, M. Puig, F. Mennechet, S. Ibanes, and M. Chillon. 2009. A real-time PCR assay for quantification of canine adenoviral vectors. J Virol Methods.

Chapter III – Part A
72
12. Salinas, S., L. G. Bilsland, D. Henaff, A. E. Weston, A. Keriel, G. Schiavo, and E. J. Kremer. 2009. CAR-associated vesicular transport of an adenovirus in motor neuron axons. PLoS pathogens 5:e1000442.
13. Genzel, Y., M. Fischer, and U. Reichl. 2006. Serum-free influenza virus production avoiding washing steps and medium exchange in large-scale microcarrier culture. Vaccine 24:3261-3272.
14. Tree, J. A., C. Richardson, A. R. Fooks, J. C. Clegg, and D. Looby. 2001. Comparison of large-scale mammalian cell culture systems with egg culture for the production of influenza virus A vaccine strains. Vaccine 19:3444-3450.
15. Genzel, Y., I. Behrendt, S. Konig, H. Sann, and U. Reichl. 2004. Metabolism of MDCK cells during cell growth and influenza virus production in large-scale microcarrier culture. Vaccine 22:2202-2208.
16. Genzel, Y., J. B. Ritter, S. Konig, R. Alt, and U. Reichl. 2005. Substitution of glutamine by pyruvate to reduce ammonia formation and growth inhibition of mammalian cells. Biotechnol Prog 21:58-69.
17. Chillon, M., and E. J. Kremer. 2001. Trafficking and propagation of canine adenovirus vectors lacking a known integrin-interacting motif. Hum Gene Ther 12:1815-1823.
18. Nadeau, I., and A. Kamen. 2003. Production of adenovirus vector for gene therapy. Biotechnol Adv 20:475-489.
19. Ferreira, T. B., A. L. Ferreira, M. J. Carrondo, and P. M. Alves. 2005. Effect of re-feed strategies and non-ammoniagenic medium on adenovirus production at high cell densities. J Biotechnol 119:272-280.
20. Altaras, N. E., J. G. Aunins, R. K. Evans, A. Kamen, J. O. Konz, and J. J. Wolf. 2005. Production and formulation of adenovirus vectors. Adv Biochem Eng Biotechnol 99:193-260.
21. Kamen, A., and O. Henry. 2004. Development and optimization of an adenovirus production process. J Gene Med 6:184-192.

Part B
Production with cells adapted to suspension
This chapter is based in the data to be published as:
Fernandes P, Sousa MFQ, Kremer EJ, Coroadinha AS, Alves PM. Suspension MDCK-E1 cell
line for the manufacturing of CAV-2 vectors. (under preparation)

Chapter III – Part B
74
Abstract
MDCK-derived cell lines can be used for canine adenovirus type 2 (CAV-2) vectors
manufacturing. However, these cells are anchorage-dependent, which complicates
process scale-up. This work aimed at streamline CAV-2 production process by adapting
our MDCK-E1 cell line to grow in suspension using serum-free medium. After directly
transferring MDCK-E1 cells to SFM4BHK medium and shaker flasks, cells were adapted to
suspension growth in 5 weeks. The newly adapted cells presented reproducible cell
growth profiles and maximum cell density up to 2.6×10⁶ cells/mL. Adapted cells
maintained their capacity to be infected by CAV-2 and titers up to 5×10⁸ IP/mL were
obtained. Here, we show that MDCK-E1 cells adapted to suspension can have a good
performance in what concerns virus production, providing important infection conditions
to be undertaken when streamlining CAV-2 bioprocess. This constitutes a step forward in
developing a scalable production process, contributing to make the process of CAV-2
vectors manufacturing equivalent to human adenovirus vectors.

Production with cells adapted to suspension
75
Contents
1. Introduction ............................................................................................................................................... 76
2. Materials and methods .......................................................................................................................... 76
2.1. Cell lines and culture media ............................................................................................................. 76
2.2. Viral vectors ............................................................................................................................................ 76
2.3. Adaptation to suspension growth in serum-free medium ................................................. 77
2.4. Cell growth assays ................................................................................................................................ 77
2.5. Evaluation of CAV-2 production in suspension adapted cells .......................................... 77
2.6. Stirred tank bioreactor for CAV-2 production ......................................................................... 78
2.7. Virus quantification ............................................................................................................................. 78
3. Results ........................................................................................................................................................... 79
3.1. Adaptation of MDCK-E1 cells to suspension ............................................................................. 79
3.2. Cell growth of suspension-adapted cells .................................................................................... 79
3.3. CAV-2 production in cells adapted to suspension growth under different MOIs .... 80
3.4. Reducing process steps: avoiding medium exchange at infection .................................. 81
3.5. Effect of infection strategy on the infectivity of viral particles ........................................ 83
4. Discussion.................................................................................................................................................... 85
5. Acknowledgements and author contribution ............................................................................. 88
6. References ................................................................................................................................................... 88

Chapter III – Part B
76
1. Introduction
The need for large amounts of vectors for pre-clinical and clinical assays is anticipated
due to the increasing interest in canine adenovirus type 2 (CAV-2) vectors for gene
therapy applications (1, 2), When scaling-up processes, stirred culture systems are
preferred over the typical static cultures. Previously, we established a CAV-2 E1-
trascomplementing cell line derived from MDCK and developed a scalable production
process based in the use of microcarriers (Chapters II and III, part A). Although
microcarriers represent the traditional approach to transfer anchorage-dependent cells
to stirred culture systems, their use poses additional costs and processing steps
associated with microcarriers preparation, cell expansion and monitoring that can be
cumbersome at industrial scales (3). Therefore, adaptation of cell lines to grow in
suspension, being performed for many cell lines including HEK293 for human adenovirus
production (4), has been recently explored with parental MDCK cells by gene expression
(5, 6) or culture medium manipulation (7-9).
In this work, aiming to streamline the production process of CAV-2 vectors, we
established a suspension cell line in completely serum-free conditions. MDCK-E1 cell line
was adapted to suspension growth and serum-free medium and its potential as CAV-2
producer evaluated in stirred cultures.
2. Materials and methods
2.1. Cell lines and culture media
MDCK-E1 cells were obtained by transfecting MDCK (ECCAC 841211903) with pCI-neo
plasmid (Promega, Madison, WI, USA) harboring E1 gene from CAV-2, as described
previously (10). Cells were cultivated in DMEM (Gibco, Paisley, UK) with 10% (v/v) FBS,
subcultured twice a week in 150 cm2 t-flasks and maintained in an incubator with
humidified atmosphere of 5% CO2 in air at 37°C.
2.2. Viral vectors
CAVGFP is an E1-deleted (ΔE1) vector containing an eGFP expression cassette derived
from CAV-2 strain Toronto A 26/61, GenBank J04368. Viral vectors stocks were prepared
and purified by CsCl gradients as described previously (10, 11).
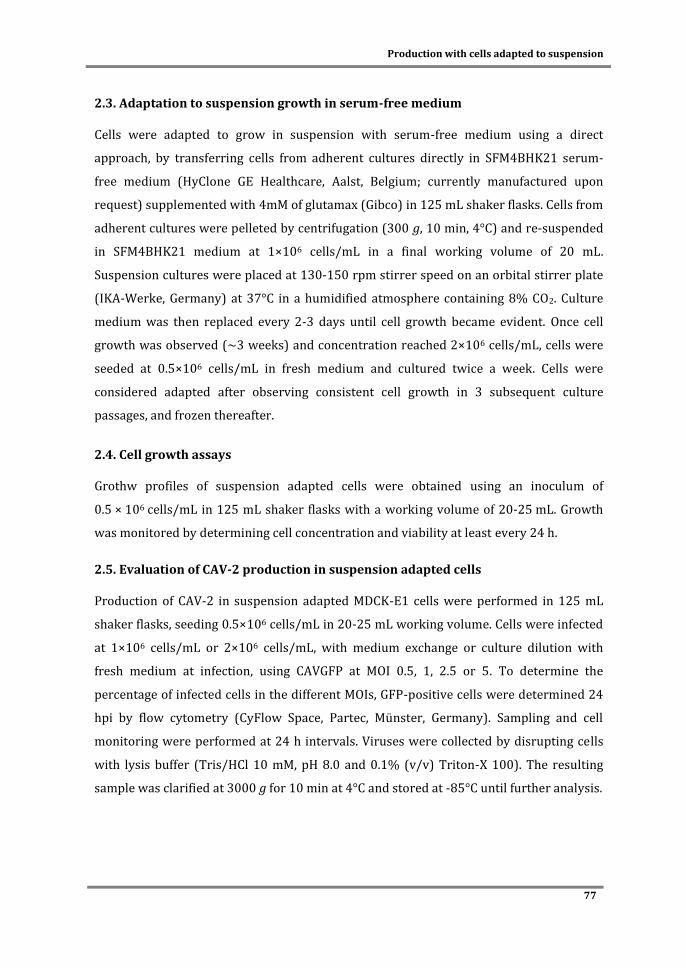
Production with cells adapted to suspension
77
2.3. Adaptation to suspension growth in serum-free medium
Cells were adapted to grow in suspension with serum-free medium using a direct
approach, by transferring cells from adherent cultures directly in SFM4BHK21 serum-
free medium (HyClone GE Healthcare, Aalst, Belgium; currently manufactured upon
request) supplemented with 4mM of glutamax (Gibco) in 125 mL shaker flasks. Cells from
adherent cultures were pelleted by centrifugation (300 g, 10 min, 4°C) and re-suspended
in SFM4BHK21 medium at 1×10⁶ cells/mL in a final working volume of 20 mL.
Suspension cultures were placed at 130-150 rpm stirrer speed on an orbital stirrer plate
(IKA-Werke, Germany) at 37°C in a humidified atmosphere containing 8% CO2. Culture
medium was then replaced every 2-3 days until cell growth became evident. Once cell
growth was observed (~3 weeks) and concentration reached 2×10⁶ cells/mL, cells were
seeded at 0.5×10⁶ cells/mL in fresh medium and cultured twice a week. Cells were
considered adapted after observing consistent cell growth in 3 subsequent culture
passages, and frozen thereafter.
2.4. Cell growth assays
Grothw profiles of suspension adapted cells were obtained using an inoculum of
0.5 × 10⁶ cells/mL in 125 mL shaker flasks with a working volume of 20-25 mL. Growth
was monitored by determining cell concentration and viability at least every 24 h.
2.5. Evaluation of CAV-2 production in suspension adapted cells
Production of CAV-2 in suspension adapted MDCK-E1 cells were performed in 125 mL
shaker flasks, seeding 0.5×10⁶ cells/mL in 20-25 mL working volume. Cells were infected
at 1×10⁶ cells/mL or 2×10⁶ cells/mL, with medium exchange or culture dilution with
fresh medium at infection, using CAVGFP at MOI 0.5, 1, 2.5 or 5. To determine the
percentage of infected cells in the different MOIs, GFP-positive cells were determined 24
hpi by flow cytometry (CyFlow Space, Partec, Münster, Germany). Sampling and cell
monitoring were performed at 24 h intervals. Viruses were collected by disrupting cells
with lysis buffer (Tris/HCl 10 mM, pH 8.0 and 0.1% (v/v) Triton-X 100). The resulting
sample was clarified at 3000 g for 10 min at 4°C and stored at -85°C until further analysis.
Chapter III – Part B
78
2.6. Stirred tank bioreactor for CAV-2 production
Suspension adapted MDCK-E1 cells were cultivated in 0.5 L stirred tank bioreactor
(Biostat Q-Plus, Sartorius Stedim Biotech, Goettingen, Germany) equipped with Rushton
6-blade disk impeller and a microsparger, under defined conditions (working volume: 0.3
L; pH: 7.4; temperature: 37°C; gas flow rate: 0.01 vvm; agitation rate: 50-110 rpm).
Dissolved oxygen concentration was kept constant at 40% of air saturation by controlling
gas inlet mixture with nitrogen, air and/or oxygen. pH was controlled using CO2
percentage in gas inlet. Cells were inoculated at 0.5×10⁶ cells/mL and infected at 1×10⁶
cells/mL with MOI 0.5 and medium exchange. For medium exchange, cells were collected
from bioreactor, centrifuged at 300 g for 15 min at 4°C and re-suspended in fresh
medium. Bioreactor was re-inoculated afterwards. Sampling and cell monitoring were
performed at 24 h intervals as described above.
2.7. Virus quantification
Quantification of infectious particles was performed by monitoring the expression of GFP
through flow cytometry from DK cells subjected to serial dilutions of viral samples, as
described previously (10). Physical (genome-containing) particles were titrated by
quantifying viral genomes through qPCR. Viral genomes were extracted and purified by
High Pure Viral Nucleic Acid Kit (Roche Diagnostics, Penzberg, Germany). SYBR Green I
dye chemistry was used to detect PCR products using Lightcycler system. Previously
purified and quantified plasmids coding for E1-deleted CAV-2 genome or GFP. To ensure
the removal of free viral genomes from samples and accurately quantify viral physical
particles, a benzonase treatment was performed prior to DNA extraction by adding 2 μl of
benzonase (250 U/μl) (Merck Millipore, Darmstadt, Germany) to the same sample
volume and incubating for 1 h at 37 °C. Benzonase was inhibited during the proteinase K
step of DNA extraction protocol. To estimate the number of viral genomes, primers
against the expression cassette of each viral vector were used. Primers for GFP gene:
forward 5’-CAGAAGAACGGCATCAAGGT-3’ and reverse 5’-CTGGGTGCTCAGGTAGTGG-3’.
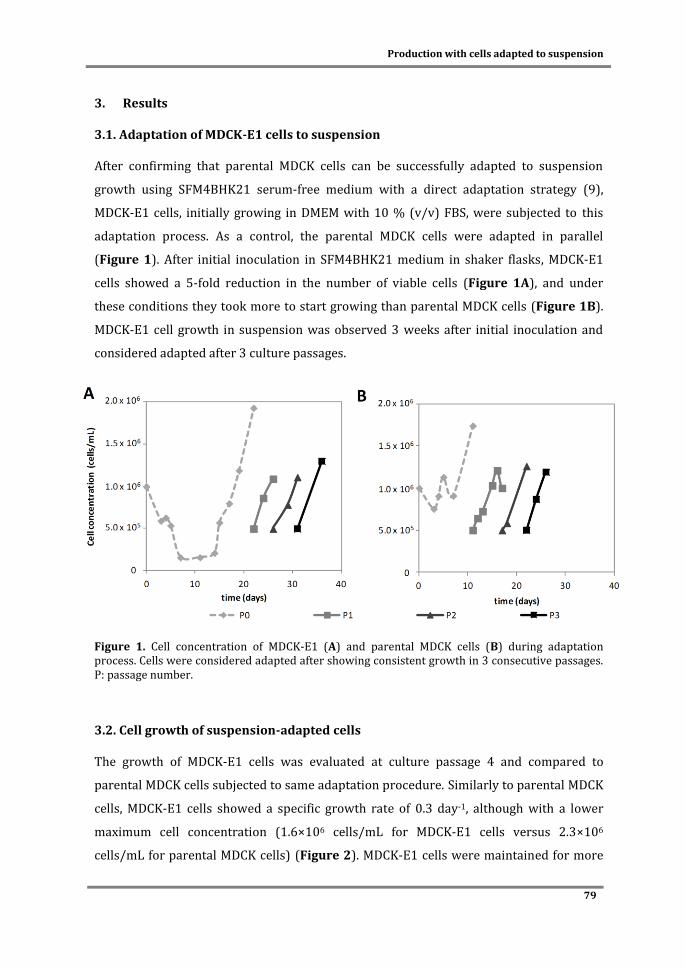
Production with cells adapted to suspension
79
3. Results
3.1. Adaptation of MDCK-E1 cells to suspension
After confirming that parental MDCK cells can be successfully adapted to suspension
growth using SFM4BHK21 serum-free medium with a direct adaptation strategy (9),
MDCK-E1 cells, initially growing in DMEM with 10 % (v/v) FBS, were subjected to this
adaptation process. As a control, the parental MDCK cells were adapted in parallel
(Figure 1). After initial inoculation in SFM4BHK21 medium in shaker flasks, MDCK-E1
cells showed a 5-fold reduction in the number of viable cells (Figure 1A), and under
these conditions they took more to start growing than parental MDCK cells (Figure 1B).
MDCK-E1 cell growth in suspension was observed 3 weeks after initial inoculation and
considered adapted after 3 culture passages.
Figure 1. Cell concentration of MDCK-E1 (A) and parental MDCK cells (B) during adaptation process. Cells were considered adapted after showing consistent growth in 3 consecutive passages. P: passage number.
3.2. Cell growth of suspension-adapted cells
The growth of MDCK-E1 cells was evaluated at culture passage 4 and compared to
parental MDCK cells subjected to same adaptation procedure. Similarly to parental MDCK
cells, MDCK-E1 cells showed a specific growth rate of 0.3 day-1, although with a lower
maximum cell concentration (1.6×10⁶ cells/mL for MDCK-E1 cells versus 2.3×10⁶
cells/mL for parental MDCK cells) (Figure 2). MDCK-E1 cells were maintained for more

Chapter III – Part B
80
20 culture passages. An increase of 1.5 fold in specific cell growth and maximum cell
density of MDCK-E1 cells was obtained after 20 passages: cells were able to grow up to
2.6×10⁶ cells/mL (Figure 2). Parental MDCK cells after 24 passages kept the same growth
profile.
Figure 2 - Cell growth of MDCK and MDCK-E1 in suspension cultures after adaptation. Two passage numbers were evaluated for each cell line. P: passage number.
3.3. CAV-2 production in cells adapted to suspension growth under different MOIs
Due to stirring, infection is usually more efficient in suspension cultures than in adherent
cultures. MOI should be thus tuned to ensure that infection is not compromising cell
viability that can impact virus production yields. MDCK-E1 cells were infected at 1×10⁶
cells/mL with medium exchange at infection and MOI 5, 2.5, 1 and 0.5. Then, cell
concentration, percentage of infected cells and virus production were evaluated (Figure
3). The results show that the majority of cells were infected with the different MOIs
assayed (Figure 3A). In fact, using a MOI as low as 0.5, 75% of cells were shown to be
infected. Cell death was in proportion to the MOI used, in which high virus input led to
earlier decrease in cell concentration (Figure 3B). While amplification ratios where
higher when low MOIs were used (Figure 3C), the total volumetric productivity was
higher when using high MOIs, with maximum productivity of 4.9 × 10⁸ infectious particles
(IP)/mL obtained at MOI 5 (Figure 3D). On the other hand, MOI 0.5 led to a maximum
volumetric productivity of 1.4×10⁸ IP/mL. CAV-2 production was then assayed in stirred
tank bioreactor cultures as a proof of concept. Cell culture and infection was prepared as
described above: infection at 1×10⁶ cells/mL with medium exchange and MOI of 0.5.

Production with cells adapted to suspension
81
Similarly to shaker flasks results, a volumetric productivity of 1.3×10⁸ IP/mL was
obtained. The best time of harvest was at 48 hpi. At this time point, CAV-2 vectors
presented 43 physical particles (PP) per each IP quantified.
Figure 3. Effect of MOI on CAV-2 production in suspension cultures of MDCK-E1 cells. (A) percentage of infected cells at 24 hpi. (B) Cell concentration after infection. (C) Amplification ratio of CAV-2 under different MOIs. (D) Total volumetric productivity (IP/mL). Cells were infected at 1×10⁶ cells/mL with medium exchange. Values are shown as average ± standard-deviation (n=2).
3.4. Reducing process steps: avoiding medium exchange at infection
Production of adenovirus in a lab-scale is typically performed with medium exchange at
infection. Although easy to perform in static cultures, medium exchange with suspension
cultures implies additional steps including centrifugation and re-inoculation of cells in
fresh medium. To overcome this, we diluted the cell culture at infection time with fresh
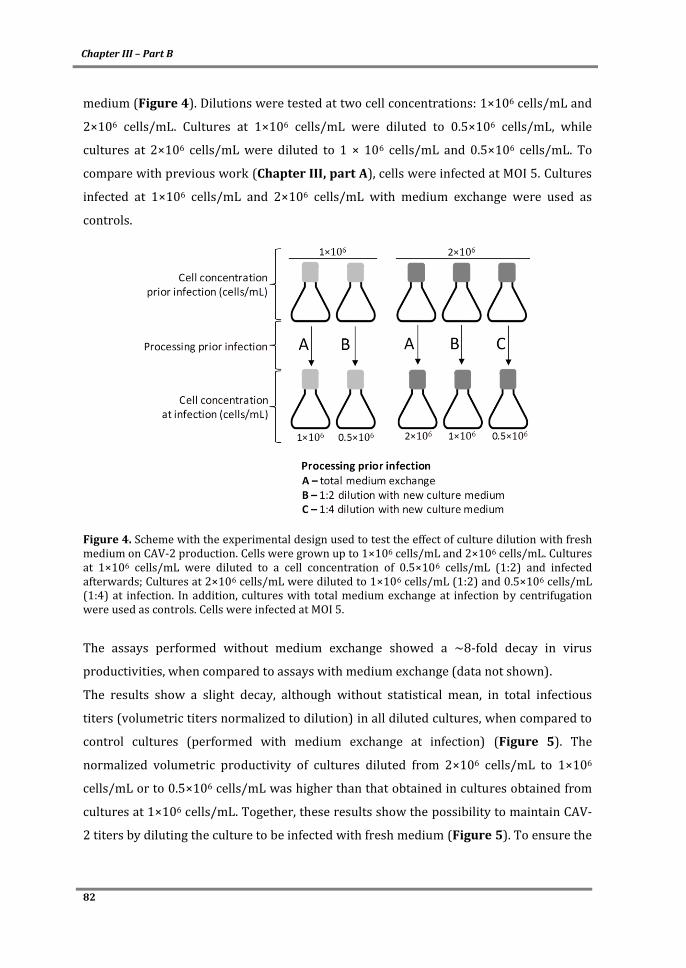
Chapter III – Part B
82
medium (Figure 4). Dilutions were tested at two cell concentrations: 1×10⁶ cells/mL and
2×10⁶ cells/mL. Cultures at 1×10⁶ cells/mL were diluted to 0.5×10⁶ cells/mL, while
cultures at 2×10⁶ cells/mL were diluted to 1 × 10⁶ cells/mL and 0.5×10⁶ cells/mL. To
compare with previous work (Chapter III, part A), cells were infected at MOI 5. Cultures
infected at 1×10⁶ cells/mL and 2×10⁶ cells/mL with medium exchange were used as
controls.
Figure 4. Scheme with the experimental design used to test the effect of culture dilution with fresh medium on CAV-2 production. Cells were grown up to 1×10⁶ cells/mL and 2×10⁶ cells/mL. Cultures at 1×10⁶ cells/mL were diluted to a cell concentration of 0.5×10⁶ cells/mL (1:2) and infected afterwards; Cultures at 2×10⁶ cells/mL were diluted to 1×10⁶ cells/mL (1:2) and 0.5×10⁶ cells/mL (1:4) at infection. In addition, cultures with total medium exchange at infection by centrifugation were used as controls. Cells were infected at MOI 5.
The assays performed without medium exchange showed a ~8-fold decay in virus
productivities, when compared to assays with medium exchange (data not shown).
The results show a slight decay, although without statistical mean, in total infectious
titers (volumetric titers normalized to dilution) in all diluted cultures, when compared to
control cultures (performed with medium exchange at infection) (Figure 5). The
normalized volumetric productivity of cultures diluted from 2×10⁶ cells/mL to 1×10⁶
cells/mL or to 0.5×10⁶ cells/mL was higher than that obtained in cultures obtained from
cultures at 1×10⁶ cells/mL. Together, these results show the possibility to maintain CAV-
2 titers by diluting the culture to be infected with fresh medium (Figure 5). To ensure the
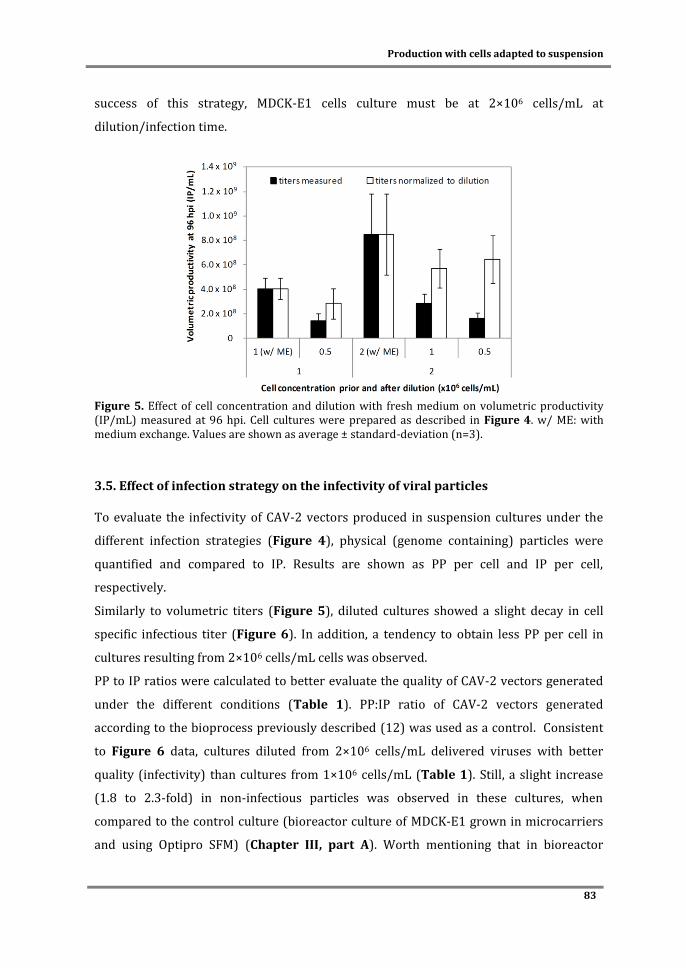
Production with cells adapted to suspension
83
success of this strategy, MDCK-E1 cells culture must be at 2×10⁶ cells/mL at
dilution/infection time.
Figure 5. Effect of cell concentration and dilution with fresh medium on volumetric productivity (IP/mL) measured at 96 hpi. Cell cultures were prepared as described in Figure 4. w/ ME: with medium exchange. Values are shown as average ± standard-deviation (n=3).
3.5. Effect of infection strategy on the infectivity of viral particles
To evaluate the infectivity of CAV-2 vectors produced in suspension cultures under the
different infection strategies (Figure 4), physical (genome containing) particles were
quantified and compared to IP. Results are shown as PP per cell and IP per cell,
respectively.
Similarly to volumetric titers (Figure 5), diluted cultures showed a slight decay in cell
specific infectious titer (Figure 6). In addition, a tendency to obtain less PP per cell in
cultures resulting from 2×10⁶ cells/mL cells was observed.
PP to IP ratios were calculated to better evaluate the quality of CAV-2 vectors generated
under the different conditions (Table 1). PP:IP ratio of CAV-2 vectors generated
according to the bioprocess previously described (12) was used as a control. Consistent
to Figure 6 data, cultures diluted from 2×10⁶ cells/mL delivered viruses with better
quality (infectivity) than cultures from 1×10⁶ cells/mL (Table 1). Still, a slight increase
(1.8 to 2.3-fold) in non-infectious particles was observed in these cultures, when
compared to the control culture (bioreactor culture of MDCK-E1 grown in microcarriers
and using Optipro SFM) (Chapter III, part A). Worth mentioning that in bioreactor
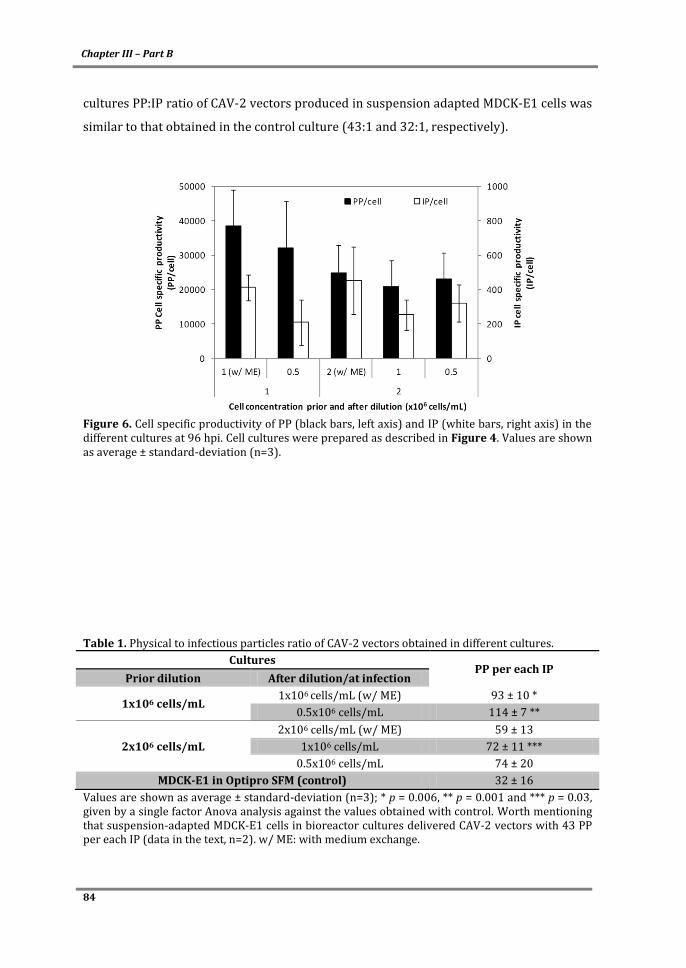
Chapter III – Part B
84
cultures PP:IP ratio of CAV-2 vectors produced in suspension adapted MDCK-E1 cells was
similar to that obtained in the control culture (43:1 and 32:1, respectively).
Figure 6. Cell specific productivity of PP (black bars, left axis) and IP (white bars, right axis) in the different cultures at 96 hpi. Cell cultures were prepared as described in Figure 4. Values are shown as average ± standard-deviation (n=3).
Table 1. Physical to infectious particles ratio of CAV-2 vectors obtained in different cultures.
Cultures PP per each IP
Prior dilution After dilution/at infection
1x10⁶ cells/mL 1x10⁶ cells/mL (w/ ME) 93 ± 10 *
0.5x106 cells/mL 114 ± 7 **
2x10⁶ cells/mL
2x10⁶ cells/mL (w/ ME) 59 ± 13
1x10⁶ cells/mL 72 ± 11 ***
0.5x10⁶ cells/mL 74 ± 20
MDCK-E1 in Optipro SFM (control) 32 ± 16
Values are shown as average ± standard-deviation (n=3); * p = 0.006, ** p = 0.001 and *** p = 0.03, given by a single factor Anova analysis against the values obtained with control. Worth mentioning that suspension-adapted MDCK-E1 cells in bioreactor cultures delivered CAV-2 vectors with 43 PP per each IP (data in the text, n=2). w/ ME: with medium exchange.
Production with cells adapted to suspension
85
4. Discussion
The increasing demands of CAV-2 vectors for gene transfer (1, 2, 13), require larger
amounts of high quality vectors to conduct preclinical and possibly clinical trials. To
develop a virus manufacturing GMP-compliant and scalable process, producer cell line
should be well characterized, preferably growing in suspension in serum-free medium,
and permit virus replication to high titers. To fully meet these requirements, the
previously established MDCK-E1 cell line (10) (Chapter II) was adapted to grow in
suspension with serum-free medium. The ΔE1 CAV-2 vectors production was analyzed.
Several methods to achieve parental MDCK cells stably growing in suspension by either
medium (7-9) or genetic manipulations (5, 6) have been described. The work of van
Wielink et al. (9) probably represents the fastest strategy to adapt MDCK cells to
suspension growth and was adapted for this work. Based on that, we were able to adapt
MDCK cells by directly transferring cells to shaker flasks with SFM4BHK21 medium,
skipping the adaptation phase in adherent cultures previously described and therefore
reducing the adaptation process in 4-6 weeks. Accordingly, single MDCK-E1 cells growing
in suspension were obtained. Two additional weeks were required for adaptation of
MDCK-E1 when comparing with the adaptation of parental MDCK cells (Figure 1). This
suggests that the adaptive potential of MDCK was reduced during the establishment of
MDCK-E1 cell line. As shown previously, parental MDCK cells depict a heterogeneous
population (14, 15). The original variability of MDCK cell population, which possibly
favored its adaptation to suspension by selecting a clone or a subset of clones more prone
to survive and/or grow in suspension, may not be well represented in MDCK-E1 cell line;
MDCK-E1 cell line represents a clone selected through limiting dilution in static cultures,
which might explain why the adaptation of this cell line was more difficult.
In accordance to the work of van Wielink et al. (9), parental MDCK cells adapted herein
showed similar maximum cell density (Figure 2). However, in our hands growth rate of
MDCK and was 2-fold lower than that described. MDCK-E1 cells showed a slight decrease
in the maximum cell density at culture passage 4, which can be correlated with the
adaptive profile of this cell line (Figure 1). We could overcome this by maintaining
MDCK-E1 cells for 20 more culture passages (Figure 2).
To counteract the absence of serum and/or adhesion surface with the survival and
growth in a suspension culture environment, the levels of membrane proteins and cell
surface receptors of suspension adapted cells can change from the original cell (9, 16).
Chapter III – Part B
86
However, the receptors involved in virus entry, such as CAR (17), must be still present in
the newly adapted MDCK-E1 cells, since the permissiveness to CAV-2 infection was
maintained (Figure 3A).
Ideally, the MOI to be used in suspension cultures should be optimized, as the high MOIs
used in adherent cultures might compromise the cell viability and final virus titers in
stirred cultures. In addition, agitation maximizes the number of infected cells and low
MOIs are suitable for stirred cultures. In fact, earlier cell death was observed in cells
infected at high MOI (Figure 3B). Volumetric titers ranged from 1.4 - 4.9×10⁸ IP/mL in
proportion to the MOI used (Figure 3D). When comparing MOI 5 with MOI 0.5, 3.5-fold
improvement in volumetric titer was observed although 10-times more viral vectors
were spent to infect same cell number. Accordingly, the amplification ratio under MOI 0.5
was higher than that obtained with MOI 5 (Figure 3C). This indicates that infection of
MDCK-E1 cells in suspension with MOI 0.5 is preferable: the majority of cells are infected,
productivity (per virus particle) is maximized and virus seed stock is saved. Still, given
the process previously established in stirred tank bioreactors (12) and the typical MOI
used for adenovirus production (18), we decided to perform the following assays with
MOI 5.
To avoid any limitation in nutrient(s) that could affect for virus propagation and/or
accumulation of inhibitory byproducts, medium exchange at infection time is typically
applied for small-scale productions of adenoviruses. However, from a bioprocess point of
view this is difficult to manage with suspension cells, as it implies transfer of bioreactor
culture, centrifugation and re-inoculation. To address this possible bottleneck, we
evaluated the effect of diluting culture prior infection with new culture medium (Figure
4). This would allow the addition of fresh nutrients, dilute any toxic byproduct and
circumvent centrifugation step. Indeed, when using diluted cultures from cells at 2×10⁶
cells/mL, total CAV-2 titers obtained were similar to those assays with medium exchange
(Figure 5 and Figure 6). More specifically, similar CAV-2 titers can be obtained either by
diluting the culture 2 or 4 times (Figure 5). From a bioprocess point of view, CAV-2
vectors should be thus produced by diluting the culture to half: this would save culture
medium and alleviate downstream processing, as less working volume is being managed.
Assuming the medium nutrient limitation/byproducts accumulation hypothesis, one
should expect that cultures with less growing time (i.e. at cell concentration of 1×10⁶
cells/mL) would have less medium-related limitations than those in which cells were

Production with cells adapted to suspension
87
grown for longer time periods (i.e. at cell concentration of 2×10⁶ cells/mL). However, the
infectious titers of cultures generated from cells at 2×10⁶ cells/mL were higher than that
obtained with cultures generated from cells at 1×10⁶ cells/mL (Figure 5). This indicates
that cell status and/or physiology gathered at concentration of 2×10⁶ cells/mL is better
suited for virus production in terms of infectious titers (Figures 5 and 6) and quality of
viral particles (Table 1). The relation between metabolites, cell cycle phase and CAV-2
production should be thus further explored to take fully profit of this feature (19).
When transferring to stirred tank bioreactor, no significant improvements in productivity
were observed, although the resulting vectors had higher infectivity (PP:IP ratio of 43:1)
than those obtained in shaker flasks and similar to our control culture (bioreactor culture
with MDCK-E1 in microcarriers) (Table 1). In the bioreactors established previously with
MOI 5, a volumetric productivity of ~2.8×10⁹ IP/mL (n=4) is typically obtained (Chapter
III, part A), which is 5-fold higher than that obtained with the new suspension cells
(Figure 3D). Nevertheless, worth mentioning that the use of suspension cells greatly
facilitates culture manipulation in what regards microcarriers preparation and cell seed
from adherent cultures. In addition, unlike the bioprocess previously established
(Chapter III, part A), serum is now totally abolished from production process.
In summary, we show the adaptation process of MDCK-E1 cell line to suspension, by
transferring them directly to stirred cultures in SFM4BHK21 culture medium. Using
adapted cells, CAV-2 vectors titers up to 5.1×10⁸ IP/mL were possible, and a PP value of
43 per each IP was obtained in bioreactor cultures. Feeding cells at infection time with
fresh medium enabled same specific titers, overcoming the need of medium
exchange/cell centrifugation at infection time. Together, this work constitutes a progress
in CAV-2 vectors availability at larger scales, contributing to make the manufacturing
process of CAV-2 vectors equivalent to human adenovirus vectors.
Chapter III – Part B
88
5. Acknowledgements and author contribution
This work was supported by Fundação para a Ciência e Tecnologia – Portugal (through
the project PTDC/EBB-BIO/118615/2010) and European Commission (BrainCAV
HEALTH – HS_2008_222992). Paulo Fernandes acknowledges Fundação para a Ciência e
a Tecnologia (FCT) for his Ph.D. grant (SFRH/BD/70810/2010). The authors
acknowledge Rute Castro and Tanja Laske for the fruitful discussions about the
adaptation of MDCK cells to suspension growth.
Paulo Fernandes conceived the experimental setup and design, performed the
experiments, analyzed the data and wrote the chapter.
6. References
1. Cubizolle, A., N. Serratrice, N. Skander, M. A. Colle, S. Ibanes, A. Gennetier, N. Bayo-Puxan, K. Mazouni, F. Mennechet, B. Joussemet, Y. Cherel, Y. Lajat, C. Vite, F. Bernex, V. Kalatzis, M. E. Haskins, and E. J. Kremer. 2014. Corrective GUSB Transfer to the Canine Mucopolysaccharidosis VII Brain. Mol Ther 22:762-773.
2. Ariza, L., L. Gimenez-Llort, A. Cubizolle, G. Pages, B. Garcia-Lareu, N. Serratrice, D. Cots, R. Thwaite, M. Chillon, E. J. Kremer, and A. Bosch. 2014. Central Nervous System Delivery of Helper-Dependent Canine Adenovirus Corrects Neuropathology and Behavior in Mucopolysaccharidosis Type VII Mice. Hum Gene Ther 25:199-211.
3. Silva, A., P. Fernandes, M. Q. Sousa, and P. Alves. 2014. Scalable Production of Adenovirus Vectors, p. 175-196. In M. Chillón and A. Bosch (ed.), Adenovirus, vol. 1089. Humana Press.
4. Silva, A. C., C. Peixoto, T. Lucas, C. Kuppers, P. E. Cruz, P. M. Alves, and S. Kochanek. 2010. Adenovirus vector production and purification. Curr Gene Ther 10:437-455.
5. Chu, C., V. Lugovtsev, H. Golding, M. Betenbaugh, and J. Shiloach. 2009. Conversion of MDCK cell line to suspension culture by transfecting with human siat7e gene and its application for influenza virus production. Proc Natl Acad Sci U S A 106:14802-14807.
6. Chu, C., V. Lugovtsev, A. Lewis, M. Betenbaugh, and J. Shiloach. 2010. Production and antigenic properties of influenza virus from suspension MDCK-siat7e cells in a bench-scale bioreactor. Vaccine 28:7193-7201.
7. Tsutsumi, R., S. Fujisaki, M. Shozushima, K. Saito, and S. Sato. 2006. Anoikis-resistant MDCK cells carrying susceptibilities to TNF-alpha and verotoxin that are suitable for influenza virus cultivation. Cytotechnology 52:71-85.
8. Lohr, V., Y. Genzel, I. Behrendt, K. Scharfenberg, and U. Reichl. 2010. A new MDCK suspension line cultivated in a fully defined medium in stirred-tank and wave bioreactor. Vaccine 28:6256-6264.
9. van Wielink, R., H. C. Kant-Eenbergen, M. M. Harmsen, D. E. Martens, R. H. Wijffels, and J. M. Coco-Martin. 2011. Adaptation of a Madin-Darby canine kidney cell line to suspension growth in serum-free media and comparison of its ability to produce avian influenza virus to Vero and BHK21 cell lines. J Virol Methods 171:53-60.
10. Fernandes, P., V. M. Santiago, A. F. Rodrigues, H. Tomas, E. J. Kremer, P. M. Alves, and A. S. Coroadinha. 2013. Impact of E1 and Cre on adenovirus vector amplification: developing MDCK CAV-2-E1 and E1-Cre transcomplementing cell lines. PLoS One 8:e60342.
11. Kremer, E. J., S. Boutin, M. Chillon, and O. Danos. 2000. Canine adenovirus vectors: an alternative for adenovirus-mediated gene transfer. J Virol 74:505-512.
Production with cells adapted to suspension
89
12. Fernandes, P., C. Peixoto, V. M. Santiago, E. J. Kremer, A. S. Coroadinha, and P. M. Alves. 2013. Bioprocess development for canine adenovirus type 2 vectors. Gene Ther 20:353-360.
13. Serratrice, N., A. Cubizolle, S. Ibanes, N. Mestre-Frances, N. Bayo-Puxan, S. Creyssels, A. Gennetier, F. Bernex, J. M. Verdier, M. E. Haskins, G. Couderc, F. Malecaze, V. Kalatzis, and E. J. Kremer. 2014. Corrective GUSB transfer to the canine mucopolysaccharidosis VII cornea using a helper-dependent canine adenovirus vector. Journal of controlled release : official journal of the Controlled Release Society 181:22-31.
14. Dukes, J. D., P. Whitley, and A. D. Chalmers. 2011. The MDCK variety pack: choosing the right strain. BMC cell biology 12:43.
15. Lugovtsev, V. Y., D. Melnyk, and J. P. Weir. 2013. Heterogeneity of the MDCK cell line and its applicability for influenza virus research. PLoS One 8:e75014.
16. Jaluria, P., M. Betenbaugh, K. Konstantopoulos, B. Frank, and J. Shiloach. 2007. Application of microarrays to identify and characterize genes involved in attachment dependence in HeLa cells. Metab Eng 9:241-251.
17. Soudais, C., S. Boutin, S. S. Hong, M. Chillon, O. Danos, J. M. Bergelson, P. Boulanger, and E. J. Kremer. 2000. Canine adenovirus type 2 attachment and internalization: coxsackievirus-adenovirus receptor, alternative receptors, and an RGD-independent pathway. J Virol 74:10639-10649.
18. Altaras, N. E., J. G. Aunins, R. K. Evans, A. Kamen, J. O. Konz, and J. J. Wolf. 2005. Production and formulation of adenovirus vectors. Adv Biochem Eng Biotechnol 99:193-260.
19. Ferreira, T. B., R. Perdigao, A. C. Silva, C. Zhang, J. G. Aunins, M. J. Carrondo, and P. M. Alves. 2009. 293 cell cycle synchronisation adenovirus vector production. Biotechnol Prog 25:235-243.

Chapter III – Part B
90

Chapter IV
Implications of Cre activity and
co-infection on canine
helper-dependent vector production
This chapter is adapted from:
Fernandes P, Almeida AI, Kremer EJ, Alves PM, Coroadinha AS. (2015). Production of
canine helper-dependent vectors: implications of Cre activity and co-infection on adenovirus
propagation. Sci Rep. (accepted).
Chapter IV
92
Abstract
The importance of Cre recombinase to minimize helper vector (HV) contamination during
helper-dependent adenovirus vectors (HDVs) production is well documented. However,
Cre recombinase, by inducing DNA double-strand breaks (DSBs), can cause a reduced
proliferation and genotoxic effects in cultured cells. In this work, Cre-expressing cell
stability, co-infection and their relation to adenovirus amplification/HV contamination
were evaluated to develop a production protocol for HD canine adenovirus type 2 (CAV-
2) vectors. Long-term Cre expression reduced the capacity of MDCK-E1-Cre cells to
produce CAV-2 by 7-fold, although cell growth was maintained. High HDV/HV MOI ratio
(5:0.1) led to low HV contamination without compromising HDV yields. Indeed, such MOI
ratio was sufficient to reduce HV levels, as these were similar either in MDCK-E1 or
MDCK-E1-Cre cells. This raises the possibility of producing HDVs without Cre-expressing
cells, which would circumvent the negative effects that this recombinase holds to the
production system. Here, we show how Cre and MOI ratio impact adenovirus vectors
yields and infectivity, providing key-information to design an improved manufacturing of
HDV. Potential mechanisms to explain how Cre is specifically impacting cell productivity
without critically compromising its growth are presented.

Implications of Cre activity and co-infection on canine helper-dependent vector production
93
Contents
1. Introduction ............................................................................................................................................... 94
2. Materials and Methods .......................................................................................................................... 95
2.1. Cell lines and culture media ............................................................................................................. 95
2.2. Viral vectors ............................................................................................................................................ 96
2.3. Cell growth assays ................................................................................................................................ 96
2.4. Cre activity ............................................................................................................................................... 96
2.5. Viral vectors production assays ..................................................................................................... 97
2.6. Infectious vectors titration ............................................................................................................... 97
2.7. Quantification of physical particles .............................................................................................. 97
3. Results ........................................................................................................................................................... 99
3.1. Cell line evaluation at different culture passages ................................................................... 99
3.1.1. Growth characteristics of MDCK-E1-Cre ........................................................................... 99
3.1.2. Cre expression and excision efficiency of MDCK-E1-Cre .........................................100
3.1.3. CAV-2 production of MDCK-E1-Cre ...................................................................................100
3.2. Establishing the best conditions for HD CAV-2 production .............................................102
3.2.1. HDV /HV MOI ratio ..................................................................................................................102
3.2.2. The impact of MOI ratio in co-infections .........................................................................102
3.2.3. The role of Cre recombinase and MOI on the propagation of HV .........................104
3.2.4. The relation between viral particles infectivity, Cre and packaging ..................104
4. Discussion..................................................................................................................................................106
5. Acknowledgments and author contribution ..............................................................................109
6. References .................................................................................................................................................109

Chapter IV
94
1. Introduction
Adenoviruses have received considerable attention as vectors for gene therapy and their
genome has been progressively modified to improve safety and efficacy in therapeutic
applications. From vectors with the deletion of the E1 region to helper-dependent vectors
(HDVs) with the deletion of viral genes, an enhanced capacity for a gene therapeutic
insertion from ~7 kb to ~36 kb has been achieved (1). Most replication-defective
adenovirus vectors require for manufacturing and replication a cell line that expresses
the adenoviral E1 functions in trans. However, since HDVs retain only the inverted
terminal repeats and the packaging signal, early and late viral functions need to be
provided in a synchronized fashion. Standard productions of HDVs are based on co-
infection of HDV and a helper vector (HV), which provides all viral proteins in trans.
During production, both HDV and HV genomes replicate inside the cells, but the
encapsidation of the HV genome is minimized, by flanking its packaging signal (Ψ) with
recognition sequences for a recombinase constitutively expressed by the cells, such as
Cre (2). Therefore, the E1 transcomplementing cell line for HDV production must also
express the recombinase (2-4). Cre/loxP system was the first system described to
efficiently reduce HV contaminant, and is still the most common system used for HDV
propagation.
The importance of high levels of Cre to avoid HV propagation is unquestionable (5). In
fact, considering that the remaining HV contaminant was due to limited Cre activity levels
that permitted HV to escape packaging signal excision (5), major advances were made to
increase the levels of recombinase during HDV production (6). On the other hand, the
effect of Cre expression on producer cell homeostasis has been undervalued. Cre
expression can result in a markedly reduced proliferation and genotoxic effects in
cultured cells (7). The aberrant activity on multiple pseudo loxP sites presented in the
mammalian genome (8) induces DNA double-strand breaks (DSBs) or nicks that are
converted to DSBs during DNA replication, leading to arrest of cells in G2/M phase
because of intolerable DNA damage (7). Furthermore, although sustained low-levels
might be supported by cells without significant toxicity, they cause a slow, cumulative
increase in recombination and chromosome abnormalities. Therefore, the stability of
cells constitutively expressing Cre recombinase is likely to be impaired. While these
effects are not substantiated in literature in the scope of adenovirus production, they are
considerably described for several cell lines (7, 9-11), including HEK 293 cells (9),
Implications of Cre activity and co-infection on canine helper-dependent vector production
95
traditionally used to propagate adenoviruses. From a bioprocess point-of-view, failure of
producer cell line robustness to maintain performance compromises the viral
preparations quality, process yields, reproducibility, economics and the regulatory
approval.
Previously, we established MDCK-derived cell lines for the production of canine
adenovirus type 2 (CAV-2) vectors (12). In this work, we studied the impact of Cre
recombinase in the scope of an optimal production process for HD CAV-2 production with
MDCK-derived cells in serum-free medium, emphasizing two aspects: cell line stability
and infection conditions. Canine adenovirus type 2 (CAV-2) vectors were selected
because of their attractive features to bypass the clinical disadvantages of using human
adenoviruses while keeping other advantages (13, 14), to address fundamental
neurobiological questions (15-19) and to develop potential treatment of
neurodegenerative and ocular disorders (20-22). Moreover, MDCK cells are already
approved by the regulatory authorities for the manufacture of vaccines and thus
represent a suitable cell substrate that might facilitate the approval of clinical grade CAV-
2 vectors production (23). MDCK-E1-Cre cell line stability was addressed by evaluating
growth, Cre activity levels and virus production in cells with increasing culture passages.
Different HDV/HV MOI ratios were assayed to determine the best infection conditions to
amplify HD CAV-2 and to understand the relation between Cre expression, infection
conditions and HV propagation. Here, we show how Cre expression impacts cell
performance and adenovirus propagation and how infection conditions significantly
contribute to reduce HV contamination during HDV production even in the absence of
Cre-recombinase.
2. Materials and Methods
2.1. Cell lines and culture media
MDCK-E1 cells (12) are MDCK (ECCAC 841211903) derived and stably express the E1
region from CAV-2 and the neomycin resistance gene. MDCK-E1-Cre cells (12), in addition
to E1, also express Cre recombinase and zeocin resistance gene. MDCK-E1 and MDCK-E1-
Cre were sequentially adapted to Optipro serum-free medium (Gibco, Paisley, UK) with 4
mM glutamax (Gibco) by increasing the percentage of Optipro medium in subculture
passages. Cells were subcultured twice a week in 150 cm2 t-flasks and maintained in an
Chapter IV
96
incubator with humidified atmosphere of 5% CO2 in air at 37 °C. For splitting or collecting
cells, the monolayer was washed with PBS, incubated with 0.25% (w/v) trypsin-EDTA
(Gibco) at 37 °C until detachment started to become evident (up to 15 min) and cells
suspended in culture medium. Cells were then pelleted at 300 g during 10 min and re-
suspended in fresh medium. To evaluate the effect of culture passages, cells were
maintained in duplicates, either with or without antibiotic pressure. For antibiotic
pressure, 500 µg/mL of Geneticin (G418) (Invivogen, Toulouse, France) was added to
culture medium for MDCK-E1 cells maintenance, while for MDCK-E1-Cre cells G418 plus
500 µg/mL of Zeocin (Invivogen) was used. Cells were frozen after 10 and 20 cell culture
passages in CryoStor CS10 (Sigma-Aldrich, St. Louis, MO, USA) using a Mr. Frosty Freezing
Container (Thermo-scientific, Rockford, IL, USA).
2.2. Viral vectors
CAVGFP, JB∆5 and HD CAVGFP are vectors derived from CAV-2 strain Toronto A 26/61,
GenBank J04368. CAVGFP (13) and HD CAVGFP (16) are E1-deleted (ΔE1) and HD
vectors, respectively, and contain an eGFP expression cassette. JB∆5 is a helper vector
(HV) containing loxP sites flanking the packaging domain and a RSV-lacZ expression
cassette (16). CAVGFP, JB∆5 and HD CAVGFP viral stocks were prepared and purified by
CsCl gradients as described previously (12, 13).
2.3. Cell growth assays
MDCK-E1-Cre growth assays in static cultures were performed using an inoculum of 1 x
104 cells/cm2 in 25 cm2 t-flasks with a working volume of 10 mL. Cell concentration and
viability was determined by the trypan blue exclusion method using a 0.1% (v/v) solution
prepared in PBS and counting cells in a Fuchs-Rosenthal haemacytometer (Brand,
Wertheim, Germany).
2.4. Cre activity
Relative Cre activity was assayed by the level of luciferase activity generated by the
adenovirus vector AdMA19 (a gift from F. Graham) after infecting cells (24). AdMA19
contains the luciferase cDNA under control of the human cytomegalovirus promoter but
separated from it by an extraneous spacer sequence composed by a series of initiation

Implications of Cre activity and co-infection on canine helper-dependent vector production
97
and stop codons in several reading frames. This translational “start/stop sequence”,
flanked by loxP, disrupts translation. If the cell clone expresses Cre, the stop sequence is
floxed out and translation proceeds leading to luciferase expression. Briefly, cells were
seeded in 24 well-plates in quadruplicates and infected the day after with 20 IP/cell of
AdM19 with medium exchange. Twenty-four hpi, cells were counted and lysed to release
luciferase, both in duplicates. The resulting supernatant was collected and the light units
were quantified with a Modulus Luminometer from Turner Biosystems (Sunnyvale, CA,
USA) after adding luciferin and normalized to cell concentration.
2.5. Viral vectors production assays
Cells were seeded at 3 × 10⁴ cells/cm2, infected the day after with medium exchange. To
evaluate cells productivity at different passage number, infections of CAVGFP at MOI 5
were performed. Excision efficiency was estimated by determining the fold-reduction in
helper JB∆5 production with MDCK-E1-Cre cells infected at MOI 5. The assays for HD
CAVGFP production optimization were performed by co-infecting cells with HD CAVGFP
at MOI 5 and JB∆5 at MOI 1, 0.5 and 0.1. To further understand how Cre recombinase and
co-infection determine optimal HD CAVGFP production, co-infections of CAVGFP (MOI 5)
with JB∆5 (MOI 5, 1 and 0.5), and single infections of JB∆5 (MOI 5, 1 and 0.5) were also
performed. Moreover, all the infection assays were performed in MDCK-E1-Cre and
MDCK-E1 cells. Once infected, cells were incubated for further 48 h and viral samples
collected using triton (Sigma-Aldrich) 0.1% (v/v) in Tris-HCl, clarified at 3000 g for 10
min at 4 °C and stored at -85 °C until further analysis.
2.6. Infectious vectors titration
Quantification of infectious CAVGFP and HD CAVGFP was performed by monitoring the
expression of GFP, while titration of infectious JB∆5 vectors was based in lacZ gene
expression and β-galactosidase activity as described previously (12).
2.7. Quantification of physical particles
Viral genomes were extracted and purified by High Pure Viral Nucleic Acid Kit (Roche
Diagnostics, Penzberg, Germany). SYBR Green I dye chemistry was used to detect PCR
products using Lightcycler system. Previously purified and quantified plasmids coding for

Chapter IV
98
E1-deleted CAV-2 genome, GFP or lacZ were used as standards. To ensure the removal of
free viral genomes from samples and accurately quantify viral physical particles, a
benzonase treatment was performed prior to DNA extraction by adding 2 μl of benzonase
(250 U/μl) (Merck Millipore, Darmstadt, Germany) to the same sample volume and
incubating for 1 h at 37 °C. Benzonase was inhibited during the proteinase K step of DNA
extraction protocol. To estimate the number of viral genomes, primers against the
expression cassette of each viral vector were used. Primers for GFP gene: forward 5’-
CAGAAGAACGGCATCAAGGT-3’ and reverse 5’-CTGGGTGCTCAGGTAGTGG-3’; primers for
lacZ gene: forward 5’-ACTATCCCGACCGCCTTACT-3’ and reverse 5’-
TAGCGGCTGATGTTGAACTG-3’.
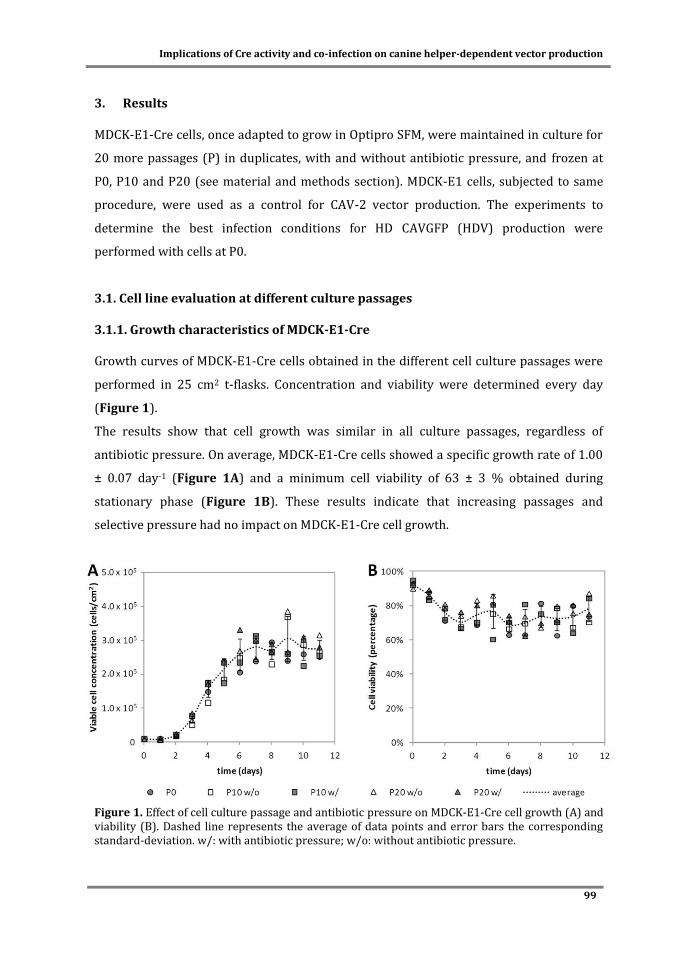
Implications of Cre activity and co-infection on canine helper-dependent vector production
99
3. Results
MDCK-E1-Cre cells, once adapted to grow in Optipro SFM, were maintained in culture for
20 more passages (P) in duplicates, with and without antibiotic pressure, and frozen at
P0, P10 and P20 (see material and methods section). MDCK-E1 cells, subjected to same
procedure, were used as a control for CAV-2 vector production. The experiments to
determine the best infection conditions for HD CAVGFP (HDV) production were
performed with cells at P0.
3.1. Cell line evaluation at different culture passages
3.1.1. Growth characteristics of MDCK-E1-Cre
Growth curves of MDCK-E1-Cre cells obtained in the different cell culture passages were
performed in 25 cm2 t-flasks. Concentration and viability were determined every day
(Figure 1).
The results show that cell growth was similar in all culture passages, regardless of
antibiotic pressure. On average, MDCK-E1-Cre cells showed a specific growth rate of 1.00
± 0.07 day-1 (Figure 1A) and a minimum cell viability of 63 ± 3 % obtained during
stationary phase (Figure 1B). These results indicate that increasing passages and
selective pressure had no impact on MDCK-E1-Cre cell growth.
Figure 1. Effect of cell culture passage and antibiotic pressure on MDCK-E1-Cre cell growth (A) and viability (B). Dashed line represents the average of data points and error bars the corresponding standard-deviation. w/: with antibiotic pressure; w/o: without antibiotic pressure.

Chapter IV
100
3.1.2. Cre expression and excision efficiency of MDCK-E1-Cre
To evaluate the impact of increasing passages in Cre expression, two approaches were
used. The first estimates Cre activity through the level of luciferase activated by the
excision of a stop sequence flanked by loxP sites (view materials and methods section)
(Figure 2). In the second approach, Cre activity was estimated by evaluating the
reduction in HV JB∆5 propagation (due to excision of packaging genome) in MDCK-E1-Cre
cells (Table 1). The results obtained from both methods were similar. A decrease in Cre
activity up to 1.5 ± 0.3 fold, was obtained in cells at P20 when maintaining the antibiotic
pressure (Figure 2), nevertheless this reduction did not significantly alter the HV
excision efficiency (Table 1). Without the selective pressure, a further 2.5 ± 0.5 fold
decrease in Cre activity was observed from P10 to P20 (Figure 2), which contributed to
approximately 3-fold reduction in the capacity for HV genomes excision (Table 1).
Figure 2. Effect of cell culture passage and antibiotic pressure on Cre-activity of MDCK-E1-Cre cells. Light units were normalized to cell concentration and background obtained with MDCK-E1 cells. Values are shown as average ± standard-deviation (n=3). w/ AB: with antibiotic pressure; w/o AB: without antibiotic pressure. * p = 0.01, given by a single factor Anova analysis against the corresponding P0 values.
3.1.3. CAV-2 production of MDCK-E1-Cre
To evaluate the impact of increasing subculture passages on the capacity to produce viral
vectors, production assays with CAVGFP were performed. MDCK-E1 cells maintained in
parallel under same passages number were added to the experiments and used as
controls for ∆E1 production.
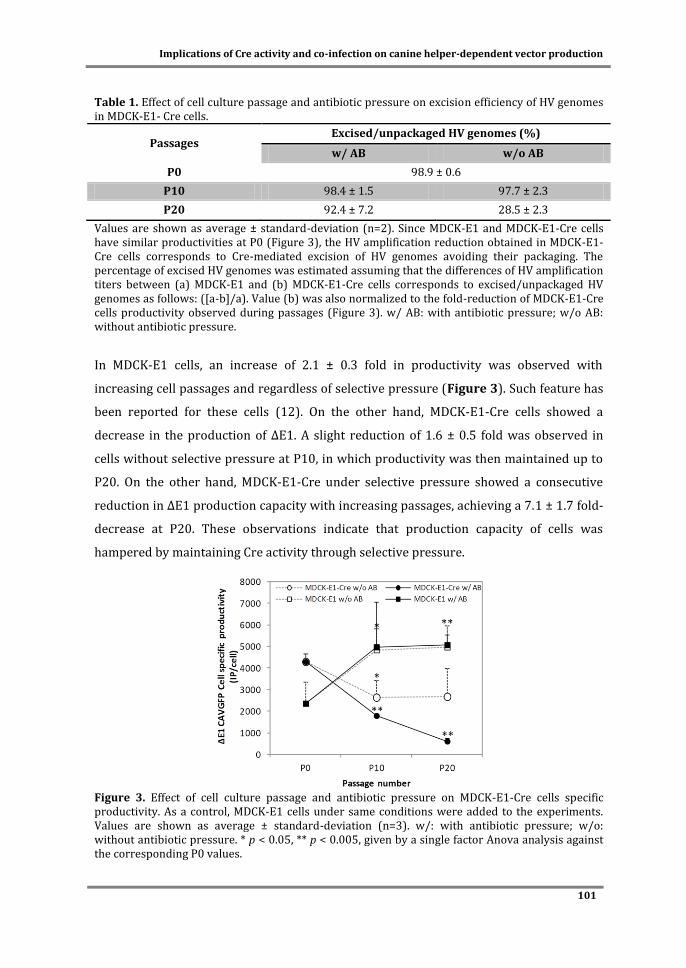
Implications of Cre activity and co-infection on canine helper-dependent vector production
101
Table 1. Effect of cell culture passage and antibiotic pressure on excision efficiency of HV genomes in MDCK-E1- Cre cells.
Passages Excised/unpackaged HV genomes (%)
w/ AB w/o AB
P0 98.9 ± 0.6
P10 98.4 ± 1.5 97.7 ± 2.3
P20 92.4 ± 7.2 28.5 ± 2.3
Values are shown as average ± standard-deviation (n=2). Since MDCK-E1 and MDCK-E1-Cre cells have similar productivities at P0 (Figure 3), the HV amplification reduction obtained in MDCK-E1-Cre cells corresponds to Cre-mediated excision of HV genomes avoiding their packaging. The percentage of excised HV genomes was estimated assuming that the differences of HV amplification titers between (a) MDCK-E1 and (b) MDCK-E1-Cre cells corresponds to excised/unpackaged HV genomes as follows: ([a-b]/a). Value (b) was also normalized to the fold-reduction of MDCK-E1-Cre cells productivity observed during passages (Figure 3). w/ AB: with antibiotic pressure; w/o AB: without antibiotic pressure.
In MDCK-E1 cells, an increase of 2.1 ± 0.3 fold in productivity was observed with
increasing cell passages and regardless of selective pressure (Figure 3). Such feature has
been reported for these cells (12). On the other hand, MDCK-E1-Cre cells showed a
decrease in the production of ∆E1. A slight reduction of 1.6 ± 0.5 fold was observed in
cells without selective pressure at P10, in which productivity was then maintained up to
P20. On the other hand, MDCK-E1-Cre under selective pressure showed a consecutive
reduction in ∆E1 production capacity with increasing passages, achieving a 7.1 ± 1.7 fold-
decrease at P20. These observations indicate that production capacity of cells was
hampered by maintaining Cre activity through selective pressure.
Figure 3. Effect of cell culture passage and antibiotic pressure on MDCK-E1-Cre cells specific productivity. As a control, MDCK-E1 cells under same conditions were added to the experiments. Values are shown as average ± standard-deviation (n=3). w/: with antibiotic pressure; w/o: without antibiotic pressure. * p < 0.05, ** p < 0.005, given by a single factor Anova analysis against the corresponding P0 values.

Chapter IV
102
3.2. Establishing the best conditions for HD CAV-2 production
To exclude any cell passage effect, the following experiments were performed is MDCK-
E1-Cre and MDCK-E1 cells at P0.
3.2.1. HDV /HV MOI ratio
To establish optimal conditions to produce HD CAVGFP (HDV) (maximum productivity
and lowest HV contamination), production assays under different MOI ratios (5 to 1, 5 to
0.5, and 5 to 0.1 IP) were performed. MOI ratio of 5 to 5 was initially tested, but critically
comprised cell viability and production of either HDV or HV (data not shown).
Similar HDV specific productivities of approximately 300 IP/cell were obtained using the
different MOI ratios tested (Figure 4A). Even with a MOI as low as 0.1, HDV productivity
was still maintained. When using MDCK-E1-Cre cells, HV contamination levels were
similar in the three co-infections (2-3%) (Figure 4B).
To further understand how Cre recombinase impacts HV propagation in the different MOI
ratios, the assays were also performed in MDCK-E1 cells (Figure 4A, B). The results show
a similar HDV production in both cells (Figure 4A), however a clear proportion between
HV MOI and its contaminant levels was observed (Figure 4B). While at MOI 1 of HV a
high contamination was observed (16.3%), a decrease in HV contaminant to 2.0% was
possible when decreasing MOI of this vector. Moreover, contaminant levels of HV with
MDCK-E1 cells in 5HDV : 0.1HV co-infections were similar to those obtained with MDCK-
E1-Cre cells. These results indicate that co-infection with the lowest HV MOI tested
herein, i.e. 0.1 of HV was sufficient to minimize contamination during HDV production.
3.2.2. The impact of MOI ratio in co-infections
Given that HDV production requires co-infection, the impact of co-infection conditions on
adenovirus propagation and HV contaminant levels were further analyzed. Since that
HDV production yields are low, in which cell homeostasis is highly impaired (25), we
reasoned that the effect of co-infection and vectors competition for amplification would
be much more evident if using a CAV-2 vector that typically holds high propagation levels.
Therefore, infections assays under different MOI ratios were reproduced by replacing
HDV for ∆E1 CAV-2 vectors. Similarly to HDV assays, cells were co-infected with ∆E1
(MOI 5) and HV at MOI 5, MOI 1 or MOI 0.5 using MDCK-E1 and MDCK-E1-Cre cell-lines.

Implications of Cre activity and co-infection on canine helper-dependent vector production
103
The production of ∆E1 vector increased when HV MOI was decreased for both cell lines
(Figure 4C). However, MDCK-E1-Cre cells showed lower capacity to produce CAVGFP
than MDCK-E1 cells, especially under high virus input. Similarly to the assays with HDV,
the proportion of HV was minimal in MDCK-E1-Cre cells, and highly dependent on the
MOI when MDCK-E1 cells were used (Figure 4D). However, in each infection condition
assayed, a constant fold-reduction (5 to 6 fold) in HV contamination levels was observed
when comparing MDCK-E1 to MDCK-E1-Cre cells. These results corroborate that the MOI
ratio used to infect cells determines the proportion of each vector in the final production
pool, i.e which vector and its propagation is favored.
Figure 4. Effect of MOI ratio on virus production and HV contaminant using MDCK-E1-Cre and MDCK-E1 cells. (A, B) Cell specific productivity of HDV (A) and resulting HV contaminant (B). (C, D) Cell specific productivity of ∆E1 (C) and resulting HV contaminant (D). Values are shown as average ± standard-deviation (n=3). * p < 0.05, ** p < 0.005, given by a single factor Anova analysis.

Chapter IV
104
3.2.3. The role of Cre recombinase and MOI on the propagation of HV
To gather a better understanding of the factor behind a low HV contamination in HDV
production, the role of Cre recombinase and MOI were evaluated from an HV propagation
point-of-view. To understand the relation between Cre recombinase and HV propagation
under different MOIs, infections with HV using MOI 5, 1 and 0.5 were assayed in MDCK-
E1-Cre and compared to those obtained with MDCK-E1 cells (Figure 5). A decrease in HV
production was observed in MDCK-E1-Cre cells in comparison to MDCK-E1 cells due to
excision of the packaging single by Cre activity. Cell specific productivity was
proportional to the MOI used in both cell lines. Furthermore, the differences in IP/cell of
MDCK-E1-Cre versus MDCK-E1 cells in the different MOIs tested were shown to be
similar, following on average a fold-reduction of 145 ± 23. These observations indicate
that HVs escaping from excision were proportional to the MOI used.
Figure 5. Effect of MOI on HV production in MDCK-E1-Cre and MDCK-E1 cells. Values are shown as
average ± standard-deviation (n=3).
3.2.4. The relation between viral particles infectivity, Cre and packaging
Physical (genome-containing) particles of HDV, ∆E1 and HV were quantified and
normalized to the infectious titer to analyze the infectivity in the different conditions
assayed.
The results show a higher PP:IP ratio with HDVs than ∆E1 (Figure 6), as previously
described (25). When using MDCK-E1 as producer cells, the PP:IP ratios of HDV and ∆E1
were similar along the different co-infections (Figure 6A,B). However, PP:IP ratios
obtained with MDCK-E1-Cre cells were consistently higher than those obtained with

Implications of Cre activity and co-infection on canine helper-dependent vector production
105
MDCK-E1 cells. In addition, the highest PP:IP ratio for HDV and ∆E1 was obtained with
MDCK-E1-Cre cells under high MOI. Together, these observations show that MDCK-E1-
Cre cells generate more non-infectious particles, which is further aggravated by the use of
a high MOI of virus.
When evaluating HV, no significant differences in PP:IP ratios were observed between the
different MOIs or cell lines used, although a slight tendency to obtain more non-infectious
particles of HV in co-infections with ∆E1 was also obtained with MDCK-E1-Cre cells
(Table 2).
Figure 6. Comparison of physical to infectious particles ratio for HDV (A) and ∆E1 (B) obtained in MDCK-E1 and MDCK-E1-Cre cells in the different co-infections. Values are shown as average ± standard-deviation (n=3). * p < 0.05, given by a single factor Anova analysis.
Table 2. Physical to infectious particles ratio of HV obtained with MDCK-E1-Cre and MDCK-E1 cells under the different co-infections
Co-infection with
Cells MOI of HV
5 HV 1HV 0.5 HV 0.1HV
HDV MDCK-E1-Cre n.d. 86 ± 12 93 ± 17 85 ± 16
MDCK-E1 n.d. 75 ± 18 102 ± 33 93 ± 16
∆E1 MDCK-E1-Cre 58 ± 8 50 ± 9 42 ± 3 n.d.
MDCK-E1 37 ± 19 38 ± 15 37 ± 7 n.d.
Values are shown as average ± standard-deviation (n=3); No statistical mean (p value < 0.05) was obtained when comparing values of MDCK-E1-Cre with MDCK-E1 cells under same co-infection conditions. n.d.: not determined.

Chapter IV
106
4. Discussion
While helper-dependent vectors (HDVs) continue to demonstrate a high therapeutic
potential, the production standardization of these vectors is still limiting their wide
availability in gene delivery assays and trials. In this study, we evaluated Cre-expressing
cells stability, infection conditions and their relation to adenovirus amplification and
helper vector (HV) contamination in serum-free medium conditions to establish a
reproducible production process for HD canine adenovirus type 2 (CAV-2) vectors. We
found that constitutive Cre expression affects the long-term capacity of cells to produce
adenoviruses, and co-infection conditions using low HV MOI can effectively reduce HV
contamination even when using cells without Cre recombinase.
HDV producer cells need to be in culture for longer periods of time as cells are needed for
serial amplifications until sufficient vectors are generated (2, 26-28). On the other hand,
the expression of Cre recombinase, due to its toxicity (7), is likely to impair cell line
performance. Therefore, the evaluation of producer cell line stability in the scope of HDV
production becomes critical. The consistent MDCK-E1-Cre cells growth profile under
increasing subculture passages (Figure 1) indicates that Cre expression was supported
by the cell line, probably because of non-toxic levels and/or the cells capacity to correct
Cre-induced DNA double-stranded breaks (DSBs) (7). However, when evaluating virus
production, a consecutive reduction in ΔE1 vectors (CAVGFP) productivity along culture
passages was observed (Figure 3), namely in the cell lines forced to express Cre
recombinase through selective pressure from P10 to P20 (Figure 2). MDCK-E1-Cre cells
in Optipro SFM medium can be thus used for virus production during 10 culture passages
after thawing. The factor(s) and/or mechanism(s) behind these observations must be
such that despite impacting virus replication, cell homeostasis is balanced enough to
sustain growth under the presence of Cre. Furthermore, any effect of E1 expression levels
on CAV-2 production should be ruled out, since E1 levels between MDCK-E1-Cre and
MDCK-E1 cells in same conditions (passage number and antibiotic pressure) were found
to be similar (data not shown). The 116 cell line, one of the several Cre-expressing cell
lines derived from HEK 293 (29) and established by Palmer and Ng (27), was able to keep
adenovirus productivities up to 86 passages when maintained under selective pressure.
While these results differ from ours, the evaluation of other Cre-expressing cells
established for HDV production(29) should be pursued to understand how host cell
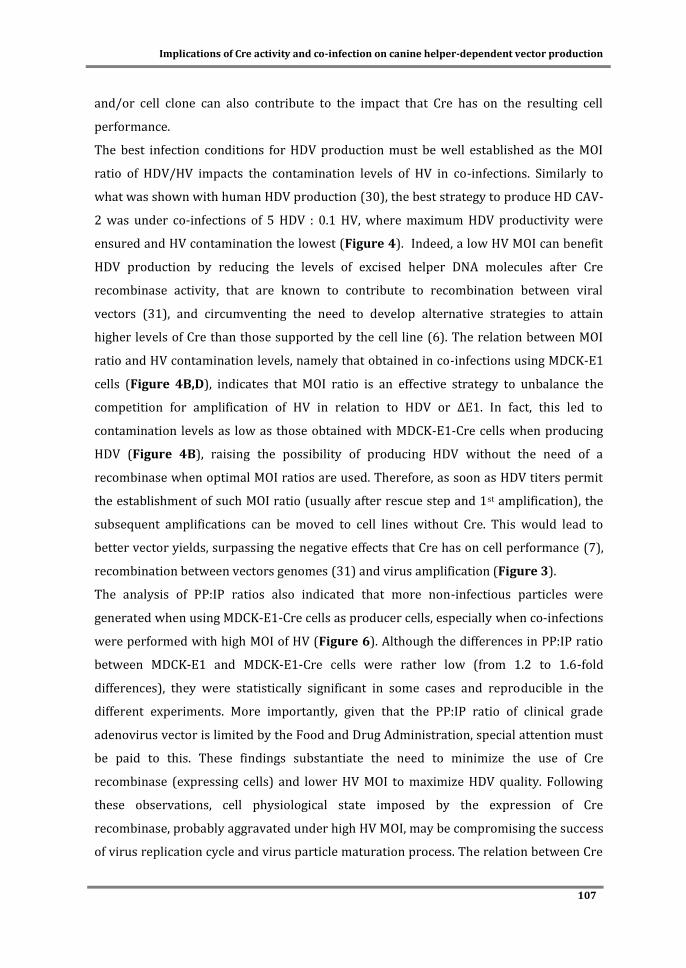
Implications of Cre activity and co-infection on canine helper-dependent vector production
107
and/or cell clone can also contribute to the impact that Cre has on the resulting cell
performance.
The best infection conditions for HDV production must be well established as the MOI
ratio of HDV/HV impacts the contamination levels of HV in co-infections. Similarly to
what was shown with human HDV production (30), the best strategy to produce HD CAV-
2 was under co-infections of 5 HDV : 0.1 HV, where maximum HDV productivity were
ensured and HV contamination the lowest (Figure 4). Indeed, a low HV MOI can benefit
HDV production by reducing the levels of excised helper DNA molecules after Cre
recombinase activity, that are known to contribute to recombination between viral
vectors (31), and circumventing the need to develop alternative strategies to attain
higher levels of Cre than those supported by the cell line (6). The relation between MOI
ratio and HV contamination levels, namely that obtained in co-infections using MDCK-E1
cells (Figure 4B,D), indicates that MOI ratio is an effective strategy to unbalance the
competition for amplification of HV in relation to HDV or ∆E1. In fact, this led to
contamination levels as low as those obtained with MDCK-E1-Cre cells when producing
HDV (Figure 4B), raising the possibility of producing HDV without the need of a
recombinase when optimal MOI ratios are used. Therefore, as soon as HDV titers permit
the establishment of such MOI ratio (usually after rescue step and 1st amplification), the
subsequent amplifications can be moved to cell lines without Cre. This would lead to
better vector yields, surpassing the negative effects that Cre has on cell performance (7),
recombination between vectors genomes (31) and virus amplification (Figure 3).
The analysis of PP:IP ratios also indicated that more non-infectious particles were
generated when using MDCK-E1-Cre cells as producer cells, especially when co-infections
were performed with high MOI of HV (Figure 6). Although the differences in PP:IP ratio
between MDCK-E1 and MDCK-E1-Cre cells were rather low (from 1.2 to 1.6-fold
differences), they were statistically significant in some cases and reproducible in the
different experiments. More importantly, given that the PP:IP ratio of clinical grade
adenovirus vector is limited by the Food and Drug Administration, special attention must
be paid to this. These findings substantiate the need to minimize the use of Cre
recombinase (expressing cells) and lower HV MOI to maximize HDV quality. Following
these observations, cell physiological state imposed by the expression of Cre
recombinase, probably aggravated under high HV MOI, may be compromising the success
of virus replication cycle and virus particle maturation process. The relation between Cre
Chapter IV
108
activity, infection conditions and virus maturation should be thus further clarified to
understand the mechanism behind the generation of less infectious particles.
Apart of generating more non-infectious particles (Figure 6, Table 2) and reducing virus
production at high passage number (Figure 3), MDCK-E1-Cre cells also impacted CAV-2
production when co-infected with HV. In fact, when comparing the specific productivity
of MDCK-E1 and MDCK-E1-Cre cells in ∆E1 + HV co-infections, a reduction in ∆E1
amplification was observed with MDCK-E1-Cre cells, specially under high HV MOI
(Figure 4C). This feature is specific to co-infections with HV in MDCK-E1-Cre cells as this
was not observed after infecting MDCK-E1-Cre and MDCK-E1 with increasing MOIs (from
5 to 40) of ∆E1 alone (Figure 3 and data not shown). Since the difference between co-
infections with MDCK-E1-Cre and MDCK-E1 cells is the occurrence of HV genomes
excision, these observations substantiate a relation between high number of excised HV
genomes and inhibition of ∆E1 amplification.
To support Cre recombinase activity, cells must present a consistent DSBs repair system.
Such mechanism is involved in the inhibition of adenovirus replication: viral genomes are
sensed as DSBs activating DNA damage response and the repair mechanism concatenate
viral genomes making them unavailable for the subsequent replication process (32).
Adenoviral E4 11k (E4orf3) or the complex of E4 34k (E4orf6) and E1B proteins
counteract and are sufficient to inhibit DSBs repair system, thereby preventing genome
concatenation (33-36). Given the link of Cre – DSBs repair – virus amplification, we
hypothesize that the reduction in CAV-2 production could be due to an up regulation of
DSBs repair mechanism. Assuming that Cre-expressing cells should have an up regulated
DSBs repair system, MDCK-E1-Cre cells are likely to be more prone in sensing viral DNA
as DSBs than MDCK-E1 cells. If MDCK-E1-Cre cells are challenged with high MOIs of HV,
more DNA breaks are exposed as more viral genomes are being excised, which might
result in a higher activation of DSBs repair system, explaining the inhibition of ∆E1
propagation under high HV MOIs (Figure 4C). Accordingly, MDCK-E1-Cre cells with
increased DSBs repair system, being more prone to repair Cre-induced damages, might
dominate cell population during culture passages due to proliferative advantage.
Therefore, the DSBs repair system of cells maintained in culture for long periods would
be consistently more active and sensitive to viral genomes, which might explain the
subsequent reduction of ∆E1 production in MDCK-E1-Cre cells along passages (Figure 3).
A model where DSB repair system interfere with the typical adenovirus propagation must

Implications of Cre activity and co-infection on canine helper-dependent vector production
109
fit with a scenario which E4 levels attained during infection are no longer enough to
inhibit this mechanism (33-35). In addition, the occurrence of genome concatenation
should be observed to confirm these assumptions (32).
In conclusion, despite similar growth profile of MDCK-E1-Cre cells with increasing
passages, the long-term Cre recombinase expression reduced their capacity to produce
adenoviruses. Not only that, but more non-infectious particles were generated with these
cells (up to 1.6 fold-increase) in HV co-infections, especially under high MOIs. The best
conditions to produce HDV followed a high HDV/HV MOI ratio with a HV MOI as low as
0.1. This favored HDV propagation and infectivity and limited the generation of
contaminant HV. In fact, such MOI ratio was capable of attaining low HV contamination
levels, with or without the activity of Cre, raising the possibility of producing HDVs
without Cre-expressing cells when optimal infection conditions are used. This work
unveils the impact of the Cre recombinase system and MOI ratio on adenovirus
propagation, highlighting important bioprocess parameters that must be considered to
design an improved manufacturing of HDVs.
5. Acknowledgments and author contribution
We thank Sandy Ibanes and Aurelie Gennetier for the initial preparations of CAV-2
vectors. This work was supported by Fundação para a Ciência e a Tecnologia (FCT) –
Portugal, through the project PTDC/EBB-BIO/118615/2010, and European Commission
through FP7 project BrainCAV (222992). Paulo Fernandes acknowledges FCT for his
Ph.D. grant (SFRH/BD/70810/2010). Paulo Fernandes conceived the experimental setup
and design, performed the experiments, analyzed the data and wrote the chapter.
6. References
1. Dormond, E., M. Perrier, and A. Kamen. 2009. From the first to the third generation adenoviral vector: what parameters are governing the production yield? Biotechnol Adv 27:133-144.
2. Parks, R. J., L. Chen, M. Anton, U. Sankar, M. A. Rudnicki, and F. L. Graham. 1996. A helper-dependent adenovirus vector system: removal of helper virus by Cre-mediated excision of the viral packaging signal. Proc Natl Acad Sci U S A 93:13565-13570.
3. Lieber, A., C. Y. He, I. Kirillova, and M. A. Kay. 1996. Recombinant adenoviruses with large deletions generated by Cre-mediated excision exhibit different biological properties compared with first-generation vectors in vitro and in vivo. J Virol 70:8944-8960.
4. Hardy, S., M. Kitamura, T. Harris-Stansil, Y. Dai, and M. L. Phipps. 1997. Construction of adenovirus vectors through Cre-lox recombination. J Virol 71:1842-1849.

Chapter IV
110
5. Ng, P., C. Evelegh, D. Cummings, and F. L. Graham. 2002. Cre levels limit packaging signal excision efficiency in the Cre/loxP helper-dependent adenoviral vector system. J Virol 76:4181-4189.
6. Gonzalez-Aparicio, M., I. Mauleon, P. Alzuguren, M. Bunuales, G. Gonzalez-Aseguinolaza, C. San Martin, J. Prieto, and R. Hernandez-Alcoceba. 2011. Self-inactivating helper virus for the production of high-capacity adenoviral vectors. Gene Ther 18:1025-1033.
7. Loonstra, A., M. Vooijs, H. B. Beverloo, B. A. Allak, E. van Drunen, R. Kanaar, A. Berns, and J. Jonkers. 2001. Growth inhibition and DNA damage induced by Cre recombinase in mammalian cells. Proc Natl Acad Sci U S A 98:9209-9214.
8. Thyagarajan, B., M. J. Guimaraes, A. C. Groth, and M. P. Calos. 2000. Mammalian genomes contain active recombinase recognition sites. Gene 244:47-54.
9. Silver, D. P., and D. M. Livingston. 2001. Self-excising retroviral vectors encoding the Cre recombinase overcome Cre-mediated cellular toxicity. Molecular cell 8:233-243.
10. Pfeifer, A., E. P. Brandon, N. Kootstra, F. H. Gage, and I. M. Verma. 2001. Delivery of the Cre recombinase by a self-deleting lentiviral vector: efficient gene targeting in vivo. Proc Natl Acad Sci U S A 98:11450-11455.
11. Baba, Y., M. Nakano, Y. Yamada, I. Saito, and Y. Kanegae. 2005. Practical range of effective dose for Cre recombinase-expressing recombinant adenovirus without cell toxicity in mammalian cells. Microbiol Immunol 49:559-570.
12. Fernandes, P., V. M. Santiago, A. F. Rodrigues, H. Tomas, E. J. Kremer, P. M. Alves, and A. S. Coroadinha. 2013. Impact of E1 and Cre on adenovirus vector amplification: developing MDCK CAV-2-E1 and E1-Cre transcomplementing cell lines. PLoS One 8:e60342.
13. Kremer, E. J., S. Boutin, M. Chillon, and O. Danos. 2000. Canine adenovirus vectors: an alternative for adenovirus-mediated gene transfer. J Virol 74:505-512.
14. Perreau, M., F. Mennechet, N. Serratrice, J. N. Glasgow, D. T. Curiel, H. Wodrich, and E. J. Kremer. 2007. Contrasting effects of human, canine, and hybrid adenovirus vectors on the phenotypical and functional maturation of human dendritic cells: implications for clinical efficacy. J Virol 81:3272-3284.
15. Soudais, C., C. Laplace-Builhe, K. Kissa, and E. J. Kremer. 2001. Preferential transduction of neurons by canine adenovirus vectors and their efficient retrograde transport in vivo. Faseb J 15:2283-2285.
16. Soudais, C., N. Skander, and E. J. Kremer. 2004. Long-term in vivo transduction of neurons throughout the rat CNS using novel helper-dependent CAV-2 vectors. FASEB J 18:391-393.
17. Hnasko, T. S., F. A. Perez, A. D. Scouras, E. A. Stoll, S. D. Gale, S. Luquet, P. E. Phillips, E. J. Kremer, and R. D. Palmiter. 2006. Cre recombinase-mediated restoration of nigrostriatal dopamine in dopamine-deficient mice reverses hypophagia and bradykinesia. Proc Natl Acad Sci U S A 103:8858-8863.
18. Pivetta, C., M. S. Esposito, M. Sigrist, and S. Arber. 2014. Motor-circuit communication matrix from spinal cord to brainstem neurons revealed by developmental origin. Cell 156:537-548.
19. Ekstrand, M. I., A. R. Nectow, Z. A. Knight, K. N. Latcha, L. E. Pomeranz, and J. M. Friedman. 2014. Molecular profiling of neurons based on connectivity. Cell 157:1230-1242.
20. Ariza, L., L. Gimenez-Llort, A. Cubizolle, G. Pages, B. Garcia-Lareu, N. Serratrice, D. Cots, R. Thwaite, M. Chillon, E. J. Kremer, and A. Bosch. 2014. Central Nervous System Delivery of Helper-Dependent Canine Adenovirus Corrects Neuropathology and Behavior in Mucopolysaccharidosis Type VII Mice. Hum Gene Ther 25:199-211.
21. Cubizolle, A., N. Serratrice, N. Skander, M. A. Colle, S. Ibanes, A. Gennetier, N. Bayo-Puxan, K. Mazouni, F. Mennechet, B. Joussemet, Y. Cherel, Y. Lajat, C. Vite, F. Bernex, V. Kalatzis, M. E. Haskins, and E. J. Kremer. 2014. Corrective GUSB Transfer to the Canine Mucopolysaccharidosis VII Brain. Mol Ther 22:762-773.

Implications of Cre activity and co-infection on canine helper-dependent vector production
111
22. Serratrice, N., A. Cubizolle, S. Ibanes, N. Mestre-Frances, N. Bayo-Puxan, S. Creyssels, A. Gennetier, F. Bernex, J. M. Verdier, M. E. Haskins, G. Couderc, F. Malecaze, V. Kalatzis, and E. J. Kremer. 2014. Corrective GUSB transfer to the canine mucopolysaccharidosis VII cornea using a helper-dependent canine adenovirus vector. Journal of controlled release : official journal of the Controlled Release Society 181:22-31.
23. Fernandes, P., C. Peixoto, V. M. Santiago, E. J. Kremer, A. S. Coroadinha, and P. M. Alves. 2013. Bioprocess development for canine adenovirus type 2 vectors. Gene Ther 20:353-360.
24. Soudais, C., S. Boutin, and E. J. Kremer. 2001. Characterization of cis-acting sequences involved in canine adenovirus packaging. Mol Ther 3:631-640.
25. Fernandes, P., D. Simão, M. R. Guerreiro, E. J. Kremer, A. S. Coroadinha, and P. M. Alves. 2014. The impact of Adenovirus life cycle on the generation of canine helper-dependent vectors. Gene Ther in press.
26. Dormond, E., A. Meneses-Acosta, D. Jacob, Y. Durocher, R. Gilbert, M. Perrier, and A. Kamen. 2009. An efficient and scalable process for helper-dependent adenoviral vector production using polyethylenimine-adenofection. Biotechnol Bioeng 102:800-810.
27. Palmer, D., and P. Ng. 2003. Improved system for helper-dependent adenoviral vector production. Mol Ther 8:846-852.
28. Suzuki, M., R. Cela, C. Clarke, T. K. Bertin, S. Mourino, and B. Lee. 2010. Large-scale production of high-quality helper-dependent adenoviral vectors using adherent cells in cell factories. Hum Gene Ther 21:120-126.
29. Kovesdi, I., and S. J. Hedley. 2010. Adenoviral producer cells. Viruses 2:1681-1703. 30. Dormond, E., M. Perrier, and A. Kamen. 2009. Identification of critical infection
parameters to control helper-dependent adenoviral vector production. J Biotechnol 142:142-150.
31. Ahn, M., A. Gamble, S. R. Witting, J. Magrisso, S. Surendran, S. Obici, and N. Morral. 2013. Vector and helper genome rearrangements occur during production of helper-dependent adenoviral vectors. Human gene therapy methods 24:1-10.
32. Weiden, M. D., and H. S. Ginsberg. 1994. Deletion of the E4 region of the genome produces adenovirus DNA concatemers. Proc Natl Acad Sci U S A 91:153-157.
33. Boyer, J., K. Rohleder, and G. Ketner. 1999. Adenovirus E4 34k and E4 11k inhibit double strand break repair and are physically associated with the cellular DNA-dependent protein kinase. Virology 263:307-312.
34. Stracker, T. H., C. T. Carson, and M. D. Weitzman. 2002. Adenovirus oncoproteins inactivate the Mre11-Rad50-NBS1 DNA repair complex. Nature 418:348-352.
35. Araujo, F. D., T. H. Stracker, C. T. Carson, D. V. Lee, and M. D. Weitzman. 2005. Adenovirus type 5 E4orf3 protein targets the Mre11 complex to cytoplasmic aggresomes. J Virol 79:11382-11391.
36. Baker, A., K. J. Rohleder, L. A. Hanakahi, and G. Ketner. 2007. Adenovirus E4 34k and E1b 55k oncoproteins target host DNA ligase IV for proteasomal degradation. J Virol 81:7034-7040.

Chapter IV
112

Chapter V
The impact of adenovirus life cycle on the
generation of canine helper-dependent
vectors
This chapter is adapted from:
Fernandes P, Simão D, Guerreiro MR, Kremer EJ, Coroadinha AS, Alves PM (2015). Impact
of adenovirus life cycle on the generation of canine helper-dependent vectors. Gen Ther.
Jan;22(11):40-9

Chapter V
114
Abstract
Helper-dependent adenovirus vectors (HDVs) are safe and efficient tools for gene
transfer with high cloning capacity. However, the multiple amplification steps needed to
produce HDV hamper a robust production process and in turn the availability of high
quality vectors. To understand the factors behind the low productivity, we analyzed the
progression of HDVs life cycle. Canine adenovirus type 2 (CAV-2) vectors, holding
attractive features to overcome immunogenic concerns and treat neurobiological
disorders, were the focus of this work.
When compared to E1-deleted (∆E1) vectors, we found a faster helper genome
replication during HDV production. This was consistent with an upregulation of the
adenovirus polymerase (Adpol) and pre-terminal protein (pTP) and led to higher and
earlier expression of structural proteins. While genome packaging occurred similarly to
∆E1 vectors, more immature capsids were obtained during HDV production, which led to
a ~4-fold increase in physical to infectious particles ratio. The higher viral protein
content in HDV-producing cells was also consistent with an increased activation of
autophagy and cell death, in which earlier cell death compromised volumetric
productivity. The increased empty capsids and earlier cell death found in HDV production
may partially contribute to the lower vector infectivity. However, an HDV specific factor
responsible for a defective maturation process should be also involved to fully explain the
low infectious titers. This study showed how a deregulated adenovirus cycle progression
affected cell line homeostasis and HDV propagation, highlighting the impact of vector
genome design on virus-cell interaction.
The impact of adenovirus life cycle on the generation of canine helper-dependent vectors
115
Contents
1. Introduction .............................................................................................................................................116
2. Materials and Methods ........................................................................................................................118
2.1. Cell lines and culture medium .......................................................................................................118
2.2. Vector .......................................................................................................................................................118
2.3. Gene expression analysis ................................................................................................................118
2.4. Viral vectors amplification studies .............................................................................................119
2.5. Infectious vectors titration .............................................................................................................119
2.6. Viral genomes and physical particles by real-time PCR ....................................................119
2.7. Quantification of assembled capsids ..........................................................................................119
2.8. Cell death analysis ..............................................................................................................................120
2.9. Western blot analysis ........................................................................................................................121
2.10. Nuclei extracts ...................................................................................................................................121
3. Results .........................................................................................................................................................122
3.1. Volumetric productivity and viral particles infectivity are impaired in HDV
production ......................................................................................................................................................123
3.2. Cell binding and trafficking into the nucleus does not affect HDV production .......124
3.3. Replication of vector genome increases in HDV-producing cells ..................................125
3.4. Expression of genes implicated in viral DNA replication and late phase is observed
earlier in HDV-producing cells ..............................................................................................................126
3.5. Despite more assembled particles during HDV production, packaging occurs
similarly to ∆E1 control ............................................................................................................................128
3.6. Low cell viability during HDV production is linked to activation of autophagy and
high levels of viral proteins affecting virus infectivity ...............................................................129
4. Discussion..................................................................................................................................................132
5. Acknowledgements and author contribution ...........................................................................135
6. References .................................................................................................................................................136

Chapter V
116
1. Introduction
Adenoviruses (Ads) are non enveloped, icosahedral particles containing a linear, double-
stranded DNA genome. Ad vectors have received considerable attention as gene transfer
tools in which human adenovirus serotype 5 (HAd5) is the typical prototype vector
backbone. However, the hurdles facing the clinical use of human adenoviral vectors,
including innate and pre-existing immunity, may limit the efficiency and time of
transgene expression (1). One of the alternatives to circumvent these drawbacks is using
non human Ads, such as canine adenovirus type 2 (CAV-2) vectors (2). In addition to the
paucity of anti-CAV-2 neutralizing antibodies in humans (2, 3), their vectors induce a low
level of innate response and no activation of human complement pathways (4, 5). Their
ability to preferentially transduce neurons, combined with a remarkable capacity of
axonal transport (6, 7), make CAV-2 vectors promising candidates for the treatment of
neurodegenerative diseases (8, 9).
Adenovirus genome has been progressively modified from the wild-type to improve
vector safety and efficacy in therapeutic applications (reviewed elsewhere (10)). Helper-
dependent vectors (HDVs), devoid of viral coding regions, are powerful tools for gene
transfer in vivo. HDVs combine high transduction efficacies, long-term gene expression,
and a cloning capacity of >30 kb. These vectors retain only on their genomes the inverted
terminal repeats, the packaging region (Ψ) and an expression cassette(s). To produce
HDVs, both early and late viral functions need to be complemented in a synchronized
fashion. Standard production methods are based on the co-infection of E1-
transcomplementing cells with HDV and an E1-deleted helper vector (HV), which
provides the viral proteins in trans. During production, both HDV and HV genomes
replicate inside the cells, but the encapsidation of the HV genome is minimized, by
flanking its Ψ with recognition sequences for a recombinase constitutively expressed by
the cells, such as FLP (11, 12) or Cre (13).
Despite their enormous potential, the use of HDVs in preclinical and clinical settings is
limited because of two bottlenecks: contamination with HV and production yields.
Several efforts to reduce HV contamination have been described. Based on alternative
vector designs, deletion of the Ψ in the HV genome was improved through the
development of an inducible self-inactivating vector (vector expressing a recombinase
that can block its own genome packaging) (14). Moreover, tweaking the HV packaging
domain can delay its packaging (15), or reduce its packaging efficiency in co-infection
The impact of adenovirus life cycle on the generation of canine helper-dependent vectors
117
contexts (16, 17). Reduced HDV production obtained after the initial transfection step,
limited by transfection efficiency and initiation of viral DNA replication from plasmid
substrates, has also prompted others to improve the strategies. With a focus on this step,
production of HDV was improved by creating cell lines expressing pre-terminal protein
(pTP) and adenoviral DNA polymerase (Adpol) (18), optimizing transfection methods
compliant with scalable processes (19), and developing an intracellular system to release
HDV genome from transfected circular plasmids, which increased transfection efficiencies
of ~10-fold (20). However, even using improved conditions, multiple amplification steps
are needed to rescue HDV amplification to its maximum and prepare sufficient quantities
of vector (14, 19, 21, 22). Moreover, most reports show a relatively low infectivity of HDV
in comparison to physical particles (optical density based) titers (14, 23) and, equally
importantly, inconsistent infectious yields obtained in different preparations of the same
HDV (14). Although most studies were conducted with human HDVs, consistently low
infectious titers are also extended to canine HDVs (4, 6, 9).
Ads have a regulated infection cycle where multiple viral and cellular proteins interact to
enable a productive virus replication and generate infectious virus particles (reviewed in
(24)). Therefore, understanding the adenovirus replication steps during the generation of
HDV particles could help break the bottlenecks behind the productivity of these vectors.
After cell binding, the mature viral particle is internalized and transported towards the
nucleus. During this transport, the particle is dismantled by an ordered elimination of
some structural proteins and culminates with the delivery of the viral genome into the
nucleus via nuclear pore complexes (25). Once in the nucleus, early genes are expressed
and viral DNA replication starts. Late phase of infection is then activated and structural
proteins expressed. These proteins are likely assembled into empty virions, followed by
the packaging of viral genome. Finally, viral particles undergo a protease-mediated
maturation process to becomes infectious (26-28).
In the present study, we investigated the steps of Ad cycle that could be affected during
HD CAV-2 production. As CAV-2 vectors use keeps increasing(8, 9), larger amounts of
high quality vectors to conduct preclinical and possibly clinical assays are required.
Therefore, understanding HDV productivity is critical to identify and hopefully overcome
the manufacturing limitations. Here, we provide evidences of a distinct replication cycle
progression during HDV production, which resulted in changes in the cell physiology and
vector productivity.

Chapter V
118
2. Materials and Methods
2.1. Cell lines and culture medium
MDCK (ECCAC, Nr 84121903) and MDCK-E1-Cre cells (29) were grown in Dulbecco’s
Modified Eagle’s Medium (DMEM) (Gibco, Paisley, UK) supplemented with 10% (v/v) FBS
(Gibco). Cells were maintained at 37ºC in a humidified atmosphere air containing 5% CO2.
Cell concentration and viability were determined by the trypan blue exclusion method
using a 0.1% (v/v) solution prepared in PBS and counting cells in a Fuchs-Rosenthal
haemacytometer (Brand, Wertheim, Germany).
2.2. Vector
CAVGFP, JB∆5 and HD CAVGFP are vectors derived from CAV-2 strain Toronto A 26/61,
GenBank J04368. CAVGFP (2) and HD CAVGFP (7) are E1-deleted (ΔE1) and HD vectors,
respectively, and contain an CMV-eGFP expression cassette. JB∆5 is a helper vector
containing loxP flanking the packaging domains and a RSV-lacZ expression cassette (7).
CAVGFP, JB∆5 and HD CAVGFP viral stocks were prepared and purified by CsCl gradients
as described previously (2, 29).
2.3. Gene expression analysis
To assess gene expression, total RNA was extracted from 1 × 10⁶ cells using RNeasy mini
kit (QIAGEN, Germantown, MD, USA). In infected cells, two rounds of RNA cleaning were
performed. For real-time PCR, RPL-22 was chosen as a control gene. Reverse
transcription of total RNA was performed according to Transcriptor high fidelity cDNA
synthesis kit (Roche applied science, Mannheim, Germany) protocol for cDNA synthesis
using 1 μg of total RNA and oligo dT primer for total mRNA reverse transcription (RT).
The reverse transcribed cDNA was aliquoted and stored at -20ºC until further processing.
SYBR Green I dye chemistry was used to detect the PCR products using LightCycler 480
SYBR Green I Master (Roche applied science) according to the manufacturer’s
instructions using LightCycler 480 Real Time PCR System (Roche applied science). cDNA
samples were run with a RT-reaction free control and a sample without cDNA template.
The primers used for each target are shown in Table S1 (Appendix).

The impact of adenovirus life cycle on the generation of canine helper-dependent vectors
119
2.4. Viral vectors amplification studies
MDCK-E1-Cre cells were seeded at 1.5 × 10⁴ cells/cm2, infected the day after with
medium exchange. Unless stated otherwise, HD CAVGFP production assays were
performed using MOI 5 and MOI 1 of HD CAVGFP and JB∆5, respectively. As control,
CAVGFP production assays were performed by co-infecting JB∆5 under same conditions.
Production assays using single infection of JB∆5 with MOI 1 were also performed to
isolate the role of this vector on production kinetics. Intracellular samples were collected
using triton (Sigma-Aldrich) 0.1% (v/v) in Tris-HCl, clarified at 3000 g for 10 min at 4ºC
and stored at -85ºC until further analysis.
2.5. Infectious vectors titration
Quantification of infectious HD CAVGFP and CAVGFP was performed by monitoring the
expression of GFP, while titration of infectious JB∆5 vectors was based in lacZ gene
expression and β-galactosidase activity as described previously (29).
2.6. Viral genomes and physical particles by real-time PCR
Viral genomes were extracted and purified by High Pure Viral Nucleic Acid Kit (Roche
Diagnostics, Penzberg, Germany). SYBR Green I dye chemistry was used to detect PCR
products using Light Cycler system. Quantification was based on the detection of GFP (for
HD CAVGFP and CAVGFP) or lacZ (for JB∆5). Previously purified and quantified plasmids
coding for E1-deleted CAV-2 genome, GFP or lacZ were used as standards. To ensure the
removal of free viral genomes from samples and accurately quantify viral physical
particles, a benzonase treatment was performed prior to DNA extraction by adding 2 μl of
benzonase (250 U/μl) (Merck Millipore, Darmstadt, Germany) to the same sample
volume and incubating for 1 h at 37ºC. Benzonase was inhibited using the proteinase K
step of DNA extraction protocol. GFP and lacZ primers are shown in Table S1 (Appendix).
2.7. Quantification of assembled capsids
After confirming that virions and empty capsids were quantifiable through Nanoparticle
Tracking Analysis (NTA), assembled capsids were titrated using LM10 instrument
(NanoSight, Amesbury, UK). Following the manufacturer’s instructions, samples were
diluted with Dulbecco’s phosphate buffered saline (PBS) to reach a particle concentration

Chapter V
120
suitable for analysis with NTA (1.0 × 10⁸ to 2.5 × 10⁹ particles/mL). At least two different
sample dilutions were prepared for each sample and analyzed twice. The NanoSight
LM10 recorded 60 second sample videos which were then analyzed with the NTA 2.0
Analytical software release version build 0125 (NanoSight, Amesbury, UK). The NTA
software is then able to identify and track individual nanoparticles moving under
Brownian motion and the results allow particle size and concentration to be recovered
(30).
2.8. Cell death analysis
Cells were seeded in 24 well plates, infected under the conditions above mentioned and
analysed for necrosis and autophagy at 20 hpi. Necrosis was assessed by staining cells
with propidium iodide (Sigma-Aldrich, St. Louis, MO, USA). After 20 hpi, cells were
collected from wells in duplicates, stained with 2 μl of propidium iodide solution (Sigma-
Aldrich) in 2 mL final volume, incubated in the dark during 10 min and analyzed by flow
cytometry using a CyFlow Space (Partec, Münster, Germany) equipped with a 561 nm
yellow laser and 630 ± 22 nm filter. Non-stained and non-infected controls were also
analyzed. Autophagy was evaluated through the detection of autophagosomes by
immunostaining. Cells grown in coverslips inside wells were fixed in 4% (w/v)
paraformaldehyde + 4% sucrose (w/v) in PBS, permeabilized with 0.1% (v/v) Triton X-
100 solution (Sigma) and processed as described previously (31). Briefly, after blocking
with 0.2% (w/v) fish skin gelatin (FSG), samples were incubated with anti-LC3B antibody
(Sigma-Aldrich), diluted to 1:100 in 0.125% (w/v) FSG + 0.1% (v/v) Triton X-100 in PBS.
Alexa Fluor® 647 Goat Anti-Rabbit IgG (H+L) antibody (Invitrogen, Carlsbad, CA, USA)
was used as secondary antibody diluted to 1:500. Cell nuclei were counter stained with
ProLong Gold antifade reagent with DAPI (Invitrogen). Samples were visualized using
fluorescence (DMI6000, Leica) microscopy. Images were processed using the open source
ImageJ software (Rasband, W.S., ImageJ, U. S. National Institutes of Health, Bethesda,
Maryland, USA, http://imagej.nih.gov/ij/, 1997-2012.). Autophagy-positive cells were
quantified by counting the number of cells presenting autophagosomes in relation to the
number of stained nuclei. Quantifications were performed in two biological replicates,
using at least three different sections per replicate.
The impact of adenovirus life cycle on the generation of canine helper-dependent vectors
121
2.9. Western blot analysis
Cell protein extracts were obtained from 1 × 10⁶ cells using 500 μl of mammalian protein
extraction reagent M-PER (Thermoscientific, Rockford, IL, USA) according to
manufacturer’s instructions. Equal volumes of sample were subjected to SDS-PAGE gel
according to NuPAGE® SDS-PAGE gel system (Invitrogen), and transfered to Hybond-C
extra membranes (GE Healthcare, Uppsala, Sweden) using Trans-blot turbo transfer
system (Bio-rad, Hercules, CA, USA). Membranes were blocked with 5% (w/v) dry milk in
tris-buffered saline-Tween 20, and probed with polyclonal rabbit anti-CAV-2 primary
antibody (32) and anti-β actin abcam8226 (housekeeping control). Both antibodies were
diluted to 1:1000. Western blot membrane detection was performed using HPR-linked
antibodies and Amersham ECL reagents and protocols.
2.10. Nuclei extracts
Cells at 80% confluence in four 150 cm2 T-flasks were infected and harvested 8 hpi in
cold PBS using a cell scraper. The extract from nuclei were prepared by adapting the
protocol provided in CelLytic NuCLEAR extraction kit (Sigma-Aldrich). Briefly, cells were
centrifuged and suspended in Lysis buffer (5 mM Tris HCl, pH 7.5 with 1 mM MgCl2, 1.5
mM CaCl2 and 1 mM DTT), then cells were let to swell on ice for 15 min and disrupted
using a syringe with a narrow-gauge needle (No. 26). After, the suspension was
centrifuged during 20 min at 11 000 g, and the crude nuclei pellet suspended in
extraction buffer (20 mM HEPES pH 7.9, with 1.5 mM MgCl2 and 0.42 M NaCl, 0.2 mM
EDTA, 1 mM DTT and 25% (v/v) Glycerol). Finally, 0.1 % (v/v) of Triton (Sigma-Aldrich)
in Tris HCl was added, the suspended nuclei was agitated for 30 min and centrifuged for
3000 g during 10 min at 4 ºC. Extracts were stored at -85ºC. Viral genomes were isolated
from nuclei extracts using the High Pure Viral Nucleic Acid Kit (Roche) and quantified as
stated above.
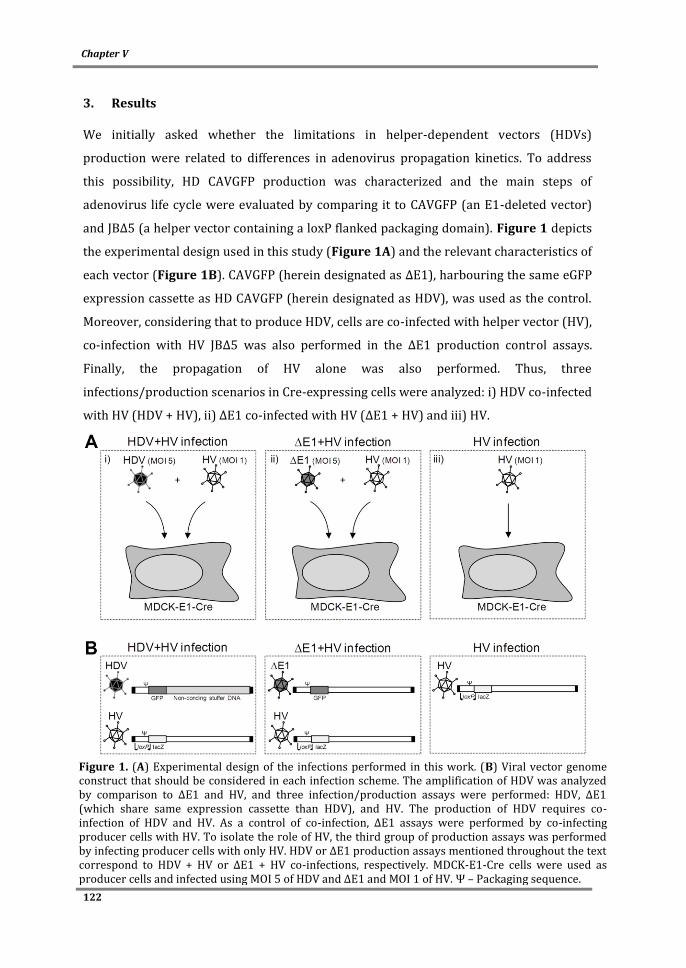
Chapter V
122
3. Results
We initially asked whether the limitations in helper-dependent vectors (HDVs)
production were related to differences in adenovirus propagation kinetics. To address
this possibility, HD CAVGFP production was characterized and the main steps of
adenovirus life cycle were evaluated by comparing it to CAVGFP (an E1-deleted vector)
and JB∆5 (a helper vector containing a loxP flanked packaging domain). Figure 1 depicts
the experimental design used in this study (Figure 1A) and the relevant characteristics of
each vector (Figure 1B). CAVGFP (herein designated as ∆E1), harbouring the same eGFP
expression cassette as HD CAVGFP (herein designated as HDV), was used as the control.
Moreover, considering that to produce HDV, cells are co-infected with helper vector (HV),
co-infection with HV JB∆5 was also performed in the ∆E1 production control assays.
Finally, the propagation of HV alone was also performed. Thus, three
infections/production scenarios in Cre-expressing cells were analyzed: i) HDV co-infected
with HV (HDV + HV), ii) ∆E1 co-infected with HV (∆E1 + HV) and iii) HV.
Figure 1. (A) Experimental design of the infections performed in this work. (B) Viral vector genome construct that should be considered in each infection scheme. The amplification of HDV was analyzed by comparison to ∆E1 and HV, and three infection/production assays were performed: HDV, ∆E1 (which share same expression cassette than HDV), and HV. The production of HDV requires co-infection of HDV and HV. As a control of co-infection, ∆E1 assays were performed by co-infecting producer cells with HV. To isolate the role of HV, the third group of production assays was performed by infecting producer cells with only HV. HDV or ∆E1 production assays mentioned throughout the text correspond to HDV + HV or ∆E1 + HV co-infections, respectively. MDCK-E1-Cre cells were used as producer cells and infected using MOI 5 of HDV and ∆E1 and MOI 1 of HV. Ψ – Packaging sequence.
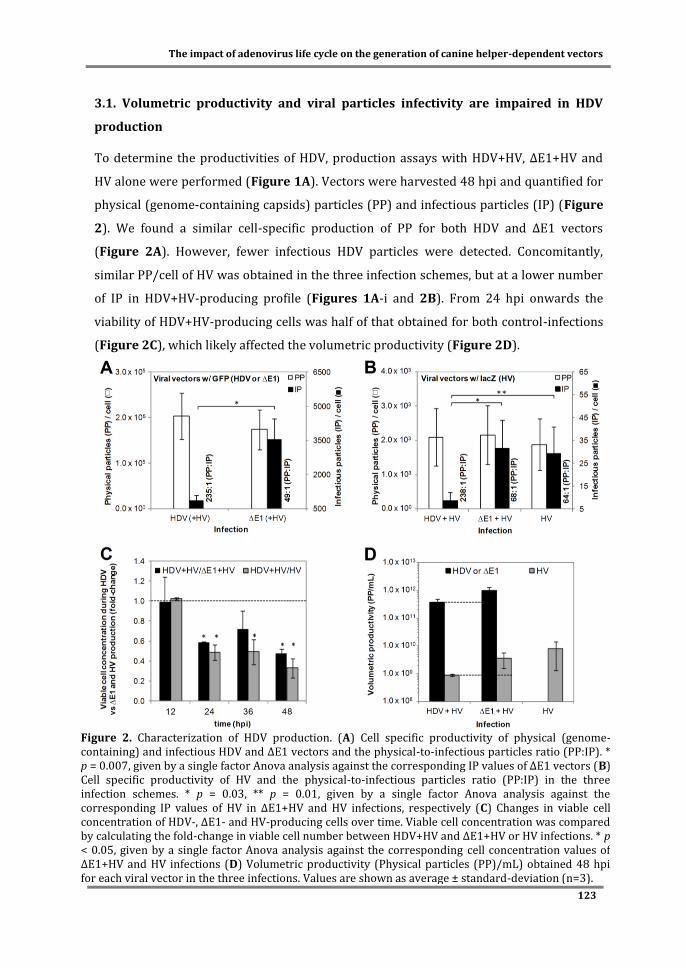
The impact of adenovirus life cycle on the generation of canine helper-dependent vectors
123
3.1. Volumetric productivity and viral particles infectivity are impaired in HDV
production
To determine the productivities of HDV, production assays with HDV+HV, ∆E1+HV and
HV alone were performed (Figure 1A). Vectors were harvested 48 hpi and quantified for
physical (genome-containing capsids) particles (PP) and infectious particles (IP) (Figure
2). We found a similar cell-specific production of PP for both HDV and ∆E1 vectors
(Figure 2A). However, fewer infectious HDV particles were detected. Concomitantly,
similar PP/cell of HV was obtained in the three infection schemes, but at a lower number
of IP in HDV+HV-producing profile (Figures 1A-i and 2B). From 24 hpi onwards the
viability of HDV+HV-producing cells was half of that obtained for both control-infections
(Figure 2C), which likely affected the volumetric productivity (Figure 2D).
Figure 2. Characterization of HDV production. (A) Cell specific productivity of physical (genome-containing) and infectious HDV and ∆E1 vectors and the physical-to-infectious particles ratio (PP:IP). * p = 0.007, given by a single factor Anova analysis against the corresponding IP values of ∆E1 vectors (B) Cell specific productivity of HV and the physical-to-infectious particles ratio (PP:IP) in the three infection schemes. * p = 0.03, ** p = 0.01, given by a single factor Anova analysis against the corresponding IP values of HV in ∆E1+HV and HV infections, respectively (C) Changes in viable cell concentration of HDV-, ∆E1- and HV-producing cells over time. Viable cell concentration was compared by calculating the fold-change in viable cell number between HDV+HV and ∆E1+HV or HV infections. * p < 0.05, given by a single factor Anova analysis against the corresponding cell concentration values of ∆E1+HV and HV infections (D) Volumetric productivity (Physical particles (PP)/mL) obtained 48 hpi for each viral vector in the three infections. Values are shown as average ± standard-deviation (n=3).
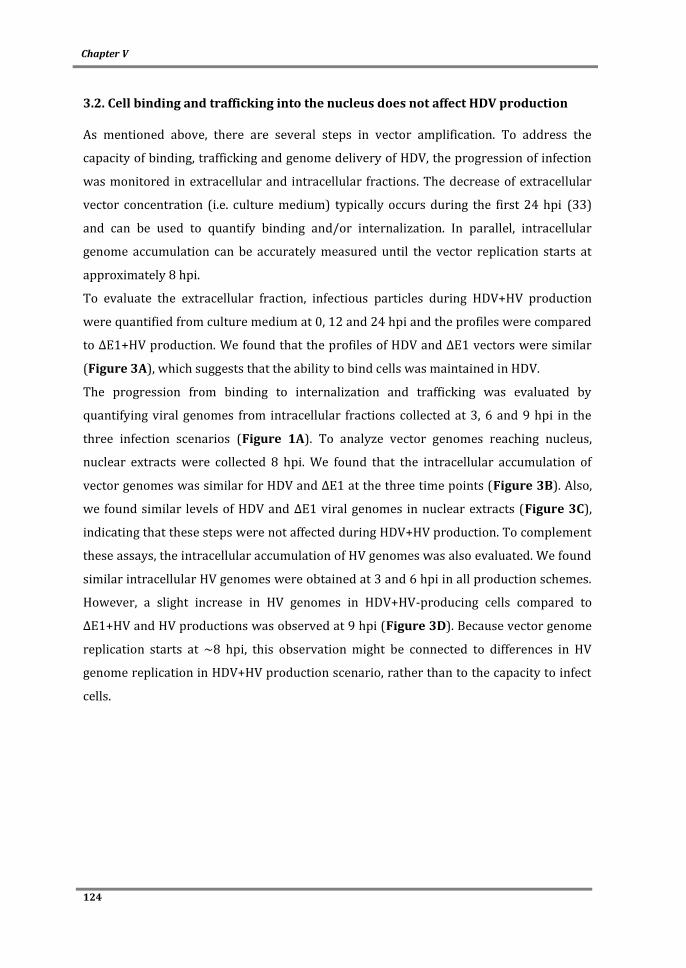
Chapter V
124
3.2. Cell binding and trafficking into the nucleus does not affect HDV production
As mentioned above, there are several steps in vector amplification. To address the
capacity of binding, trafficking and genome delivery of HDV, the progression of infection
was monitored in extracellular and intracellular fractions. The decrease of extracellular
vector concentration (i.e. culture medium) typically occurs during the first 24 hpi (33)
and can be used to quantify binding and/or internalization. In parallel, intracellular
genome accumulation can be accurately measured until the vector replication starts at
approximately 8 hpi.
To evaluate the extracellular fraction, infectious particles during HDV+HV production
were quantified from culture medium at 0, 12 and 24 hpi and the profiles were compared
to ∆E1+HV production. We found that the profiles of HDV and ∆E1 vectors were similar
(Figure 3A), which suggests that the ability to bind cells was maintained in HDV.
The progression from binding to internalization and trafficking was evaluated by
quantifying viral genomes from intracellular fractions collected at 3, 6 and 9 hpi in the
three infection scenarios (Figure 1A). To analyze vector genomes reaching nucleus,
nuclear extracts were collected 8 hpi. We found that the intracellular accumulation of
vector genomes was similar for HDV and ∆E1 at the three time points (Figure 3B). Also,
we found similar levels of HDV and ∆E1 viral genomes in nuclear extracts (Figure 3C),
indicating that these steps were not affected during HDV+HV production. To complement
these assays, the intracellular accumulation of HV genomes was also evaluated. We found
similar intracellular HV genomes were obtained at 3 and 6 hpi in all production schemes.
However, a slight increase in HV genomes in HDV+HV-producing cells compared to
∆E1+HV and HV productions was observed at 9 hpi (Figure 3D). Because vector genome
replication starts at ~8 hpi, this observation might be connected to differences in HV
genome replication in HDV+HV production scenario, rather than to the capacity to infect
cells.
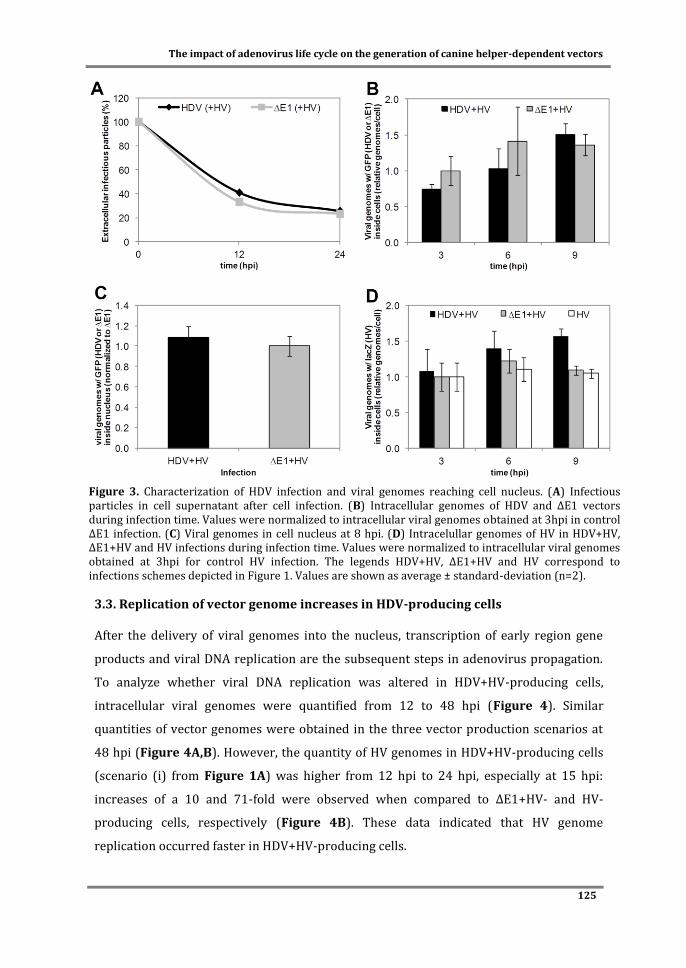
The impact of adenovirus life cycle on the generation of canine helper-dependent vectors
125
3.3. Replication of vector genome increases in HDV-producing cells
After the delivery of viral genomes into the nucleus, transcription of early region gene
products and viral DNA replication are the subsequent steps in adenovirus propagation.
To analyze whether viral DNA replication was altered in HDV+HV-producing cells,
intracellular viral genomes were quantified from 12 to 48 hpi (Figure 4). Similar
quantities of vector genomes were obtained in the three vector production scenarios at
48 hpi (Figure 4A,B). However, the quantity of HV genomes in HDV+HV-producing cells
(scenario (i) from Figure 1A) was higher from 12 hpi to 24 hpi, especially at 15 hpi:
increases of a 10 and 71-fold were observed when compared to ∆E1+HV- and HV-
producing cells, respectively (Figure 4B). These data indicated that HV genome
replication occurred faster in HDV+HV-producing cells.
Figure 3. Characterization of HDV infection and viral genomes reaching cell nucleus. (A) Infectious particles in cell supernatant after cell infection. (B) Intracellular genomes of HDV and ∆E1 vectors during infection time. Values were normalized to intracellular viral genomes obtained at 3hpi in control ∆E1 infection. (C) Viral genomes in cell nucleus at 8 hpi. (D) Intracelullar genomes of HV in HDV+HV, ∆E1+HV and HV infections during infection time. Values were normalized to intracellular viral genomes obtained at 3hpi for control HV infection. The legends HDV+HV, ∆E1+HV and HV correspond to infections schemes depicted in Figure 1. Values are shown as average ± standard-deviation (n=2).

Chapter V
126
The transgene expression in terms of mRNA, was also evaluated as an indicator of
transcription capacity since to some extent may represent the immediate-early
transcription. These showed lower levels of GFP and slightly higher levels of β-
galactosidase in HDV+HV-infected cells when compared to ∆E1+HV and HV infections
(Figure S1, Appendix).
3.4. Expression of genes implicated in viral DNA replication and late phase is
observed earlier in HDV-producing cells
While early phase genes are primarily transcribed before genome replication and the
corresponding mRNA is transcribed from the input genomes, late region transcription
becomes robust once DNA replication starts. To analyze whether the expression of viral
genes was altered during HDV production, transcription and translation were analyzed.
Transcription analysis was performed by determining mRNA levels from several regions
to have representatives of the different infection phases. Table S2 (Appendix) describes
the viral genes analyzed and the corresponding infection phase and biological role. Viral
genes to be analyzed were selected according to two main criteria: choose at least two
viral genes from early and late phases, and viral genes involved in processes that
occurred differently during HDV production, namely those involved in DNA replication
(E2 region (34)), and those involved in capsid maturation (protease and pVI (28, 35)). In
addition, IVa2 was analyzed because of its role during mid-late phase in activating late
region expression (36) and later as key player in viral genome packaging (37).
Regardless of the phase, the expression of all viral genes increased from 12 hpi to 48 hpi
(Table S3, Appendix). Notably, we found earlier and higher levels of viral transcripts in
Figure 4. Analysis of viral genomes replication of viral vectors in each infection scheme. (A) HDV and ∆E1 genomes (B) HV genomes in each infection. Values were normalized to intracellular viral genomes obtained at 3hpi for control ∆E1+HV and HV infections. Values are shown as average ± standard-deviation (n=2).
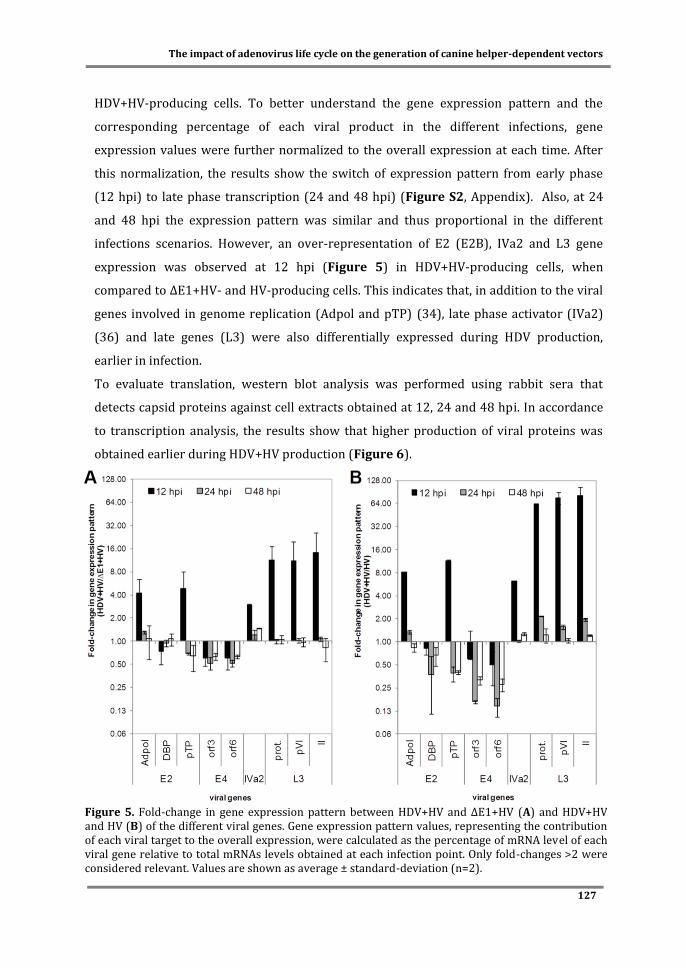
The impact of adenovirus life cycle on the generation of canine helper-dependent vectors
127
HDV+HV-producing cells. To better understand the gene expression pattern and the
corresponding percentage of each viral product in the different infections, gene
expression values were further normalized to the overall expression at each time. After
this normalization, the results show the switch of expression pattern from early phase
(12 hpi) to late phase transcription (24 and 48 hpi) (Figure S2, Appendix). Also, at 24
and 48 hpi the expression pattern was similar and thus proportional in the different
infections scenarios. However, an over-representation of E2 (E2B), IVa2 and L3 gene
expression was observed at 12 hpi (Figure 5) in HDV+HV-producing cells, when
compared to ∆E1+HV- and HV-producing cells. This indicates that, in addition to the viral
genes involved in genome replication (Adpol and pTP) (34), late phase activator (IVa2)
(36) and late genes (L3) were also differentially expressed during HDV production,
earlier in infection.
To evaluate translation, western blot analysis was performed using rabbit sera that
detects capsid proteins against cell extracts obtained at 12, 24 and 48 hpi. In accordance
to transcription analysis, the results show that higher production of viral proteins was
obtained earlier during HDV+HV production (Figure 6).
Figure 5. Fold-change in gene expression pattern between HDV+HV and ∆E1+HV (A) and HDV+HV and HV (B) of the different viral genes. Gene expression pattern values, representing the contribution of each viral target to the overall expression, were calculated as the percentage of mRNA level of each viral gene relative to total mRNAs levels obtained at each infection point. Only fold-changes >2 were considered relevant. Values are shown as average ± standard-deviation (n=2).
Chapter V
128
3.5. Despite more assembled particles during HDV production, packaging occurs
similarly to ∆E1 control
Once the translation of late region transcripts is accomplished, the structural proteins are
assembled into capsids and genomes are packaged to generate full virions. However,
when producing adenovirus vectors, two types of viral particles are routinely produced:
assembled genome-containing or empty capsids, which are assembled particles with little
or no viral genome (38). Therefore, to understand the type of particles generated during
HDV production, assembly and packaging were further analyzed.
Assembly was analyzed by quantifying the assembled viral particles obtained 48 hpi
using the NanoSight technology, which measured assembled particles, the sum of empty
capsids and full virions. In addition to a positive correlation between the number of
assembled viral particles and viral proteins expression in each infection (Figure 6), we
found more assembled viral particles in HDV+HV production (Figure 7A).
Genome packaging was evaluated by comparing free viral genomes with total viral
genomes (free genomes plus packaged genomes) at 48 hpi. To do so, viral DNA was
extracted from intracellular samples in duplicate, in which one replicate was subjected to
benzonase treatment prior DNA extraction; the decrease of quantified viral genomes in
the samples treated with benzonase before DNA extraction, in comparison with non-
treated sample, indicates the presence of free viral genomes. We found no significant
changes in the free viral genomes obtained in HDV+HV- and ∆E1+HV-producing cells
(Figure 7B). By comparison, the quantity of HV free viral genomes was similar in the
three infection schemes. More free viral genomes should be obtained for HV than for HDV
Figure 6. Western blot of cell extracts obtained in each infection scheme. Cell extracts were normalized to cell concentration and each lane was loaded with same sample volume. Image corresponds to a single membrane. β-actin blot (loading control) was obtained by cutting a fragment which included the 42 kDa size region from the original membrane, using the bands of SeeBlue® Plus2 Pre-stained Protein Standard (Invitrogen) as reference. After detection, Magic MagicMark™ XP Western Protein Standard (Invitrogen) was used as molecular weight marker. For a matter of clarity, blot is shown cropped.

The impact of adenovirus life cycle on the generation of canine helper-dependent vectors
129
or ΔE1 vectors, as Cre recombinase specifically impacts HV genome packaging. This
observation was not clear in Figure 7B, probably because of the considerable inter-assay
variability (depicted by the error bars) that disguised the expected differences between
free genomes percentage of HV and HDV or ΔE1 vector.
Together, these results show that despite more viral capsids generated, the percentage of
packaged HDV genomes did not increased. Notably, the total DNA of HDV and ∆E1 were
similar at 48 hpi (Figure 4A).
3.6. Low cell viability during HDV production is linked to activation of autophagy
and high levels of viral proteins affecting virus infectivity
When compared to non-infected cells, a 3.32 ± 0.23 fold-increase in necrotic cells was
obtained at 24 hpi during HDV production, versus 1.74 ± 0.15 and 1.42 ± 0.01 for ∆E1 and
HV, respectively, which is consistent with the cell viability analysis (Figure 2D). To
further understand the cell death during HDV production, we evaluated the effect of HDV
infection on cell viability, the activation of autophagy, an adenovirus-related programmed
cell death (39, 40), and the role of virus cycle progression on producer cells viability and
viral productive outcome.
To determine the effect of infection on cell death, HDV infections were performed in
MDCK-E1-Cre cells and MDCK cells at same MOI (Figure 1A-i), which do not express the
CAV-2 E1 region and are therefore unable to allow productive infectious cycle of ∆E1
CAV-2 vectors. At 48 hpi, MDCK cell viability was maintained, indicating that HDV
Figure 7. Assembled viral particles (A) and free viral genomes (B) obtained in each infection at 48 hpi. Values are shown as average ± standard-deviation (n=2).

Chapter V
130
transduction (binding, trafficking and delivery of vector genome to the nucleus) per se did
not induce cell death (data not shown).
The decay in cell viability (Figure 2C) should be connected to an adenovirus-specific
programmed cell death. Autophagy, a form of programmed cell death induced by
adenoviruses (39, 40), was therefore evaluated via the detection of LC3-incorporated
autophagosomes. One of the major hallmarks of activation of autophagic process is the
formation of cellular autophagosome puncta containing LC3-II. We found an increase in
LC3-II autophagosomes in HDV+HV-producing cells (Figure 8). While HDV+HV
producing cells presented 16 ± 4 % autophagy-positive cells, ∆E1+HV-producing cells
presented 2 ± 1 %, corresponding to an 8-fold difference. HV-producing cells or mock-
infected cells did not present detectable autophagosome-like structures in the six
analyzed sections. Moreover, the number of autophagosomes per autophagy-positive
cells was higher in cells producing HDV+HV (Figure 8). This indicates that autophagy
was more strongly induced during the production of these vectors.
To determine if cell death was due to the viral cycle progression, the intracellular
environment observed during HDV+HV production (high levels of HV genomes and viral
proteins earlier in time) was induced during ∆E1 production by increasing the MOI of HV
(Figure 9). Forty-eight hpi, cell concentration and viral proteins levels were determined.
Consistent with an increase in viral proteins (Figure 9A), we found a decrease in cell
viability when the HDV+HV production scenario was pursued (Figure 9B). Furthermore,
to analyze the effect of this scenario on production of viral vectors, PP and IP were
Figure 8. Detection of autophagy activation through LC3-integrated autophagosomes (shown as light blue spots) in infected cells 24 hpi. White arrowheads point to LC3B-positive cells with punctuate pattern indicating the integration of LC3 into the autophagosomes. High magnification inset represents the region indicated by the white square. Scale bars, 50 μm and 10 μm for high-magnification inset.

The impact of adenovirus life cycle on the generation of canine helper-dependent vectors
131
quantified in the above mentioned assay (Figure 9B). The results showed a relation
between cell death and low viral particles infectivity (increase in PP:IP ratio). However,
although a 1.7 ± 0.3-fold increase in PP:IP ratio of ∆E1 vectors was obtained when co-
infecting cells with a HV MOI 40, fewer viable cells compared to those observed during
HDV+HV production were observed. Moreover, even under these circumstances, the
decrease in viral particles infectivity did not reach the 4-fold change when comparing
HDV with ∆E1 vectors (Figure 2A).
Figure 9. Production of ∆E1 vectors by inducing the intracellular environment obtained in HDV-producing cells at 48 hpi. The intracellular environment of HDV+HV-producing cells was induced by co-infecting cells with MOI 5 of ∆E1 and increasing MOIs of HV. (A) Western blot of cell extracts to compare production of viral proteins. Cell extracts were normalized to cell concentration and each lane was loaded with same sample volume. Cell extracts of HDV+HV-producing cells were added as a control to show the level of proteins produced under these conditions. Image corresponds to a single membrane and was processed as described previously (B) Fold-change on viable cell concentration and physical to infectious particles (PP:IP) ratio relative to co-infection with MOI 1 of HV. Values are shown as average ± standard-deviation (n=2).
Chapter V
132
4. Discussion
The production of helper-dependent vectors (HDVs) presents two important bottlenecks:
helper vector (HV) contamination and production yields. Several efforts toward the
reduction of HV contamination (11-15) and the improvement of transfection step (18-20)
have been described, however less attention has been paid to the overall production of
HDV. More specifically, while the interest in canine adenovirus type 2 (CAV-2) vectors for
gene therapy increases (8, 9), understanding canine HDV productivities is important to
accomplish a consistent production system, streamline the bioprocess and debottleneck
high quality preparations.
Despite the difficulty in comparing the titers described in the literature, due to the use
different protocols, vectors and samples purity, cell specific productivity of HD CAV-2
vectors (~105 physical particles/cell (Figure 2A)) was similar to the production yields
reported for human HDV (14, 21, 22). On the other hand, a ~4-fold decrease in infectious
particles of HDV was observed when compared to ∆E1 control vectors (Figure 2A).
Canine HDV preparations with higher physical to infectious particle (PP:IP) ratios than
those obtained with ∆E1 vectors, being already reported (4, 9), were consistently
obtained in our hands (data not shown). Some studies show a relatively high and/or
inconsistent PP:IP ratios among different preparations of same human HDV (14, 23).
Special attention must be paid to this, as the PP:IP ratio of clinical grade adenoviruses is
limited by Food and Drug Administration. In addition, we found a reduction in HDV
volumetric productivity related with an higher producer cell death (Figure 2C,D).
To further understand the limitations in HDV amplification we analyzed virus cycle
during vectors production. We found that HDV has a distinct viral cycle progression,
which impaired producer cell homeostasis and vector production and quality.
Despite similar internalization and nuclear delivery (Figure 3), a faster vector genome
replication of HV from 9 hpi onwards was obtained during the co-infection of HDV+HV
(Figures 3D and 4B). Any HV-specific effect was ruled out because this was not observed
in HV-producing cells (Figure 1A-iii). Although an increase in HV genome replication was
observed during co-infection with ∆E1 vector production (Figure 1A-ii), HV genome
replication was even faster in HDV+HV-producing cells (Figure 1A-i). The viral proteins
involved in adenovirus genome replication, DNA-binding protein (DBP), adenoviral DNA
polymerase (Adpol) and pre-terminal protein (pTP) belong to E2 transcription unit (34).
Indeed, an upregulation of subunit E2B products was observed in HDV-producing cells

The impact of adenovirus life cycle on the generation of canine helper-dependent vectors
133
(Figure 5), which was consistent with the replication profile of HV genome in these
conditions. Why this increase occurred during HDV+HV production, and the mechanism
behind this up-regulation, is still not clear. First, the activation of early phase
transcription is amplified by E1 (E1A) expression (41). However, no differences were
detected in E1 levels in the different infections assayed in this work (data not shown).
The mechanism behind the upregulation of E2B gene products appears to be specific,
because this was not observed in E2A subunit, which share same promoter, or E4. Unlike
HV, the replication profile of HDV genome was more modest and in accordance with that
obtained in ∆E1 control vector infection (Figure 4A). Assuming that genome replication
was upregulated in HDV+HV-producing cells, this might indicate that the stuffer
sequence, besides affecting transgene expression (Figure S1, Appendix) as previously
described (42, 43), may impact HDV genome replication.
Faster HV genome replication contributed to an increase in expression of viral products,
namely IVa2 and late-phase proteins (Figures 5 and 6). IVa2, expressed during DNA
replication, is implicated in the activation of major late promoter during late-phase
infection (36). Thus, upregulation of IVa2 can be correlated with the overexpression of
late-phase transcripts and proteins. Such high levels of viral proteins were likely
responsible for the increase in cell death during HDV+HV production, which
compromised the volumetric productivity (Figures 2C,D). Concomitantly, activation of
cell death was more pronounced in HDV+HV-producing cells, in which autophagy was
evident in these cells (Figure 8). Autophagy, in addition to its role in degradation and
recycling of cellular constituents (44, 45), can act as a form of programmed cell death (46,
47). Recent studies link autophagy to the main mechanisms for adenovirus-mediated cell
lysis (39, 40). This type of programmed cell death was therefore more activated during
HDV+HV production, which might be implicated in a critical physiological state. Still,
autophagy may be necessary for a successful adenovirus replication (40). Together, our
results are in line with the importance of a balanced autophagy activation to pursue both
a sustainable host cell homeostasis and an adequate environment for virus amplification
and maturation.
Consistent with the overall increase in viral protein production in HDV+HV-producing
cells, more viral capsids (empty plus genome-containing) were obtained when compared
to ∆E1+HV-infected cells (Figure 7A). This demonstrates that assembly occurred in
proportion to the viral protein content (Figure 6). Given the similar number of physical
Chapter V
134
(genome-containing) particles between HDV and ∆E1 infection (Figure 2A), this also
indicates that more empty and/or defective particles were obtained during HDV+HV
production. Assembly of adenovirus particles proceeds packaging: the adenovirus
genome, along with packaging proteins, interacts with structural and non-structural
proteins resulting in the formation of a “procapsid” structure with the viral DNA (48).
Then, the genome is encapsidated. The quantification of DNA-containing particles showed
that HDV packaging occurred similarly to control infections (Figure 2A). Empty capsids
and free-viral genomes were obtained in all of the assayed productions schemes (Figure
7). This indicates that a threshold for packaging was obtained, even under higher levels of
viral transcripts involved in packaging, namely IVa2 (Figure 5) (37), L1 52/55K (49), L4
22K (50) and IIIa (51), as observed during HDV+HV production (data not shown).
Together, these observations raise the hypothesis that post-transcriptional events or the
levels of host cell factors, such as P-complex (52), might influence genome packaging in a
rate limiting manner.
Following assembly and packaging, adenovirus undergoes a final maturation step driven
by the virus encoded protease. This process, involving the cleavage of several viral
proteins and increased by the presence of two co-factors (C-terminal of pVI and viral
dsDNA) renders virus particles infectious (28, 53). High levels of pVI and protease
transcripts were obtained during HDV+HV production (Figure 5), however the low
infectious titer of these vectors suggests a defect in capsid maturation. On the other hand,
late phase viral proteins produced earlier might compromise cell homeostasis and the
success of virus replication progress. For instance, protease is also responsible for the
cleavage of cell cytokeratin system, weakening mechanical integrity of the cell and
promoting host cell lysis late in infection (54). Thus, such high levels of protease earlier
(or any late-phase product) might contribute to impaired cell integrity in a way that
maturation step is not fully accomplished. Taking this into account, we hypothesized a
link between cell death/physiological state imposed by HDV infection and impaired virus
maturation. To test this possibility, an intracellular environment similar to HDV+HV
producing cells was induced in ∆E1 producing cells. Similar protein levels and cell death
profiles to those obtained during HDV production were detected using this strategy
(Figure 9), consistent with a correlation of cell death with viral protein content.
However, the impact of earlier cell death on virus maturation is only partial, because the
differences in ∆E1 infectivity (PP:IP ratio) (Figure 9B) did not reach the 4-fold decrease
The impact of adenovirus life cycle on the generation of canine helper-dependent vectors
135
observed in HDV (Figure 2A). This suggests that the physiological state of HDV+HV-
producing cells was not fully simulated using the increasing HV MOI strategy. In fact,
higher levels of autophagosomes were always obtained in HDV+HV-producing cells, even
in cells co-infected with ΔE1 and HV at MOI 40 (data not shown), which supports the
hypothesis of a HDV-specific interaction with producer cell. In addition, other intrinsic
feature of HDV might also be implicated in maturation and viral particles infectivity. The
maturation process is thought to be independent of DNA sequence (27), thus the effect of
HDV genome sequence should be ruled out. However, it is not known how viral genome
structurally interacts with core proteins, and if that affects viral capsid assembly and
subsequent maturation. In the light of these results, the role of stuffer sequence and the
clarification of HDV structure would be important to understand any connection with
viral particle maturation state (26).
In summary, in HDV+HV-producing cells viral genome replication occurred faster, leading
to higher levels of late region proteins. Such high viral protein content was consistent
with increased cell death observed during production. Despite similar cell-specific
productivities of total HDV and ∆E1 virions, infectious to physical particles ratios
obtained in HDV were 4-times lower, indicating lower infectivity. Increased levels of
empty capsids and defective particles interfere with the infectious titers. Therefore,
factors affecting the maturation process should be involved. For instance, it is likely that
the cell physiological state contributed to reduced vectors infectivity. Nevertheless, a
particular feature of HDV must be further affecting its maturation, which would fully
explain the differences in infectious titers.
This work identifies faster genome replication, viral protein synthesis, higher production
of defective particles and lower maturation as bottlenecks in helper-dependent CAV-2
production, highlighting the effect of vector design on the virus replication cycle and
virus-cell interaction as an important feature to understand the viral vector productive
outcome.
5. Acknowledgements and author contribution
We thank Sandy Ibanes and Aurelie Gennetier for the initial preparations of CAV-2
vectors, Francisca Monteiro, Vanessa Bandeira and Rute Castro for technical support.
This work was supported by Fundação para a Ciência e a Tecnologia (FCT) – Portugal,
through the project PTDC/EBB-BIO/118615/2010, and European Commission through

Chapter V
136
FP7 project BrainCAV (222992). Paulo Fernandes acknowledges FCT for his Ph.D. grant
(SFRH/BD/70810/2010).
Paulo Fernandes conceived the experimental setup and design, performed the
experiments, analyzed the data and wrote the chapter.
6. References
1. Lowenstein, P. R., R. J. Mandel, W. D. Xiong, K. Kroeger, and M. G. Castro. 2007. Immune responses to adenovirus and adeno-associated vectors used for gene therapy of brain diseases: the role of immunological synapses in understanding the cell biology of neuroimmune interactions. Curr Gene Ther 7:347-360.
2. Kremer, E. J., S. Boutin, M. Chillon, and O. Danos. 2000. Canine adenovirus vectors: an alternative for adenovirus-mediated gene transfer. J Virol 74:505-512.
3. Perreau, M., and E. J. Kremer. 2005. Frequency, proliferation, and activation of human memory T cells induced by a nonhuman adenovirus. J Virol 79:14595-14605.
4. Keriel, A., C. Rene, C. Galer, J. Zabner, and E. J. Kremer. 2006. Canine adenovirus vectors for lung-directed gene transfer: efficacy, immune response, and duration of transgene expression using helper-dependent vectors. J Virol 80:1487-1496.
5. Perreau, M., F. Mennechet, N. Serratrice, J. N. Glasgow, D. T. Curiel, H. Wodrich, and E. J. Kremer. 2007. Contrasting effects of human, canine, and hybrid adenovirus vectors on the phenotypical and functional maturation of human dendritic cells: implications for clinical efficacy. J Virol 81:3272-3284.
6. Soudais, C., C. Laplace-Builhe, K. Kissa, and E. J. Kremer. 2001. Preferential transduction of neurons by canine adenovirus vectors and their efficient retrograde transport in vivo. Faseb J 15:2283-2285.
7. Soudais, C., N. Skander, and E. J. Kremer. 2004. Long-term in vivo transduction of neurons throughout the rat CNS using novel helper-dependent CAV-2 vectors. FASEB J 18:391-393.
8. Cubizolle, A., N. Serratrice, N. Skander, M. A. Colle, S. Ibanes, A. Gennetier, N. Bayo-Puxan, K. Mazouni, F. Mennechet, B. Joussemet, Y. Cherel, Y. Lajat, C. Vite, F. Bernex, V. Kalatzis, M. E. Haskins, and E. J. Kremer. 2014. Corrective GUSB Transfer to the Canine Mucopolysaccharidosis VII Brain. Mol Ther 22:762-773.
9. Ariza, L., L. Gimenez-Llort, A. Cubizolle, G. Pages, B. Garcia-Lareu, N. Serratrice, D. Cots, R. Thwaite, M. Chillon, E. J. Kremer, and A. Bosch. 2014. Central Nervous System Delivery of Helper-Dependent Canine Adenovirus Corrects Neuropathology and Behavior in Mucopolysaccharidosis Type VII Mice. Hum Gene Ther 25:199-211.
10. Dormond, E., M. Perrier, and A. Kamen. 2009. From the first to the third generation adenoviral vector: what parameters are governing the production yield? Biotechnol Adv 27:133-144.
11. Ng, P., C. Beauchamp, C. Evelegh, R. Parks, and F. L. Graham. 2001. Development of a FLP/frt system for generating helper-dependent adenoviral vectors. Mol Ther 3:809-815.
12. Umana, P., C. A. Gerdes, D. Stone, J. R. Davis, D. Ward, M. G. Castro, and P. R. Lowenstein. 2001. Efficient FLPe recombinase enables scalable production of helper-dependent adenoviral vectors with negligible helper-virus contamination. Nat Biotechnol 19:582-585.
13. Parks, R. J., L. Chen, M. Anton, U. Sankar, M. A. Rudnicki, and F. L. Graham. 1996. A helper-dependent adenovirus vector system: removal of helper virus by Cre-mediated excision of the viral packaging signal. Proc Natl Acad Sci U S A 93:13565-13570.
14. Gonzalez-Aparicio, M., I. Mauleon, P. Alzuguren, M. Bunuales, G. Gonzalez-Aseguinolaza, C. San Martin, J. Prieto, and R. Hernandez-Alcoceba. 2011. Self-
The impact of adenovirus life cycle on the generation of canine helper-dependent vectors
137
inactivating helper virus for the production of high-capacity adenoviral vectors. Gene Ther 18:1025-1033.
15. Alba, R., P. Hearing, A. Bosch, and M. Chillon. 2007. Differential amplification of adenovirus vectors by flanking the packaging signal with attB/attP-PhiC31 sequences: implications for helper-dependent adenovirus production. Virology 367:51-58.
16. Soudais, C., S. Boutin, and E. J. Kremer. 2001. Characterization of cis-acting sequences involved in canine adenovirus packaging. Mol Ther 3:631-640.
17. Kanegae, Y., M. Ishimura, S. Kondo, and I. Saito. 2012. Influence of loxP insertion upstream of the cis-acting packaging domain on adenovirus packaging efficiency. Microbiol Immunol 56:447-455.
18. Hartigan-O'Connor, D., A. Amalfitano, and J. S. Chamberlain. 1999. Improved production of gutted adenovirus in cells expressing adenovirus preterminal protein and DNA polymerase. J Virol 73:7835-7841.
19. Dormond, E., A. Meneses-Acosta, D. Jacob, Y. Durocher, R. Gilbert, M. Perrier, and A. Kamen. 2009. An efficient and scalable process for helper-dependent adenoviral vector production using polyethylenimine-adenofection. Biotechnol Bioeng 102:800-810.
20. Ibanes, S., and E. J. Kremer. 2013. Canine Adenovirus Type 2 Vector Generation via I-Sce1-Mediated Intracellular Genome Release. PLoS One 8:e71032.
21. Palmer, D., and P. Ng. 2003. Improved system for helper-dependent adenoviral vector production. Mol Ther 8:846-852.
22. Suzuki, M., R. Cela, C. Clarke, T. K. Bertin, S. Mourino, and B. Lee. 2010. Large-scale production of high-quality helper-dependent adenoviral vectors using adherent cells in cell factories. Hum Gene Ther 21:120-126.
23. Kreppel, F., V. Biermann, S. Kochanek, and G. Schiedner. 2002. A DNA-based method to assay total and infectious particle contents and helper virus contamination in high-capacity adenoviral vector preparations. Hum Gene Ther 13:1151-1156.
24. Flint, S. J., L. W. Enquist, V. R. Racaniello, and A. M. Skalka. 2004. Principles of virology: molecular biology, pathogenesis, and control of animal viruses, 2nd ed. ASM Press, Washington, DC.
25. Greber, U. F., M. Suomalainen, R. P. Stidwill, K. Boucke, M. W. Ebersold, and A. Helenius. 1997. The role of the nuclear pore complex in adenovirus DNA entry. EMBO J 16:5998-6007.
26. Perez-Berna, A. J., A. Ortega-Esteban, R. Menendez-Conejero, D. C. Winkler, M. Menendez, A. C. Steven, S. J. Flint, P. J. de Pablo, and C. San Martin. 2012. The role of capsid maturation on adenovirus priming for sequential uncoating. J Biol Chem 287:31582-31595.
27. Graziano, V., W. J. McGrath, M. Suomalainen, U. F. Greber, P. Freimuth, P. C. Blainey, G. Luo, X. S. Xie, and W. F. Mangel. 2013. Regulation of a viral proteinase by a peptide and DNA in one-dimensional space: I. binding to DNA AND to hexon of the precursor to protein VI, pVI, of human adenovirus. J Biol Chem 288:2059-2067.
28. Blainey, P. C., V. Graziano, A. J. Perez-Berna, W. J. McGrath, S. J. Flint, C. San Martin, X. S. Xie, and W. F. Mangel. 2013. Regulation of a viral proteinase by a peptide and DNA in one-dimensional space: IV. viral proteinase slides along DNA to locate and process its substrates. J Biol Chem 288:2092-2102.
29. Fernandes, P., V. M. Santiago, A. F. Rodrigues, H. Tomas, E. J. Kremer, P. M. Alves, and A. S. Coroadinha. 2013. Impact of E1 and Cre on adenovirus vector amplification: developing MDCK CAV-2-E1 and E1-Cre transcomplementing cell lines. PLoS One 8:e60342.
30. Kramberger, P., M. Ciringer, A. Strancar, and M. Peterka. 2012. Evaluation of nanoparticle tracking analysis for total virus particle determination. Virology journal 9:265.
31. Serra, M., S. B. Leite, C. Brito, J. Costa, M. J. Carrondo, and P. M. Alves. 2007. Novel culture strategy for human stem cell proliferation and neuronal differentiation. Journal of neuroscience research 85:3557-3566.
Chapter V
138
32. Salinas, S., L. G. Bilsland, D. Henaff, A. E. Weston, A. Keriel, G. Schiavo, and E. J. Kremer. 2009. CAR-associated vesicular transport of an adenovirus in motor neuron axons. PLoS pathogens 5:e1000442.
33. Kamen, A., and O. Henry. 2004. Development and optimization of an adenovirus production process. J Gene Med 6:184-192.
34. Swaminathan, S., and B. Thimmapaya. 1995. Regulation of Adenovirus E2 Transcription Unit, p. 177-194. In W. Doerfler and P. Böhm (ed.), The Molecular Repertoire of Adenoviruses III, vol. 199/3. Springer Berlin Heidelberg.
35. Weber, J. 1976. Genetic analysis of adenovirus type 2 III. Temperature sensitivity of processing viral proteins. J Virol 17:462-471.
36. Tribouley, C., P. Lutz, A. Staub, and C. Kedinger. 1994. The product of the adenovirus intermediate gene IVa2 is a transcriptional activator of the major late promoter. J Virol 68:4450-4457.
37. Zhang, W., J. A. Low, J. B. Christensen, and M. J. Imperiale. 2001. Role for the adenovirus IVa2 protein in packaging of viral DNA. J Virol 75:10446-10454.
38. Altaras, N. E., J. G. Aunins, R. K. Evans, A. Kamen, J. O. Konz, and J. J. Wolf. 2005. Production and formulation of adenovirus vectors. Adv Biochem Eng Biotechnol 99:193-260.
39. Jiang, H., E. J. White, C. I. Rios-Vicil, J. Xu, C. Gomez-Manzano, and J. Fueyo. 2011. Human adenovirus type 5 induces cell lysis through autophagy and autophagy-triggered caspase activity. J Virol 85:4720-4729.
40. Rodriguez-Rocha, H., J. G. Gomez-Gutierrez, A. Garcia-Garcia, X. M. Rao, L. Chen, K. M. McMasters, and H. S. Zhou. 2011. Adenoviruses induce autophagy to promote virus replication and oncolysis. Virology 416:9-15.
41. Nevins, J. R. 1987. Regulation of early adenovirus gene expression. Microbiological reviews 51:419-430.
42. Ross, P. J., M. A. Kennedy, and R. J. Parks. 2009. Host cell detection of noncoding stuffer DNA contained in helper-dependent adenovirus vectors leads to epigenetic repression of transgene expression. J Virol 83:8409-8417.
43. Parks, R. J., J. L. Bramson, Y. Wan, C. L. Addison, and F. L. Graham. 1999. Effects of stuffer DNA on transgene expression from helper-dependent adenovirus vectors. J Virol 73:8027-8034.
44. Ohsumi, Y. 2001. Molecular dissection of autophagy: two ubiquitin-like systems. Nature reviews. Molecular cell biology 2:211-216.
45. Levine, B., and D. J. Klionsky. 2004. Development by self-digestion: molecular mechanisms and biological functions of autophagy. Developmental cell 6:463-477.
46. Baehrecke, E. H. 2005. Autophagy: dual roles in life and death? Nature reviews. Molecular cell biology 6:505-510.
47. Gozuacik, D., and A. Kimchi. 2007. Autophagy and cell death. Current topics in developmental biology 78:217-245.
48. Ostapchuk, P., and P. Hearing. 2005. Control of adenovirus packaging. Journal of cellular biochemistry 96:25-35.
49. Perez-Romero, P., K. E. Gustin, and M. J. Imperiale. 2006. Dependence of the encapsidation function of the adenovirus L1 52/55-kilodalton protein on its ability to bind the packaging sequence. J Virol 80:1965-1971.
50. Ostapchuk, P., M. E. Anderson, S. Chandrasekhar, and P. Hearing. 2006. The L4 22-kilodalton protein plays a role in packaging of the adenovirus genome. J Virol 80:6973-6981.
51. Ma, H. C., and P. Hearing. 2011. Adenovirus structural protein IIIa is involved in the serotype specificity of viral DNA packaging. J Virol 85:7849-7855.
52. Erturk, E., P. Ostapchuk, S. I. Wells, J. Yang, K. Gregg, A. Nepveu, J. P. Dudley, and P. Hearing. 2003. Binding of CCAAT displacement protein CDP to adenovirus packaging sequences. J Virol 77:6255-6264.

The impact of adenovirus life cycle on the generation of canine helper-dependent vectors
139
53. Mangel, W. F., W. J. McGrath, D. L. Toledo, and C. W. Anderson. 1993. Viral DNA and a viral peptide can act as cofactors of adenovirus virion proteinase activity. Nature 361:274-275.
54. Chen, P. H., D. A. Ornelles, and T. Shenk. 1993. The adenovirus L3 23-kilodalton proteinase cleaves the amino-terminal head domain from cytokeratin 18 and disrupts the cytokeratin network of HeLa cells. J Virol 67:3507-3514.

Chapter V
140

Chapter VI
Discussion and perspectives
Chapter VI
142
Contents
1. Discussion ................................................................................................................................................. 143
1.1. Upstream bioprocess for CAV-2 vectors: from producer cell lines to stirred tank
bioreactors..................................................................................................................................................... 145
1.2. Players and challenges behind canine helper-dependent vectors propagation .... 146
2. Future directions and perspectives .............................................................................................. 148
2.1. Considerations to develop superior adenovirus producer cells ................................... 148
2.2. Improve the performance of cells adapted to suspension............................................... 148
2.3. Bioprocess development for HDV............................................................................................... 149
2.4. Understand the relation between HDV construct, replication profile and
productivity ................................................................................................................................................... 149
2.5. Enhance genome packaging to maximize the generation of CAV-2 vectors ............ 150
3. Final remarks .......................................................................................................................................... 150
4. Author contribution ............................................................................................................................. 151
5. References ................................................................................................................................................ 151
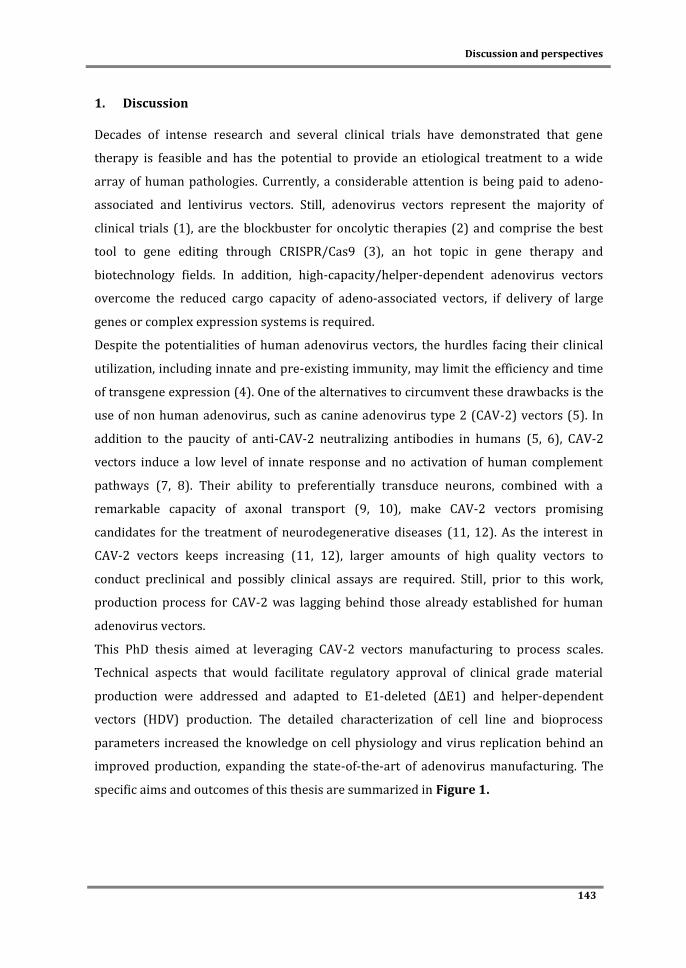
Discussion and perspectives
143
1. Discussion
Decades of intense research and several clinical trials have demonstrated that gene
therapy is feasible and has the potential to provide an etiological treatment to a wide
array of human pathologies. Currently, a considerable attention is being paid to adeno-
associated and lentivirus vectors. Still, adenovirus vectors represent the majority of
clinical trials (1), are the blockbuster for oncolytic therapies (2) and comprise the best
tool to gene editing through CRISPR/Cas9 (3), an hot topic in gene therapy and
biotechnology fields. In addition, high-capacity/helper-dependent adenovirus vectors
overcome the reduced cargo capacity of adeno-associated vectors, if delivery of large
genes or complex expression systems is required.
Despite the potentialities of human adenovirus vectors, the hurdles facing their clinical
utilization, including innate and pre-existing immunity, may limit the efficiency and time
of transgene expression (4). One of the alternatives to circumvent these drawbacks is the
use of non human adenovirus, such as canine adenovirus type 2 (CAV-2) vectors (5). In
addition to the paucity of anti-CAV-2 neutralizing antibodies in humans (5, 6), CAV-2
vectors induce a low level of innate response and no activation of human complement
pathways (7, 8). Their ability to preferentially transduce neurons, combined with a
remarkable capacity of axonal transport (9, 10), make CAV-2 vectors promising
candidates for the treatment of neurodegenerative diseases (11, 12). As the interest in
CAV-2 vectors keeps increasing (11, 12), larger amounts of high quality vectors to
conduct preclinical and possibly clinical assays are required. Still, prior to this work,
production process for CAV-2 was lagging behind those already established for human
adenovirus vectors.
This PhD thesis aimed at leveraging CAV-2 vectors manufacturing to process scales.
Technical aspects that would facilitate regulatory approval of clinical grade material
production were addressed and adapted to E1-deleted (ΔE1) and helper-dependent
vectors (HDV) production. The detailed characterization of cell line and bioprocess
parameters increased the knowledge on cell physiology and virus replication behind an
improved production, expanding the state-of-the-art of adenovirus manufacturing. The
specific aims and outcomes of this thesis are summarized in Figure 1.
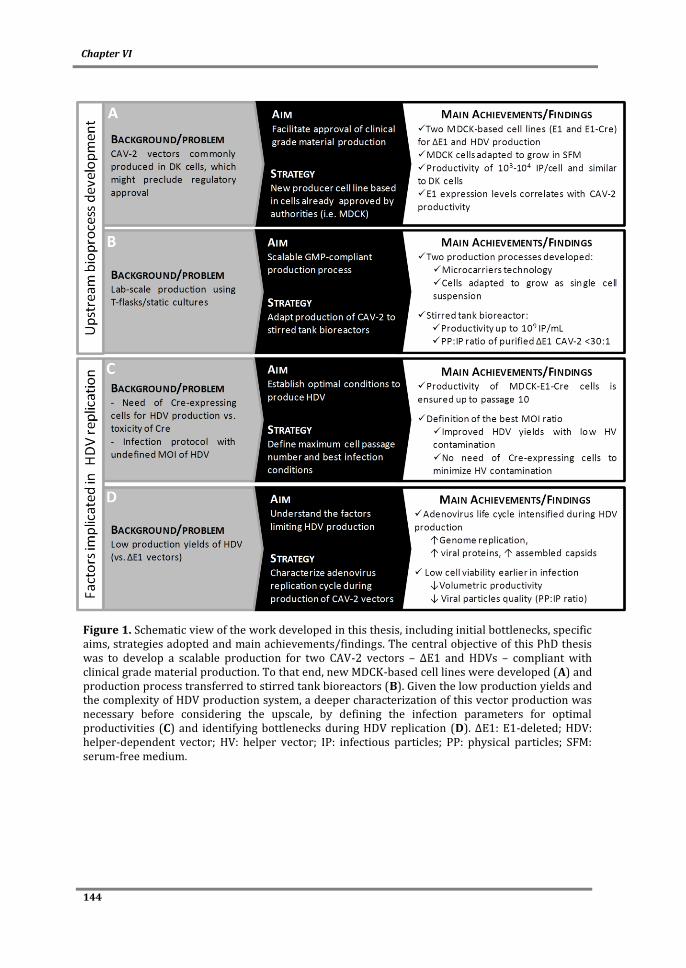
Chapter VI
144
Figure 1. Schematic view of the work developed in this thesis, including initial bottlenecks, specific aims, strategies adopted and main achievements/findings. The central objective of this PhD thesis was to develop a scalable production for two CAV-2 vectors – ΔE1 and HDVs – compliant with clinical grade material production. To that end, new MDCK-based cell lines were developed (A) and production process transferred to stirred tank bioreactors (B). Given the low production yields and the complexity of HDV production system, a deeper characterization of this vector production was necessary before considering the upscale, by defining the infection parameters for optimal productivities (C) and identifying bottlenecks during HDV replication (D). ΔE1: E1-deleted; HDV: helper-dependent vector; HV: helper vector; IP: infectious particles; PP: physical particles; SFM: serum-free medium.
Discussion and perspectives
145
1.1. Upstream bioprocess for CAV-2 vectors: from producer cell lines to stirred tank
bioreactors
CAV-2 vectors were initially developed and produced using dog kidney (DK) cells (11-
13). From the point-of-view of a regulatory approval for clinical material production, the
use of a cell substrate already acknowledged by Food and Drug Administration and
European Medical Agency should be considered. Unlike DK cells, Madin Darby canine
kidney (MDCK) cells represent a suitable cell substrate to facilitate the regulatory
approval for the production of clinical grade CAV-2 vectors, as they are already approved
by the regulatory authorities for vaccines manufacturing (14), Accordingly, we
successfully develop new MDCK-derived cell lines – MDCK-E1 and MDCK-E1-Cre
(Chapter II). These cell lines showed productivity titers as high as those described for
DKZeo and DKCre cells and for human adenovirus producing cell lines (15). In addition,
our MDCK-E1 cell line showed a remarkable stability, maintaining the titers with
increasing cultures passages (Chapter II and Chapter IV).
To meet the need of vectors at larger quantities compliant with good manufacturing
practices, ΔE1 CAV-2 production in MDCK-E1 cells was adapted to stirred tank
bioreactors and serum-free medium. Microcarrier technology, representing the most
common approach to transfer anchorage-dependent cells to stirred culture systems, was
used to develop the first bioprocess for CAV-2 vectors (Chapter III, part A). The CAV-2
productivities of 2×10³ IP/cell obtained in 2 L scale vessels were similar to monolayer
static cultures. Despite these advances, a competitive CAV-2 bioprocess should meet the
features already accomplished for human adenoviruses, i.e. producing vectors with cells
adapted to suspension (15). By changing culture medium to a specific serum-free
formulation (16), MDCK-E1 cell line was successfully adapted to grow in suspension as
single cells (Chapter III, part B). However, productivities were ~5-fold (between 3- and
8-fold) lower than those from bioreactor microcarrier cultures. Despite the lower titers,
single cells suspension cultures contributes to streamline CAV-2 production process. For
instance, the additional costs and processing steps associated with microcarriers
preparation, adherent cell expansion and monitoring are now abolished. Therefore, it will
be worth to explore the performance of the new suspension-adapted MDCK-E1 cells to
meet the titers normally accomplished. This would greatly improve the cost-effectiveness
of the final CAV-2 bioprocess.
Chapter VI
146
1.2. Players and challenges behind canine helper-dependent vectors propagation
Process optimization of ΔE1 vectors is relatively straightforward. However, due to the
complexity of production system, helper-dependent vector (HDV) production is
considered more challenging than ΔE1 vectors. More specifically, producer cells must
express Cre recombinase, which can be toxic to cells (17), and cells need to be infected by
two vectors (HDV and helper vector (HV)). A deeper evaluation of HDV production was
therefore pursued before considering the transfer to stirred cultures and the upscale.
MDCK-E1-Cre cells stability was analyzed, best infection conditions determined and
bottlenecks behind HDV replication identified.
Given Cre genotoxicity (17), it becomes crucial to understand how Cre expression can
affect MDCK-E1-Cre cell line phenotype in the long term. Indeed, and unlike MDCK-E1
cells, MDCK-E1-Cre cells were less stable with increasing culture passages in what
regards virus production, despite showing reproducible growth profiles (Chapter IV).
This indicates that passage number of our Cre-expressing MDCK must be kept to a
minimum to maintain the specific yields. To our knowledge, these findings were never
reported for other HDV production systems. In fact, Cre-expressing HEK293 cells
established by Palmer & Ng (18) were able to keep adenovirus productivities up to 86
passages. However, Cre-expressing HEK293 cells developed by others ceased to
proliferate (19). In the light of these contradictory observations, the evaluation of the
different Cre-expressing cells established for HDV production (20) should be pursued to
understand how host cell and/or cell clone is implicated in the impact that Cre has on the
resulting cell performance.
Multiple amplification steps are needed to rescue HDV amplification to its maximum and
prepare sufficient quantities of vector. This increases the chance of recombination
between HDV and HV. In fact, the excised DNA from HV after Cre activity greatly
contributes to recombination between vectors (21). To minimize this, the levels of
excised HV genomes and/or HV genome excision should be reduced in the sequential
amplifications of HDV. We found a simple way to do this by adjusting the HDV/HV MOI
ratio used to infect cells. High HDV/HV MOI ratio was sufficient to maintain HDV yields
and minimize HV levels. In fact, under such MOI ratio, HV contamination was similar in
MDCK-E1 or MDCK-E1-Cre cells (Chapter IV). This indicates the possibility to produce
HDV with low HV levels without the need of Cre-expressing cells and, therefore, avoiding
HV genome excision. Accordingly, as soon as HDV titers permit the establishment of such
Discussion and perspectives
147
MOI ratio (usually after rescue step and 1st amplification), the subsequent amplifications
can be moved to MDCK-E1 cells.
Even under optimized conditions, the production yields of canine HDV were 4-times
lower than those obtained for ΔE1 vectors. To identify the cause of this observation, we
evaluated HDV replication from an adenovirus life cycle perspective, i.e. by characterizing
the steps comprising the generation of adenovirus particles (Chapter V). Several steps
were intensified during HDV propagation, including genome replication, expression of
viral products and assembly of viral particles. This not only affected cell viability after
infection but also compromised HDV infectivity and volumetric titers. Such observations
were not found with other CAV-2 vectors, indicating a specific vector/cell interaction
during HDV propagation. The relation between vector construct and replication profile
should be thus elucidated to understand these observations and debottleneck higher
titers of HDV.
Similarly to what was done to ΔE1 CAV-2 (Chapter III), HDV production was tested in
stirred tank bioreactors with microcarriers technology and MDCK-E1-Cre cells were
subjected to suspension adaptation. In the first approach, high cell death after infection
and very low volumetric titers (106 – 107 IP/mL) were obtained (data not shown), which
corroborates the findings of Chapter V. Secondly, we were unable to adapt MDCK-E1-Cre
cells to suspension using the approach described on Chapter III, Part B: cell viability
consistently decreased during adaptation until no more viable cells were observed. This
indicates that Cre expression indeed makes cells more susceptible to manipulation and
death. Higher volumetric titers and MDCK-E1-Cre cells adapted to suspension should be
pursued to develop a robust production process for canine HDV in stirred tank
bioreactors.
Despite not succeeding in establishing a production process for HDV with high yields, this
thesis contributes to the i) definition of critical infection parameters for an improved HDV
production and ii) identification of the biological factors that should be modulated in the
future to debottleneck HDV at higher titers and with improved quality.
Chapter VI
148
2. Future directions and perspectives
The accomplishments and findings of this work (Figure 1) raised further aspects and
questions to be explored in the pursuit of an improved production process for CAV-2
vectors but also for other adenovirus vectors.
2.1. Considerations to develop superior adenovirus producer cells
While adenovirus producing cell clone selection is typically based on virus titers
screening, additional aspects behind cell performance should be undertaken to tune the
selection of more promising clones. In fact, a clear correlation between E1 (mostly E1A)
expression levels and CAV-2 production was observed during cell line development and
clone characterization (Chapter II), which corroborates the importance of evaluating E1
levels when screening and developing adenovirus producer cells. Accordingly, it is worth
to explore if attaining expression levels of E1 higher than those achieved up to now can
further increase CAV-2 titers.
2.2. Improve the performance of cells adapted to suspension
The accomplishment of adapting MDCK-E1 cells to suspension (Chapter III, part B)
contribute to the development of a cost-effective CAV-2 bioprocess. Still, the adapted
MDCK-E1 cells decreased their specific productivity in ~5-fold, when compared to those
previously obtained (Chapter II and Chapter III, part A). From the manufacturing
perspective, higher volumetric titers should be thus pursued in these cultures. One
possibility is testing other culture media commercially available that might allow higher
virus replication. Despite easy to evaluate, the success of new culture media delivering
higher titers is limited. In addition, any information on what is actually critical for
adenovirus replication in this scenario would remain unknown. One should regard the
changes in membrane receptors and signaling pathways that a cell is challenged to evolve
from an adherent phenotype to a suspension environment (22), while avoiding anoikis
(23). Therefore, understanding what changes MDCK-E1 went through and how they affect
virus production is of upmost importance, namely by studying the transcriptome of
MDCK-E1 producing cell in adherent versus suspension cultures. Besides the scientific
relevance of such findings, this information would be extremely helpful to improve cell
performance in a more targeted orientation.

Discussion and perspectives
149
2.3. Bioprocess development for HDV
MDCK-E1-Cre cells growing in suspension would be important to transfer production
process to stirred tank bioreactors. An adaptation procedure more gradual than that
performed (Chapter III, part B) can be explored for MDCK-E1-Cre cells. However, if Cre
recombinase is actually impairing cell survival during adaptation process as
hypothesized, an inducible expression system to control Cre expression in cells adapted
to suspension must be considered. Nevertheless, using what we accomplished so far, we
can propose a production protocol with rescue step (vector genome transfection) and
initial amplifications with MDCK-E1-Cre cells in adherent cultures. After obtaining
sufficient HDV, and since high HDV/HV ratio is sufficient to minimize HV contamination
(Chapter IV), HDV production can be moved to MDCK-E1 cells in stirred tank
bioreactors.
Aiming to develop a complete bioprocess for HDV vectors, the downstream processing
should be also envisaged. From a scalable perspective, chromatographic columns are the
typical choice for purification processes. However, such technology is incompatible with
the need of removing HV from HDV. One possibility to circumvent this is developing and
using self-inactivating HVs, as described by Gonzalez-Aparicio et al (24). Following this
approach, the HV contamination would be already avoided during HDV production, and
downstream process could be similar to any ΔE1 vector (25, 26).
2.4. Understand the relation between HDV construct, replication profile and
productivity
The HDV titers and quality are constraining a high yield, cost-effective production
process. Besides low infectivity, HDV showed a distinct replication profile resulting in
high cell death and low volumetric titers (Chapter V). These observations suggest a
specific HDV-producer cell interaction, as this was not observed for other CAV-2 vectors.
In the light of these results, it would be important to understand how vector construct
impacts its replication and producer cell homeostasis. Unlike ΔE1 vectors, HDV genome
harbors stuffer DNA sequences to bring the genome size to its normal and be properly
packaged. Therefore, it is important to evaluate the effect of different HDV constructs, i.e.
different stuffer DNA sequences, on replication profile and infectivity. If the replication
profile would indeed be extended to the different HDV constructs, HDV replication and
cell death must be delayed to improve volumetric titers and hopefully viral particles
Chapter VI
150
quality. For instance, cell survival after infection can be improved by expressing higher
levels of E1B (Chapter II) or other anti-apoptotic genes.
2.5. Enhance genome packaging to maximize the generation of CAV-2 vectors
Besides assembled genome-containing capsids, empty capsids are typically obtained after
adenovirus production (27). At the same time, 60-80% of free viral genomes were
observed at the end of production for both HDV and ΔE1 vectors (Chapter V). Together,
this shows that genome packaging constitutes a bottleneck during CAV-2 vectors
production. These observations also indicate enhancing packaging efficiency as a
potential approach to generate higher number of CAV-2 vectors. This can be explored by
manipulating cell and viral factors involved in packaging (28-32) and/or provide more
time for this process to occur by delaying cell lysis. Worth mentioning that adenovirus
particle generation is an orchestrated process, and the adenovirus life cycle steps
following packaging should occur accordingly. For instance, it will be crucial to ensure
that maturation step, which brings infectivity to adenoviruses, is not restricted to a
limited number of CAV-2 particles, i.e. is capable to process an increasing number of viral
particles.
3. Final remarks
This PhD thesis contributes to the progress of gene therapy by enlarging the repertoire of
vectors ready for clinical applications, merging biotechnology with virology and cell
biology areas. Upstream bioprocesses for CAV-2 vectors that meet the technical aspects
for process transfer and clinical grade production were accomplished. At the same time,
important features behind optimal cell performance and virus replication were identified.
Together, this work improved the state-of-the-art on adenovirus vectors manufacturing
and raised future perspectives on how adenovirus productivity can be further enhanced.

Discussion and perspectives
151
4. Author contribution
Paulo Fernandes wrote the chapter.
5. References
1. Ginn, S. L., I. E. Alexander, M. L. Edelstein, M. R. Abedi, and J. Wixon. 2013. Gene therapy clinical trials worldwide to 2012 - an update. J Gene Med 15:65-77.
2. Choi, I. K., and C. O. Yun. 2013. Recent developments in oncolytic adenovirus-based immunotherapeutic agents for use against metastatic cancers. Cancer gene therapy 20:70-76.
3. Holkers, M., I. Maggio, S. F. Henriques, J. M. Janssen, T. Cathomen, and M. A. Goncalves. 2014. Adenoviral vector DNA for accurate genome editing with engineered nucleases. Nat Methods 11:1051-1057.
4. Lowenstein, P. R., R. J. Mandel, W. D. Xiong, K. Kroeger, and M. G. Castro. 2007. Immune responses to adenovirus and adeno-associated vectors used for gene therapy of brain diseases: the role of immunological synapses in understanding the cell biology of neuroimmune interactions. Curr Gene Ther 7:347-360.
5. Kremer, E. J., S. Boutin, M. Chillon, and O. Danos. 2000. Canine adenovirus vectors: an alternative for adenovirus-mediated gene transfer. J Virol 74:505-512.
6. Perreau, M., and E. J. Kremer. 2005. Frequency, proliferation, and activation of human memory T cells induced by a nonhuman adenovirus. J Virol 79:14595-14605.
7. Keriel, A., C. Rene, C. Galer, J. Zabner, and E. J. Kremer. 2006. Canine adenovirus vectors for lung-directed gene transfer: efficacy, immune response, and duration of transgene expression using helper-dependent vectors. J Virol 80:1487-1496.
8. Perreau, M., F. Mennechet, N. Serratrice, J. N. Glasgow, D. T. Curiel, H. Wodrich, and E. J. Kremer. 2007. Contrasting effects of human, canine, and hybrid adenovirus vectors on the phenotypical and functional maturation of human dendritic cells: implications for clinical efficacy. J Virol 81:3272-3284.
9. Soudais, C., C. Laplace-Builhe, K. Kissa, and E. J. Kremer. 2001. Preferential transduction of neurons by canine adenovirus vectors and their efficient retrograde transport in vivo. Faseb J 15:2283-2285.
10. Soudais, C., N. Skander, and E. J. Kremer. 2004. Long-term in vivo transduction of neurons throughout the rat CNS using novel helper-dependent CAV-2 vectors. FASEB J 18:391-393.
11. Cubizolle, A., N. Serratrice, N. Skander, M. A. Colle, S. Ibanes, A. Gennetier, N. Bayo-Puxan, K. Mazouni, F. Mennechet, B. Joussemet, Y. Cherel, Y. Lajat, C. Vite, F. Bernex, V. Kalatzis, M. E. Haskins, and E. J. Kremer. 2014. Corrective GUSB Transfer to the Canine Mucopolysaccharidosis VII Brain. Mol Ther 22:762-773.
12. Ariza, L., L. Gimenez-Llort, A. Cubizolle, G. Pages, B. Garcia-Lareu, N. Serratrice, D. Cots, R. Thwaite, M. Chillon, E. J. Kremer, and A. Bosch. 2014. Central Nervous System Delivery of Helper-Dependent Canine Adenovirus Corrects Neuropathology and Behavior in Mucopolysaccharidosis Type VII Mice. Hum Gene Ther 25:199-211.
13. Bru, T., S. Salinas, and E. J. Kremer. 2010. An update on canine adenovirus type 2 and its vectors. Viruses 2:2134-2153.
14. Doroshenko, A., and S. A. Halperin. 2009. Trivalent MDCK cell culture-derived influenza vaccine Optaflu (Novartis Vaccines). Expert Rev Vaccines 8:679-688.
15. Silva, A. C., C. Peixoto, T. Lucas, C. Kuppers, P. E. Cruz, P. M. Alves, and S. Kochanek. 2010. Adenovirus vector production and purification. Curr Gene Ther 10:437-455.
16. van Wielink, R., H. C. Kant-Eenbergen, M. M. Harmsen, D. E. Martens, R. H. Wijffels, and J. M. Coco-Martin. 2011. Adaptation of a Madin-Darby canine kidney cell line to suspension growth in serum-free media and comparison of its ability to produce avian influenza virus to Vero and BHK21 cell lines. J Virol Methods 171:53-60.
Chapter VI
152
17. Loonstra, A., M. Vooijs, H. B. Beverloo, B. A. Allak, E. van Drunen, R. Kanaar, A. Berns, and J. Jonkers. 2001. Growth inhibition and DNA damage induced by Cre recombinase in mammalian cells. Proc Natl Acad Sci U S A 98:9209-9214.
18. Palmer, D., and P. Ng. 2003. Improved system for helper-dependent adenoviral vector production. Mol Ther 8:846-852.
19. Silver, D. P., and D. M. Livingston. 2001. Self-excising retroviral vectors encoding the Cre recombinase overcome Cre-mediated cellular toxicity. Molecular cell 8:233-243.
20. Kovesdi, I., and S. J. Hedley. 2010. Adenoviral producer cells. Viruses 2:1681-1703. 21. Ahn, M., A. Gamble, S. R. Witting, J. Magrisso, S. Surendran, S. Obici, and N. Morral.
2013. Vector and helper genome rearrangements occur during production of helper-dependent adenoviral vectors. Human gene therapy methods 24:1-10.
22. Jaluria, P., M. Betenbaugh, K. Konstantopoulos, B. Frank, and J. Shiloach. 2007. Application of microarrays to identify and characterize genes involved in attachment dependence in HeLa cells. Metab Eng 9:241-251.
23. Taddei, M. L., E. Giannoni, T. Fiaschi, and P. Chiarugi. 2012. Anoikis: an emerging hallmark in health and diseases. J Pathol 226:380-393.
24. Gonzalez-Aparicio, M., I. Mauleon, P. Alzuguren, M. Bunuales, G. Gonzalez-Aseguinolaza, C. San Martin, J. Prieto, and R. Hernandez-Alcoceba. 2011. Self-inactivating helper virus for the production of high-capacity adenoviral vectors. Gene Ther 18:1025-1033.
25. Fernandes, P., C. Peixoto, V. M. Santiago, E. J. Kremer, A. S. Coroadinha, and P. M. Alves. 2013. Bioprocess development for canine adenovirus type 2 vectors. Gene Ther 20:353-360.
26. Segura, M. M., M. Puig, M. Monfar, and M. Chillon. 2012. Chromatography purification of canine adenoviral vectors. Human gene therapy methods 23:182-197.
27. Altaras, N. E., J. G. Aunins, R. K. Evans, A. Kamen, J. O. Konz, and J. J. Wolf. 2005. Production and formulation of adenovirus vectors. Adv Biochem Eng Biotechnol 99:193-260.
28. Zhang, W., J. A. Low, J. B. Christensen, and M. J. Imperiale. 2001. Role for the adenovirus IVa2 protein in packaging of viral DNA. J Virol 75:10446-10454.
29. Perez-Romero, P., K. E. Gustin, and M. J. Imperiale. 2006. Dependence of the encapsidation function of the adenovirus L1 52/55-kilodalton protein on its ability to bind the packaging sequence. J Virol 80:1965-1971.
30. Ostapchuk, P., M. E. Anderson, S. Chandrasekhar, and P. Hearing. 2006. The L4 22-kilodalton protein plays a role in packaging of the adenovirus genome. J Virol 80:6973-6981.
31. Ma, H. C., and P. Hearing. 2011. Adenovirus structural protein IIIa is involved in the serotype specificity of viral DNA packaging. J Virol 85:7849-7855.
32. Erturk, E., P. Ostapchuk, S. I. Wells, J. Yang, K. Gregg, A. Nepveu, J. P. Dudley, and P. Hearing. 2003. Binding of CCAAT displacement protein CDP to adenovirus packaging sequences. J Virol 77:6255-6264.

Appendix

Appendix
154
Contents
1. Table S1 ..................................................................................................................................................... 155
2. Table S2 ..................................................................................................................................................... 156
3. Table S3 ..................................................................................................................................................... 157
4. Figure S1 ................................................................................................................................................... 158
5. Figure S2 ................................................................................................................................................... 159
6. References ................................................................................................................................................ 160
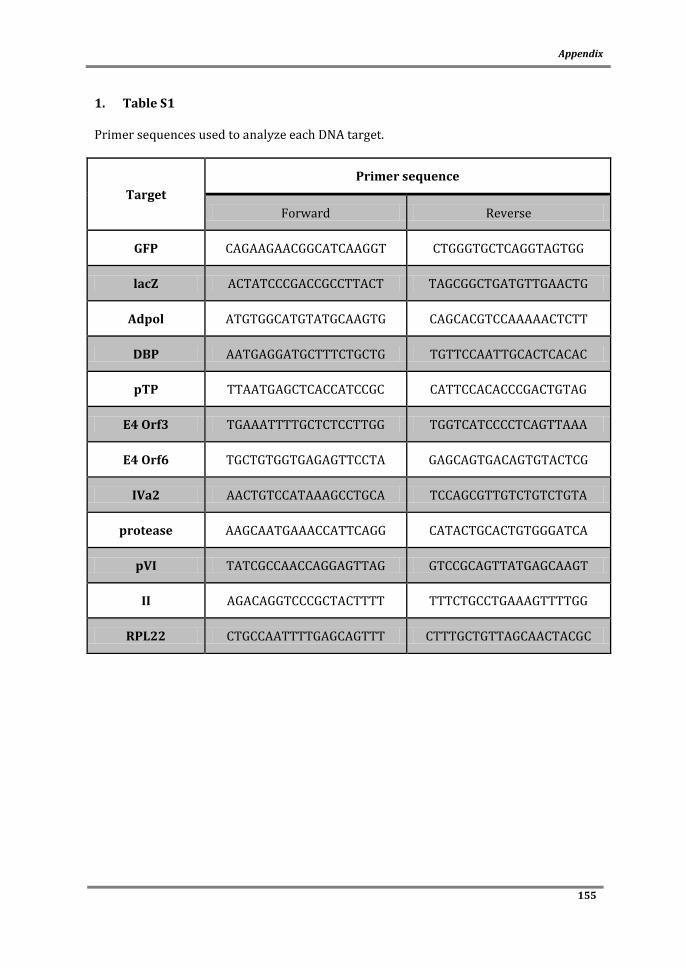
Appendix
155
1. Table S1
Primer sequences used to analyze each DNA target.
Target
Primer sequence
Forward Reverse
GFP CAGAAGAACGGCATCAAGGT CTGGGTGCTCAGGTAGTGG
lacZ ACTATCCCGACCGCCTTACT TAGCGGCTGATGTTGAACTG
Adpol ATGTGGCATGTATGCAAGTG CAGCACGTCCAAAAACTCTT
DBP AATGAGGATGCTTTCTGCTG TGTTCCAATTGCACTCACAC
pTP TTAATGAGCTCACCATCCGC CATTCCACACCCGACTGTAG
E4 Orf3 TGAAATTTTGCTCTCCTTGG TGGTCATCCCCTCAGTTAAA
E4 Orf6 TGCTGTGGTGAGAGTTCCTA GAGCAGTGACAGTGTACTCG
IVa2 AACTGTCCATAAAGCCTGCA TCCAGCGTTGTCTGTCTGTA
protease AAGCAATGAAACCATTCAGG CATACTGCACTGTGGGATCA
pVI TATCGCCAACCAGGAGTTAG GTCCGCAGTTATGAGCAAGT
II AGACAGGTCCCGCTACTTTT TTTCTGCCTGAAAGTTTTGG
RPL22 CTGCCAATTTTGAGCAGTTT CTTTGCTGTTAGCAACTACGC

Appendix
156
2. Table S2
Viral transcripts analyzed and the corresponding infection phase and biological function
on adenovirus amplification.
Target Phase Main Role
Adpol
Early (E2) genome replication (1) DBP
pTP
E4 Orf3
Early (E4) mRNA transport (2, 3)
E4 Orf6
IVa2 Middle and Late Activation of late gene expression (4) and genome
packaging (5)
Protease
Late (L3)
Maturation (6, 7)
pVI
II (hexon)
Capsid protein (2)
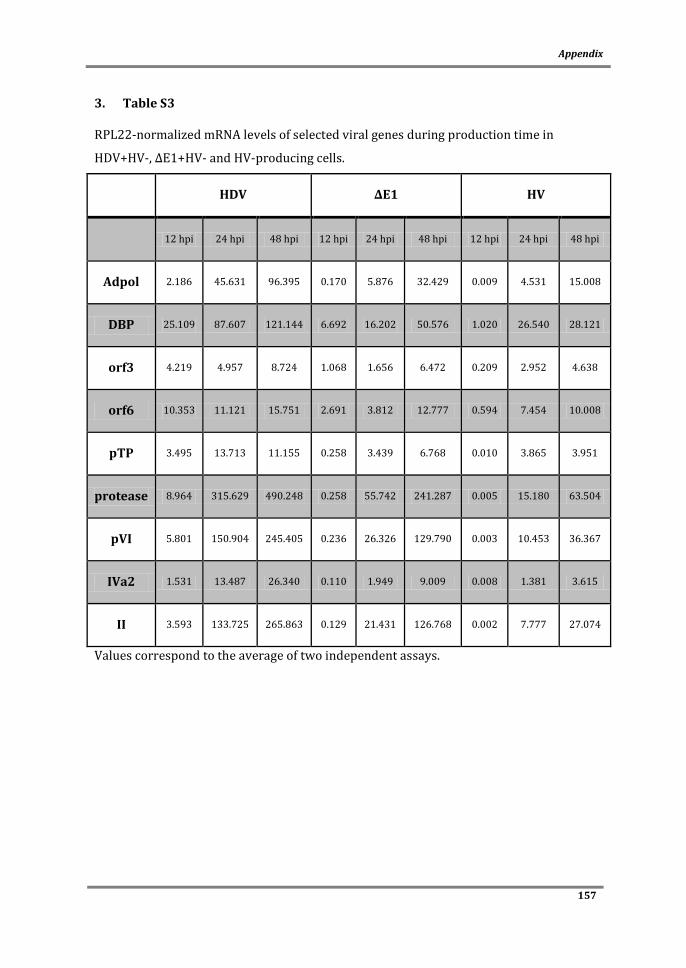
Appendix
157
3. Table S3
RPL22-normalized mRNA levels of selected viral genes during production time in
HDV+HV-, ∆E1+HV- and HV-producing cells.
HDV ∆E1 HV
12 hpi 24 hpi 48 hpi 12 hpi 24 hpi 48 hpi 12 hpi 24 hpi 48 hpi
Adpol 2.186 45.631 96.395 0.170 5.876 32.429 0.009 4.531 15.008
DBP 25.109 87.607 121.144 6.692 16.202 50.576 1.020 26.540 28.121
orf3 4.219 4.957 8.724 1.068 1.656 6.472 0.209 2.952 4.638
orf6 10.353 11.121 15.751 2.691 3.812 12.777 0.594 7.454 10.008
pTP 3.495 13.713 11.155 0.258 3.439 6.768 0.010 3.865 3.951
protease 8.964 315.629 490.248 0.258 55.742 241.287 0.005 15.180 63.504
pVI 5.801 150.904 245.405 0.236 26.326 129.790 0.003 10.453 36.367
IVa2 1.531 13.487 26.340 0.110 1.949 9.009 0.008 1.381 3.615
II 3.593 133.725 265.863 0.129 21.431 126.768 0.002 7.777 27.074
Values correspond to the average of two independent assays.
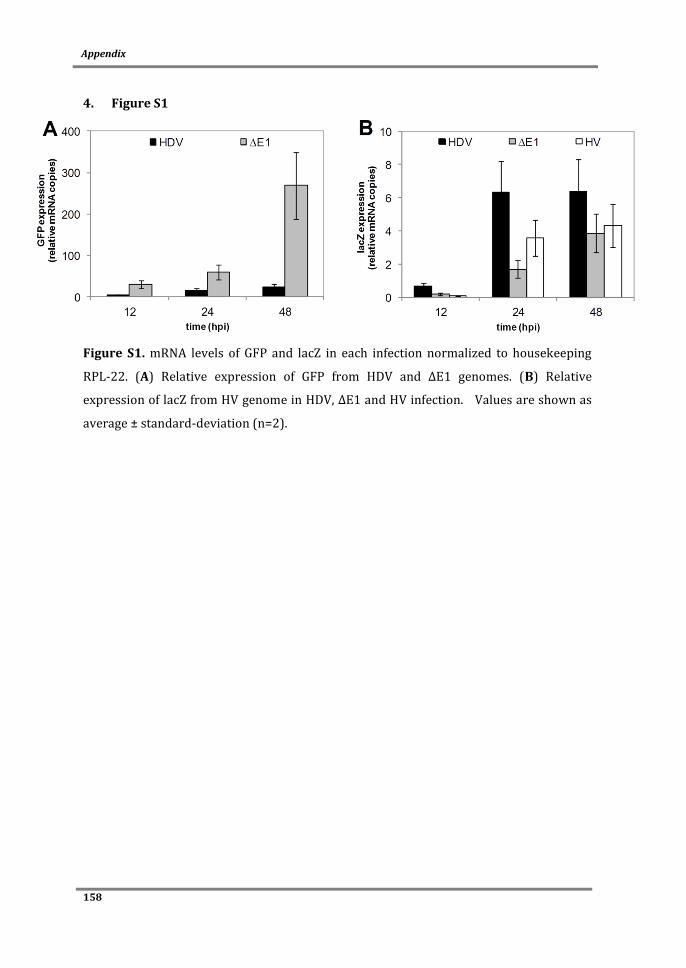
Appendix
158
4. Figure S1
Figure S1. mRNA levels of GFP and lacZ in each infection normalized to housekeeping
RPL-22. (A) Relative expression of GFP from HDV and ∆E1 genomes. (B) Relative
expression of lacZ from HV genome in HDV, ∆E1 and HV infection. Values are shown as
average ± standard-deviation (n=2).
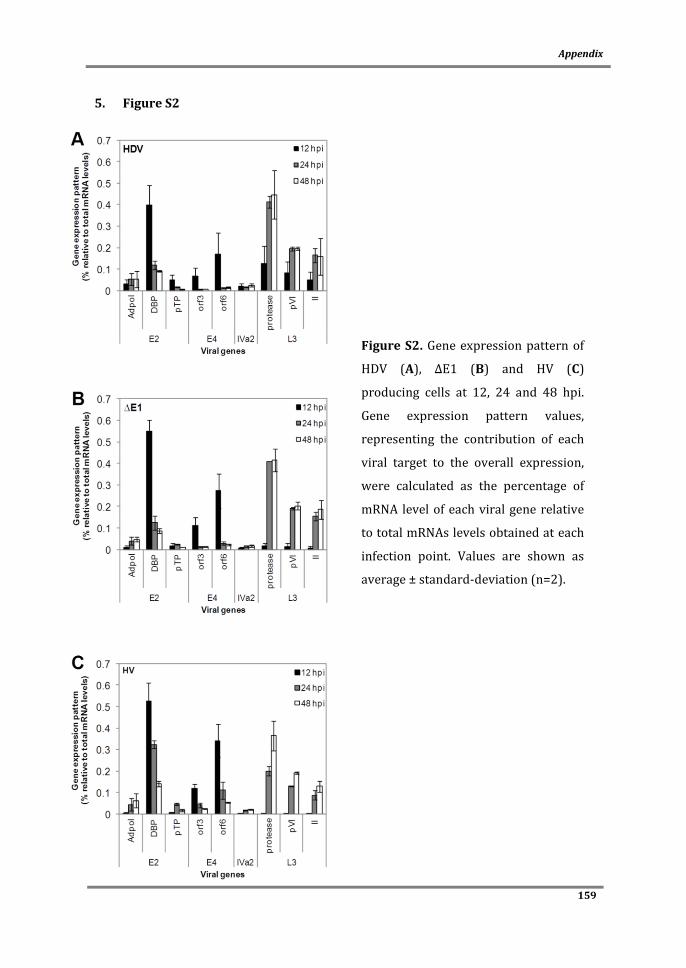
Appendix
159
5. Figure S2
Figure S2. Gene expression pattern of
HDV (A), ∆E1 (B) and HV (C)
producing cells at 12, 24 and 48 hpi.
Gene expression pattern values,
representing the contribution of each
viral target to the overall expression,
were calculated as the percentage of
mRNA level of each viral gene relative
to total mRNAs levels obtained at each
infection point. Values are shown as
average ± standard-deviation (n=2).

Appendix
160
6. References
1. Swaminathan, S., and B. Thimmapaya. 1995. Regulation of Adenovirus E2 Transcription Unit, p. 177-194. In W. Doerfler and P. Böhm (ed.), The Molecular Repertoire of Adenoviruses III, vol. 199/3. Springer Berlin Heidelberg.
2. Russell, W. C. 2000. Update on adenovirus and its vectors. J Gen Virol 81:2573-2604.
3. Weitzman, M. D., and D. A. Ornelles. 2005. Inactivating intracellular antiviral responses during adenovirus infection. Oncogene 24:7686-7696.
4. Tribouley, C., P. Lutz, A. Staub, and C. Kedinger. 1994. The product of the adenovirus intermediate gene IVa2 is a transcriptional activator of the major late promoter. J Virol 68:4450-4457.
5. Zhang, W., J. A. Low, J. B. Christensen, and M. J. Imperiale. 2001. Role for the adenovirus IVa2 protein in packaging of viral DNA. J Virol 75:10446-10454.
6. Weber, J. 1976. Genetic analysis of adenovirus type 2 III. Temperature sensitivity of processing viral proteins. J Virol 17:462-471.
7. Blainey, P. C., V. Graziano, A. J. Perez-Berna, W. J. McGrath, S. J. Flint, C. San Martin, X. S. Xie, and W. F. Mangel. 2013. Regulation of a viral proteinase by a peptide and DNA in one-dimensional space: IV. viral proteinase slides along DNA to locate and process its substrates. J Biol Chem 288:2092-2102.

