april 2020 - psc.state.fl.us
TRANSCRIPT

A p r i l 2 0 2 0

JEA 2020 Ten Year Site Plan Table of Contents
i
Table of Contents
Introduction ................................................................................................................................. 1
1. Description of Existing Facilities ...................................................................................... 2
1.1 Power Supply System Description ....................................................................... 2
System Summary ..................................................................................... 2
Purchased Power ..................................................................................... 3
1.2 Transmission and Distribution .............................................................................. 7
Transmission and Interconnections .......................................................... 7
Transmission System Considerations ....................................................... 7
Transmission Service Requirements ........................................................ 8
Distribution ............................................................................................... 8
1.3 Demand Side Management ............................................................................... 10
Interruptible Load ................................................................................... 10
Demand-Side Management Programs ................................................... 10
1.4 Clean Power and Renewable Energy ................................................................. 12
2. Forecast of Electric Power Demand and Energy Consumption ...................................... 18
2.1 Peak Demand Forecast ..................................................................................... 18
2.2 Energy Forecast ................................................................................................ 18
2.3 Plug-in Electric Vehicle Peak Demand and Energy ............................................ 21
3. Forecast of Facilities Requirements ............................................................................... 28
3.1 Future Resource Needs ..................................................................................... 28
Integrated Resource Planning Study ...................................................... 28
Capacity Needs ...................................................................................... 29
3.2 Resource Plan ................................................................................................... 31
4. Other Planning Assumptions and Information ................................................................ 40
4.1 Fuel Price Forecast ............................................................................................ 40
4.2 Economic Parameters ........................................................................................ 41
Inflation and Escalation Rates ................................................................ 41
Municipal Bond Interest Rate .................................................................. 41
Present Worth Discount Rate ................................................................. 41
Interest During Construction Interest Rate .............................................. 41
Levelized Fixed Charge Rate ................................................................. 41
5. Environmental and Land Use Information ...................................................................... 43

JEA 2020 Ten Year Site Plan Table of Contents
ii
List of Tables and Figures
Table 1: JEA Purchased Power Schedule ................................................................................... 5
Table 2: DSM Portfolio .............................................................................................................. 11
Table 3: DSM Programs ............................................................................................................ 11
Figure 1: Summer Peak Demand History & Forecast ................................................................ 19
Figure 2: Winter Peak Demand History & Forecast ................................................................... 20
Figure 3: Net Energy for Load History & Forecast ..................................................................... 20
Figure 4: Plug-in Electric Vehicles Daily Charge Pattern ........................................................... 21
Table 4a: Resource Needs After Committed Units - Summer .................................................... 29
Table 4b: Resource Needs After Committed Units - Winter ....................................................... 30
Table 5: Resource Plan ............................................................................................................. 31
List of Schedules
Schedule 1: Existing Generating Facilities .................................................................................. 6
Schedule 2.1: History and Forecast of Energy Consumption and Number of Customers .......... 22
Schedule 2.2: History and Forecast of Energy Consumption and Number of Customers .......... 23
Schedule 3.1: History and Forecast of Summer Peak Demand ................................................. 24
Schedule 3.2: History and Forecast of Winter Peak Demand .................................................... 25
Schedule 3.3: History and Forecast of Annual Net Energy For Load ......................................... 26
Schedule 4: Previous Year Actual and Two Year Forecast of Peak Demand and Net
Energy for Load By Month ............................................................................................. 27
Schedule 5: Fuel Requirements ................................................................................................ 32
Schedule 6.1: Energy Sources (GWh) ...................................................................................... 33
Schedule 6.2: Energy Sources (Percent) .................................................................................. 34
Schedule 7.1: Summer Forecast of Capacity, Demand, and Scheduled Maintenance at
Time of Peak ................................................................................................................. 35
Schedule 7.2: Winter Forecast of Capacity, Demand, and Scheduled Maintenance at Time
of Peak .......................................................................................................................... 36
Schedule 8: Planned and Prospective Generating Facility Additions and Changes ................... 37
Schedule 9: Status Report and Specifications of Proposed Generating Facilities ...................... 38
Schedule 10: Status Report and Specification of Proposed Directly Associated
Transmission Lines........................................................................................................ 39

JEA 2020 Ten Year Site Plan List of Abbreviations
iii
List of Abbreviations
Type of Generation Units
CA Combined Cycle – Steam Turbine Portion, Waste Heat Boiler (only)
CC Combined Cycle
CT Combined Cycle – Combustion Turbine Portion
GT Combustion Turbine
FC Fluidized Bed Combustion
IC Internal Combustion
ST Steam Turbine, Boiler, Non-Nuclear
Status of Generation Units
FC Existing generator planned for conversion to another fuel or energy source
M Generating unit put in deactivated shutdown status
P Planned, not under construction
RT Existing generator scheduled to be retired
RP Proposed for repowering or life extension
TS Construction complete, not yet in commercial operation
U Under construction, less than 50% complete
V Under construction, more than 50% complete
Types of Fuel
BIT Bituminous Coal
DFO No. 2 Fuel Oil
RFO No. 6 Fuel Oil
MTE Methane
NG Natural Gas
SUB Sub-bituminous Coal
PC Petroleum Coke
WH Waste Heat
Fuel Transportation Methods
PL Pipeline
RR Railroad
TK Truck
WA Water

JEA 2020 Ten Year Site Plan Introduction
1
Introduction
The Florida Public Service Commission (FPSC) is responsible for ensuring that Florida’s electric
utilities plan, develop, and maintain a coordinated electric power grid throughout the state. The
FPSC must also ensure that electric system reliability and integrity is maintained, that adequate
electricity at a reasonable cost is provided, and that plant additions are cost-effective. In order to
carry out these responsibilities, the FPSC must have information sufficient to assure that an
adequate, reliable, and cost-effective supply of electricity is planned and provided.
The Ten-Year Site Plan (TYSP) provides information and data that will facilitate the FPSC’s
review. This TYSP provides information related to JEA’s power supply strategy to adequately
meet the forecasted needs of our customers for the planning period from January 1, 2020 to
December 31, 2029. This power supply strategy maintains a balance of reliability, environmental
stewardship, and low cost to the consumers.

JEA 2020 Ten Year Site Plan Existing Facilities
2
1. Description of Existing Facilities
1.1 Power Supply System Description
System Summary
JEA is the eighth largest municipally owned electric utility in the United States in terms of number
of customers. JEA’s electric service area covers most of Duval County and portions of Clay and
St. Johns Counties. JEA’s service area covers approximately 900 square miles and serves more
than 450,000 customers.
As of January 1, 2020, JEA consists of two financially separate entities: the JEA Electric System;
and the Robert W. Scherer bulk power system. The total projected net capability of JEA’s
generation system is 3,145 MW for winter and 2,854 MW for summer. Details of the existing
facilities are displayed in TYSP Schedule 1.
The JEA Electric System
The JEA Electric System consists of generating facilities located on four plant sites within the City
of Jacksonville (The City); the J. Dillon Kennedy Generating Station (Kennedy), the Northside
Generating Station (Northside), the Brandy Branch Generating Station (Brandy Branch), and the
Greenland Energy Center (GEC).
Collectively, these plants consist of two dual-fired (petroleum coke/coal) Circulating Fluidized Bed
(CFB) steam turbine-generator units (Northside steam Units 1 and 2); one dual-fired (oil/gas)
steam turbine-generator unit (Northside steam Unit 3); seven dual-fired (gas/diesel) combustion
turbine-generator units (Kennedy GT7 and GT8, GEC GT1 and GT2 and Brandy Branch GT1,
CT2, and CT3); four diesel-fired combustion turbine-generator units (Northside GTs 3, 4, 5, and
6); and one combined cycle heat recovery steam generator unit (Brandy Branch steam Unit 4).
During the spring of 2019, JEA upgraded Brandy Branch units CT2 and CT3. The upgrade
involved the addition of General Electric’s Advanced Gas Path (AGP) and 7FA.05 compressor
modifications to the existing Brandy Branch CT2 and CT3 7FA.03 units. Refer to Schedule 1 for
summer and Winter Net Capability updates.
Robert W. Scherer Bulk Power System
Robert W. Scherer Unit 4 is a coal-fired generating unit with a net output of 846 MW located in
Monroe County, Georgia. Scherer Unit 4 is one of four coal-fired steam units located at the
12,000-acre site near the Ocmulgee River approximately three miles east of Forsyth, Georgia.
JEA and FPL purchased an undivided interest of this unit from Georgia Power Company. JEA
has 23.6 percent (200 net MW) and FPL 76.4 percent ownership interest in Unit 4.

JEA 2020 Ten Year Site Plan Existing Facilities
3
In addition to the purchase of undivided ownership interests in Scherer Unit 4, under the Scherer
Unit 4 Purchase Agreement, JEA and FPL also purchased proportionate undivided ownership
interests in (i) certain common facilities shared by Units 3 and 4 at Plant Scherer, (ii) certain
common facilities shared by Units 1, 2, 3 and 4 at Plant Scherer and (iii) an associated coal
stockpile. Under a separate agreement, JEA also purchased a proportionate undivided ownership
interest in substation and switchyard facilities. JEA has firm transmission service for delivering
the energy output from this unit to JEA’s system.
Purchased Power
1.1.2.1 Trail Ridge Landfill
In 2006, JEA entered into a purchase power agreement (PPA) with Trail Ridge Energy, LLC (TRE)
to purchase energy and environmental attributes from up to 9 net MW of firm renewable
generation capacity utilizing the methane gas from The City’s Trail Ridge landfill located in
western Duval County (the “Phase One Purchase”). The facility was one of the largest landfill
gas-to-energy facilities in the Southeast when it began commercial operation December 6, 2008.
JEA and TRE executed an amendment to this purchase power agreement on March 9, 2011 that
included additional capacity. The “Phase Two Purchase” amendment included up to 9 additional
net MW. Landfill Energy Systems (LES) developed the Sarasota County Landfill in Nokomis,
Florida (up to 6 net MW) to serve part of this Phase Two agreement. This portion of the Phase
Two purchase began February 2015. These landfill gas projects generated 87,561 MWh calendar
year 2019.
1.1.2.2 Jacksonville Solar
In May 2009, JEA entered into a purchase power agreement with Jacksonville Solar, LLC (Jax
Solar) to receive up to 12 MWAC of as-available renewable energy from the solar plant located in
western Duval County. The Jacksonville Solar facility consists of approximately 200,000
photovoltaic panels on a 100-acre site and was forecasted to produce an average of 22,340
megawatt-hours (MWh) of electricity per year. The Jacksonville Solar plant began commercial
operation at full designed capacity September 30, 2010. Jax Solar generated 18,314 MWh
calendar year 2019.
1.1.2.3 Solar Purchase Power Agreements
In 2014, JEA’s Board approved a Solar Photovoltaic Initiative that supports up to 38 additional
MWAC. JEA issued a Solar PV Request For Proposals (RFPs) December 2014 and April 2015 to
solicit PPA proposals to satisfy the adopted 2014 policy. JEA awarded a total of 31.5 MW of solar
PV power purchase contracts with terms of 20-25 years to various vendors. Of the awarded
contracts, only seven agreements were finalized for a total of 27 MW. The last of these seven
projects was completed December 2019.
JEA 2020 Ten Year Site Plan Existing Facilities
4
In October 2017, the JEA Board approved a further solar expansion consisting of five-50 MWAC
solar facilities to be constructed on JEA-owned property. These projects, totaling 250 MWAC, are
structured as PPAs. A Request for Qualifications to select the vendors was issued and a vendor
short list was announced November 2017. The RFP for the facilities was released to the short
listed vendors on January 2, 2018. JEA received and evaluated 50 proposals that conformed to
the requirements of the RFP. JEA awarded the contracts to EDF Renewables Distributed
Solutions on April 26, 2018. JEA negotiated and executed the contracts with EDF the first quarter
2019. JEA will purchase the produced energy and the associated environmental attributes from
each facility. Beaver Street Solar Center, Cecil Commerce Solar Center, Deep Creek Solar
Center, Forest Trail Solar Center, and Westlake Solar Center are tentatively scheduled for
completion by the end of 2022.
1.1.2.4 Nuclear Generation
JEA’s Board had established targets to acquire 10 percent of JEA’s energy requirements from
nuclear sources by 2018 and up to 30 percent by 2030. March 2008, the JEA Board of Directors
approved the pursuit of nuclear energy partnerships as part of a strategy for greater regulatory
and fuel diversification. October 2017, the JEA Board modified this goal by adopting an Energy
Mix Policy, which allows the 30 percent target to be met by any carbon-free or carbon-neutral
generation. Meeting these targets will result in a smaller carbon footprint for JEA’s customers.
In June 2008, JEA entered into a 20-year PPA with the Municipal Electric Authority of Georgia
(MEAG) for a portion of MEAG’s entitlement to Vogtle Units 3 and 4. These two new nuclear units
are under construction at the existing Plant Vogtle location in Burke County, GA. Under this PPA,
JEA is entitled to a total of 206 MW of firm capacity from these units. After accounting for
transmission losses, JEA is anticipating to receive a total of 200 MW of net firm capacity from
these units. The current schedule makes available to JEA 100 net MW of capacity beginning
November 2021 from Unit 3 and an additional 100 net MW beginning November 2022 from Unit
4. Table 1 lists JEA’s current purchased power contracts.
1.1.2.5 Cogeneration
Cogeneration facilities help meet the energy needs of JEA’s system on an as-available, non-firm
basis. Since these facilities are considered energy only resources, they are not forecasted to
contribute firm capacity to JEA’s reserve margin requirements.
Currently, JEA has contracts with one customer-owned qualifying facility (QF), as defined in the
Public Utilities Regulatory Policy Act of 1978. Anheuser Busch has a total installed summer rated
capacity of 8 MW and winter rated capacity of 9 MW.

JEA 2020 Ten Year Site Plan Existing Facilities
5
Table 1: JEA Purchased Power Schedule
(1) Dates are tentative.
Contract Start Date End Date MWAC Product Type
LES I 12/06/08 12/31/26 9 Annual
Trail Ridge II 02/01/14 12/31/26 6 Annual
MEAG Unit 3 11/01/21 11/01/41 100 Annual
Plant Vogtle Unit 4 11/01/22 11/01/42 100 Annual
Jacksonville Solar 09/30/10 09/30/40 12 Annual
NW Jacksonville Solar 05/30/17 05/30/42 7 Annual
Old Plank Road Solar 10/13/17 10/13/37 3 Annual
Starratt Solar 12/20/17 12/20/37 5 Annual
Simmons Road Solar 01/17/18 01/17/38 2 Annual
Blair Site Solar 01/23/18 01/23/38 4 Annual
Old Kings Solar 10/15/18 10/15/38 1 Annual
SunPort Solar 12/04/19 12/04/39 5 Annual
Cecil Commerce Solar(1) 05/19/21 05/19/46 50 Annual
Westlake Solar(1) 07/07/21 07/07/46 50 Annual
Deep Creek Solar (1) 08/03/21 08/03/46 50 Annual
Beaver Street Solar(1) 10/08/21 10/08/46 50 Annual
Forest Trail Solar (1) 12/01/21 12/01/46 50 Annual

JEA 2020 Ten Year Site Plan Existing Facilities
6
(1) (2) (3) (4) (5) (6) (7) (8) (9) (10) (11) (12) (13) (14) (15)
Plant Name
Unit Number
Location Unit Type
Fuel Type Fuel Transport Commercial In-Service
Expected Retirement
Gen Max Nameplate (b)
Net MW Capability Ownership Status
Primary Alt. Primary Alt. Mo/Year Mo/Year kW Summer Winter
Kennedy 407,600 300 382
7 12-031 GT NG DFO PL WA 06/2000 (a) 203,800 150 191 Utility
8 12-031 GT NG DFO PL WA 06/2009 (a) 203,800 150 191 Utility
Northside 1,512,100 1,310 1,356
1 12-031 ST PC BIT WA RR 05/2003 (a) 350,000 293 293 Utility
2 12-031 ST PC BIT WA RR 04/2003 (a) 350,000 293 293 Utility
3 12-031 ST NG RFO PL WA 07/1977 (a) 563,700 524 524 Utility
33-36 12-031 GT DFO WA,TK 01/1975 (a) 248,400 200 246 Utility
Brandy Branch 879,800 746 826
1 12-031 GT NG DFO PL TK 05/2001 (a) 203,800 150 191 Utility
2 12-031 CT NG PL TK 05/2001 (a) 203,800 190 209 Utility
3 12-031 CT NG PL TK 10/2001 (a) 203,800 190 209 Utility
4 12-031 CA WH 01/2005 (a) 268,400 216 216 Utility
Greenland Energy Center 407,600 300 382
1 12-031 GT NG DFO PL TK 06/2011 (a) 203,800 150 191 Utility
2 12-031 GT NG DFO PL TK 06/2011 (a) 203,800 150 191 Utility
Scherer
4 13-207 ST BIT RR 02/1989 (a) 990,000 198 198 Joint (c)
JEA System Total 2,854 3,145 (d)
Notes: (a) Units expected to be maintained throughout the TYSP period.
(b) Generator Max Nameplate is total unit not ownership.
(c) Net capability reflects JEA's 23.64% ownership in Scherer 4.
(d) Numbers may not add due to rounding.
Schedule 1: Existing Generating Facilities

JEA 2020 Ten Year Site Plan Transmission and Distribution
7
1.2 Transmission and Distribution
Transmission and Interconnections
JEA’s transmission system consists of 744 circuit-miles of bulk power transmission facilities
operating at four voltage levels: 69 kV, 138 kV, 230 kV, and 500 kV.
The 500 kV transmission lines are jointly owned by JEA and FPL, completing the path from FPL’s
Duval substation (west of JEA’s system) to the north to interconnect with the Georgia Integrated
Transmission System (ITS). Along with JEA and FPL, Duke Energy Florida and the City of
Tallahassee each own transmission interconnections with the Georgia ITS. JEA’s import capacity
is 1,228 MW over the 500 kV transmission lines through Duval substation.
The 230 kV and 138 kV transmission systems provide a backbone around JEA’s service territory,
with one river crossing in the north and no river crossings in the south, leaving an open loop. The
69 kV transmission system extends from JEA’s core urban load center to the northwest, northeast,
east, and southwest; covering the area not covered by the 230 kV and 138 kV transmission
backbone.
JEA owns and operates a total of four 230 kV transmission interconnections at FPL’s Duval
substation in Duval County. JEA has one 230 kV transmission interconnection which terminates
at Beaches Energy Services’ Sampson substation (FPL metered) in St. Johns County. JEA’s
ownership of this interconnection ends at State Road 210 which is located just north of the
Sampson substation. JEA has one 230 kV transmission interconnection terminating at Seminole
Electric Cooperative Incorporated’s (SECI) Black Creek substation in Clay County. JEA’s
ownership of this interconnection ends at the Duval County – Clay County line.
JEA’s one 138 kV tie-line, owned by Beaches Energy Services, terminates at JEA’s Neptune
substation. The 138 kV circuit breaker at Neptune substation is owned and maintained by JEA,
and the 138 kV transmission line fed by the circuit breaker is owned and operated by Beaches
Energy Services. JEA owns and operates a 138 kV transmission loop that extends from the 138
kV backbone north to JEA’s Nassau substation. This substation serves as a 138 kV transmission
interconnection point for FPL’s O’Neil substation and Florida Public Utilities Company’s (FPU)
Step Down substation. JEA’s ownership of these two 138 kV interconnections end at the first
transmission structure outside of the Nassau substation.
Transmission System Considerations
JEA continues to evaluate and upgrade the bulk power transmission system as necessary to
provide reliable electric service to its customers. In compliance with North American Electric
Reliability Corporation (NERC) and Florida Reliability Coordinating Council’s (FRCC) standards,
JEA continually assesses the needs and options for increasing the capability of the transmission
system.

JEA 2020 Ten Year Site Plan Transmission and Distribution
8
Since FRCC region became FL-Peninsula sub-region of SERC from July 2019, JEA is following
additional guidelines and actively participating in the SERC activities towards the reliability and
security of the bulk electric system.
JEA performs system assessments using JEA’s published Transmission Planning Process in
conjunction with and as an integral part of the FRCC’s published Regional Transmission Planning
Process. FRCC’s published Regional Transmission Planning Process facilitates coordinated
planning by all transmission providers, owners, and stakeholders within the FRCC Region.
FRCC’s members include investor owned utilities, municipal utilities, power marketers, and
independent power producers. The FRCC Board of Directors has the responsibility to ensure that
the FRCC Regional Transmission Planning Process is fully implemented. The FRCC Planning
Committee, which includes representation by all FRCC members, directs the FRCC Transmission
Technical Subcommittee in conjunction with the FRCC Staff to conduct the necessary studies to
fully implement the FRCC Regional Transmission Planning Process. The FRCC Regional
Transmission Planning Process meets the principles of the Federal Energy Regulatory
Commission (FERC) Final Rule in Docket No. RM05-35-000 for: (1) coordination, (2) openness,
(3) transparency, (4) information exchange, (5) comparability, (6) dispute resolution, (7) regional
coordination, (8) economic planning studies, and (9) cost allocation for new projects.
Transmission Service Requirements
JEA also engages in market transmission service obligations via the Open Access Same-time
Information System (OASIS) where daily, weekly, monthly, and annual firm and non-firm
transmission requests are submitted by potential transmission service subscribers.
The following two existing transmission service contracts expired or are set to expire in this Ten
Year Site Plan period:
The contract for the delivery of backup, non-firm, as-available service to Beaches Energy
Services expired at the end of November 2019.
FPL purchased Cedar Bay plant and retired the generation December 2016. The
transmission service for the delivery of Cedar Bay generation has been converted to JEA’s
Open Access Transmission service, and will remain with FPL through 2024.
Distribution
The JEA distribution system operates at three primary voltage levels (4.16 kV, 13.2 kV, and 26.4
kV). The 4.16 kV system serves a permanently defined area in older residential
neighborhoods. The 13 kV system serves a permanently defined area in the urban downtown
area. These two distribution systems serve any new customers that are located within their
defined areas, but there are no plans to expand these two systems beyond their present
boundaries. The 26.4 kV system serves approximately 88 percent of JEA’s load, including 75
percent of the 4.16 kV substations. The current standard is to expand the 26.4 kV system as

JEA 2020 Ten Year Site Plan Transmission and Distribution
9
required to serve all new distribution loads, except loads that are within the boundaries of the 4.16
kV or 13.2 kV systems. JEA has approximately 7,000 miles of distribution circuits of which more
than half is underground.

JEA 2020 Ten Year Site Plan Demand Side Management
10
1.3 Demand Side Management
Interruptible Load
JEA currently offers Interruptible and Curtailable Service to eligible industrial class customers with
peak demands of 750 kW or higher. Customers who subscribe to the Interruptible Service are
subject to interruption of their full nominated load during times of system emergencies, including
supply shortages. Customers who subscribe to the Curtailable Service may elect to voluntarily
curtail portions of their nominated load based on economic incentives. For the purposes of JEA’s
planning reserve requirements, only customer load nominated for Interruptible Service is treated
as non-firm. This non-firm load reduces the need for capacity planning reserves to meet peak
demands. JEA forecasts 100 MW of interruptible peak load for the summer and 102 MW for the
winter which remain constant throughout the study period. For 2020, the interruptible load
represents 3.8 percent of the forecasted total peak demand in the winter and 3.6 percent of the
forecasted total peak demand in the summer.
Demand-Side Management Programs
JEA continues to pursue a greater implementation of demand-side management programs where
economically beneficial and continues to meet JEA’s Florida Energy Efficiency and Conservation
Act (FEECA) goals. JEA’s demand-side management programs focus on improving the efficiency
of customer end uses as well as improving the system load factor. To encourage efficient
customer usage, JEA offers customers both education and economic incentives on more efficient
end use technologies. For load factor improvement, JEA has implemented a Demand Rate Pilot
program with the intent of reducing peaks for residential customers.
Electrification programs include on-road and off-road vehicles, floor scrubbers, forklifts, cranes
and other industrial process technologies. JEA’s forecast of annual incremental demand and
energy reductions due to its current DSM energy efficiency programs is shown in Table 2. Final
results from the Demand Rate Pilot program have not yet been determined, and as such impacts
are not reflected. JEA’s current and planned DSM programs are summarized by commercial and
residential programs in Table 3.

JEA 2020 Ten Year Site Plan Demand Side Management
11
Table 2: DSM Portfolio – Energy Efficiency Programs
ANNUAL
INCREMENTAL 2020 2021 2022 2023 2024 2025 2026 2027 2028 2029
Annual Residential 17.2 17.2 17.2 17.2 17.2 17.2 17.2 17.2 17.2 17.2
Energy Commercial 17.4 17.4 17.4 17.4 17.4 17.4 17.4 17.4 17.4 17.4
(GWh) Total 34.6 34.6 34.6 34.6 34.6 34.6 34.6 34.6 34.6 34.6
Summer Residential 4.7 4.7 4.7 4.7 4.7 4.7 4.7 4.7 4.7 4.7
Peak Commercial 3.2 3.2 3.2 3.2 3.2 3.2 3.2 3.2 3.2 3.2
(MW) Total 7.9 7.9 7.9 7.9 7.9 7.9 7.9 7.9 7.9 7.9
Winter Residential 3.7 3.7 3.7 3.7 3.7 3.7 3.7 3.7 3.7 3.7
Peak Commercial 2.4 2.4 2.4 2.4 2.4 2.4 2.4 2.4 2.4 2.4
(MW) Total 6.1 6.1 6.1 6.1 6.1 6.1 6.1 6.1 6.1 6.1
Table 3: DSM Programs
Commercial Programs Residential Programs
Commercial Energy Assessment Program Residential Energy Assessment Program
Commercial Energy Efficient Products Residential Energy Efficient Products
Commercial Prescriptive Program Residential New Build
Custom Commercial Program Residential Solar Water Heating
Commercial Solar Net Metering Residential Solar Net Metering
Small Business Direct Install Program Neighborhood Efficiency Program
Off-Road Electrification Residential Efficiency Upgrade
Electric Vehicles
Demand Rate Pilot

JEA 2020 Ten Year Site Plan Clean Power and Renewable Energy
12
1.4 Clean Power and Renewable Energy
JEA continues to investigate economic opportunities to incorporate clean power and renewable
energy into JEA’s power supply portfolio. To that end, JEA has implemented several clean power
and renewable energy initiatives and continues to evaluate potential new initiatives.
1.4.1 Clean Power Program
As established in JEA’s “Clean Power Action Plan” and through routine Clean Power Program
meetings from 1999-2014, JEA worked with the Sierra Club of Northeast Florida (Sierra Club),
the American Lung Association (ALA), and local environmental groups as a means of providing
guidance and recommendations to JEA in the development and implementation of the Clean
Power Programs.
Since the conclusion of this program, JEA has continued to make considerable progress related
to clean power initiatives. This progress includes installation of clean power systems, unit
efficiency improvements, solar purchase power agreements, legislative and public education
activities, and research and development of clean power technologies.
1.4.2 Renewable Energy
In 2005, JEA received a Sierra Club Clean Power Award for its voluntary commitment to
increasing the use of solar, wind and other renewable or green power sources. Since that time,
JEA has implemented new renewable energy projects and continues to explore additional
opportunities to increase its utilization of renewable energy. JEA issued several Requests for
Proposals (RFPs) for solar energy that resulted in new resources for JEA’s portfolio. As discussed
below, JEA’s existing renewable energy sources include installation of solar photovoltaic (PV),
solar thermal, and landfill gas capacity.
1.4.2.1 Solar and the Solar Incentive
JEA has installed 35 solar PV systems, totaling 222 kW, on public high schools in Duval County,
as well as many of JEA’s facilities, and the Jacksonville International Airport. To further promote
the acceptance and installation of solar energy systems, JEA implemented the Solar Incentive
Program early 2002. This program provided rebates for the installation of solar thermal systems.
In addition to the solar thermal system incentive program, JEA established a residential net
metering program to encourage the use of customer-sited solar PV systems. The policy has since
evolved with several revisions:
2009: Tier 1 & 2 Net Metering policy launched to include all customer-owned renewable
generation systems less than or equal to 100 kW
2011: Tier 3 Net Metering policy established for customer-owned renewable generation
systems greater than 100 kW up to 2 MW
JEA 2020 Ten Year Site Plan Clean Power and Renewable Energy
13
2014: Policy updated to define Tier 1 as 10 kW or less, Tier 2 as greater than 10 kW –
100 kW, and Tier 3 as 100 kW – 2 MW. This policy was capped at 10 MW for total
generation. All customer-owned generation in excess of 2 MW would be addressed in
JEA’s Distributed Generation Policy.
2017: In October, the JEA Board approved the consolidation of the Net Metering and
Distributed Generation Policies into a single, comprehensive Distributed Generation
Policy.
2018: Effective April 1, the comprehensive Distributed Generation (DG) Policy qualified
renewable and non-renewable customer-owned generation systems under the following
ranges:
o DG-1 – Less than or equal to 2 MW
o DG-2D – Over 2 MW with distribution level connection
o DG-2T – Over 2 MW with transmission level connection
This DG policy acts in concert with the JEA Battery Incentive Program (see Section 1.4.3.3
Energy Storage) and allows existing customers the option to be grandfathered under the
2014 Net Metering Policy for a period of 20 years.
JEA signed a purchase power agreement with Jacksonville Solar, LLC May 2009 to provide
energy from a 12 MWAC rated solar farm, which began operation summer 2010 (see Section
1.1.2.3 Jacksonville Solar).
In December 2014, a Solar Policy was approved by the JEA Board, setting forth the goal of an
additional 38 MW of solar photovoltaic (PV) power via power purchase contracts by the end of
2016. JEA issued three Solar PV RFPs and received a total of 73 bids. In 2015, JEA awarded a
total of 31.5 MW of solar PV power purchase contracts with terms of 20 to 25 years to various
vendors. The PPA, 5 MW on U.S. Navy owned land, awarded to Hecate Energy, LLC in 2016
was cancelled because JEA and the Navy were unable to reach an agreement on the land lease.
A 4.5 MW award to SunEdison Utility Solutions, LLC was cancelled due to failure of the contractor
to secure site control. The following are the seven PPAs that were finalized for a total of 27 MW
in JEA’s service territory of which JEA pays for the energy and has rights to the associated
environmental attributes produced by the facilities:
Northwest Jacksonville Solar Partners, LLC: 7 MWAC / 25-year PPA. The NW Jax facility
consists of 28,000 single-axis tracking photovoltaic panels on a vendor-leased site, owned
by American Electric Power (AEP). The facility became operational on May 30, 2017.
Old Plank Road Solar Farm, LLC: 3 MWAC / 20-year PPA. The Old Plank Road Solar
facility consists of 12,800 single-axis tracking photovoltaic panels on a vendor-leased 40-
acre site, owned by Southeast Solar Farm Fund, a partnership between PEC Velo & Cox
Communications. The site attained commercial operation on October 13, 2017.

JEA 2020 Ten Year Site Plan Clean Power and Renewable Energy
14
C2 Starratt Solar, LLC: 5 MWAC / 20-year PPA. The Starratt Solar facility, on a vendor-
leased site, is owned by C2 Starratt Solar, LLC and was constructed by Inman Solar,
Incorporated. The site attained commercial operation on December 20, 2017.
Inman Solar Holdings 2, LLC: 2 MWAC /20-year PPA. The Simmons Solar facility, on a
vendor-leased site, is owned by Inman Solar Holdings 2, LLC and was constructed by
Inman Solar, Inc. The site attained commercial operation on January 17, 2018.
Hecate Energy Blair Road, LLC: 4 MWAC / 20-year PPA. The Blair Road facility, on a
vendor-leased site, is owned by Hecate Energy Blair Road, LLC and was constructed by
Hecate Energy, LLC. The site attained commercial operation on January 23, 2018.
JAX Solar Developers, a wholly-owned subsidiary of Mirasol Fafco Solar, Inc.: 1 MWAC /
20-year PPA. The Old Kings Rd Solar facility is owned by EcoPower Development, LLC
and was constructed by Mirasol Fafco Solar, Inc. The site attained commercial operation
on October 15, 2018.
Imeson Solar, LLC: 5 MWAC solar PV / 2 MW, 4 MWh battery energy storage system
(BESS) / 20-year PPA. The primary function of the BESS is to smooth the solar
generation. It is the first utility scale solar plus storage facility interconnected to the JEA
grid. The site, labeled SunPort Solar, was constructed by 174 Power Global and attained
commercial operation on December 4, 2019.
In October 2017, the JEA Board approved a further solar expansion consisting of five-50 MWAC
solar facilities to be constructed on JEA-owned property. These projects, totaling 250 MWAC, are
structured as PPAs. A Request for Qualifications (RFQ) to select the vendors was issued and a
vendor short list was announced November 2017. The RFP for the facilities was released to the
short listed vendors on January 2, 2018. JEA received and evaluated 50 proposals that
conformed to the requirements of the RFP. JEA awarded the contracts to EDF Renewables
Distributed Solutions April 2018 and executed the contracts the 1st quarter of 2019. JEA will
purchase the produced energy, as well as the associated environmental attributes from each
facility. Beaver Street Solar Center, Cecil Commerce Solar Center, Deep Creek Solar Center,
Forest Trail Solar Center, and Westlake Solar Center contractually have until the end of 2022 to
be completed.
1.4.2.2 Landfill Gas and Biogas
JEA owned three internal combustion engine generators located at the Girvin Road landfill. This
facility was placed into service July 1997, and has been fueled by the methane gas produced by
the landfill. The facility originally had four generators, with an aggregate net capacity of 3 MW.
Since that time, methane gas generation has declined and one generator was removed and
placed into service at the Buckman Wastewater Treatment facility and Girvin was
decommissioned in 2014.

JEA 2020 Ten Year Site Plan Clean Power and Renewable Energy
15
JEA’s Buckman Wastewater Treatment Plant previously dewatered and incinerated the sludge
from the treatment process and disposed of the ash in a landfill. The current facility manages the
sludge using three anaerobic digesters and one sludge dryer to produce a pelletized fertilizer
product. The methane gas from the digesters can be used as a fuel for the sludge dryer and the
digester heaters.
JEA signed a Power Purchase Agreement with Trail Ridge Energy, LLC (TRE) in 2006 (Phase
One) for 9 net MW of the gas-to-energy facility at the Trail Ridge Landfill in Duval County. In
2011, JEA executed an amendment to the Power Purchase Agreement (Phase Two) to purchase
9 additional MW from a gas-to-energy facility. LES has developed the Sarasota County Landfill
in Nokomis, Florida (up to 6 net MW) to serve part of the Phase Two agreement. This portion of
the Phase Two purchase began February 2015 (see Section 1.1.2.1 Trail Ridge Landfill).
1.4.2.3 Wind
As part of its ongoing effort to utilize more sources of renewable energy, in 2004 JEA entered into
a 20-year agreement with Nebraska Public Power District (NPPD) to participate in a wind
generation project located in Ainsworth, Nebraska. JEA’s participation in NPPD’s wind generation
project allowed JEA to receive environmental credits (green tags) associated with this green
power project. Under the wind generation agreement, JEA purchased 10 MW of capacity from
NPPD’s wind generation facility. In turn, NPPD bought back the energy at specified on and off
peak charges.
JEA sold environmental credits for specified periods from this project thereby reducing but not
eliminating JEA’s net cost for this resource. With the expansion of JEA’s renewable portfolio
within the State of Florida, which includes additional landfill gas generation and new solar
facilities, JEA and NPPD agreed to terminate the contract effective December 31, 2019.
1.4.2.4 Biomass
In 2008, to obtain cost-effective biomass generation, JEA completed a detailed feasibility study
of both self-build stand-alone biomass units and the co-firing of biomass in Northside 1 and 2.
The JEA self-build projects would not have been eligible for the federal tax credits afforded to
developers. The co-firing alternative for Northside 1 and 2 considered potential reliability issues
associated with those units. Even though the price of petroleum coke has been volatile in recent
past, petroleum coke prices are still forecasted to be lower than the cost of biomass on an as-
fired basis. In addition, JEA conducted an analytical evaluation of specific biomass fuel types to
determine the possibility of conducting a co-firing test in Northside 1 or 2.
In 2011, JEA co-fired biomass in the Northside Units 1 and 2, utilizing wood chips from JEA tree
trimming activities as a biomass energy source. Northside 1 and 2 produced a total of 2,154 MWh
of energy from wood chips during 2011 and 2012. At that time, JEA received bids from local
sources to provide biomass for potential use for Northside Units 1 and 2. Currently, no biomass
is being co-fired in Northside Units 1 and 2.

JEA 2020 Ten Year Site Plan Clean Power and Renewable Energy
16
1.4.3 Research Efforts
Many of Florida’s renewable resources such as offshore wind, tidal, and energy crops require
additional research and development before they can be implemented as large-scale power
generating technologies. JEA’s renewable energy research efforts have focused on the
development of these technologies through a partnership with the University of North Florida’s
(UNF) Engineering Department. In the past, UNF and JEA have worked on the following projects:
JEA with UNF, worked to quantify the winter peak reductions of solar hot water systems.
UNF, in association with the University of Florida, evaluated the effect of biodiesel fuel in
a utility-scale combustion turbine. Biodiesel has been extensively tested on diesel
engines, but combustion turbine testing has been very limited.
UNF evaluated the tidal hydro-electric potential for North Florida, particularly in the
Intracoastal Waterway, where small proto-type turbines have been tested.
JEA, UNF, and other Florida municipal utilities partnered on a grant proposal to the Florida
Department of Environmental Protection to evaluate the potential for offshore wind
development in Florida.
JEA provided solar PV equipment to UNF for installation of a solar system at the UNF
Engineering Building to be used for student education.
JEA developed a 15-acre biomass energy farm where the energy yields of various
hardwoods and grasses were evaluated over a 3 year period.
JEA participated in the research of a high temperature solar collector that has the potential
for application to electric generation or air conditioning.
Through Florida State University (FSU), JEA participated in The Sunshine State Solar Grid
Initiative (SUNGRIN) which was a five-year project (2010-2015) funded under the DOE Solar
Energy Technologies Program (SETP), Systems Integration (SI) Subprogram, High Penetration
Solar Deployment Projects. The goal of the SUNGRIN project, which started spring 2010, was to
gain significant insight into effects of high-penetration levels of solar PV systems in the power
grid, through simulation-assisted research and development involving a technically varied and
geographically dispersed set of real-world test cases within the Florida grid. JEA provided FSU
with data from the output of the Jacksonville Solar project.
In 2016, JEA pledged its support to the proposed 3-year Florida Alliance for Accelerating Solar
and Storage Technology Readiness (FAASSTeR) project. The program is led by Nhu Energy,
Inc. and Florida Municipal Electric Association (FMEA) with partial funding from the DOE.
FAASSTeR seeks to grow solar capacity in FMEA member utilities to over 10% by 2024, and
provide increased value in terms of cost of service, electric infrastructure reliability, security, and
resilience, and environmental and broader economic benefits. With assistance from the National
Renewable Energy Laboratory (NREL) and Lawrence Berkeley National Laboratory (LBNL),

JEA 2020 Ten Year Site Plan Clean Power and Renewable Energy
17
studies on cost and performance of solar and solar plus storage applications were conducted.
The program recently opted for a no-cost extension to continue research efforts through June
2020. During this extension, Nhu Energy, Inc. will continue to provide technical assistance on
various solar and solar plus storage applications.
1.4.3.1 Generation Efficiency and New Natural Gas Generation
In the late 1990’s, JEA began to modernize its natural gas/oil fleet of generating units by replacing
inefficient steam units and inefficient combustion turbine units with more efficient natural gas-fired
combustion turbines and combined cycle units. The retirement of units and their replacement
with an efficient combined cycle unit and efficient simple cycle combustion turbines at Brandy
Branch, Kennedy, and Greenland Energy Center significantly reduced CO2 emissions.
During the spring of 2019, JEA upgraded Brandy Branch units CT2 and CT3. The upgrade
involved the addition of General Electric’s Advanced Gas Path (AGP) and 7FA.05 compressor
modifications to the existing Brandy Branch CT2 and CT3 7FA.03 units. These upgrades
improved the efficiency of the Brandy Branch units CT2 and CT3 taking it from approximately
48% to 53% on an ISO basis.
1.4.3.2 Renewable Energy Credits
JEA makes all environmental attributes from renewable facilities available to sell in order to lower
rates for JEA customers. JEA has sold environmental credits for specified periods. In 2019, JEA
certified approximately 20,000 Solar RECs under the Green-e certification structure and tracked
and delivered approximately 46,000 landfill gas RECs through the North America Renewables
(NAR) registry.
1.4.3.3 Energy Storage
JEA continues its efforts to demonstrate its commitment to energy efficiency and environmental
improvement by researching energy storage applications and methods to efficiently incorporate
storage technologies into the JEA system.
JEA welcomed the first utility-scale battery energy storage system to its grid with the addition of
the SunPort Solar facility's 4 MWh battery. The storage system levels the solar PV output.
JEA's residential Battery Incentive Program enacted April 1, 2018 has continued to provide
financial incentive towards the cost of an energy storage system, subject to lawfully appropriated
funds. The Program, used in concert with the 2018 Distributed Generation Policy, is intended to
assist customers in being efficient energy users. Customers who elect to collect the rebate are
able to offset electricity consumption from JEA, up to the limits of their storage devices. Funds
allotted to each customer under the Program is subject to review and change to optimize adoption.
Since its inception, 49 residential storage systems have been installed and more than 30
applications are pending approval.
JEA 2020 Ten Year Site Plan Forecast of Electric Power & Energy Consumption
18
2. Forecast of Electric Power Demand and Energy
Consumption
Annually, JEA develops forecasts of seasonal peaks demand, net energy for load (NEL),
interruptible customer demand, demand-side management (DSM), and the impact of plug-in
electric vehicles (PEVs). JEA removes from the total load forecast all seasonal, coincidental non-
firm sources and adds sources of additional demand to derive a firm load forecast.
JEA uses National Oceanic and Atmospheric Administration (NOAA) Weather Station -
Jacksonville International Airport for the weather parameters, Moody’s Analytics (Moody)
economic parameters for Duval County, JEA’s Data Warehouse to determine the total number of
Residential accounts and CBRE Jacksonville for Industrial total inventory square footages. JEA
develops its annual forecast using SAS and Microsoft Office Excel.
JEA’s Fiscal Year 2020 baseline forecast uses 10-years of historical data. Using the shorter
period allows JEA to capture the more recent trends in customer behavior, energy efficiency and
conservation, where these trends are captured in the actual data and used to forecast projections.
2.1 Peak Demand Forecast
JEA normalizes historical seasonal peaks using historical maximum and minimum temperatures.
JEA uses 24°F as the normal temperature for the winter peak and 97°F for the normal summer
peak demands. JEA develops the seasonal peak forecasts using multiple regression analysis of
normalized historical seasonal peaks, normalized historical and forecasted residential,
commercial and industrial energy for Winter/Summer peak months, heating degrees for the 72
hours leading to winter peak and cooling degrees for the 48 hours leading to summer peak. JEA’s
forecasted Average Annual Growth Rate (AAGR) for total peak demand during the TYSP period
is 0.38 percent for summer and 0.59 percent for winter.
2.2 Energy Forecast
JEA begins this forecast process by weather normalizing energy for each customer class. JEA
uses NOAA Weather Station - Jacksonville International Airport for historical weather data. JEA
develops the normal weather using 10-year historical average heating/cooling degree days and
maximum/minimum temperatures. Normal months, with heating/cooling degree days and
maximum/minimum temperatures that are closest to the averages, are then selected. JEA
updates its normal weather every 5 years or more frequently, if needed.
The residential energy forecast was developed using multiple regression analysis of weather
normalized historical residential energy, Total Population, Median Household Income, Total
Housing Starts from Moody’s Analytics, JEA’s total residential accounts and JEA’s residential
electric rate.

JEA 2020 Ten Year Site Plan Forecast of Electric Power & Energy Consumption
19
The commercial energy forecast was developed using multiple regression analysis of weather
normalized historical commercial energy, commercial inventory square footage, total commercial
employment, gross product and JEA’s commercial electric rate.
The industrial energy forecast was developed using multiple regression analysis of weather
normalized historical industrial energy, total industrial employment, proprietors’ profit and total
retail sales product for existing industrial accounts. JEA then layers in the estimated energy for
new industrial customers on the forecasted industrial energy.
The lighting energy forecast was developed using the historical actual energy, number of
luminaries and JEA’s estimated High Pressure Sodium (HPS) to Light-Emitting Diode (LED) street
light conversion schedule. The LEDs are estimated to use 45% less energy than the HPS street
lights. JEA developed the forecasted number of luminaries using regression analysis of the
number of JEA customers. The forecasted lighting energy was calculated using the forecasted
number of luminaries, applied with the remaining HPS to LED street light conversions with all new
street light additions as LED only.
JEA’s forecasted AAGR for net energy for load during the TYSP period is 0.63 percent.
Figure 1: Summer Peak Demand History & Forecast
2,300
2,500
2,700
2,900
3,100
3,300
20
10
20
11
20
12
20
13
20
14
20
15
20
16
20
17
20
18
20
19
20
20
20
21
20
22
20
23
20
24
20
25
20
26
20
27
20
28
20
29
MW
Summer Peak Demand
History Forecast

JEA 2020 Ten Year Site Plan Forecast of Electric Power & Energy Consumption
20
Figure 2: Winter Peak Demand History & Forecast
Figure 3: Net Energy for Load History & Forecast
10,000
11,000
12,000
13,000
14,000
15,000
20
10
20
11
20
12
20
13
20
14
20
15
20
16
20
17
20
18
20
19
20
20
20
21
20
22
20
23
20
24
20
25
20
26
20
27
20
28
20
29
GW
h
Net Energy for Load (NEL)
History Forecast
2,300
2,500
2,700
2,900
3,100
3,3002
01
0
20
11
20
12
20
13
20
14
20
15
20
16
20
17
20
18
20
19
20
20
20
21
20
22
20
23
20
24
20
25
20
26
20
27
20
28
20
29
MW
Winter Peak Demand
History Forecast

JEA 2020 Ten Year Site Plan Forecast of Electric Power & Energy Consumption
21
2.3 Plug-in Electric Vehicle Peak Demand and Energy
The PEVs demand and energy forecasts are developed using the historical number of PEVs in
Duval County obtained from the Florida Department of Highway Safety and Motor Vehicles
(DHSMV) and the historical number of vehicles in Duval County from the U.S. Census Bureau.
JEA forecasted the number of vehicles in Duval County using multiple regression analysis of
historical and forecasted Duval Population, Median Household Income and Number of
Households from Moody’s Analytics. The forecasted number of PEVs is modeled using multiple
regression analysis of the number of vehicles and the average motor gasoline price from the U.S.
Energy Information Administration (EIA) Annual Energy Outlook (AEO).
The usable battery capacity (70% of battery capacity) per vehicle was determined based on the
current plug-in vehicle models in Duval County, such as BMW, General Motors’ Chevrolet and
Cadillac, Honda, Fisker, Ford, Mitsubishi, Nissan, Porsche, Tesla, Toyota and Volvo. The
average usable battery capacity per PEV is calculated using the average usable battery capacity
of each vehicle brand and then assumes the annual growth of usable battery capacity per PEV
by using historical 5 years average growth of 0.08 kWh. Similarly, the peak capacity is determined
based on the average on-board charging rate of each vehicle brand and the forecast peak
capacity per PEV grows by 0.03 kW per year.
JEA developed the PEVs daily charge pattern based on the U.S. Census 2013 American
Community Survey (ACS-13) for time of arrival to work and travel time to work for Duval County.
The baseline forecast assumed that charging will be once every two days and uncontrolled;
charging starts immediately upon arriving home.
Figure 4: PEVs Daily Charge Pattern
The PEVs peak demand forecast is developed using the on-board charge rate for each model,
the PEVs daily charge pattern and the total number of PEVs each year. The PEV energy forecast
is developed simply by summing the hourly peak demand for each year.
JEA’s forecasted AAGRs for PEV winter and summer coincidental peak demand and total energy
are approximately 13 percent during the TYSP period.
0.0%
10.0%
20.0%
30.0%
40.0%
1 2 3 4 5 6 7 8 9 10 11 12 13 14 15 16 17 18 19 20 21 22 23 24Pe
rce
nt
of
PEV
s St
art
Ch
argi
ng
Hour
PEVs Daily Charge Pattern

JEA 2020 Ten Year Site Plan Forecast of Electric Power & Energy Consumption
22
Schedule 2.1: History and Forecast of Energy Consumption and Number of Customers by Class
Year
(1) (2) (3) (4) (5) (6) (7) (8) (9)
Rural and Residential Commercial Industrial
GWH Sales Average
Number of Customers
Average kWh/
Customer GWH Sales
Average Number of Customers
Average kWh/
Customer GWH Sales
Average Number of Customers
Average kWh/
Customer
2010 5,747 369,051 15,572 4,071 46,192 88,137 2,720 223 12,192,753
2011 5,237 369,761 14,163 3,927 46,605 84,255 2,682 215 12,469,585
2012 4,880 372,430 13,102 3,852 47,127 81,735 2,598 218 11,908,327
2013 4,852 377,326 12,860 3,777 47,691 79,204 2,589 219 11,812,928
2014 5,162 383,998 13,443 3,882 49,364 78,642 2,564 215 11,951,824
2015 5,197 391,219 13,285 4,001 50,821 78,733 2,579 207 12,438,487
2016 5,351 398,387 13,431 4,064 51,441 78,994 2,457 202 12,159,793
2017 5,199 404,806 12,842 4,011 51,970 77,176 2,532 202 12,510,027
2018 5,460 412,070 13,251 4,042 52,525 76,954 2,524 196 12,853,285
2019 5,479 420,831 13,019 4,060 53,153 76,389 2,733 194 14,085,278
2020 5,576 429,768 12,975 4,029 53,993 74,626 2,712 191 14,197,111
2021 5,594 436,345 12,820 4,051 54,560 74,255 2,779 191 14,547,180
2022 5,617 443,763 12,657 4,076 55,110 73,969 2,794 191 14,626,109
2023 5,665 451,212 12,555 4,096 55,644 73,617 2,801 191 14,664,783
2024 5,719 458,504 12,473 4,116 56,167 73,274 2,815 191 14,739,844
2025 5,771 465,513 12,398 4,133 56,677 72,929 2,835 191 14,841,936
2026 5,833 472,150 12,354 4,152 57,175 72,611 2,858 191 14,963,495
2027 5,894 478,408 12,320 4,170 57,660 72,324 2,882 191 15,091,142
2028 5,943 484,196 12,274 4,190 58,134 72,067 2,908 191 15,227,151
2029 5,982 489,750 12,214 4,213 58,597 71,896 2,941 191 15,396,936

JEA 2020 Ten Year Site Plan Forecast of Electric Power & Energy Consumption
23
Schedule 2.2: History and Forecast of Energy Consumption and Number of Customers by Class
Year
(10) (11) (12) (13) (14) (15) (16) (17)
Street & Highway Lighting
Other Sales to Ultimate Customers
Total Sales to Ultimate
Customers
Sales For Resale
Utility Use & Losses
Net Energy For Load
Other Customers Total Number of Customers
GWH GWH GWH GWH GWH GWH Average Number
2010 122 0 12,660 617 569 13,846 2 415,468
2011 123 0 11,968 589 424 12,980 2 416,583
2012 123 0 11,452 585 374 12,411 2 419,777
2013 122 0 11,340 395 550 12,286 2 425,238
2014 105 0 11,713 472 473 12,658 2 433,578
2015 87 0 11,864 392 612 12,868 2 442,249
2016 77 0 11,949 490 498 12,937 2 450,032
2017 63 0 11,805 288 578 12,672 2 456,981
2018 59 0 12,085 82 646 12,813 0 464,793
2019 57 0 12,328 58 411 12,797 0 474,178
2020 52 0 12,369 36 542 12,948 0 483,952
2021 51 0 12,475 36 491 13,002 0 491,095
2022 52 0 12,539 37 478 13,053 0 499,064
2023 53 0 12,615 37 481 13,133 0 507,047
2024 54 0 12,703 37 482 13,222 0 514,861
2025 55 0 12,794 38 481 13,313 0 522,380
2026 55 0 12,897 38 479 13,415 0 529,516
2027 56 0 13,002 39 477 13,518 0 536,260
2028 56 0 13,097 39 479 13,615 0 542,521
2029 57 0 13,192 39 473 13,704 0 548,538

JEA 2020 Ten Year Site Plan Forecast of Electric Power & Energy Consumption
24
Schedule 3.1: History and Forecast of Summer Peak Demand
Note: All projections coincident at time of peak.
(1) (2) (3) (4) (5) (6) (7) (8) (9) (10) (11)
Calendar Year
Total Demand
Interruptible Load
Load Management QF Load
Served by QF
Generation
Cumulative Conservation
Net Firm Peak
Demand
Time Of Peak
Residential Comm/Ind. Residential Comm/Ind. Month Day H.E. Temp
2010 2,817 0 0 0 0 0 0 2,817 6 22 1600 98
2011 2,756 0 0 0 0 0 0 2,756 6 18 1700 102
2012 2,616 0 0 0 0 0 0 2,616 8 11 1700 98
2013 2,596 0 0 0 0 0 0 2,596 7 25 1700 95
2014 2,646 0 0 0 0 0 0 2,646 8 14 1600 93
2015 2,683 0 0 0 0 0 0 2,683 8 22 1600 99
2016 2,763 0 0 0 0 0 0 2,763 6 17 1600 97
2017 2,682 0 0 0 0 0 0 2,682 7 7 1700 98
2018 2,557 0 0 0 0 0 0 2,557 8 16 1700 96
2019 2,644 0 0 0 0 0 0 2,644 8 14 1600 94
2020 2,623 100 0 0 0 3 2 2,518 --- --- --- ----
2021 2,633 100 0 0 0 8 5 2,520 --- --- --- ----
2022 2,642 100 0 0 0 11 7 2,524 --- --- --- ----
2023 2,652 100 0 0 0 16 11 2,526 --- --- --- ----
2024 2,662 100 0 0 0 17 11 2,534 --- --- --- ----
2025 2,672 100 0 0 0 19 13 2,540 --- --- --- ----
2026 2,682 100 0 0 0 22 15 2,545 --- --- --- ----
2027 2,694 100 0 0 0 30 20 2,544 --- --- --- ----
2028 2,704 100 0 0 0 31 21 2,552 --- --- --- ----
2029 2,715 100 0 0 0 39 26 2,551 --- --- --- ----

JEA 2020 Ten Year Site Plan Forecast of Electric Power & Energy Consumption
25
Schedule 3.2: History and Forecast of Winter Peak Demand
(1) (2) (3) (4) (5) (6) (7) (8) (9) (10) (11)
Calendar Year
Total Demand
Interruptible Load
Load Management QF Load
Served by QF
Generation
Cumulative Conservation Net Firm
Peak Demand
Time Of Peak
Residential Comm/Ind. Residential Comm/Ind. Month Day H.E. Temp
2010 3,224 0 0 0 0 0 0 3,224 1 11 800 20
2011 3,062 0 0 0 0 0 0 3,062 1 14 800 23
2012 2,665 0 0 0 0 0 0 2,665 1 4 800 22
2013 2,559 0 0 0 0 0 0 2,559 2 18 800 24
2014 2,823 0 0 0 0 0 0 2,823 1 7 800 22
2015 2,863 0 0 0 0 0 0 2,863 2 20 800 24
2016 2,674 0 0 0 0 0 0 2,674 1 20 800 28
2017 2,480 0 0 0 0 0 0 2,480 1 9 800 30
2018 3,080 0 0 0 0 0 0 3,080 1 8 800 26
2019 2,475 0 0 0 0 0 0 2,475 1 31 800 34
2020 2,862 102 0 0 0 2 1 2,756 --- --- --- ----
2021 2,875 102 0 0 0 4 3 2,766 --- --- --- ----
2022 2,886 102 0 0 0 6 4 2,774 --- --- --- ----
2023 2,902 102 0 0 0 9 6 2,785 --- --- --- ----
2024 2,921 102 0 0 0 10 7 2,802 --- --- --- ----
2025 2,939 102 0 0 0 13 9 2,815 --- --- --- ----
2026 2,959 102 0 0 0 15 10 2,833 --- --- --- ----
2027 2,980 102 0 0 0 16 11 2,851 --- --- --- ----
2028 3,000 102 0 0 0 18 12 2,868 --- --- --- ----
2029 3,019 102 0 0 0 20 14 2,883 --- --- --- ----
Note: All projections coincident at time of peak.

JEA 2020 Ten Year Site Plan Forecast of Electric Power & Energy Consumption
26
Schedule 3.3: History and Forecast of Annual Net Energy For Load
(1) (2) (3) (4) (5) (6) (7) (8) (9) (10)
Calendar Year
Total Energy
For Load
Interruptible Load
Load Management QF Load
Served by QF
Generation
Cumulative Conservation Net Energy
For Load Load Factor
Residential Comm/Ind. Residential Comm/Ind.
2010 13,846 0 0 0 0 0 0 13,846 49%
2011 12,980 0 0 0 0 0 0 12,980 48%
2012 12,411 0 0 0 0 0 0 12,411 53%
2013 12,286 0 0 0 0 0 0 12,286 54%
2014 12,658 0 0 0 0 0 0 12,658 51%
2015 12,868 0 0 0 0 0 0 12,868 51%
2016 12,937 0 0 0 0 0 0 12,937 53%
2017 12,672 0 0 0 0 0 0 12,672 53%
2018 12,813 0 0 0 0 0 0 12,813 54%
2019 12,797 0 0 0 0 0 0 12,797 55%
2020 12,987 0 0 0 0 20 20 12,948 53%
2021 13,064 0 0 0 0 31 31 13,002 54%
2022 13,149 0 0 0 0 48 48 13,053 54%
2023 13,263 0 0 0 0 65 65 13,133 54%
2024 13,388 0 0 0 0 83 83 13,222 54%
2025 13,513 0 0 0 0 100 100 13,313 54%
2026 13,649 0 0 0 0 117 117 13,415 54%
2027 13,787 0 0 0 0 135 135 13,518 54%
2028 13,920 0 0 0 0 152 152 13,615 54%
2029 14,043 0 0 0 0 169 169 13,704 54%
JEA 2020 Ten Year Site Plan Forecast of Electric Power & Energy Consumption
27
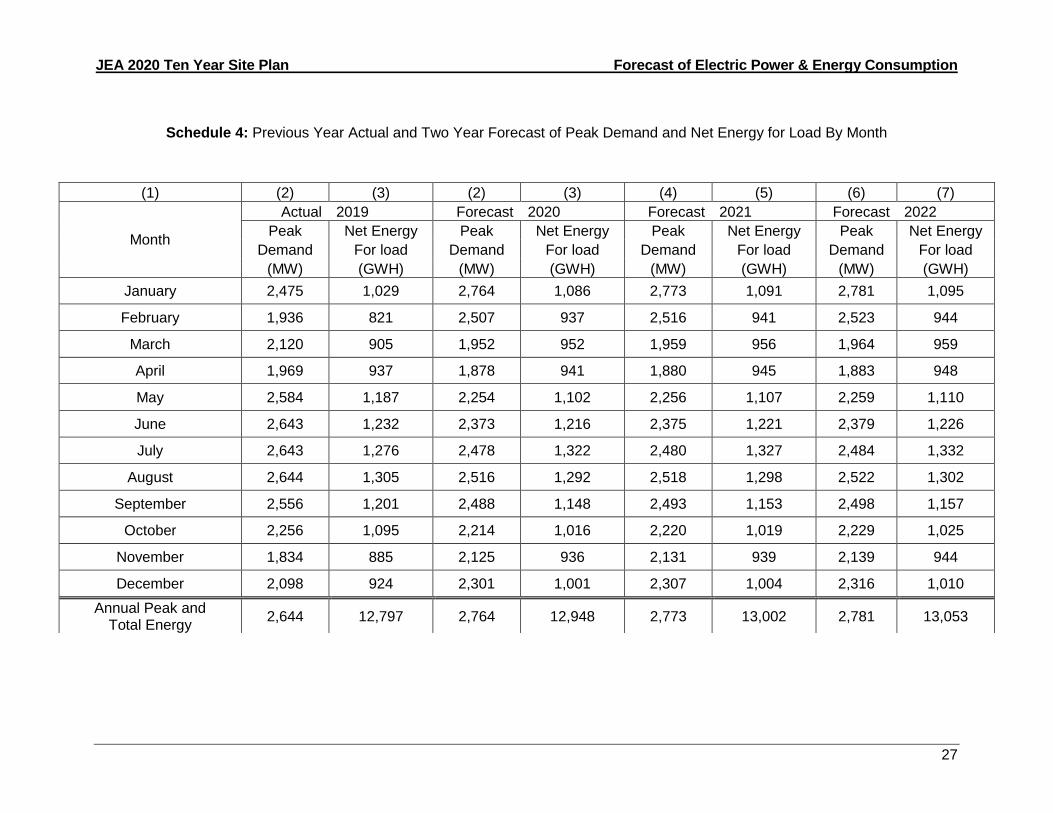
Schedule 4: Previous Year Actual and Two Year Forecast of Peak Demand and Net Energy for Load By Month
(1) (2) (3) (2) (3) (4) (5) (6) (7)
Month
Actual 2019 Forecast 2020 Forecast 2021 Forecast 2022
Peak Net Energy Peak Net Energy Peak Net Energy Peak Net Energy
Demand For load Demand For load Demand For load Demand For load
(MW) (GWH) (MW) (GWH) (MW) (GWH) (MW) (GWH)
January 2,475 1,029 2,764 1,086 2,773 1,091 2,781 1,095
February 1,936 821 2,507 937 2,516 941 2,523 944
March 2,120 905 1,952 952 1,959 956 1,964 959
April 1,969 937 1,878 941 1,880 945 1,883 948
May 2,584 1,187 2,254 1,102 2,256 1,107 2,259 1,110
June 2,643 1,232 2,373 1,216 2,375 1,221 2,379 1,226
July 2,643 1,276 2,478 1,322 2,480 1,327 2,484 1,332
August 2,644 1,305 2,516 1,292 2,518 1,298 2,522 1,302
September 2,556 1,201 2,488 1,148 2,493 1,153 2,498 1,157
October 2,256 1,095 2,214 1,016 2,220 1,019 2,229 1,025
November 1,834 885 2,125 936 2,131 939 2,139 944
December 2,098 924 2,301 1,001 2,307 1,004 2,316 1,010
Annual Peak and Total Energy
2,644 12,797 2,764 12,948 2,773 13,002 2,781 13,053
JEA 2020 Ten Year Site Plan Forecast of Facilities Requirements
28
3. Forecast of Facilities Requirements
3.1 Future Resource Needs
Integrated Resource Planning Study
JEA initiated an Integrated Resource Planning (IRP) study the Spring of 2018. This 2019 IRP
was developed to study JEA’s electric system over the 2020 through 2050 period and assist JEA
in determining the most cost-effective type of generation to provide firm power in the 2025 to 2030
timeframe with the potential retirement due to 316(b) compliance of JEA’s Northside 3 as the
primary driver for projected capacity requirements.
A scenario approach was utilized which allowed simultaneous consideration of variations to
several inputs. Scenarios were developed to address uncertainties related to:
Projected load growth (both peak demand and annual energy requirements)
Penetration of plug-in electric vehicles and increased electrification
Net metering, energy efficiency, energy conservation, and direct load control
Future environmental regulations and clean energy standards
Estimated capital costs for new generating units
Projected natural gas prices
Potential future solid-fuel unit retirements
A wide range of natural gas and solar photovoltaic (PV) technologies were considered as potential
supply-side options for evaluation. The natural gas options represent various technologies
including reciprocating engines, aeroderivatives, and combustion turbines in different simple cycle
and combined cycle configurations. Solar PV technologies included utility scale PV with and
without battery storage, and reflected projected continuation of decreases in equipment and
construction costs.
The economic evaluations performed included an initial screening of the supply-side options as
well as detailed generation expansion and production cost modeling. The initial screening,
performed as a levelized cost of energy (LCOE) analysis, was utilized to evaluate the various
supply-side options and screen out options that were not economic for consideration in the
generation expansion planning and subsequent production cost modeling.
Regardless of the scenario or sensitivity evaluated, the expansion plan that includes retirement
of Northside 3 and a new 7HA.02 1x1 combined cycle is the least cost expansion plan on a
cumulative present worth cost (CPWC) basis. When comparing expansion plans including
continued operation of Northside 3, retirement of Northside 3, and conversion of the Greenland
Energy Center simple cycle units to combined cycle, the CPWCs of expansion plans within each
scenario and sensitivity are within approximately 1 percent to 3 percent of one another. The
differentials in CPWC are small for expansion plans that included replacement of Northside 3 with

JEA 2020 Ten Year Site Plan Forecast of Facilities Requirements
29
either a new 1x1 combined cycle or conversion of one or both of the existing Greenland Energy
Center simple cycle units to combined cycle.
Because the need for additional capacity is fueled by the retirement of Northside Unit 3, JEA is
preparing for a comprehensive condition assessment on Northside 3 to determine the unit’s safety
and reliability in the near term and determine the capital investment needed to comply with
applicable regulations including and other than 316(b). Since JEA has not made a definitive
decision on the future of this Unit, Northside 3 is included as a capacity resource for the term of
this Ten Year Site Plan period. The 2019 IRP is in final review and will be available under a
separate cover.
Capacity Needs
JEA evaluates future supply capacity needs for the electric system based on peak demand and
energy forecasts, existing supply resources and contracts, transmission considerations, existing
unit capacity changes, and future committed resources as well as other planning assumptions.
The base capacity plan in Table 4 includes the addition of the purchased power agreement with
MEAG for Vogtle Units 3 and 4 in 2021 and 2022.
Table 4a: Resource Needs after Committed Units - Summer
Summer
Year
Installed Capacity
Firm Capacity QF
Available Capacity
Firm Peak
Demand
Reserve Margin Before
Maintenance
Reserve Margin After Maintenance Import Export
MW MW MW MW MW MW MW Percent MW Percent
2020 2,853 15 0 0 2,869 2,514 354 0 354 14%
2021 2,853 15 0 0 2,869 2,510 358 0 358 14%
2022 2,853 115 0 0 2,969 2,508 460 0 460 18%
2023 2,853 215 0 0 3,069 2,504 565 0 565 23%
2024 2,853 215 0 0 3,069 2,506 563 0 563 22%
2025 2,853 215 0 0 3,069 2,506 562 0 562 22%
2026 2,853 215 0 0 3,069 2,504 564 0 564 23%
2027 2,853 200 0 0 3,053 2,495 558 0 558 22%
2028 2,853 200 0 0 3,053 2,497 556 0 556 22%
2029 2,853 200 0 0 3,053 2,489 564 0 564 23%
Note: Committed capacity additions include Vogtle Units 3 & 4 November 2021 & 2022, respectively.

JEA 2020 Ten Year Site Plan Forecast of Facilities Requirements
30
Table 4b: Resource Needs after Committed Units - Winter
Winter
Year
Installed Capacity
Firm Capacity QF
Available Capacity
Firm Peak
Demand
Reserve Margin Before
Maintenance
Reserve Margin After Maintenance Import Export
MW MW MW MW MW MW MW Percent MW Percent
2019/20 3,145 15 0 0 3,160 2,763 396 14% 396 14%
2020/21 3,145 15 0 0 3,160 2,773 387 14% 387 14%
2021/22 3,145 115 0 0 3,260 2,781 479 17% 479 17%
2022/23 3,145 215 0 0 3,360 2,792 568 20% 568 20%
2023/24 3,145 215 0 0 3,360 2,809 551 20% 551 20%
2024/25 3,145 215 0 0 3,360 2,822 538 19% 538 19%
2025/26 3,145 215 0 0 3,360 2,840 520 18% 520 18%
2026/27 3,145 215 0 0 3,360 2,858 502 18% 502 18%
2027/28 3,145 200 0 0 3,345 2,875 470 16% 470 16%
2028/29 3,145 200 0 0 3,345 2,890 455 16% 455 16%
Note: Committed capacity additions include Vogtle Units 3 & 4 November 2021 & 2022, respectively.
JEA’s Planning Reserve Policy defines the planning reserve requirements that are used to
develop the resource portfolio through the Integrated Resource Planning process. These
guidelines set forth the planning criteria relative to the planning reserve levels and the constraints
of the resource portfolio.
JEA’s system capacity is planned with a targeted 15 percent generation reserve level for
forecasted wholesale and retail firm customer coincident one-hour peak demand, for both winter
and summer seasons. This reserve level has been determined to be adequate to meet and
exceed the industry standard Loss of Load Probability of 0.1 days per year. This level has been
used by the Florida Public Service Commission (FPSC) for municipalities in the consideration of
need for additional generation additions.
To meet these Planning Reserve Policy requirements, JEA will acquire the needed capacity and
associated energy as identified in Table 4, for those years where the reserve margin is below 15
percent. JEA’s Planning Reserve Policy establishes a guideline that provides an allowance to
meet the 15 percent reserve margin with up to 3 percent of forecasted firm peak demand in any
season from purchases acquired in the operating horizon. Where JEA’s seasonal needs are
greater than 3% of firm peak demand, TEA will acquire short-term seasonal market purchases for
JEA no later than the season prior to the need. TEA actively trades energy with a large number
of counterparties throughout the United States, and is generally able to acquire capacity and
energy from other market participants when any of its members require additional resources.
JEA 2020 Ten Year Site Plan Forecast of Facilities Requirements
31
3.2 Resource Plan
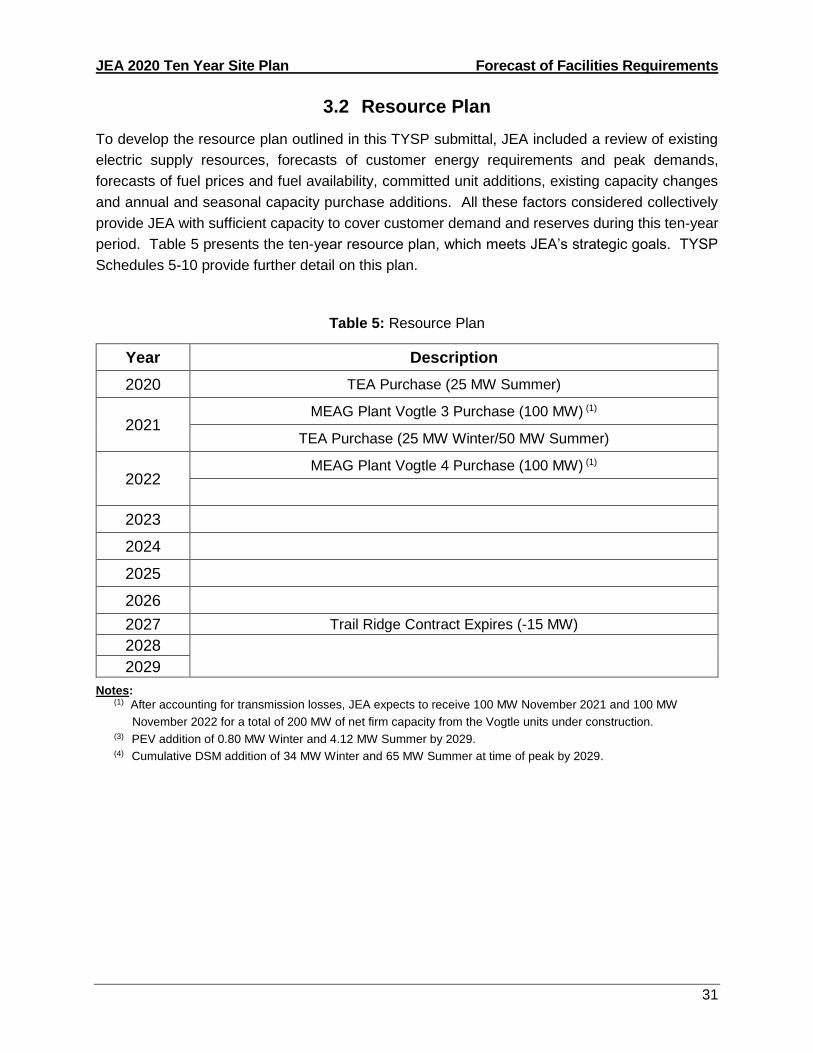
To develop the resource plan outlined in this TYSP submittal, JEA included a review of existing
electric supply resources, forecasts of customer energy requirements and peak demands,
forecasts of fuel prices and fuel availability, committed unit additions, existing capacity changes
and annual and seasonal capacity purchase additions. All these factors considered collectively
provide JEA with sufficient capacity to cover customer demand and reserves during this ten-year
period. Table 5 presents the ten-year resource plan, which meets JEA’s strategic goals. TYSP
Schedules 5-10 provide further detail on this plan.
Table 5: Resource Plan
Year Description
2020 TEA Purchase (25 MW Summer)
2021 MEAG Plant Vogtle 3 Purchase (100 MW) (1)
TEA Purchase (25 MW Winter/50 MW Summer)
2022 MEAG Plant Vogtle 4 Purchase (100 MW) (1)
2023
2024
2025
2026
2027 Trail Ridge Contract Expires (-15 MW)
2028
2029
Notes: (1) After accounting for transmission losses, JEA expects to receive 100 MW November 2021 and 100 MW
November 2022 for a total of 200 MW of net firm capacity from the Vogtle units under construction. (3) PEV addition of 0.80 MW Winter and 4.12 MW Summer by 2029. (4) Cumulative DSM addition of 34 MW Winter and 65 MW Summer at time of peak by 2029.

JEA 2020 Ten Year Site Plan Forecast of Facilities Requirements
32
Schedule 5: Fuel Requirements
(1) (2) (3) (4) (5) (6) (7) (8) (9) (10) (11) (12) (13) (14)
Actual
Fuel Type Units 2019 2020 2021 2022 2023 2024 2025 2026 2027 2028 2029
(1) NUCLEAR
TOTAL TRILLION BTU 0 0 0 0 0 0 0 0 0 0 0
(2) COAL
TOTAL 1000 TON 1,654 1,767 1,953 1,654 1,672 1,618 1,997 2,003 2,149 2,087 2,205 RESIDUAL
(3) STEAM 1000 BBL 2 0 0 0 0 0 0 0 0 0 0
(4) CC 1000 BBL 0 0 0 0 0 0 0 0 0 0 0
(5) CT/GT 1000 BBL 0 0 0 0 0 0 0 0 0 0 0
(6) TOTAL 1000 BBL 2 0 0 0 0 0 0 0 0 0 0 DISTILLATE
(7) STEAM 1000 BBL 0.4 3.4 6.1 5.2 3.1 7.5 2.2 4.3 4.0 4.3 4.0
(8) CC 1000 BBL 0.0 0.0 0.0 0.0 0.0 0.0 0.0 0.0 0.0 0.0 0.0
(9) CT/GT 1000 BBL 6.2 10.8 15.9 6.6 4.6 2.1 0.3 4.1 4.0 9.2 2.7
(10) TOTAL 1000 BBL 7 14 22 12 8 10 3 8 8 14 7 NATURAL GAS
(12) STEAM 1000 MCF 19,104 27,399 22,400 21,549 19,824 19,172 13,298 12,698 13,296 12,076 12,410
(13) CC 1000 MCF 23,490 30,476 29,590 29,710 28,032 29,690 28,865 28,984 27,992 29,448 29,198
(14) CT/GT 1000 MCF 8,416 6,601 7,164 4,666 3,381 3,418 3,144 3,514 4,826 5,364 3,633
(15) TOTAL 1000 MCF 51,010 64,475 59,154 55,924 51,237 52,280 45,306 45,196 46,114 46,888 45,241
(16) OTHER (SPECIFY)
TOTAL TRILLION BTU 0 0 0 0 0 0 0 0 0 0 0
Note: Coal includes JEA's share of Scherer 4 and Northside Coal and Petroleum Coke.

JEA 2020 Ten Year Site Plan Forecast of Facilities Requirements
33
Schedule 6.1: Energy Sources (GWh)
(1) (2) (3) (4) (5) (6) (7) (8) (9) (10) (11) (12) (13) (14)
Fuel Type Units
Actual
2020 2021 2022 2023 2024 2025 2026 2027 2028 2029 2019
(1) Firm Inter-Region Intchg. (a) GWH 3,050 66 211 982 1,676 1,622 1,619 1,681 1,622 1,628 1,679
(2) NUCLEAR GWH 0 0 0 0 0 0 0 0 0 0 0
(3) COAL(b) GWH 3,287 4,275 4,589 3,843 3,842 3,773 4,640 4,697 4,955 4,881 5,121
(4)
RESIDUAL
STEAM
GWH
0.987 0 0 0 0 0 0 0 0 0 0
(5) CC 0 0 0 0 0 0 0 0 0 0 0
(6) CT 0 0 0 0 0 0 0 0 0 0 0
(7) TOTAL 1 0 0 0 0 0 0 0 0 0 0
(8)
DISTILLATE
STEAM
GWH
0 0 0 0 0 0 0 0 0 0 0
(9) CC 0 0 0 0 0 0 0 0 0 0 0
(10) CT 1.891 5 7 3 2 1 0 2 2 4 1
(11) TOTAL 2 5 7 3 2 1 0 2 2 4 1
(12)
NATURAL GAS
STEAM
GWH
1,881 2,771 2,262 2,131 1,934 1,866 1,286 1,214 1,269 1,146 1,166
(13) CC 3,610 4,956 4,809 4,814 4,528 4,810 4,651 4,674 4,519 4,763 4,716
(14) CT 822 664 721 469 341 343 313 347 483 527 358
(15) TOTAL 6,312 8,391 7,792 7,413 6,803 7,018 6,250 6,234 6,270 6,436 6,240
(16) NUG GWH 0 0 0 0 0 0 0 0 0 0 0
(17) RENEWABLES HYDRO
0.00 0.00 0.00 0.00 0.00 0.00 0.00 0.00 0.00 0.00 0.00
(18)
LANDFILL GAS 87.56 130.30 130.00 130.00 130.00 130.30 130.00 130.00 0.00 0.00 0.00
(19) SOLAR 58.36 81.70 273.10 682.20 679.60 678.50 673.80 671.00 668.60 667.30 662.90
(20) TOTAL 146 212 403 812 810 809 804 801 669 667 663
(22) OTHER (SPECIFY) GWH 0 0 0 0 0 0 0 0 0 0 0
(23) NET ENERGY FOR LOAD(c) GWH 12,798 12,948 13,002 13,053 13,133 13,222 13,313 13,415 13,518 13,615 13,704
Note:
(a) Firm Inter-Regional Interchange includes Seasonal and Annual PPAs starting 2018 and Nuclear PPA from MEAG starting 2021. (b) Coal includes JEA's share of Scherer 4, and Northside Coal and Petroleum Coke. (c) May not add due to rounding.

JEA 2020 Ten Year Site Plan Forecast of Facilities Requirements
34
Schedule 6.2: Energy Sources (Percent)
(1) (2) (3) (4) (5) (6) (7) (8) (9) (10) (11) (12) (13) (14)
Fuel Type Units
2020 2021 2022 2023 2024 2025 2026 2027 2028 2029 2019
(1) Firm Inter-Region Intchg. (a) % 23.8 0.5 1.6 7.5 12.8 12.3 12.2 12.5 12.0 12.0 12.3
(2) NUCLEAR % 0.0 0.0 0.0 0.0 0.0 0.0 0.0 0.0 0.0 0.0 0.0
(3) COAL(b) % 25.7 33.0 35.3 29.4 29.3 28.5 34.9 35.0 36.7 35.8 37.4
(4)
RESIDUAL
STEAM
%
0.01 0.0 0.0 0.0 0.0 0.0 0.0 0.0 0.0 0.0 0.0
(5) CC 0.0 0.0 0.0 0.0 0.0 0.0 0.0 0.0 0.0 0.0 0.0
(6) CT 0.0 0.0 0.0 0.0 0.0 0.0 0.0 0.0 0.0 0.0 0.0
(7) TOTAL 0.0 0.0 0.0 0.0 0.0 0.0 0.0 0.0 0.0 0.0 0.0
(8)
DISTILLATE
STEAM
%
0.0 0.0 0.0 0.0 0.0 0.0 0.0 0.0 0.0 0.0 0.0
(9) CC 0.0 0.0 0.0 0.0 0.0 0.0 0.0 0.0 0.0 0.0 0.0
(10) CT 0.0 0.0 0.1 0.0 0.0 0.0 0.0 0.0 0.0 0.0 0.0
(11) TOTAL 0.0 0.0 0.1 0.0 0.0 0.0 0.0 0.0 0.0 0.0 0.0
(12)
NATURAL GAS
STEAM
%
14.7 21.4 17.4 16.3 14.7 14.1 9.7 9.0 9.4 8.4 8.5
(13) CC 28.2 38.3 37.0 36.9 34.5 36.4 34.9 34.8 33.4 35.0 34.4
(14) CT 6.4 5.1 5.5 3.6 2.6 2.6 2.3 2.6 3.6 3.9 2.6
(15) TOTAL 49.3 64.8 59.9 56.8 51.8 53.1 46.9 46.5 46.4 47.3 45.5
(16) NUG % 0.0 0.0 0.0 0.0 0.0 0.0 0.0 0.0 0.0 0.0 0.0
(17)
RENEWABLES
HYDRO
%
0.0 0.0 0.0 0.0 0.0 0.0 0.0 0.0 0.0 0.0 0.0
(18)
LANDFILL GAS 0.7 1.0 1.0 1.0 1.0 1.0 1.0 1.0 0.0 0.0 0.0
(19) SOLAR 0.5 0.6 2.1 5.2 5.2 5.1 5.1 5.0 4.9 4.9 4.8
(20) TOTAL 1.1 1.6 3.1 6.2 6.2 6.1 6.0 6.0 4.9 4.9 4.8
(22) OTHER (SPECIFY) % 0.0 0.0 0.0 0.0 0.0 0.0 0.0 0.0 0.0 0.0 0.0
(23) NET ENERGY FOR LOAD (c) % 100% 100% 100% 100% 100% 100% 100% 100% 100% 100% 100%
Note: (a) Nuclear PPA with MEAG beginning 2021 is included in Firm Inter-Regional Interchange. (b) Coal includes JEA's share of Scherer 4, and Northside Coal and Petroleum Coke. (c) May not add due to rounding.

JEA 2020 Ten Year Site Plan Forecast of Facilities Requirements
35
Schedule 7.1: Summer Forecast of Capacity, Demand, and Scheduled Maintenance at Time of Peak
Year
Installed
Capacity
Firm Capacity
QF Available
Capacity
Firm
Peak
Demand
Reserve Margin
Before Maintenance
Scheduled
Maintenance
Reserve Margin
After Maintenance Import Export
MW MW MW MW MW MW MW Percent MW MW Percent
2020 2,853 40 0 0 2,894 2,516 378 0 0 378 15%
2021 2,853 40 0 0 2,894 2,512 382 0 0 382 15%
2022 2,853 115 0 0 2,969 2,510 459 0 0 459 18%
2023 2,853 215 0 0 3,069 2,505 563 0 0 563 22%
2024 2,853 215 0 0 3,069 2,507 561 0 0 561 22%
2025 2,853 215 0 0 3,069 2,507 561 0 0 561 22%
2026 2,853 215 0 0 3,069 2,506 563 0 0 563 22%
2027 2,853 200 0 0 3,053 2,497 557 0 0 557 22%
2028 2,853 200 0 0 3,053 2,499 555 0 0 555 22%
2029 2,853 200 0 0 3,053 2,491 563 0 0 563 23%

JEA 2020 Ten Year Site Plan Forecast of Facilities Requirements
36
Schedule 7.2: Winter Forecast of Capacity, Demand, and Scheduled Maintenance at Time of Peak
Year
Installed
Capacity
Firm Capacity
QF Available
Capacity
Firm
Peak
Demand
Reserve Margin
Before Maintenance
Scheduled
Maintenance
Reserve Margin
After Maintenance Import Export
MW MW MW MW MW MW MW Percent MW MW Percent
2020 3,145 40 0 0 3,185 2,764 421 0 0 421 15%
2021 3,145 65 0 0 3,210 2,773 437 0 0 437 16%
2022 3,145 115 0 0 3,260 2,781 479 0 0 479 17%
2023 3,145 215 0 0 3,360 2,792 568 0 0 568 20%
2024 3,145 215 0 0 3,360 2,809 550 0 0 550 20%
2025 3,145 215 0 0 3,360 2,823 537 0 0 537 19%
2026 3,145 215 0 0 3,360 2,840 520 0 0 520 18%
2027 3,145 215 0 0 3,360 2,859 501 0 0 501 18%
2028 3,145 200 0 0 3,345 2,875 469 0 0 469 16%
2029 3,145 200 0 0 3,345 2,891 454 0 0 454 16%

JEA 2020 Ten Year Site Plan Forecast of Facilities Requirements
37
Schedule 8: Planned and Prospective Generating Facility Additions and Changes
Planned and Prospective Generating Facility and Purchased Power Additions and Changes (1) (2) (3) (4) (5) (6) (7) (8) (9) (10) (11) (12) (13) (14) (15)
Plant Name
Unit No.
Location Unit Type
Fuel Type Fuel Transport Construction
Start Date
Commercial/ In-Service or
Change Date
Expected Retirement/ Shutdown
Date
Gen Max Nameplate
Net Capability
Status
Primary Alternate Primary Alternate Summer Winter
kW MW MW
NONE TO REPORT

JEA 2020 Ten Year Site Plan Forecast of Facilities Requirements
38
Schedule 9: Status Report and Specifications of Proposed Generating Facilities
(2020 Dollars)
1 Plant Name and Unit Number:
None to Report
2 Capacity:
3 Summer MW
4 Winter MW
5 Technology Type:
6 Anticipated Construction Timing:
7 Field Construction Start-date:
8 Commercial In-Service date:
9 Fuel:
10 Primary
11 Alternate
12 Air Pollution Control Strategy:
13 Cooling Method:
14 Total Site Area:
15 Construction Status:
16 Certification Status:
17 Status with Federal Agencies:
18 Projected Unit Performance Data:
19 Planned Outage Factor (POF):
20 Forced Outage Factor (FOF):
21 Equivalent Availability Factor (EAF):
22 Resulting Capacity Factor (%):
23 Average Net Operating Heat Rate (ANOHR):
24 Projected Unit Financial Data:
25 Book Life:
26 Total Installed Cost (In-Service year $/kW):
27 Direct Construction Cost ($/kW):
28 AFUDC Amount ($/kW):
29 Escalation ($/kW):
30 Fixed O&M ($/kW-yr):
31 Variable O&M ($/MWh):

JEA 2020 Ten Year Site Plan Forecast of Facilities Requirements
39
Schedule 10: Status Report and Specification of Proposed Directly
Associated Transmission Lines
1 Point of Origin and Termination
None To Report
2 Number of Lines
3 Right of Way
4 Line Length
5 Voltage
6 Anticipated Construction Time
7 Anticipated Capital Investment
8 Substations
9 Participation with Other Utilities

JEA 2020 Ten Year Site Plan Other Planning Assumptions and Information
40
4. Other Planning Assumptions and Information
4.1 Fuel Price Forecast
JEA uses a diverse mix of fuels in its generating units. The fuel price projections include natural
gas, coal, petroleum coke, uranium and diesel fuel.
The fuel price projections used in this forecast were developed based on long-term price forecasts
from the Annual Energy Outlook 2020 (AEO2020) issued by the U.S. Energy Information
Administration (EIA). The AEO2020 presents projections of energy supply, demand, and prices
through 2050. AEO2020 projections are based on results from the EIA’s National Energy
Modeling System (NEMS). NEMS is a computer based energy-economy modeling system of U.S.
energy markets. NEMS projects the production, imports, conversion, consumption, and prices of
energy, subject to a variety of assumptions related to macroeconomic and financial factors, world
energy markets, resource availability and costs, behavioral and technological choice criteria, cost
and performance characteristics of energy technologies, and demographics.
Scherer 4 burns Powder River Basin (PRB) coal. Projections of the commodity price for PRB
coal are based on existing coal contracts through 2022 and then escalated using AEO2020
projections for Wyoming PRB coal. The transportation component of the delivered price
projection was derived from existing contracts and escalated by an inflation rate of 1.9%
thereafter. The inflation rate of 1.9% originates from the AEO2020.
Northside units 1 and 2 currently burn a blend of petroleum coke and coal. These units are
projected to burn 60 percent petroleum coke and 40 percent coal during the forecast period. The
Northside coal price projections are based on 1/29/20 settle prices of short-term NYMEX API2
Argus-McCloskey coal futures and then escalated using AEO2020 projections for Interior coal.
Freight rates for waterborne delivery of Colombian coal were based on the historical average over
the last five years and escalated using the AEO2020 inflation rate to project transportation costs
beyond 2020. A ratio of historical delivered petroleum coke and coal prices over the past year
was applied to the delivered Northside coal price projections to derive the projected petroleum
coke price.
JEA currently operates eight units utilizing natural gas as a primary fuel. These units are GEC
GT1 and GT2, Brandy Branch GT1, CT2 and CT3, Northside 3, and Kennedy GT7 and GT8. The
natural gas price projection was based on the 1/29/20 settle prices of short-term NYMEX natural
gas strip and then escalated using AEO2020 Henry Hub price forecast. The transportation costs
are a combination of historical Florida city gate market costs on Florida Gas Transmission and
local distribution fees.
The 1970’s-vintage combustion turbine units at Northside Generating Station (GT3, GT4, GT5,
and GT6) burn diesel fuel as the primary fuel type. Five JEA units utilize diesel fuel as an
alternative to natural gas: Kennedy GT7 and GT8, GEC GT1 and GT2, and Brandy Branch GT1.
Projections for the price of diesel fuel are based on 1/29/20 settle prices of short-term NYMEX

JEA 2020 Ten Year Site Plan Other Planning Assumptions and Information
41
ultra-low sulfur diesel futures pricing and then escalated using AEO2020 projections for ultra-low
sulfur diesel.
JEA has a purchase power agreement with MEAG for 200MW from Vogtle Units 3 and 4 currently
under construction in Georgia with planned in-service dates of 2021 and 2022. The fuel price
forecast accounts for the costs of mine-mouth uranium, enrichment and fabrication.
4.2 Economic Parameters
This section presents the parameters and methodology used for economic evaluations as part of
JEA’s least-cost expansion plan to satisfy forecast capacity requirements throughout the TYSP
period.
Inflation and Escalation Rates
The general inflation rate, construction cost escalation rate, fixed O&M escalation rate, and
nonfuel variable O&M escalation rate are each assumed to be 1.9 percent.
Municipal Bond Interest Rate
JEA performs sensitivity assessments of project cost to test the robustness of JEA’s resource
plan. Project cost includes forecast of direct cost of construction, indirect cost, and financing cost.
Financing cost includes the forecast of long term tax-exempt municipal bond rates, issuance cost,
and insurance cost. For JEA’s plan development, the long term tax-exempt municipal bond rate
is assumed to be 4.50 percent. This rate is based on JEA’s judgment and expectation that the
long term financial markets will return to historical stable behavior under more stable economic
conditions.
Present Worth Discount Rate
The present worth discount rate is assumed to be equal to the tax-exempt municipal bond interest
rate of 4.50 percent.
Interest During Construction Interest Rate
The interest during construction rate, or IDC, is assumed to be 4.50 percent.
Levelized Fixed Charge Rate
The fixed charge rate (FCR) represents the sum of a project’s fixed charges as a percent of the
initial investment cost. When the FCR is applied to the initial investment, the product equals the
revenue requirements needed to offset the fixed charges during a given year. A separate FCR
can be calculated and applied to each year of an economic analysis, but it is common practice to
use a single, levelized FCR (LFCR) that has the same present value as the year-by-year fixed
charge rate.

JEA 2020 Ten Year Site Plan Other Planning Assumptions and Information
42
Different generating technologies are assumed to have different economic lives and therefore
different financing terms. Simple cycle combustion turbines are assumed to have a 20-year
financing term; while natural gas-fired combined cycle units are assumed to be financed over 25
years. Given the various economic lives and corresponding financing terms, different LFCRs
were developed.
All LFCR calculations assume the 4.50 percent tax-exempt municipal bond interest rate, a
1.00 percent bond issuance fee, and a 0.50 percent annual property insurance cost. The resulting
20-year fixed charge rate is 8.265 percent and the 25-year fixed charge rate is 7.312 percent.

JEA 2020 Ten Year Site Plan Environmental and Land Use Information
43
5. Environmental and Land Use Information
JEA does not have any capacity build projects underway or planned for the term of this Ten Year
Site Plan. Therefore, there are no potential sites in which to report environmental and land use
information.