arab barometer ii · pdf filearab barometer ii iraq country report july 2012 ... pious...
TRANSCRIPT

Arab Barometer II
Iraq Country Report July 2012
Michael Hoffman
Princeton University

Arab Barometer Report: Iraq Michael Hoffman, Princeton University
Introduction
The second wave of the Arab Barometer survey was conducted in Iraq between February
20th
and March 12th
of 2012. As Iraq was not included in the first wave of the Arab Barometer,
this survey was the first of its kind in the country. This report outlines the views of Iraqi citizens
on issues of religion, economic and political outlooks, satisfaction with the government and other
institutions, trust, attitudes towards women, and views of the United States. It also examines
differences (where applicable) between Sunni’s and Shi’ites as well as between Arabs and
Kurds.
1,236 respondents were included in this survey. The sample covered by the survey was
52.7% male and 47.3% female. Table 1 presents the distribution of respondents according to age
group. As shown in the table, about 75% of the respondents were age 45 or under. The ethnic
composition of the sample is as follows: 83.5% Arab, 14.6% Kurdish, 1.9% other.
Table 1: Ages of Respondents
Age Group Frequency Percent
18-25 334 27.02
26-35 318 25.73
36-45 264 21.36
46+ 320 25.89
Total 1,236 100
Table 2 displays the distribution of religious affiliations within the sample. About 80%
of respondents identified as either Sunni or Shi’ite (37.5% and 43.75%, respectively), but 18% of
respondents identified themselves simply as Muslims. 7 respondents (0.6% of the total sample)
identified themselves as Christians.
Table 2: Religious Affiliation
Religion Frequency Percent
Christian 7 0.57
Sunni 462 37.50
Shi'ite 539 43.75
Muslim (Unspecified) 224 18.18
Total 1,232 100

Figure 1 presents the distribution of respondents’ education levels. The modal
respondent possessed an elementary education, with slightly fewer holding a preparatory/basic
education. About two-thirds of the respondents had completed an education level between
elementary and secondary. 13% of respondents held a BA, while only 4 respondents (0.3%)
possessed a MA or above.
Figure 1: Education Level
0
.05
.1.1
5.2
.25
Den
sity
Sec
onda
ry
Dip
lom
a/Pro
fess
iona
l
Illite
rate
/Lite
rate B
A
Pre
para
tory
/Bas
ic
MA a
nd A
bove
Elem
enta
ry
Level of Education

Figure 2 displays the distribution of income within the sample. The average household
income is 616,413 dinar (about 530 USD) per month. The 25th
percentile of income in the
sample was 400,000 dinar; the 75th
percentile was 815,000. 10% of respondents reported a
monthly household income of less than 30,000 dinar (about 26 USD). Sunnis reported an
average monthly income of 536,066 dinar (460 USD), compared to 706,506 dinar (606 USD) for
Shi’ites. Among Arabs, the average monthly income was 661,149 dinar (567 USD); for Kurds,
377,862 dinar (324 USD).
Figure 2: Monthly Household Income
01
02
03
0
Pe
rce
nt
0 500000 1000000 1500000Monthly Income

Religion
Religion is known to be an important feature of Iraqi life, but there exists considerable
variation in the ways in which individuals practice their religion as well as their views about
religion and politics. Figure 3 displays the proportion of individuals of each sect who engage in
various types of religious behavior. The overwhelming majority of both Sunnis and Shi’ites pray
daily, and the difference between sects in this regard is minimal. However, Shi’ites are over 10
percentage points more likely than Sunnis to read the Qur’an regularly, but Sunnis are almost 20
percentage points more likely to regularly attend Friday prayers. In total, 78% of Iraqis pray
daily, 68% read or listen to the Qur’an regularly, and 48% attend Friday prayers regularly.
Figure 3: Religiosity, by Sect
0.2
.4.6
.8
Pro
port
ion
Always Prays Daily Reads Qur'an Alwaysor Most of the Time
Attends Friday Prayers Alwaysor Most of the Time
Sunni Shi'a
It is important to ask, however, how Iraqis view members of other sects, and how these
views translate into political attitudes. Overall, most Iraqis state that they would not mind
having members of other religions as neighbors. However, Sunnis are slightly less likely to
agree to this statement (78%) than are Shi’ites (83%). Figure 4 displays the proportion of
respondents who answered “agree” or “strongly agree” to questions about separation of religion
and politics. On the whole, most Iraqis (72%) agreed that religious practices should be kept as a
private matter and separated from public life. An even higher proportion (85%) agreed that
religious leaders should not interfere in voters’ decisions. In this question, however, a significant
sectarian difference is present: Sunnis are over 10 percentage points more likely than Shi’ites to

agree with this statement. Less than one-third of respondents (31%) agreed that Islamic law was
appropriate for their country, with Shi’ites about 3 percentage points more likely than Sunnis to
agree. Sunnis (51%) were substantially more likely than Shi’ites (38%) to state that it was
important to them that a political candidate was from their sect. This difference may be related
to perceptions about treatment of Sunnis under the current regime; it is likely that Sunnis believe
that it is particularly important that members of their sect are elected to public office in order to
preserve the rights of the Sunni community.
Figure 4: Religion and Politics, by Sect
0.2
.4.6
.81
Pro
port
ion: A
gre
e
Religious practices are private and should beseparated from social and political life.
Religious leaders (imams, preachers, priests)should not interfere in voters’
decisions in elections.
Sunni Shi'a

Figure 5 demonstrates that attitudes towards religion and politics differ somewhat by age
group. Younger groups are less likely to support Islamic law than are older respondents, but are
not clearly distinguishable from the older generations on the questions of “religious practices are
private” and “religious leaders should not interfere in voters’ decisions.” Thus, younger
respondents were not necessarily more supportive of secular politics than were their older
counterparts; majorities of respondents in each age group reported support for secular politics.
Figure 5: Religion and Politics, by Age
.75
.65
.73.76
.87
.81
.9
.84
.29.32
.3
.34
0.2
.4.6
.81
Pro
port
ion:
Agre
e
Religious Practices are Private Religious Leaders Should NotInterfere in Voters' Decisions
Islamic Law is Appropriate for Iraq
18-25 26-35
36-45 46+

Figure 6 reveals that a clearer trend in attitudes towards religion and politics emerges
when comparing education levels. More educated respondents are much more likely to believe
that religious practices are private; the most educated individuals were 27 percentage points
more likely to agree to this statement than were the least educated. Likewise, the most educated
respondents were 12 percentage points less likely than the least educated to believe that Islamic
law is appropriate for Iraq. In general, higher education levels were associated with greater
support for secular politics.
Figure 6: Religion and Politics, by Education
.48
.64
.76.81 .81
.75
.88 .9
.84.86
.82.8
.4
.32 .31 .31 .29 .28
0.2
.4.6
.81
Pro
port
ion:
Agre
e
Religious Practices are Private Religious Leaders Should NotInterfere in Voters' Decisions
Islamic Law is Appropriate for Iraq
Illiterate/Literate Elementary
Preparatory/Basic Secondary
Mid-Level Diploma BA and Above

Attitudes towards religion and politics might also be a function of personal piety. For
this reason, Figure 7 divides respondents according to whether or not they pray daily. While
non-prayers are similar to those who pray on the question of the privacy of religious practices,
differences are present in the other two questions: those who pray were ten percentage points
more likely to agree that religious leaders should not interfere in voters’ decisions, but seven
percentage points more likely to support Islamic law in Iraq. Thus, it is not simply the case that
pious individuals support a fusion of religion and politics; while those who pray daily support
Islamic law with a higher frequency, they are also more likely to believe that religious leaders
should not influence voters’ decisions.
Figure 7: Religion and Politics, by Daily Prayer
.73 .72
.78
.88
.26
.33
0.2
.4.6
.8
Pro
port
ion:
Agre
e
Religious Practices are Private Religious Leaders Should NotInterfere in Voters' Decisions
Islamic Law is Appropriate for Iraq
Does Not Pray Daily Prays Daily

Economy
Figure 8 reveals that the vast majority of Iraqis responded that economic issues were the
most important challenges facing the country today. 67% of respondents identified “the
economic situation” as the primary challenge, with an additional 25% citing “financial and
administrative corruption.” Perhaps surprisingly, very few respondents pointed to security or
sectarian issues as the primary challenge facing the country. Likewise, only a very small portion
of respondents pointed to the building of democracy as the most important challenge facing the
country. Clearly, Iraqis are highly concerned about the state of the economy.
Figure 8: Most Important Challenge Facing Iraq
0.2
.4.6
.8
De
nsity
The E
cono
mic S
ituat
ion
Finan
cial a
nd A
dministra
tive
Cor
rupt
ion
Enhan
cing
and
Stre
ngth
enin
g Dem
ocra
cy
Reso
lutio
n of t
he P
ales
tinia
n Q
uest
ion
Achie
ving
Sta
bility
and
Inte
rnal
Sec
urity
Curb
ing
Foreign
Inte
rfere
nce
Secta
rianis
m
Divisio
n of
Iraq
alo
ng S
ecta
rian/
Ethnic
Line
s
What is the most important challenge Iraq is facing today?

This issue, however, involves a sectarian dimension as well. Figure 9 shows that while
47% of Shi’ites reported that the economic situation in Iraq was “good,” only 26% of Sunnis
made similar statements. There is evidence that economic conditions have disproportionately
impacted Sunnis, at least in the area of perceptions of the economy. This difference is also
related to the difference in incomes reported above: Sunnis are, on average, poorer than Shi’ites,
and this difference is quite possibly linked to their economic evaluations of the country.
Figure 9: Economic Evaluation, by Sect
0.1
.2.3
.4.5
Sunni Shi'a
Pro
po
rtio
n:
Eco
no
mic
Situ
atio
n "
Go
od
"

Figure 10 reveals that ethnicity is also an important factor in distinguishing respondents’
economic evaluations. Nearly 60% of Kurds reported that the economic situation was “good” or
“very good” in Iraq, compared to just 34% among Arabs. This distinction cannot be explained
by income, as the average Kurd in the sample was substantially poorer than the average Arab. A
more likely explanation is that citizens evaluate the country’s economic situation in comparison
to its past economic conditions; thus, while economic conditions may not have improved for
Arabs, they might have improved substantially for Iraqi Kurds.
Figure 10: Economic Evaluation, by Ethnicity
0.2
.4.6
Arab Kurdish
Pro
po
rtio
n:
Eco
no
mic
Situ
atio
n "
Go
od
"
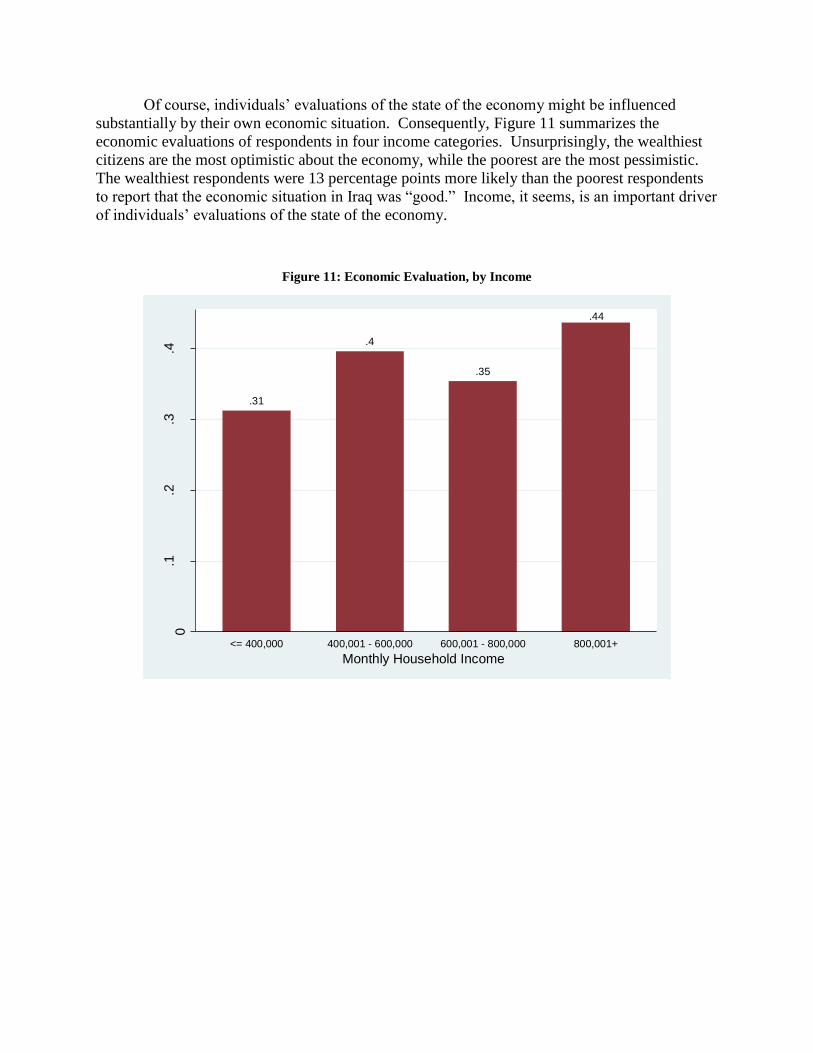
Of course, individuals’ evaluations of the state of the economy might be influenced
substantially by their own economic situation. Consequently, Figure 11 summarizes the
economic evaluations of respondents in four income categories. Unsurprisingly, the wealthiest
citizens are the most optimistic about the economy, while the poorest are the most pessimistic.
The wealthiest respondents were 13 percentage points more likely than the poorest respondents
to report that the economic situation in Iraq was “good.” Income, it seems, is an important driver
of individuals’ evaluations of the state of the economy.
Figure 11: Economic Evaluation, by Income
.31
.4
.35
.44
0.1
.2.3
.4
Pro
port
ion:
Econ
om
ic S
itua
tion
Go
od
<= 400,000 400,001 - 600,000 600,001 - 800,000 800,001+
Monthly Household Income
Politics and Democracy
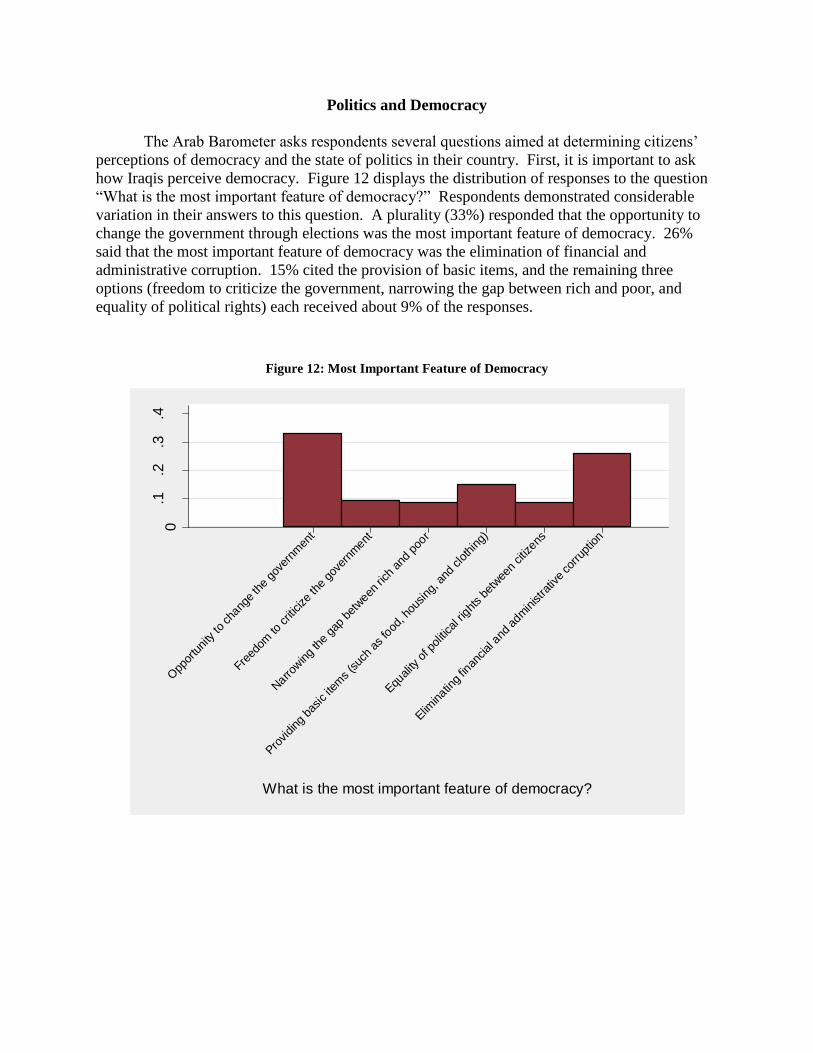
The Arab Barometer asks respondents several questions aimed at determining citizens’
perceptions of democracy and the state of politics in their country. First, it is important to ask
how Iraqis perceive democracy. Figure 12 displays the distribution of responses to the question
“What is the most important feature of democracy?” Respondents demonstrated considerable
variation in their answers to this question. A plurality (33%) responded that the opportunity to
change the government through elections was the most important feature of democracy. 26%
said that the most important feature of democracy was the elimination of financial and
administrative corruption. 15% cited the provision of basic items, and the remaining three
options (freedom to criticize the government, narrowing the gap between rich and poor, and
equality of political rights) each received about 9% of the responses.
Figure 12: Most Important Feature of Democracy
0.1
.2.3
.4
De
nsity
Opp
ortu
nity to
cha
nge
the
gove
rnm
ent
Freed
om to
crit
icize th
e go
vern
ment
Providing
bas
ic item
s (s
uch a
s fo
od, h
ousing
, and
clo
thin
g)
Eliminatin
g fin
ancial
and
adm
inistra
tive
corrup
tion
Equality
of p
olitica
l rig
hts
betw
een
citiz
ens
Narro
wing
the g
ap b
etween
rich
and
poo
r
What is the most important feature of democracy?

Iraqis vary considerably in their belief in the suitability of democracy for their country.
Figure 13 displays the distribution of respondents according to how suitable they believe
democracy to be for Iraq. For this question, respondents were asked to provide an answer on a
scale of 1 to 10, where 1 means “absolutely inappropriate” and 10 means “completely
appropriate” Most citizens are located near the center of this distribution, but over 10% believe
that democracy is not at all suitable for the country. Few respondents placed themselves at the
“completely appropriate” extreme, suggesting that most Iraqis are not perfectly convinced of the
suitability of democracy for their country.
Figure 13: Suitability of Democracy for Iraq
0
.05
.1.1
5.2
Den
sity
0 2 4 6 8 10To what extent do you think democracy is appropriate for Iraq?

How, then, do citizens perceive the state of politics in their country? Figure 14 displays
the distribution of responses about government satisfaction on a scale of 1 to 10. Few
respondents gave the government a score of 7 or higher, but many citizens placed the
government somewhere in the middle of the scale. These results suggest that citizens are, on
average, neither entirely satisfied nor entirely dissatisfied with the performance of their fledgling
government. Once again, a sectarian distinction emerges in this question: the average Shi’ite
gave the government a score of 4.5, compared to only 3.4 for the average Sunni. Similarly,
Kurds were significantly more optimistic about the performance of the government: the average
Kurd gave the government a score of 5.4, compared to 3.7 among Arabs. These differences are
symptomatic of a larger trend, which is discussed in detail below.
Figure 14: Satisfaction with Government
0
.05
.1.1
5.2
De
nsity
0 2 4 6 8 10To what extent are you satisfied with the government’s performance?

Levels of trust in political institutions depend considerably on the institution considered.
Most Iraqis trust the army and the police, but less than 20% of respondents from either sect trust
political parties (this result is mirrored in the finding that only 3% of respondents said that they
belonged to a political party). Sectarian differences are also present in levels of trust for several
of these institutions. Shi’ites are more than twice as likely to trust the government. Likewise,
they are 13 percentage points more likely to trust the police, and 22 percentage points more
likely to trust the army. While the difference between sects in levels of trust is minimal for a few
of these institutions, Shi’ites exhibited higher levels of trust in every one of these institutions.
Figure 15: Trust in Institutions, by Sect
0.2
.4.6
.8
Pro
port
ion: T
rust a
Gre
at o
r a
Me
diu
m E
xte
nt
Gov
ernm
ent
Judiciar
y
Par
liam
ent
Police
Par
ties
Arm
y
Civil Soc
iety
Sunni Shi'a

Trust in institutions is, of course, related to preferences regarding regime types. Figure
16 presents the levels of support for various regimes by sect. Both Sunni’s and Shi’ites exhibited
levels of support for democracy in excess of 90%, and a majority of respondents expressed
support for rule by experts, with no substantial difference between sects. On the issue of
authoritarian government (“a political system with an authoritarian president (non-democratic)
who is indifferent to parliament and elections”), however, considerable differences emerge:
Sunnis were four times as likely to support authoritarian government as were Shi’ites (who
almost never reported support for authoritarian rule). Much of this difference can be explained
by the different experiences of these groups under the regime of Saddam Hussein.
Figure 16: Attitudes Toward Regimes, by Sect
0.2
.4.6
.81
Pro
port
ion: G
oo
d o
r V
ery
Goo
d fo
r Ir
aq
Democratic System Authoritarian System Rule by Experts
Sunni Shi'a

Figure 17 displays respondents’ attitudes towards these regime types while
dividing respondents according to education level. More educated respondents were the
most supportive of democracy; the most educated group was 13 percentage points more
likely to support democracy than was the least educated group. At the same time,
however, the most educated group also demonstrated greater support for authoritarian
rule than any of the other groups. On the question of “rule by experts,” no clear trend is
discernable.
Figure 17: Attitudes Toward Regimes, by Education
.84
.95.93 .93 .94
.97
.12 .12 .120.08
.12.14
.71
.78.74 .74
.68.71
0.2
.4.6
.81
Pro
port
ion:
Go
od
or
Very
Goo
d fo
r Ir
aq
Democratic System Authoritarian System Rule by Experts
Illiterate/Literate Elementary
Preparatory/Basic Secondary
Mid-Level Diploma BA and Above
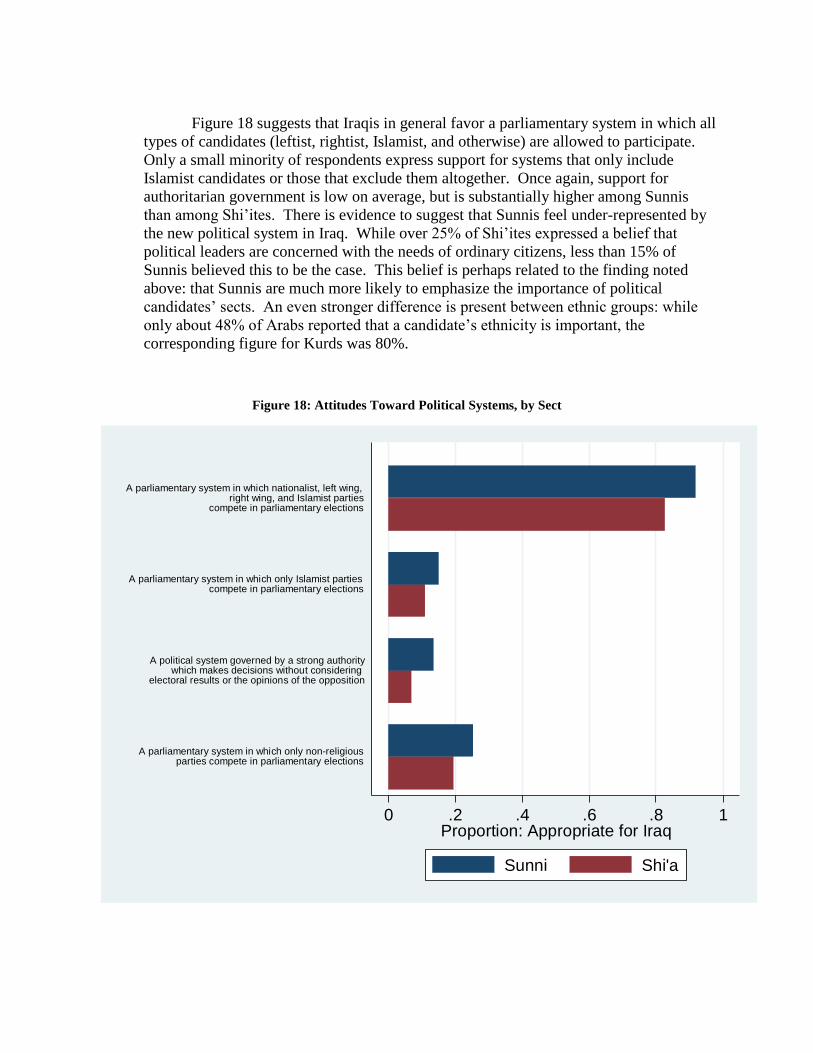
Figure 18 suggests that Iraqis in general favor a parliamentary system in which all
types of candidates (leftist, rightist, Islamist, and otherwise) are allowed to participate.
Only a small minority of respondents express support for systems that only include
Islamist candidates or those that exclude them altogether. Once again, support for
authoritarian government is low on average, but is substantially higher among Sunnis
than among Shi’ites. There is evidence to suggest that Sunnis feel under-represented by
the new political system in Iraq. While over 25% of Shi’ites expressed a belief that
political leaders are concerned with the needs of ordinary citizens, less than 15% of
Sunnis believed this to be the case. This belief is perhaps related to the finding noted
above: that Sunnis are much more likely to emphasize the importance of political
candidates’ sects. An even stronger difference is present between ethnic groups: while
only about 48% of Arabs reported that a candidate’s ethnicity is important, the
corresponding figure for Kurds was 80%.
Figure 18: Attitudes Toward Political Systems, by Sect
0 .2 .4 .6 .8 1Proportion: Appropriate for Iraq
A parliamentary system in which only non-religiousparties compete in parliamentary elections
A political system governed by a strong authoritywhich makes decisions without considering
electoral results or the opinions of the opposition
A parliamentary system in which only Islamist partiescompete in parliamentary elections
A parliamentary system in which nationalist, left wing,right wing, and Islamist parties
compete in parliamentary elections
Sunni Shi'a

Similar trends emerge in response to the question “To what extent do you feel that you
are being treated equally to other citizens in Iraq?” 33% of Sunnis responded that they felt they
were treated equally “to a great extent” or “to a medium extent,” compared to 39% among
Shi’ites. The difference is starker between ethnic groups: Kurds were 24 percentage points more
likely than Arabs to give a positive response to this question.
Another important issue is the matter of perceptions about security. When respondents
were asked “Do you currently feel that your own personal as well as your family’s safety and
security are ensured or not?”, 58% responded that they felt their safety was either “ensured” or
“fully ensured,” while 42% responded that their safety was “not ensured” or “absolutely not
ensured.” Figure 19 displays the perceptions of safety, divided by education level. In general,
the least educated citizens felt safer than the more educated groups. Indeed, citizens in the
lowest education category were 20 percentage points more likely than those in the highest
category to report that they felt that their safety was ensured.
Figure 19: Perceptions of Safety, by Education
.75
.6 .6
.49
.57.55
0.2
.4.6
.8
Pro
port
ion:
Safe
ty E
nsu
red
Illiterate/Literate Elementary Preparatory/Basic Secondary Mid-Level Diploma BA and Above

Political Participation
Figure 20 reveals that Iraqis, on average, are only somewhat interested in politics. Barely
10% of respondents stated that they were “very interested” in politics, a figure that is comparable
to the proportion who said they were “not interested.” About 80% of respondents placed
themselves in the categories of “interested” or “slightly interested.” Figure 21 displays the
proportions of individuals who use various media sources to follow politics at least a few times
per month. Television constitutes the bulk of media access regarding politics for most Iraqis,
with nearly all respondents stating that they follow television for political news at least a few
times per month. Radio is the second-most frequent source, with slightly over half of
respondents using the radio at least a few times per month for political news. The press, whether
daily or weekly, is only used by a minority of respondents. Internet penetration in the area of
political news remains low, with less than 20% of respondents stating that they use the internet at
least a few times per month for political news.
Figure 20: Interest in Politics
0.1
.2.3
.4
De
nsity
Very Interested Interested Not InterestedSlightly Interested
In general, to what extent are you interested in politics?

Figure 21: Media Usage
TV
Daily Press
Weekly Press
Radio
Internet
0.2
.4.6
.81
Pro
port
ion: F
ollo
ws a
t le
ast a
few
tim
es p
er
mo
nth
Figure 22 summarizes the frequency of various types of political participation among
Iraqis. Most Iraqis (84%) reported voting in the most recent elections, but only a small minority
reported participating in protest or attending campaign meetings (18% in each case.) Figure 23
reveals that a considerable gender gap exists in the area of political participation. Men were
about 8 percentage points more likely to vote than were women, more than twice as likely to
protest, and nearly twice as likely to attend campaign meetings.

Figure 22: Political Participation
.84
.18 .18
0.2
.4.6
.8
Pro
port
ion:
Part
icip
ate
d
Voting Attend Campaign Meetings
Protest
Figure 23: Political Participation, by Gender
.88
.8
.22
.13
.23
.11
0.2
.4.6
.8
Pro
port
ion:
Part
icip
ate
d
Voting Attend Campaign Meetings Protest
Male Female

As Figure 24 demonstrates, some differences exist in levels of political participation
across levels of education. These differences were starkest in the area of protest: the most
educated respondents were nearly three times as likely to engage in protest compared to the least
educated respondents. Likewise, the most educated respondents were about 5 percentage points
more likely to attend campaign meetings than were the least educated. As the figure illustrates,
however, these trends are not entirely linear, and no clear trend is present in frequency of voting.
Figure 24: Political Participation, by Education Level
.86.83
.79 .81
.91 .89
.16 .18 .17.21
.14
.21
0.08
.19 .19
.14
.19.23
0.2
.4.6
.81
Pro
port
ion:
Part
icip
ate
d
Voting Attend Campaign Meetings Protest
Illiterate/Literate Elementary
Preparatory/Basic Secondary
Mid-Level Diploma BA and Above

Figure 25 presents the frequencies of these types of political participation divided by age
group. Voting and attending campaign meetings both increase monotonically with age: each
older age group is more likely than all younger groups to engage in these types of participation.
The trend for protest is not so clear: the age group who was most likely to protest was the 36-45
age group, with the youngest and the oldest age groups less likely than all others.
Figure 25: Political Participation, by Age
.81 .82
.87 .87
.15 .17.2 .2
.16.19
.2.16
0.2
.4.6
.8
Pro
port
ion:
Part
icip
ate
d
Voting Attend Campaign Meetings Protest
18-25 26-35
36-45 46+

Finally, Figure 26 presents the frequencies of each type of political participation by
income level. The only type of political participation that demonstrates anything close to a clear
trend is attending campaign meetings: individuals in the highest income group were about 50%
more likely than others to engage in this type of behavior. Voting behavior does not exhibit a
clear trend: the richest and poorest groups were only separated by about 2 percentage points, and
both were more likely to vote than were than middle income groups. Propensity to protest was
mostly similar across income groups, and no monotonic trend is present.
Figure 26: Political Participation, by Income
.88
.82.78
.86
.16 .15 .16
.24
.19.15
.2.17
0.2
.4.6
.8
Pro
port
ion:
Part
icip
ate
d
Voting Attend Campaign Meetings Protest
<= 400,000 400,001 - 600,000
600,001 - 800,000 800,001+

Attitudes Towards Women
Questions regarding women’s rights provided mixed findings. Figure 27 displays the
proportion of respondents who agreed with various positions regarding women. On the one
hand, fewer than 50% of respondents believed that a woman could become president or prime
minister of a Muslim state. Likewise, over 75% agreed that men are better than women at
political leadership. At the same time, however, barely a quarter of respondents believed that
university education is more important for men than it is for women, and 72% of respondents
stated that men and women should have equal work opportunities. Thus, Iraqis in general appear
to be much more supportive of equality for women in economic matters than in political matters.
Figure 27: Attitudes Towards Women
A woman can become theprime minister or president
of a Muslim state
In general, men arebetter at political
leadership than women
University education formales is more importantthan university education
for females
Men and womenshould have
equal work opportunities
0.2
.4.6
.8
Pro
port
ion: A
gre
e

Figure 28 displays the differences between men and women with regard to questions of
women’s rights. For each question, women were more supportive than men of women’s
equality, but the differences are not as sharp as might be expected. Only half of women
responded that a woman could be the political leader of a Muslim country, and 72% of women
agreed that men make better political leaders than women. For each of these questions, the
proportion of women agreeing to the statement was within 8 percentage points of the proportion
of men, suggesting that while some gender differences emerge, there is not a tremendous gender
gap in Iraq with regard to attitudes towards women.
Figure 28: Attitudes Towards Women, by Gender
.42
.5
.28
.23
.7
.74
.78
.72
0.2
.4.6
.8
Pro
port
ion:
Agre
e
Woman PM OKIn Muslim Country
Men's EducationMore Important
Men and Women Should HaveEqual Work Opportunities
Men Make BetterPolitical Leaders
Male Female

Figure 29 summarizes respondents’ attitudes towards women by age group. Once again,
while differences between groups are present, they are not overwhelmingly large. Moreover,
these trends are not linear. Older age groups were about 5 percentage points more likely to agree
that men’s education is more important than women’s. No clear pattern is present in the question
of female political leaders in a Muslim country, but younger groups are less likely to believe that
men make better political leaders (with the exception of the oldest age group, which is
comparable to the youngest two with regard to this question). In the area of equal work
opportunities, the age groups are largely similar.
Figure 29: Attitudes Towards Women, by Age
.5
.41
.49
.44
.24.22
.29.27
.73 .73.69
.72 .72
.76
.8
.74
0.2
.4.6
.8
Pro
port
ion:
Agre
e
Woman PM OKIn Muslim Country
Men's EducationMore Important
Men and Women Should HaveEqual Work Opportunities
Men Make BetterPolitical Leaders
18-25 26-35
36-45 46+

It is conceivable that attitudes towards women might be driven, in part, by personal piety.
To this end, Figure 30 summarizes respondents’ attitudes towards women while dividing them
by whether or not they pray daily. Individuals who always prayed daily were much more likely
to support women’s equality than those who did not. Non-prayers were 13 percentage points
more likely to agree that a woman could be the leader of a Muslim country, 3 percentage points
less likely to agree that men’s education is more important, 12 percentage points more likely to
support equal work opportunities for women, and 36 percentage points less likely to believe that
men make better political leaders. It appears that personal piety associated with less support for
gender equality.
Figure 30: Attitudes Towards Women, by Daily Prayer
.56
.43
.23.26
.81
.69
.47
.83
0.2
.4.6
.8
Pro
port
ion:
Agre
e
Woman PM OKIn Muslim Country
Men's EducationMore Important
Men and Women Should HaveEqual Work Opportunities
Men Make BetterPolitical Leaders
Does Not Pray Daily Prays Daily

Views of the United States
Attitudes toward the United States (and particularly, its involvement in Iraq) follow
sectarian and ethnic patterns in accordance with the experiences of different groups in pre- and
post-invasion Iraq. Figure 31 displays the distribution (by sect) of responses to a question about
the influence of the United States on the development of democracy in Iraq. While a majority of
Sunnis believe that the American influence on Iraqi democracy has been negative, the modal
response among Shi’a was “somewhat positive.”
Figure 31: US Influence on Democracy in Iraq, by Sect
0.2
.4
Ver
y Pos
itive
Som
ewha
t Pos
itive
Nei
ther
Pos
itive
nor
Neg
ative
Som
ewha
t Neg
ative
Ver
y Neg
ative
Ver
y Pos
itive
Som
ewha
t Pos
itive
Nei
ther
Pos
itive
nor
Neg
ative
Som
ewha
t Neg
ative
Ver
y Neg
ative
Sunni Shi'a
De
nsity
Do you think the influence of the United States on the development of democracy in Iraq has been:

Figure 32 presents the distribution of answers to the same question, but divided by
ethnicity rather than sect. Once again, a difference between groups emerges. Kurds were
substantially more likely than Arabs to evaluate the influence of the United States on Iraqi
democracy as positive. Taken together, these results suggest that attitudes towards American
involvement are, in no small part, a function of the comparative experiences of various groups
under Saddam Hussein; the comparison of before and after the US invasion leads to different
evaluations of American influence by different groups.
Figure 32: US Influence on Democracy in Iraq, by Ethnicity
0.2
.4
Ver
y Pos
itive
Som
ewha
t Pos
itive
Nei
ther
Pos
itive
nor
Neg
ative
Som
ewha
t Neg
ative
Ver
y Neg
ative
Ver
y Pos
itive
Som
ewha
t Pos
itive
Nei
ther
Pos
itive
nor
Neg
ative
Som
ewha
t Neg
ative
Ver
y Neg
ative
Arab Kurdish
De
nsity
Do you think the influence of the United States on the development of democracy in Iraq has been:
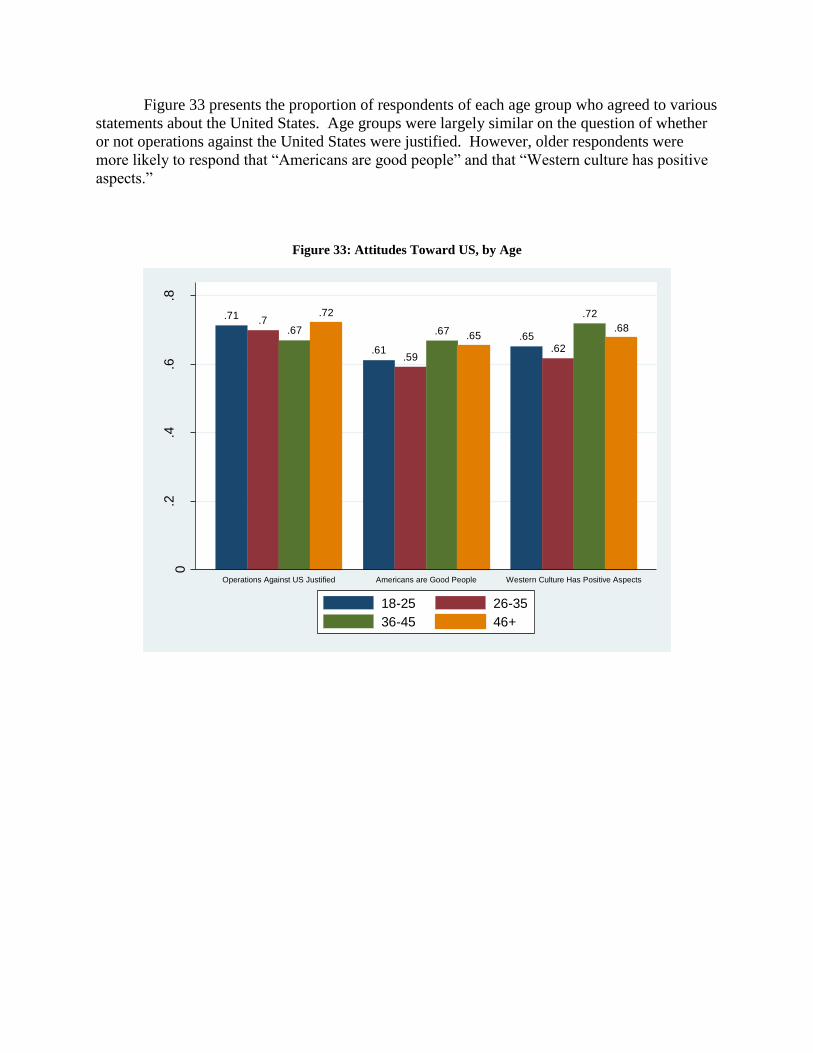
Figure 33 presents the proportion of respondents of each age group who agreed to various
statements about the United States. Age groups were largely similar on the question of whether
or not operations against the United States were justified. However, older respondents were
more likely to respond that “Americans are good people” and that “Western culture has positive
aspects.”
Figure 33: Attitudes Toward US, by Age
.71 .7.67
.72
.61.59
.67 .65 .65.62
.72
.68
0.2
.4.6
.8
Pro
port
ion:
Agre
e
Operations Against US Justified Americans are Good People Western Culture Has Positive Aspects
18-25 26-35
36-45 46+

Figure 34 presents the proportion of respondents who agreed to various statements about
the United States, by sect. Shi’ites were more likely than Sunnis to agree that “Americans are
good people” and that “American and Western culture has positive aspects.” Interestingly,
however, Shi’ites were also more likely to agree that American interference in the region
justifies armed operations against the United States everywhere. On the whole, a majority of
Iraqis agreed that such operations were justified, but a majority also stated that Americans are
good people and that American culture has positive aspects.
Figure 34: Attitudes Toward US, by Sect
0.2
.4.6
.8
Pro
port
ion: A
gre
e
The United States’ interference inthe region justifies armed operationsagainst the United States everywhere
Despite negative U.S. foreign policy, Americans
are good people
American and Western culturehas positive aspects
Sunni Shi'a

Figure 35, which presents the results of the same questions, but divided by ethnicity
rather than sect, suggests a clearer trend. Kurds are, on average, much more supportive of the
United States than are Iraqi Arabs. Less than 40% of Kurds stated that armed operations are
justifiable against the United States everywhere (compared to 74% among Arabs), and over 70%
agreed that Americans are good people and that American culture has positive aspects. Once
again, these results suggest that attitudes towards the United States in general are related to the
comparative experiences of different groups.
Figure 35: Attitudes Toward US, by Ethnicity
0.2
.4.6
.8
Pro
port
ion: A
gre
e
The United States’ interference inthe region justifies armed operationsagainst the United States everywhere
Despite negative U.S. foreign policy, Americans
are good people
American and Western culturehas positive aspects
Arab Kurdish

Conclusion
Several important results are evident from these data. First, Iraqis are very concerned
about the economy and about political equality. While they differ on their understandings of
democracy, they are widely supportive of democratic institutions. Their level of trust in existing
institutions, however, is not high. Iraqis generally perceive the performance of their government
as mediocre at best. Perhaps relatedly, their level of political engagement is fairly low. Almost
no Iraqis reported being members of political parties, and a low proportion reported using the
print media or the internet for information about politics.
Iraqis remain highly religious, though the majority of respondents did not report
consistent attendance at Friday prayers. For the most part, they stated that they would not mind
having members of other religions as neighbors. They largely favor separation of religion and
politics, and are very unlikely to support involvement of religious leaders in citizens’ voting
decisions. Few Iraqis support an electoral system in which religious parties are banned, but even
fewer support a system in which only religious parties are allowed to compete.
Iraqis’ attitudes towards women are mixed. On the one hand, they support equality of
economic opportunity for women as well as equality in education. At the same time, however,
most Iraqis believe that men make better political leaders than women, and the majority believed
that women could not be the president or prime minister of a Muslim country.
Perhaps the most important implication of these results is that different identity groups
hold vastly different opinions. While it is well-known that Iraq is a highly divided country, these
data suggest that these divisions extend into the area of political attitudes as well. Both sectarian
and ethnic divisions are prevalent. For the most part, Shi’ites are more positive than Sunnis
about the state of their country, both politically and economically. These differences also
translate into much higher levels of support for authoritarian government among Sunnis. Kurds
are substantially more positive about the state of the country than are Arabs. Group differences
are perhaps strongest in the area of attitudes towards the United States. Shi’ites are, in general,
somewhat more inclined towards positive evaluations of the United States than are Sunnis.
Kurds, on average, hold vastly more favorable views towards the United States than do Arabs.
These differences, it seems, may stem from the experiences of different groups under
authoritarian rule.

Appendix: Frequencies of Responses
Q101: How would you evaluate the current economic situation in your country?
Very good 1.8%
Good 35.4%
Bad 44.6%
Very bad 18.1%
Q102: What do you think will be the economic situation in your country during the next
few years (3-5 years) compared to the current situation?
Much better 5.3%
Somewhat better 39.7%
Almost the same as the current situation 31.0%
Somewhat worse 11.3%
Much worse 12.6%
Q104: Do you think about emigrating from your country?
Yes, for economic reasons 7.5%
Yes, for political reasons 4.1%
Yes, for economic and political reasons 10.8%
Yes, for other reasons 0.7%
No, I do not think about emigrating 76.9%
Q105: Do you currently feel that your own personal as well as your family’s safety and
security are ensured or not?
Fully ensured 10.5%
Ensured 47.6%
Not ensured 34.4%
Absolutely not ensured 7.5%
Q106: To what extent do you feel that you are being treated equally to other citizens in
your country?
To a great extent 4.3%
To a medium extent 28.7%
To a limited extent 48.2%
Not at all 18.8%
Q1016: I will read you some statements related to your household income. Which of these
statements comes closest to describing your household income?
Our household income covers our expenses well 6.6%

and we are able to save
Our household income covers our expenses 34.6%
without notable difficulties.
Our household income does not cover our expenses 44.7%
and we face some difficulties in meeting our needs.
Our household income does not cover our expenses 14.2%
and we face significant difficulties in meeting our needs.
Q512: Suppose there was a scale from 1-10 measuring the extent to which democracy is
suitable for your country, with 1 meaning that democracy is absolutely inappropriate for
your country and 10 meaning that democracy is completely appropriate for your country.
To what extent do you think democracy is appropriate for your country?
1 11.5%
2 6.4%
3 8.2%
4 10.0%
5 18.9%
6 13.3%
7 10.7%
8 8.9%
9 5.7%
10 6.4%
Q515-1: There is a difference in opinion among people regarding the most important
features of democracy. If you had to choose one, which of the following features would you
say is the most important?
The opportunity to change the government through elections 32.8%
Freedom to criticize the government 9.1%
Narrowing the gap between rich and poor 8.5%
Providing basic items (such as food, housing, and clothing) 15.1%
to every individual
Equality of political rights between citizens 8.5%
Eliminating financial and administrative corruption 26.0%
Other 0.2%
Q515-2: The second most important?
The opportunity to change the government through elections 10.0 %
Freedom to criticize the government 19.6%
Narrowing the gap between rich and poor 9.9%
Providing basic items (such as food, housing, and clothing) 18.2%

to every individual
Equality of political rights between citizens 16.2%
Eliminating financial and administrative corruption 25.6%
Other 0.7%
Q516-4: To what extent do you agree or disagree with the following statements? A
democratic system may have problems, yet it is better than other systems.
Strongly agree 33.8%
Agree 52.9%
Disagree 11.2%
Strongly disagree 2.1%
Q517-1: I will describe different political systems to you, and I want to ask you about your
opinion of each one of them with regard to the country’s governance – for each one would
you say it is very good, good, bad, or very bad?
A democratic political system (ensures public freedoms, equality in political and
civil rights, devolution of authority, and accountability and transparency of the executive
authority).
Very good 45.7%
Good 50.4%
Bad 3.2%
Very bad 0.8%
Q517-2: A political system with an authoritarian president (non-democratic) who is
indifferent to parliament and elections.
Very good 6.6%
Good 5.5%
Bad 29.5%
Very bad 58.4%
Q517-3: A political system controlled by experts who make decisions that they think are
most appropriate for the country.
Very good 23.5%
Good 54.3%
Bad 17.1%
Very bad 5.2%

Q518-1: I will mention some of the political systems currently in place in various Middle
Eastern and North African countries. I would like to know to what extent you think these
systems would be appropriate for your country.
A parliamentary system in which nationalist, left wing, right wing, and Islamist
parties compete in parliamentary elections.
Very appropriate 46.4%
Appropriate 41.9%
Somewhat appropriate 7.1%
Absolutely inappropriate 4.6%
Q518-2: A parliamentary system in which only Islamist parties compete in parliamentary
elections.
Very appropriate 1.9%
Appropriate 9.3%
Somewhat appropriate 17.3%
Absolutely inappropriate 71.5%
Q518-3: A political system governed by a strong authority which makes decisions without
considering electoral results or the opinions of the opposition.
Very appropriate 1.8%
Appropriate 7.3%
Somewhat appropriate 12.1%
Absolutely inappropriate 78.9%
Q518-4: A system governed by Islamic law without elections or political parties.
Very appropriate 2.7%
Appropriate 8.8%
Somewhat appropriate 19.8%
Absolutely inappropriate 68.7%
Q518-5: A parliamentary system in which only non-religious parties compete in
parliamentary elections.
Very appropriate 3.1%
Appropriate 16.9%
Somewhat appropriate 13.0%
Absolutely inappropriate 67.1%

Q523: To what extent do you think the lack of respect for human rights is justified in order
to maintain security in your country?
Justified to a great extent 3.1%
Justified to a medium extent 10.9%
Justified to a limited extent 15.0%
Not justified at all 70.9%
Q210: Do you think that there is corruption within the state’s institutions and agencies?
Yes 96.6%
No 3.4%
Q211: In your opinion, to what extent is the government working to eliminate corruption in
your country?
To a great extent 6.4%
To a medium extent 14.5%
To a limited extent 38.6%
Not at all 40.5%
Q217: In your opinion, are people nowadays able to criticize the government without fear?
Yes 80.4%
No 19.6%
Q218-2 Do you agree or disagree with the following statements?
Political leaders are concerned with the needs of ordinary citizens.
Strongly agree 7.0%
Agree 11.5%
Disagree 50.5%
Strongly disagree 31.0%
Q218-5: Sometimes, politics are so complicated that I cannot understand what is
happening.
Strongly agree 24.8%
Agree 45.8%
Disagree 22.7%
Strongly disagree 6.7%
Q301: Did you vote in the last parliamentary elections that were held on (date of the last
elections)
Yes 84.0%
No 16.1%
Q302: During the last parliamentary elections held on (date of the last elections), did you
attend any meetings or activities related to any electoral campaign?
Yes 17.9%
No 82.1%
Q404: In general, to what extent are you interested in politics?
Very interested 11.6%
Interested 41.9%
Slightly interested 36.1%
Not interested at all 10.4%
Q405: To what extent do you follow political news in your country?
To a great extent 22.4%
To a medium extent 41.3%
To a limited extent 32.6%
I don’t follow political news at all 3.8%
Q407: Which of the following sources is most trustworthy with regard to local political
news?
Television 95.4%
Radio 1.4%
Newspapers (the daily press) 0.5%
Weekly newspapers and magazines 0.2%
The internet 2.6%
Q409: Do you use the internet….
Daily or almost daily 6.1%
At least once a week 9.2%
At least once a month 6.0%
A few times a year 1.9%
I do not use the internet 76.8%
Q410-1: Do you use the internet in order to…
Find out about political activities taking place in your country.
Yes 40.4%
No 59.6%

Q504: If you were to evaluate the state of democracy and human rights in your country
today, would you say that they are:
Very good 3.9%
Good 22.9%
Neither good nor bad 34.7%
Bad 29.2%
Very bad 9.3%
Q508: In your opinion, to what extent is the United States of America a democratic
country?
0 0.5%
1 0.3%
2 0.3%
3 0.5%
4 0.9%
5 5.6%
6 5.4%
7 11.4%
8 17.9%
9 26.4%
10 30.8%
Q511: In your opinion, to what extent is your country democratic?
0 6.0%
1 9.3%
2 10.1%
3 14.3%
4 15.4%
5 19.8%
6 11.5%
7 8.1%
8 2.8%
9 0.8%
10 1.9%

Q513: Suppose that there was a scale from 1-10 to measure the extent of your satisfaction
with the government, in which 1 means that you were absolutely unsatisfied with its
performance and 10 means that you were very satisfied.
To what extent are you satisfied with the government’s performance?
1 17.2%
2 11.2%
3 15.2%
4 17.4%
5 16.9%
6 11.2%
7 5.0%
8 2.5%
9 1.2%
10 2.3%
Q514: To what extent do you agree or disagree with the following statement: “Political
reform must be implemented in stages (gradually) (step by step) rather than immediately?
I strongly agree 20.6%
I somewhat agree 44.5%
I somewhat disagree 10.0%
I strongly disagree 24.8%
Q601-1: I will read a set of statements that relate to the status of women in our society to
you in order to gauge the extent of your agreement/disagreement with each statement
A woman can become the prime minister or president of a Muslim state.
Strongly agree 13.6%
Agree 32.2%
Disagree 33.6%
Strongly disagree 20.5%
Q601-2: A married woman can work outside the home.
Strongly agree 26.9%
Agree 57.5%
Disagree 12.7%
Strongly disagree 2.9%
Q601-3: In general, men are better at political leadership than women.
Strongly agree 34.8%
Agree 40.5%

Disagree 16.3%
Strongly disagree 8.5%
Q601-4: University education for males is more important than university education for
females.
Strongly agree 5.6%
Agree 19.8%
Disagree 45.1%
Strongly disagree 29.6%
Q601-5: Men and women should have equal work opportunities.
Strongly agree 23.1%
Agree 48.9%
Disagree 23.8%
Strongly disagree 4.2%
Q601-7: It is permissible for a woman to travel abroad by herself.
Strongly agree 9.0%
Agree 16.2%
Disagree 41.5%
Strongly disagree 33.3%
Q601-9: Women’s share of inheritance should be equal to that of men.
Strongly agree 10.4%
Agree 18.7%
Disagree 41.9%
Strongly disagree 29.0%
Q601-10: Women can assume judicial positions.
Strongly agree 20.2%
Agree 45.2%
Disagree 25.3%
Strongly disagree 9.3%
Q601-12: The first wife’s consent is a prerequisite for permitting a man to marry a second
woman.
Strongly agree 30.0%
Agree 40.7%
Disagree 19.3%
Strongly disagree 10.1%
Q601-13: A woman can reject a marriage that her family chose for her without her
consent.
Strongly agree 41.4%
Agree 45.0%
Disagree 11.3%
Strongly disagree 2.3%
Q601-14: Women and men should have equal rights in making the decision to divorce.
Strongly agree 32.0%
Agree 47.3%
Disagree 18.3%
Strongly disagree 2.4%
Q601-15: The law should not allow a man to marry more than one woman.
Strongly agree 17.5%
Agree 29.2%
Disagree 32.1%
Strongly disagree 21.2%
Q604-1: To what extent do you consider the following factors obstacles to accepting your
son/daughter/sister/brother’s marriage?
Not praying.
Constitutes an obstacle to a great extent 42.8%
Constitutes an obstacle to a medium extent 29.5%
Constitutes an obstacle to a limited extent 19.3%
Does not constitute an obstacle whatsoever 8.5%
Q605-1: To what extent do you agree or disagree with each of the following principles in
the enactment of your country’s laws and regulations?
The government and parliament should enact laws in accordance with the people’s
wishes.
Strongly agree 42.3%
Agree 38.3%
Disagree 17.8%
Strongly disagree 1.6%

Q605-2: The government and parliament should enact laws in accordance with Islamic law.
Strongly agree 34.8%
Agree 46.6%
Disagree 11.5%
Strongly disagree 7.1%
Q605-3: The government and parliament should enact laws in accordance with citizens’
wishes with regard to certain subjects and in accordance with Islamic law with regard to
other subjects.
Strongly agree 45.6%
Agree 42.5%
Disagree 9.5%
Strongly disagree 2.4%
Q606-1: To what extent do you agree or disagree with the following statements?
Religious leaders (imams, preachers, priests) should not interfere in voters’
decisions in elections.
Strongly agree 43.9%
Agree 41.5%
Disagree 10.0%
Strongly disagree 4.7%
Q606-3: Religious leaders (imams, preachers, priests) should have influence over
government decisions.
Strongly agree 12.8%
Agree 34.5%
Disagree 41.0%
Strongly disagree 11.7%
Q606-4: Religious practices are private and should be separated from social and political
life.
Strongly agree 35.2%
Agree 37.1%
Disagree 19.1%
Strongly disagree 8.6%

Q607-1: The opinions of Islamic jurists and religious scholars differ with regard to their
interpretations of certain issues in Islam. I want to ask to what extent you agree or disagree
with some of these issues?
Democracy is a system that contradicts the teachings of Islam.
Strongly agree 11.7%
Agree 14.1%
Disagree 37.3%
Strongly disagree 36.8%
Q607-2: In a Muslim country, non-Muslims should enjoy less political rights than Muslims.
Strongly agree 1.9%
Agree 11.1%
Disagree 47.8%
Strongly disagree 39.3%
Q607-4: Gender-mixed education should be allowed in universities.
Strongly agree 13.6%
Agree 66.2%
Disagree 15.8%
Strongly disagree 4.4%
Q607-5: When a person changes his/her religion he/she should be penalized with death.
Strongly agree 3.0%
Agree 9.8%
Disagree 33.5%
Strongly disagree 53.7%
Q607-6: Women should wear modest clothes without needing to wear hijab.
Strongly agree 7.1%
Agree 34.8%
Disagree 42.1%
Strongly disagree 16.0%
Q609: Generally speaking, would you describe yourself as…
Religious 35.7%
Somewhat religious 62.0%
Not religious 2.3%

Q610-1: Do you “pray daily?”
Pray daily.
Always 78.1%
Most of the time 14.2%
Sometimes 5.9%
Rarely 1.9%
Q610-2: Fast during Ramadan/Fast the 40 days of Lent for Christians.
Always 76.2%
Most of the time 17.2%
Sometimes 5.3%
Rarely 1.4%
Q610-5: Attend Friday prayer/Sunday services.
Always 24.9%
Most of the time 23.5%
Sometimes 16.2%
Rarely 35.5%
Q610-6: Listen to or read the Quran/the Bible.
Always 20.0%
Most of the time 48.2%
Sometimes 23.0%
Rarely 8.8%
Q201-1: I will name a number of institutions, and I would like you to tell me to what extent
you trust each of them:
The government (the cabinet).
I trust it to a great extent 4.8%
I trust it to a medium extent 35.7%
I trust it to a limited extent 29.4%
I absolutely do not trust it 30.2%
Q201-2: The judiciary (the courts).
I trust it to a great extent 11.6%
I trust it to a medium extent 43.7%

I trust it to a limited extent 23.8%
I absolutely do not trust it 20.9%
Q201-3: The elected council of representatives (the parliament).
I trust it to a great extent 4.1%
I trust it to a medium extent 24.7%
I trust it to a limited extent 39.8%
I absolutely do not trust it 31.5%
Q201-4: Public Security (the police).
I trust it to a great extent 18.0%
I trust it to a medium extent 50.5%
I trust it to a limited extent 21.4%
I absolutely do not trust it 10.2%
Q201-6: The armed forces (the army).
I trust it to a great extent 23.9%
I trust it to a medium extent 44.8%
I trust it to a limited extent 20.8%
I absolutely do not trust it 10.5%
Q203-1: Generally speaking, how would you evaluate the performance of “the
government” in carrying out its tasks and duties?
The federal government.
Very good 2.2%
Good 19.3%
Neither good nor bad 34.4%
Bad 31.5%
Very bad 12.6%
Q203-1: Parliament
Very good 3.2%
Good 19.5%
Neither good nor bad 34.3%
Bad 29.2%
Very bad 13.8%

Q203-3: The judiciary.
Very good 9.8%
Good 28.8%
Neither good nor bad 31.6%
Bad 19.2%
Very bad 10.8%
Q203-4: The police (Public security).
Very good 15.9%
Good 42.3%
Neither good nor bad 24.1%
Bad 13.3%
Very bad 4.4%
Q203-5: The local government.
Very good 3.0%
Good 21.5%
Neither good nor bad 33.3%
Bad 27.1%
Very bad 15.2%
Q209: To what extent do you agree with this statement: The federal government does all it
can to provide its citizens with all services.
I very much agree 4.9%
I agree 19.4%
I disagree 48.1%
I absolutely disagree 27.7%
Q213: Some people say that nowadays it is impossible to obtain a job without connections,
while others say that jobs are only available to qualified candidates. Based on a recent
experience (or experiences) you are personally aware of, do you think that…
Obtaining employment through connections 65.3%
is extremely widespread
Employment is sometimes obtained 29.2%
through connections
Employment is obtained without connections 2.5%
I do not know of any relevant experiences 3.0%

Q303: In general, how would you evaluate the last parliamentary elections that were held
on (date of the last elections)?
They were completely free and fair 14.6%
They were free and fair, with some minor breaches 28.1%
They were free and fair, with some major breaches 31.0%
They were not free and fair 26.3%
Q502-1: Here is a set of activities that citizens usually take part in. During the past three
years, did you participate in …
Attending a meeting to discuss a subject or sign a petition.
Once 5.7%
More than once 8.7%
I have never participated 85.6%
Q502-2: Participating in a protest, march or sit-in.
Once 9.6%
More than once 8.2%
I have never participated 82.3%
Q524-1: An anti-terrorism law was issued in some Arab countries, and I would like to
know your opinion of this law. To what extent do you think that enforcing this law
contributes to…
Combating terrorism.
To a great extent 22.6%
To a medium extent 45.1%
To a limited extent 21.2%
Does not contribute to this at all 11.1%
Q524-2: Violating the public freedoms of citizens.
To a great extent 21.2%
To a medium extent 34.0%
To a limited extent 31.5%
Does not contribute to this at all 13.3%

Q524-3: Limiting the peaceful activities of the opposition.
To a great extent 17.6%
To a medium extent 38.0%
To a limited extent 31.2%
Does not contribute to this at all 13.2%
Q705: Some people attribute the lack of development in the Arab world compared to other
parts of the world to external factors, while others blame internal factors. In your opinion,
which is more important in causing the lack of development in the Arab world?
Internal factors 24.9%
External factors 23.0%
Both are equally important 52.1%
Q706: Do you agree or disagree with the following statement: “The United States’
interference in the region justifies armed operations against the United States everywhere.”
Strongly agree 29.0%
Agree 41.3%
Disagree 21.9%
Strongly disagree 7.8%
Q707: Do you agree or disagree with the following statement: “Despite negative U.S.
foreign policy, Americans are good people.”
Agree 63.0%
Disagree 37.0%
Q708: Do you agree or disagree with the following statement: “American and Western
culture has positive aspects.”
Agree 66.4%
Disagree 33.6%