arate electronic journal volume 9, number 1 march 2019
TRANSCRIPT

ArATE Electronic Journal
Volume 9, Number 1
March 2019
Editor:
Dr. Misty LaCour, Purdue University Global
Peer Reviewers:
Dr. C. Neelie Dobbins, Southern Arkansas University
Dr. Shellie Hanna, Arkansas Tech University
Dr. Ryan Kelly, Arkansas State University
Dr. Lisa Oden, Southern Arkansas University
Dr. Alicia Show, Arkansas State University
Article and Authors:
Experience-First Methodology: Teaching English Vocabulary through STEM Curriculum
Dr. Daniel Barth, University of Arkansas
Are We There Yet? The Journey, Destination and Time Conundrum Regarding the
Education of African Americans in Arkansas
Dr. Charlene Johnson Carter, University of Arkansas
Supporting English Learners and Their Families through Summer Learning
Dr. Sarah Frederickson, University of Arkansas
Dr. Trish Lopez, University of Arkansas
Dr. Janet Penner-Williams, University of Arkansas
A Tale of Two None-Conventional Approaches to Teach Cultural Competence to
Preservice Teachers: Examples from the Republic of Turkey and the United States of
America
Dr. Ismail Guven, Ankara University and Arkansas Tech University
Dr. Mohamed Ibrahim, Arkansas Tech University
A Case Study on the Differences in Scores of Undergraduate Students in Traditional,
Online, and Hybrid Classes
Patricia Ruth Kuhn, University of Arkansas
Dr. Betsy Orr, University of Arkansas
Mathematics Teaching: Constructivist and Non-Constructivist Beliefs of Preservice
Teachers
Dr. Julie J. Williams-Mills, Henderson State University
Dr. Julie Quast, Henderson State University
Dr. Melanie Fields, Texas A&M University-Commerce
Experience-First Methodology: Teaching English Vocabulary through STEM Curriculum
Dr. Daniel Barth, University of Arkansas
Abstract
The Experience-First methodology is based upon more than 30 years’ experience teaching
STEM courses in astronomy, physics, chemistry, and Earth science at the secondary and
undergraduate level in Southern California. In the communities where the researcher taught,
more than 50% of the student body were ESL students, most of whom did not speak English in
the home. Using low-cost science pedagogy, students constructed their own models and
equipment and then used those materials to conduct scientific experiments and observations.
Each student’s experience in constructing and using scientific equipment and models was then
used as a basis for the acquisition of vocabulary to enable the student to discuss and share their
work. This methodology was significantly more effective than giving students a list of
vocabulary words and definitions to memorize before the laboratory activity was attempted.
This methodology was validated by consistently high scores on standardized, end-of-year tests
and by student success in undergraduate and technical careers after graduation.
Introduction
Teaching in schools with high-risk populations forces the educator to come to grips with
the twin problems affecting both the school and its students, high poverty rates and large, diverse
ESL populations. For the school and its teachers, lack of funding means that there is little money
available for classes in STEM areas to purchase equipment for laboratory exercises. What little
money there is usually goes to consumable items for biology and chemistry classes. Classes
such as astronomy and physics get little support and often suffer from a lack of modern
equipment.
In Riverside County, California where the researcher spent the majority of his career,
more than 50% of the population were ESL students. Although the dominant ethnicity was
Hispanic, there were more than 60 languages and dialects spoken at area schools across
Riverside County. Although California tried bilingual education in Spanish for many years, this
experiment was unsuccessful and left native speakers of other languages without services. Some
ESL students were placed in Spanish language bilingual classes and forced to learn science or
mathematics in a third language different from English and their native tongue.
Bilingual education efforts broke down on two fronts: first, the program did not succeed
in producing successful graduates fluent in English, second the program actually discriminated
against all speakers of languages other than Spanish. The state program also struggled for years
to find enough Spanish-language educators for specific subjects, especially in the STEM
classroom. California finally settled on providing a 12-hour training course for every educator in
the state, and awarding every teacher with an ESL teaching certificate. The state then abandoned
the bilingual education program altogether in 1999, effectively telling teachers: ‘It’s your
problem now.’

Although bilingual education as it was implemented in California was discriminatory and
did not work well on a practical level, it also had an unintended consequence; during the 18 year
period when English-only instruction was in place in California, most certified bilingual teachers
left the state. (Sanchez, 2016.) Even now, California’s Proposition 58 leaves it up to local
districts to decide whether or not to provide bilingual education, but the problem of how to
provide effective English language acquisition is still in the teacher’s lap because of the great
variety of languages spoken in classrooms. A more universal methodology was needed for the
average classroom teacher, as the standards-based movement, Common Core, NCLB, etc. all
place the responsibility for classroom-wide success upon the educator’s shoulders.
Methodology
The methodologies for low-cost science and experience-first pedagogy emerged
organically in the classroom rather than from a pre-planned investigation. Simply put, as a
teacher in the classroom with almost no equipment funding and a high percentage of ESL
students, the researcher had to find a way to address the daily challenges in his classroom so that
all students could be successful.
The equipment problem was the first thing that needed to be addressed. Looking at
catalogs for lab equipment that would be appropriate for the STEM classes being taught, the
researcher realized that much of the necessary equipment for physics laboratory investigations
was relatively simple in nature and could be constructed by the students themselves with proper
tools and guidance from the instructor. Constructing equipment using relatively low-cost
materials from the local home improvement store, requesting tool donations from parents, even
scouring garage sales and flea markets for old tools; these methods allowed the researcher to
gather the necessary tools for students to build their own equipment in class.
It soon became apparent that having students build their own equipment added a new
dimension to the science laboratory experience. Students gained a new appreciation for the
experimental equipment itself, both in how it functioned, and of the effort needed to acquire the
equipment. With student-built equipment in the classroom, the frequency of incidents of
vandalism and equipment damage dropped almost to zero. Students became not only
knowledgeable, but proudly possessive of their equipment.
The researcher also noticed that when ESL exhibited a strong tendency to self-select into
homogenous language groups. Students who grouped together to work on building a piece of
equipment all worked together in their native language. Even when working silently, students
reported later that they thought about the project in their own language. These students were
working together in their own language without being taught in their native language. More
importantly, these students were gaining practical experience in many areas: tool use, safety
procedures, equipment design, equipment maintenance and calibration – all of these in their
native languages. It was not uncommon in the researcher’s classroom to have four or more
languages being spoken at one time on laboratory workday.
The students were gaining another valuable commodity – they were acquiring actual
working experience in the STEM classroom. We are not talking about mere vocational
experience, but actual scientific experience as well. With each student having a common
experience building experimental equipment in the classroom, it became apparent that each
student’s experiences now became a foundation for learning technical STEM vocabulary.
When the students had acquired actual experience in a STEM activity, giving the students
the vocabulary needed to then discuss what they had built and learned about became far easier.
When each student in the classroom had a shared experience, albeit in their own language, giving
the students new English vocabulary became another effective tool for the student, rather than an
additional assignment. English became a common language to discuss common experiences, and
to critique each other’s work, ask critical questions, and share results.
Vocabulary acquisition became faster and easier for all students in the STEM program.
The result was that most vocabulary lists and assignments were dropped from the physics lab
classes all together; these assignments had become redundant. Some vocabulary lessons were
maintained, but these usually consisted of reviews after a laboratory project was over rather than
the preliminary lesson in a unit of study. Exemplary test results well above the average for our
school became common place rather than rare among the students in the school’s STEM
program.
Extending the Methodology to Other Classes
It was soon possible to extend the experience-first pedagogy easily into chemistry
classes, but astronomy remained a challenge. Astronomy was an equipment intensive discipline
and essentially an observational science; could the experience-first model be made to work here?
One of the challenges of teaching an observational astronomy course lay in the nature of
the course material and concepts rather than the acquisition of equipment. The researcher was
able to write small grants for the purchase of equipment, and because astronomy equipment is
almost entirely durable and low-maintenance in nature, ongoing funding was not necessary to the
success of the laboratory program. Soon, the astronomy program had all the equipment that was
needed for observational lab nights.
The challenge in teaching this course lay precisely in the observational nature of the
laboratory exercises. Young millennial students are bombarded by images. The ready
availability and pervasive nature of smart phones, tablets, computers, internet access, and
streaming video meant that students spent many hours each day digesting images on a screen.
According to the Connected Kids report compiled by the Childwise market research
group, teens today spend 7.5 – 8 hours per day watching images on a screen, up from 2.5-3 hours
per day in 1995. (Connected Kids: Trend Watch, 2017.) For classes with primarily observational
laboratory activities such as biology and astronomy, this overload of screen images is quite
problematic. When students go to an astronomy activity and look through binoculars or a
telescope at the Moon, it becomes merely one more image among many hundreds already
viewed that day.
The relentless montage of images makes critical observation very difficult for the school
age child. According to a 2006 CBS News report, the number of images a person is exposed to
rose from approximately 500 per day in the 1970’s to over 5,000 per day by 2006. (Johnson,
CBS News, 2006). The Business Journal claims that active internet surfers see over 11,000
advertisements per day – surely the total sum of images we see are far higher. (Sanders, 2017.)
The question of how to cut through the visual clutter in a child’s life is a pressing one for the
modern educator.
For the astronomy laboratory curriculum, low-cost science methods and experience-first
pedagogy again proved effective in the classroom. Before implementing experience-first
pedagogy in the classroom, the researcher often found that evening laboratory events were less
than successful. Students (and adults!) often looked through the telescope, shrugged and said:

‘It’s the Moon.’, and then walked away unimpressed. It was often difficult to get students to
observe carefully and make note of what they saw in the eyepiece. An added difficulty was that
the telescope is strictly a solo instrument; only one person at a time can look through the
eyepiece and the instructor cannot in any way point out features to the student as they observe.
Constructing an Experience-First Model
The solution was to implement an experience-first exercise, helping students to each
build a model of the lunar surface in clay. Using a light-colored, non-drying clay, the students
made a 15x15x1 cm square. A large marble was used to make a 6-8 cm depression in the clay
square, then a small amount of dark clay was used to overlay the depression. This modeled a
maria, a large crater (150 km wide or greater) on the lunar surface that had later filled with dark,
iron-rich lava from the Moon’s interior.
Next, smaller marbles and round beads of various sizes are used to model smaller craters
from 0.1 – 2 cm wide. The number of craters created increases as size decreases. The marbles
were rolled a bit as they were pressed into the clay to create crater rims. Small bits of clay were
placed in the center of some of the larger craters to represent central mounts, mountainous
features peculiar to large lunar craters. With an abundance of craters, students readily noticed
that some craters overlapped earlier features; this allowed us to introduce the idea of geological
chronology – exploring the age of features by studying their overlapping nature on the lunar
surface.
After this, students used a golf tee or a blunt pencil to make marks surrounding craters
representing the ejecta blanket formed by rocky material blasted out of newer craters less than 50
million years old. Rays, exceptionally long streaks of dusty material, were drawn on our model
using golf tees, and finally the golf tees were used to put a plethora of minor craters all over the
face of the models. The last step was to use the edge of a steel ruler to mark out lines of
longitude and latitude, making a 2-cm grid on our model.
As we worked on the models, students were introduced to these and other vocabulary
terms in the classroom. Having the experience of creating the lunar features on a clay model
before being given the vocabulary terms was a powerful experience. After creating the models,
students paired off and shared what they had learned and created by showing and describing the
models in English to their partners. Since the vocabulary and concepts were new to everyone, no
particular advantage was had by the native English speaker over the ESL student; everyone
worked equally hard to become fluent with the new vocabulary.
Further work was done with the models once they were created. Students drew a 2-cm
grid on a piece of construction paper and made an accurate map of their models. On the Moon,
craters and features on the near side are primarily named for Western and European scientists
and mathematicians. In the classroom, students were now allowed to develop their own naming
schemes using bands, films, food, or their own cultural references. The features were then
named and a key to the maps were made for each model.
Students went on to make rulers and scales. Each 2-cm square represented 100 km, the
paper rulers were divided in increments of 25 km. Latitude and longitude or ‘GPS’ coordinates
were determined for each major feature and a list of coordinates was added to the list of names
on each map key. Pythagorean theory and the distance formula were used to determine distances
between major landmarks. Students then used eye droppers and filled each crater with water to
determine its volume; crater volume was used as an analog measurement for impact energy.

After several days of study making, mapping, measuring, and studying the lunar surface
models, students were then allowed to participate in an evening astronomy lab looking at the
lunar surface for the first time at a variety of magnifications. (Barth, 2018.)
Unlike previous years’ lab experiences, the students brought a wealth of knowledge to the
eyepiece when they looked at the Moon for the first time. The view through the telescope was
no longer just an image, one among thousands, it was a unique experience confirming the
hypotheses that the students had made in clay in the classroom the week before. The
experience-first methodology not only improved the English language vocabulary of the ESL
students without regard to their native language, it improved the quality of the laboratory
observation experience for every student and make the laboratory observation more meaningful
to everyone in the class.
Results
The experience-first and low-cost science methodologies for STEM educators have been
used to develop the Astronomy for Educators program at the University of Arkansas where
educators learn to utilize these pedagogies to teach STEM curriculum in an effective way
without regard to barriers of cost or English language fluency.
These materials and lessons were taught to a group of 32 international educators gathered
at the University of Arkansas this spring with great success. The educators responding to a post-
event survey showed a broad acceptance of these methodologies and most indicated an interest in
using the methodologies in order to improve their teaching of English language vocabulary
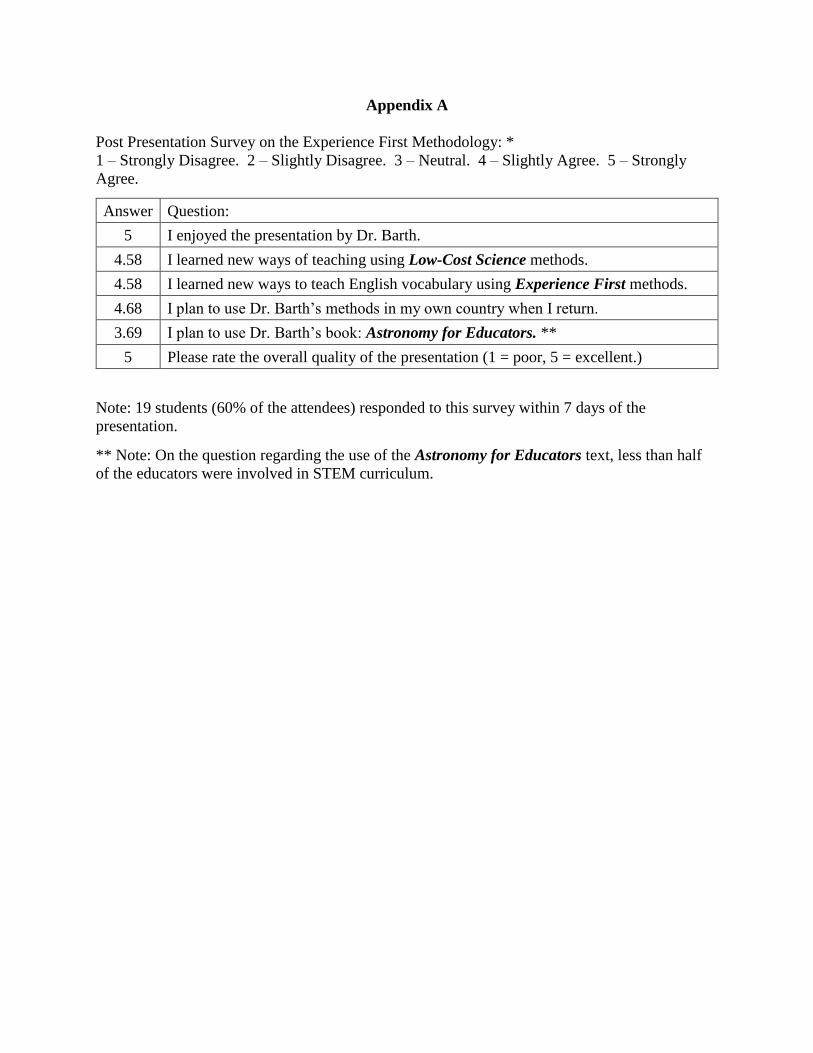
through experience-first curriculum in their own countries. There were 6 questions answered on
a Likert-type scale from 1 – 5 representing Strongly Disagree to Strongly Agree (see Appendix
A for the complete results by question). Question #1 asked if the teachers enjoyed the
presentation, the score was 5.0 indicating exceptional engagement with the curriculum.
Question #2 asked if the teachers learned new ways of teaching using low-cost science
methods, the score was 4.58. Some of the educators indicated that they taught in conditions of
poverty in their own countries and that low-cost methods were not novel for them.
Question #3 asked if the teachers had learned new ways to teach English vocabulary with
the experience-first method, the score was 4.58. This was an exciting result since the
experience-first methodology was at the core of teaching ESL students without regard to native
language using STEM curriculum.
Question #4 asked if the teachers planned to use the experience-first method when they
returned home. The average score was 4.68, indicating a strong acceptance of the method and a
good fit with the school system in the teachers’ home countries.
Question #5 asked the teachers if they planned to use the Astronomy for Educators text,
the score was 3.69; several teachers commented after the presentation that they did not teach any
STEM curriculum and therefore had no plans to use the book.
Question #6 asked the teachers to rate the overall presentation, the score was a 5.0 which
was gratifying and indicated that the presentation was well planned and executed.
These materials are now published by the University of Arkansas as an Open Educational
Resource available at no cost to any educator. It is hoped that these methodologies become more
widespread, not only in teaching astronomy and space science, or STEM curriculum, as initial
results show that the principles can be applied successfully to any curriculum.

Discussion and Implications
The use of low-cost science methodologies and the effective English vocabulary
acquisition for ESL students in the STEM classroom represents a personal journey of discovery
for this researcher. A childhood spent in a homogenous school culture with virtually no ESL
population left the researcher poorly prepared for the widely diverse cultural and linguistic
environment found in urban, Southern California school systems. The researcher found that
neither his life experiences, nor his training in science or academic studies in education prepared
him for these ongoing challenges in the secondary classroom. As a professor of STEM
education, the researcher has found that today’s pre-service teachers are at much the same
disadvantage. For many education students, neither their life experience nor their academic
training has effectively prepared them to be successful in a linguistically diverse classroom.
The experience-first methodology not only addresses the gap in the teacher’s academic
training, it specifically does not depend upon the multi-lingual skills of the teacher in the
classroom – in fact, this methodology assumes that the educator has no such skills.
The author saw bilingual science education firsthand for 18 years. The classroom next
door taught biology in Spanish. The author noted both by observation and in curriculum
development discussions with bilingual STEM education teachers, that much of the technical
STEM concepts and virtually all of the more challenging (and rewarding!) laboratory exercises
were stripped from these classes in order to substitute vocabulary acquisition lessons. It was
common to hear the teacher speaking in Spanish, and then to lead students in a call-and-response
teaching them the parts of a cell or an ecosystem.
These bilingual education students did not however, spend time with microscopes
looking at cells, make models of cellular components, or take field trips to observe actual
ecosystem; they were too busy filling out vocabulary worksheets. And as for students who spoke
German, Russian, French, Japanese, Vietnamese, Tagalog, and many other languages, they were
blatantly discriminated against – there were no classes or language support services at all for
them. The other, more universal discrimination was that bilingual classes began and ended with
elementary biology; no classes in honors biology, AP classes, chemistry, physics, or astronomy
classes were offered in a bilingual format.
We cannot possibly supply teachers for every language group for every STEM class at
every level. The logistical problems are insoluble, and the financial burdens unsustainable.
Further, the smaller and more rural a school district is, the more intractable the logistical and
financial problems become. There is a further problem that bilingual students are unfairly
segregated from their English-speaking peers. This segregation is wrong on its face, and further
does nothing to develop a tolerant and accepting culture for the students.
The experience-first methodology eliminates these problems at their source. It eliminates
the necessity of specific multi-lingual skills on the part of the classroom teacher. For the small
or rural school districts which often have difficulty recruiting enough qualified STEM educators,
this means that they can hire an experience-first qualified educator who can serve all the local
students. It does not matter if there are a handful of ESL students or hundreds, all can be served
successfully. If the district experiences an influx of new ESL students, there will be little or no
impact in test scores or the level of educational service provided by the existing staff.
Adding low-cost science methodologies solves another fundamental problem in STEM
education – equal accessibility. Small and rural schools often limit their STEM curriculum
offerings not because they do not have the staff or student interest, but because of the financial
burden of supporting multiple STEM disciplines and purchasing and maintaining expensive
laboratory equipment. For both the rural and urban school, the realities of financial pressures
force administrators to make “this or that” choices. It often comes down to the reality that if we
do not have funding for everything we want, we must make do with the basics. Equipment
intensive classes such as physics and astronomy are often cut.
The educator who trains students to construct their own laboratory equipment is free of
almost all of these financial pressures. Schools that adopt low-cost science methodologies are
able to offer access to a diverse and high-quality STEM experience to all students. The use of
experience-first methods means that these opportunities are equally available to students from
any cultural and linguistic background. Removing linguistic, geographic, and financial barriers
restricting access to quality STEM education programs is perhaps the most profound and far
reaching benefit of these methodologies.
References
Barth, D. (2018). Astronomy for educators. University of Arkansas Library Press. Retrieved
from https:// uark.libguides.com/barth_ASTRO
Barth, D. (2007). Teaching science through literature. Claremont Graduate University Press.
Boyse, K., & Bushman, B. (2010). Television and children. Michigan Medicine, University of
Michigan. Retrieved from: http://www.med.umich.edu/yourchild/topics/tv
Connected Kids: Trend Watch (2017.) Retrieved from:
https://groupmp15170118135410.blob.core.windows.net/cmscontent/2017/06/Connected-
Kids-Trends-Watch-2017_Small1.pdf
Johnson, C. (2006). Cutting through advertising clutter. CBS News. Retrieved from:
https://www.cbsnews.com/news/cutting-through-advertising-clutter/
Sanchez, C. (2016). Bilingual education returns to California: Now what?, National Public
Radio. Retrieved from:
https://www.npr.org/sections/ed/2016/11/25/502904113/bilingual-education-returns-to-
california-now-what
Sanders, B. (2017). Do we really see 4,000 ads a day? The Business Journal. Retrieved from:
https://www.bizjournals.com/bizjournals/how-to/marketing/2017/09/do-we-really-see-4-
000-ads-a-day.html
Wakefield, J. (2015). Children spend six hours or more a day on screens. BBC News. Retrieved
from: https://www.bbc.com/news/technology-32067158
Appendix A
Post Presentation Survey on the Experience First Methodology: *
1 – Strongly Disagree. 2 – Slightly Disagree. 3 – Neutral. 4 – Slightly Agree. 5 – Strongly
Agree.
Answer Question:
5 I enjoyed the presentation by Dr. Barth.
4.58 I learned new ways of teaching using Low-Cost Science methods.
4.58 I learned new ways to teach English vocabulary using Experience First methods.
4.68 I plan to use Dr. Barth’s methods in my own country when I return.
3.69 I plan to use Dr. Barth’s book: Astronomy for Educators. **
5 Please rate the overall quality of the presentation (1 = poor, 5 = excellent.)
Note: 19 students (60% of the attendees) responded to this survey within 7 days of the
presentation.
** Note: On the question regarding the use of the Astronomy for Educators text, less than half
of the educators were involved in STEM curriculum.
Are We There Yet? The Journey, Destination and Time Conundrum Regarding the
Education of African Americans in Arkansas
Dr. Charlene Johnson Carter, University of Arkansas
Abstract
Studies comparing educational achievement by students of African descent to that of
students of European descent, typically assess personal variables to explain "gaps" or differences
in performance. Sociopolitical and historical, i.e., systemic, realities receive limited
consideration. This inquiry diverges from deficit models explaining performance differences as
functions of personal variables. Teacher quality as a systemic variable is analyzed. Using an
allegory based on a trip with young children, the "journey" of African Americans in the Arkansas
education system is analyzed - sociopolitical and sociohistorical realities (terrain); teacher
quality proxied by salaries and National Board Certification (supplies); and travel time. The
implications of positionality (driver) for framing causality and interpretations of disparities in
educational outcomes are explored. Further research of systemic variables’ effects on
educational practices and student achievement is recommended.
Introduction
The efficacy of education obtained by African Americans is a major concern nationally
and locally (Ansell, 2011; Hill, 2011; Carter & Welner, 2013). Coined as the “achievement
gap,” students of African descent1 perform at significantly lower levels compared to those of
European descent. Investigations to account for this lack of achievement largely focus on
personal variables such as family, peers, communities, etc. This highly complex topic is rarely
examined for the implications of social, political, historical and cultural factors. For example,
there is little (if any) consideration given to the effects of 300+ years of oppression, tyranny and
discrimination. Moreover, the prevailing practice is to adhere to the meritocratic vision of the
American educational system that obfuscates the systematic and systemic oppression that
continues to exist. Although it is not as overt as previously, oppression remains very tangible in
its manifestations and evident in its resultant effects. Reframing the achievement gap as an
opportunity gap linked to sociohistorical and sociopolitical reality is a recent development
(Carter & Welner, 2013). Ladson-Billings (2013) says it is an education debt that if not paid,
requires at least acknowledgement as affecting the educational outcomes (achievement gap) we
monitor so closely. The implications of time for the interpretation of this phenomenon has been
given miniscule attention. Many refer to the Brown v. Board of Education (1954) decision as the
defining turn of events leading to equal educational opportunity for all. However, some
researchers, based on reasons beyond the reach of this paper (Bell, 2005) have deemed this
assessment misguided.
1 The terms, students of African descent and Black children are used in conjunction with African American to include children born in American as well as children of the African

Discussion and investigation of the "achievement gap" gives substantial attention to the
relatively short 60+ years since the Brown v. Board of Education decision. The discourse is
centered on reasons for the overall lack of achievement by children of color based on a white
standard. The window of 60+ years is based on the erroneous premise that the legislation and
cessation of discriminatory practices were virtually simultaneous. Once the changes were
legislated, the search for the lack of instant mobility of students of African descent centered on
personal characteristics, such as socioeconomic status, family structure, culture, etc. (Ansell,
2011) Seldom considered is how the academic experiences of students of African descent are
adversely affected by remnants of 300+ years of systemic tyranny and oppression. Minimal
attention is given to the continuing inequitable resource allocation among schools based on the
characteristics of students who attend them. This one-sided, time-limited perspective is
reminiscent of anxious children on a road trip experienced by the author so long ago.
Years ago, my mother and I made a twelve-hour, cross-country trip by car with four
children, ages four to eight. The trip pre-dated iPhone and iPad, and I could not afford an
entertainment package. The hand-held devices were pencils and crayons. We did our best to
prepare the youngsters for the trip by reminding them that we would be in the car a long time and
they could take anything to play or read. Twenty minutes into the trip, we slowed down to
merge onto a two-lane highway from the interstate and the four-year-old asked loudly, "Are we
there yet?" I looked at my mother and said, "This is going to be a long ride."
Many investigators approach the performance differential between students of African
descent and those of European descent using a time perspective similar to that of this four-year-
old. To them, Arkansas has been at this long enough to have arrived at our destination, closure
of the achievement gap. Given the years of legislated inequity, could we have arrived this
quickly? However, when it comes to the education of African Americans in Arkansas,
perceptions of adults are reminiscent of the four-year-old in that a naive, distorted
conceptualization of elapsed time vs, “equal/equivalent” time is displayed. Here,
“equal/equivalent time” refers to time during which African Americans students are endowed
with educational resources equivalent to those available to their white counterparts. Exponential
changes in achievement are expected in 60 plus years based on the aftermath of legislated
changes to a system of exclusion that was sustained for centuries. Few "knowledgeable" people
demonstrate recognition of the implications of the "distance" (the years of inequity and
exclusion), the "terrain" (the entrenched nature of segregation), or the "destination" (expectations
of academic progress).
Trip preparation includes planning for things we can and cannot control. Things we
control lend themselves to planning much more readily than those that are not. Because most
elements of a student's home life and background are beyond the purview (control) of schools, it
is misguided to focus on these factors and largely ignore systemic variables that can and should
be adjusted. A school has little influence on a student’s home life and background. However,
the continued focus remains on conditions least susceptible to "treatment" by an educational
system rather than relevant environmental variables that can be substantially influenced by the
system.
This paper examines factors considered to be malleable by those in power. Whereas
background factors have remained prominent to explain the lower achievement for African
American students nationally and locally (Greene, Barnett, Ritter, & Winters, 2006), they are
misguided, simplistic and/or distorted. This paper explicates this topic from another stance by
taking into account sociopolitical and historical factors rarely considered. By looking at teachers
and the inequitable quality/treatment that exists across districts within the state, the paper
examines career indicators, specifically salaries and National Board Certification as indicators of
inequity. "Are we there yet?" is a metaphorical framework for addressing the issues. "We"
refers specifically to students/people of African descent within the state. "There" refers to the
destination, educational achievement. "Yet" encompasses varied perspectives gauging time and
progress. Positionality and how it affects the identification of an appropriate destination, the
determination of when it is reached, and time are examined as it relates to these aspects of the
trip. One's position or "place" will lead to different interpretations given the varied and
inequitable inputs that prevail in today's educational system.
The Driver
A reader’s, personal perceptions are often a catalyst and major influencer on the
interpretations given to what is read. Positionality is a concept that acknowledges the effects and
implications of one’s experiences and demographics (gender, race, socioeconomic status, etc.) on
research perspectives and interpretations (Arber, 2000; Briscoe, 2005; Milner, 2007).
Positionality is integral to this paper’s premise that interpretations of progress are a function of
one's position and the ideological stance reflected in it (Briscoe, 2005; Milner, 2007).
Based on positionality, it is important to know the perspective of a study’s author(s), i.e.,
the driver, as it relates to this paper. My demographic positionality originates from growing up
in a lower-income, majority African American, urban community. This demographic
positionality contributes to my ideological positionality and "insider" position on this issue
(Arber, 2000; Briscoe, 2005; Milner, 2007). My experiences mediate and influence my
understanding and interpretation of rationales regarding the lack of academic achievement, e.g.,
lack of interest, motivation and drive to learn, as the reason for educational progress. What is
written leaves me with questions regarding the nature, context, and meaning of these varied
perspectives on this topic (Perry, Steele, & Hilliard, 2003). This paper's context is influenced by
this perspective/positionality.
"We" - African Americans Social and Historical Realities in Arkansas
For this paper, "we" refers to people of African descent in the state of Arkansas. The
state's historical, social, and political realities for people of African descent reflect national
trends but also have unique attributes (Anderson, 1988; Gehring, 2004). These differences have
implications for educational processes and must be taken into account. For some, these
demographic realities are a backdrop for their explanations for academic discrepancies; for this
paper they are germane to the understanding of the existing systemic inequities.
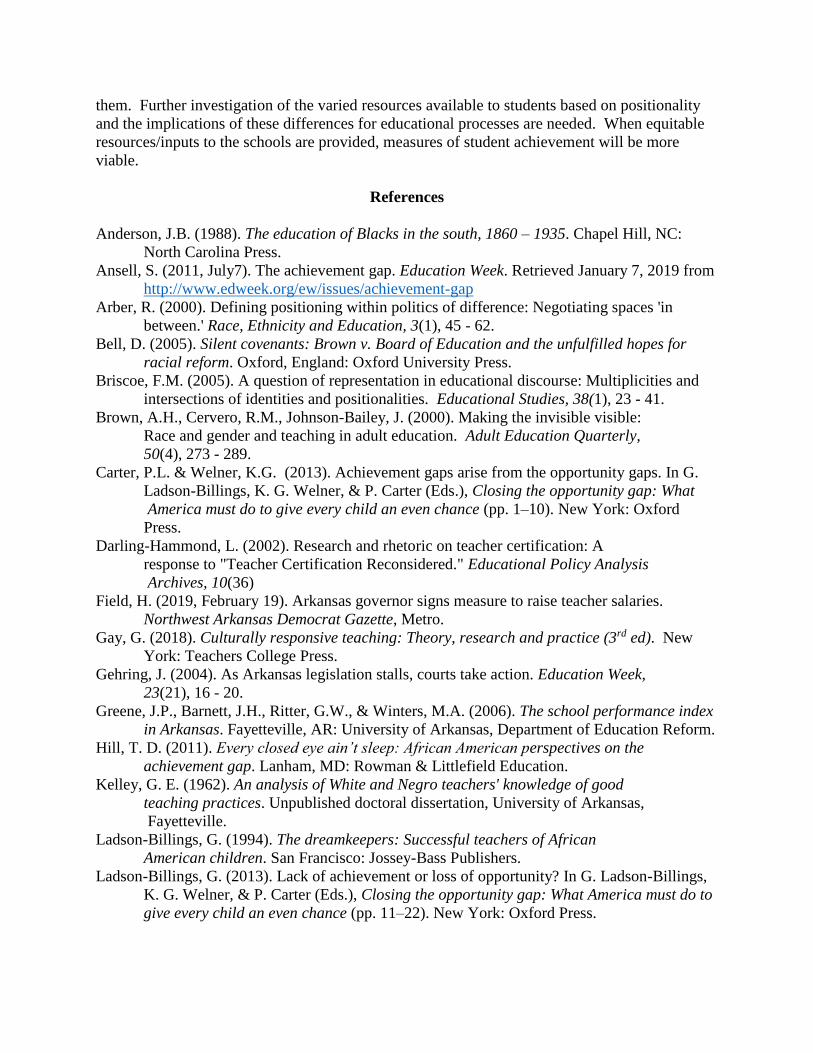
According to the U.S. Census, American Community 5-year [2013 – 2017] Survey,
Arkansas is the 33rd largest state with a population of 2.98 million. The residents are dispersed
across 75 counties ranging from 5,194 in Calhoun County (southern Arkansas) to 392,848 in
Pulaski County (site of the largest city and capital, Little Rock) (see Appendix). Fifty-six (75%)
of the counties have populations less than 40,000. In 23 (41%) of the 56 counties, at least 20%
of the residents are of African descent. People of African descent make up more than 20% of the
population in six of the 19 (32%) counties with populations of more than 40,000 (see Appendix).
Patterns of living are also of note. People of African descent are concentrated in the southern
and eastern regions of the state with relatively few of them in the northern and western sections.

There are similar divisions in regard to income. Compared to the nation as a whole,
Arkansas is lower in median income. The national median income is $57,652 and $43,813 for
Arkansas. The five counties with the lowest median incomes ranging from $27,036 in Desha
County to $31,584 in Monroe County, are in counties with larger percentages (27.5% to 56%) of
African Americans (see Appendix). Of the five counties with the highest median incomes in the
state, $49,968 to $61,271, African American population range from 1.6% to 11.4%.
Historically, larger numbers of African Americans resided in the Arkansas Delta – a once
prosperous area of fertile farmland and varied manufacturing businesses. People of African
descent were the majority among those working on the farms and in the industries; employment
prospects were plentiful. In recent years, the region's prosperity has been replaced by economic
hardships and is home to some of the lowest median incomes and the highest rates of poverty in
the nation. People of African descent living in smaller, rural communities in the southern and
eastern sections of the state are likely to have lower incomes and higher rates of poverty. This
reality diverges from national trends and perceptions of African Americans concentrated in urban
areas. However, this reality does reflect national trends of lower incomes and de jure
segregation.
These economic realities and disparities are rarely acknowledged for their effects on
educational conditions and their implications for varied regions throughout the state. Although
poverty and ethnicity in some cases, have been studied as rationales for differential educational
performance of students (Greene, et. al. 2006), the effects of these realities on the educational
resources or inputs are rarely examined. Teacher quality as a vital resource is recognized for its
fundamental contribution to children’s academic progress (Darling-Hammond, 2002; Ladson-
Billings, 1994). Complex in nature, it is beyond the scope of this paper to examine the varied
dimensions of teacher quality. Consistent with the economic stance taken so far, this paper
examines teacher quality in terms of salary and National Board Certification as indicators of
resources teachers bring to schools. Both are representative of the value placed on the education
of students. Arkansas provides a ready forum to study this phenomenon of differences in teacher
value with its large range of differences across the state. Historically and economically,
educational attainment differs based on ethnicity and the systemic variables that are relevant to
it. With this in mind, counties are compared based on two indicators of teacher quality, teacher
salaries and National Board Certification. The three counties with the highest median incomes
and smallest percentages of African American residents, (Benton, Saline and Lonoke) are
compared to those with the lowest median incomes and the highest percentages of African
American residents (Lee, Chicot and Phillips). The paper examines the differences in teacher
quality, i.e., teacher salaries and National Board Certification, between these two groups.
"There" - Teacher Quality
Identifying the destination is instrumental to planning and making a trip. Here, the
phrase, "it is not the destination but the journey," applies to some extent. One must determine
the destination when making crucial trip-related decisions. A timeline that includes car time and
stops, and gathering necessary resources based on destination and time. "Going camping" is a
simple phrase but what does it mean? Camping out in one's own backyard is an outdoor
experience, but it does not present the organizational, logistical and financial challenges of a
camp-out in a park that one must cross five states to reach. This has implications for the
preparations and the activities that occur at the end of the journey. Likewise, to address the

effects of centuries of exclusion, extensive preparations are needed for the "rough" and
cumbersome terrain across years of systemic, entrenched racism. The sociohistorical context and
varied positionalities of those defining the trip and the destination for the state of Arkansas make
positionality especially pertinent.
In 2004 considerable attention was focused on the 50th anniversary of the Supreme
Court’s decision in Brown v. Topeka Board of Education (Bell, 2005; Orfield, Frankenberg, &
Siegel-Hawley, 2016). Several reports described the gains or lack thereof of African American
students over the 50 years since de facto segregation was made illegal. Although the 1954
decision called for desegregating schools with “all deliberate speed,” it took until 1956 and a
return to court to decipher this directive and push school systems to act on it. Many
jurisdictions, including many in Arkansas, continued to resist the mandate (Gehring, 2004).
Opposition to desegregation of public schools (kindergarten to twelfth grades) in
Arkansas entered the national consciousness when Governor Orval Faubus ordered the National
Guard to prevent nine students from entering Central High School in Little Rock in 1957. At a
symposium held in Little Rock in 2007 to assess progress made since the Central High School
crisis, some attention was given to the role teacher quality played in the lack of progress (Tubbs,
2007). However, the families, backgrounds, values, and various attributes of students of African
descent were noted as the culprits for lower levels of achievement (Tubbs, 2007).
Arkansas reflects national school trends in being essentially segregated with greater
concentrations of people of African descent in the most economically depressed areas and
residents of European descent in the more affluent areas. Areas with a majority of African
American students have lower levels of educational achievement and resources. Lake View is
one of those areas.
Lake View is a small school district in southeastern Arkansas with virtually 100% of its
students claiming African American heritage. In 1992, Leon Phillips, the superintendent in Lake
View school system filed a lawsuit (Lake View School District v. Governor Mike Huckabee)
against the state of Arkansas to bring attention to the inequity in the allocation of resources in
education and to effect changes in the funding formula for public education across the state.
After a long litigation, the state was directed to address the inequities. The court’s ruling
in 1994 ordered the state to address the resource allocation problem in a timely manner.
However, it took over ten years before the Arkansas legislature met the dictates of the edict and
devised an acceptable statewide plan (Gehring, 2004). This landmark decision clearly delineated
systemic issues confronting Arkansas education, but these are ignored or dismissed in discussions
about the discrepancies in achievement scores within and among school districts. Among the
changes that may significantly impact educational outcomes in Arkansas is the adjustment to
teacher salaries.
Teacher quality is recognized as fundamental to students' success (Darling-Hammond,
2002). This is particularly true for students of African descent (Gay, 2018; Ladson-Billings,
1994). With the adoption of the No Child Left Behind (NCLB) Act (2002), this verity acquired
the status of an imperative. The stated objective of NCLB was to eliminate achievement gaps
among groups of students by promoting an increased emphasis on reading and mathematical
ability. A major element of meeting this goal was providing a "highly qualified teacher" in every
classroom. A highly qualified teacher is one who: (1) has a baccalaureate degree, (2) is certified
in the content area in which he/she teaches, and (3) passes tests in the content area (NCLB,
2002).
Difficulty in recruiting educators with requisite training is extremely challenging for
districts in which a majority of the students live at or below the poverty level. This contributes
significantly to the misconception of a teacher shortage. Given the perceived shortage of
qualified, practicing educators, states have adopted alternative methods of licensure in order to
meet this mandate. Alternate licensing programs are a means to rapidly increase the pool of
teacher by allowing a person with a baccalaureate degree to seek certification in a content area.
Those receiving alternative licensure usually work in the lower socioeconomic areas where
traditionally licensed teachers are less likely to live and teach. The result has been a
disproportionately high number of alternatively licensed educators manning classrooms in these
schools. There is a scarcity of research on the effectiveness of these educators. Mixed results
are reported that appear to be based on one's ideological stance (Darling-Hammond, 2002). The
alternative measures are condoned based on the perception of a "teacher shortage." The more
likely situation is not a teacher shortage but a shortage of educators willing to teach in certain
areas. Traditionally, formally prepared and licensed educators prefer to teach in affluent
Arkansas communities that pay higher teacher salaries. Consequently, those most in need of the
‘best-prepared,” "highly qualified" teachers as a means of addressing the achievement gap are
least likely to have them. In Arkansas, this is certainly evident in how teachers are dispersed in
the state and the variation in teachers' salaries.
In 1962, Gene Kelley's dissertation, "An analysis of White and Negro teachers'
knowledge of good teaching practices," looked at a number of indices that measured inequality
that persisted in the "dual system" after the Brown decision of 1954 (Kelley, 1962) Kelley's
interests were in the "intangible" areas of education, i.e., teaching effectiveness as indicated in
knowledge of good quality teaching practices - does this knowledge differ based on race of the
educator? Although "tangibles" (facilities, salaries, books, transportation, etc.) were not a direct
area of interest, Kelley recognized "it was impossible to divorce or isolate completely, the
tangibles from the intangibles" (p.12). Different aspects of education, including teachers'
salaries, were analyzed for their differences primarily during the period from 1952 to 1957.
There were large and overt inequalities in salaries and compensation for those who educated
students of African descent in Arkansas. Although this discrepancy persisted in 1960, it did
decrease somewhat.
The Arkansas State Department of Education reports that the average salary for
Negro teachers in Arkansas for the school year 1959 - 60 was $3,110 compared to
$3,434 for white teachers. The differential between Negro and white teachers
(sic) salaries decreased from 395 in 1952 to 172 in 1960, a decrease of fifty-six
per cent. (p. 20)
Similar to 1960 when these teachers were studied, disparities in teachers’ compensation
remain but they are largely based on who is being taught rather than on who is teaching. As a
result of the Lake View decision, teacher salaries were reviewed by state legislators. They found
Arkansas ranked 43rd on the American Federation of Teachers salary survey of 2001 (Richard,
2002). This review resulted in the state raising the minimum teacher salary to $28,711 in 2004.
In 2018, teacher salary came under political scrutiny yet again, “Boosting teacher pay was a
pillar of Hutchinson’s re-election campaign and his legislative agenda…Under the legislation,
first-year teacher with a bachelor’s degree must be paid a minimum of $32,800 next year [2019 –
2020] and $36,000 by 2023.” (Field, 2019). These are encouraging changes but there remains a
large differential in salaries. As indicated in Table 1, Phillips County has the lowest household
income and pays incoming teachers $38,246 (highest beginning salary for this county, see Table

2) as compared to the most affluent area, Benton, where the highest incoming salary is $44,750.
Difference between these two is 14%. Desha County with a median income of $27,036 has an
incoming salary of $32,125 – 28% difference from the highest incoming salary for Benton
County. This discrepancy increases with time.
Table 1.
Comparison of Six Arkansas Counties on Teacher Salaries, and National Board Certification
County Median
Income
Percent of
African
Americans
Teacher Salaries
Beginning Career High
Number of
National Board
Certified
Teachers*
Benton $61,271 1.6 $44,750 $74,105 59/10
Saline $58,985 6.4 $38,580 $68,746 20/1
Lonoke $57,290 6.0 $40,575 $62,475 22
Phillips 26,652 62.8 $38,246 $53,899 0/1
Desha 27,036 47.5 $32,125 $49,897 1
Lee 27,901 56.9 $32,660 $48,240 1
*Numbers as of 2008/Number in 2018

Table 2.
Salaries by School Districts for Six Arkansas Counties
County School District Beginning salary Highest degree
Benton
Bentonville 44,708 71,121
Decatur 31,600 48,225
Gentry 35,000 55,768
Gravette 41,300 66,585
Pea Ridge 40,000 60,850
Rogers 44,750 74,105
Siloam Springs 39,500 58,207
Saline
Benton 36,425 61,529
Bryant 38,580 68,746
Harmony Grove 38,200 58,850
Lonoke
Cabot 40,575 62,475
Carlisle 31,500 47,950
England 31,000 48,899
Lonoke 33,966 53,484
Phillips Barton-Lexa 38,246 53,899
Helena West Helena 36,246 53,816
Marvell-Elaine 36,500 55,867
Desha
Dumas 31,000 47,150
McGehee 32,125 49,897
Lee
Lee County 32,660 48,240
Source: Teacher Salary Schedule Analysis, Fiscal Year 2016 – 2017
www.arkansased.gov
For experienced teachers, the highest salaries are also in districts in higher socioeconomic
areas. The top salaries ($74,105 to $62,475) are in Benton, Lonoke and Saline Counties;
Phillips, Desha and Lee Counties, pay top salaries ($47,150 to $55,867) that range from
approximately 36% to 25% less than their better endowed counterparts. This discrepancy is a
crucial indicator of the value placed on the quality of education received by those in more
affluent areas compared to those living in economically disadvantaged regions. The incentives
and rewards are greatest for those who choose to teach in the more affluent areas. Almost 60
years have passed since Dr. Kelley's analysis of compensation and teacher quality, yet there
remains a disparity in amounts paid to teachers of African American children.
A second critical resource disparity is the number of Nationally Board Certified teachers,
an indicator of teaching excellence. The National Board for Professional Teacher Standards
(NBPTS) certifies as master teachers those who "improve teaching and student learning"
(http://www.nbpts.org). It describes National Board Certified Teachers as "highly accomplished
educators who meet high and rigorous standards" (http://www.nbpts.org). Receiving NBPTS
arises out of reflective process involving videos of teaching, artifacts of student work,
delineation of goals and outcomes, and writing/reflecting on the processes. The certification
process embodies the significance of reflection by requiring educators to critically examine why
they engage in certain practices (rationale, purpose) and to what end (goals, expected outcomes).
By becoming cognizant of their practices, they become more effective in their design and
implementation. In addition to the honor associated with this certification, a state provides a
monetary award in recognition of completing the arduous process. Within this area, poverty is
noted as an area that warrants an additional reward - working in a high-poverty school and
district (70% or more students are eligible for free and reduced-price lunch) nets a higher
monetary award than educators who do not.
As with “highly qualified” teachers economic factors linked to the distribution master
teachers in Arkansas, school districts with the highest salaries and/or largest populations tend to
have the largest number of National Board Certified educators. Of the six counties compared, in
2008, Benton county had the highest number, 59 (third largest number for the state after Pulaski
county's 110 and Craighead county's 64); there were 20 in Saline; and, Lonoke had 22 (M.
Rowland, personal email, April 25, 2008). For the three majority African American counties,
Lee had, and Chicot had one, and Phillips was one of six counties with none (M. Rowland,
personal email, April 25, 2008). The list of NBCT list for Arkansas in 2018 reflects similar
trends with Benton having 10 as compared to Phillips with one (Table 1). Again, the students in
the most economically challenged, rural environments are not given privilege to the benefits of
"improved teaching and student learning."
"Yet"…According to Positionality
Many believe the major work needed to realize educational equity has been
accomplished given the legislation passed beginning with the 1954 Brown v. Topeka Board Of
Education. However, the reality is a substantial part of the nation remains essentially segregated
based in fact or in practice. This is clearly the case in Arkansas. The percentage of people of
African descent is higher in Arkansas (16%) than the national average (12.8%), however, the
state remains highly segregated with its African American population concentrated in a few
areas. This concentration has serious implications for the educational processes within these
areas.
Positionality has implications for how the issue of equity and outcomes is defined and
addressed. The people directly affected by this controversy are rarely consulted for ideas and/or
recommendations to address it. Reactions to the directive to change the inequitable funding
formula resulted in the recommendation that districts consolidate so state-allocated funds can be
used more judiciously. However, the weight of poverty is not alleviated by how this is done.
Smaller and poorer school districts are consolidated either with similarly small or larger poorer
neighboring districts thereby further exacerbating the problem of inadequate resources (Richard,
2002).
Disparities in salaries for educators and the distribution of Nationally Board Certified
educators remain. One, teacher salaries, is directly under the purview/control of the state; the
other arises from the voluntary decisions of educators. How can educators either with this
certification or with the requisite skills be encouraged to apply for this honor? This seems to
reflect Kelley's focus on the intangible contributions to the classroom and how they are related to
the tangible ones (monies and rewards). If the educators in the lower socioeconomic areas
received this kind of preparation, practices would be enhanced thereby benefitting the students.
These areas could be studied to ascertain their effects as opposed to the more prominent studies
and their "formulas" for determining student success by accounting for economic status and race
(Greene, et. al. 2006). Formulas for students of poverty have been proposed to offset or take into
account these variables to determine district and teacher success (Greene, et.al, 2006). Because
of the perception that home life, culture and socioeconomic status have direct bearing on
intellect, measures that are most accepted are those that emphasize their influence. These
measures have implications for the expectations and subsequent effort given to addressing the
needs of students.
Conclusion
To better understand how teacher quality impacts educational outcomes, the dispersion of
teacher salaries and master teachers across the state of Arkansas was examined. The disparities
indicated in Dr. Kelley's dissertation of 1962 remain today with children of African descent and
in poverty receiving less of the quality espoused as integral to address the achievement gaps.
Positionality is indicated in that litigation and legislation that caused this issue to be viewed more
systematically than individually was initiated by those maligned and most affected. Although
knowledge about a student’s home life and family might be relevant for instruction, it is the
premise of this paper that these are often over emphasized and overshadow significant others.
Positionality is of importance because it recognizes the potential for flawed logic
underlying "formulas" and variables selected to explicate this issue. Some of the prevailing
explanations are based on the implied assumption or belief that people of color have a resistance
or aversion to education. This is a residual of oppressive ideologies used to exclude students of
color. More in line with African Americans and education is the following:
My primary argument is that this indigenous and operative philosophy of learning
and schooling was capable of developing and sustaining the desire for learning in
a people for whom educational accomplishment was not necessarily linked to
comparable rewards, primarily because education was so tied to the identity of
African Americans as a free people. I further argue that this philosophy was
passed on in both oral and written narratives and institutionalized in the school
communities created by African Americans. …. For the slaves, literacy was more
than a symbol of freedom; it was freedom. It affirmed their humanity, their
personhood. (Perry, Steele & Hilliard, 2003, p. 13)
This quote embodies the bulk of my experiences with people of African descent.
To quote my mother, "nothing from nothing leaves nothing." Deficit perspectives are
not effective for realizing equity. If the progress we seek in educational achievement is to be
realized, we must move from the anxious, naïve, and privileged perspectives/positions that hold
students’ characteristics accountable for their success rather than those responsible for educating
them. Further investigation of the varied resources available to students based on positionality
and the implications of these differences for educational processes are needed. When equitable
resources/inputs to the schools are provided, measures of student achievement will be more
viable.
References
Anderson, J.B. (1988). The education of Blacks in the south, 1860 – 1935. Chapel Hill, NC:
North Carolina Press.
Ansell, S. (2011, July7). The achievement gap. Education Week. Retrieved January 7, 2019 from
http://www.edweek.org/ew/issues/achievement-gap
Arber, R. (2000). Defining positioning within politics of difference: Negotiating spaces 'in
between.' Race, Ethnicity and Education, 3(1), 45 - 62.
Bell, D. (2005). Silent covenants: Brown v. Board of Education and the unfulfilled hopes for
racial reform. Oxford, England: Oxford University Press.
Briscoe, F.M. (2005). A question of representation in educational discourse: Multiplicities and
intersections of identities and positionalities. Educational Studies, 38(1), 23 - 41.
Brown, A.H., Cervero, R.M., Johnson-Bailey, J. (2000). Making the invisible visible:
Race and gender and teaching in adult education. Adult Education Quarterly,
50(4), 273 - 289.
Carter, P.L. & Welner, K.G. (2013). Achievement gaps arise from the opportunity gaps. In G.
Ladson-Billings, K. G. Welner, & P. Carter (Eds.), Closing the opportunity gap: What
America must do to give every child an even chance (pp. 1–10). New York: Oxford
Press.
Darling-Hammond, L. (2002). Research and rhetoric on teacher certification: A
response to "Teacher Certification Reconsidered." Educational Policy Analysis
Archives, 10(36)
Field, H. (2019, February 19). Arkansas governor signs measure to raise teacher salaries.
Northwest Arkansas Democrat Gazette, Metro.
Gay, G. (2018). Culturally responsive teaching: Theory, research and practice (3rd ed). New
York: Teachers College Press.
Gehring, J. (2004). As Arkansas legislation stalls, courts take action. Education Week,
23(21), 16 - 20.
Greene, J.P., Barnett, J.H., Ritter, G.W., & Winters, M.A. (2006). The school performance index
in Arkansas. Fayetteville, AR: University of Arkansas, Department of Education Reform.
Hill, T. D. (2011). Every closed eye ain’t sleep: African American perspectives on the
achievement gap. Lanham, MD: Rowman & Littlefield Education.
Kelley, G. E. (1962). An analysis of White and Negro teachers' knowledge of good
teaching practices. Unpublished doctoral dissertation, University of Arkansas,
Fayetteville.
Ladson-Billings, G. (1994). The dreamkeepers: Successful teachers of African
American children. San Francisco: Jossey-Bass Publishers.
Ladson-Billings, G. (2013). Lack of achievement or loss of opportunity? In G. Ladson-Billings,
K. G. Welner, & P. Carter (Eds.), Closing the opportunity gap: What America must do to
give every child an even chance (pp. 11–22). New York: Oxford Press.

Milner, R.H., IV. (2007). Race, culture and researcher positionality: Working through
dangers seen, unseen and unforeseen. Educational Researcher, 36(7), 388 - 400.
Orfield, G., Ee, J. Frankenberg, E., & Siegel-Hawley, G. (2016). Brown at 62: School
segregation by race, poverty and state. Civil Rights Project/ Proyecto Derechos
Civiles, University of California at Los Angeles, Los Angeles, California.
Perry, T., Steele, C., & Hilliard, A. (2003). Young, gifted and Black: Promoting high
achievement among African American students. Boston: Beacon Press.
Richard, A. (2002). Arkansas leaders confront tough options. Education Week, 21(43).
Appendix
2Demographic Information for Arkansas by County
County Total
Population
Percent Black Median
Income
Arkansas 18,352 26.4 38,532
Ashley 20,771 25.6 36407
Baxter 41,093 00.2 40,072
Benton 251,823 01.6 61,271
Boone 37,212 00.4 40,727
Bradley 10,994 29.3 36,310
Calhoun 5,194 22.3 37,225
Carroll 27,782 01.3 39,686
Chicot 11,008 54.2 32,412
Clark 22,495 23.9 37,144
Clay 15,190 00.7 32,219
Cleburne 25,361 00.6 42,312
Cleveland 8,332 11.0 44,840
Columbia 23,992 35.0 37,072
Conway 20,954 11.2 39,638
Craighead 104,246 13.4 45,672
Crawford 62,119 01.3 43,504
Crittenden 49,278 49.0 38,558
Cross 17,164 22.8 41,081
2 Based on five year estimates – 2013 – 2017 American Community Survey

County Total
Population
Percent Black Median
Income
Dallas 7,585 40.3 35,794
Desha 12,094 47.5 27,036
Drew 18,620 28.8 36,092
Faulkner 121,282 11.4 50,316
Franklin 17,803 01.0 39,472
Fulton 12,092 00.3 36,051
Garland 97,994 08.2 41,672
Grant 18,076 02.9 49,968
Greene 44,197 01.0 45,566
Hempstead 22,154 29.6 38,701
Hot Spring 33,480 11.0 40,626
Howard 13,472 20.9 34,851
Independence 37,097 02.0 39,945
Izard 13,521 01.9 39,135
Jackson 17,429 17.0 32,783
Jefferson 71,373 56.4 37,630
Johnson 26,155 01.8 35,758
Lafayette 7051 37.9 32,500
Lawrence 16,777 00.9 37,603
Lee 9,614 56.9 27,901
Lincoln 13,885 31.4 38,873
Little River 12,494 20.5 36,963
Logan 21,802 02.1 37,982
Lonoke 71,568 06.0 57,290
Madison 15,907 00.6 42,894
Marion 16,374 00.2 36,113
Miller 43,760 24.7 41,862
Mississippi 43,534 35.1 36,417
Monroe 7,420 40.8 31,584
Montgomery 9,059 00.3 35,252
Nevada 8,528 33.4 36,995
County Total
Population
Percent Black Median
Income
Newton 7,898 00.0 38,134
Ouachita 24,378 40.9 32,136
Perry 10,320 02.3 46,168
Phillips 19,518 62.8 26,652
Pike 10,893 02.8 36,893
Poinsett 24,098 05.6 37,487
Polk 20,212 00.5 33,870
Pope 63,372 02.9 40,668
Prairie 8,309 13.4 41,244
Pulaski 392,848 36.1 48,850
Randolph 17,514 00.9 35,930
St. Francis 26,688 55.6 33,102
Saline 116,252 06.4 58,985
Scott 10,584 00.2 37,396
Searcy 7,925 00.2 36,716
Sebastian 127,362 06.8 40,932
Sevier 17,206 04.8 43,675
Sharp 17,041 00.6 31,792

Supporting English Learners and Their Families through Summer Learning
Dr. Sarah Frederickson, University of Arkansas
Dr. Trish Lopez, University of Arkansas
Dr. Janet Penner-Williams, University of Arkansas
Abstract
An intentionally designed summer intervention examined the potential positive academic impact
such a program could have on English language learners (ELLs) in literacy and mathematics for
rising kindergarten to rising seventh grade students. The teachers chosen for these students were
endorsed in ESL and received additional professional development in preparation for the summer
intervention. The participating students were all identified as ELLs. Post summer intervention
student state assessment scores were compared to a control group of ELL students that did not
partake in the summer intervention. There were statistically significant findings in mathematics
in favor of the students that completed the summer intervention. Teacher and student anecdotal
comments are incorporated to further reflect the positive impact the program had on ELL
students.
Introduction
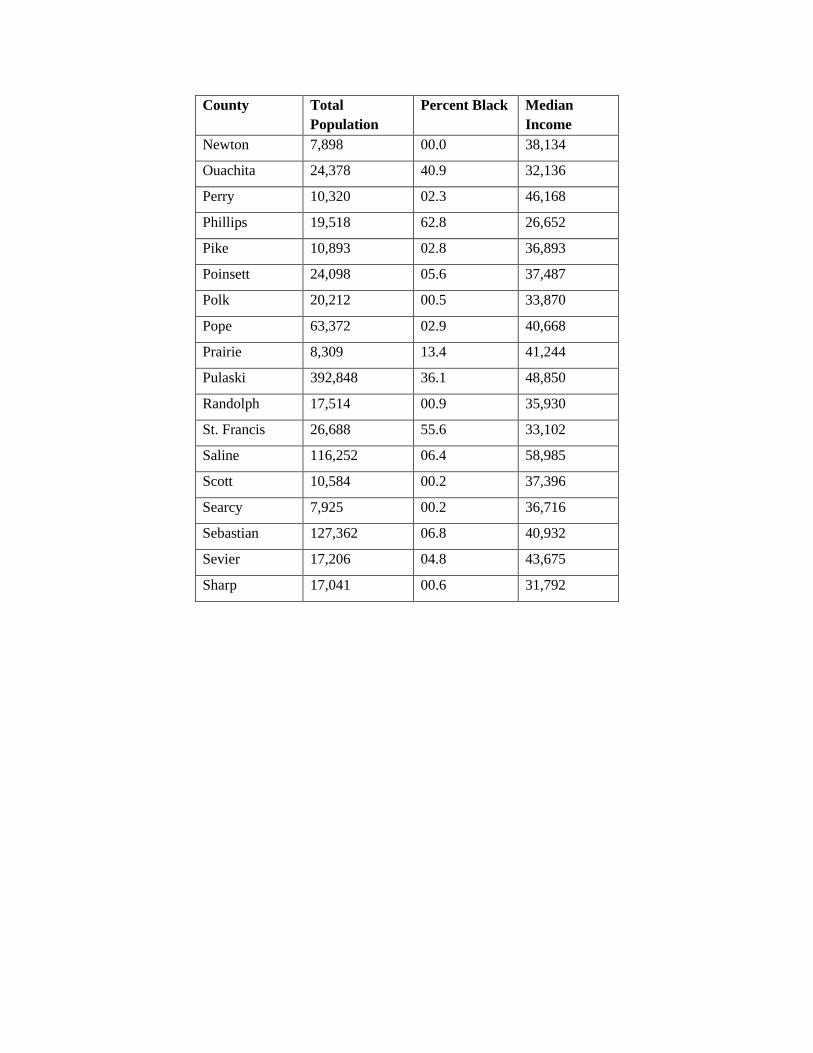
As she shuffled through attendance slips, the summer coordinator’s nods turned to shock.
“I knocked on this one’s door last night!” she exclaimed. “The door’s about to fall off, but I kept
knocking until someone answered. They know she needs to be here.” This response was
common from the summer coordinator, a kindergarten through fifth grade instructional facilitator
at the elementary site that hosted a summer learning program tailored to meet the needs of
English learners (ELs). Her persistence in promoting attendance at the summer program—
whether conducting home visits, speaking to parents over the phone in their native language of
Spanish, or speaking to neighbors and friends of the family—was an integral part of its success.
The summer coordinator has seen firsthand the persistent achievement gap in both
reading and mathematics that exists between ELs and their non-English learner peers. This
persistent disparity needs to be thoroughly examined and intentional interventions put in place
due to the increasing number of ELs in public schools (National Center for Education Statistics
[NCES], 2013; NCES, 2018; Carlo et al., 2004). The school district where the summer
coordinator works hosted the summer program to intervene on behalf of its EL population. The
district has 47% of its student population as limited English proficient. For the 2017-2018
school year, the Hispanic population was 45.9%, the Pacific Islander population was 11.7%, and
the Asian population was 1.6%. These students may also experience an additional barrier to
achievement based on socioeconomic status, as ELs disproportionately come from low
socioeconomic homes nationwide (Alexander, Entwisle, & Olson, 2007; Kieffer, 2010). The
student population for the school district has 71% of its population considered low-income.
One of the greatest disparities for disadvantaged students can be traced to children’s out
of school experiences (Alexander et al., 2007). As Pitcock notes, when public schools are open,
“students of different income levels achieve at roughly the same rate” (2018, p. 5). Summer
school is a way for students to lessen the amount of time they are in an out-of-school learning
environment. Researchers McEachin, Augustine, and McCombs further support effective

summer programming as a way to combat what they term “the summer slide” (2018, p. 10). Our
projects examine the issue of “the summer slide” in relation to ELs. The University of Arkansas
in Fayetteville (UA) is the lead agency for OELA-Office of English Language Acquisition
federally funded grants CONNECT (Creating Organized Networks Needed to Effectively
Increase Early Childhood Teacher Performance) and SOAR (Strategically Organized for EL
Academic Results). Our projects are actively working to address bridging the gap between ELs
and their English-as-a-first-language peers through focused summer school intervention for
students.
In accordance with existing research, we found several aspects to be crucial to the
implementation of our summer program, like small class sizes, alignment to student needs, high
quality instruction from well qualified teachers, and practices to create a positive site culture and
maximize participation and attendance (McEachin, Augustine, & McCombs, 2018; Augustine,
McCombs, Schwartz, & Zakaras, 2013; Cooper, Charlton, Valentine, Muhlenburck, & Borman,
2000). This article briefly describes the considerations in designing the summer program and
selecting students. We then incorporate our analyses of the data into three larger categories that
were components of success for our program: (1) student-centered curriculum and instruction;
(2) methods that reduce the affective filter; and (3) family and community participation. A
description of the data analysis methodologies follows. Finally, we provide conclusions and
implications based on our statistical analyses. These strategies, and their subcomponents, could
be replicated in future summer programs for ELs.
Summer Program Design
The summer program described in this case study was a two-week program of intensive
literacy and math instruction. Students were selected using data from their English Language
Proficiency Assessment (ELPA), Measures of Academic Progress (MAP), and Benchmark
Assessment System (BAS) scores. As students were selected for the summer intervention, an
effort was made to aggregate data for control students who were also English learners at the
same school and in the same grade level as those students who attended the summer program
(see Table 1). Students who scored at the beginning and intermediate levels on the ELPA were
selected to participate. The students’ MAP and BAS scores were not only used as a baseline for
data analysis comparisons after the completion of the summer school, but were also used as a
foundation for creating curricula tailored to the needs of the students in the program. During the
program, students received instruction in classes of no more than eight students, and had at least
35-40 minutes of instruction in math, reading, and writing. The anecdotal comments are
incorporated into the relevant suggestions from the literature about summer programming below.

Table 1
Demographics of Students in Summer Program
Grade Level
& Group N Hispanic
Hawaiian/
Pacific Islander
All Other
Demographic
Groups Males Females
K-Treatment 13 76.9% 23.1% 0 38.5% 61.5%
K-Control 15 93.3% 6.7% 0 66.6% 33.3%
1st-Treatment 20 55.0% 40.0% 5.0% 65% 35%
1st-Control 31 67.7% 32.3% 0 29% 71%
2nd-Treatment 20 55.0% 45.0% 0 55% 45%
2nd-Control 21 38.1% 61.9% 0 52.4% 47.6%
3rd-Treatment 16 68.8% 31.3% 0 50% 50%
3rd-Control 29 62.1% 37.9% 0 48.3% 51.7%
4th-Treatment 16 62.5% 37.5% 0 31.3% 68.75%
4th-Control 15 60% 40% 0 53.3% 46.7%
5th-Treatment 18 44.4% 50% 5.56% 50% 50%
5th-Control 17 58.8% 41.2% 0 64.7% 35.3%
6th-Treatment 11 90.9% 9.1% 0 36.4% 63.6%
6th-Control 11 63.6% 36.4% 0 27.3% 72.7%
7th-Treatment 26 15.7% 42.3% 0 61.5% 38.5%
7th-Control 19 84.2% 15.8% 0 36.3% 73.7%
Student-centered Curriculum and Instruction
Small Class Sizes
Based on an evaluation of summer programs in six urban districts in the summer of 2011,
Augustine, McCombs, Zakaras, and Schwartz recommended students should be in small classes
or groups (2013). They found that teachers might find large class sizes challenging, even with a
second adult in the room. Similarly, Cooper and his colleagues found that summer programs
with small group or individual instruction had the greatest effect on student performance (2000).
Our summer program corroborated those findings, with students in kindergarten through seventh
grade in classes of no more than an eight-to-one student-teacher ratio. Anecdotal evidence from

teachers within our program were in agreement with Cooper’s recommendation for small class
sizes in summer school. Teachers commented that the instructional design with small groups
allowed them to tailor instruction to the individual needs of each students and that response time
of the teacher to individual needs tends to be much quicker in a smaller group.
Aligned to Student Needs
The curricula for our programs was created based on student needs. Several state-
regulated assessment data sets were used to determine needs of instruction for students, as well
as their previous grade level teacher’s input for areas of growth. Using the information gathered
from those sources, the site-specific summer coordinators worked with project staff to adapt and
create curricula to fit the needs of the targeted students. The literacy curricula that were
developed were adapted from commercially available and tested curriculum, and incorporated
features to improve learning like small group reading and time to write based on reading
(Augustine, McCombs, Schwartz, & Zakaras, 2013). Teachers were trusted, as professionals
trained in ESL, to monitor and adjust the curriculum in real time in response to student learning
needs.
Qualified Teachers
Research suggests that teacher quality is a strong determinant in school quality and
student learning (Rivkin, Hanushek, & Kain, 2005), yet teachers trained and certified for
instructing ELs consistently continues to be an area of teacher shortage (NCES, 2018). The
educators selected to teach in the summer school were experienced teachers who went through
an application and screening process before they began in the program. To apply, the teachers
had to be ESL endorsed and licensed to teach in their subject area. The project directors
conducted observations in the applicant’s classroom of the applicant’s instructional methods
prior to approval to teach in the summer school. The observations focused on the teacher’s use of
instructional strategies and assessments that benefit ELs. As Goldenberg notes, ELs require
additional instructional supports to achieve current academic standards (2014).
Coaching
Teachers were asked to choose an area of focus for observation based on the instructional
practices and discourse elements from the Culturally Responsive Instruction Observation
Protocol (Powell, Cantrell, Correll, & Malo-Juvera, 2017). Project staff observed the teachers
during the summer school to gain more insight into specific classroom methodologies used by
teachers. Following Knight's Reflective Teaching model (2013), teachers that volunteered to
receive coaching met with trained project staff coaches. The coaches implemented Knight's
model in structured conversations to improve the teachers' culturally responsive instruction. All
teachers that received coaching indicated through surveys and verbal feedback that; 1) the focus
area of coaching was relevant to them, 2) they would have something they could apply in their
classrooms in the fall, 3) the time spent with a coach was adequate and meaningful, and 4) they
would choose a coaching option again if given the opportunity.
Methods to Reduce the Affective Filter
Results from a randomized field trial suggest that voluntary summer school programs can
help improve learning for students from high-poverty schools on the condition that students have
regular attendance in the program (Borman & Dowling, 2006). Project staff and teachers actively
worked to reduce the affective filter of students to maximize participation and attendance
through a variety of ways, like the summer coordinator’s home visits before the program started.
Considering affective learning needs for English learners means “minimizing barriers to learning
and resulting frustrations” (Rao & Torres, 2016). For our projects, this included providing
meals, grouping strategically, and giving the students small gifts.
Hungry kids have a much more difficult time learning because basic needs are not met
(Aleshire, 2017). Breakfast and lunch were provided to the students every day. In a district where
the poverty rate is 71%, many students do not have access to regular meals outside of school.
The students were given balanced nutrition at mealtimes and could take home any extra food.
Students were placed in small, homogeneous groups by reading level so students could
have focused interventions. The groups of students could have equal access to participation in
activities with class sizes of no more than eight students. These students could identify with each
other on an academic level. Survey feedback from the students indicated they enjoyed the small
class sizes and felt better prepared for the upcoming school year.
The Educational Renewal Zone associated with University of Arkansas, Fayetteville
partnered with our grants to provide attendance reward baggies. Students received a gift bag for
every day of their attendance. These baggies contained small gifts of candy, erasers, pencils,
bookmarks, and Razorback© paraphernalia. The summer coordinator reached out to the local
Barnes & Noble Bookstore to obtain a book of the student’s choice for each child that attended
summer school as a gift for the last day and as a reward for its hard work during the program. As
a result, attendance remained steady over the course of the program.
Parent and Community Participation
Research into parent involvement is becoming more refined in order to delineate the
various types of parental involvement and measures of student academic achievement (Fan &
Chen, 2001). Recent research suggests family involvement is positively linked to children’s
academic outcomes (Weiss, Lopez, & Rosenberg, 2010; Wilder, 2014; Van Voorhis, Maier,
Epstein, & Lloyd, 2013). There is general agreement within the research on at least two
categories of family involvement: learning activities within the home and learning activities
within the school (Tang, Dearing, & Weiss, 2012). Our projects supported opportunities for both
categories of family involvement. Project staff and community members met with students and
their families during Parent and Child Together (PACT) time prior to summer school. During the
meeting, two groups from the community gave informational presentations multilingually about
local resources available to culturally and linguistically diverse families. Then, to support
learning at home, parents and students received backpacks filled with bilingual, grade-level
appropriate books in their native language and multiple activities the parent and student could do
together at home.
One factor in low parent involvement for ELs may be barriers in communication and
access (Barrueco, Smith, & Stephens, 2015). The projects sought to reduce these barriers through
parent liaisons and bus routes. Project staff conducted phone calls and home visits to recruit and

enroll targeted students. Bus routes were provided to better enable students to attend summer
school. Parent liaisons contacted families in their home language if a child was absent or if a
teacher wanted to communicate to a parent about a student. Additionally, open lines of
communication between project staff and families was a crucial part of the success of the
summer school, from enrollment to implementation.
Methodologies
As described in the summer program design section, students’ ELPA, MAP, and BAS
assessment scores were collected and analyzed to establish treatment and control groups of
students before the summer program began. Teachers collected student work on assignments
and formative assessment in class during the summer program. On the last day, students
completed a survey in which they were asked to rate their experience using a Likert scale with
pictures that matched their emotions on a scale of one to four. Students were also asked what
they liked about the program, what they would change, and what they learned. In addition to this
data collection, teachers completed a survey rating the success of the program and providing
responses to open-ended questions. In the fall following the summer program, students’ MAP
scores were collected and analyzed using paired samples t-tests to compare the means between
treatment students’ test administrations for all grades except Kindergarten, who did not take the
MAP assessment as part of their Pre-Kindergarten program. Independent samples t-tests were
also conducted to compare the means of the treatment to the control students on the post-
administration of the MAP. For test statistics that were significant, effect sizes (Cohen’s d) were
calculated using the formula d=|t|/√N for paired samples t-tests and the formula d=(M2 -M1)/SD
pooled for independent samples t-tests. Due to the simultaneous triangulation of data and the in
depth nature of the analysis, these results are validated. Analyses of these data are included in the
conclusions section below.
Conclusions
Summer school may be an effective intervention to help improve instruction and learning
for all students, especially English learners with a two-fold challenge—learning a new academic
language and coming from a low socioeconomic home. Preliminary findings (see Tables 2 and
3) from our projects show potential, with a statistically significant, small effect size in first grade
math when comparing pre- and post-treatment scores (p=0.038, d=0.498); statistically
significant, medium effect size in third grade math (p=0.040, d=0.659); and statistically
significant, large effect size in sixth grade math (p=0.038, d=0.97) between the control and
treatment groups after the summer school intervention. Although scores were statistically
significantly different for second and third grade reading, this difference existed between the
treatment and control groups before the summer program intervention and continued after.

Table 2
Paired samples test statistics comparing post-intervention to pre-intervention administrations
Grade Level Mean
Std.
Deviation t df
Sig. (2-
tailed)
1st-Reading 0.600 4.535 0.592 19 0.561
1st-Math 3.250 6.528 2.226 19 0.038
2nd-Reading 1.950 8.611 1.013 19 0.324
2nd-Math 1.050 6.134 0.765 19 0.453
3rd-Reading -0.375 7.310 -0.205 15 0.840
3rd-Math -0.500 8.140 -0.246 15 0.809
4th-Reading -2.800 5.185 -2.091 14 0.055
4th-Math -1.600 5.974 -1.037 14 0.317
5th-Reading 0.600 13.410 0.173 14 0.865
5th-Math 2.313 5.016 1.844 15 0.085
6th-Reading 0.455 5.260 0.287 10 0.780
6th-Math 1.900 6.951 0.864 9 0.410
7th-Reading 2.308 12.506 0.665 12 0.518
7th-Math -1.250 8.201 -0.682 19 0.504
* Kindergarten students did not take the MAP before summer school, so no data is available for
this statistic.

Table 3
Independent samples test statistics, treatment-control
Grade Level t Df
Sig. (2-
tailed)
Mean
Difference
Std. Error
Difference
K-Reading 1.167 19.3 0.258 3.938 3.376
K-Math 1.288 26 0.209 4.974 3.863
1st-Reading -0.100 48 0.921 -0.350 3.492
1st-Math 0.012 49 0.991 0.040 3.464
2nd-Reading 2.894 39 0.006 9.271 3.203
2nd-Math 1.988 31.8 0.057 6.836 3.484
3rd-Reading 2.180 40.5 0.035 7.584 3.479
3rd-Math 2.117 43 0.040 6.412 3.029
4th-Reading -1.144 50 0.258 -4.674 4.084
4th-Math -0.245 50 0.807 -0.799 3.258
5th-Reading -0.608 31 0.547 -3.600 5.916
5th-Math -0.536 32 0.596 -2.618 4.883
6th-Reading -0.413 20 0.684 -2.182 5.285
6th-Math -2.225 19 0.038 -9.109 4.094
7th-Reading 1.330 41 0.191 4.763 3.582
7th-Math -0.612 39 0.544 -2.029 3.314
As noted in the article, “The Case for Summer Learning,” reading tends to be a more organic
part of a child’s out-of-school life and parents gravitate toward reading with their children
(Pitcock, 2018). On the other hand, math knowledge and skills tend not to be reinforced out of
school to the same degree as reading. Qualitative data also reflected high self-efficacy for
students in specific math and reading skills after the summer school, as well as high self-efficacy
for teachers in implementing culturally responsive teaching methods and assessments for English
learners.
Educators, administrators, and researchers looking to strengthen or start summer
programs to reduce the “summer slide” should keep in mind the ideas of implementing student-
centered curricula and instruction, reducing the affective filter, and engaging families and
community groups. Specific supports for English learners can augment a program’s success,
such as the coaching of culturally responsive teaching strategies and incorporation of
multilingual family and community members. Being persistent, like our summer coordinator,
helps too. Average daily attendance for students’ grades kindergarten through seventh was 133
students, due in large part to constant contact by project staff with EL families to get students to
school and learning. After missing the first day of the summer program, the student the summer
coordinator visited attended regularly. The student wrote with enthusiasm she felt excited about
summer school because she wanted to see the teachers and she learned about sight words.
Moving forward, our research will continue to focus on improving instruction for English
learners by providing professional development and coaching to teachers, while examining the
specific components of the summer school program that lead to success for our students. In
sharing our research, we hope to encourage others to purposefully design and plan summer
programs, and to reflect, examine, and research the factors that contribute to success for English
learners.
References
Alexander, K.L., Entwisle, D.R., & Olson, L.S. (2007). Lasting consequences of the summer
learning gap. American Sociological Review, 72(2), 167-180. https://0-doi-
org.library.uark.edu/10.1177/000312240707200202
Aleshire, I. (2017, Aug 04). Hungry kids can’t learn. The Register - Guard. Retrieved from
http://0-search.proquest.com.library.uark.edu/docview/1925904758?accountid=8361
Augustine, C.H., McCombs, J.S., Schwartz, H.L., & Zakaras, L. (2013). Getting to work on
summer learning: Recommended practices for success. Santa Monica, CA: RAND
Corporation. Retrieved from http://0-search.ebscohost.com.library.uark.edu/
login.aspx?direct=true&db=nlebk&AN=646994&site=ehost-live&scope=site
Barrueco, S., Smith, S, & Stephens, S.A. (2015). Supporting parent engagement in linguistically
diverse families to promote young children’s learning: Implications for early care and
education policy. New York, NY: Child Care & Early Education Research Connections.
Borman, G. D., & Dowling, N. M. (2006). Longitudinal achievement effects of multiyear
summer school: Evidence from the teach Baltimore randomized field trial. Educational
Evaluation and Policy Analysis, 28(1), 25-48. Retrieved from http://0-
search.proquest.com.library.uark.edu/docview/197230316?accountid=8361
Carlo, M.S., August, D., McLaughlin, B., Snow, C.E., Dressler, C., Lippman, D.N., Lively, T.J.,
& White, C.E. (2004). Closing the gap: Addressing the vocabulary needs of English-
language learners in bilingual and mainstream classrooms. Reading Research Quarterly,
39(2), 188-215. Retrieved from http://0-www.jstor.org.library.uark.edu/stable/4151671
Cooper, H., Charlton, K., Valentine, J., Muhlenbruck, L., & Borman, G. (2000). Making the
most of summer school: A meta-analytic and narrative review. Monographs of the
Society for Research in Child Development, 65(1), I-127. Retrieved from http://0-
www.jstor.org.library.uark.edu/stable/3181549
Fan, X., & Chen, M. (2001). Parental involvement and students' academic achievement: A meta-
analysis. Educational Psychology Review, 13(1), 1-22. doi:http://0-
dx.doi.org.library.uark.edu/10.1023/A:1009048817385
Goldenberg, C. (2014). Unlocking the research on english learners. The Education Digest, 79,
36-46. Retrieved from http://0-search.proquest.com.library.uark.edu/
docview/1496698449?accountid=8361
Kieffer, M.J. (2010). Socioeconomic status, English proficiency, and late emerging reading
difficulties. Educational Researcher, 39(6), 484-486.
Knight, J. (2013). High impact instruction: A framework for great teaching. Thousand Oaks,
CA: Corwin.
McEachin, A., Augustine, C.H., & McCombs, J. (2018). Effective summer programming: What
educators and policymakers should know. American Educator, 42(1), 10-11.
National Center for Education Statistics, Institute of Education Sciences, United States
Department of Education. (2013). NAEP Nation’s Report Card Student Groups [Data
file]. Retrieved from https://www.nationsreportcard.gov/reading_math_2013/#/student-
groups
National Center for Education Statistics, Institute of Education Sciences, United States
Department of Education. (2018). English Language Learners in Public Schools [Data
file]. Retrieved from https://nces.ed.gov/programs/coe/pdf/coe_cgf.pdf
Pitcock, S. (2018) The case for summer learning: Why supporting students and families all year
is vitally important. American Educator, 42(1), 4-9.
Powell, R., Cantrell, S.C., Correll, P.K., & Malo-Juvera, V. (2017). Culturally Responsive
Instruction Observation Protocol (4th ed.) Lexington, KY: University of Kentucky
College of Education.
Rao, K. and Torres, C. (2016). Supporting academic and affective learning processes for English
language learners with universal design for learning. TESOL Quarterly, 51(2), 460-472.
doi:10.1002/tesq.342
Rivkin, S., Hanushek, E., & Kain, J. (2005). Teachers, schools, and academic achievement.
Econometrica, 73(2), 417-458. Retrieved from http://0-
www.jstor.org.library.uark.edu/stable/3598793
Tang, S., Dearing, E., & Weiss, H.B. (2012). Spanish-speaking Mexican-American families’
involvement in school-based activities and their children’s literacy: The implications of
having teachers who speak Spanish and English. Early Childhood Research Quarterly,
27(2), 178.
Van Voorhis, F. L., Maier, M. F., Epstein, J. L., & Lloyd, C. M. The impact of family
involvement on the education of children ages 3 to 8: A focus on literacy and math
achievement outcomes and social-emotional skills. Retrieved from
http://www.mdrc.org/publication/ impact-family-involvement-education-children-ages-3-
8
Weiss, H.B., Lopez, M.E., & Rosenberg, H. (2010). Beyond random acts: Family, school, and
community engagement as an integral part of education reform. Washington, D.C.:
Harvard Family Research Project & SEDL. Retrieved from
https://www.sedl.org/connections/engagement_forum/beyond_random_acts.pdf
Wilder, S. (2014). Effects of parental involvement on academic achievement: a meta-synthesis.
Educational Review, 66(3), 377-397. doi:10.1080/00131911.2013.780009
A Tale of Two None-conventional Approaches to Teach Cultural Competence to Preservice
Teachers: Examples from the Republic of Turkey and the United States of America
Dr. Ismail Guven, Ankara University and Arkansas Tech University
Dr. Mohamed Ibrahim, Arkansas Tech University
Introduction
Preservice teachers are increasingly required to accommodate diverse students’
population in their future classrooms. Furthermore, national and state standards require that
preservice teachers demonstrate adequate understanding of their students’ differences and make
instructional decisions accordingly (He & Cooper, 2009). Consequently, teacher education
programs utilize a wide range of strategies to help teacher candidates to teach and interact
effectively with different learners. The goal of these strategies is to ensure that teachers can
address the needs of all students, understand their own worldviews and to be responsive to the
health, beliefs, cultural, and linguistic needs of their students (Banks, 1994; Bennett, 1993;
Gillette & Boyle-Baise, 1995; Nieto & Rolon, 1995). Many scholars argue that despite the
importance of teaching cultural competence, it is one of the most overlooked areas in the field of
training (Saha, Beach, & Cooper, 2008; Adler & Gundersen, 2007). Furthermore, cultural
competence cannot be learned successfully by reading books or taking quizzes due to the scope
of culture aspects such as students’ age, gender, disability, income level, education, and
geographical location. Therefore, for preservice teachers to become culturally competent, they
are required to learn about the culture elements they function in to effectively teach diverse
students.
Although researchers have examined different approaches to teach cultural competence
such as using reflection and field experiences, other researchers argue that these strategies lack a
systematic integration of many of cultural aspects in many teacher programs (Banks, 1984;
Bennett, 1993; Helms, 1984; Villegas, 1991; Zeichner, 1993, Prater, Wilder, & Dyches, 2008).
Therefore, this study proposed two different none-conventional approaches to teach cultural
competence to preservice teachers from the Republic of Turkey and the United States of
America.
Literature Review
Cultural Competence
The literature presents different approaches to teach cultural competence. For example,
while some researchers consider that teaching cultural competence must include the interaction
between knowledge, values, attitudes and understandings of different groups, other researchers
argue that cultural competence must evolve over time and to be closely related to one's own
culture, including the interactions of the individuals with others to develop dynamic and complex
learning environment (Siwatu, 2007, Sue, 2001, Lynch, & Hanson,1992). Based on this view,
modelling effective communication and constant interaction between preservice teachers and
their different elements of their environment are essential components for teaching cultural
competency. For instance, the use of modelling performance-based art projects, outdoor
activities and the participation in multicultural events can enhance students’ cultural competence
(Sue, 2001). Engaging in such cultural activity projects can also help preservice teachers to
develop awareness about other cultures and overcome their individual biases. Therefore, the
participation in such activities should allow students to develop cultural awareness and integrate
these practices into their classroom daily routines (Kirmayer, 2012; Diller, & Moule, 2005, Gay,
2000). Further, researchers proposed other activities to teach cultural competence to teacher
candidates such as local dances and drama activities. These activities allow students to explore
other cultural aspects, solve communication problems, develop self-confidence to bridge
differences between communities and learn about the habits of different cultures (Doğan, 2008;
Brown, 2007, Güzeloğulları & Ertural, 2006; Siwatu, 2007, Bişgin, 2001).
Project-based Learning
Project-based learning (PBL) is a teaching strategy that focuses on student-directed
investigation (Blumenfeld et al., 1991; English & Kitsantas, 2013). The main foundation of PBL
is the constant interaction and active participation with peers. Through this strategy, students
engage in projects by articulating questions for investigation, designing plans, collecting and
analyzing information, and creating a product of their understanding (Blumenfeld et al., 1991).
The core emphasis of PBL learning is allowing students to interact and communicate with their
peers during working on their project and to engage in reflective and critical thinking about what
is being learned (Barrows, 2000; Bereiter & Scardamalia, 1989; Torp & Sage, 1998). Therefore,
project-based learning is considered an important learning approach that may support the
improvement of students’ communication skills during projects execution (Blumenfeld et al.,
1991; English & Kitsantas, 2013; Sungur & Tekkaya, 2006).
Theoretical Framework
Self-efficacy
The present study adopted Bandura’s Social Cognitive Theory (SCT) as a theoretical
framework (Bandura, 1986, 1994 &1997). Bandura’ SCT emphasized the importance of
behavioral imitation and modeling as the most effective strategy to teach new behaviors,
compared to teaching by persuasion or observation. Therefore, Bandura takes a broad view of
learning and recommends constant interaction between three different factors for successful
reciprocal causation model: behaviors, personal factors and the environment. Although, Bandura
does not suggest that the three factors in the model make equal contributions to the new
behavior, he believes that people learn through observing others and by attending to the
consequences of their own actions. Therefore, Bandura defines self-efficacy as “the beliefs in
one’s capabilities to organize and execute the courses of action required to produce given
attainments (Bandura, 1997). These beliefs affect the way people interact, communicate, make
choices, the efforts they put into completing tasks, their will and resolve when difficulties arise,
and their skills to cope with difficult situations. An important argument in Bandura’s construct is
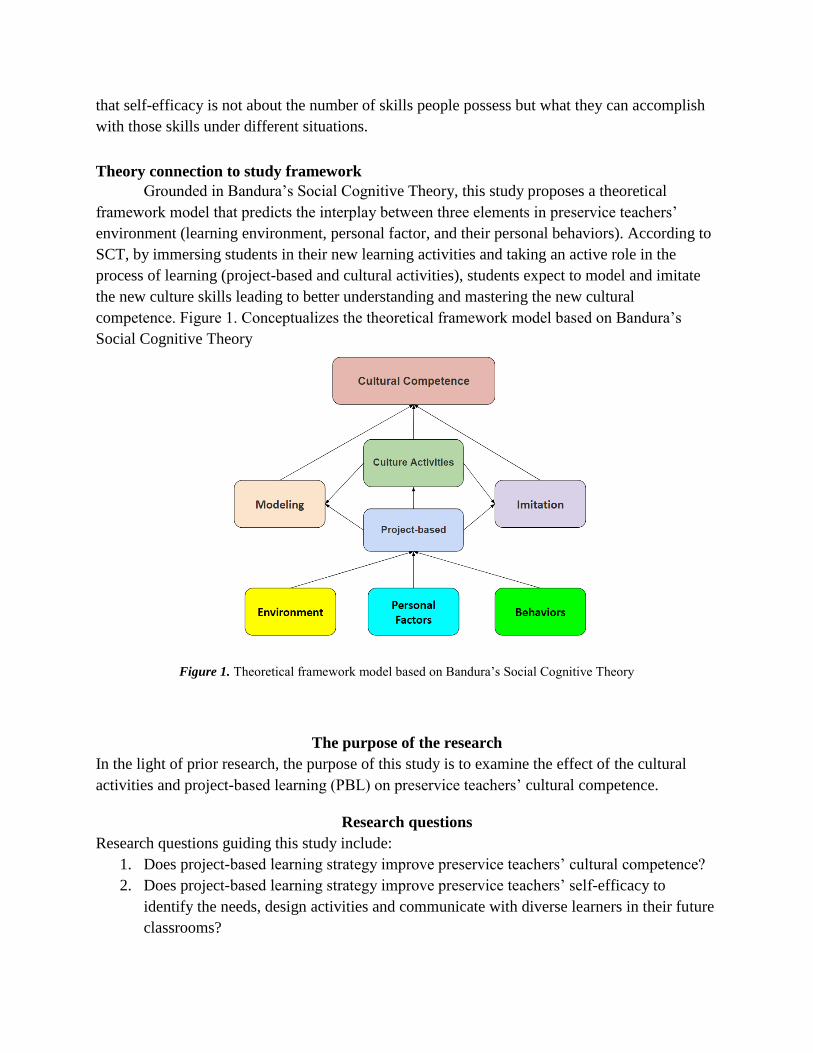
that self-efficacy is not about the number of skills people possess but what they can accomplish
with those skills under different situations.
Theory connection to study framework
Grounded in Bandura’s Social Cognitive Theory, this study proposes a theoretical
framework model that predicts the interplay between three elements in preservice teachers’
environment (learning environment, personal factor, and their personal behaviors). According to
SCT, by immersing students in their new learning activities and taking an active role in the
process of learning (project-based and cultural activities), students expect to model and imitate
the new culture skills leading to better understanding and mastering the new cultural
competence. Figure 1. Conceptualizes the theoretical framework model based on Bandura’s
Social Cognitive Theory
Figure 1. Theoretical framework model based on Bandura’s Social Cognitive Theory
The purpose of the research
In the light of prior research, the purpose of this study is to examine the effect of the cultural
activities and project-based learning (PBL) on preservice teachers’ cultural competence.
Research questions
Research questions guiding this study include:
1. Does project-based learning strategy improve preservice teachers’ cultural competence?
2. Does project-based learning strategy improve preservice teachers’ self-efficacy to
identify the needs, design activities and communicate with diverse learners in their future
classrooms?
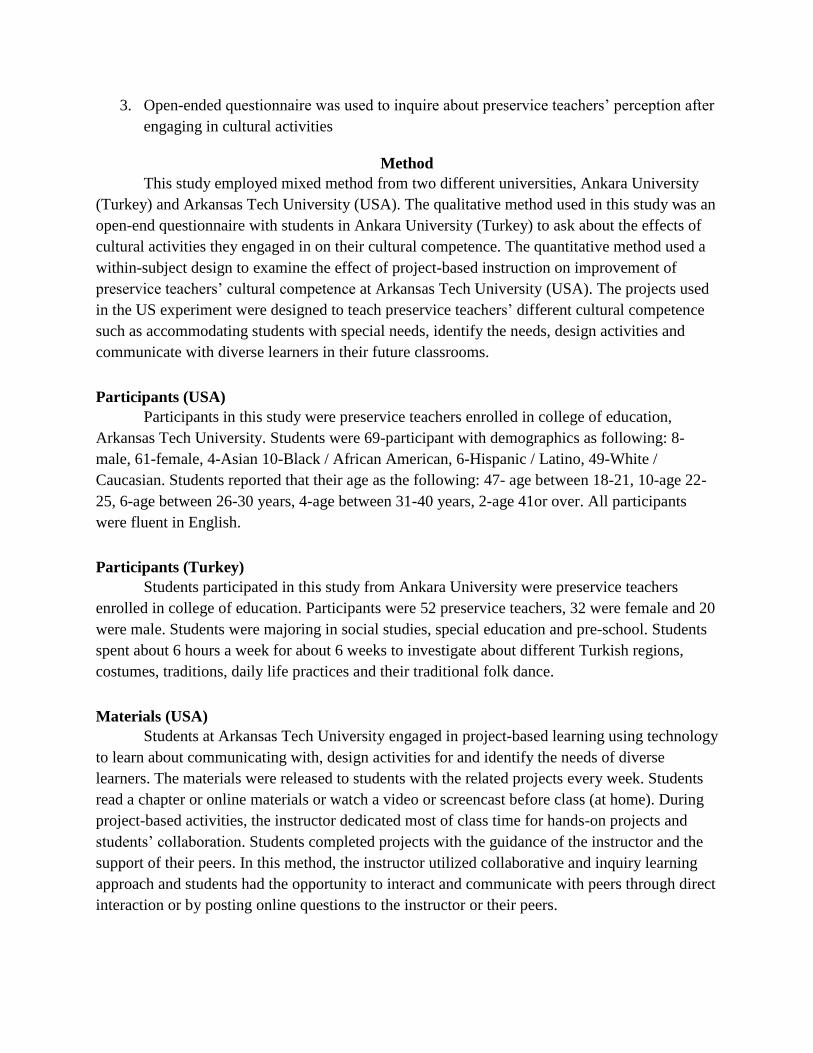
3. Open-ended questionnaire was used to inquire about preservice teachers’ perception after
engaging in cultural activities
Method
This study employed mixed method from two different universities, Ankara University
(Turkey) and Arkansas Tech University (USA). The qualitative method used in this study was an
open-end questionnaire with students in Ankara University (Turkey) to ask about the effects of
cultural activities they engaged in on their cultural competence. The quantitative method used a
within-subject design to examine the effect of project-based instruction on improvement of
preservice teachers’ cultural competence at Arkansas Tech University (USA). The projects used
in the US experiment were designed to teach preservice teachers’ different cultural competence
such as accommodating students with special needs, identify the needs, design activities and
communicate with diverse learners in their future classrooms.
Participants (USA)
Participants in this study were preservice teachers enrolled in college of education,
Arkansas Tech University. Students were 69-participant with demographics as following: 8-
male, 61-female, 4-Asian 10-Black / African American, 6-Hispanic / Latino, 49-White /
Caucasian. Students reported that their age as the following: 47- age between 18-21, 10-age 22-
25, 6-age between 26-30 years, 4-age between 31-40 years, 2-age 41or over. All participants
were fluent in English.
Participants (Turkey)
Students participated in this study from Ankara University were preservice teachers
enrolled in college of education. Participants were 52 preservice teachers, 32 were female and 20
were male. Students were majoring in social studies, special education and pre-school. Students
spent about 6 hours a week for about 6 weeks to investigate about different Turkish regions,
costumes, traditions, daily life practices and their traditional folk dance.
Materials (USA)
Students at Arkansas Tech University engaged in project-based learning using technology
to learn about communicating with, design activities for and identify the needs of diverse
learners. The materials were released to students with the related projects every week. Students
read a chapter or online materials or watch a video or screencast before class (at home). During
project-based activities, the instructor dedicated most of class time for hands-on projects and
students’ collaboration. Students completed projects with the guidance of the instructor and the
support of their peers. In this method, the instructor utilized collaborative and inquiry learning
approach and students had the opportunity to interact and communicate with peers through direct
interaction or by posting online questions to the instructor or their peers.

Materials (Turkey)
Students at Ankara University attended social activities during the 6-weeks experiment
time such as social clubs and folk dance activities. In preparation for the folk dance activities,
students were free to select to study about different Turkish regions, their culture, costumes,
traditions, music, lifestyles and history. Students attended about 6 hours per week working on
these activities through reading, interacting with other students and reviewing different
multimedia materials related to different Turkish regions. Instructors emphasized the importance
of collaboration between all participants in all activities. The final project was a folk dance
performance represents different Turkish regions presented at the end of the semester.
Instrumentations
For students at Arkansas Tech University, the instrumentations consisted of the following
items:
Demographic survey. The demographic survey was to collect information about the
participants’ makeup, such as gender, age, major and race.
Self-efficacy survey. This survey was a 3-question 11-level Likert scale to assess students
perceived self-efficacy based on Bandura’s “Guide to the construction of self-efficacy scales” in
Pajares & Urdan (2006). The measure was tailored to assess students’ ability to integrate
technology in their teaching to enhance cultural competence. The scale ranges from "Cannot do
at all" at zero to “Highly certain can do" at 100 and it was administered at both the beginning and
the end of the study. Students were asked to answer how confident they were in their belief that
they have this ability". For example, students were asked: “Before engaging in technology
integration in teaching and learning in your content area: How certain that you can design and
teach technology enhanced learning activities that connect content standards with student
technology standards and meet the diverse needs of learners. Rate your degree of confidence by
recording a number from zero to 100 using the scale given below”. Participants could rate their
confident by selecting a number starting from zero "Cannot do at all" to 100 “Highly certain can
do". Students were asked the same question at the end of the semester.
The initial ratings of the measure indicated that all items adequately reflect and assess the
topics covered in this experiment and the scores averaged across the 3 items. Mean for the total
sample M = 86.00, SD = 9.30, range = 7.38. The investigators calculated the inter-rater reliability
of the measure by intra-class correlation coefficients to evaluate the consistency of the ratings.
The reliability for the measure Cronbach’s alpha (an estimated of internal consistency) was .90.
Furthermore, the investigators used this measure of self-efficacy assessments in other classes
related to teaching preservice teachers (face and construct validity). Finally, the investigators
examined the measure’s scale results and scale results of other concepts in the courses such as
computer- assisted instruction, virtual classroom and course management system, and found that
the results of this measure significantly correlated with the results in other concepts and
Cronbach’s alpha was .92 (criterion-related validity).

For students at Ankara University, the instrumentation used was an open-ended
questionnaire to solicit about students’ experience during the cultural activities.
Procedure
Students at Arkansas Tech University completed at the beginning of the semester a
demographic and self-efficacy surveys related to their abilities to communicate, design activities
and to identify the needs of diverse learners. Second, the instructor used the project-based
method to teach 10 topics in 10 consecutive weeks. At the end of the semester, students
completed again self-efficacy survey.
Students at Ankara University attended the cultural and folk dance activities 6 hours a
week for 6 weeks. At the end of the semester, students completed an open-ended questionnaire to
reflect on their academic, social and cultural experiences during the cultural activities.
Results
Prior to the main analyses, the data was screened for normality, out-of-range responses
and systematic patterns of missing values. The investigators found that the data is normally
distributed with no apparent patterns or clusters emerging. The three questions included in this
analysis include: Students’ ability to communicate with diverse learners, the ability to design
activities for diverse learners and the ability to identify the needs of diverse learners.
Quantitative Analyses
First question. Does project-based learning strategy improve preservice teachers’ self-
efficacy to apply cultural competence in their future classrooms?
To answer the first question, investigators conducted paired samples t-test to compare students’
mean of self-efficacy to apply cultural competence before and after engaging in project-based
method. Results showed that mean of students’ self-efficacy to apply cultural competence in
their future classrooms after the project-based teaching (M = 247.68, SD = 43.46) was
statistically higher compared to their self-efficacy level before engaging in the PBL activities (M
= 172.46, SD = 73.55) at the .001 level of significance (t = 8.08, df = 68, n = 69, p < .001, 95%
CI for mean difference= 75.22, SD= 77.36. On average, students’ self-efficacy difference was
about 27.681 points more after project-based teaching method. As displayed in Table 2, there are
statistically significant differences, at the .001 significance level. Tables 1 and 2 summarize
results from paired-samples t-tests performed for the same groups of participants.
Table 1
Descriptive statistics for students’ self-efficacy to apply cultural competence based on PBL activities
Mean N Std. Deviation Std. Error Mean
Self-efficacy to apply cultural competence After 247.68 69 43.46 5.23
Self-efficacy to apply cultural competence Before 172.46 69 73.55 8.85
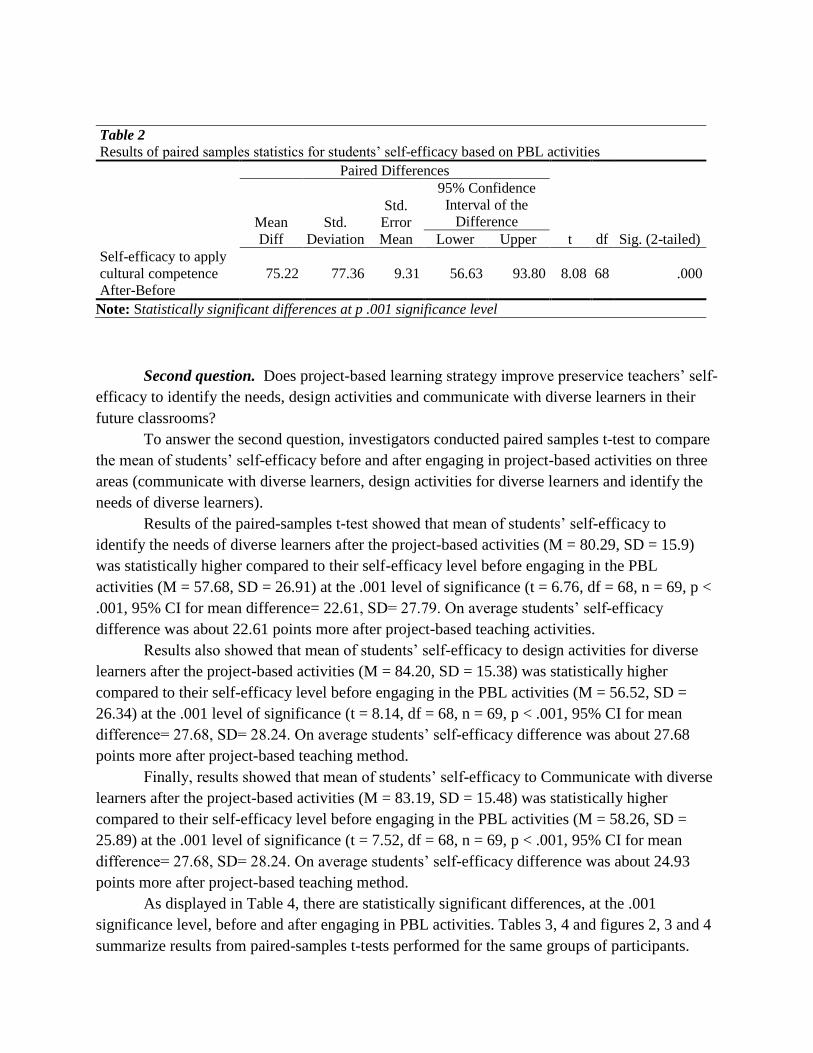
Table 2
Results of paired samples statistics for students’ self-efficacy based on PBL activities
Paired Differences
t df Sig. (2-tailed)
Mean
Diff
Std.
Deviation
Std.
Error
Mean
95% Confidence
Interval of the
Difference
Lower Upper
Self-efficacy to apply
cultural competence
After-Before
75.22 77.36 9.31 56.63 93.80 8.08 68 .000
Note: Statistically significant differences at p .001 significance level
Second question. Does project-based learning strategy improve preservice teachers’ self-
efficacy to identify the needs, design activities and communicate with diverse learners in their
future classrooms?
To answer the second question, investigators conducted paired samples t-test to compare
the mean of students’ self-efficacy before and after engaging in project-based activities on three
areas (communicate with diverse learners, design activities for diverse learners and identify the
needs of diverse learners).
Results of the paired-samples t-test showed that mean of students’ self-efficacy to
identify the needs of diverse learners after the project-based activities (M = 80.29, SD = 15.9)
was statistically higher compared to their self-efficacy level before engaging in the PBL
activities (M = 57.68, SD = 26.91) at the .001 level of significance (t = 6.76, df = 68, n = 69, p <
.001, 95% CI for mean difference= 22.61, SD= 27.79. On average students’ self-efficacy
difference was about 22.61 points more after project-based teaching activities.
Results also showed that mean of students’ self-efficacy to design activities for diverse
learners after the project-based activities (M = 84.20, SD = 15.38) was statistically higher
compared to their self-efficacy level before engaging in the PBL activities (M = 56.52, SD =
26.34) at the .001 level of significance (t = 8.14, df = 68, n = 69, p < .001, 95% CI for mean
difference= 27.68, SD= 28.24. On average students’ self-efficacy difference was about 27.68
points more after project-based teaching method.
Finally, results showed that mean of students’ self-efficacy to Communicate with diverse
learners after the project-based activities (M = 83.19, SD = 15.48) was statistically higher
compared to their self-efficacy level before engaging in the PBL activities (M = 58.26, SD =
25.89) at the .001 level of significance (t = 7.52, df = 68, n = 69, p < .001, 95% CI for mean
difference= 27.68, SD= 28.24. On average students’ self-efficacy difference was about 24.93
points more after project-based teaching method.
As displayed in Table 4, there are statistically significant differences, at the .001
significance level, before and after engaging in PBL activities. Tables 3, 4 and figures 2, 3 and 4
summarize results from paired-samples t-tests performed for the same groups of participants.
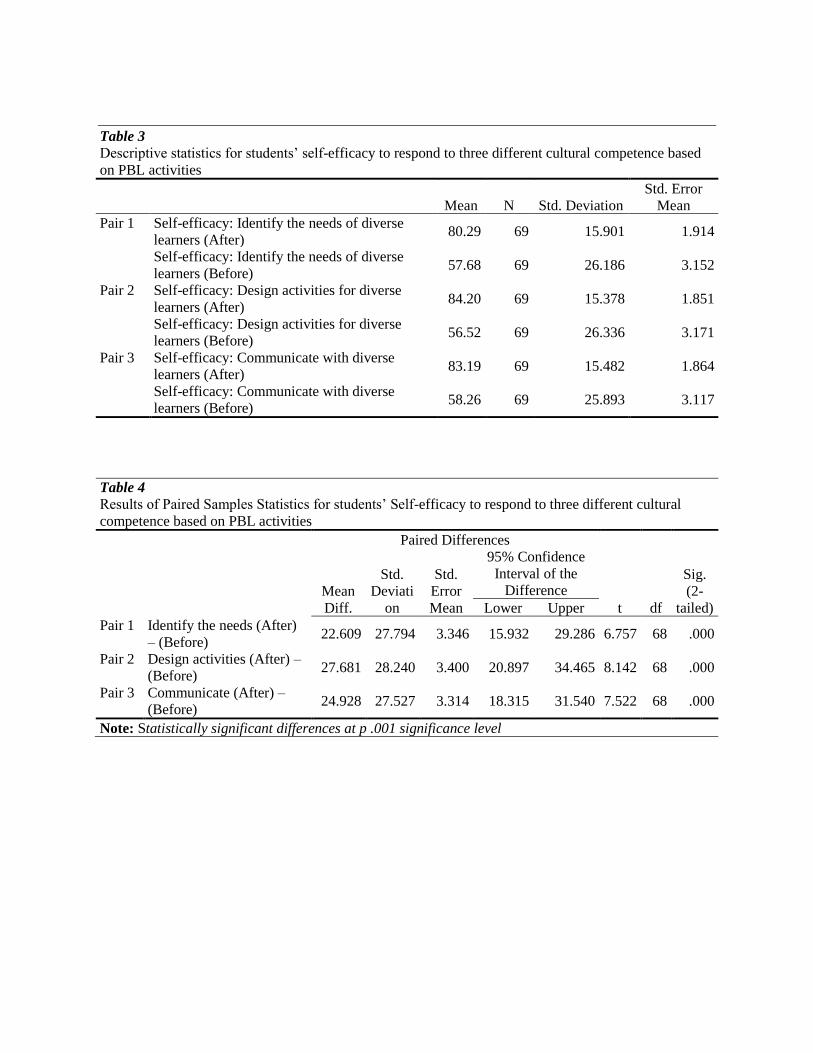
Table 3
Descriptive statistics for students’ self-efficacy to respond to three different cultural competence based
on PBL activities
Mean N Std. Deviation
Std. Error
Mean
Pair 1 Self-efficacy: Identify the needs of diverse
learners (After) 80.29 69 15.901 1.914
Self-efficacy: Identify the needs of diverse
learners (Before) 57.68 69 26.186 3.152
Pair 2 Self-efficacy: Design activities for diverse
learners (After) 84.20 69 15.378 1.851
Self-efficacy: Design activities for diverse
learners (Before) 56.52 69 26.336 3.171
Pair 3 Self-efficacy: Communicate with diverse
learners (After) 83.19 69 15.482 1.864
Self-efficacy: Communicate with diverse
learners (Before) 58.26 69 25.893 3.117
Table 4
Results of Paired Samples Statistics for students’ Self-efficacy to respond to three different cultural
competence based on PBL activities
Paired Differences
t df
Sig.
(2-
tailed)
Mean
Diff.
Std.
Deviati
on
Std.
Error
Mean
95% Confidence
Interval of the
Difference
Lower Upper
Pair 1 Identify the needs (After)
– (Before) 22.609 27.794 3.346 15.932 29.286 6.757 68 .000
Pair 2 Design activities (After) –
(Before) 27.681 28.240 3.400 20.897 34.465 8.142 68 .000
Pair 3 Communicate (After) –
(Before) 24.928 27.527 3.314 18.315 31.540 7.522 68 .000
Note: Statistically significant differences at p .001 significance level

Figure 2. Students’ ability to identify the needs of
diverse learners (before and after)
Figure 3. Students’ ability to design activities for
diverse learners (before and after)
Figure 4. Students’ ability to communicate with diverse
learners (before and after)
Qualitative Results
Narrative descriptions were developed from open-ended questionnaire data and then
coded using an open and axial coding system to identify codes, categories, themes, organized
patterns and subcategories ground within participants' collected data. Further, the research
questions served as a guide in the search for common themes and patterns and to utilize
pathways, connections and interpretations of the information (Coffey & Atkinson, 1996). The
literature was also analyzed to compile a comparative source of information depicting evidence
of practice. Although, the findings were varied, the investigators found several overarching
themes.

One common theme that emerged from the students’ responses indicated that cultural
activities and particularly folk dance were effective activity in improving their friendship with
students from different cultures and contributed to enhance the social cohesion of the university.
Most participants (32) mentioned that cultural activities helped them to make new friends from
different cultural background in addition to building stronger friendship ties (16 students). Only
4 students stated that the cultural activities did not affect their relationship with others. Most of
the participants (44) stated that taking a role in the folk-dance groups enhanced their sense of
connection with other cultures. Before participating in folk-dance activities, students stated that
their circle of friends were only limited to their narrow group, but through participation in the
dance activities, their friendship circle was extended. Most of the participants (43) stated that
their participation in folk dance activities made them more comfortable, active and positive about
other cultures. Other students stated that after participating to folk dance activities they were able
to spend more time with new friends and learn from each other.
Another common theme appeared from students’ responses indicated that there was an
overall positive influence of folk dance activities on the preservice teachers’ cultural knowledge.
For example, a significant number of the students (38) indicated that their participation in folk
dance activities positively affected their knowledge about other Turkish cultural practices and
removed their bias toward them. Regarding the effect of the cultural activities on students’
cultural competence, most students (42) stated that joining folk dance events contributed to
improvement in their empathy, respect to other cultures, and improved cultural knowledge about
different Turkish regions that they never knew about before. Students stated that in addition to
learn to dance, they learned about the history and practices of various Turkish regions, which
will help them to teach about these practices when they become teachers in the future.
The final common theme emerged from students’ responses was the positive impact of
the cultural activities on them to become culturally responsive teachers. For example, majority of
students revealed that the activities helped them to recognize and embrace the culture differences
and therefore helped them to develop learning activities to accommodate different cultures and
needs. Additionally, majority of students (36) mentioned that these activities provided an
opportunity to understand their own identities as well others, resulting on richer perspective
about their worldviews and cultural inclusiveness. Majority of the participants (45) stated that
they could implement similar cultural activities in their own classrooms to teach their future
students’ different cultural perspectives. Figure 5 shows preservice teachers performing the folk-
dance activities in Ankara University.

Figure 5. Four different photos of preservice teachers performing the folk-dance activities as part of
learning cultural competence in Ankara University.
Discussion and Conclusion
This study presents the results of two different approaches used at Arkansas Tech
University (USA) and Ankara University (Turkey) to teach cultural competence to preservice
teachers. While preservice teachers at Arkansas Tech University engaged in project-based
teaching strategy to learn about cultural competence, preservice teachers at Ankara University
engaged in cultural activities and folk dance to learn about different cultures.
The main finding of this study is that the use of the PBL strategy does improve preservice
teachers’ self-efficacy to identify the needs, design activities and communicate with diverse
learners in their future classrooms. This improvement was demonstrated by the statistically
significant differences in students’ self-efficacy scores across all questions after engaged in PBL
activities. A possible interpretation of this research finding is grounded in Bandura’s Social
Cognitive Theory (1997) that the improvement in students’ self-efficacy depends on the one’s
capabilities to organize and execute the courses of action required to produce a given task. These
beliefs affect the way people make choices, the efforts they put into completing tasks, their will
and resolve when difficulties arise, and their skills to cope with difficult situations.
Consequently, students who engaged in the PBL were more curious to learn about diverse people
and their needs and promote students’ cognitive engagement and help them to interact more

efficiently with each other. Additionally, when students engage in active learning and taking an
active role in collaborative projects, they model and imitate the new skills leading to better
mastering the new cultural competence. This interpretation is consistent with prior research
regarding the effectiveness of the PBL strategy on student learning due to the additional
opportunities for students to model what they learn and collaborate with peers leading to deep
learning (Demetry, 2010; Strayer, 2007).
In Ankara University (Turkey), the results of present study revealed that cultural
activities and folk dance contributed to improvement of preservice teachers’ cultural knowledge.
Furthermore, these activities helped students to work closer with other students to learn about
different cultures, communicate with their peers during the culture activities and learn together
about diverse people, costumes and traditions. This interpretation is consistent with students’
questionnaire reflections that folk dance activities have contributed to their social and
intercultural development. This finding is also consistent with other research that indicated that
peer interaction and collaboration is one of the most important factors for positive intercultural
experience for teacher candidates (Terenzini, Lorang and Pascarella, 1981; Tinto, 1975, 1997,
Karahan et al. 2005). Furthermore, Özdinç (2005) attested that preservice teachers who
participate in socio-cultural activities showed improvement in their communication skills,
tolerance to others and embracing differences. Similarly, Gökmenoğlu and Kiraz (2011) argued
that it is important to provide preservice teachers with a platform to explore authentic cultural
experiences and to encourage them to participate in social activities to help them improve their
cultural literacy and learn about the world they live in.
References
Adler, N. J., & Gundersen, A. (2007). International dimensions of organizational behavior.
Cengage Learning.
Aypay, A., Aypay, A. ve Demirhan, G. (2009). Öğrencilerin üniversiteye sosyal uyumu. Bir
üniversite örneği. (Social Adaptation of Freshmen into University life: a case study).
Uşak Üniversitesi Sosyal Bilimler Dergisi (1), 46-64
Bandura, A (1986). Social foundations of thought and action: A social cognitive theory.
Englewood Cliffs, NJ: Prentice Hall, 1986.
Bandura, A. (1994). “Self-efficacy”, In V. S. Ramachaudran (Ed.), Encyclopedia of human
behavior, Vol. 4, Academic Press, New York, 77-81.
Bandura, A. (1997). Self-efficacy: The Exercise of Control, W. H. Freeman and Company, New
York,
Banks, J. A. (1984) Teaching strategies for ethnic studies. Allyn & Bacon, Boston
Banks, J. A. (1994) Multiethnic education: Theory and practice. Allyn & Bacon, Needham
Heights, MA
Bennett, M. J. Paige, M. (ed) (1993) Towards ethno-relativism: A developmental model of
intercultural sensitivity. Education for the intercultural experience pp. 21-72.
Intercultural Press, Yarmouth, ME
Brown, M. R. (2007). Educating all students: Creating culturally responsive teachers,
classrooms, and schools. Intervention in school and clinic, 43(1), 57-62.
Coffey, A., & Atkinson, P. (1996). Making sense of qualitative data: complementary research
strategies: Sage Publications, Inc.
Diller, J. V., & Moule, J. (2005). Cultural competence: A primer for educators.
Thomson/Wadsworth.
Demetry, C. (2010). Work in Progress - An Innovation Merging "Classroom Flip" and Team-
Based Learning. Paper presented at the 40th ASEE/IEEE Frontiers in Education
Conference, Washington, DC.
Doğan, İ. (2008). Öğretmen adaylarınin rekreasyonel bir faaliyet olarak halk oyunlarına katılım
nedenleri. Yayınlanmamış Yüksek Lisans Tezi (The participation aims of prospective
teachers into recreational activities: Unpublished Master Thesis), Gazi Üniversitesi
Eğitim Bilimleri Enstitüsü Beden Eğitimi ve Spor Öğretmenliği Anabilim Dalı
Erdoğan, S., Şanlı, H. S. ve Şimşek-Bekir, H. (2005). Gazi üniversitesi, eğitim fakültesi
öğrencilerinin üniversite yaşamına uyum durumları. (Adaptation level of prospective
teachers into university life: Case of University of Gazi). Kastamonu Eğitim Dergisi, 13
(2), 479-496
Gay, G. (2010). Culturally responsive teaching: Theory, research, and practice. Teachers
College Press.
Gillette, M., & Boyle-Baise, M. (1996). Multicultural education at the graduate level: Assisting
teachers in gaining multicultural understandings. Theory & Research in Social
Education, 24(3), 273-293.
Gökmenoğlu, T. ve Kiraz, E. (2011). Öğretmen adaylarının üniversitelerde sunulan sosyal ve
akademik olanakları değerlendirme durumları: ODTÜ örneği. (Evaluation of university
students on social and academic environments at universities: Middle East Technical
University Case). Türk Eğitim Bilimleri Dergisi, 9(2), 393-410.
Güzeloğulları, N. ve Ertural, M. S. (2006, Nisan). Ortak kültürel değerlerin oluşumunda ve
yaşatılmasında Türk halk oyunlarının işlevleri”. (The function of Turkish Folkdances for
creating cultural commonalities among university students). Uluslararası TürkDünyası
Kültür Kurultayı, 9–15 Nisan 2006, Ege Üniversitesi, İzmir/TÜRKİYE.
He, Y., & Cooper, J. E. (2009). The ABCs for pre‐service teacher cultural competency
development. Teaching Education, 20(3), 305-322.
Helms, J. E. (1984) Toward a theoretical explanation of the effects of race on counseling: A
Black and White model. Counseling Psychologist 12, pp. 153-165.
Karahan, T. F., Sardoğan, M. E., Özkamalı, E. ve Dicle, A. N. (2005). Üniversite l. Sınıf
öğrencilerinin üniversiteye uyum düzeylerinin sosyo-kültürel etkinlikler açısından
incelenmesi. (An Examination of the adaptation levels of freshmen into university life in
terms of social and cultural activities). Çukurova Üniversitesi Eğitim Fakültesi Dergisi,
30(2), 63-72.
Kirmayer, L. J. (2012). Rethinking cultural competence.
Kuru, N., Bülbül, T. ve Saka, M. (2001). An investigation of the relationship between the
students’ communication gap attending to the facilities of education and their
participation in social activities. National Conference with International Participation.
“Anthropology- Pedagogy- Ergonomics. Shumen University, 7-8 June 2001, Varna-
Bulgaria.
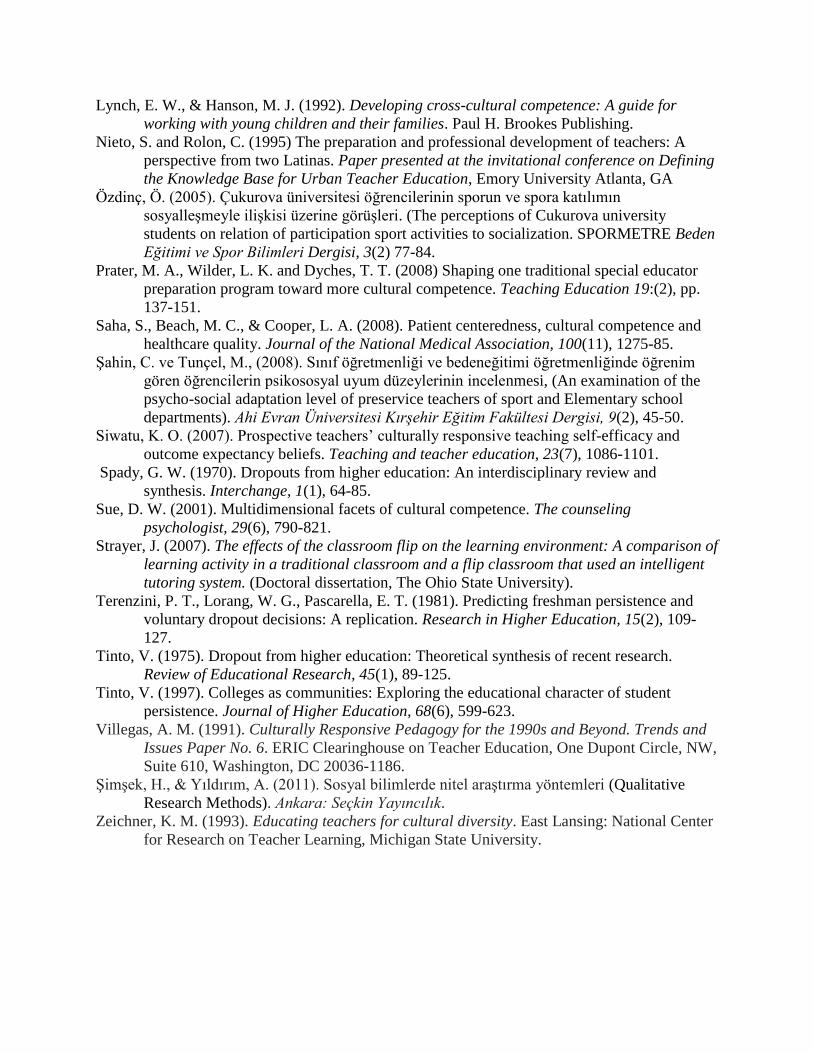
Lynch, E. W., & Hanson, M. J. (1992). Developing cross-cultural competence: A guide for
working with young children and their families. Paul H. Brookes Publishing.
Nieto, S. and Rolon, C. (1995) The preparation and professional development of teachers: A
perspective from two Latinas. Paper presented at the invitational conference on Defining
the Knowledge Base for Urban Teacher Education, Emory University Atlanta, GA
Özdinç, Ö. (2005). Çukurova üniversitesi öğrencilerinin sporun ve spora katılımın
sosyalleşmeyle ilişkisi üzerine görüşleri. (The perceptions of Cukurova university
students on relation of participation sport activities to socialization. SPORMETRE Beden
Eğitimi ve Spor Bilimleri Dergisi, 3(2) 77-84.
Prater, M. A., Wilder, L. K. and Dyches, T. T. (2008) Shaping one traditional special educator
preparation program toward more cultural competence. Teaching Education 19:(2), pp.
137-151.
Saha, S., Beach, M. C., & Cooper, L. A. (2008). Patient centeredness, cultural competence and
healthcare quality. Journal of the National Medical Association, 100(11), 1275-85.
Şahin, C. ve Tunçel, M., (2008). Sınıf öğretmenliği ve bedeneğitimi öğretmenliğinde öğrenim
gören öğrencilerin psikososyal uyum düzeylerinin incelenmesi, (An examination of the
psycho-social adaptation level of preservice teachers of sport and Elementary school
departments). Ahi Evran Üniversitesi Kırşehir Eğitim Fakültesi Dergisi, 9(2), 45-50.
Siwatu, K. O. (2007). Prospective teachers’ culturally responsive teaching self-efficacy and
outcome expectancy beliefs. Teaching and teacher education, 23(7), 1086-1101.
Spady, G. W. (1970). Dropouts from higher education: An interdisciplinary review and
synthesis. Interchange, 1(1), 64-85.
Sue, D. W. (2001). Multidimensional facets of cultural competence. The counseling
psychologist, 29(6), 790-821.
Strayer, J. (2007). The effects of the classroom flip on the learning environment: A comparison of
learning activity in a traditional classroom and a flip classroom that used an intelligent
tutoring system. (Doctoral dissertation, The Ohio State University).
Terenzini, P. T., Lorang, W. G., Pascarella, E. T. (1981). Predicting freshman persistence and
voluntary dropout decisions: A replication. Research in Higher Education, 15(2), 109-
127.
Tinto, V. (1975). Dropout from higher education: Theoretical synthesis of recent research.
Review of Educational Research, 45(1), 89-125.
Tinto, V. (1997). Colleges as communities: Exploring the educational character of student
persistence. Journal of Higher Education, 68(6), 599-623.
Villegas, A. M. (1991). Culturally Responsive Pedagogy for the 1990s and Beyond. Trends and
Issues Paper No. 6. ERIC Clearinghouse on Teacher Education, One Dupont Circle, NW,
Suite 610, Washington, DC 20036-1186. Şimşek, H., & Yıldırım, A. (2011). Sosyal bilimlerde nitel araştırma yöntemleri (Qualitative
Research Methods). Ankara: Seçkin Yayıncılık. Zeichner, K. M. (1993). Educating teachers for cultural diversity. East Lansing: National Center
for Research on Teacher Learning, Michigan State University.

A Case Study on the Differences in Scores of Undergraduate Students in
Traditional, Online, and Hybrid Classes
Patricia Ruth Kuhn, University of Arkansas
Dr. Betsy Orr, University of Arkansas
Abstract
The purpose of this research was to ascertain whether there were variances in academic
performance between students taking an educational technology course in traditional, online, and
hybrid learning environments. As a secondary goal, the researcher assessed the differences in
academic performance of male and female students. All students in this study held an
undergraduate status of junior or above. They had earned a minimum of 45 hours and a
minimum 2.75 overall GPA. The students were given identical instructions and rubrics for a
WebQuest project. The results were analyzed through quantitative investigation of the students’
scores for their individual projects. The WebQuest scores of 1,052 students were collected over
14 semesters (fall 2009 through spring 2016).
Introduction
The rapid growth in online education makes it vital to understand if there are differences
in learning outcomes according to delivery mode. Since 2012 distance growth has continued its
steady increase, while traditional class enrollment has decreased. The Babson Survey Research
Group reported that online classes grew “by 5.6% from Fall 2015 to Fall 2016.” (Seaman, Allen,
and Seaman, 2018, p 3). Many studies have been conducted evaluating the final course grade of
traditional students against that of online learners. Research on students’ traditional classroom
outcomes versus online class outcomes has generated unpredictable results. Some studies have
assessed the equivalent exam performance of traditional classroom students versus online
learning students and found no significant difference (Elvers, Polzella, & Graetz, 2003;
Hemmati, Omrani, & Hemmati, 2013; Hollister & Berenson, 2009; Jensen, 2011; McGready &
Brookmeyer, 2013; Stowell & Bennett, 2010; Summers, Waigandt, & Whittaker, 2005). This
research study looks at performance results in one project of a single educational technology
course. The study covers performance results in three types of classes (traditional, online, and
hybrid) of the students of two different instructors.
Mosalanejad, Shahsavari, Sobhanian, and Dastpak (2012) discovered that even though
there is no difference in practical test scores, nursing students’ online-course scores surpass their
traditional-course scores in an abstract examination. The researchers suggest that tests entailing
memorization may be simpler online, possibly because of the students’ ability to look up the
appropriate answers. Scores on tests with abstract questions do not differ between the two types
of learning modes. An analysis conducted at Georgia Gwinnet College (Kakish, Pollacia, &
Heinz, 2012) found:
No substantial difference between academic results between student performance in a
traditional classroom and students in a hybrid class. Based on the results of their findings,
they discovered that there was no significant difference between the performances of the
two groups, with a 95% level of confidence. The data showed that students in the

traditional sections perform slightly better than their counterparts in the hybrid sections,
but the differences are not statistically significant. (p. 11)
As the use of the Internet for online and hybrid courses grows, higher education programs are
struggling with their response to growing directives for accountability. The federal government
wants accrediting organizations to supply evidence that students attain the expressed knowledge
objectives (Suskie, 2004). Consequently, these powerful demands force instructors to record
learning success, in addition to trying to continuously improve the learning results.
The growth of online and hybrid classes and of instructors’ accountability requirements
compounds the issue of providing quantitative proof of the success of online learning as
compared to traditional classroom learning. This study investigates the academic results of
traditional classroom learning weighed against that of online and hybrid learning. It focuses on
the academic performances of students in traditional, online, and hybrid classes of two
instructors, in a course in educational technology in a teacher education program. All results
were derived using the same grading rubric for one specific technology project (WebQuest). The
two instructors worked together to design the rubric and used identical instructional resources.
This paper reviews the learning environment literature and investigates past studies on the
effectiveness of traditional classroom learning as compared to online and hybrid learning. It then
explains the research setting and the methodology. In conclusion, the results are presented and
discussed to deduce critical concerns, lessons learned, and directions for research in the future.
Statement of the Purpose
The main purpose of this study is to ascertain whether there are any differences in
academic performance between traditional, online, and hybrid-learning students who take the
same educational technology course. As a secondary goal, the study assesses the differences in
academic performance of male and female students in the same classes. The population sample
of this research constituted upper-class undergraduate students admitted to the Teacher
Education program, who chose to attend either a traditional, an online, or a hybrid class.
This research study compares traditional, online, and hybrid instructional modes of
delivery of curricula by examining student performance on one specific WebQuest project. A
similar study was conducted by Neuhauser (2002), who evaluated just two sections of the same
course. Neuhauser analyzed the students’ final grades from a traditional course and an online
course. The same instructor taught the two sections using identical instructional resources. On
comparing the final grades from the two sections, Neuhauser found no meaningful distinction,
with the online students averaging only marginally higher. In comparison, this research will
compare the final WebQuest project grades of 1,052 students in 48 sections of the same course
taught in traditional, online, and hybrid classes by two different instructors using the same
project, instructional materials, and grading rubric for assessment.
This quantitative, causal-comparative (ex post facto) study explores pre-existing
differences in groups of individuals, where both the effect and the declared reason have occurred
previously, and the study is in retrospect. The outcome dimensions measure the included
students’ final grade scores on one identical project required for an undergraduate educational
technology class, with an identical rubric and the same two instructors grading all of the
students’ WebQuest projects in all three learning modes.

Review of Related Literature
Comparative research on the effect on student performance of traditional, online, and
hybrid modes of learning has produced varied results. Some studies have returned positive or
negative results, while others found little significant difference. The review focuses on research
published between 1995 and 2016. Database sources, including ERIC and Academic Search
Premier, provided sites for information retrieval, while Google Scholar offered the necessary
interface to search the Internet for sites containing original texts. The review closely focused on
92 studies that compared traditional learning to online and hybrid learning.
Background
Access to higher education can be achieved in various ways. One way is to enroll in a
traditional classroom program, which involves attending classes and accessing educational
materials within the learning institution (Chen & Jones, 2007). Alternatively, students can enroll
in an online program, whereby they complete schoolwork and communicate over the Internet,
interconnected through various communication technologies. Some educational institutions may
also blend the two by offering both traditional and online coursework in a hybrid or blended
course. Arbaugh (2005) and Chen and Jones (2007) assert that most institutions of higher
learning have adopted all three systems in their learning environments.
While most of the debate relating to the efficiency of traditional, online, and hybrid education
systems revolves around student performance and satisfaction, other issues of concern to
researchers relate to technical expertise, at both a personal and an institutional level. Personal
technical issues include skill level and attitude of the student towards the educational system.
Institutional issues relate to infrastructural development. A third area of discussion about the
differences between traditional, online, and hybrid educational systems relates to flexibility,
communication, interaction, learning, and skills development (Wills & Stommel, 2002).
Introduction to Traditional, Online, and Hybrid Learning
Traditional learning
Since the beginning of public education, traditional classroom learning has been the basic
model. In this model, a typical university classroom environment involves a professor giving a
lecture to students, who listen and take notes on the information offered by the lecturer. The
crucial element of this mode as compared to online learning is that it provides a platform for
interaction between the lecturer and the students. O’Malley and McCraw (1999) discovered that
technological improvements leading to the advent of technological devices, such as mobile
phones and computers, encouraged a shift in popularity from traditional classroom learning to
online learning. They add that the most important technological discovery was the computer and
the Internet. However, this shift did not mean that the traditional classroom lost its popularity in
educational circles. Numerous studies (Kearns, Shoaf, & Summey, 2004; Maki & Maki, 2002;
Maki, Maki, Patterson, & Whittaker, 2000) have found that students are more satisfied with
traditional learning compared to online learning. Most research studies that compare traditional
and online instructional modes of learning, using final grades instead of final exam scores, show
that students in the traditional classroom receive higher scores (Asby, Sadera, & McNary, 2011;
Jaggars, Edgecombe, & Stacey, 2013; Terry, 2007; Waschull, 2001).

Ashby, Sadera, and McNary (2011) report that students in traditional classes have higher final
exam results compared to those in online and hybrid classes. Waschull (2001) found a trend
toward higher final exam scores for students in traditional settings compared to those in online
classes. Terry (2007) also showed that traditional-classroom test scores are higher than online-
course scores.
There are studies, though, that have found evidence for higher final exam scores in online
and hybrid courses compared to the same courses in traditional settings (Lim, Kim, Chen, &
Ryder, 2008). Moreover, findings of no significant difference have been detailed in Russell
(1999). Research in this area has yielded every possible conclusion.
Final grades, as opposed to final test scores, have not received as much attention in
studies on academic differences in face-to-face, online, and hybrid learning. Here, the outcomes
are less conflicting: most studies provide evidence for the superiority of the traditional method,
although some investigations have found no meaningful difference in final grades between
delivery modes (Akyol & Garrison, 2010; Kirtman, 2009).
Online learning
The origins of distance education can be traced back to the nineteenth century in
continental Europe. The practice commenced with learning carried out through postal service
correspondence (Freed, 2004). Much later, with the advent of the Internet and related
technology, the same practice became web based. Online education occurs when teachers and
students are geographically and technologically separated from one another, but connect for
learning via the Internet. However, the distance between them is not defined, and need not be
large enough to inhibit traditional classroom education. Freed (2004) suggests that online
learning can occur when students and instructors inhabit the same learning institutions as well
when students are located far away. Although video conferencing is closely related to the
classroom experience, online learning has transformed learning into an anytime, anywhere
experience. Online study can reach wider audiences and provide students an opportunity to study
while still in their home or at work. It has internationalized education and addressed the barriers
associated with human diversity factors, such as social, economic, or cultural background. The
recent advancement in online learning has led several scholars to predict that the traditional
mode of prearranged face-to-face classes will vanish in due course (Arbaugh & Duray, 2002;
Hiltz, 1993; Kearns, et al., 2004; Maki & Maki, 2002).
Hall (2002) and Ponzurick, Russo, and Logar (2000) found that the enhancement of
online learning was correlated with the advent of radio and other media that make distant
communication possible. Computer-mediated learning technologies—such as video
conferencing, online and offline video instructional learning, and two-way audio and video web-
based communication—increase the possibility of success. Brown and Liedholm (2002) assert
that although online learning has existed for a long time, it has yet to be universally incorporated
into learning practices. Most of the challenges in the application of online learning relate to the
quality or clarity of instruction compared to traditional classroom learning. Other questions
associated with online learning are the relative cost of attendance, characteristics of the students,
characteristics governing the efficiency of the instructions, and performance of the students.
Studies on the efficiency issues have not provided answers to these queries (Noyes, Garland, &
Robbins, 2004; Scheines, Leinhardt, Smith, & Cho, 2005).
Although faced with seemingly insurmountable opposition and criticism due to its
reliance on expensive and complicated technology, online learning has proven to be superior in

terms of quality and student performance compared to traditional classroom teaching in some
studies (Arbaugh & Duray, 2002; Wills & Stommel, 2002). Indeed, Lim, Kim, Chen, and Ryder
(2008) discovered that students’ test scores are higher in online classes than in traditional
courses. Online learning generates the physical features of traditional education, such as lecture
halls, which enable students to participate from anywhere they have access to a computer and
eliminate the costs of commuting. In addition, from an environmental standpoint, students can
access learning materials easily from technological data storage devices, such as flash drives and
portable personal computers, instead of the hard-copy paper materials traditionally used in face-
to-face courses. Furthermore, the internet has facilitated access to virtually all forms of learning
materials and sources.
Hybrid learning
In hybrid or blended learning, students attend a traditional class part of the time and
participate in an online distance education class for the remainder. A study at Central Florida
University by EDUCAUSE Center for Applied Research found that “blended courses have the
potential to increase student learning outcomes while lowering attrition rates in comparison with
equivalent fully online classes” (Dziuban, Hartman, & Moskal, 2004, p. 5).
In 2011, researchers monitored 605 college students taking the same statistics course at
six different public universities. One group took the course in a traditional classroom, while the
other students took it in a hybrid format. The students were pre- and post-tested. The hybrid
group performed marginally better, but this result was not statistically significant (Bowen,
Chingos, Lack, & Nygren, 2012).
In another study involving a medical terminology course, the researchers compared
traditional and hybrid courses using quantitative methods to determine student opinions and
whether the two modes of course delivery met the course objective. Satisfaction was
significantly stronger for students in the hybrid courses (Martin, Kreiger, & Apicerno, 2015).
Gangone (2015) discusses the results of converting a traditional class to a hybrid format,
comparing the hybrid students’ performance results in a quiz to the two-remaining traditional-
class students’ performance results in the same quiz. Students in the hybrid section in most cases
performed better than students in the traditional classes. Finally, a meta-analysis conducted by
SRI International for the U.S. Department of Education in 2010 examined studies of hybrid
learning from 1996 through 2006 and found that students in blended learning classes
outperformed those in fully online or fully in-person classes (Means, Toyama, Murphy, Bakia, &
Jones, 2010).
Research Design and Questions
Research design
This quantitative, causal-comparative design sought to determine the relationship
between students’ scores on one content-specific education project, a WebQuest. The study
covered seven years of traditional, online, and hybrid technology in education classes, taught by
two instructors at a regional university in the southwest United States. The independent variable
was the individual students’ score on the WebQuest project administered during semester, in a
traditional, online, or hybrid class. The dependent variable was the dichotomous outcomes.
Fourteen consecutive semesters from fall 2009 to spring 2016 of students’ WebQuest scores
provided the data for analysis. The students’ scores were obtained from the two instructors, who

each taught four classes each semester. The scores used came from eight of each type of class
(traditional, online, and hybrid) from the two instructors.
Research Questions
The research questions guiding the inquiry are:
1. Is there a significant difference in academic outcomes among undergraduate
baccalaureate students engaged in traditional, online, and hybrid instruction?
2. Is there a significant difference in academic performance between genders in
traditional, online, and hybrid instruction?
Methodology
The sample for this research project comprised upper-class undergraduate students
enrolled in a required course in educational technology for a teacher education program. The
students enrolled in the one-semester class, in traditional, online, or hybrid format. The same two
instructors taught all three types of classes, using the same rubric to evaluate the same WebQuest
project. The study compared the performance-related scores of each student on the assigned
WebQuest project. Existing data on the scores of the project and on gender were collected from
the academic records of both instructors.
The primary purpose of the study was to determine whether there are any differences in
academic performance between students in traditional, online, and hybrid learning environments.
As a secondary goal, it assessed the differences between male and female students in the
different education environments.
Data Analysis
Since the study was ex post facto, the researcher used archival data recorded between the
fall of 2009 and the spring of 2016. WebQuest scores of a total of 1,052 students over 14
semesters were collected. All students in this study held an undergraduate status of junior or
above and had passed the certification test for state educators. They were also accepted as
teacher candidates of the College of Education in the Teacher Education Department at their
university. The students’ scores were obtained from the two instructors who taught four of the
classes each semester in all three formats (traditional, online, and hybrid). The scores used came
from eight of each type of class from each of the two instructors.
The researcher entered the assessment data into the Statistical Package for the Social
Sciences (SPSS), version 25, for data analysis with various statistical tools. To see if there was a
significant difference between the WebQuest scores of students of the two different instructors,
an independent samples t-test (hereafter, independent t-test) was used. This test compares the
means between two unrelated groups on the same continuous dependent variable; for the
purposes of this project, it indicates whether the WebQuest scores differ based on instructor,
mode of instruction (traditional, online, or hybrid), or gender (male/female).
As there was no difference in mean academic performance between the students of the
two instructors, the researcher combined the two datasets in order to analyze the research
questions using a two-way ANOVA. The two-way ANOVA compares the mean differences
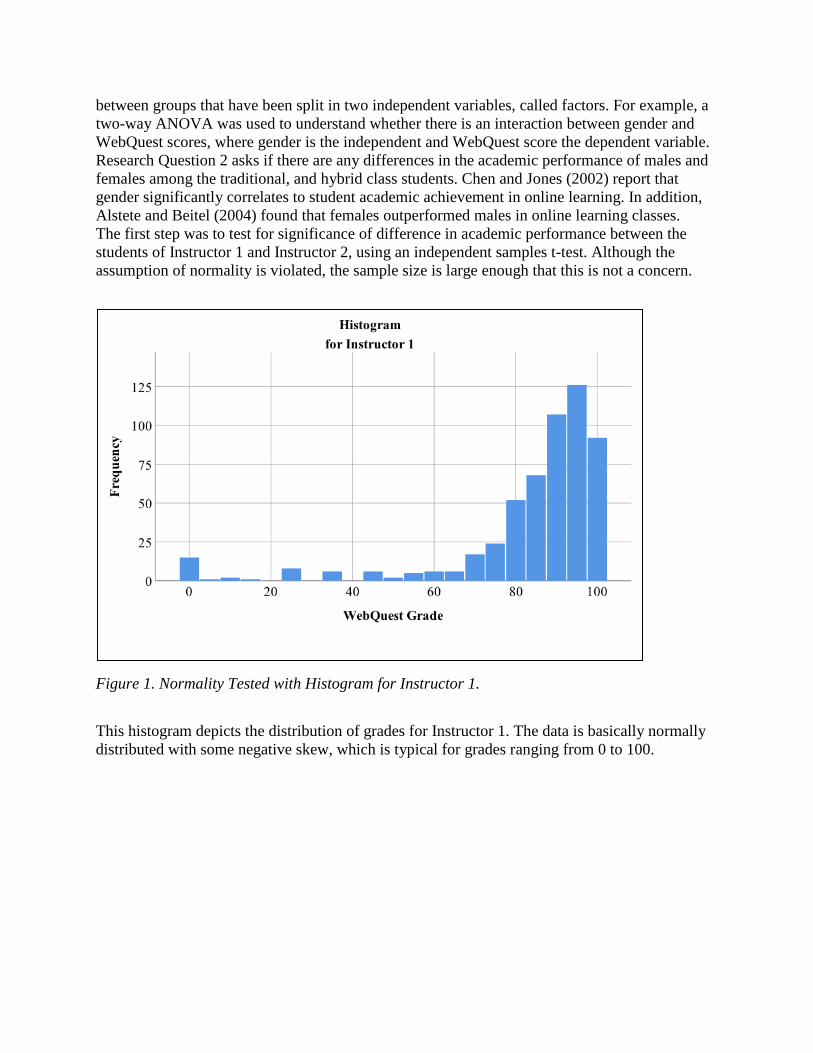
between groups that have been split in two independent variables, called factors. For example, a
two-way ANOVA was used to understand whether there is an interaction between gender and
WebQuest scores, where gender is the independent and WebQuest score the dependent variable.
Research Question 2 asks if there are any differences in the academic performance of males and
females among the traditional, and hybrid class students. Chen and Jones (2002) report that
gender significantly correlates to student academic achievement in online learning. In addition,
Alstete and Beitel (2004) found that females outperformed males in online learning classes.
The first step was to test for significance of difference in academic performance between the
students of Instructor 1 and Instructor 2, using an independent samples t-test. Although the
assumption of normality is violated, the sample size is large enough that this is not a concern.
Figure 1. Normality Tested with Histogram for Instructor 1.
This histogram depicts the distribution of grades for Instructor 1. The data is basically normally
distributed with some negative skew, which is typical for grades ranging from 0 to 100.

Figure 2. Normality Tested with Histogram for Instructor 2.
This histogram depicts the distribution of grades for Instructor 2. The data is basically normally
distributed with some negative skew, which is typical for grades ranging from 0 to 100.
Table 1. Kolmogorov-Smirnov Test for Normality
Instructor Test statistic Df p-value
Instructor 1 .22 544 <.001
Instructor 2 .28 541 <.001
This table shows that the distribution for grades by Instructor violates he assumption normality,
but the histograms show that the violation is not severe. Although the assumption of normality is
violated, the sample size is large enough that this is not a concern.
Table 2. Homogeneity of Variance: Tested with Levene’s Test
Instructor Mean Standard Deviation
Instructor 1 83.86 20.98
Instructor 2 83.14 24.26

The results of Levene’s test indicate that homogeneity of variance, is met, F (1,1083) = 1.74, p =
.19. There was no difference in mean academic performance between instructors,
t (1083) = .52, p = .60 (Table 4.2). Therefore, the researcher combined the two datasets in order
to analyze the research questions.
Analysis of Research Questions Using Two-way ANOVA
The assumptions of the two-way ANOVA are:
1. Independent observations
2. Normal distribution: tested with Kolmogorov-Smirnov test, and histogram of
residuals.
Table 3. Kolmogorov-Smirnov Test of Normality on Mode of Delivery
Mode Test statistic df p-value
Traditional .26 369 <.001
Online .24 353 <.001
Hybrid .26 363 <.001
This table shows that the distribution for grades by Instructor violates the assumption of
normality, but the histogram shows that the violation is not severe.
Table 4. Kolmogorov-Smirnov Test of Normality on Gender
Gender Test statistic df p-value
Male .27 169 <.001
Female .24 916 <.001
This table shows that the distribution for grades by gender violates the assumption of normality,
but the histogram shows that the violation is not severe.
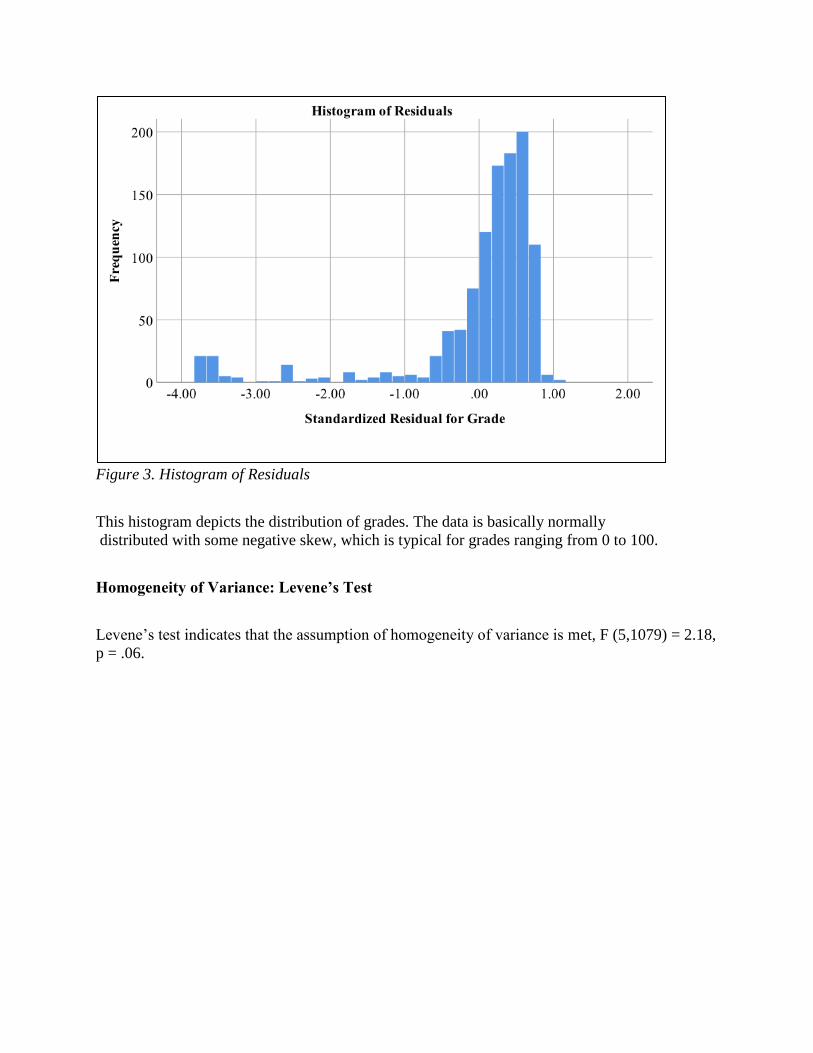
Figure 3. Histogram of Residuals
This histogram depicts the distribution of grades. The data is basically normally
distributed with some negative skew, which is typical for grades ranging from 0 to 100.
Homogeneity of Variance: Levene’s Test
Levene’s test indicates that the assumption of homogeneity of variance is met, F (5,1079) = 2.18,
p = .06.

Table 5. Results of Two-Way ANOVA
Source SS Df MS F p-value
Gender 1042.76 1 1042.76 2.03 .16
Mode 1538.64 2 769.32 1.50 .22
Mode X
Gender 502.17 2 251.08 .49 .61
Error 554237.04 1079 513.66
Total 8122013.00 1085
The results show there is no difference in academic performance by gender, F (1,1079) = 2.03, p
= .16 (Table 4.7). Additionally, there is no difference in academic performance by mode of
delivery, F (2,1079) = 1.50, p = .22 (Table 4.6). Finally, there is no interaction between gender
and academic performance, F (2,1079) = .49, p = .61.
Table 6. Difference in Academic Performance and Mode of Delivery
Mode of Delivery Mean Standard Deviation
Traditional 82.10 24.63
Online 84.65 20.64
Hybrid 83.81 22.45
Table 6 shows the mean and standard deviation of the grades by mode of delivery.
Table 7. Difference in Academic Performance and Gender
Gender Mean Standard Deviation
Male 81.46 25.39
Female 83.88 22.12

Table 7 shows the mean and standard deviation of grades by gender.
Conclusions
A two-way ANOVA was conducted to determine the effect of the three types of course
delivery—onsite traditional, online distance, and hybrid classes—on student performance. That
is, it was used to test if there was meaningful variance in the scores on the WebQuest project
according to mode of delivery or gender. No significant variance was detected, and this result
supports the continued development of online instruction programs. The findings of this study
illustrate that online learning has become an accepted alternative to traditional learning and can
be just as effective as traditional or hybrid learning. Instructors should ensure that students
receive the same curriculum for the same course whether it is an online or traditional course.
While previous studies provided evidence that online students did significantly better than
students in traditional classes (Means, et al., 2010; Shacher & Newman, 2003), it is possible that
more self-motivated students are more likely to select online classes, as was found in a study of
microeconomics classes (Gratton-Lavoie & Stanley, 2009).
Findings
This study found no difference in academic performance by mode of delivery, F (2,1079)
= 1.50, p = .22 (see Table 4.6), and no difference in academic performance by gender, F (1,1079)
= 2.03, p = .16 (see Table 4.7). It also found no interaction between gender and academic
performance, F (2,1079) = .49, p = .61.
Discussion
Research suggests that teaching and studying online can be as effective as traditional
instruction “when the method and technologies used are appropriate to the instructional tasks,
there is student-to-student interaction, and when there is timely teacher-to- student feedback”
(Moore, Thompson, Quigley, Clark, & Goff, 1990; Verduin & Clark, 1991). This study joins the
growing body of research on the success of online learning. The lack of significant difference in
results between the three modes of delivery (tradition, online, and hybrid) may indicate that all
three modes are acceptable in teaching courses to students. All of the instructors of the
educational course examined in this study worked closely together to ensure all their students
received the same content regardless of the instructor or mode of delivery they chose.
Universities and colleges need to conduct more research to verify that students in their
traditional, online, and hybrid courses are making the same progress regardless of mode of
delivery.
Suggestions for Future Research
Ultimately, research is needed on related issues outside the scope of this study. For
example, retention and graduation rates may be related to mode of delivery. Additionally,
research should take into account the methods used for teaching online and traditional classes.
In addition, online students have more opportunity to cheat. The two instructors in this study had

the opportunity to observe the progress of the traditional and hybrid students as they wrote their
WebQuest. Their online students, on the other hand, turned in their completed WebQuest with no
observation of their work by the instructors.
The students involved in the current study were above average. These findings may thus
not be generalizable to the larger population of students in traditional, online, and hybrid
education classes. Despite these issues, the findings of this study are consistent with previous
studies (Parsons-Pollard, Lacks, & Grant (2008).
Summary
The type of analysis used in this study should be carried out consistently by universities
in order to pinpoint any differences between results in traditional, online, and hybrid courses that
could signify inequalities in learning. As the number of students enrolled in online courses
grows, it is important that more research be done to determine if online education is as effective
as traditional education.
Online education has become a popular change from traditional educational classes.
However, there are still questions as to its effectiveness. In a study that compares student
learning outcomes in a microeconomics course, Brown and Liedholm (2002) found that students
in the online format performed significantly worse on tests than the students in the traditional
format even though they had better GPA and ACT scores.
References
Akyol, Z., & Garrison, D. R. (2010). The development of a community of inquiry over time in an
online course: Understanding the progression and integration of social, cognitive and
teaching presence. Journal of Asynchronous Learning Networks, 12(2–3), 3–22.
Alstete, J., & Beitel, N. (2004). Performance indicators on online distance learning courses: A
study of management education. Quality Assurance in Education, 12(1), 6–14.
Arbaugh, J. (2005). Is there an optimal design for online MBA courses? Academy of
Management Learning & Education, 4(2), 135–143.
Arbaugh, J., & Duray, R. (2002). Technological and instructural characteristics, student learning
and satisfaction with web-based courses: An exploratory study of two on-line MBA
programs. Management Learning, 33(3), 331–347.
Ashby, J., Sadera, W.A., & McNary, S.W. (2011). Comparing student success between
developmental math courses offered online, blended, and face-to-face. Journal of
Interactive Online Learning, 10(3), 128-140.
Babson Survey Research Group (2016). Distance education enrollment growth continues
[Scholarly project]. In I. E. Allen, J. Seaman, R. Poulin, & T. Taylor Straut, Online
report card: Tracking online education in the United States. Retrieved from
https://onlinelearningconsortium.org/read/online-report-card-tracking-online-education-
united-states-2015.
Brown, B., & Liedholm, C. (2002). Can web courses replace the classroom in principles of
microeconomics? American Economic Review, 92(2), 444–448.
Bowen, W., Chingos, M., Lack, K., and Nygren, T. (May 22, 2012). Interactive Learning Online
at Public Universities: Evidence from Randomized Trials. Ithaka: USA.

http://www.sr.ithaka.org/research-publications/interactive-learning-online-public-
universities-evidence-randomized-trials.
Chen, C., & Jones, K. (2007). Blended learning vs. tradition classroom settings: Assessing
effectiveness and student perceptions in an MBA accounting course. The Journal of
Educators Online, 4(1), 1–15.
Dziuban, C., Hartman, J., & Moskal, P. (2004). Blended learning. Educause Center for
Applied Research Bulletin, 2004(7), 1-12.
Elvers, G. C., Polzella, D. J., & Graetz, K. (2003). Procrastination in online courses:
Performance and attitudinal differences. Teaching of Psychology, 30, 159–162.
Freed, K. (2004). A history of distance learning. Retrieved from http://www.media-
visions.com/ed-distlrn.html
Gangone, M. (2015). A case study of the effectiveness of a hybrid course in engineering
education. Paper presented at ASEE Gulf Southwest Annual Conference, University of
Texas at San Antonio. Retrieved from
http://engineering.utsa.edu/~aseegsw2015/papers/ASEE-
GSW_2015_submission_103.pdf.
Gratton-Lavoie, C., & Stanley, D. (2009). Teaching and learning principles of microeconomics
online: An empirical assessment. Research in Economic Education, Winter, 3–25.
Hall, B. (2002). FAQs about learning. Retrieved from http://www.brandon-hall.com/
Hemmati, N., Omrani, S., & Hemmati, N. (2013). A comparison of internet-based learning and
traditional classroom lecture to learn CPR for continuing medical education. Turkish
Online Journal of Distance Education, 14(1), 256–265.
Hiltz, S. (1993). Correlates of learning in a virtual classroom. International Journal of Man-
Machine Studies, 39, 71–98.
Hollister, K. K., & Berenson, M. L. (2009). Proctored versus unproctored online exams:
Studying the impact of exam environment on student performance. Decision Sciences
Journal of Innovative Education, 7(1), 271–294.
Jaggars, S., Edgecombe, N., & Stacey, G. (2013). What we know about online course outcomes.
New York, NY: Community College Research Center, Teachers College, Columbia
University.
Jensen, S. (2011). In-class versus online video lectures: Similar learning outcomes, but a
preference for in-class. Teaching of Psychology, 38(4), 298–302.
Kakish, K. M., Pollacia, L., & Heinz, A. (2012) Analysis of the effectiveness of traditional
versus hybrid student performance for an elementary statistics course. International
Journal for Scholarship of Teaching and Learning, 6(2), 4–32.
Kearns, K. L., Shoaf, J., & Summey, M. (2004). Performance and satisfaction of second-degree
BSN students in web-based and traditional course delivery environments. Journal of
Nursing Education, 43(6), 280–284.
Kirtman, L. (2009). Online versus in-class courses: An examination of difference in learning
outcomes. Issues in Teacher Education, 19(2), 103–116.
Lim, J., Kim, M., Chen, S. S., & Ryder, C. E. (2008). An empirical investigation of student
achievement and satisfaction in different learning environments. Journal of Instructional
Psychology, 35(2), 113–119.
Maki, W., & Maki, R. (2002). Multimedia comprehension skill predicts differential outcomes of
web-based and lecture courses. Journal of Experimental Psychology: Applied, 8, 85–98.

Maki, W., Maki, R., Patterson, M., & Whittaker, P. (2000). Evaluation of a web-based
introductory psychology course: Learning and satisfaction in web-based versus lecture
courses. Behavior Research Methods, Instruments & Computers, 32, 230–239.
Martin, J. S., Kreiger, J. E., & Apicerno, A. L. (2015). Effectiveness of a hybrid classroom in the
delivery of medical terminology course content relative to a traditional classroom format.
Journal of the Scholarship of Teaching and Learning, 15(5), 72. Retrieved from
http://osotl.indiana.edu
McGready, J., & Brookmeyer, R. (2013). Evaluation of student outcomes in online vs. campus
biostatistics education in a graduate school of public health. Preventive Medicine: An
International Journal Devoted to Practice and Theory, 56(2), 142–144.
Means, B., Toyama, Y., Murphy, R., Bakia, M., & Jones, K. (2010). Evaluation of evidence-
based practices in online learning: A meta-analysis and review of online learning
studies. Washington, DC: Office of Planning, Evaluation, and Policy Development,
Center for Technology in Learning, U.S. Department of Education.
Moore, M. G., Thompson, M. M., Quigley, A. B., Clark, G. C., & Goff, G. G. (1990). The effects
of distance learning: A summary of the literature (Research Monograph No. 2).
University Park, PA: American Center for the Study of Distance Education, Pennsylvania
State University.
Mosalanejad, L., Shahsavari, S., Sobhanian, S., & Dastpak, M. (2012). The effect of virtual
versus traditional learning in achieving competency-based skills. Turkish Online Journal
of Distance Education, 13(2), 69–75.
Neuhauser, C. (2002). Learning style and effectiveness of online and face-to-face instruction.
The American Journal of Distance Education, 16(2).
Noyes, J., Garland, K., & Robbins, L. (2004). Paper-based versus computer-based assessment: Is
workload another test mode effect? British Journal of Educational Technology, 35(1),
111–113.
O’Malley, J., & McCraw, H. (1999). Students’ perceptions of distance learning, online learning
and the traditional classroom. Online Journal of Distance Education Administration,
2(4). Retrieved from http://www.westga.edu/~distance/omalley24.html
Parsons-Pollard, N., Lacks, T. R., & Grant, P. H. (2008). A comparative assessment of student
learning outcomes in large online and traditional campus-based introduction to criminal
justice courses. Criminal Justice Studies, 2, 225–239.
Ponzurick, T., Russo, K., & Logar, C. (2000). Delivering graduate marketing education: An
analysis of face-to-face versus distance education. Journal of Marketing Education,
22(3), 180–187.
Russell, T. L. (1999). No significant difference: A comparative research bibliography on
technology for distance education. Raleigh, NC: North Carolina State University.
Scheines, R., Leinhardt, G., Smith, J., & Cho, K. (2005). Replacing lecture with web-based
course materials. Journal of Educational Computing Research, 32(1), 1–25.
Seaman, J. E., Allen, I. E., & Seaman, J. (2018). Grade increase: Tracking distance education
in the United States. Wellesley: The Babson Survey Research Group.
Shachar, M. & Neumann, Y. (2003). Differences between traditional and distance education
academic performances: A meta-analytic approach. International Review of Research in
Open and Distance Learning. 4(2), 1-20.
Stowell, J. R., & Bennett, D. (2010). Effects of online testing on student exam performance and
test anxiety. Journal of Educational Computing Research, 42(2), 161–171.

Summers, J., Waigandt, A., & Whittaker, T. (2005). A comparison of student achievement and
satisfaction in an online versus a traditional face-to-face statistics class. Innovative
Higher Education, 29(3), 233–250.
Suskie, L. (2004). Assessing student learning: A common sense guide. Bolton, MA: Anker.
Terry, N. (2007). Assessing instruction modes for Master of Business Administration (MBA)
courses. Journal of Education for Business, 82(4), 220–225.
Verduin, J. R. & Clark, T. A. (1991). Distance education: The foundations of effective practice.
San Francisco, CA: Jossey-Bass Publishers.
Waschull, S. (2001). The online delivery of psychology courses: Attribution, performance, and
evaluation. Teaching of Psychology, 28, 143–147.
Wills, C., & Stommel, M. (2002). Graduate students’ precourse and postcourse perceptions and
preferences concerning completely web-based courses. Journal of Nursing Education,
41(5), 193–201.
Mathematics Teaching: Constructivist and Non-Constructivist Beliefs of Preservice
Teachers
Dr. Julie J. Williams-Mills, Henderson State University
Dr. Julie Quast, Henderson State University
Dr. Melanie Fields, Texas A&M University-Commerce
Abstract
This qualitative study explored the beliefs preservice teachers (PSTs) held about mathematics
instruction prior to completing their mathematics methods course. Open-ended survey questions
were given to examine PSTs’ beliefs about mathematics teaching. The survey was administered
to elementary and middle-level education majors during the first week of their undergraduate
mathematics methods course. Specifically, we examined how their existing beliefs about
mathematics instruction related to the four tenets of constructivism. Participants exhibited
constructivist beliefs about teaching mathematics, but also expressed some traditional beliefs of
mathematics instruction.
Introduction
Historically, mathematics teaching has reflected a direct instruction approach. Many
adults may remember mathematics as the teacher solving problems on the board and then the
students practicing similar problems. However, the National Council of Teachers of Mathematics
(NCTM, 2014) emphasizes the necessity of students developing conceptual understanding prior
to procedural fluency. Although this has been the position of the NCTM for multiple decades,
not all mathematics instruction reflects this idea. In order to better prepare preservice teachers to
emphasize conceptual understanding in mathematics instruction, we explored the beliefs held by
preservice teachers regarding teaching and learning. Specifically, we examined how their
existing beliefs about mathematics instruction related to the tenets of constructivism. The
following question guided this study:
What are elementary and middle-level preservice teachers’ beliefs about mathematics
teaching and learning?
Theoretical Perspective
According to the NCTM (2000), mathematics instruction should prepare K-12 students
for life and the workplace. To do this, the NCTM emphasizes the importance of learning
mathematics with understanding using a constructivist approach, and therefore constructivism
served as the theoretical framework for this study. Constructivism is based on the idea that
learning occurs when people are active, experimenting, and doing, and in this process, they are
constructing knowledge (Piaget, 1954; Vygotsky, 1978). The constructivist viewpoint is
somewhat broad, including perspectives from Dewey, Piaget, Vygotsky, and Bruner, as well as
many contemporary theorists.
Due to the multiple perspectives of this theory, Loyens, Rickers, and Schmidt (2007)
identified four major assumptions that embrace the umbrella term constructivism. The first of
these assumptions is learners construct new knowledge based on their personal experiences and

prior knowledge. Students modify and expand existing schemas (pieces of knowledge) when
they interact or learn something new. Second, social interactions through cooperative learning
help learners construct knowledge. Because learners’ experiences and knowledge are different,
they can better expand knowledge through collaborative work. Third, self-regulation is
necessary for learner success. Constructivist teachers provide opportunities for learners to reflect
and expect students to be responsible for their own learning and behaviors. The final assumption
of constructivism is learning should involve authentic problems and scenarios, allowing students
to solve real-world problems. For the purpose of this study, we will use the four tenets identified
by Loyens, Rickers, and Schmidt (2007) to define constructivism.
Review of Literature
Pajares (1992) effectively sums up beliefs as a set of ideas determined by experiences,
changes, and/or inferences. Beliefs can be influenced by a person’s level of comfort, and this is
especially true in teaching. These beliefs are often predetermined prior to entering their
education courses in a teacher preparation program (Gresham & Burleigh, 2018; Gautreau, Brye
& Lunceford, 2016). Beliefs are impacted by previous experiences as students, theoretical
perspectives from pedagogy coursework, and field experience as preservice teachers.
Beliefs held by preservice teachers can be categorized by teaching, learning, instruction,
and content. When studying the beliefs held by secondary education minors, Caukin (2017)
found participants discussed more teacher-centered beliefs than learning-centered beliefs. In
statements concerning pedagogy, several of the mathematics majors valued problem-solving and
critical thinking of students; the participants explained critical thinking was more important than
finding the correct answer. Some of the participants described a discovery approach to
instruction, visualizing the role of the teacher as a facilitator while encouraging students to be
creative in their solutions.
In many studies, preservice teachers report their beliefs are based on their prior
experiences in school and what they learned about teaching from observing their teachers
(Pajares, 1992; Jong and Hodges, 2013). Steele, Brew, Rees, and Ibrahim-Khan (2013)
compared science versus non-science majors’ beliefs about preparedness to teach mathematics.
While their findings focused on participants’ differences, the authors described the importance of
students’ background as more impactful on their beliefs about teaching mathematics. Sometimes
negative ideas and beliefs about teaching are in place prior to entering their preparation program
(Geist, 2010). Fields and Isbell (2018) found some teachers would not be swayed to try
constructive approaches taught in their program, because they believed constructivist methods
could not work for all classrooms.
Gresham and Burleigh (2018) sought to reveal perceptions of constructivist methods for
teaching mathematics. Using a survey, journal responses to open-ended reflective questions, and
interviews the researchers found the methods course had an impact on preservice teachers’
beliefs and anxiety. The course instructors focused on preparing the teachers to use a variety of
constructivist teaching methods, use precise mathematics language, and create a positive
classroom environment. Results from the thirty-four participants suggested that each element
influenced their changed beliefs. Reported changes from the interviews indicated new levels of
improved confidence to try various strategies in their future classrooms. Additionally, the value
of practicing the methods with children encouraged the use of constructivist styles of teaching.

In a similar study, Swars et al. (2018) focused on content knowledge and attitude changes
through a specific course designed to encourage contextualized constructivist lessons.
The Mathematics Teaching Efficacy Beliefs Instrument (MTEBI) results “showed a significant
increase across the program, revealing the teachers had significant increases in beliefs in their
capabilities to teach mathematics effectively and influence student learning” (p. 132). They
found the most significant changes occurred in the second semester, suggesting the length of
immersion and experiences have a greater influence on preservice teachers’ attitudes towards
trying constructivist teaching methods.
Pedagogy coursework also impacts preservice teachers’ beliefs about instructional
methods. Overall, Swars et al. (2018) and Gresham and Burleigh (2018) discovered participants
changes in beliefs were positive. The preservice teachers’ enculturation of constructivist views
become one of advocacy for learning through experiences, becoming a guide on the side not the
sage on the stage. The methods courses gave them confidence to try new instructional strategies.
Fields, Williams, and Isbell (2017) found both practice and theory impact preservice teachers’
beliefs on teaching. The progression of change often begins as the preservice teachers’ encounter
field-based experiences, where the participants described themselves as both teacher and learner.
Methods
A qualitative content analysis (Krippendorff, 2004) of open-ended survey prompts was
conducted to explore preservice teachers’ beliefs about mathematics instruction. Preservice
teachers enrolled in a mathematics methods course completed a series of several prompts to
inform the instructor about their experiences with and beliefs about mathematics; however, only
the following two survey items were used for analysis in this study:
1) Tell me about your favorite or best mathematics teacher.
2) What should a mathematics classroom look like? (Describe the roles of the
teacher and students, what are they doing? Describe the physical setting, as well
as the “feel” of the classroom).
This study was conducted at a small liberal arts university in a southern state of the
United States. All participants were classified as seniors at the same university and answered the
prompts in a Google Form survey during the first week of the semester they were enrolled in
mathematics methods. Prior to taking the mathematics methods course, the participants had
completed at least three collegiate mathematics courses designed for elementary and middle-
level preservice teachers. Data was gathered over four consecutive long semesters, and 87
students participated in the study. Of the participants, 72 were seeking elementary licensure, and
15 were seeking middle-level licensure. Eighty of the participants were female, and seven were
male.

Figure 1. List of codes for the content analysis of survey data.
The open-ended responses to two items on the survey were analyzed using provisional
coding, meaning a list of codes was determined before the analysis of data, while still allowing
for modification, deletion, or expansion of new codes during analysis (Saldaña, 2013). The codes
used for content analysis of the survey data are displayed Figure 1. The following tenets of
constructivist theories (Loyens, Rickers, and Schmidt, 2007) were identified as codes prior to
analysis - authentic problems, construct new knowledge, cooperative learning, and self-
regulation. Additional codes emerged during the analysis of data - non-constructivist views and
explaining.
Findings
The tenets of constructivism served as the categories for the qualitative analysis of the
open response survey, in addition to two categories that emerged during analysis of the data. The
findings section is organized by the data analysis categories – cooperative learning, real world
problems, construct new knowledge, self-regulation, explaining, and non-constructivist views.
Pseudonyms designated by the researchers are used for the participants to protect their identities.
Unless otherwise identified, all participants quoted are elementary pre-service teachers.
Cooperative Learning
Throughout the responses, group or collaborative work was mentioned 30 times by the
participants. Terms like “community” and “team” were used to describe the environment of an
ideal mathematics classroom. When discussing cooperative learning, participants emphasized the
importance of group work and collaborations between teacher-student and student-student. A
few participants described classrooms in which teachers and students should interact frequently,
highlighting that teachers should learn from students as well as students learning from their
teachers. Denise explained, “Both [teacher and students] are there to help the other improve.”
The interactions, according to the participants, should reflect teachers and students working
together to “explore mathematical concepts” and “to solve math problems.”
Several participants mentioned the need for a balance of individual and group work when
learning mathematics. Believing students sometimes learn better from peers, Alexis a middle
level education major said, “Group work is important to math, because if a student is struggling
to learn from a teacher, then maybe a student would be able to better relate to another student’s
explanation.” In order to build a positive classroom environment, Harper and LaPortia believed

“students being comfortable working problems in front of their peers” and “to ask for help when
they need it” were important.
Real World Problems
When asked about their best or favorite teachers, participants often described how the
teacher related mathematics to the real world. Games, projects, stock market references, field
trips, class surveys, and career posters were some of the ways participants listed real-world
connections. The need for relevant and real-life mathematics scenarios was coded 26 times in the
data. Whitney highly valued real-world problems,
Mathematics is everywhere one looks. I believe we can motivate the students to bring
things outside into the classroom for mathematics. This will educate students on problem
solving and caring for what is going on around the world. It will also help engage our
students and let them enjoy the world of mathematics. It is very important for our
students to be able to take their knowledge and understanding out in the world. Teacher’s
goals should be to educate the students through critical skills needed in everyday life.
Construct New Knowledge
Although no participants specifically said “constructing knowledge” in their responses,
participants referenced the use of tools and manipulatives, experiencing learning through hands-
on activities, and accepting multiple solutions to the same mathematics problems 48 times.
Several participants emphasized the importance of students having access to manipulatives and
tools in a mathematics classroom. According to LaPortia, “a math classroom should be full of
resources and all kinds of different materials for students to work with,” and Raquel believed “a
mathematics classroom should be full of manipulatives.”
Some participants also viewed the mathematics classroom as a place for students to
experience through hands-on activities, “like science...with experiments, only math.” These
experiences should include project-based lessons, stations or centers, and discussion in which
“students should be doing a good majority of the talking.” Describing the teacher as a facilitator,
Courtney, a middle level preservice teacher, discussed her ideal mathematics classroom,
I want them to discover math with guidance. That is what I want our roles to be. I want
them to be excited to uncover a new concept without me spoon feeding it to them. I want
active, engaged math investigators for students. I want to be there as a guide, to help
them stay on track and delve deeper. I know that my dream class is a bit Pollyanna-ish,
but that is my vision.
Although it was only referred to a couple of times, two participants discussed accepting multiple
ways to solve mathematics problems. When recounting their favorite mathematics teacher, Kathy
appreciated “students did not have to solve problems the same way she did.”
Self-regulation
Self-regulation was the least mentioned in the data and was only coded 11 times. When
describing the role of the student, participants believed students should ask questions, listen, and
use the resources provided to them. Only one participant mentioned the role of the teacher in
helping students learn study skills. Debra reflected on the concept of mistakes, “I want to
emphasize trying and taking risks. That is how most mathematics problems were solved. I like
the idea that failing a few times is a requirement in my class, because it means my students
tried.”
Explaining
The code explaining emerged during analysis of the data and was coded 26 times. The
participants valued teachers who explained concepts clearly, provided several examples, and
shared multiple methods to solving one problem. When referring to their favorite or best
mathematics teacher, multiple participants simply mentioned how great the teachers were at
explaining content, LaPortia went in more detail,
She did a really great job of explaining the ‘why’ of everything. When we would learn
about a new formula, she would teach use the formula and then go on to show us the
background of where that formula came from and why that is the formula that does what
we need it to do.
Using examples when explaining mathematical concepts was also appreciated by the
participants, Mary shared, “my favorite mathematics teachers gave many examples of how to
work problems before actually having us do it on our own and I learned best from him.” Ben
believed teachers should explain concepts in multiple ways, and “show students different ways to
solve math problems...allowing the student to choose what works best for them.”
Non-constructivist Views
Although many of the responses reflected the four tenets of constructivism, participants
referenced what the researchers perceived as non-constructivist views fourteen times. Comments
that did not reflect constructivist views revolved around direct instruction and traditional roles of
teachers and students. Some participants made conflicting statements that incorporated both
constructivist and non-constructivist views. A few participants believed a classroom teacher
should be responsible for presenting the information through “lecture” or “direct instruction.”
Tabitha described this as, “the teacher should explain the concept being taught and then students
should immediately practice.” When discussing the roles of students and teacher, some
participants viewed more traditional roles. Josie stated, “the teacher is the teacher and the
students are the learners,” and Kathy said, “it is the job of the teacher to provide the tools and
knowledge for students to learn, and it is the job of the students to utilize what is provided of
them.” Some responses, like Britney’s, incorporated both constructivist and non-constructivist
ideals, “I do think that math needs more teacher instruction, not just guidance. But I think that
students should also be able to figure some things out for themselves.”
Discussion
The purpose of this paper was to examine preservice teachers’ beliefs about mathematics
teaching and learning, specifically in relation to constructivism. In some capacity, all four of the
constructivist tenets were described throughout the participants’ responses. Overall, the
participants seemed to value cooperative learning, real-world problems, and the use of
manipulatives and tools for hands-on learning. Self-regulation was not as prevalent in the data,
but this could be due to the limitations of the questions asked.
Throughout the responses, participants highlighted the importance of teachers giving
clear explanations, which led to some non-constructivist views regarding direct instruction and
traditional teacher roles. Like the findings from Jong and Hodges (2013), participants may be
holding to more traditional beliefs about the roles of teachers and students. As they described
their favorite mathematics teacher, participants often said the teacher was good at explaining.
The participants rarely expanded on this thought. However, Alice articulated, “[the teacher]
really helped me to understand how things worked and why they worked out the way they did
rather than telling me how to do it.” It is unclear if the concept of explaining was always used
with a constructivist mindset. The participants’ beliefs tended to be more teacher-centered rather
than learner-centered, similar to the findings from Caukin (2017).
Participants mentioned their college professors and high school teachers more often than
elementary and middle-level teachers when discussing their favorite or best mathematics
teachers. One reason could be because they can remember more about recent learning
experiences, so this may not indicate they are better teachers than elementary teachers. Although
the question asked them to describe their favorite or best teacher, the responses clearly supported
quality teaching.
The NCTM (2000) stated mathematics instruction should reflect constructivist ideals, and
for the most part, participants were reflecting these components. It is important to note, some
participants were incorporating ideas like real-world problems and manipulatives in their
descriptions of mathematics teaching, but they still hung onto to some traditional views of
mathematics. Years of learning mathematics in a traditional direct instruction classroom can
make it difficult for preservice teachers to fully grasp constructivist views that embrace student
discovery and construction of knowledge. However, elementary methods courses should
encourage constructivist approaches to teaching and learning mathematics (Gresham and
Burleigh, 2018; Swars et al., 2018).
Limitations
This small qualitative study provided the researchers with data to improve instruction in
the mathematics methods course. Limitations existed due to the size and purpose of the study.
Participants were only asked about their beliefs about mathematics at one point in time. The
survey was not for a grade in the course nor was it initially intended for a research study, which
may have caused short, less descriptive answers. Although this study was small and limited, it
may still be valuable to others. Lincoln and Guba (1985) encouraged researchers to avoid
generalizing data, instead they emphasized the importance of “transferability” and “fittingness.”
Meaning, teacher preparation programs and mathematics instructors may find this study valuable
due to possible similarities in their programs and classes.
Implications
From the data collected, participants in this particular teacher education program are
connecting the tenets of constructivism with mathematics instruction, but not fully embracing
this approach to teaching. It is clear the mathematics college instructors are modeling
constructivist approaches, since participants frequently mentioned their college professors in
their responses. Yet, preservice teachers still need more experiences discovering mathematical
concepts, as well as observing and facilitating K-12 students’ discovery of mathematics
concepts. In regard to constructivism, our teacher preparation program should place more
emphasis on the role of the teachers and students, as well as collaborative work. While the
participants frequently focused on “teacher explaining,” the mathematics methods classroom
should highlight the role of students explaining rather than the teacher. As a program, we should
emphasize the importance of promoting student self-regulation as a valuable part of the learning
experience.
Collaborative work was valued by the participants, but it is unclear if they understood the
difference between group work and cooperative learning. As teacher preparation educators, we
need to model cooperative learning groups and discuss the characteristics that distinguish them
from group work. Similar to the Swars et al. (2018) and Gresham and Burleigh (2018) studies, a
next step could be to examine the perspectives after preservice teachers enter the classroom. This
study leads to new research questions concerning how preservice teachers’ beliefs change during
the methods and internship semesters and what factors impact their mathematics teaching
practice.
References
Caukin, N. (2019). What teacher candidates believe about teaching and learning. In N.P.
Gallavan P. & L.G. Putney (Eds.), Teacher education yearbook XXVI: Building upon
inspirations and aspirations with hope, courage, and strength (Vol. 2, pp. 25-42). Lanham,
MD: Rowman & Littlefield.
Fields, M., & Isbell, L. (2018). A culturally candid response: Tale of two
professors' reflections. Curriculum and Teaching Dialogue, 20(1/2), 133-135.
Fields, M., Williams, J., & Isbell, L. (2017). Changes in preservice teachers’ beliefs as
indicators of learning. The Texas Forum of Teacher Education, 7, 21-26.
Geist, E. (2010). The anti-anxiety curriculum: Combating math anxiety in the classroom.
Journal of Instructional Psychology, 37(1), 24–31.
Gautreau, C., Brye, M. V., & Lunceford, C. (2016). Mathematics-related anxiety and attitudes:
examining the impact among Latina preservice teachers. Journal of Latinos and
Education, 15(1), 26-38. https://doi.org/10.1080/15348431.2015.1045146
Gresham, G., & Burleigh, C. (2018). Exploring early childhood preservice teachers’ mathematics
anxiety and mathematics efficacy beliefs. Teaching Education, 1-25.
https://doi.org/10.1080/10476210.2018.1466875
Jong, C., & Hodges, T. (2013). The influence of elementary preservice teachers’ mathematical
experiences on their attitudes towards teaching and learning mathematics.
International Electronic Journal of Mathematics Education, 8(2–3), 100–122.
Lincoln, Y. S., & Guba, E. G. (1985). Naturalistic inquiry. Beverly Hills, CA: SAGE.
Loyens, S. M., Rikers, R. M., & Schmidt, H. G. (2007). Students’ conceptions of distinct
constructivist assumptions. European Journal of Psychology of Education, 22(2), 179-
199.
Krippendorff, K. (2004). Content analysis: An introduction to its methodology (2nd ed.).
Thousand Oaks, CA: SAGE.
National Council of Teachers of Mathematics. (2000). Principles and standards for school
mathematics. Reston, VA: NCTM.
National Council of Teachers of Mathematics (NCTM). (2014). Principles to actions: Ensuring
mathematical success for all. Reston, VA: NCTM.
Pajares, M. F. (1992). Teachers' beliefs and educational research: Cleaning up a messy construct.
Review of Educational Research, 62(3), 307-332.
Piaget, J. (1954). The construction of reality in the child. Oxon, OX: Routledge.
Saldaña, J. (2013). The coding manual for qualitative researchers (Vol. 2). Los Angeles, CA:
SAGE.
Steele, A., Brew, C., Rees, C., & Ibrahim-khan, S. (2013). Our practice, their readiness: Teacher
educators collaborate to explore and improve preservice teacher readiness for science and
math instruction. Journal of Science Teacher Education, 24(1), 111-131.
Swars, S. L., Smith, S. Z., Smith, M. E., Carothers, J., & Myers, K. (2018). The preparation
experiences of elementary mathematics specialists: examining influences on beliefs,
content knowledge, and teaching practices. Journal of Mathematics Teacher Education,
21(2), 123-145. https://doi.org/10.1007/s10857-016-9354-y
Vygotsky, L.S. (1978). Mind in society: The development of higher psychological processes.
Harvard University Press.