arcgis pro: what's new in analysis - esri · tools for analyzing spatial distributions,...
TRANSCRIPT

ArcGIS Pro: What’s New in AnalysisJames Sullivan
February 9–10, 2015 | Washington, DC
Federal GIS Conference

What is analysis?
Analysis transforms raw data into information or knowledge.
Spatial analysis does this
for geographic or spatial
data.

Who? What? Where? When? Why?
Spatial analysis answers “where”
questions.
Where is the best location for a new community center?
Where is an area with high crime rates?
Where has the landscape changed in the last 10 years?

Analysis in ArcGIS Desktop
Make analysis easy
Single tools that run common workflows like summarizing within an area, aggregating
points, etc.
Make it fast
More tools using parallel processing
Continual improvements to vector overlay
With better/more correct analysis results
Better distance calculations/geodesic

Analysis in ArcGIS Pro
ArcGIS Pro provides incredible capabilities for performing analysis in 2d and 3d.
Performance (~20%) + scalability + visualization
Geoprocessing
Raster analysis
Network analysis
3d analysis
Statistical analysis

Analysis in ArcGIS Pro
The ANALYSIS ribbon tab provides access to
Gallery of powerful analytic tools
Suite of all geoprocessing tools
Python command line
ModelBuilder
Network analysis
Imagery processing

GeoprocessingProcessing geographic data

Geoprocessing is a rich suite of tools for processing geographic data.
Spatial analysis + manage GIS data
A typical geoprocessing tool processes input data and produces an output.
E.g. Buffer a map layer to create areas around
the layer’s features
You can model and automate geoprocessing
workflows using ModelBuilder or Python.
What is geoprocessing?

Familiar user experience with some key productivity improvements.
Most tools, models, and Python scripts that work in ArcMap will work in Pro.
ArcObjects-based custom tools are not supported.
Analyze for Pro tool checks models and scripts
for unsupported tools, data, and Python code.
Geoprocessing in ArcGIS Pro
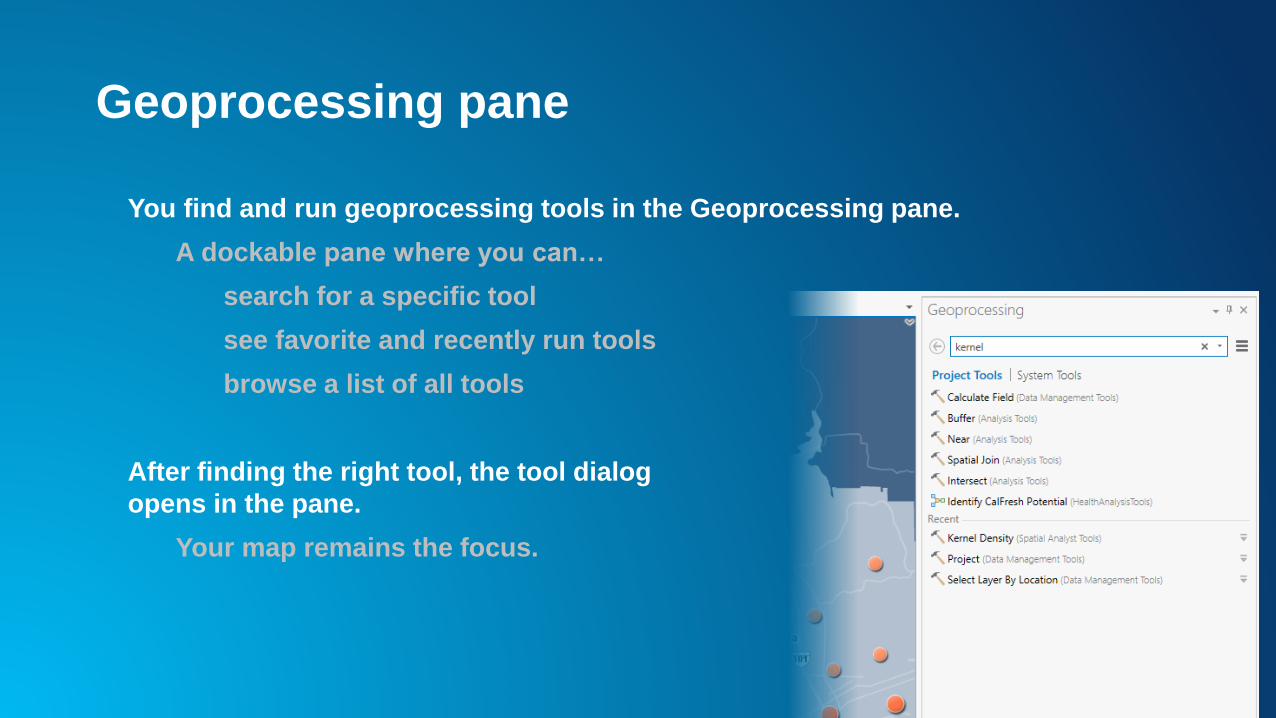
You find and run geoprocessing tools in the Geoprocessing pane.
A dockable pane where you can…
search for a specific tool
see favorite and recently run tools
browse a list of all tools
After finding the right tool, the tool dialog
opens in the pane.
Your map remains the focus.
Geoprocessing pane

Create a geoprocessing workflow
Make a Python script tool that runs Python code
To get started, run the tool in Pro, then
Copy Python command and paste into script file.
Build a model of your workflow
using ModelBuilder.
Connect tools and data to
form a diagram that
represents your workflow.

GeoprocessingDemo

Raster AnalysisSpatial Analyst extension

Raster analysis
Spatial Analyst includes 170+ geoprocessing tools.
Integrates both vector and raster spatial analysis.
Range of applications including suitability modeling,
hydrological analysis, surface interpolation, and more.
Powerful map algebra language
Raster Calculator

Improved user experience of tools and controls and
access to key raster analysis environments
Cellsize, snap raster, mask, etc.
More tools use parallel processing/multi-core
Reclassify, Weighted Overlay, Zonal Statistics
New tools in ArcGIS Desktop
Rescale By Function, geodesic Viewshed, Segmentation
and Classification
Raster analysis

Wind power suitabilityDemo
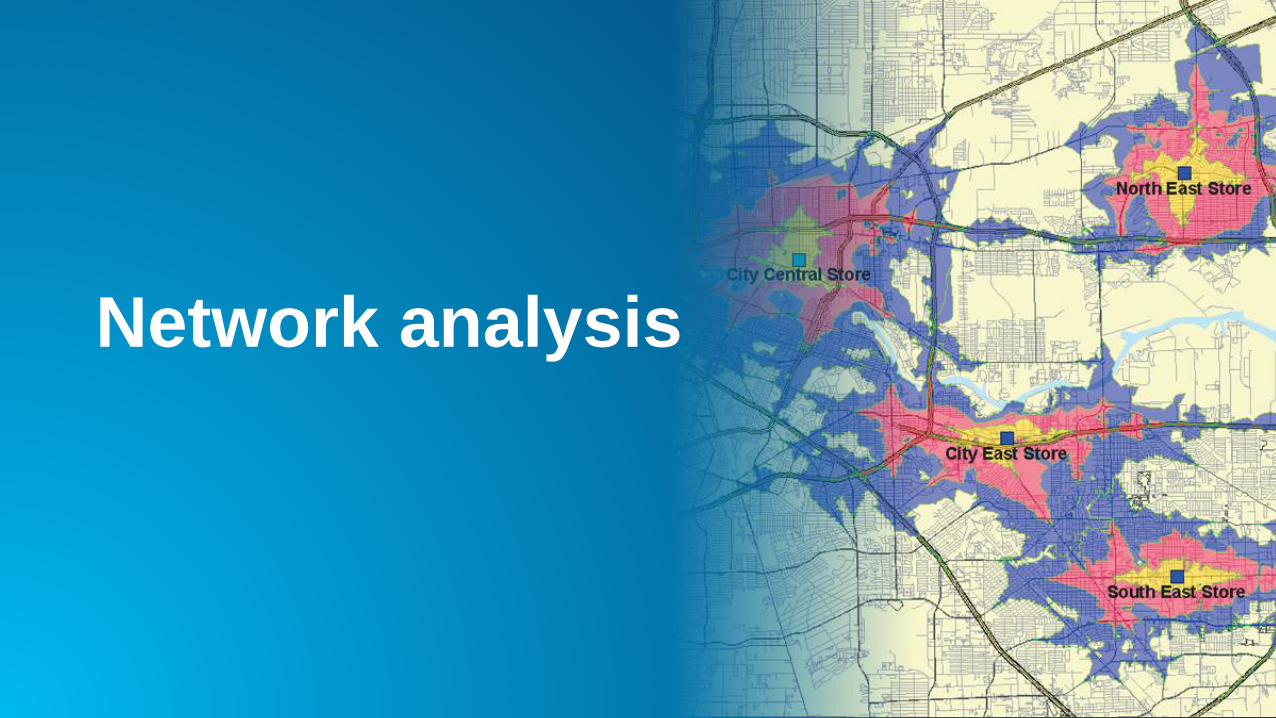
Network analysis

Routing / Directions
Closest facility
Drive-time / service areas
Location – Allocation
Vehicle routing problem
Origin – Destination matrix
Network Analysis

Network analysis in ArcGIS Pro
2D and 3D network analysis
Start with Analysis > Network Analysis >
Service Area or Route
Contextual ribbon tab for different network
analysis layers
Add locations, configure, and run
Other analysis accomplished through
geoprocessing tools in Network Analyst toolbox

Don’t have your own network data or don’t know how to use it? Use
ArcGIS ready-to-use services
Requires ArcGIS Organizational account; credits consumed
Services use premium street network data with historical and
current traffic estimates and world-wide coverage.
http://logistics.arcgis.com/arcgis/services
Network analysis services

Network analysisDemo

3D Analysis

100+ geoprocessing tools for elevation surface
creation and analysis, using vectors, rasters and
TIN-based models.
Support for analysis and visualization of Lidar and
point-cloud data through the LAS dataset.
Measuring distances/proximity and evaluating
spatial relationships in 3D.
Volumetric and visibility analysis
3D Analyst extension
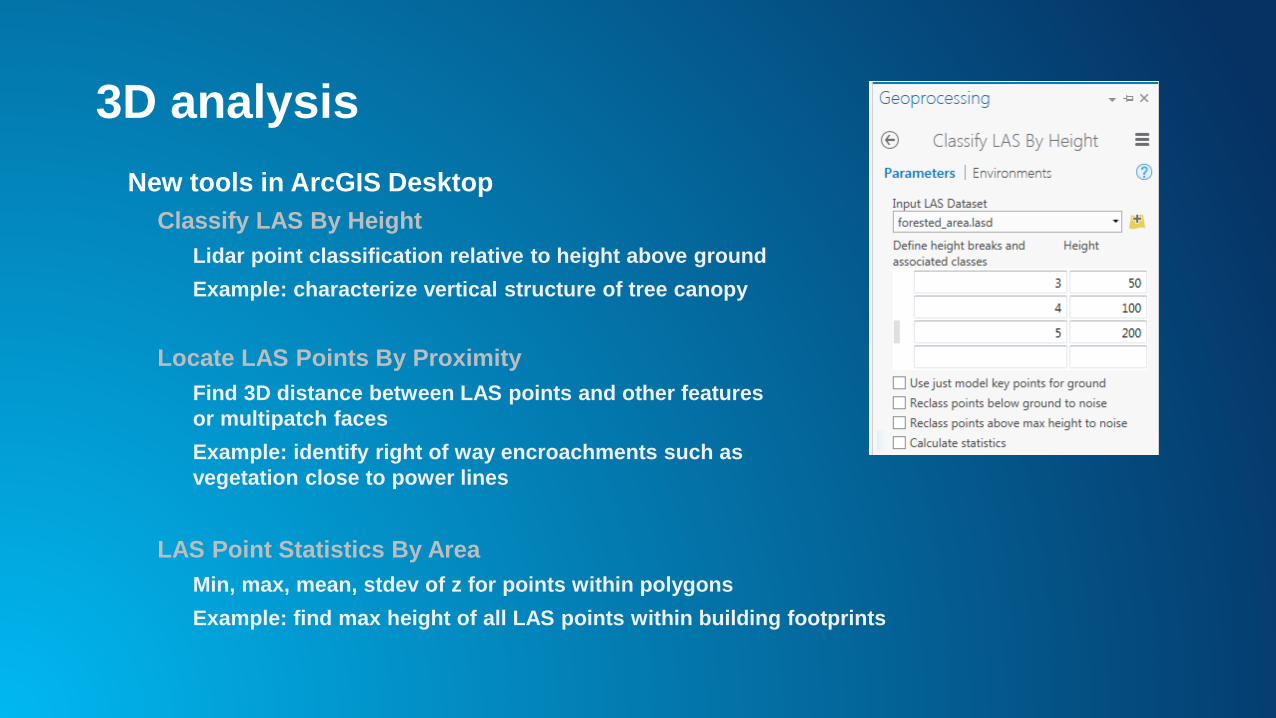
New tools in ArcGIS Desktop
Classify LAS By Height
Lidar point classification relative to height above ground
Example: characterize vertical structure of tree canopy
Locate LAS Points By Proximity
Find 3D distance between LAS points and other features
or multipatch faces
Example: identify right of way encroachments such as
vegetation close to power lines
LAS Point Statistics By Area
Min, max, mean, stdev of z for points within polygons
Example: find max height of all LAS points within building footprints
3D analysis

3D AnalysisDemo

Statistical analysisSpatial and geostatistics

Interactive modeling tools for creating statistically valid
prediction surfaces along with prediction uncertainties.
Predict between known measurements – interpolation
Off-the-shelf tools for calculating extremely accurate
interpolation surfaces without configuration of statistical
models.
Empirical Bayesian Kriging
No Geostatistical Wizard in first release of Pro –
only the existing geoprocessing tools.
Geostatistical Analyst

Tools for analyzing spatial distributions, patterns, processes and relationships in 2D,
3D, and 4D (time)
Summarize key characteristics of a spatial distribution
Identify significant clusters and outliers
Model and explore spatial relationship through regression
New tools in ArcGIS Pro
Create Space Time Cube: Aggregates data into
multidimensional data structure
Emerging Hot Spot Analysis: Identify hot and cold spot
trends – new, intensifying, diminishing, sporadic, etc.
Spatial Statistics

Statistical analysisDemo

Learn more about spatial
analysis
http://pro.arcgis.com/en/analysis/

Don’t forget to complete
a session evaluation form!
February 9–10, 2015 | Washington, DC
Federal GIS Conference

Print your customized
Certificate of Attendance!Printing stations located on L St. Bridge, next to registration
February 9–10, 2015 | Washington, DC
Federal GIS Conference

GIS Solutions EXPO, Hall DMonday, 12:30pm – 6:30pm
Tuesday, 10:45 AM–4:00 PM
• Exhibitors
• Hands-On Learning Lab
• Technical & Extended Support
• Demo Theater
• Esri Showcase
February 9–10, 2015 | Washington, DC
Federal GIS Conference

Networking Reception:
National Museum of American History
Tuesday, 6:30 PM–9:30 PM
Bus Pickup located on L Street
February 9–10, 2015 | Washington, DC
Federal GIS Conference

Interested in diving
deeper into Esri technology?
Add a day to your Fed GIS experience and register to attend the Esri
DevSummit Washington DC. Stop by the registration counter to sign up.
February 9–10, 2015 | Washington, DC
Federal GIS Conference
