arctic sea ice cover - woods hole oceanographic …€¢ canary in a coal mine military •...
TRANSCRIPT
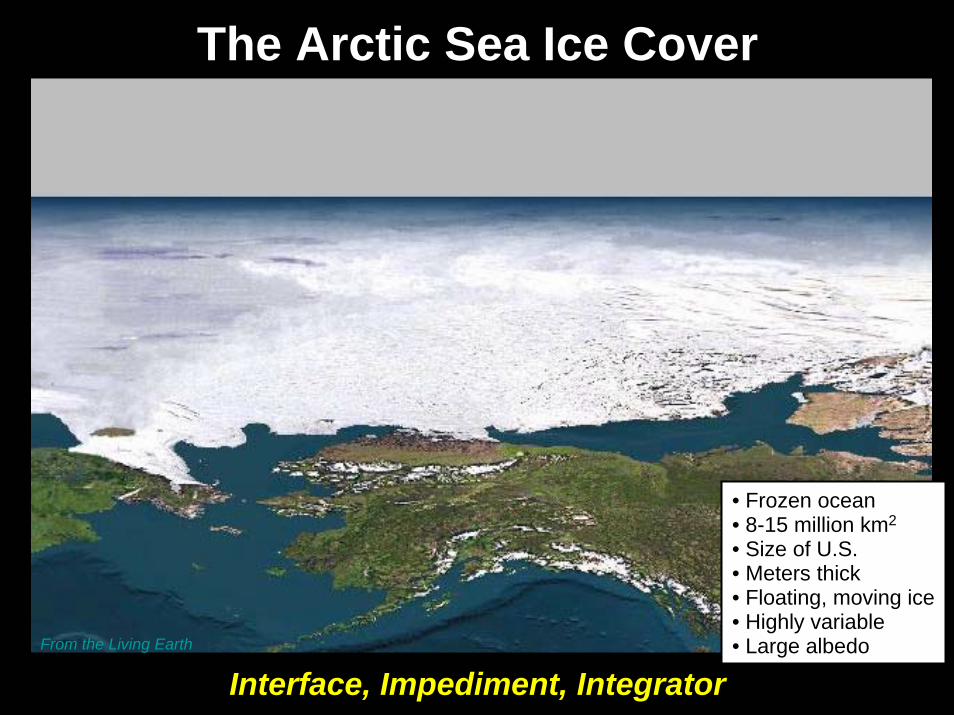
The Arctic Sea Ice Cover
From the Living Earth
• Frozen ocean• 8-15 million km2
• Size of U.S.• Meters thick• Floating, moving ice• Highly variable• Large albedo
Interface, Impediment, Integrator
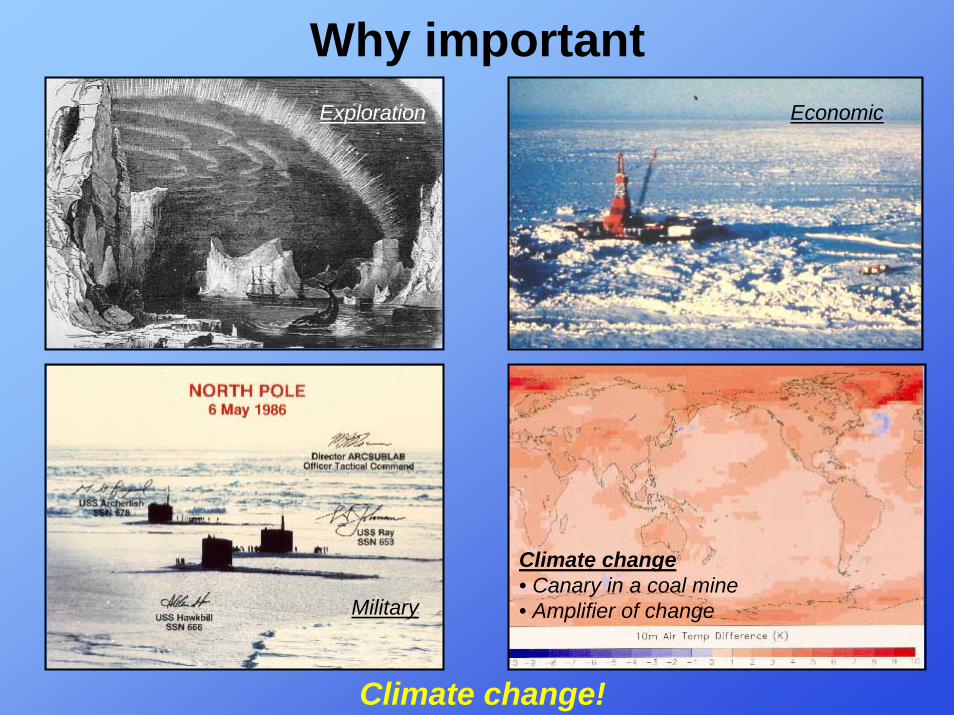
Why importantExploration Economic
Climate change• Canary in a coal mine• Amplifier of changeMilitary
Climate change!

What are the major sea ice questions?
• How much ice is there?• areal extent• thickness
• How much snow is there?• How does the ice move?• What is its mass balance?• Where does the sunlight go?• What are its properties?• How does it interact with other components?
• Determine the extent of the ice cover• Determine the redistribution of the ice cover due to dynamics and thermodynamcs• Measure the export of ice from the Arctic basin• Determine the snow depth and the ice thickness
• Which Arctic changes reflect basin-wide, decadal, and long-term processes? • How are they coupled?• Have Arctic feedbacks amplified these changes?• What are the future Arctic change scenarios?
• Is Arctic change related to the Arctic Oscillation?• Is Arctic change a component of climate change?• Are feedbacks critical to Arctic change?• Do physical changes greatly impact Arctic ecosystems and society?
• Assess large-scale Arctic environmental change.• Conduct scientific exploration of polar frontiers.• Observe polar regions in depth.• Understand human-environmental dynamics.• Create new connections between science and public.
How are these quantities changing?

What do we need to measure?• Ice extent• Thickness distribution• Snow depth distribution• Ice motion• Temperature• Mass balance • Albedo and transmission• Environmental forcing
(ocean and atmosphere)
Spatial and temporal variability make it difficult

What tools do we have?
• Archived data• Field experiments
• camps• cruises• submarines
• Remote sensing• IPS• aircraft• satellites
• Models• process• discrete element• large-scale ice• GCM
Ice tethered buoys!
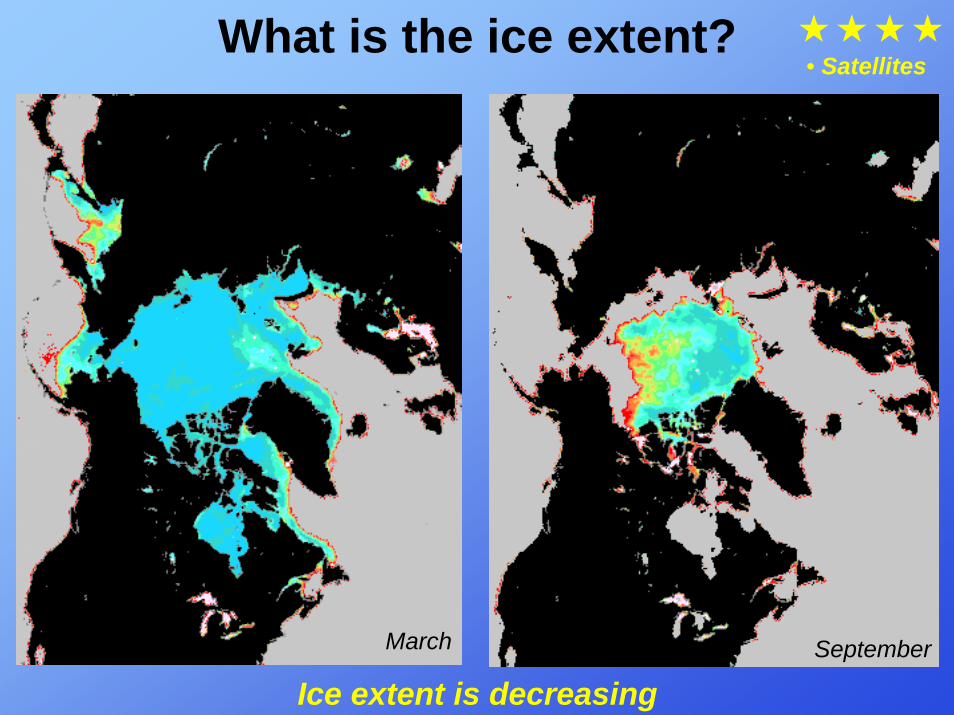
What is the ice extent?• Satellites
March September
Ice extent is decreasing
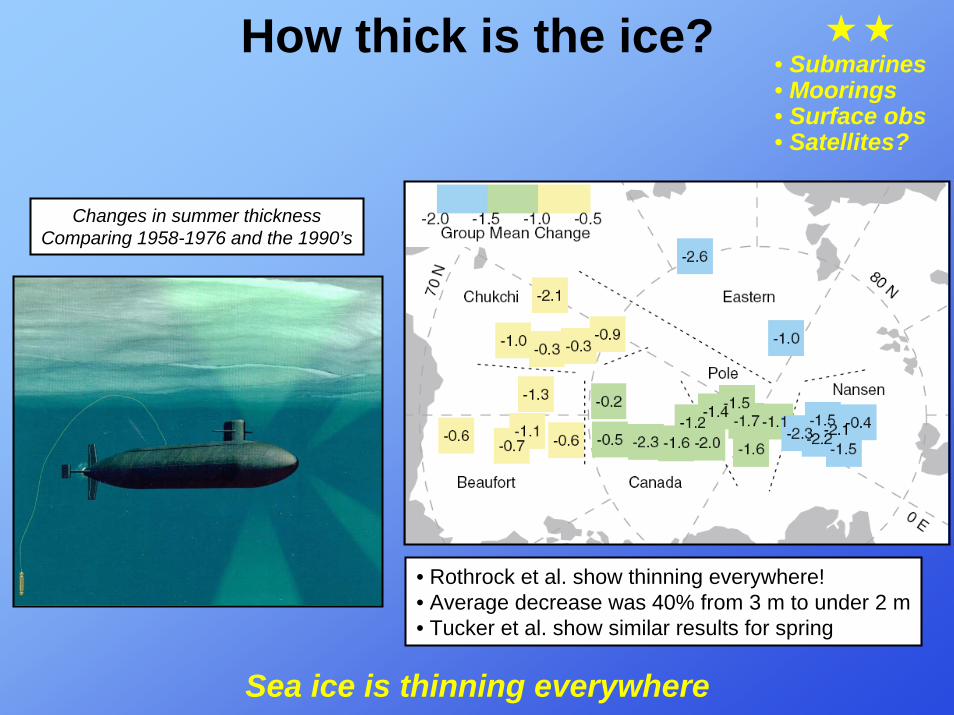
How thick is the ice?
• Rothrock et al. show thinning everywhere!• Average decrease was 40% from 3 m to under 2 m• Tucker et al. show similar results for spring
Changes in summer thicknessComparing 1958-1976 and the 1990’s
• Submarines• Moorings• Surface obs• Satellites?
Sea ice is thinning everywhere

How much snow is there?• Surface obs• Buoys• Satellites?
0 25 50 75 100 1250.00
0.01
0.02
0.03
0.04
0.05
Spring 199821,169 points33.7 cm mean19.3 std. dev.
Freq
uenc
y (%
)Snow depth (cm)
10/10 11/24 1/8 2/22 4/8 5/23 7/70
10
20
30
40
19981997D t
Ave
rage
dep
th (c
m)
Seasonal evolution and large spatial variability
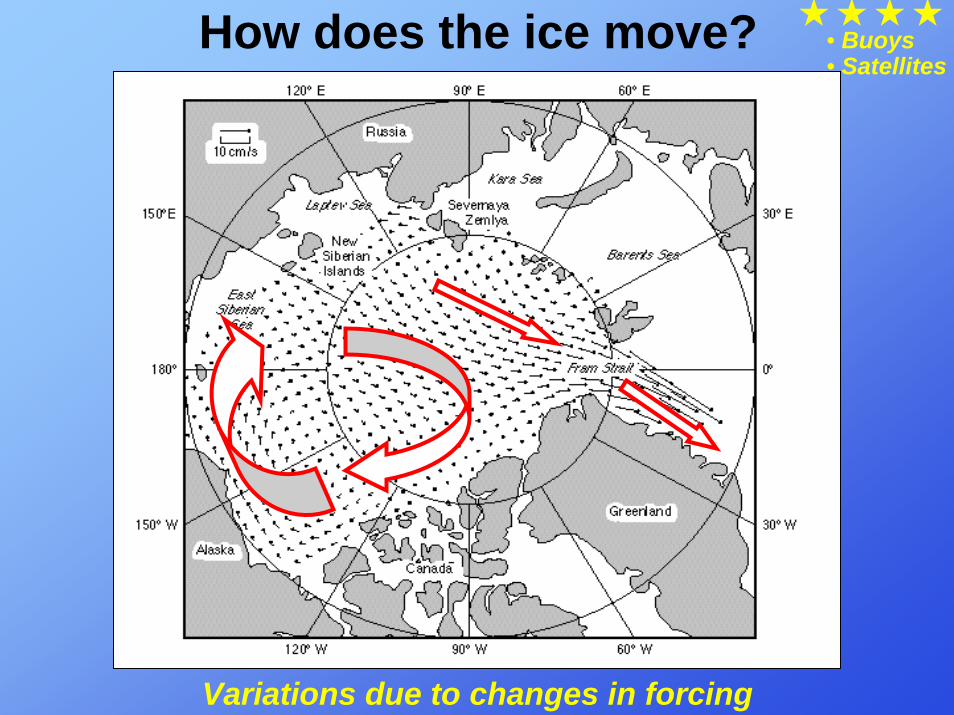
How does the ice move? • Buoys• Satellites
Variations due to changes in forcing

What is the mass and heat budget?• Surface obs• Buoys
10/10 12/10 2/10 4/10 6/10 8/10 10/10-200
-150
-100
-50
0
50
100
First year 0.7 to 1.5 m 1.5 to 2.25m above 2.25 m
Date
Cha
nge
in ic
e th
ickn
ess
(cm
)
Manned camp
Autonomous buoy
0
25
50
75
Tota
l mel
t (cm
)
Snow melt Surface melt Bottom melt
1957 1958 1959 1975 1994 1998 2000 2002
Large variability: spatial and interannual
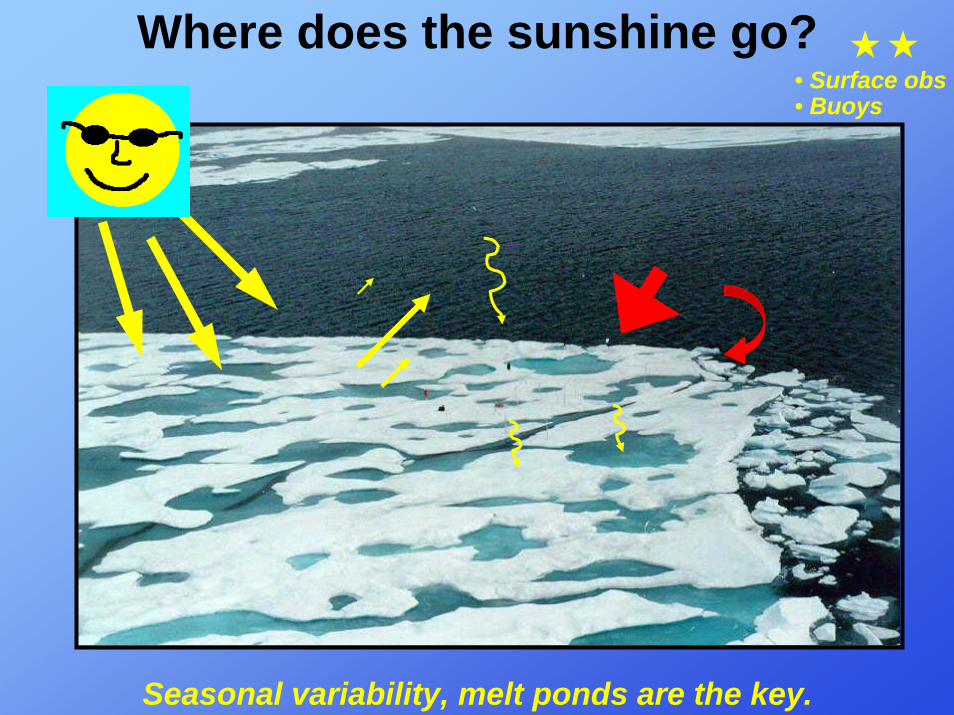
Where does the sunshine go?• Surface obs• Buoys
Seasonal variability, melt ponds are the key.

What are the ice properties?• Surface obs• Buoys• Satellites
Ice properties impact all parameters

How does it interact?• Surface obs
Much work to do.

Ice tethered systems: ice measurements1. Air temperature2. Ice temperature3. Upper ocean temperature4. Snow depth5. Ice thickness6. Ice mass balance7. Surface conditions8. Solar partitioning9. Ice position
1. Thermistors2. Thermistors3. Thermistors4. Acoustic sensor5. Acoustic sensor6. Acoustic / thermistors7. Web cams – above,below8. Spectroradiometers9. GPS
Ice tethered systems can make major contributions
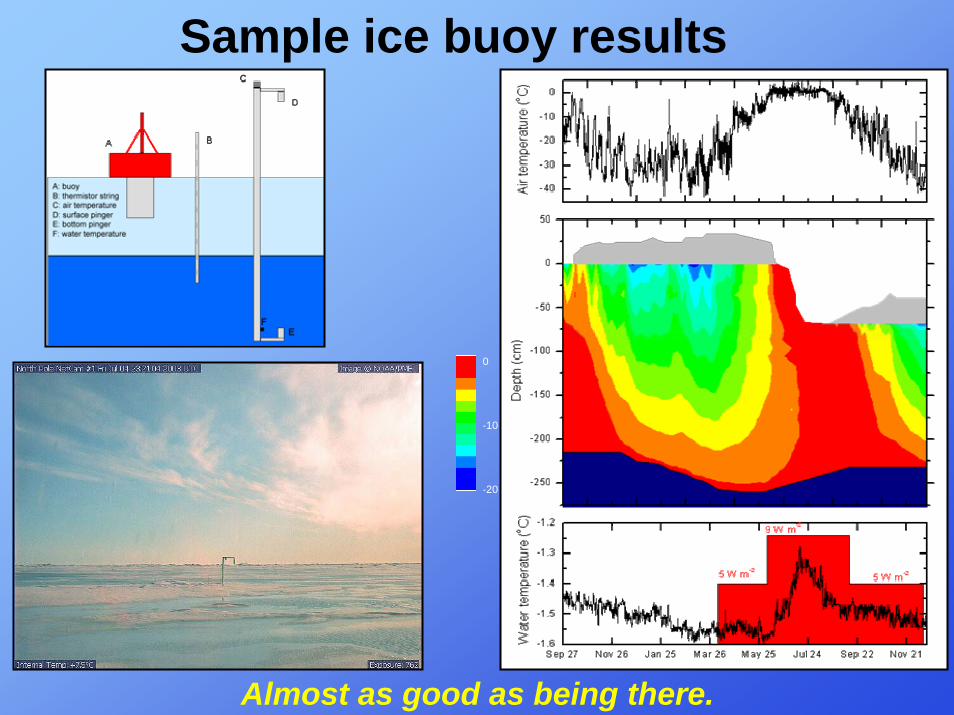
Sample ice buoy results
0
-10
-20
Almost as good as being there.
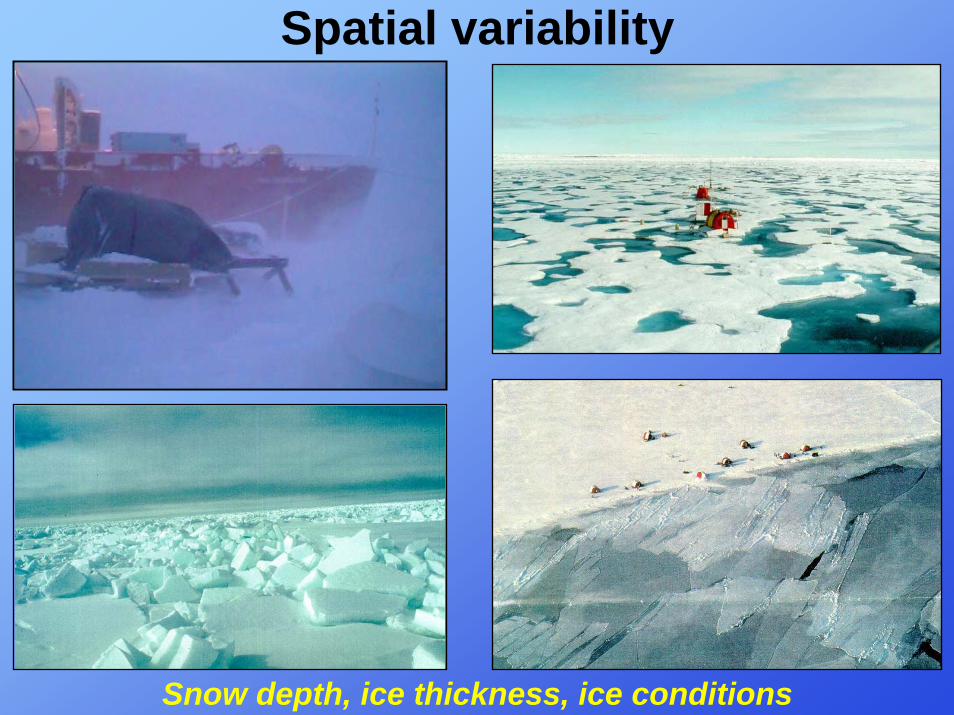
Spatial variability
Snow depth, ice thickness, ice conditions

What good is a point measurement?
0.0
0.1
0.2
0.3
0.4
-150 -100 -50 00.0
0.1
0.2
0.3
0.4
Fra
ctio
n
Surface melt
Total melt (cm)
Fra
ctio
n
Bottom melt
Pretty good if… you carefully select location

Smart motes
Snow-ice interface temperature tells all

Installation measurement festival
Explore spatial variability
• Aerial photographs • Snow depth• Pond depth• Ice thickness• Surface types
Characterize area during buoy installation

Remember outreach
Classroom visits, media outreach, web cams and pages

Integration coordination, and synthesis
Ice tethered buoys Satellites
Field studies
Models
3 levels of coordination and integration
• Integrate all buoy elements (ice, ocean, atmosphere, biology, geochemistry).
• Integrate tethered buoys with other components of an Arctic Ocean observing system (satellites, moorings, stations)
• Coordinate with other studies (process studies, field studies, models)
• Collaborate with other efforts• Synthesize results
Integration is the key

Summary
• How much ice is there?• areal extent• thickness – Yes!
• How much snow is there? – Yes!• How does the ice move? – Yes!• What is its mass balance? – Yes!• Where does the sunlight go? – Yes!• What are its properties? – Yes!• How does it interact with other components? – Yes!
Can ice tethered buoys help answer the questions – YES!

SEARCH ice mass balance activities
• Sponsored by NOAA and NSF• Ice mass balance buoys • Deployments defined by
• Maximum coverage• Models and observations
• Eight buoys this year• Expected life 1-3 year • Coordinated with moorings
• Ocean instruments• Ice profiling sonar
• Collaboration with other efforts
Location, location, location
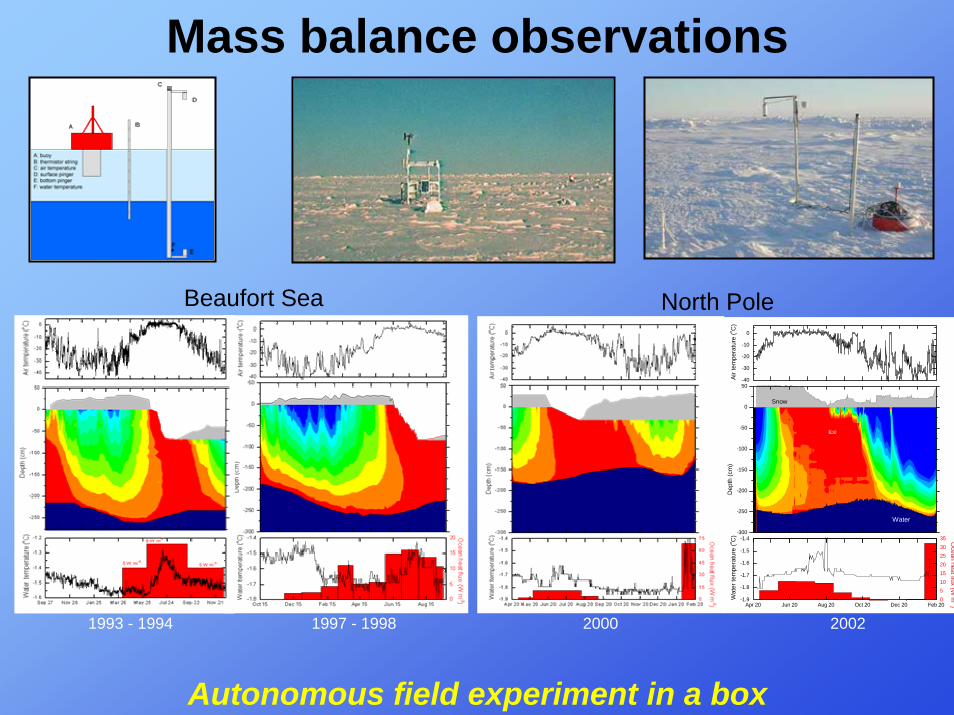
Mass balance observations
Beaufort Sea
05101520253035
Snow
-40
-30
-20
-10
0
Air t
empe
ratu
re (o C
)
-300
-250
-200
-150
-100
-50
0
50
Ice
Water
Ocean heat flux (W
m-
Dep
th (c
m)
2)
n 20 Aug 20 Oct 20 Dec 20 Feb 20Apr 20 Ju-1.9
-1.8
-1.7
-1.6
-1.5
-1.4
Wat
er te
mpe
ratu
re (o C
)
North Pole
20001993 - 1994 1997 - 1998 2002
Autonomous field experiment in a box