are land application programs in georgia complying...
TRANSCRIPT

Are Land ApplicationPrograms in Georgia
Complying with the Part 503Regs?
Are Land ApplicationPrograms in Georgia
Complying with the Part 503Regs?
Richard O. Mines, Jr.Richard O. Mines, Jr.Mercer UniversityMercer University
Rachel CochranRachel CochranGeorgia Environmental Protection DivisionGeorgia Environmental Protection Division

OverviewOverviewObjectivesObjectives
BackgroundBackground
MethodologyMethodology
Results and DiscussionResults and Discussion
ConclusionsConclusions
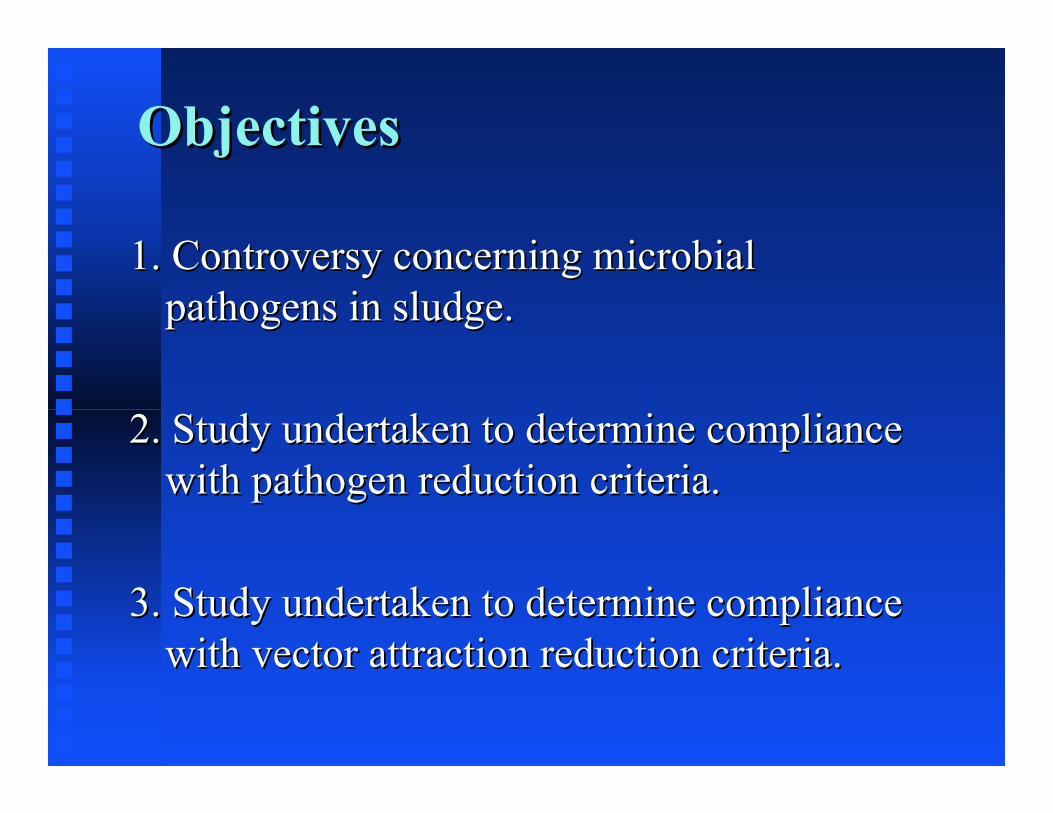
ObjectivesObjectives
1. Controversy concerning microbial1. Controversy concerning microbialpathogens in sludge.pathogens in sludge.
2. Study undertaken to determine compliance2. Study undertaken to determine compliancewith pathogen reduction criteria.with pathogen reduction criteria.
3. Study undertaken to determine compliance3. Study undertaken to determine compliancewith vector attraction reduction criteria.with vector attraction reduction criteria.
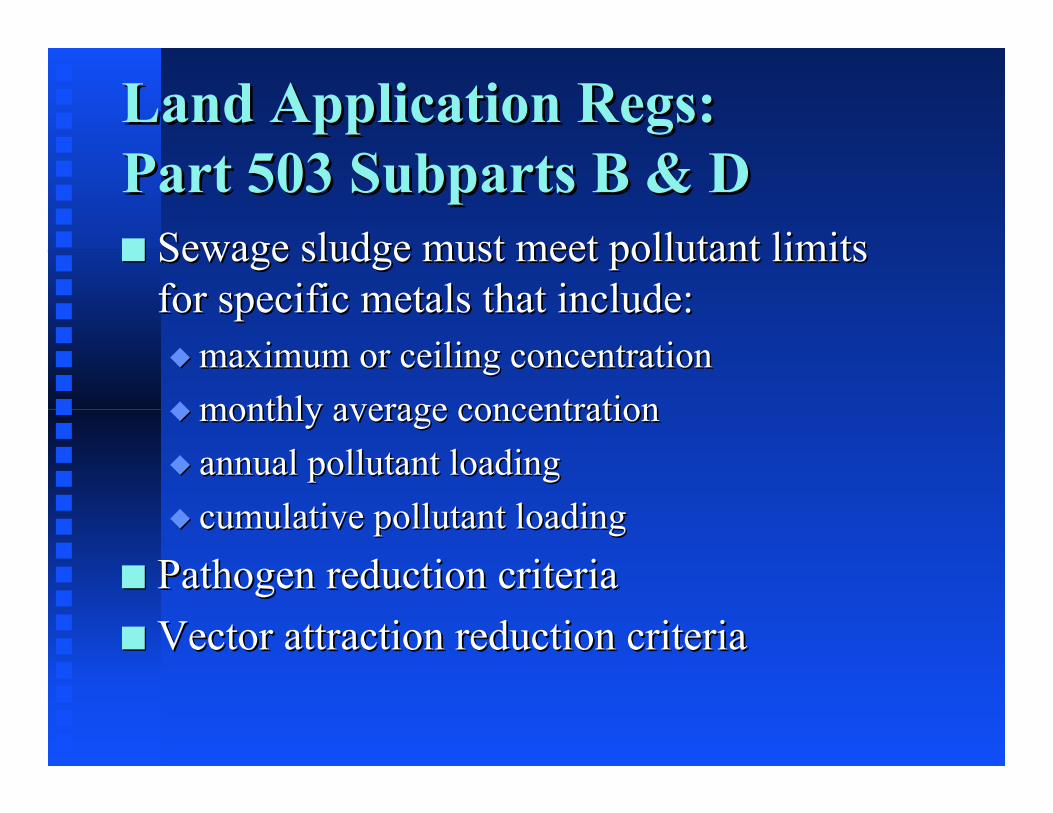
Land Application Regs:Part 503 Subparts B & DLand Application Regs:Part 503 Subparts B & D
Sewage sludge must meet pollutant limitsSewage sludge must meet pollutant limitsfor specific metals that include:for specific metals that include:
maximum or ceiling concentrationmaximum or ceiling concentrationmonthly average concentrationmonthly average concentrationannual pollutant loadingannual pollutant loadingcumulative pollutant loadingcumulative pollutant loading
Pathogen reduction criteriaPathogen reduction criteriaVector attraction reduction criteriaVector attraction reduction criteria

Class A SludgePathogen RequirementsClass A SludgePathogen Requirements
Fecal coliform bacteria <= 1000 MPN perFecal coliform bacteria <= 1000 MPN pergram of total solids (dry wt. basis).gram of total solids (dry wt. basis).
Density of Density of Salmonella sp. Salmonella sp. Bacteria < 3Bacteria < 3MPN per 4 grams of TS (total solids).MPN per 4 grams of TS (total solids).
Must utilize one of 6 technologies.Must utilize one of 6 technologies.
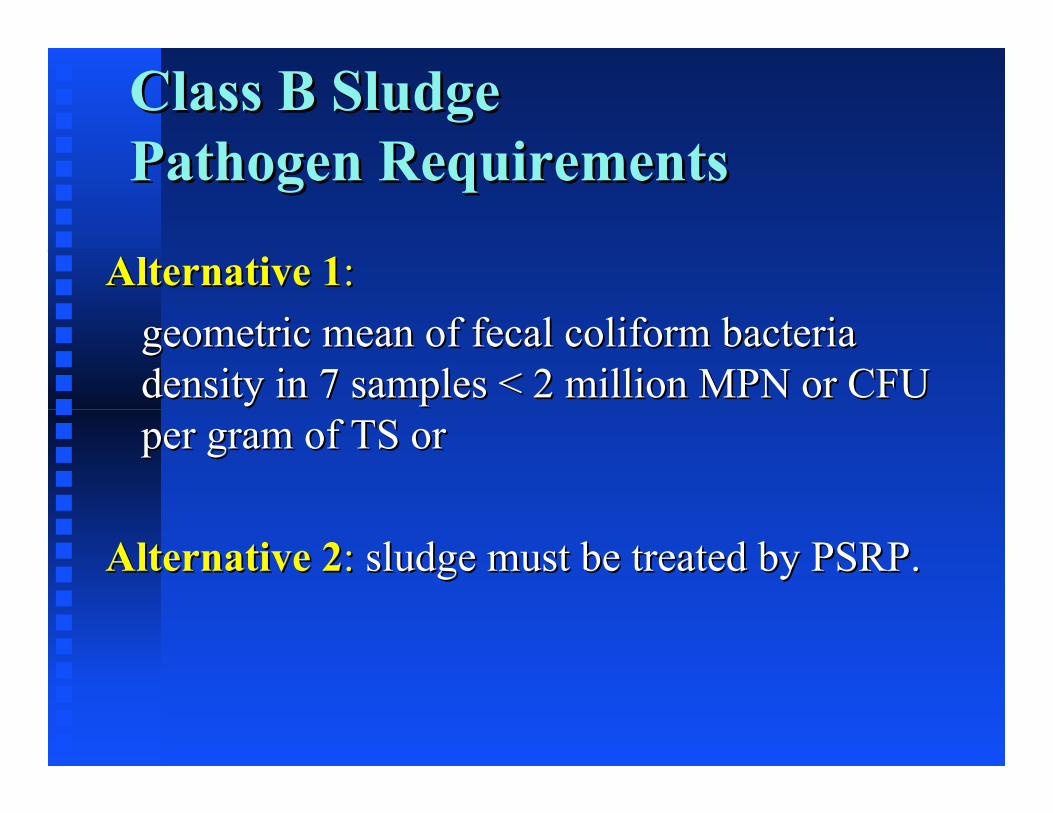
Class B SludgePathogen RequirementsClass B SludgePathogen Requirements
Alternative 1Alternative 1::geometric mean of fecal coliform bacteriageometric mean of fecal coliform bacteriadensity in 7 samples < 2 million MPN or CFUdensity in 7 samples < 2 million MPN or CFUper gram of TS orper gram of TS or
Alternative 2Alternative 2:: sludge must be treated by PSRP. sludge must be treated by PSRP.

Technologies for Meeting ClassA Pathogen RequirementsTechnologies for Meeting ClassA Pathogen Requirements
1. Time and temperature.1. Time and temperature.2. pH and time.2. pH and time.3.3. Analysis for enteric viruses (EV) prior to Analysis for enteric viruses (EV) prior to
treatment.treatment.4. Analysis for viable helminth ova (VHO)4. Analysis for viable helminth ova (VHO)5. Analysis for EV or VHO at disposal.5. Analysis for EV or VHO at disposal.6. Sludge should be treated in a PFRP.6. Sludge should be treated in a PFRP.
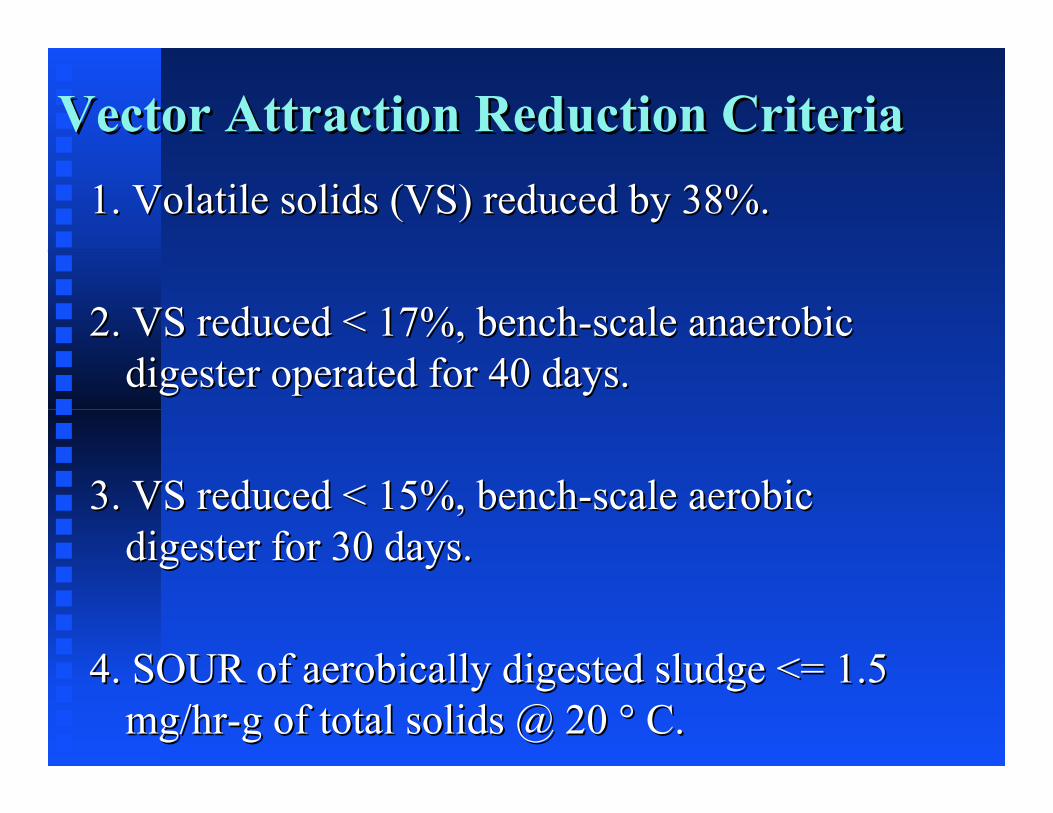
Vector Attraction Reduction CriteriaVector Attraction Reduction Criteria1. Volatile solids (VS) reduced by 38%.1. Volatile solids (VS) reduced by 38%.
2. VS reduced < 17%, bench-scale anaerobic2. VS reduced < 17%, bench-scale anaerobicdigester operated for 40 days.digester operated for 40 days.
3. VS reduced < 15%, bench-scale aerobic3. VS reduced < 15%, bench-scale aerobicdigester for 30 days.digester for 30 days.
4. SOUR of aerobically digested sludge <= 1.54. SOUR of aerobically digested sludge <= 1.5mg/hr-g of total solids @ 20 ° C.mg/hr-g of total solids @ 20 ° C.
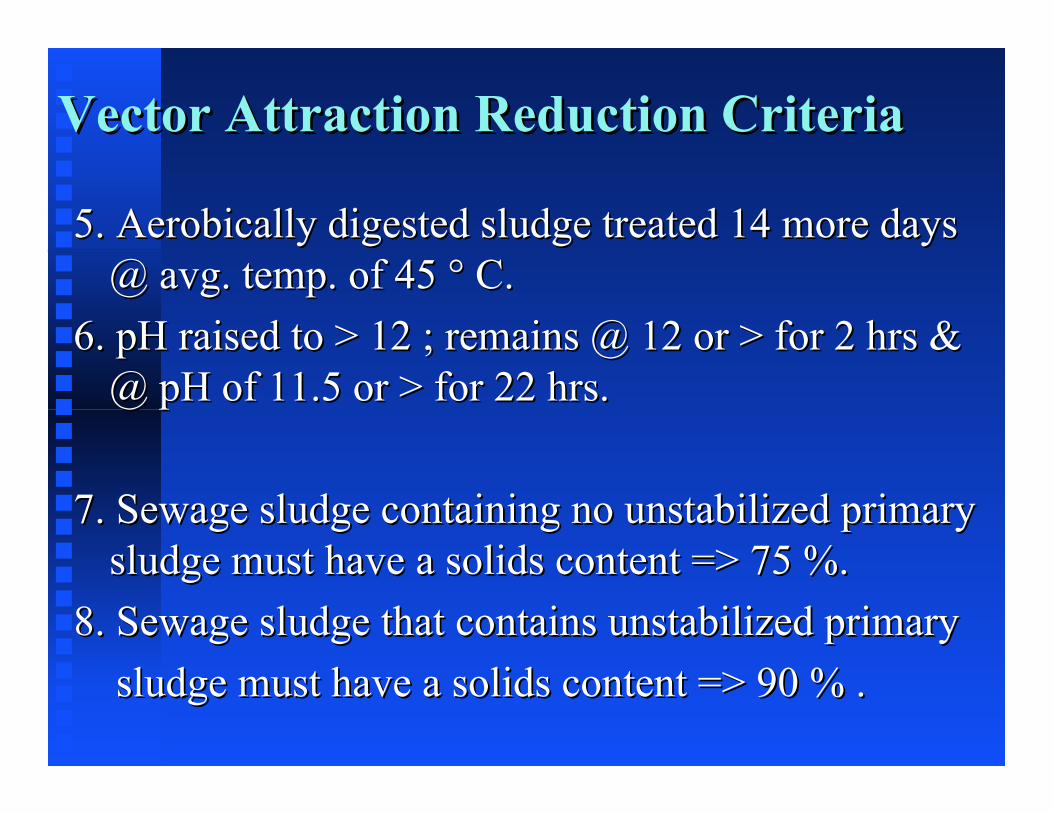
Vector Attraction Reduction CriteriaVector Attraction Reduction Criteria
5. Aerobically digested sludge treated 14 more days5. Aerobically digested sludge treated 14 more days@ @ avgavg. temp. of 45 ° C.. temp. of 45 ° C.
6. pH raised to > 12 ; remains @ 12 or > for 2 hrs &6. pH raised to > 12 ; remains @ 12 or > for 2 hrs &@ pH of 11.5 or > for 22 hrs.@ pH of 11.5 or > for 22 hrs.
7. Sewage sludge containing no unstabilized primary7. Sewage sludge containing no unstabilized primarysludge must have a solids content => 75 %.sludge must have a solids content => 75 %.
8. Sewage sludge that contains unstabilized primary8. Sewage sludge that contains unstabilized primary sludge must have a solids content => 90 % . sludge must have a solids content => 90 % .
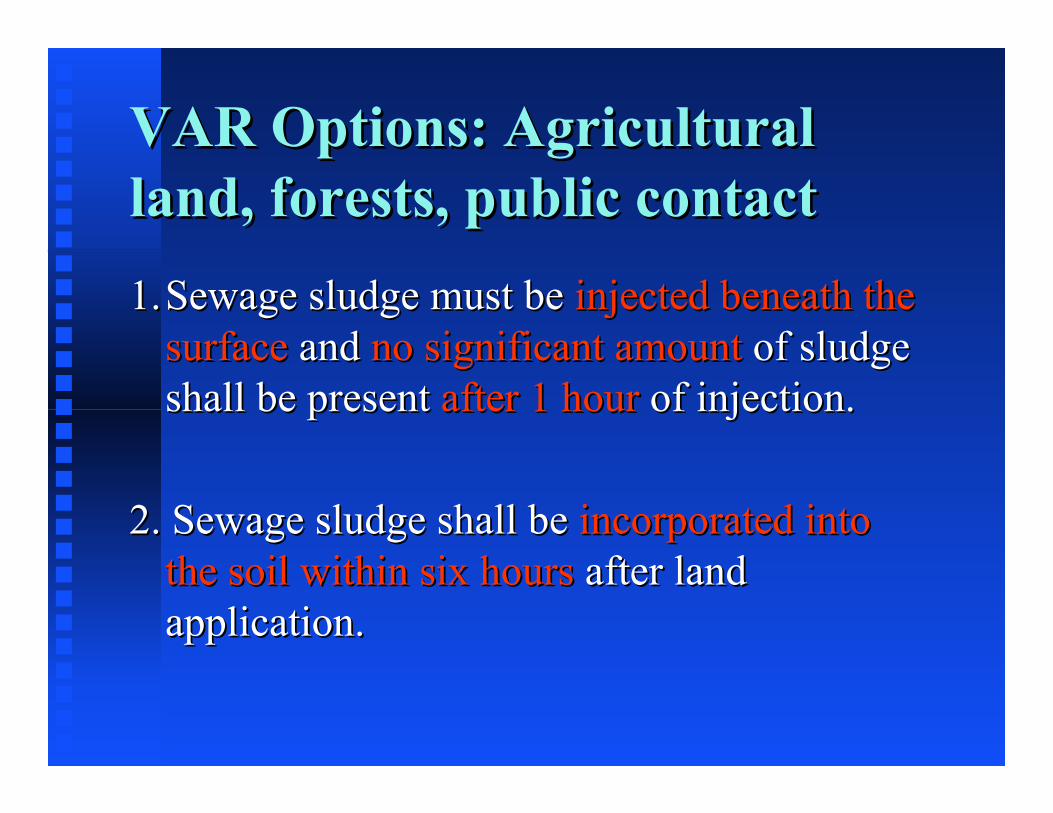
VAR Options: Agriculturalland, forests, public contactVAR Options: Agriculturalland, forests, public contact1.1. Sewage sludge must be Sewage sludge must be injected beneath theinjected beneath the
surfacesurface and and no significant amountno significant amount of sludge of sludgeshall be present shall be present after 1 hourafter 1 hour of injection. of injection.
2. Sewage sludge shall be 2. Sewage sludge shall be incorporated intoincorporated intothe soil within six hoursthe soil within six hours after land after landapplication.application.
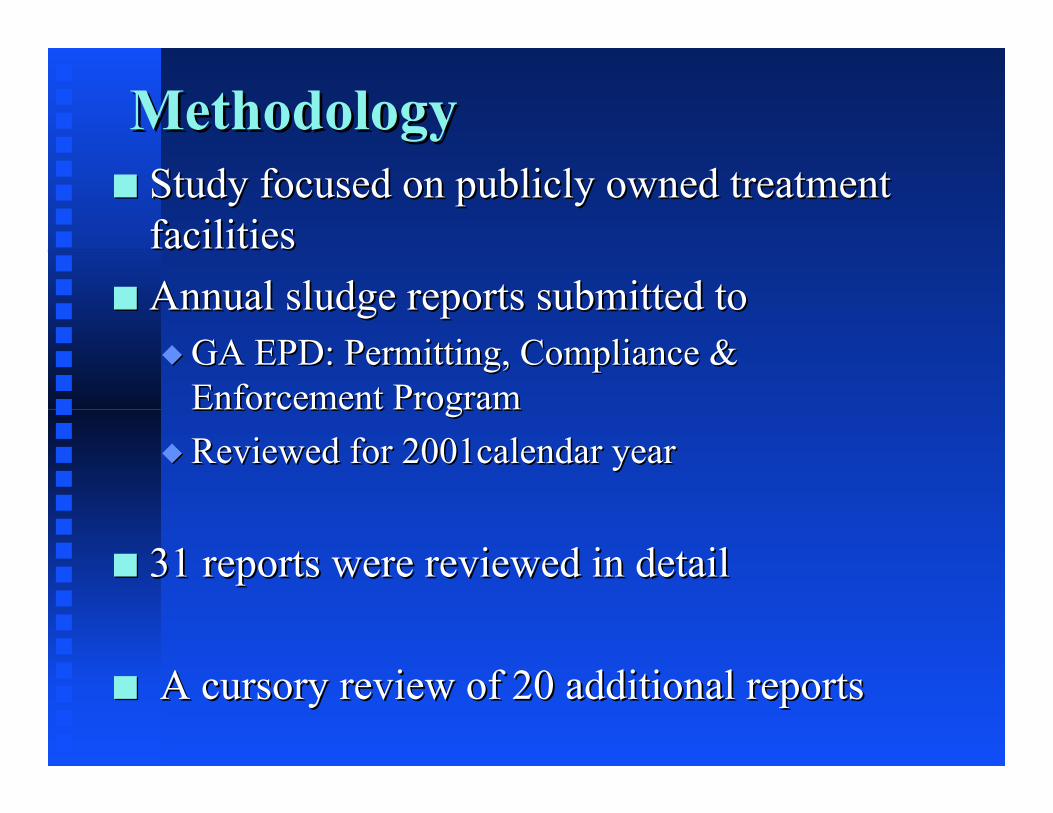
MethodologyMethodologyStudy focused on publicly owned treatmentStudy focused on publicly owned treatmentfacilitiesfacilitiesAnnual sludge reports submitted toAnnual sludge reports submitted to
GA EPD: Permitting, Compliance &GA EPD: Permitting, Compliance &Enforcement ProgramEnforcement ProgramReviewed for 2001calendar yearReviewed for 2001calendar year
31 reports were reviewed in detail31 reports were reviewed in detail
A cursory review of 20 additional reports A cursory review of 20 additional reports
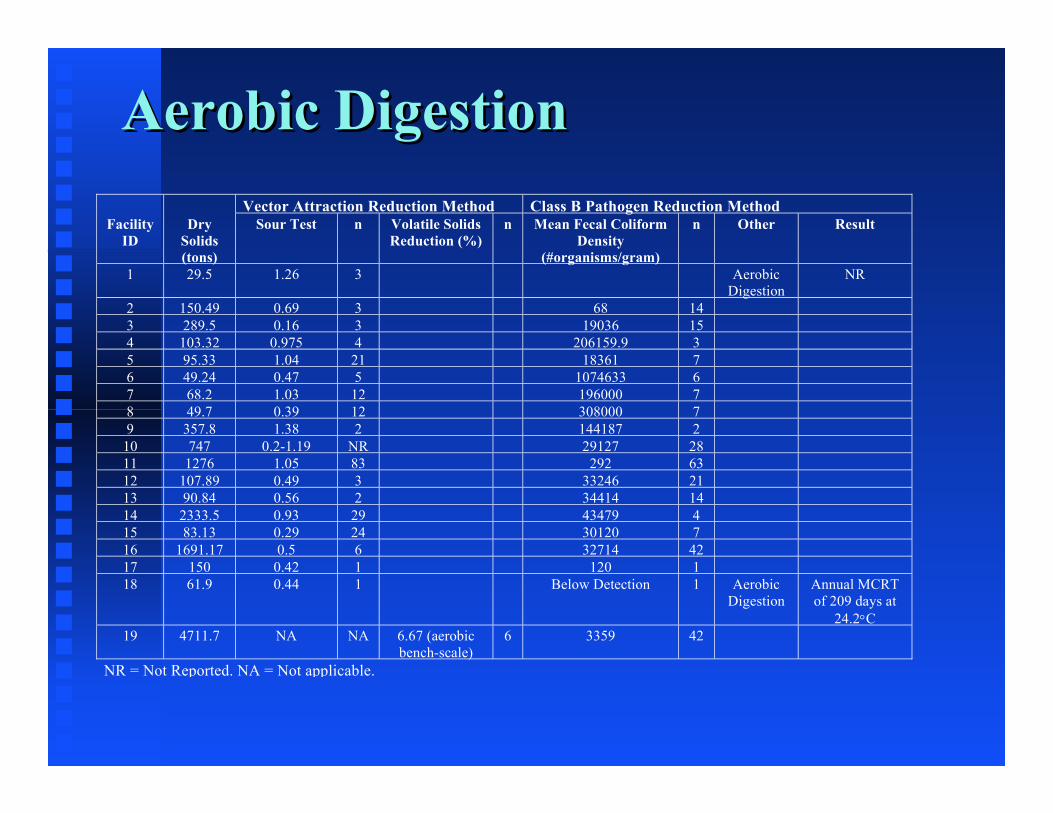
Aerobic DigestionAerobic DigestionVector Attraction Reduction Method Class B Pathogen Reduction Method
FacilityID
DrySolids(tons)
Sour Test n Volatile SolidsReduction (%)
n Mean Fecal ColiformDensity
(#organisms/gram)
n Other Result
1 29.5 1.26 3 AerobicDigestion
NR
2 150.49 0.69 3 68 143 289.5 0.16 3 19036 154 103.32 0.975 4 206159.9 35 95.33 1.04 21 18361 76 49.24 0.47 5 1074633 67 68.2 1.03 12 196000 78 49.7 0.39 12 308000 79 357.8 1.38 2 144187 2
10 747 0.2-1.19 NR 29127 2811 1276 1.05 83 292 6312 107.89 0.49 3 33246 2113 90.84 0.56 2 34414 1414 2333.5 0.93 29 43479 415 83.13 0.29 24 30120 716 1691.17 0.5 6 32714 4217 150 0.42 1 120 118 61.9 0.44 1 Below Detection 1 Aerobic
DigestionAnnual MCRTof 209 days at
24.2°C19 4711.7 NA NA 6.67 (aerobic
bench-scale)6 3359 42
NR = Not Reported. NA = Not applicable.
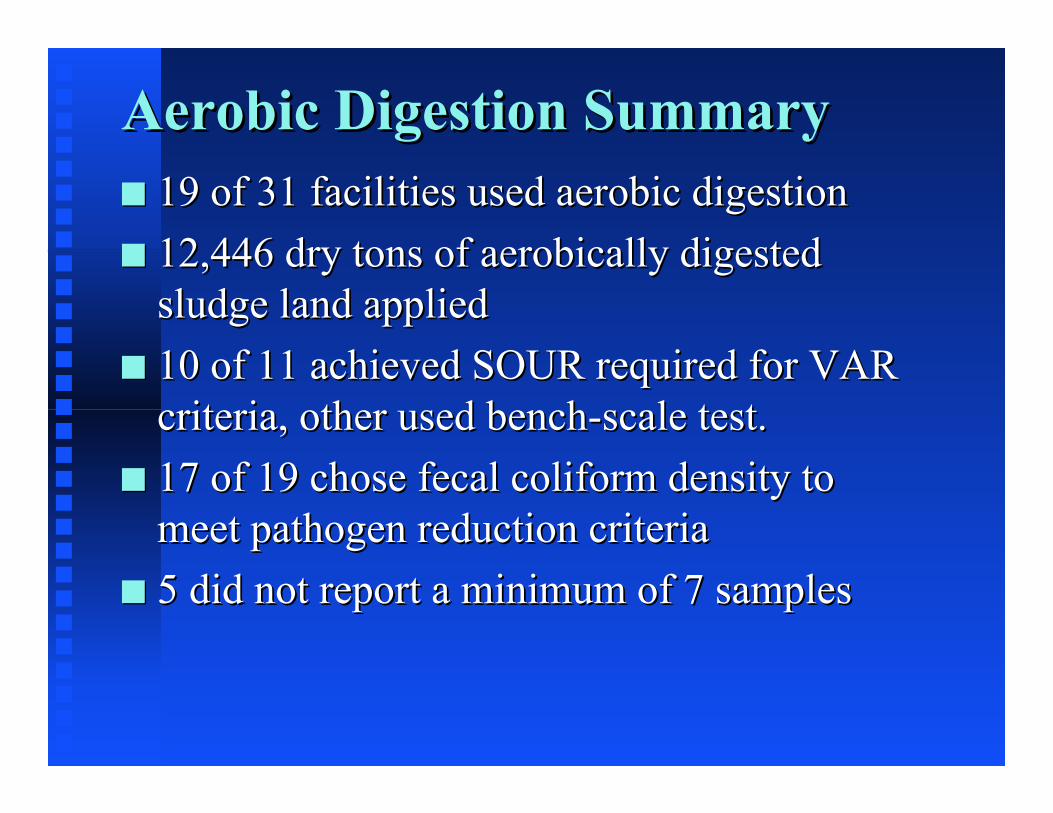
Aerobic Digestion SummaryAerobic Digestion Summary19 of 31 facilities used aerobic digestion19 of 31 facilities used aerobic digestion12,446 dry tons of aerobically digested12,446 dry tons of aerobically digestedsludge land appliedsludge land applied10 of 11 achieved SOUR required for VAR10 of 11 achieved SOUR required for VARcriteria, other used bench-scale test.criteria, other used bench-scale test.17 of 19 chose fecal coliform density to17 of 19 chose fecal coliform density tomeet pathogen reduction criteriameet pathogen reduction criteria5 did not report a minimum of 7 samples5 did not report a minimum of 7 samples

Lime StabilizationLime Stabilization
Vector Attraction ReductionMethod
Pathogen Reduction Method
FacilityID
SludgeTreatment
DrySolids(tons)
Other Mean FecalColiform Density
(#organisms/gram)
n Other Result
20 LimeStabilization
23.19 Lime Stabilization 26165 2 LimeStabilization
21 LimeStabilization
7.88 Lime Stabilization 33000 1 LimeStabilization
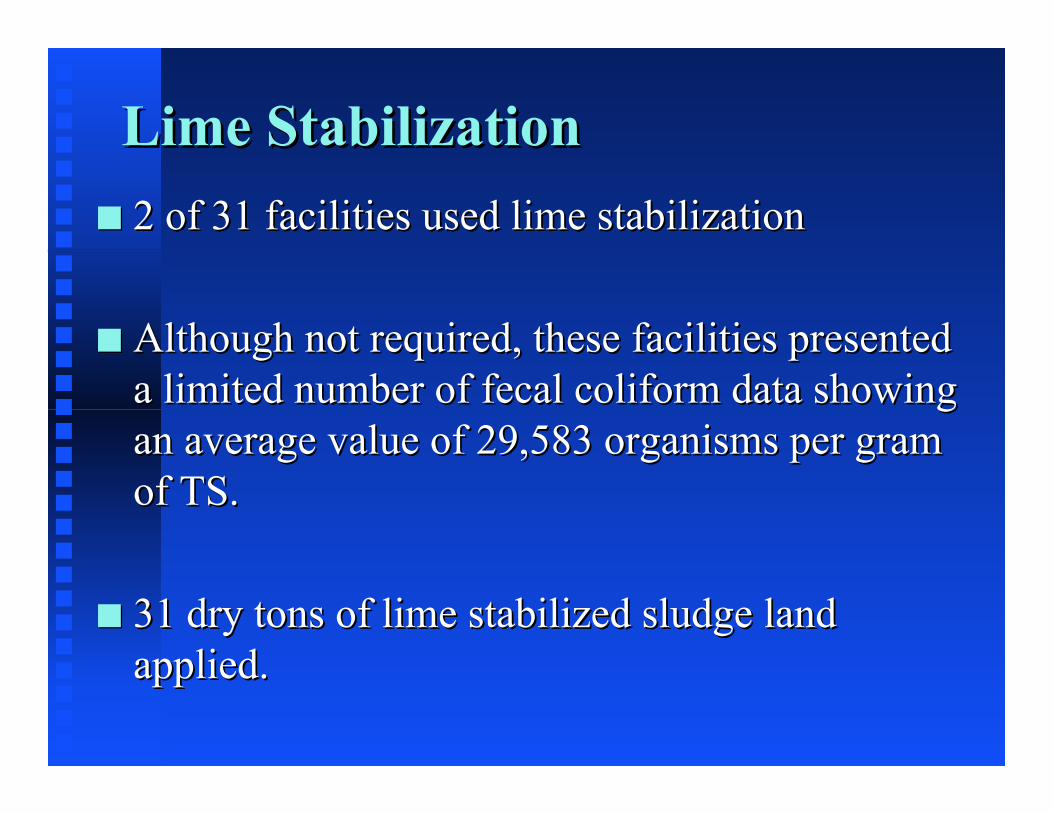
Lime StabilizationLime Stabilization2 of 31 facilities used lime stabilization2 of 31 facilities used lime stabilization
Although not required, these facilities presentedAlthough not required, these facilities presenteda limited number of fecal coliform data showinga limited number of fecal coliform data showingan average value of 29,583 organisms per graman average value of 29,583 organisms per gramof TS.of TS.
31 dry tons of lime stabilized sludge land31 dry tons of lime stabilized sludge landapplied.applied.
Anaerobic DigestionAnaerobic DigestionVector Attraction Reduction
MethodPathogen Reduction Method
FacilityID
SludgeTreatment
DrySolids(tons)
Volatile SolidsReduction (%)
n Other Mean FecalColiform Density
(#organisms/gram)
n Other Result
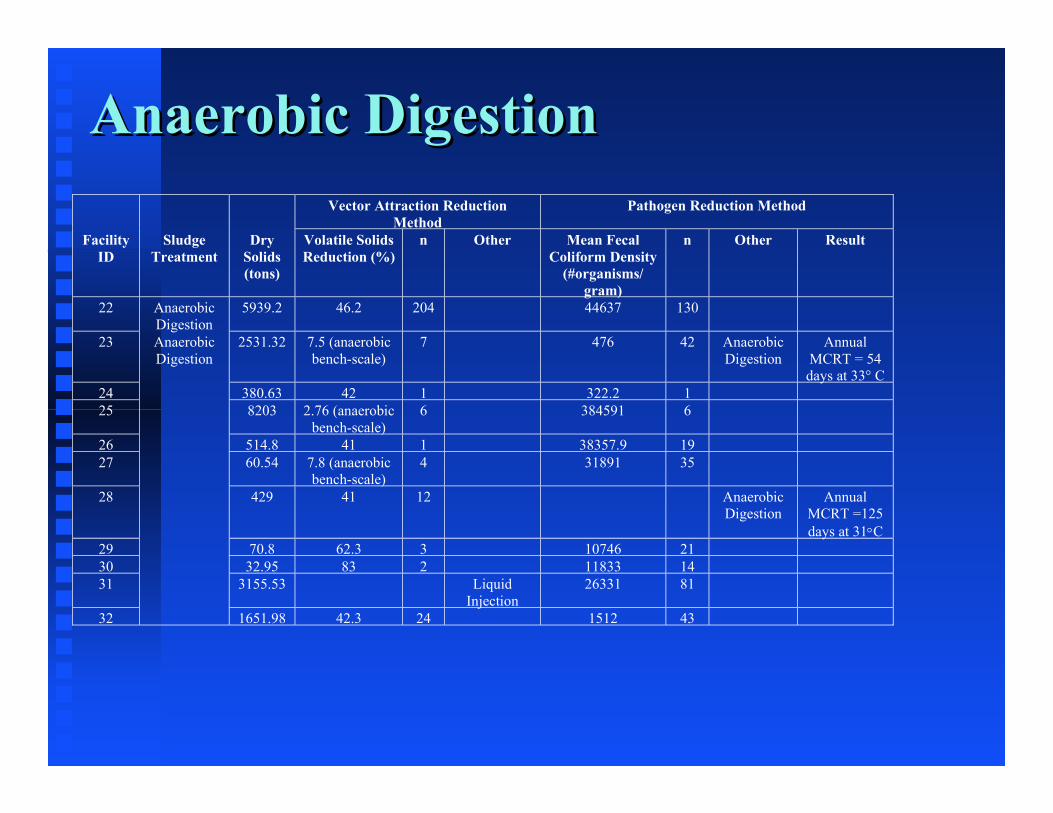
22 AnaerobicDigestion
5939.2 46.2 204 44637 130
23 AnaerobicDigestion
2531.32 7.5 (anaerobicbench-scale)
7 476 42 AnaerobicDigestion
AnnualMCRT = 54days at 33° C
24 380.63 42 1 322.2 125 8203 2.76 (anaerobic
bench-scale)6 384591 6
26 514.8 41 1 38357.9 1927 60.54 7.8 (anaerobic
bench-scale)4 31891 35
28 429 41 12 AnaerobicDigestion
AnnualMCRT =125days at 31°C
29 70.8 62.3 3 10746 2130 32.95 83 2 11833 1431 3155.53 Liquid
Injection26331 81
32 1651.98 42.3 24 1512 43
Anaerobic DigestionAnaerobic Digestion
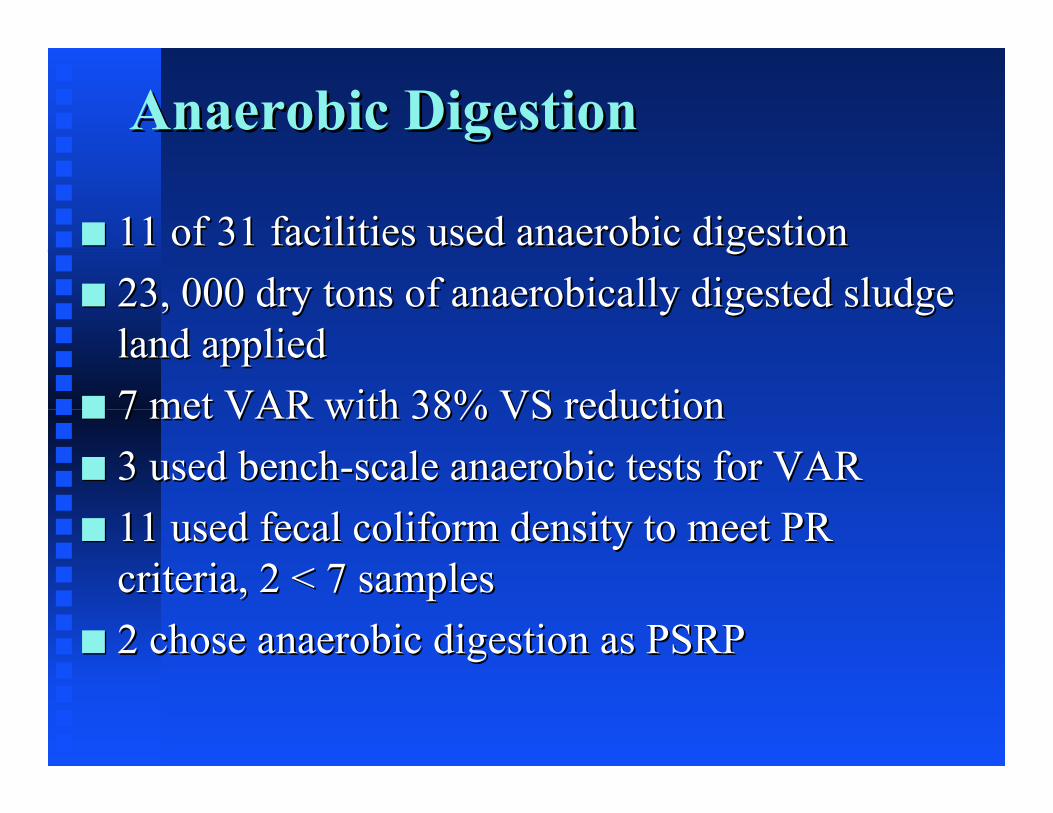
11 of 31 facilities used anaerobic digestion11 of 31 facilities used anaerobic digestion23, 000 dry tons of anaerobically digested sludge23, 000 dry tons of anaerobically digested sludgeland appliedland applied7 met VAR with 38% VS reduction7 met VAR with 38% VS reduction3 used bench-scale anaerobic tests for VAR3 used bench-scale anaerobic tests for VAR11 used fecal coliform density to meet PR11 used fecal coliform density to meet PRcriteria, 2 < 7 samplescriteria, 2 < 7 samples2 chose anaerobic digestion as PSRP2 chose anaerobic digestion as PSRP
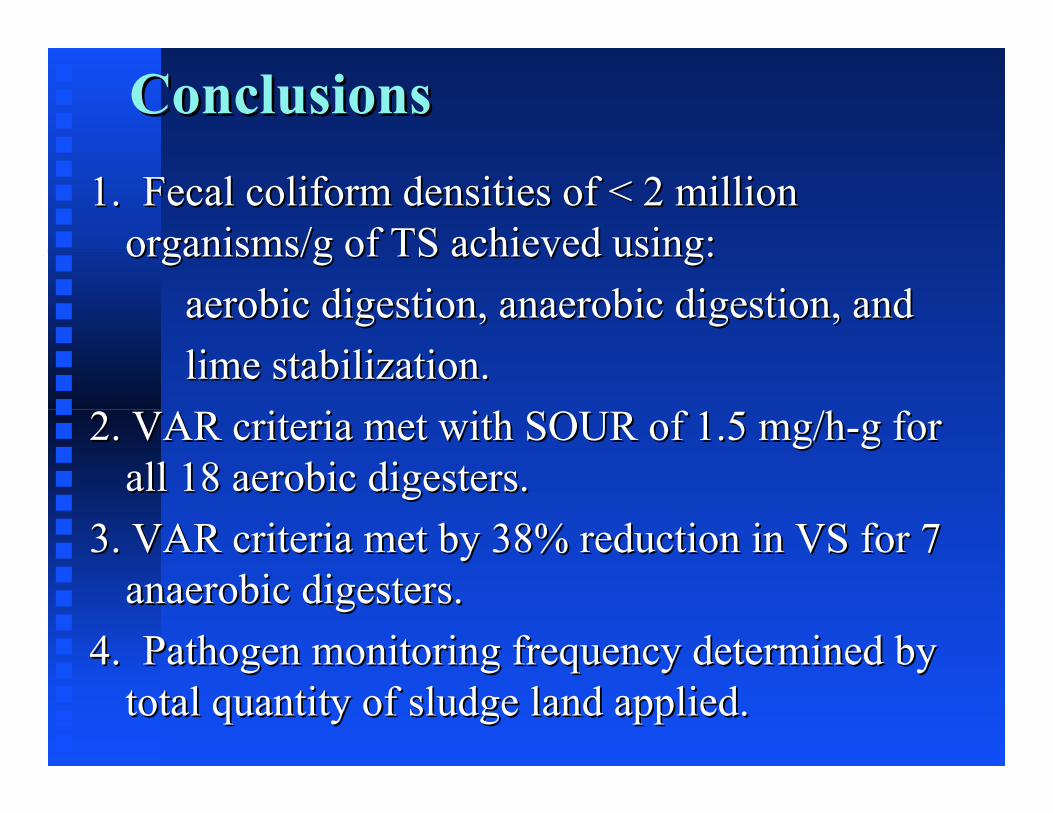
ConclusionsConclusions1. Fecal coliform densities of < 2 million1. Fecal coliform densities of < 2 million
organisms/g of TS achieved using:organisms/g of TS achieved using:aerobic digestion, anaerobic digestion, andaerobic digestion, anaerobic digestion, andlime stabilization.lime stabilization.
2. VAR criteria met with SOUR of 1.5 mg/h-g for2. VAR criteria met with SOUR of 1.5 mg/h-g forall 18 aerobic digesters.all 18 aerobic digesters.
3. VAR criteria met by 38% reduction in VS for 73. VAR criteria met by 38% reduction in VS for 7anaerobic digesters.anaerobic digesters.
4. Pathogen monitoring frequency determined by4. Pathogen monitoring frequency determined bytotal quantity of sludge land applied.total quantity of sludge land applied.
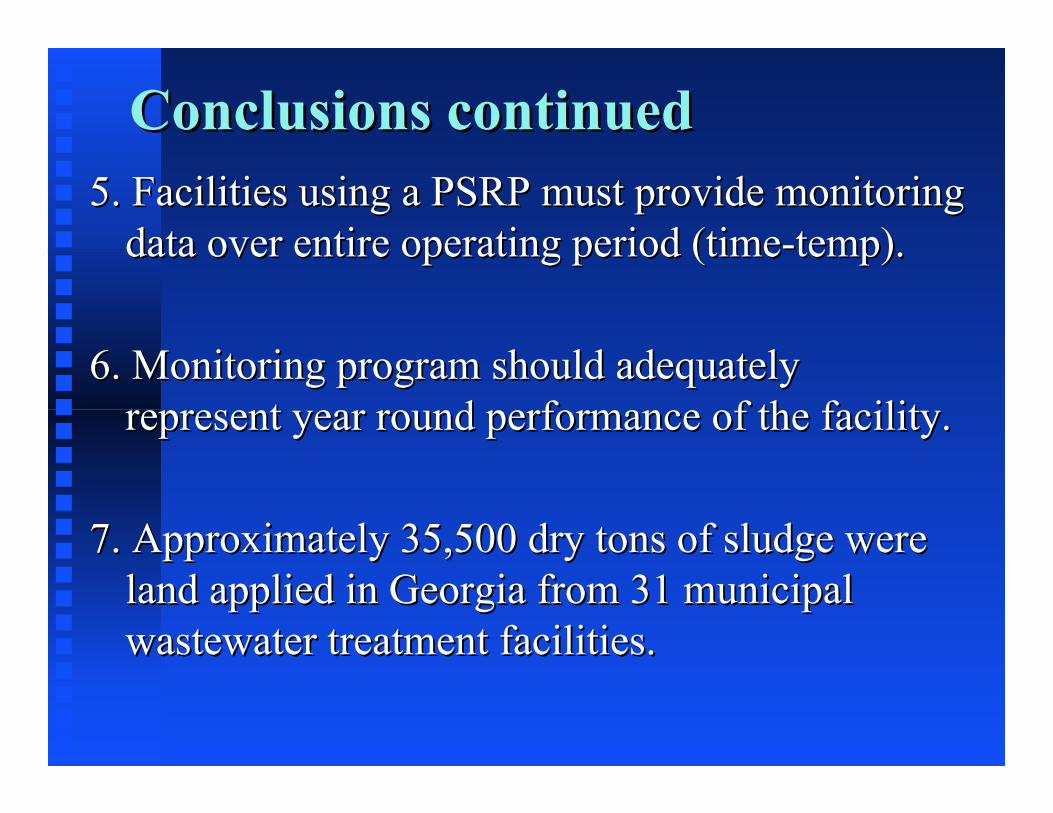
Conclusions continuedConclusions continued5. Facilities using a PSRP must provide monitoring5. Facilities using a PSRP must provide monitoring
data over entire operating period (time-temp).data over entire operating period (time-temp).
6. Monitoring program should adequately6. Monitoring program should adequatelyrepresent year round performance of the facility.represent year round performance of the facility.
7. Approximately 35,500 dry tons of sludge were7. Approximately 35,500 dry tons of sludge wereland applied in Georgia from 31 municipalland applied in Georgia from 31 municipalwastewater treatment facilities.wastewater treatment facilities.
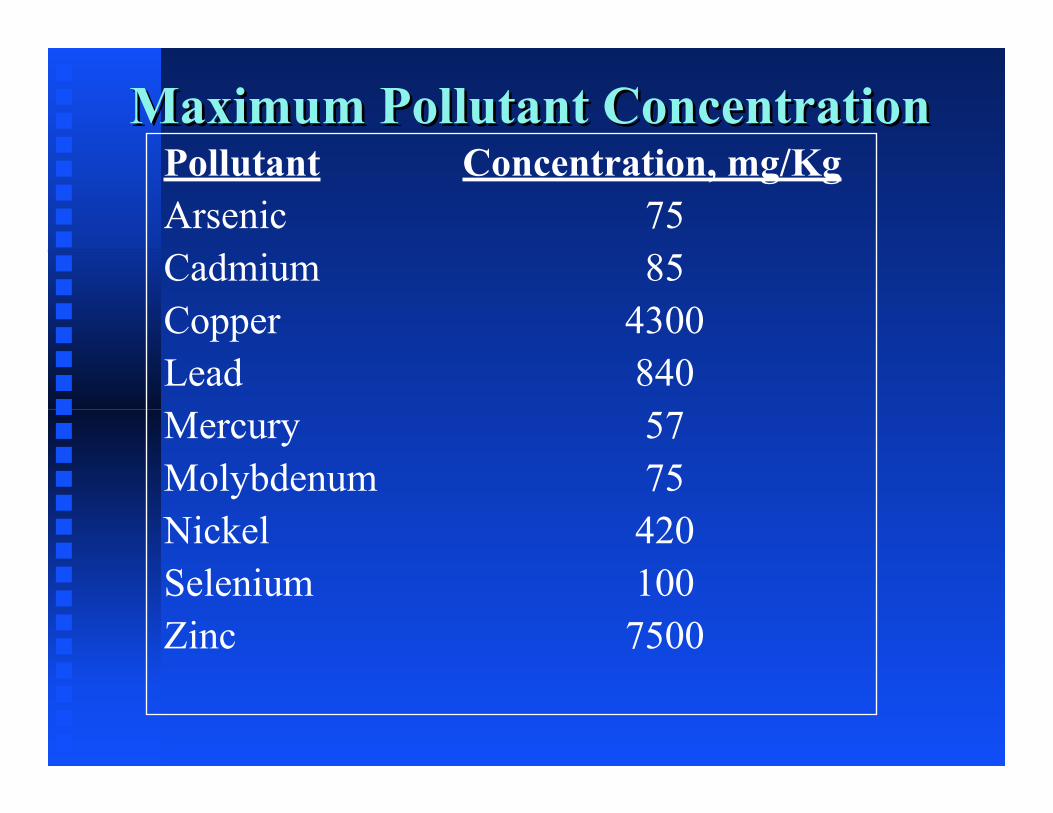
Maximum Pollutant ConcentrationMaximum Pollutant ConcentrationPollutant Concentration, mg/Kg Arsenic 75Cadmium 85Copper 4300Lead 840Mercury 57Molybdenum 75Nickel 420Selenium 100Zinc 7500

Monthly AVG Pollutant ConcentrationMonthly AVG Pollutant ConcentrationPollutant Concentration, mg/Kg Arsenic 41Cadmium 39Copper 1500Lead 300Mercury 17Nickel 420Selenium 100Zinc 2800
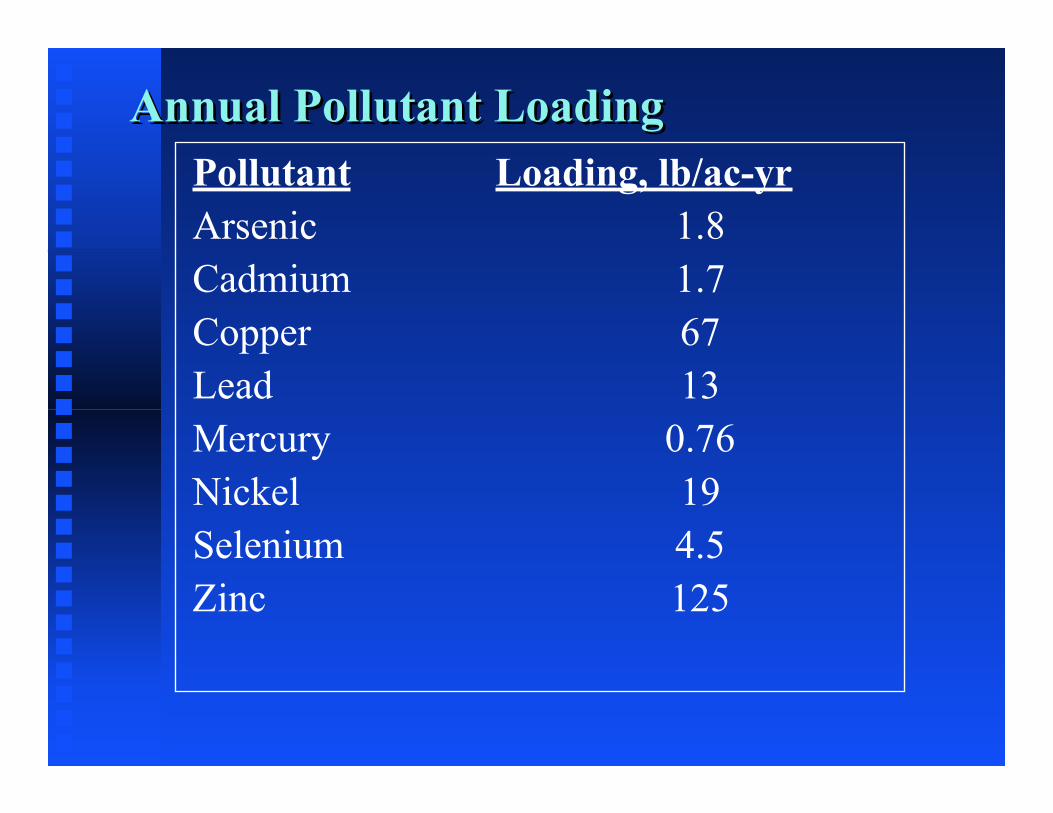
Annual Pollutant LoadingAnnual Pollutant LoadingPollutant Loading, lb/ac-yr Arsenic 1.8Cadmium 1.7Copper 67Lead 13Mercury 0.76Nickel 19Selenium 4.5Zinc 125
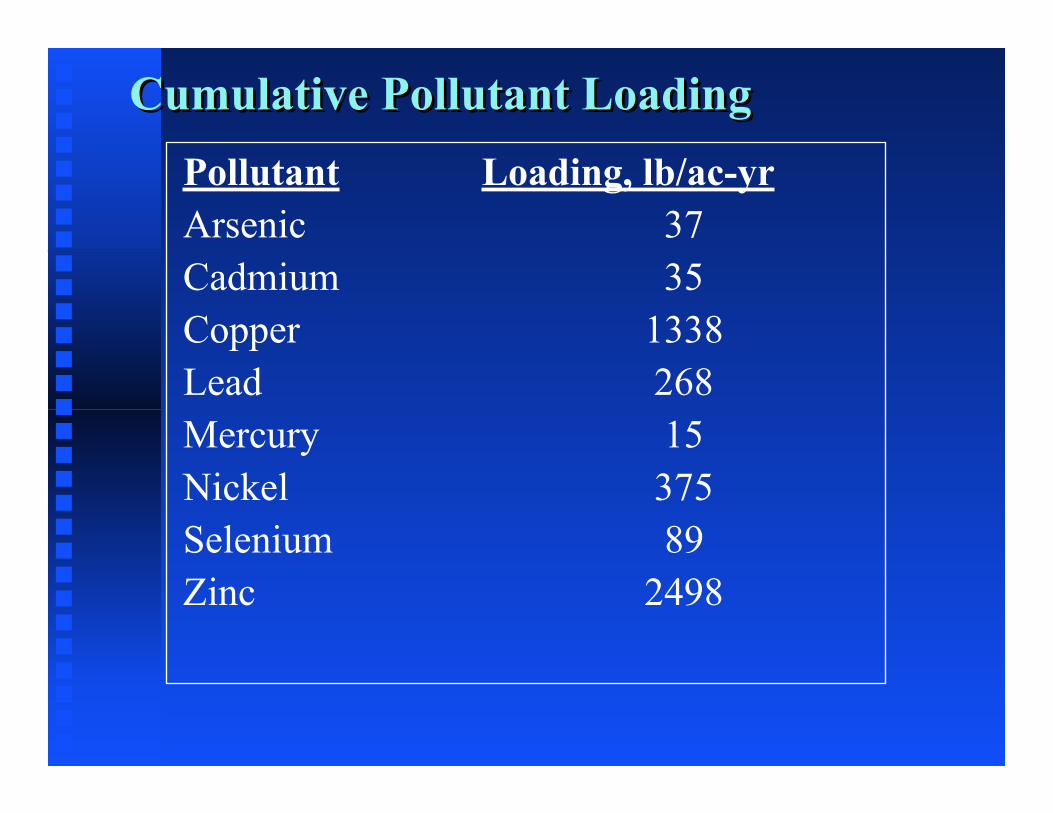
Cumulative Pollutant LoadingCumulative Pollutant LoadingPollutant Loading, lb/ac-yr Arsenic 37Cadmium 35Copper 1338Lead 268Mercury 15Nickel 375Selenium 89Zinc 2498