are tobacco taxes really...
TRANSCRIPT
Are Tobacco Taxes Really Regressive? Evidence from Chile.
ARE TOBACCO TAXESREALLY REGRESSIVE?E V I D E N C E F R O M C H I L E
Alan FuchsFrancisco Meneses
Pub
lic D
iscl
osur
e A
utho
rized
Pub
lic D
iscl
osur
e A
utho
rized
Pub
lic D
iscl
osur
e A
utho
rized
Pub
lic D
iscl
osur
e A
utho
rized

2
3
Are Tobacco Taxes Really Regressive?Evidence from Chile
Alan Fuchs and Franciso Meneses1
Summary Report1
Abstract
Tobacco Taxes are deemed regressive as poorest families tend to allocate larger shares of their budget to purchase tobacco. However, as taxes also discourage tobacco use, some of the most adverse effects, including higher medical expenses, lower life expectancy at birth, added years of disability among smokers, and reductions in the quality of life, among other, would be reduced. This paper describes and simulates the effects of the tobacco tax on incomes in Chile assuming three different price-elasticity scenarios for different income deciles of the population. Results show that although price increase for tobacco through higher taxes generates negative income variations across all groups in a population, under a more comprehensive scenario that includes benefits through lower medical expenses and an increase in working years, the results invert, and the overall monetary effect of the taxation policy becomes positive. Moreover, the reduction in medical expenses seems to be the main driver of the increase in net incomes because of the reduction in tobacco-related problems that require expensive treatments. Lastly, as the distributional effects of tobacco taxes are directly related to the long-term price elasticities of tobacco consumption, it would be advisable a coordination between taxation and behavioral change policies across income groups. (JEL Codes: H23, H31, I18, O15)
1 *Fuchs: The World Bank, Poverty and Equity Global Practice, 1818 H Street NW, I 4-405, Washington, DC 20433 (email: [email protected]); **Meneses, Duke University (email: [email protected]). Support for the preparation of this report was provided by World Bank’s Global Tobacco Control Program, co-financed by the Bill and Melinda Gates Foundation and Bloomberg Foundation. We are grateful to Oscar Calvo-Gonzalez, Patricio Marquez, Blanca Moreno-Dodson, Gabriela Inchauste, Jasmin Chakeri, Sheila Dutta, Enrique Fanta and Lidia Ceriani for providing comments and support to this paper. The findings, interpretations and conclusions in this research note are entirely those of the authors. They do not necessarily represent the view of the World Bank Group, its Executive Directors, or the countries they represent.

4
5
Are Tobacco Taxes Really Regressive? Evidence from Chile.
1. Introduction
In April 2014, the government of Chile proposed a large-scale tax reform, the most significant in 30 years. Among the main changes were tax increases on tobacco, alcohol, and sugared beverages. Because low-income families usually allocate a larger proportion of their budgets to tobacco, as well as alcohol and sugary beverages, at first sight the tax increase would seem to be a regressive policy. However, a closer look shows that the tax increase and resulting reduction in consumption would lower the adverse effects of tobacco consumption, including higher medical expenses, the negative effect on life expectancy at birth, added years of disability among smokers, reductions in the quality of life, and a list of negative externalities among first- and secondhand smokers. The increase in tobacco tax and the subsequent reduction of tobacco consumption could therefore result in potential measurable benefits for tobacco consumers. This paper describes and quantifies the effects of the tobacco tax on incomes through three factors: (1) the tobacco price increase, (2) the reduction in medical expenses, and (3) the rise in revenues because of the gain in years of employment. To estimate the impact of these effects, the paper makes various assumptions about the price-elasticity of tobacco and calculates the income gains among various population income groups.
During the last 15 years, the prevalence of tobacco consumption has been falling around the world, and Chile is no exception (WHO 2015a).2 According to the Drug Consumption Survey in Chile, monthly tobacco consumption has decreased from 43.6 percent of the adult
population in 1992 to 34.7 percent today3. These consumption reductions could relate to policy measures implemented in Chile during the last decade such as education, taxes, warning labels, and advertising bans. Public anti-tobacco policies in Chile are in line with the global trend: at least 40 percent of countries have implemented mechanisms to reduce tobacco consumption during the last two years (WHO 2015a).
There is ample and robust evidence linking tobacco consumption with health-related problems (Doll and Hill 1956; Wynder and Graham 1950). Diseases associated with tobacco use range from lung cancer to stroke and even to congenital malformations in children (HHS 2014.) In 2010, 5 million early deaths were attributed to tobacco consumption globally, and, in Chile, the Ministry of Health estimates that 18.5 percent of annual deaths may be attributable to tobacco use (Jha and Peto 2014; Pichón-Riviere et al. 2014). Scientific evidence linking tobacco and health problems triggered important policy shifts among international organizations and policy makers alike, leading to more rigorous normative frameworks on the sale and use of tobacco.
Today, more than 80 percent of the world’s smokers live in low and middle income countries; harming health, incomes, earning potential, labor productivity, and undermining human capital accumulation – a critical factor for sustainable economic growth and social development (WHO 2015). The United Nations (UN) has set the health and wellbeing as one of their priority goals. Similarly, the World Health Organization (WHO) has set the reduction of tobacco consumption as one of its primary goals. It has thus promoted
2 Between 1970 and 2000, tobacco production and consumption showed steady growth around the world. This trend started to change with the reduction of consumption in the developed countries and increases in the developing world, particularly China (WHO 2015b). Tobacco prevalence has decreased, but because of population growth, total consumption has increased (Ng et al. 2014).3 Prevalence of monthly tobacco consumption. National survey of drugs in the general population 2014. (Estudio nacional de drogas en la población general) SENDA, Ministry of Interior and Public Safety.
6
tobacco monitoring, smoke-free policies, smoking-cessation support programs, relevant health advice, advisory deterrents, and taxation policies (WHO 2015a). Among strategies, the tobacco tax seems to be one of the most efficient measures to reduce tobacco consumption and increase government revenue (World Bank 1999). The inelastic demand of some tobacco consumers is useful for increasing tax revenues; and the higher price elasticity of younger smokers makes the tax an effective consumption deterrent (Chaloupka et al. 2002; Debrott Sánchez 2006).
A recurrent concern about tobacco tax policies relates to potential negative income inequality effects, as there is a common believe that these tend to affect the poor more disproportionately. Because low-income households allocate larger shares of their incomes to consumption and, among expenditures, to purchase tobacco, indirect taxes tend to affect their monthly budgets disproportionately more than the budgets of more well off households. Therefore, tobacco taxes directly affect low-income individuals more, compared with other income groups and other taxes. Nonetheless, if indirect effects are considered, the concern about tobacco tax policies no longer holds. Indeed, it has been shown that the future benefits of nonsmoking outweigh the losses attributed to tobacco taxes among the population in general and, specifically, low-income groups (Denisova and Kuznetsova 2014; Verguet et al. 2015). Still, there is no evidence that these trends are occurring in Chile.
During the past two decades, several anti-tobacco measures have been implemented in Chile, including tax increases, advertisement regulations, and smoke-free public spaces. Although the policy effort has been substantial, Chile still has one of the highest tobacco consumption rates in Latin
America (WHO 2015a). In 2006, Chile enacted the Anti-Tobacco Law, which includes restrictions on tobacco advertising, a prohibition on selling cigarettes to students or close to schools, advertising the risks of tobacco consumption and of exposure to tobacco smoke, and designated smoking areas in restaurants, casinos, or nightclubs (IDB 2011). Some of these policies have been strengthen further in subsequent normative updates.
The government of Chile raised the ad valorem tobacco tax to 62.3 percent and the fixed tax to US$0.16 per package of 20 cigarettes to finance the reconstruction of the areas affected by the earthquake in February 2010 (IDB 2011).4 The change meant that Chile had one of the highest tributary loads for tobacco in the Americas (Pichón-Riviere et al. 2014). The 2014 Tax Reform reduced the ad valorem tax to 30 percent and substantially increased the fixed tax to Ch$681 (US$1.28) per 20-cigarette pack.
Beyond short-term changes in tobacco expenditures, the possible benefits of these policies included lower medical expenditures and more years of healthy life, both of which could translate into private monetary benefits that more than offset the losses generated by tax increases. To test these hypotheses, we use a social welfare framework to calculate the effects on various income groups and assume different price-elasticities for tobacco consumption. To establish a contextual background, section 2 briefly reviews the literature on the health effects of tobacco, tobacco policies, and tobacco price elasticities. Section 3 describes the methodology, parameters, and data used to forecast the impact of the tobacco tax. Section 4 presents the estimation results, and Section 5 concludes with a discussion on implications and policy implications.
4 This represents 0.0000675 unidad tributaria mensual (monthly tax units), a tax unit that is monthly defined. The exchange rate was US$1.00 = Ch$670.
Are Tobacco Taxes Really Regressive? Evidence from Chile.
7
2. Literature
There is extensive literature analyzing the health effects of tobacco, public policies, and price elasticities on the international level, but there is surprisingly little evidence on Chile.
a. Tobacco and healthIn the 20th century, about 100 million deaths were potentially related to tobacco use (Peto and Lopez 2004). If current trends were to remain constant, about 1 billion people could die from tobacco-related diseases during this century (Jha and Peto 2014). In Chile, over 92,000 children and more than 4 million adults consume tobacco every day (Tobacco Atlas 2010). Moreover, according to the Chilean Ministry of Health tobacco caused more than 16,000 deaths in 2013 (nearly 1 in 5 annual deaths). The same year, almost 8,000 Chileans were diagnosed with cancers related to tobacco consumption.
The relation between tobacco consumption and health problems has been extensively researched since the 1950s (Doll and Hill 1956; Wynder and Graham 1950). According to the U.S. Department of Health and Human Services, the conclusion that tobacco consumption is responsible has been reached in many studies of cancer, including lung cancer, oral cancer, laryngeal cancer, pancreatic cancer, kidney cancer, cervical cancer, and acute myeloid leukemia (HHS 2004).
Active smoking is associated with respiratory problems such as tuberculosis, chronic respiratory symptoms, influenza, pneumonia, infections, chronic bronchitis, emphysema, and asthma. It is also associated with cardiovascular diseases, such as aneurysms, strokes, and coronary heart disease, as well as adverse reproductive and developmental effects, such as congenital
malformations in babies, male sexual dysfunction, low birth weights and complications in pregnancy (HHS 2004, 2014). The exposure to secondhand smoke has a causal relationship with many respiratory diseases in children. There are more than 4 thousand chemicals in tobacco smoke (of which at least 250 are harmful and more than 50 cause cancer). Although the evidence to infer a relation between secondhand smoke and cancer or its impact on reproduction is not clear, some research points in this direction (HHS 2004, 2014). Moreover, according to the World Health Organization, second hand smoke is responsible for over 600 thousand premature deaths.
b. Tobacco policiesGlobally, anti-tobacco policies range from separating smokers in particular locations from completely smoke-free environments to advertising to deter tobacco use, prohibitions on tobacco sales close to schools, and taxation and smoking cessation programs. Although various approaches have been assessed, they show diverse effects in tobacco use and exposure among the population.
WHO (2015a) argues that entirely smoke-free environments, rather than separate smoking rooms or good ventilation systems, are the only way to prevent the harmful consequences of secondhand tobacco smoke. Smoke-free laws are popular because there is evidence showing they not only improve health outcomes, but do not affect business. In 2014, these laws benefited 18 percent of the world's population, and Chile was one of five countries that had implemented a smoke-free law covering all public places and all workplaces (WHO 2015a).5 The benefits depended on the breadth of the legislation. For example, prohibiting smoking in all indoor workplaces reduced the exposure to secondhand smoke by
5 In 2014, 1.3 billion people (18 percent of the world's population in 49 countries) were covered at the most comprehensive level of smoke-free policies, an increase of about 200 million people since 2012 (WHO 2015a).
8
80–90 percent and decreased the incidence of acute respiratory illness (IARC 2009). However, the impact of smoke-free policies on consumption is small compared with taxation. Levy et al. (2012) estimate that the vast reduction in tobacco use in Brazil was mostly caused by higher tobacco prices (46 percent of the impact) and smoke-free policies (14 percent).
In 2014, about 15 percent of the world's population had access to smoking cessation support programs, 2 percent more than in 2012.6 These programs represent the fifth most widespread policy in the world (WHO 2015a). They significantly raise quit rates among smokers who want to quit (Fiore and the Guideline Panel 2008). They are more cost-effective relative to with other health care programs (Cromwell et al. 1997). Even though they are an effective way to quit, they consider only the group of addicted individuals who want to be treated. Their provision is also associated with country income, and they are widely concentrated in high-income countries.
Another way to discourage tobacco consumption is through health warning labeling on tobacco packages. This is the third most common policy against cigarettes in the world. In 2014, almost 20 percent of the world’s population was being exposed to such labeling. Warning labels are widely supported by the public and must be redesigned regularly to maintain their impact. They may not represent a cost to governments (WHO 2015a). The use of warnings may influence people against tobacco consumption; however, their use would account for only a marginal decrease (Borland 1997; Fathelrahman et al. 2009; Levy et al. 2012).
Mass media campaigns that reach large populations represent the most massive way to combat tobacco use. In 2014, such campaigns covered 55 percent of the world's population. People in low-income countries are less likely to be exposed to campaigns, and there is also limited information about the cost-effectiveness of this approach (WHO 2015a). Durkin, Brennan, and Wakefield (2011) conclude that mass media prevention programs could promote quitting. The impact depends on the duration of the campaigns, especially among low-income smokers. It also depends on the message; information about the adverse health risks of smoking are the most efficient means to reach users.
c. Tobacco taxesAlthough media campaigns are cost-effective, tobacco taxation is considered one of the most efficient measures for reducing tobacco consumption; as a second-level benefit, they also increase government revenue (World Bank 1999)7. Because both effects are desirable from a policy standpoint, the use of taxes is economically justified on the externalities caused by tobacco. The higher price elasticity of young people makes taxes a good way to fight tobacco. Chile is one of the countries covered by higher tobacco taxes (WHO 2015a).
Institutions such as IDB (2010), WHO (2008), The International Agency for Cancer Research (IARC, 2011), and the World Bank (1999) and authors such as Levy et al. (2014) have associated price increases with significant declines in tobacco consumption. They estimate that higher taxes are responsible for almost 50 percent of the decline in smoking. The effects of these policies
6 Smoking cessation support programs are implemented in 24 countries and cover 1.1 billion people (WHO 2015a).7 Tobacco tax increases have also been associated with the increase of contraband and illegal tobacco sales, reducing the expected increase in government revenue. (Jha, P., & Chaloupka, F. J. (2000))
9
Are Tobacco Taxes Really Regressive? Evidence from Chile.
mainly depend on the type of taxes. Ad valorem taxes consider a portion of the price; so tobacco companies have the opportunity to avoid higher taxes by setting lower prices. For this reason, the levels of consumption and the amount of government tax revenue depend on the industry pricing strategy. Alternatively, specific excise taxes establish a fixed tax amount, although they must be adjusted periodically for inflation to accomplish their mission, and they are associated with the risk of encouraging contraband sales (WHO 2015a). The taxation system in Chile considers both types of tobacco taxes: the recent tax increase on tobacco included a reduction in the ad valorem tax and a significant increase in the specific excise tax. These measures are aligned with WHO (2010) best practice recommendations, making almost every cigarette brand in Chile equally costly.
d. The price elasticity of tobacco consumptionThe measurement of price elasticity is crucial in defining and calibrating taxation systems because it determines the sensitivity of demand to a change in tobacco prices. In general, tax increases generate more impact on tobacco consumption in low- and middle-income countries than in high-income countries (WHO 2015a).
There is an extensive literature defining the relationship between tobacco prices and consumption. Guindon (2013) provides a broad review of 26 international studies. Chaloupka and Grossman (1996) and Lewit and Coate (1981) estimate the elasticity among under-18-year-olds in the United States at values of −1.44 and −1.31, respectively. Among adults ages 18 years and older, Chaloupka (1991) and Lewit and Coate (1981) estimate the elasticity in the United States at between −0.27 and −0.42. For Latin America, Guindon, Paraje, and Chaloupka (2015) analyze 32 studies and conclude that the price elasticity is likely to be below −0.5. Carvalho and Lobão
(1998) and Iglesias and Nicolau (2006) calculate the short-run price elasticity in Brazil, and Ramos and Curti (2006) do same in Uruguay. The results in both countries range between −0.2 and −0.6. In Argentina and Mexico, the estimations are slightly lower. Gonzáles Rozada and Rodríguez-Iglesias (2013) and Olivera-Chávez et al. (2010) calculate a short-term price elasticity at between −0.10 and −0.30. Debrott Sánchez (2006) estimates a general price elasticity in Chile of −0.21 and calculates that the price elasticity in the short and long term is −0.22 and −0.45, respectively.
Thus, some studies find lower-bound elasticities between −0.1 and −0.3, while other researchers find medium-bound elasticities between −0.3 and −0.6. A third set of studies finds higher-bound elasticities, from −0.6 to −1.5, in particular among younger population groups and low-income countries. A similar classification can be found in China (Hu et al. 2010).
There are two important relationships between tobacco price elasticities, income and age. People from low income groups have shown to have more elastic demands than medium and higher income groups of the population (Jha & Chaloupka 1999). At the same time, young groups of the population are also more responsive to tax increases because they tend to be less affected by addiction, more affected by peer effects and at the same time have less disposable income (Jha & Chaloupka 1999). Studies in United States have consistently shown that younger groups of the population have higher elasticities than older groups (for example, U.S. Centers for Disease Control and Prevention,1998). Chaloupka and Grossman (1996) and Lewit and Coate (1981).
e. Further costs of tobacco: life, work, and medical expensesThe major costs of tobacco consumption beyond the direct price effects are associated with public and private health costs. Tobacco-related health
10
costs are usually considered to be either direct or indirect. Direct costs include the monetary value of the consumption of goods and services motivated and, in many cases, compelled because of tobacco use. These are divided into health care costs (hospitalization, medication, medical supplies, equipment, and so on) and non–health care costs (job replacements for sick smokers, insurance, cleaning up the cigarette ash, stubs, packaging, and smoke residue of smokers, and so on). The indirect costs include the loss of productivity because of lost working days related to smoking illnesses and the value of the lives prematurely lost. Both effects are incorporated in the disability-adjusted life years indicator (WHO 2011).
Focusing on the costs of health systems, Lightwood et al. (2000) estimate the cost of tobacco use. They suggest that the gross health cost in high-income countries fluctuates between 0.1 and 1.0 percent of gross domestic product (GDP). Limited data inhibit accurate estimates on low- and middle-countries, but the authors argue that the price elasticity could be as high as the elasticities in high-income countries. Meanwhile, Verguet et al. (2015) analyze the health effects of a price increase in China. Their research concludes that a 50 percent rise in prices would result in 231 million years of life gained over 50 years, with a significant impact in the lowest income quintile. Pichón-Riviere et al. (2014) estimate that tobacco use in Chile would reduce life expectancy by nearly 4.0 years among women and 4.3 years among men. There would also be about 379 thousand life days lost, which is over a thousand years.8 They estimate the annual direct cost of tobacco-related disease in the Chilean health system is about 0.6 percent of GDP.
8 Days lost refer to years of life lost (YLL) because of premature mortality. Another indicator is years lost because of disability (YLD) among people living with poor health and its consequences. Usually, disability-adjusted life years = YLL + YLD.
Are Tobacco Taxes Really Regressive? Evidence from Chile.
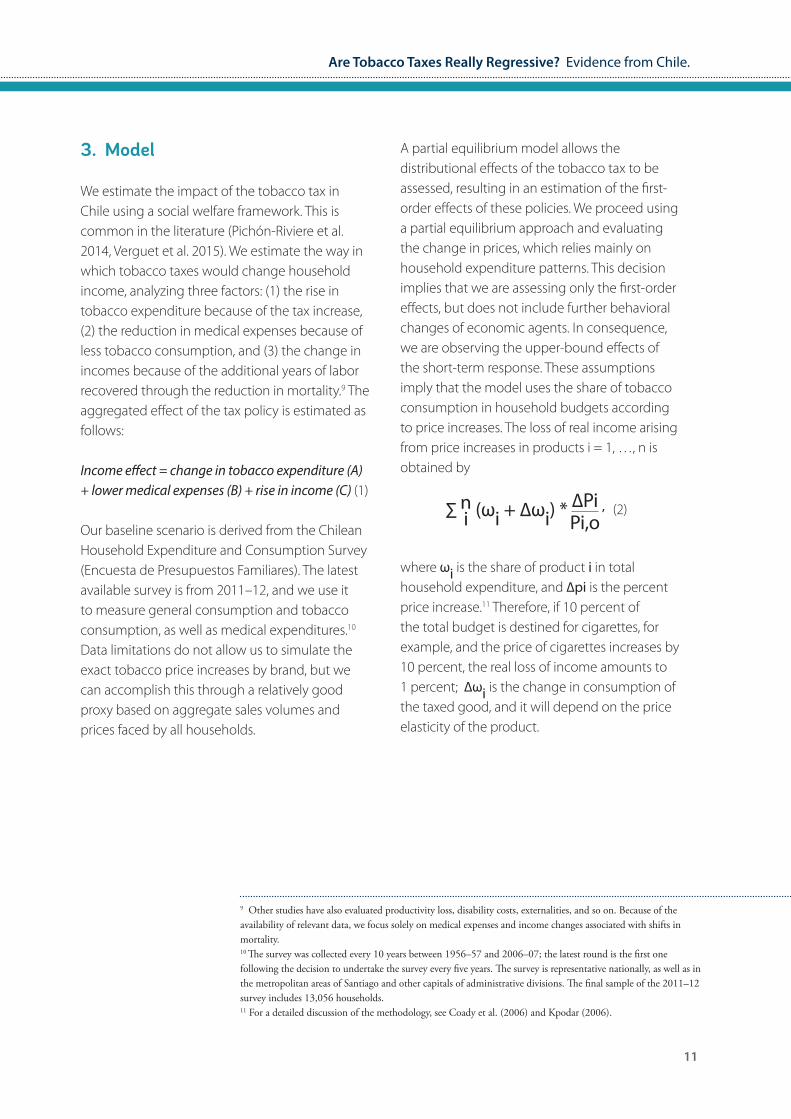
A partial equilibrium model allows the distributional effects of the tobacco tax to be assessed, resulting in an estimation of the first-order effects of these policies. We proceed using a partial equilibrium approach and evaluating the change in prices, which relies mainly on household expenditure patterns. This decision implies that we are assessing only the first-order effects, but does not include further behavioral changes of economic agents. In consequence, we are observing the upper-bound effects of the short-term response. These assumptions imply that the model uses the share of tobacco consumption in household budgets according to price increases. The loss of real income arising from price increases in products i = 1, …, n is obtained by
where ωi is the share of product i in total household expenditure, and ∆pi is the percent price increase.11 Therefore, if 10 percent of the total budget is destined for cigarettes, for example, and the price of cigarettes increases by 10 percent, the real loss of income amounts to 1 percent; ∆ωi is the change in consumption of the taxed good, and it will depend on the price elasticity of the product.
11
3. Model
We estimate the impact of the tobacco tax in Chile using a social welfare framework. This is common in the literature (Pichón-Riviere et al. 2014, Verguet et al. 2015). We estimate the way in which tobacco taxes would change household income, analyzing three factors: (1) the rise in tobacco expenditure because of the tax increase, (2) the reduction in medical expenses because of less tobacco consumption, and (3) the change in incomes because of the additional years of labor recovered through the reduction in mortality.9 The aggregated effect of the tax policy is estimated as follows:
Income effect = change in tobacco expenditure (A) + lower medical expenses (B) + rise in income (C) (1)
Our baseline scenario is derived from the Chilean Household Expenditure and Consumption Survey (Encuesta de Presupuestos Familiares). The latest available survey is from 2011–12, and we use it to measure general consumption and tobacco consumption, as well as medical expenditures.10 Data limitations do not allow us to simulate the exact tobacco price increases by brand, but we can accomplish this through a relatively good proxy based on aggregate sales volumes and prices faced by all households.
9 Other studies have also evaluated productivity loss, disability costs, externalities, and so on. Because of the availability of relevant data, we focus solely on medical expenses and income changes associated with shifts in mortality.10 The survey was collected every 10 years between 1956–57 and 2006–07; the latest round is the first one following the decision to undertake the survey every five years. The survey is representative nationally, as well as in the metropolitan areas of Santiago and other capitals of administrative divisions. The final sample of the 2011–12 survey includes 13,056 households.11 For a detailed discussion of the methodology, see Coady et al. (2006) and Kpodar (2006).
∑ n (ωi + ∆ωi) * ∆Pi ,i Pi,o(2)
12
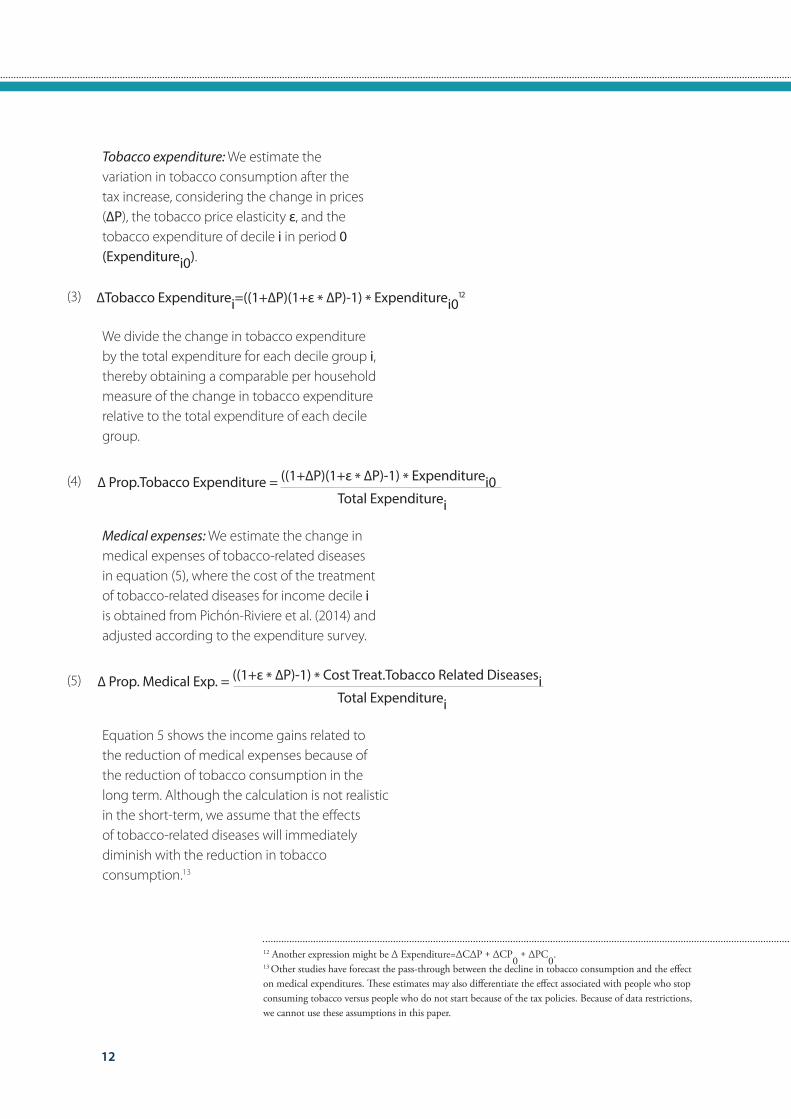
Tobacco expenditure: We estimate the variation in tobacco consumption after the tax increase, considering the change in prices (∆P), the tobacco price elasticity ε, and the tobacco expenditure of decile i in period 0 (Expenditurei0).
We divide the change in tobacco expenditure by the total expenditure for each decile group i, thereby obtaining a comparable per household measure of the change in tobacco expenditure relative to the total expenditure of each decile group.
Medical expenses: We estimate the change in medical expenses of tobacco-related diseases in equation (5), where the cost of the treatment of tobacco-related diseases for income decile i is obtained from Pichón-Riviere et al. (2014) and adjusted according to the expenditure survey.
Equation 5 shows the income gains related to the reduction of medical expenses because of the reduction of tobacco consumption in the long term. Although the calculation is not realistic in the short-term, we assume that the effects of tobacco-related diseases will immediately diminish with the reduction in tobacco consumption.13
∆Tobacco Expenditurei=((1+∆P)(1+ε * ∆P)-1) * Expenditurei012
∆ Prop.Tobacco Expenditure = ((1+∆P)(1+ε * ∆P)-1) * Expenditurei0 Total Expenditurei
(3)
(4)
(5) ∆ Prop. Medical Exp. = ((1+ε * ∆P)-1) * Cost Treat.Tobacco Related Diseasesi Total Expenditurei
12 Another expression might be ∆ Expenditure=∆C∆P + ∆CP0 + ∆PC0.
13 Other studies have forecast the pass-through between the decline in tobacco consumption and the effect on medical expenditures. These estimates may also differentiate the effect associated with people who stop consuming tobacco versus people who do not start because of the tax policies. Because of data restrictions, we cannot use these assumptions in this paper.
13
Are Tobacco Taxes Really Regressive? Evidence from Chile.
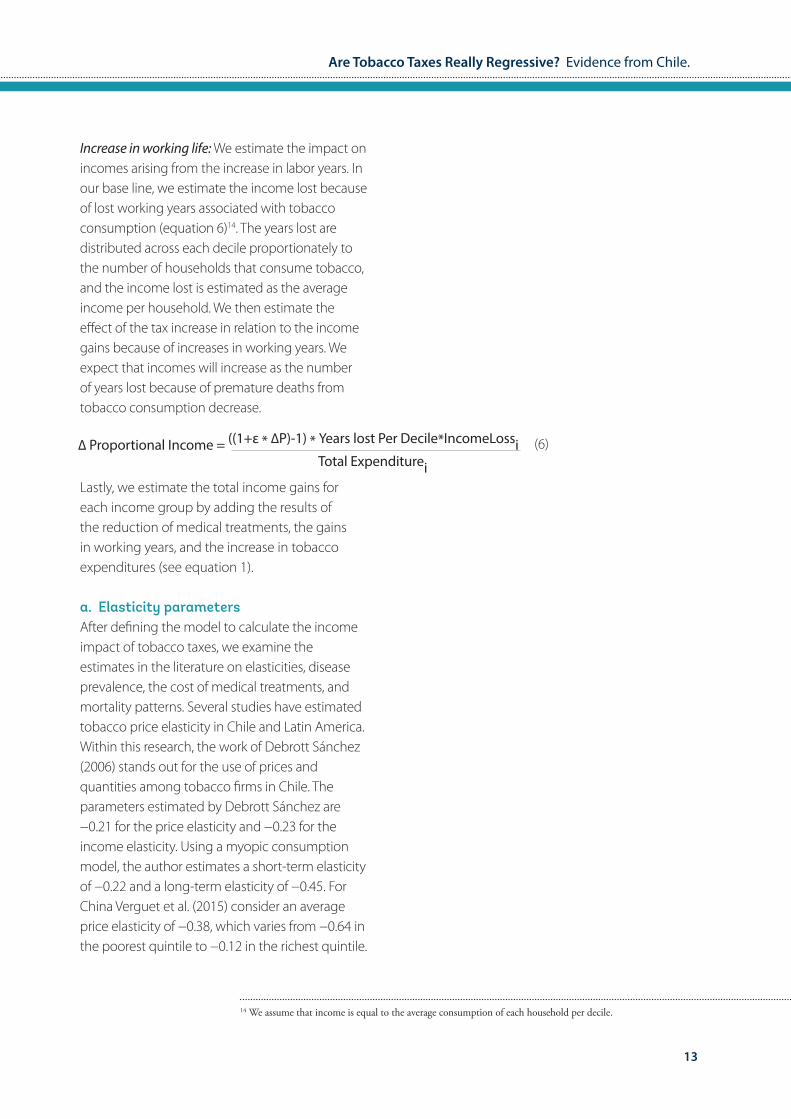
Increase in working life: We estimate the impact on incomes arising from the increase in labor years. In our base line, we estimate the income lost because of lost working years associated with tobacco consumption (equation 6)14. The years lost are distributed across each decile proportionately to the number of households that consume tobacco, and the income lost is estimated as the average income per household. We then estimate the effect of the tax increase in relation to the income gains because of increases in working years. We expect that incomes will increase as the number of years lost because of premature deaths from tobacco consumption decrease.
Lastly, we estimate the total income gains for each income group by adding the results of the reduction of medical treatments, the gains in working years, and the increase in tobacco expenditures (see equation 1).
a. Elasticity parametersAfter defining the model to calculate the income impact of tobacco taxes, we examine the estimates in the literature on elasticities, disease prevalence, the cost of medical treatments, and mortality patterns. Several studies have estimated tobacco price elasticity in Chile and Latin America. Within this research, the work of Debrott Sánchez (2006) stands out for the use of prices and quantities among tobacco firms in Chile. The parameters estimated by Debrott Sánchez are −0.21 for the price elasticity and −0.23 for the income elasticity. Using a myopic consumption model, the author estimates a short-term elasticity of −0.22 and a long-term elasticity of −0.45. For China Verguet et al. (2015) consider an average price elasticity of −0.38, which varies from −0.64 in the poorest quintile to −0.12 in the richest quintile.
(6)∆ Proportional Income = ((1+ε * ∆P)-1) * Years lost Per Decile*IncomeLossi Total Expenditurei
14 We assume that income is equal to the average consumption of each household per decile.
14
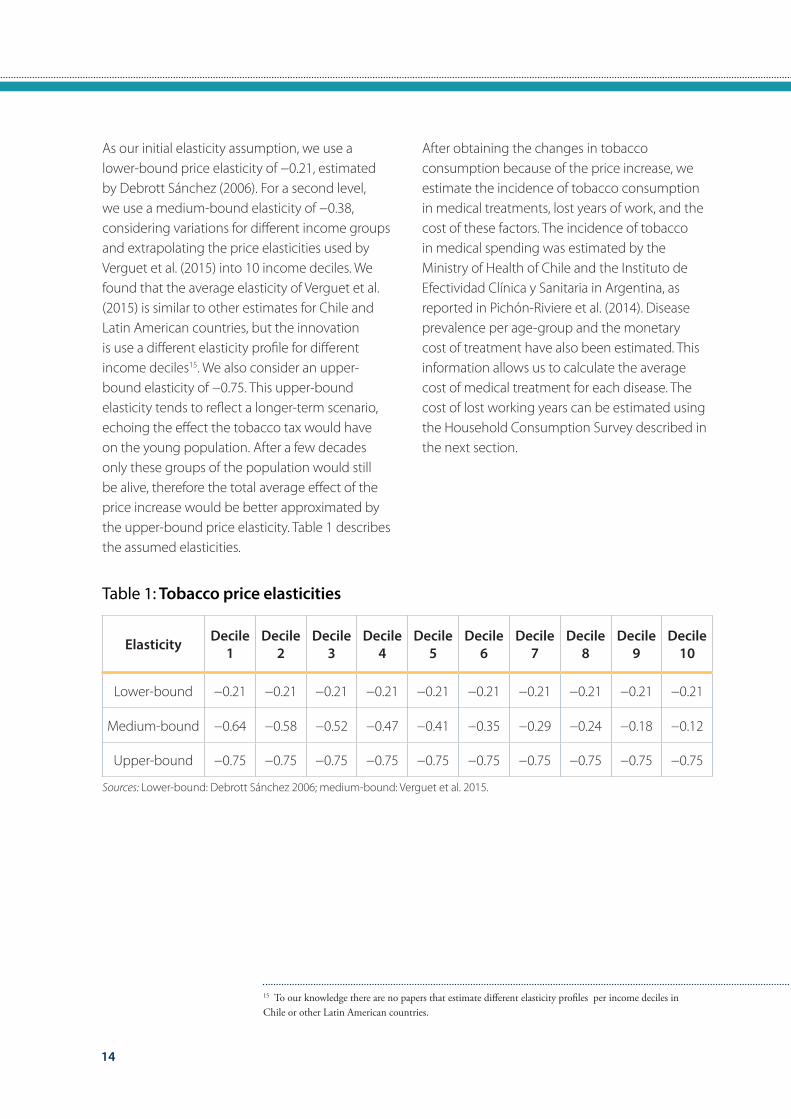
As our initial elasticity assumption, we use a lower-bound price elasticity of −0.21, estimated by Debrott Sánchez (2006). For a second level, we use a medium-bound elasticity of −0.38, considering variations for different income groups and extrapolating the price elasticities used by Verguet et al. (2015) into 10 income deciles. We found that the average elasticity of Verguet et al. (2015) is similar to other estimates for Chile and Latin American countries, but the innovation is use a different elasticity profile for different income deciles15. We also consider an upper-bound elasticity of −0.75. This upper-bound elasticity tends to reflect a longer-term scenario, echoing the effect the tobacco tax would have on the young population. After a few decades only these groups of the population would still be alive, therefore the total average effect of the price increase would be better approximated by the upper-bound price elasticity. Table 1 describes the assumed elasticities.
Elasticity Decile 1
Decile 2
Decile 3
Decile 4
Decile 5
Decile 6
Decile 7
Decile 8
Decile 9
Decile 10
Lower-bound −0.21 −0.21 −0.21 −0.21 −0.21 −0.21 −0.21 −0.21 −0.21 −0.21
Medium-bound −0.64 −0.58 −0.52 −0.47 −0.41 −0.35 −0.29 −0.24 −0.18 −0.12
Upper-bound −0.75 −0.75 −0.75 −0.75 −0.75 −0.75 −0.75 −0.75 −0.75 −0.75
Table 1: Tobacco price elasticities
After obtaining the changes in tobacco consumption because of the price increase, we estimate the incidence of tobacco consumption in medical treatments, lost years of work, and the cost of these factors. The incidence of tobacco in medical spending was estimated by the Ministry of Health of Chile and the Instituto de Efectividad Clínica y Sanitaria in Argentina, as reported in Pichón-Riviere et al. (2014). Disease prevalence per age-group and the monetary cost of treatment have also been estimated. This information allows us to calculate the average cost of medical treatment for each disease. The cost of lost working years can be estimated using the Household Consumption Survey described in the next section.
15 To our knowledge there are no papers that estimate different elasticity profiles per income deciles in Chile or other Latin American countries.
Sources: Lower-bound: Debrott Sánchez 2006; medium-bound: Verguet et al. 2015.
15
Are Tobacco Taxes Really Regressive? Evidence from Chile.
Elasticity Decile 1
Decile 2
Decile 3
Decile 4
Decile 5
Decile 6
Decile 7
Decile 8
Decile 9
Decile 10
Lower-bound −0.21 −0.21 −0.21 −0.21 −0.21 −0.21 −0.21 −0.21 −0.21 −0.21
Medium-bound −0.64 −0.58 −0.52 −0.47 −0.41 −0.35 −0.29 −0.24 −0.18 −0.12
Upper-bound −0.75 −0.75 −0.75 −0.75 −0.75 −0.75 −0.75 −0.75 −0.75 −0.75
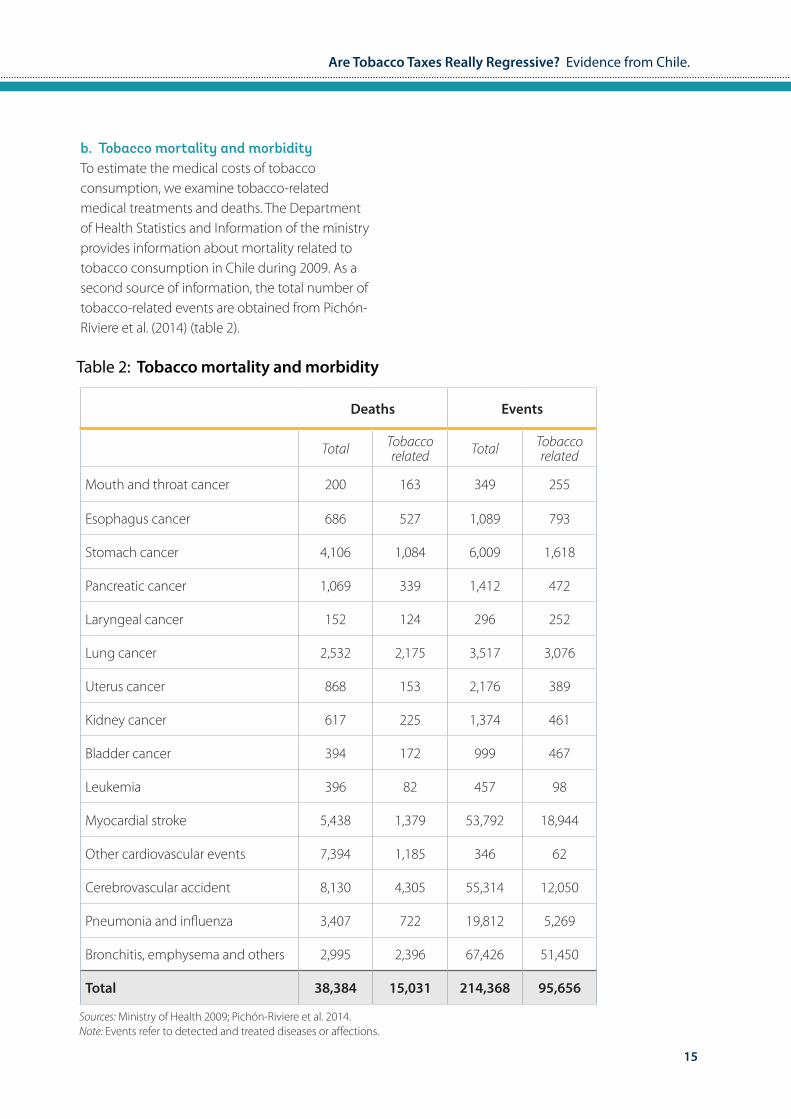
b. Tobacco mortality and morbidityTo estimate the medical costs of tobacco consumption, we examine tobacco-related medical treatments and deaths. The Department of Health Statistics and Information of the ministry provides information about mortality related to tobacco consumption in Chile during 2009. As a second source of information, the total number of tobacco-related events are obtained from Pichón-Riviere et al. (2014) (table 2).
Deaths Events
Total Tobacco related Total Tobacco
related
Mouth and throat cancer 200 163 349 255
Esophagus cancer 686 527 1,089 793
Stomach cancer 4,106 1,084 6,009 1,618
Pancreatic cancer 1,069 339 1,412 472
Laryngeal cancer 152 124 296 252
Lung cancer 2,532 2,175 3,517 3,076
Uterus cancer 868 153 2,176 389
Kidney cancer 617 225 1,374 461
Bladder cancer 394 172 999 467
Leukemia 396 82 457 98
Myocardial stroke 5,438 1,379 53,792 18,944
Other cardiovascular events 7,394 1,185 346 62
Cerebrovascular accident 8,130 4,305 55,314 12,050
Pneumonia and influenza 3,407 722 19,812 5,269
Bronchitis, emphysema and others 2,995 2,396 67,426 51,450
Total 38,384 15,031 214,368 95,656
Table 2: Tobacco mortality and morbidity
Sources: Ministry of Health 2009; Pichón-Riviere et al. 2014.Note: Events refer to detected and treated diseases or affections.
16
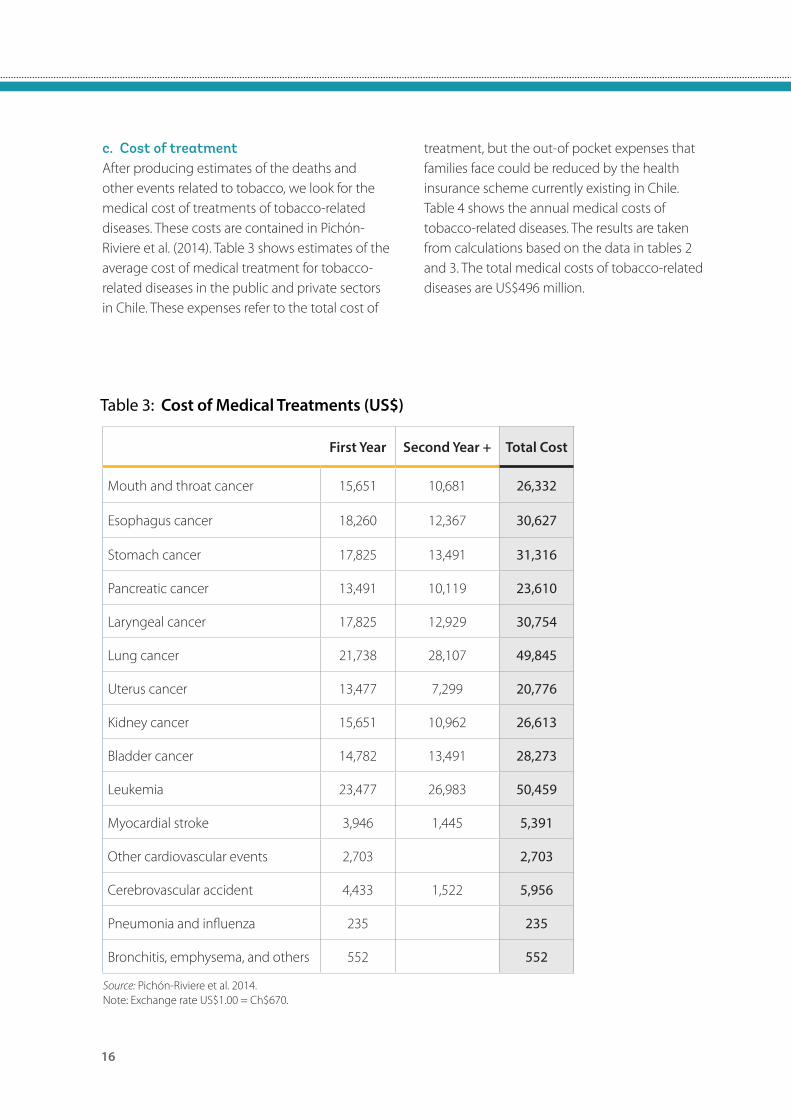
c. Cost of treatmentAfter producing estimates of the deaths and other events related to tobacco, we look for the medical cost of treatments of tobacco-related diseases. These costs are contained in Pichón-Riviere et al. (2014). Table 3 shows estimates of the average cost of medical treatment for tobacco-related diseases in the public and private sectors in Chile. These expenses refer to the total cost of
First Year Second Year + Total Cost
Mouth and throat cancer 15,651 10,681 26,332
Esophagus cancer 18,260 12,367 30,627
Stomach cancer 17,825 13,491 31,316
Pancreatic cancer 13,491 10,119 23,610
Laryngeal cancer 17,825 12,929 30,754
Lung cancer 21,738 28,107 49,845
Uterus cancer 13,477 7,299 20,776
Kidney cancer 15,651 10,962 26,613
Bladder cancer 14,782 13,491 28,273
Leukemia 23,477 26,983 50,459
Myocardial stroke 3,946 1,445 5,391
Other cardiovascular events 2,703 2,703
Cerebrovascular accident 4,433 1,522 5,956
Pneumonia and influenza 235 235
Bronchitis, emphysema, and others 552 552
Table 3: Cost of Medical Treatments (US$)
Source: Pichón-Riviere et al. 2014.Note: Exchange rate US$1.00 = Ch$670.
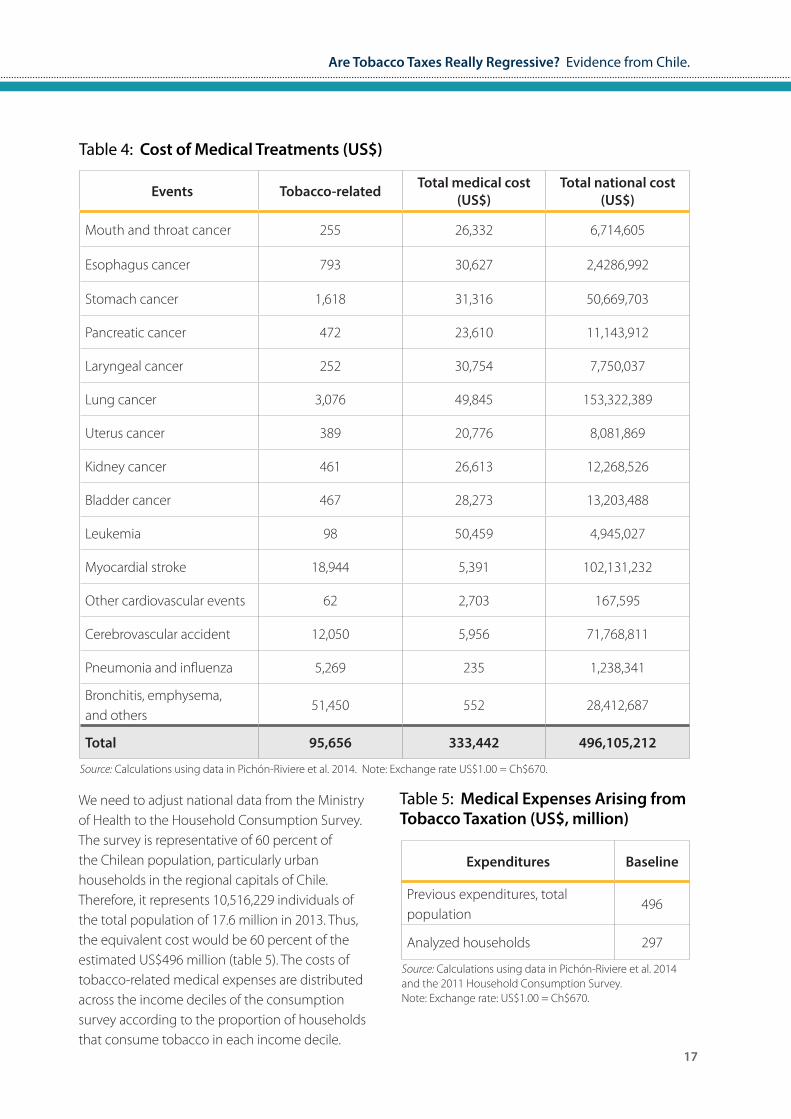
treatment, but the out-of pocket expenses that families face could be reduced by the health insurance scheme currently existing in Chile. Table 4 shows the annual medical costs of tobacco-related diseases. The results are taken from calculations based on the data in tables 2 and 3. The total medical costs of tobacco-related diseases are US$496 million.
Are Tobacco Taxes Really Regressive? Evidence from Chile.
17
Events Tobacco-related Total medical cost (US$)
Total national cost (US$)
Mouth and throat cancer 255 26,332 6,714,605
Esophagus cancer 793 30,627 2,4286,992
Stomach cancer 1,618 31,316 50,669,703
Pancreatic cancer 472 23,610 11,143,912
Laryngeal cancer 252 30,754 7,750,037
Lung cancer 3,076 49,845 153,322,389
Uterus cancer 389 20,776 8,081,869
Kidney cancer 461 26,613 12,268,526
Bladder cancer 467 28,273 13,203,488
Leukemia 98 50,459 4,945,027
Myocardial stroke 18,944 5,391 102,131,232
Other cardiovascular events 62 2,703 167,595
Cerebrovascular accident 12,050 5,956 71,768,811
Pneumonia and influenza 5,269 235 1,238,341
Bronchitis, emphysema, and others
51,450 552 28,412,687
Total 95,656 333,442 496,105,212
Table 4: Cost of Medical Treatments (US$)
Source: Calculations using data in Pichón-Riviere et al. 2014. Note: Exchange rate US$1.00 = Ch$670.
We need to adjust national data from the Ministry of Health to the Household Consumption Survey. The survey is representative of 60 percent of the Chilean population, particularly urban households in the regional capitals of Chile. Therefore, it represents 10,516,229 individuals of the total population of 17.6 million in 2013. Thus, the equivalent cost would be 60 percent of the estimated US$496 million (table 5). The costs of tobacco-related medical expenses are distributed across the income deciles of the consumption survey according to the proportion of households that consume tobacco in each income decile.
Expenditures Baseline
Previous expenditures, total population
496
Analyzed households 297
Table 5: Medical Expenses Arising from Tobacco Taxation (US$, million)
Source: Calculations using data in Pichón-Riviere et al. 2014 and the 2011 Household Consumption Survey.Note: Exchange rate: US$1.00 = Ch$670.
18
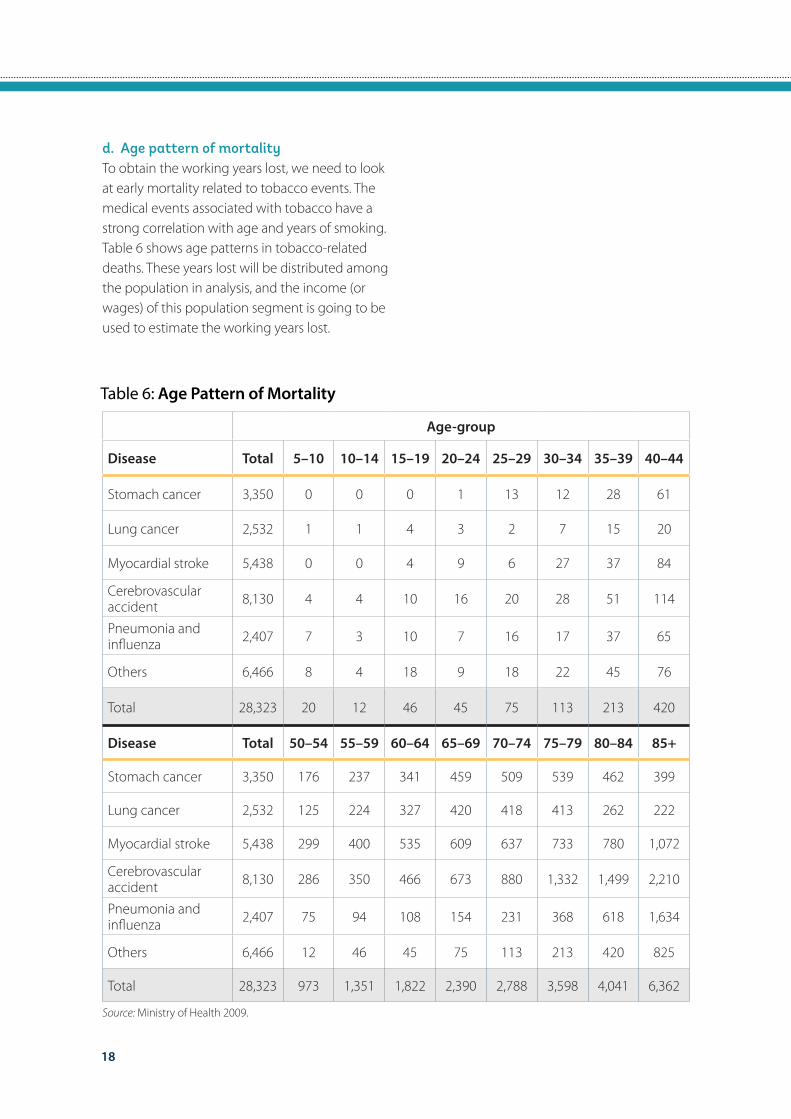
Age-group
Disease Total 5–10 10–14 15–19 20–24 25–29 30–34 35–39 40–44
Stomach cancer 3,350 0 0 0 1 13 12 28 61
Lung cancer 2,532 1 1 4 3 2 7 15 20
Myocardial stroke 5,438 0 0 4 9 6 27 37 84
Cerebrovascular accident 8,130 4 4 10 16 20 28 51 114
Pneumonia and influenza 2,407 7 3 10 7 16 17 37 65
Others 6,466 8 4 18 9 18 22 45 76
Total 28,323 20 12 46 45 75 113 213 420
Disease Total 50–54 55–59 60–64 65–69 70–74 75–79 80–84 85+
Stomach cancer 3,350 176 237 341 459 509 539 462 399
Lung cancer 2,532 125 224 327 420 418 413 262 222
Myocardial stroke 5,438 299 400 535 609 637 733 780 1,072
Cerebrovascular accident 8,130 286 350 466 673 880 1,332 1,499 2,210
Pneumonia and influenza 2,407 75 94 108 154 231 368 618 1,634
Others 6,466 12 46 45 75 113 213 420 825
Total 28,323 973 1,351 1,822 2,390 2,788 3,598 4,041 6,362
Table 6: Age Pattern of Mortality
Source: Ministry of Health 2009.
d. Age pattern of mortalityTo obtain the working years lost, we need to look at early mortality related to tobacco events. The medical events associated with tobacco have a strong correlation with age and years of smoking. Table 6 shows age patterns in tobacco-related deaths. These years lost will be distributed among the population in analysis, and the income (or wages) of this population segment is going to be used to estimate the working years lost.
19
Are Tobacco Taxes Really Regressive? Evidence from Chile.
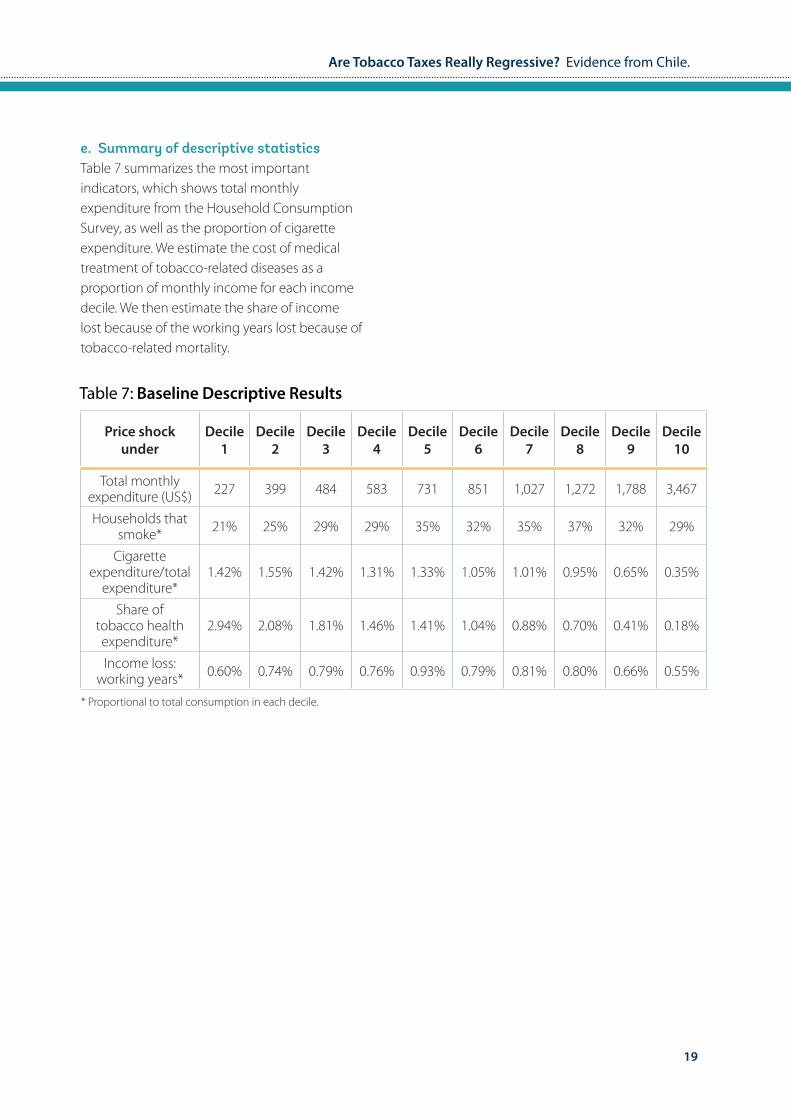
e. Summary of descriptive statisticsTable 7 summarizes the most important indicators, which shows total monthly expenditure from the Household Consumption Survey, as well as the proportion of cigarette expenditure. We estimate the cost of medical treatment of tobacco-related diseases as a proportion of monthly income for each income decile. We then estimate the share of income lost because of the working years lost because of tobacco-related mortality.
Price shock under
Decile 1
Decile 2
Decile 3
Decile 4
Decile 5
Decile 6
Decile 7
Decile 8
Decile 9
Decile 10
Total monthly expenditure (US$) 227 399 484 583 731 851 1,027 1,272 1,788 3,467
Households that smoke* 21% 25% 29% 29% 35% 32% 35% 37% 32% 29%
Cigarette expenditure/total
expenditure*1.42% 1.55% 1.42% 1.31% 1.33% 1.05% 1.01% 0.95% 0.65% 0.35%
Share of tobacco health expenditure*
2.94% 2.08% 1.81% 1.46% 1.41% 1.04% 0.88% 0.70% 0.41% 0.18%
Income loss: working years* 0.60% 0.74% 0.79% 0.76% 0.93% 0.79% 0.81% 0.80% 0.66% 0.55%
Table 7: Baseline Descriptive Results
* Proportional to total consumption in each decile.
20
4. Results
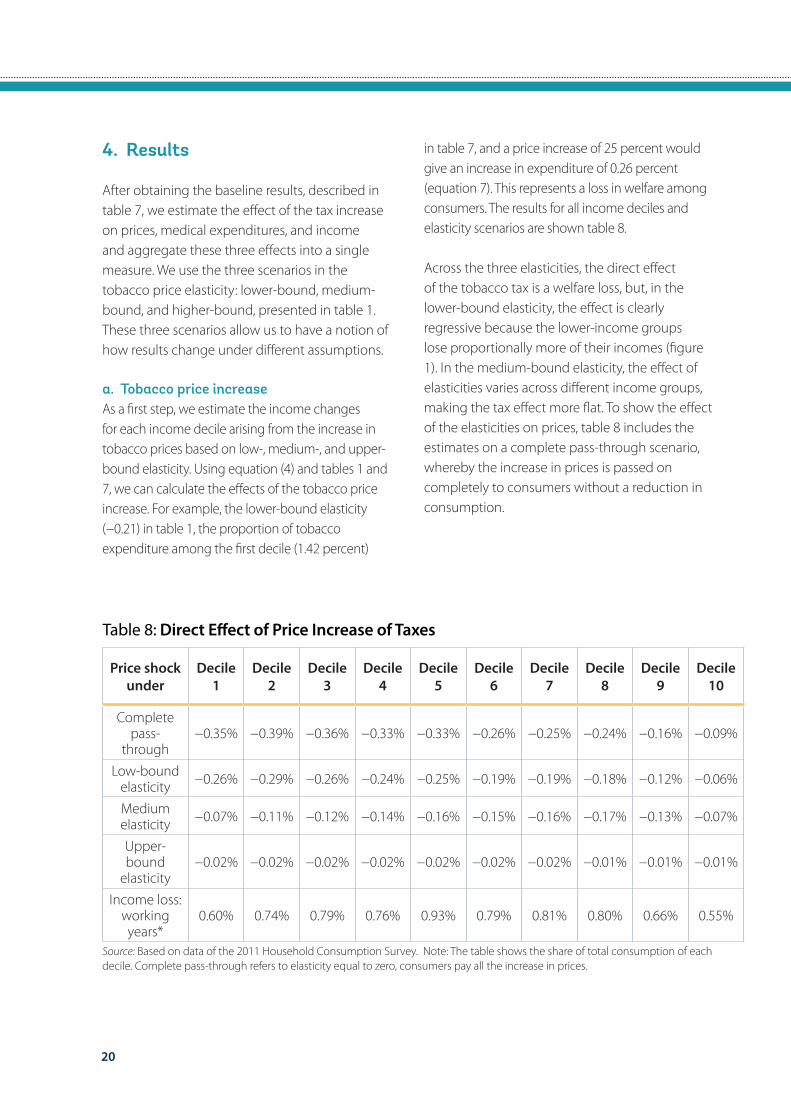
After obtaining the baseline results, described in table 7, we estimate the effect of the tax increase on prices, medical expenditures, and income and aggregate these three effects into a single measure. We use the three scenarios in the tobacco price elasticity: lower-bound, medium-bound, and higher-bound, presented in table 1. These three scenarios allow us to have a notion of how results change under different assumptions.
a. Tobacco price increaseAs a first step, we estimate the income changes for each income decile arising from the increase in tobacco prices based on low-, medium-, and upper-bound elasticity. Using equation (4) and tables 1 and 7, we can calculate the effects of the tobacco price increase. For example, the lower-bound elasticity (−0.21) in table 1, the proportion of tobacco expenditure among the first decile (1.42 percent)
Price shock under
Decile 1
Decile 2
Decile 3
Decile 4
Decile 5
Decile 6
Decile 7
Decile 8
Decile 9
Decile 10
Complete pass-
through−0.35% −0.39% −0.36% −0.33% −0.33% −0.26% −0.25% −0.24% −0.16% −0.09%
Low-bound elasticity −0.26% −0.29% −0.26% −0.24% −0.25% −0.19% −0.19% −0.18% −0.12% −0.06%
Medium elasticity −0.07% −0.11% −0.12% −0.14% −0.16% −0.15% −0.16% −0.17% −0.13% −0.07%
Upper-bound
elasticity−0.02% −0.02% −0.02% −0.02% −0.02% −0.02% −0.02% −0.01% −0.01% −0.01%
Income loss: working years*
0.60% 0.74% 0.79% 0.76% 0.93% 0.79% 0.81% 0.80% 0.66% 0.55%
Table 8: Direct Effect of Price Increase of Taxes
Source: Based on data of the 2011 Household Consumption Survey. Note: The table shows the share of total consumption of each decile. Complete pass-through refers to elasticity equal to zero, consumers pay all the increase in prices.
in table 7, and a price increase of 25 percent would give an increase in expenditure of 0.26 percent (equation 7). This represents a loss in welfare among consumers. The results for all income deciles and elasticity scenarios are shown table 8.
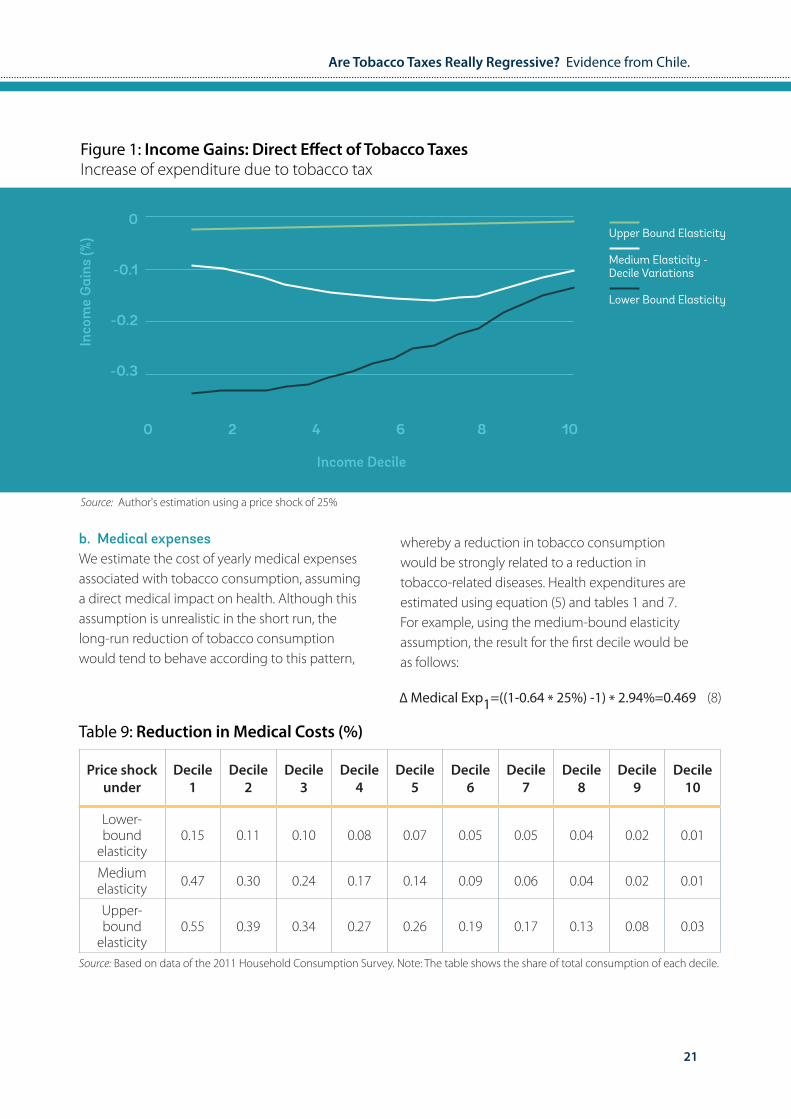
Across the three elasticities, the direct effect of the tobacco tax is a welfare loss, but, in the lower-bound elasticity, the effect is clearly regressive because the lower-income groups lose proportionally more of their incomes (figure 1). In the medium-bound elasticity, the effect of elasticities varies across different income groups, making the tax effect more flat. To show the effect of the elasticities on prices, table 8 includes the estimates on a complete pass-through scenario, whereby the increase in prices is passed on completely to consumers without a reduction in consumption.
21
Are Tobacco Taxes Really Regressive? Evidence from Chile.
Figure 1: Income Gains: Direct Effect of Tobacco TaxesIncrease of expenditure due to tobacco tax
Inco
me
Gai
ns (%
)
0
-0.1
-0.2
-0.3
0 2 4 6 8 10
Income Decile
Upper Bound Elasticity
Medium Elasticity - Decile Variations
Lower Bound Elasticity
Source: Author's estimation using a price shock of 25%
b. Medical expensesWe estimate the cost of yearly medical expenses associated with tobacco consumption, assuming a direct medical impact on health. Although this assumption is unrealistic in the short run, the long-run reduction of tobacco consumption would tend to behave according to this pattern,
∆ Medical Exp1=((1-0.64 * 25%) -1) * 2.94%=0.469 (8)
whereby a reduction in tobacco consumption would be strongly related to a reduction in tobacco-related diseases. Health expenditures are estimated using equation (5) and tables 1 and 7. For example, using the medium-bound elasticity assumption, the result for the first decile would be as follows:
Price shock under
Decile 1
Decile 2
Decile 3
Decile 4
Decile 5
Decile 6
Decile 7
Decile 8
Decile 9
Decile 10
Lower-bound
elasticity0.15 0.11 0.10 0.08 0.07 0.05 0.05 0.04 0.02 0.01
Medium elasticity 0.47 0.30 0.24 0.17 0.14 0.09 0.06 0.04 0.02 0.01
Upper-bound
elasticity0.55 0.39 0.34 0.27 0.26 0.19 0.17 0.13 0.08 0.03
Table 9: Reduction in Medical Costs (%)
Source: Based on data of the 2011 Household Consumption Survey. Note: The table shows the share of total consumption of each decile.

22
Table 9 reports the income gains derived from the reduction in medical expenses for each income decile. The reduction in tobacco consumption would have a positive effect on income through the reduction in medical treatments. The income gains would vary between 0.15 and 0.00 percentage points in the case of the lower-bound elasticity assumption, between 0.49 and 0.00 percentage points in the case of the medium-bound elasticity, and between 0.55 and 0.03 percentage points in the case of the upper-bound elasticity (figure 2). These results show the importance of the elasticity assumptions; they also stress the relevance to the possible elasticity variations across income groups.
Figure 2: Income Gains: Medical Costs of Tobacco TaxesReduction of expenditure expenditures
Inco
me
Gai
ns (%
)
0.5
0.4
0.3
0.2
0.1
00 2 4 6 8 10
Income Decile
Upper Bound Elasticity
Medium Elasticity - Decile Variations
Lower Bound Elasticity
Source: Author's estimation using a price shock of 25%
c. Income gains arising because of longer years of working lifeWe estimate the cost of working life lost because of tobacco consumption, assuming that there is a direct impact of lower tobacco use on health and work-generated income. We calculate the impact for each income decile, using the age pattern of mortality and estimating the years of life lost. We then estimate the welfare effect using the lower-bound price elasticity, medium-bound price elasticity, and upper-bound elasticity with decile variations.
23
Are Tobacco Taxes Really Regressive? Evidence from Chile.
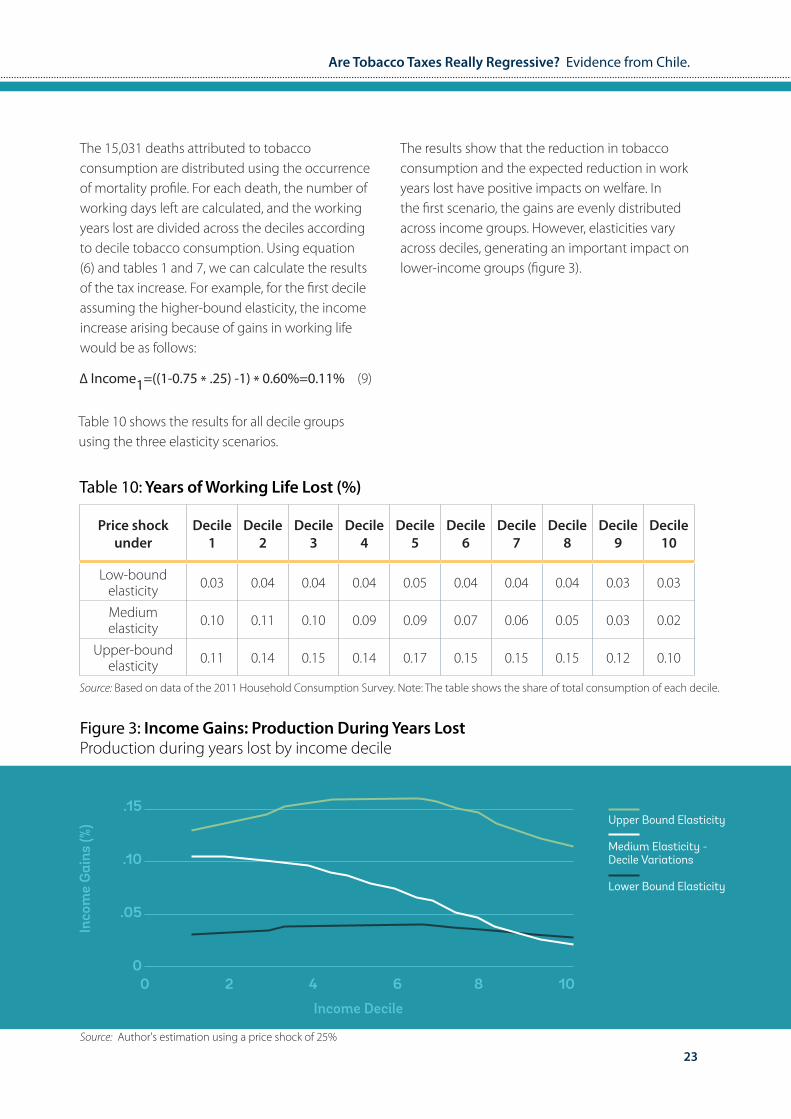
The 15,031 deaths attributed to tobacco consumption are distributed using the occurrence of mortality profile. For each death, the number of working days left are calculated, and the working years lost are divided across the deciles according to decile tobacco consumption. Using equation (6) and tables 1 and 7, we can calculate the results of the tax increase. For example, for the first decile assuming the higher-bound elasticity, the income increase arising because of gains in working life would be as follows:
∆ Income1=((1-0.75 * .25) -1) * 0.60%=0.11% (9)
Table 10 shows the results for all decile groups using the three elasticity scenarios.
Price shock under
Decile 1
Decile 2
Decile 3
Decile 4
Decile 5
Decile 6
Decile 7
Decile 8
Decile 9
Decile 10
Low-bound elasticity 0.03 0.04 0.04 0.04 0.05 0.04 0.04 0.04 0.03 0.03
Medium elasticity 0.10 0.11 0.10 0.09 0.09 0.07 0.06 0.05 0.03 0.02
Upper-bound elasticity 0.11 0.14 0.15 0.14 0.17 0.15 0.15 0.15 0.12 0.10
Table 10: Years of Working Life Lost (%)
Source: Based on data of the 2011 Household Consumption Survey. Note: The table shows the share of total consumption of each decile.
The results show that the reduction in tobacco consumption and the expected reduction in work years lost have positive impacts on welfare. In the first scenario, the gains are evenly distributed across income groups. However, elasticities vary across deciles, generating an important impact on lower-income groups (figure 3).
Figure 3: Income Gains: Production During Years LostProduction during years lost by income decile
Inco
me
Gai
ns (%
)
.15
.10
.05
00 2 4 6 8 10
Income Decile
Upper Bound Elasticity
Medium Elasticity - Decile Variations
Lower Bound Elasticity
Source: Author's estimation using a price shock of 25%
24
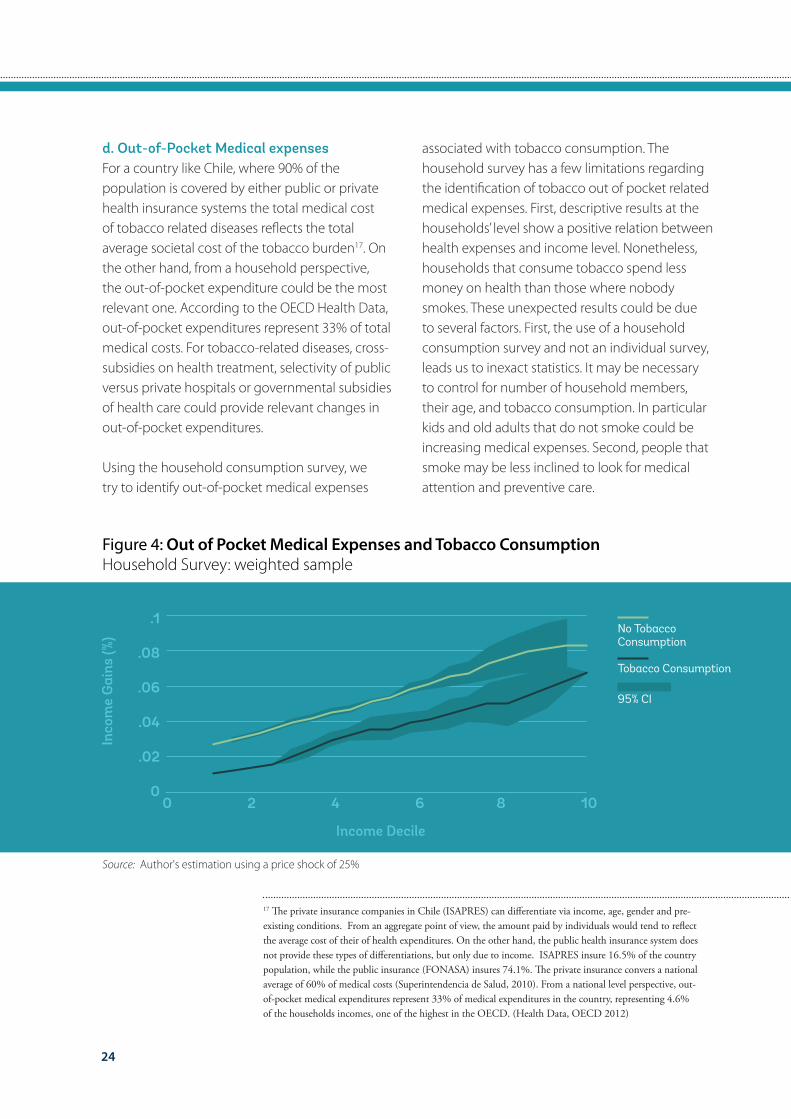
d. Out-of-Pocket Medical expensesFor a country like Chile, where 90% of the population is covered by either public or private health insurance systems the total medical cost of tobacco related diseases reflects the total average societal cost of the tobacco burden17. On the other hand, from a household perspective, the out-of-pocket expenditure could be the most relevant one. According to the OECD Health Data, out-of-pocket expenditures represent 33% of total medical costs. For tobacco-related diseases, cross-subsidies on health treatment, selectivity of public versus private hospitals or governmental subsidies of health care could provide relevant changes in out-of-pocket expenditures.
Using the household consumption survey, we try to identify out-of-pocket medical expenses
17 The private insurance companies in Chile (ISAPRES) can differentiate via income, age, gender and pre-existing conditions. From an aggregate point of view, the amount paid by individuals would tend to reflect the average cost of their of health expenditures. On the other hand, the public health insurance system does not provide these types of differentiations, but only due to income. ISAPRES insure 16.5% of the country population, while the public insurance (FONASA) insures 74.1%. The private insurance convers a national average of 60% of medical costs (Superintendencia de Salud, 2010). From a national level perspective, out-of-pocket medical expenditures represent 33% of medical expenditures in the country, representing 4.6% of the households incomes, one of the highest in the OECD. (Health Data, OECD 2012)
associated with tobacco consumption. The household survey has a few limitations regarding the identification of tobacco out of pocket related medical expenses. First, descriptive results at the households’ level show a positive relation between health expenses and income level. Nonetheless, households that consume tobacco spend less money on health than those where nobody smokes. These unexpected results could be due to several factors. First, the use of a household consumption survey and not an individual survey, leads us to inexact statistics. It may be necessary to control for number of household members, their age, and tobacco consumption. In particular kids and old adults that do not smoke could be increasing medical expenses. Second, people that smoke may be less inclined to look for medical attention and preventive care.
Figure 4: Out of Pocket Medical Expenses and Tobacco ConsumptionHousehold Survey: weighted sample
Inco
me
Gai
ns (%
)
.1
.08
.06
.04
.02
00 2 4 6 8 10
Income Decile
Source: Author's estimation using a price shock of 25%
No Tobacco Consumption
Tobacco Consumption
95% CI
25
Are Tobacco Taxes Really Regressive? Evidence from Chile.
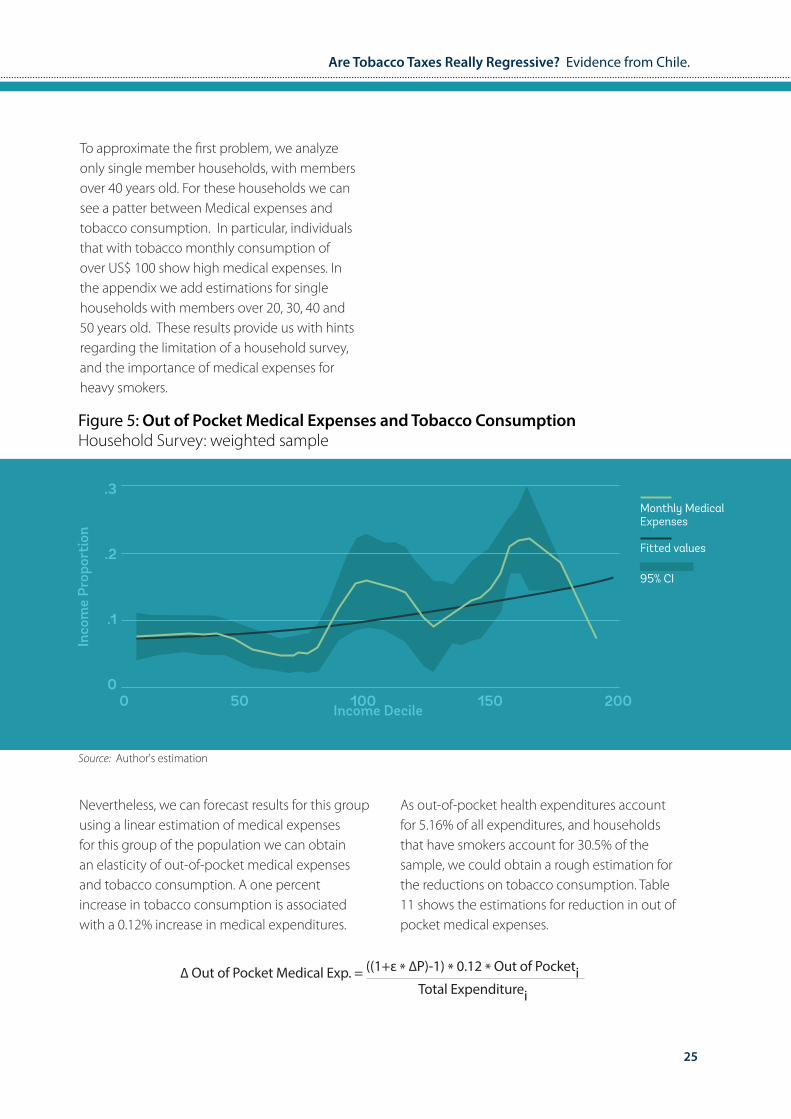
To approximate the first problem, we analyze only single member households, with members over 40 years old. For these households we can see a patter between Medical expenses and tobacco consumption. In particular, individuals that with tobacco monthly consumption of over US$ 100 show high medical expenses. In the appendix we add estimations for single households with members over 20, 30, 40 and 50 years old. These results provide us with hints regarding the limitation of a household survey, and the importance of medical expenses for heavy smokers.
Figure 5: Out of Pocket Medical Expenses and Tobacco ConsumptionHousehold Survey: weighted sample
Inco
me
Prop
orti
on
.3
.2
.1
00 50 100 150 200
Income Decile
Source: Author's estimation
Monthly Medical Expenses
Fitted values
95% CI
Nevertheless, we can forecast results for this group using a linear estimation of medical expenses for this group of the population we can obtain an elasticity of out-of-pocket medical expenses and tobacco consumption. A one percent increase in tobacco consumption is associated with a 0.12% increase in medical expenditures.
∆ Out of Pocket Medical Exp. = ((1+ε * ∆P)-1) * 0.12 * Out of Pocketi Total Expenditurei
As out-of-pocket health expenditures account for 5.16% of all expenditures, and households that have smokers account for 30.5% of the sample, we could obtain a rough estimation for the reductions on tobacco consumption. Table 11 shows the estimations for reduction in out of pocket medical expenses.
26
As an example, for the lower-bound elasticity, the change in out-of pocket expenditure would be:((1-0.21*0.25)-1)*0.0516*0.305*0.12=-0.01%
Out-of Pocket Medical Change Income Prop
Low-bound elasticity -0.01%
Medium elasticity -0.02%
Upper-bound elasticity -0.04%
Table 11: Reduction of out-of pocket Medical Expensese (%)
Source: Based on data of the 2011 Household Consumption Survey. Assumptions: out-of-pocket tobacco elasticity =0.12%, Out-of-pocket medical expenses 5.16%, proportion of smokers 30.5% Note: The table shows the share of total consumption
These results give us a dimension of the magnitude of out-of-pocket expenses and the reduction of tobacco consumption, for a very limited group of the population, and without estimating the effect of second hand smoking.
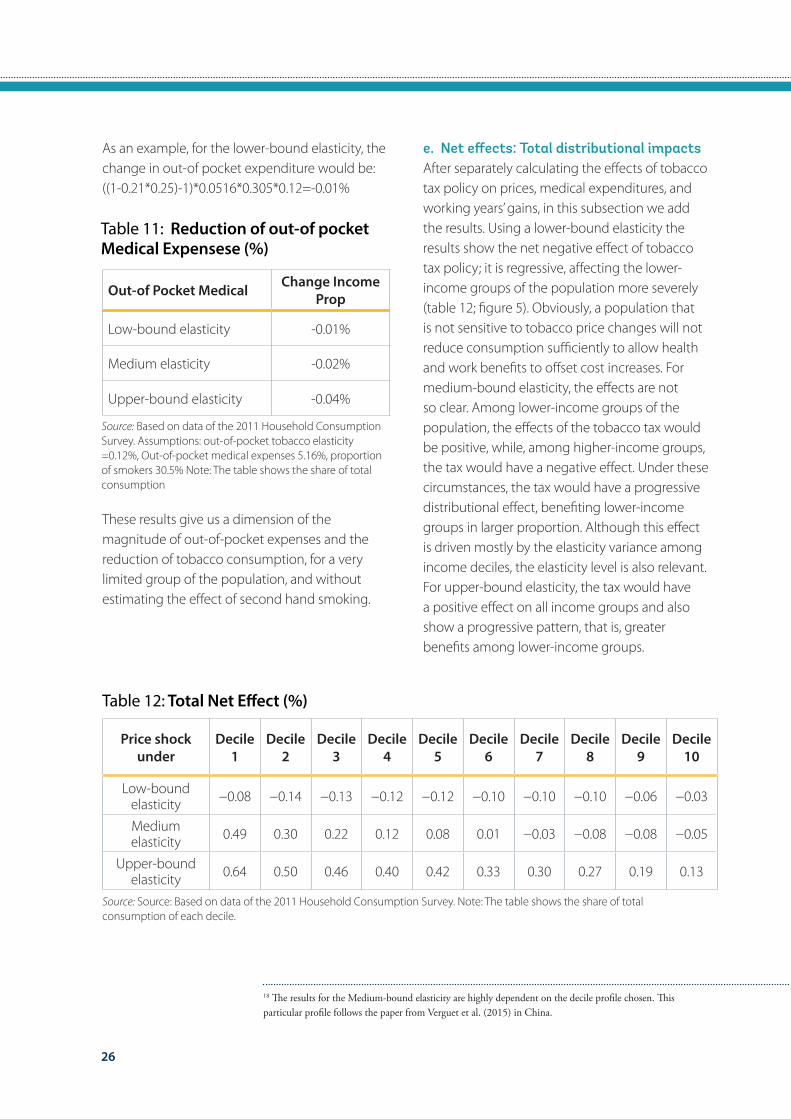
e. Net effects: Total distributional impactsAfter separately calculating the effects of tobacco tax policy on prices, medical expenditures, and working years’ gains, in this subsection we add the results. Using a lower-bound elasticity the results show the net negative effect of tobacco tax policy; it is regressive, affecting the lower-income groups of the population more severely (table 12; figure 5). Obviously, a population that is not sensitive to tobacco price changes will not reduce consumption sufficiently to allow health and work benefits to offset cost increases. For medium-bound elasticity, the effects are not so clear. Among lower-income groups of the population, the effects of the tobacco tax would be positive, while, among higher-income groups, the tax would have a negative effect. Under these circumstances, the tax would have a progressive distributional effect, benefiting lower-income groups in larger proportion. Although this effect is driven mostly by the elasticity variance among income deciles, the elasticity level is also relevant. For upper-bound elasticity, the tax would have a positive effect on all income groups and also show a progressive pattern, that is, greater benefits among lower-income groups.
18 The results for the Medium-bound elasticity are highly dependent on the decile profile chosen. This particular profile follows the paper from Verguet et al. (2015) in China.
Price shock under
Decile 1
Decile 2
Decile 3
Decile 4
Decile 5
Decile 6
Decile 7
Decile 8
Decile 9
Decile 10
Low-bound elasticity −0.08 −0.14 −0.13 −0.12 −0.12 −0.10 −0.10 −0.10 −0.06 −0.03
Medium elasticity 0.49 0.30 0.22 0.12 0.08 0.01 −0.03 −0.08 −0.08 −0.05
Upper-bound elasticity 0.64 0.50 0.46 0.40 0.42 0.33 0.30 0.27 0.19 0.13
Table 12: Total Net Effect (%)
Source: Source: Based on data of the 2011 Household Consumption Survey. Note: The table shows the share of total consumption of each decile.
27
Are Tobacco Taxes Really Regressive? Evidence from Chile.
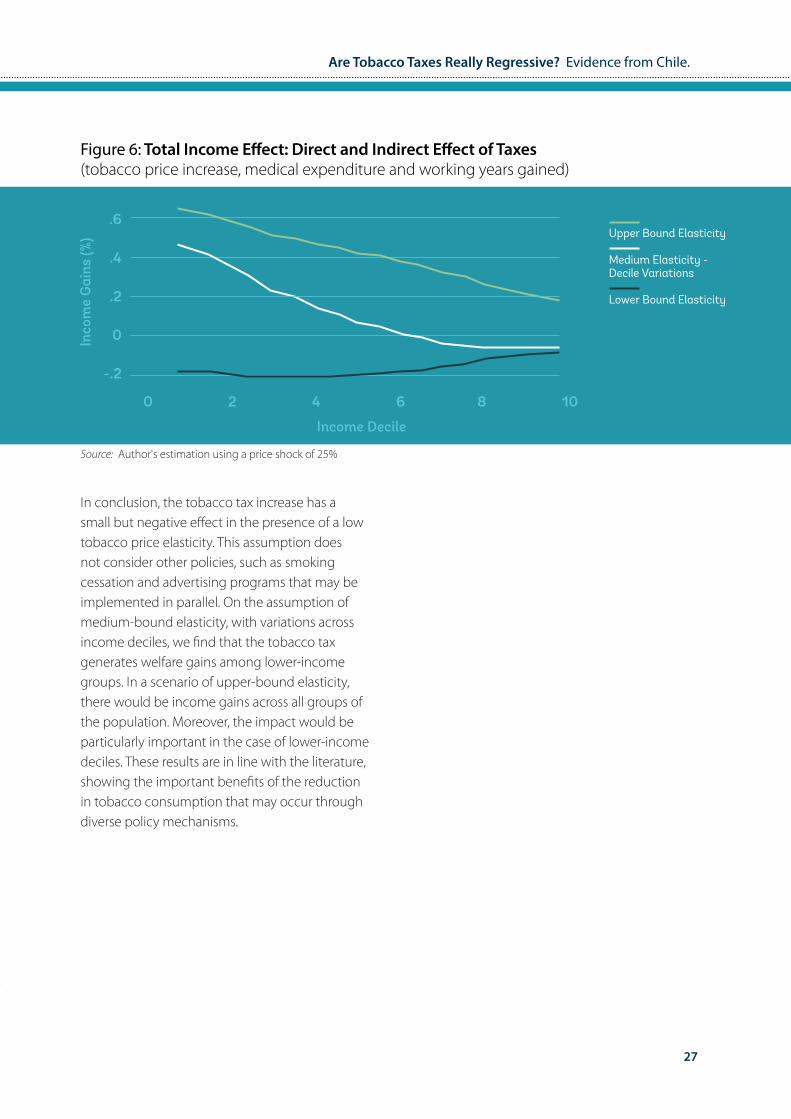
Figure 6: Total Income Effect: Direct and Indirect Effect of Taxes(tobacco price increase, medical expenditure and working years gained)
Inco
me
Gai
ns (%
)
.6
.4
.2
0
-.2
0 2 4 6 8 10
Income Decile
Upper Bound Elasticity
Medium Elasticity - Decile Variations
Lower Bound Elasticity
Source: Author's estimation using a price shock of 25%
In conclusion, the tobacco tax increase has a small but negative effect in the presence of a low tobacco price elasticity. This assumption does not consider other policies, such as smoking cessation and advertising programs that may be implemented in parallel. On the assumption of medium-bound elasticity, with variations across income deciles, we find that the tobacco tax generates welfare gains among lower-income groups. In a scenario of upper-bound elasticity, there would be income gains across all groups of the population. Moreover, the impact would be particularly important in the case of lower-income deciles. These results are in line with the literature, showing the important benefits of the reduction in tobacco consumption that may occur through diverse policy mechanisms.
28
5. Discussion
The tobacco literature has shown the negative effects of tobacco consumption on health and well-being, as well as the benefits of various public policy mechanisms aimed at reducing tobacco use. One of the most efficient ways to deter tobacco use is the application of taxes, both ad valorem or excise taxes. Yet, questions remain regarding the net positive effect of these policies and the progressivity or regressivity that they entail, particularly because the welfare effects derived from the increase in the taxes on tobacco heavily depend on the price elasticity of this item across different sectors of the population. The price elasticity will determine the magnitude of the income shock, as well as the increase in the benefits, because of the reduction in tobacco consumption.
The net welfare gain may be supported through the reduction in medical costs and the expansion in working years, which are an effect of the lower levels of tobacco consumption promoted by the tax increase. Thus, it is critical to justify the maintenance or intensification of the use of these kinds of policies by means of a demonstration of the aggregated monetary gains or losses generated. At the same time, a responsible and comprehensive policy analysis should address the differentiated effects among particular socioeconomic groups of the population, which is one of the main motivations of this research.
Results show that, considered by itself, a price increase for tobacco through higher taxes generates negative income variations across all groups in a population, because the overall prices go up. These negative effects are particularly acute in the scenario of lower-bound elasticity, and they are more moderate as elasticity expands in absolute terms. Based on an assumption of a more comprehensive approach, including benefits through lower medical expenses and an
increase in working years, the scenario reverses the negative effects, and the overall monetary effect of the taxation policy becomes positive in all cases, with the exception of lower-bound elasticity. The reduction in medical expenses is the main driver of the increase in net incomes because of the reduction in tobacco-related problems that require expensive treatments. In the three variations based on elasticity, the benefits of medical expenses are greater than the benefit of the increase in working years, particularly among lower-income groups. This is because of the reduced salaries among the lower-income groups; while medical expenses remain constant across all segments of the population, the income increases are lower among the lower-income groups.
The different elasticity assumptions generated three particular results. The lower-bound elasticity assumption generated an income loss across all decile groups in the population. The medium-bound elasticity, with decile variations, generated income gains among lower-income groups and small losses among the upper-income groups. The upper-bound elasticity generated income gains across all groups of the population, but particularly the lower-income groups. This means that the effect of taxes on the different income groups is exacerbated if the variation of price-elasticities among income deciles is higher.
The three price elasticity scenarios mimic the short- versus the long-term effects of the tobacco tax. There is evidence that adult smokers will only present small changes in their behavior if price increases, the lower-bound elasticity would tend to represent this behavior more closely. In contrast, younger groups of the population would show more elastic demand, similar to the upper-bound elasticity. After a few decades, we expect the impact of the tax policy to resemble the upper-bound elasticity scenario.
29
Are Tobacco Taxes Really Regressive? Evidence from Chile.
The results provide evidence to support the maintenance or increase in tobacco taxes. The analysis also shows the importance of the price elasticity of tobacco, which indicates the relevance of the interaction of taxation and other policies. In particular, this research suggests that taxation should always be supported by actions that could change or alter the behavior of consumers, increasing elasticity levels. Because the reaction to a price change is different in each income group, specific programs should be implemented to target consumption among lower-income groups by supporting smoking cessation and through advertising adapted to the particular sociocultural context. There is thus a need for an integrative approach to anti-tobacco policies that favor coordination between taxation and behavioral change policies to generate higher social returns. Further research could investigate which combination of programs is more efficient in deterring smoking among each socioeconomic group.
30
6. ReferencesBorland, Ron. 1997. “Tobacco Health Warnings and Smok-ing-Related Cognitions and Behaviours.” Addiction 92 (11): 1427–35.
Carvalho José L., and Waldir Lobão. 1998. “Vício privado e políticas públicas: a demanda por cigarros no Brasil.” Revista Brasileira de Economia 52: 67–104.
Centers for Disease Control and Prevention (CDC. (1998). Response to increases in cigarette prices by race/ethnicity, income, and age groups--United States, 1976-1993. MMWR. Morbidity and mortality weekly report, 47(29), 605.
Chaloupka, Frank J. 1991. “Rational Addictive Behavior and Cigarette Smoking.” Journal of Political Economy 99 (4): 722–42.
Chaloupka, Frank J., K. Michael Cummings, Chris P. Morley, and Janet K. Horan. 2002. “Tax, Price, and Cigarette Smoking: Evidence from the Tobacco Documents and Implications for Tobacco Company Marketing Strategies.” Tobacco Control 11 (1): i62–i72.
Chaloupka, Frank J., and Michael Grossman. 1996. “Price, Tobacco Control Policies, and Youth Smoking.” NBER Work-ing Paper 5740 (September), National Bureau of Economic Research, Cambridge, MA.
Coady, David, Moataz El-Said, Robert Gillingham, Kangni Kpo-dar, Paulo Medas, and David Newhouse. 2006. “The Magnitude and Distribution of Fuel Subsidies: Evidence from Bolivia, Gha-na, Jordan, Mali, and Sri Lanka.” IMF Working Paper WP/06/247, International Monetary Fund, Washington, DC.
Cromwell, Jerry, William J. Bartosch, Michael C. Fiore, Victor Hasselblad, and Timothy Baker. 1997. “Cost-Effectiveness of the Clinical Practice Recommendations in the AHCPR Guideline for Smoking Cessation.” Journal of the American Medical Associ-ation 278 (21): 1759–66.
Debrott Sánchez, David. 2006. “Economía del Control del Tabaco en los países del Mercosur y Estados Asociados: Chile.” Pan American Health Organization, Washington, DC. http://iris.paho.org/xmlui/handle/123456789/2811.
Denisova, Irina, and Polina Kuznetsova. 2014. “The Effects of Tobacco Taxes on Health: An Analysis of the Effects by Income Quintile and Gender in Kazakhstan, the Russian Federation, and Ukraine.” Discussion Paper 92765 (October), World Bank, Washington, DC.
Doll, Richard, and A. Bradford Hill. 1956. “Lung Cancer and Oth-er Causes of Death in Relation to Smoking: A Second Report on the Mortality of British Doctors.” British Medical Journal 2 (5001): 1071–81.
Durkin, Sarah, Emily Brennan, and Melanie Wakefield. 2012. “Mass Media Campaigns to Promote Smoking Cessation among Adults: An Integrative Review.” Tobacco Control 21 (2): 127–38. http://tobaccocontrol.bmj.com/content/21/2/127.full.
Fathelrahman, Ahmed I., Maizurah Omar, Rahmat Awang, Ron Borland, Geoffrey T. Fong, David Hammond, and Zarihah Zain. 2009. “Smokers’ Responses toward Cigarette Pack Warning Labels in Predicting Quit Intention, Stage of Change, and Self-Efficacy.” Nicotine and Tobacco Research 11 (3): 248–53.
Fiore, Michael C., and the Guideline Panel. 2008. “A Clinical Practice Guideline for Treating Tobacco Use and Dependence: 2008 Update.” American Journal of Preventive Medicine 35 (2): 158–76.
Gonzáles Rozada, Martín, and Germán Rodríguez-Iglesias. 2013. “Analysis of the Cigarette Tax Structure and Cigarette Demand in Argentina.” Fundación Interamericana del Corazón, Buenos Aires.
Guindon, G. Emmanuel. 2013. “The Impact of Tobacco Prices on Smoking Onset: A Methodological Review.” Tobacco Control 23 (2): e5.
Guindon, G. Emmanuel, Guillermo R. Paraje, and Frank J. Cha-loupka. 2015. “The Impact of Prices and Taxes on the Use of To-bacco Products in Latin America and the Caribbean.” American Journal of Public Health 105 (3): e9–e19.
HHS (U.S. Department of Health and Human Services). 2004. The Health Consequences of Smoking: A Report of the Surgeon General. Atlanta: Office on Smoking and Health, National Center for Chronic Disease Prevention and Health Promotion, Centers for Disease Control and Prevention, U.S. Department of Health and Human Services.
———. 2014. The Health Consequences of Smoking, 50 Years of Progress: A Report of the Surgeon General. January. Atlanta: Office on Smoking and Health, National Center for Chronic Disease Prevention and Health Promotion, Centers for Disease Control and Prevention, U.S. Department of Health and Human Services. http://www.surgeongeneral.gov/library/reports/50-years-of-progress/full-report.pdf.
Hu, Teh-wei, Zhengzhong Mao, Jian Shi, Wendong Chen. 2010. “The Role of Taxation in Tobacco Control and Its Potential Economic Impact in China.” Tobacco Control 19 (1): 58–64.
IARC (International Agency for Research on Cancer). 2009. Evaluating the Effectiveness of Smoke-Free Policies. Vol. 13 of Handbooks of Cancer Prevention, Tobacco Control. Lyon, France: IARC, World Health Organization. https://www.iarc.fr/en/publi-cations/pdfs-online/prev/handbook13/handbook13-0.pdf.
IDB (Inter-American Development Bank) Arpón, P., Bitrán, R., & Escobar, L. (2011). Consecuencias del aumento del impuesto al tabaco en Chile en el año 2010.
Iglesias Roberto, and Júlia Nicolau. 2006. “A economia do controle do tobaco nos países Mercosul e associados: Brasil.” Pan American Health Organization, Washington, DC.
Jha, P., & Chaloupka, F. J. (2000). The economics of global tobacco control. British Medical Journal, 321(7257), 358.
31
Are Tobacco Taxes Really Regressive? Evidence from Chile.
Jha, Prabhat, and Richard Peto. 2014. “Global Effects of Smok-ing, of Quitting, and of Taxing Tobacco.” New England Journal of Medicine 370 (1): 60–68.
Kpodar, Kangni. 2006. “Distributional Effects of Oil Price Changes on Household Expenditures: Evidence from Mali.” IMF Working Paper WP/06/91, International Monetary Fund, Washington, DC.
Levy, D., de Almeida, L. M., & Szklo, A. (2012). The Brazil Sim-Smoke policy simulation model: the effect of strong tobacco control policies on smoking prevalence and smoking-attrib-utable deaths in a middle income nation. PLoS Med, 9(11), e1001336.
Levy, D., Rodríguez-Buño, R. L., Hu, T. W., & Moran, A. E. (2014). The potential effects of tobacco control in China: projections from the China SimSmoke simulation model.
Lewit, Eugene M., and Douglas Coate. 1981. “The Potential for Using Excise Taxes to Reduce Smoking.” NBER Working Paper 764 (September), National Bureau of Economic Research, Cambridge, MA.
Lightwood, James, David Collins, Helen Lapsley, and Thomas E. Novotny. 2000. “Estimating the Costs of Tobacco Use.” In Tobac-co Control in Developing Countries, edited by Prabhat Jha and Frank J. Chaloupka, 63–103. Oxford: Oxford University Press.
Ministry of Health, Chile. 2009. Estadísticas de Natalidad y Mor-talidad Chile, Año 2009. Santiago, Chile: Department of Health Statistics and Information, Ministry of Health.
Ng, Marie, Michael K. Freeman, Thomas D. Fleming, Margaret Robinson, Laura Dwyer-Lindgren, Blake Thomson, Alexandra Wollum, et al. 2014. “Smoking Prevalence and Cigarette Con-sumption in 187 Countries, 1980–2012.” Journal of the American Medical Association 311 (2): 183–92.
Olivera-Chávez, Rosa Itandehui, Rodolfo Cermeño-Bazán, Belén Sáenz de Miera-Juárez, Jorge Alberto Jiménez-Ruiz, and Luz Myriam Reynales-Shigematsu. 2010. “The Effect of Tobacco Prices on Consumption: A Time Series Data Analysis for Mexi-co.” Salud Pública de México 52 (2): S197–S205.
OECD Health Statistics 2012.
OECD Health at a Glance 2013.
Peto, Richard, and Alan D. Lopez. 2004. “The Future Worldwide Health Effects of Current Smoking Patterns.” In Tobacco and Public Health: Science and Policy, edited by Peter Boyle, Nigel Gray, Jack Henningfield, John Seffrin, and Witold Zatonski, 281–86. New York: Oxford University Press.
Pichón-Riviere, Andrés, Federico Augustovski, Ariel Bardach, Lisandro Damian Colantonio, and Latinclen Tobacco Research Group. 2011. “Development and Validation of a Microsimula-tion Economic Model to Evaluate the Disease Burden Asso-ciated with Smoking and the Cost-Effectiveness of Tobacco Control Interventions in Latin America.” Value in Health 14 (5): S51–S59.
Pichón-Riviere, Andrés, Ariel Bardach, Joaquín Caporale, An-drea Alcaraz, Federico Augustovski, Francisco Caccavo, Carlos Vallejos, et al. 2014. “Carga de enfermedad atribuible al tab-aquismo en Chile.” Documento Técnico IECS 8 (April), Instituto de Efectividad Clínica y Sanitaria, Buenos Aires.
Ramos, Alejandro, and Dardo Curti. 2006. “Economía del con-trol del tabaco en los países del Mercosur y Estados asociados: Uruguay.” Pan American Health Organization, Washington, DC.
Verguet, Stéphane, Cindy L. Gauvreau, Sujata Mishra, Mary MacLennan, Shane M. Murphy, Elizabeth D. Brouwer, Rachel A. Nugent, Kun Zhao, Prabhat Jha, and Dean T Jamison. 2015. “The Consequences of Tobacco Tax on Household Health and Finances in Rich and Poor Smokers in China: An Extend-ed Cost-Effectiveness Analysis.” Lancet Global Health 3 (4): e206–16.
WHO (World Health Organization).———. 2008. WHO report on the global tobacco epidemic, 2008: the MPOWER package.
———. 2010. WHO Technical Manual on Tobacco Tax Adminis-tration. Geneva: WHO.
———. 2011. “Economics of Tobacco Toolkit: Assessment of the Economic Costs of Smoking.” WHO, Geneva. http://apps.who.int/iris/bitstream/10665/44596/1/9789241501576_eng.pdf.
———. 2011. Effectiveness of Tax and Price Policies for Tobac-co Control. IARC Handbooks of Cancer Prevention in Tobacco Control, 14.
———. 2015a. Global Report on Trends in Prevalence of Tobacco Smoking. Geneva: WHO. http://apps.who.int/iris/bitstream/10665/156262/1/9789241564922_eng.pdf?ua=1http://www.who.int/mediacentre/news/releases/2015/trends-to-bacco-use/en/.
———. 2015b. “WHO Report on the Global Tobacco Epidem-ic, 2015: Raising Taxes on Tobacco.” WHO, Geneva. http://apps.who.int/iris/bitstream/10665/178574/1/9789240694606_eng.pdf?ua=1&ua=1.
World Bank. 1999. Curbing the Epidemic: Governments and the Economics of Tobacco Control. Report 19638 (May). Develop-ment in Practice Series. Washington, DC: World Bank. http://documents.worldbank.org/curated/en/1999/05/437174/curbing-epidemic-governments-economics-tobacco-control.
Wynder, Earnest L., and Evarts A. Graham. 1950. “Tobacco Smoking as a Possible Etiologic Factor in Bronchiogenic Carci-noma: A Study of Six Hundred and Eighty-Four Proved Cases.” Journal of the American Medical Association 143 (4): 329–36.

32
33
Are Tobacco Taxes Really Regressive? Evidence from Chile.
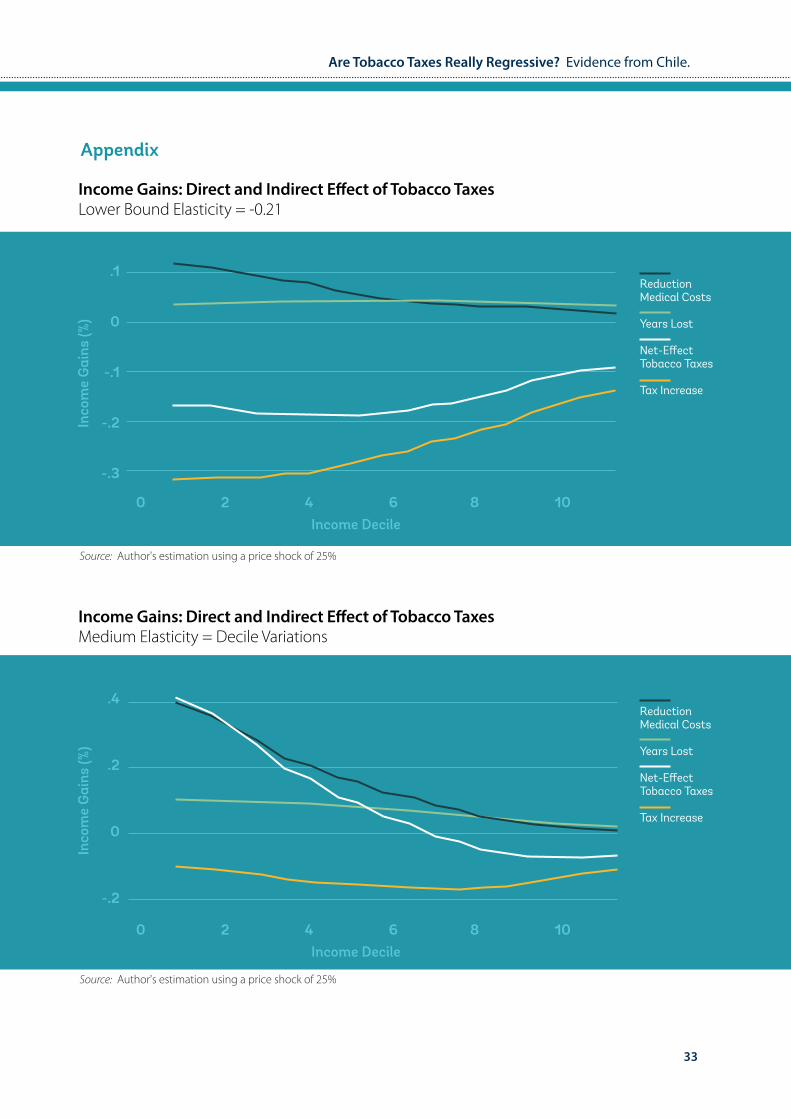
Appendix
Income Gains: Direct and Indirect Effect of Tobacco TaxesLower Bound Elasticity = -0.21
Inco
me
Gai
ns (%
)
.1
0
-.1
-.2
-.3
0 2 4 6 8 10Income Decile
Source: Author's estimation using a price shock of 25%
Reduction Medical Costs
Years Lost
Net-Effect Tobacco Taxes
Tax Increase
Income Gains: Direct and Indirect Effect of Tobacco TaxesMedium Elasticity = Decile Variations
Inco
me
Gai
ns (%
)
.4
.2
0
-.2
0 2 4 6 8 10Income Decile
Source: Author's estimation using a price shock of 25%
Reduction Medical Costs
Years Lost
Net-Effect Tobacco Taxes
Tax Increase
34
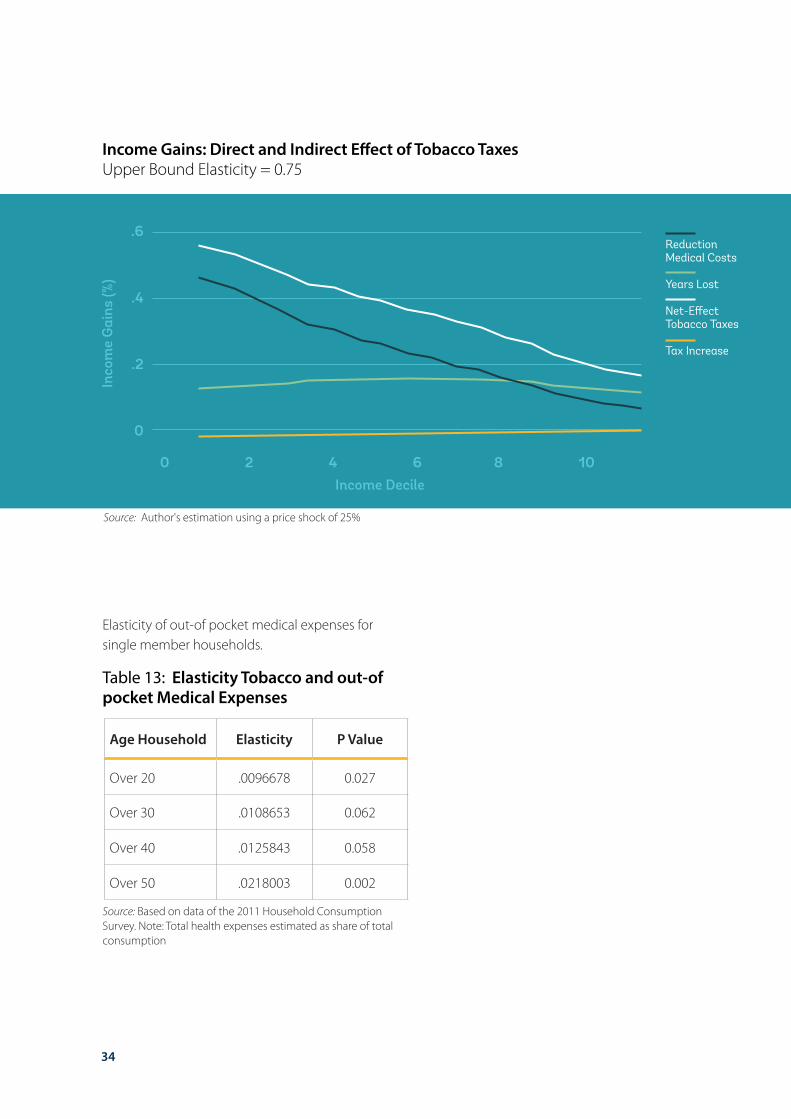
Income Gains: Direct and Indirect Effect of Tobacco TaxesUpper Bound Elasticity = 0.75
Inco
me
Gai
ns (%
)
.6
.4
.2
0
0 2 4 6 8 10Income Decile
Source: Author's estimation using a price shock of 25%
Reduction Medical Costs
Years Lost
Net-Effect Tobacco Taxes
Tax Increase
Elasticity of out-of pocket medical expenses for single member households.
Age Household Elasticity P Value
Over 20 .0096678 0.027
Over 30 .0108653 0.062
Over 40 .0125843 0.058
Over 50 .0218003 0.002
Table 13: Elasticity Tobacco and out-of pocket Medical Expenses
Source: Based on data of the 2011 Household Consumption Survey. Note: Total health expenses estimated as share of total consumption

35