do higher tobacco taxes reduce adult smoking? new · pdf filedo higher tobacco taxes reduce...
TRANSCRIPT
NBER WORKING PAPER SERIES
DO HIGHER TOBACCO TAXES REDUCE ADULT SMOKING? NEW EVIDENCEOF THE EFFECT OF RECENT CIGARETTE TAX INCREASES ON ADULT SMOKING
Kevin CallisonRobert Kaestner
Working Paper 18326http://www.nber.org/papers/w18326
NATIONAL BUREAU OF ECONOMIC RESEARCH1050 Massachusetts Avenue
Cambridge, MA 02138August 2012
The authors would like to thank Willard Manning, Donald Kenkel, Dean Lillard, Philip DeCicca, andparticipants at the 2012 American Society of Health Economists Conference for their helpful suggestions.The views expressed herein are those of the authors and do not necessarily reflect the views of theNational Bureau of Economic Research.
NBER working papers are circulated for discussion and comment purposes. They have not been peer-reviewed or been subject to the review by the NBER Board of Directors that accompanies officialNBER publications.
© 2012 by Kevin Callison and Robert Kaestner. All rights reserved. Short sections of text, not to exceedtwo paragraphs, may be quoted without explicit permission provided that full credit, including © notice,is given to the source.
Do Higher Tobacco Taxes Reduce Adult Smoking? New Evidence of the Effect of RecentCigarette Tax Increases on Adult SmokingKevin Callison and Robert KaestnerNBER Working Paper No. 18326August 2012JEL No. I12,I18
ABSTRACT
There is a general consensus among policymakers that raising tobacco taxes reduces cigarette consumption.However, evidence that tobacco taxes reduce adult smoking is relatively sparse. In this paper, we extendthe literature in two ways: using data from the Current Population Survey Tobacco Use Supplementswe focus on recent, large tax changes, which provide the best opportunity to empirically observe aresponse in cigarette consumption, and employ a novel paired difference-in-differences techniqueto estimate the association between tax increases and cigarette consumption. Estimates indicate that,for adults, the association between cigarette taxes and either smoking participation or smoking intensityis negative, small and not usually statistically significant. Our evidence suggests that increases in cigarettetaxes are associated with small decreases in cigarette consumption and that it will take sizable taxincreases, on the order of 100%, to decrease adult smoking by as much as 5%.
Kevin CallisonDepartment of EconomicsUniversity of Illinois at Chicago601 S. Morgan St. UH725 M/C 144Chicago, IL [email protected]
Robert KaestnerInstitute of Government and Public AffairsUniversity of Illinois815 West Van Buren Street, Suite 525Chicago, IL 60607and [email protected]
Introduction
There is a general consensus among policymakers that raising tobacco taxes reduces cigarette
consumption.1 However, evidence that tobacco taxes reduce adult smoking is relatively sparse (Gallet
and List 2003). For example, casual inspection of trends in tobacco taxes and tobacco use does not
suggest a strong inverse relationship between taxes and consumption. As shown in Figure 1, tobacco
taxes remained relatively constant in real terms between 1983 and 1990, but tobacco use declined
continuously during this period. From 1990 to 1998, tobacco taxes increased by approximately 20%, but
tobacco use continued to decline at about the same rate as between 1983 and 1990. Finally, from 1998 to
2008 tobacco taxes nearly doubled and there were over 100 increases in state tobacco taxes, yet tobacco
use remained on its long run trend toward less use with no noticeable break as taxes began to increase
significantly. More sophisticated empirical evidence, which we review below, also does not provide
strong support for the hypothesis that increases in tobacco taxes reduce adult cigarette consumption.
The paucity of evidence regarding the association between tobacco taxes and adult cigarette
consumption is inconsistent with the widespread support for taxes as a way to reduce smoking. While
support for tobacco taxes also stems from government preferences for raising revenue outside the
traditional methods of sales, income and property taxes, the primary political justification for higher
tobacco taxes is the public health argument that assumes that higher taxes will reduce smoking (Hines
2007, DeCicca et al. 2010a). Given this justification, we believe it is important to revisit the issue of
whether higher tobacco taxes reduce smoking, particularly for adults because there is limited evidence for
this group. In addition, revisiting the issue is warranted because the effect of tax increases is expected to
differ today from past experience since tobacco taxes are quite high and the current pool of smokers is
likely to be dominated by those who have strong preferences for smoking. Thus, previous estimates of the
effect of tax increases may not be relevant to current tax changes. Finally, while there are strong
theoretical reasons to expect that tobacco taxes reduce smoking, there are also mechanisms by which
smoking may be relatively unaffected by taxes. For example, brand loyalty provides some amount of 1For reviews see Chaloupka and Warner (2000) and Gallet and List (2003).
market power to firms, and changes in taxes may not have large effects on retail cigarette prices (DeCicca
et al. 2010b). Consumers can also shift brands (price points) and seek new, cheaper purchasing outlets
including purchases on the black market (e.g., interstate smuggling) to offset some of the effects of taxes
(Hyland et al. 2005, Stehr 2005, DeCicca et al. 2010a, Merriman 2010).
In this paper, we use data from the Current Population Survey Tobacco Use Supplements to study
the effect of recent, large changes in tobacco taxes on both the propensity to smoke and the number of
cigarettes smoked (i.e., smoking intensity). We follow previous researchers and obtain estimates of the
association between state tobacco taxes and smoking using a standard approach that controls for state and
year fixed effects. Using this method, we found that for adult smokers ages 18 to 74, a 10% tax increase is
associated with between a 0.3% to a 0.6% decrease in smoking participation and a 0.3% to a 0.4%
decrease in smoking intensity. More surprisingly, given past research suggesting that youth smoking is
more sensitive to taxes and prices, we find very little difference by age in the association between
cigarette taxes and cigarette consumption. A 10% increase in state cigarette tax is associated with:
between a 0.3% to a 0.7% decrease in smoking participation for those ages 18 to 34; between a 0.2% to a
0.4% decrease in smoking participation for those ages 35 to 54; and between a 0.3% to a 0.6% decrease in
smoking participation for those ages 55 to 74. Similarly a 10% increase in state cigarette tax is associated
with: between a 0.3% and a 0.5% decrease in smoking intensity for those ages 18 to 34; a 0.3% decrease
in smoking intensity for those ages 35 to 54; and between a 0.3% and a 0.4% decrease in smoking
intensity for those ages 55 to 74. Finally, standard errors of estimates are of a magnitude that rule out
cigarette tax elasticities with respect to smoking participation (intensity) among adults greater (more
negative) than -0.12 (-0.13).
We also obtained estimates of associations between tobacco taxes and cigarette consumption
using a novel difference-in-differences (DiD) empirical strategy that relies on comparing matched
treatment and control states (i.e., those states that increased their cigarette excise tax and those that did
not) before and after instances of tax increases in the treatment states. The use of a DiD approach allows
us to explicitly test the identifying assumption of our research design, which is not possible with the
standard, state and year fixed effects method. Estimates obtained using this approach are similar to
estimates obtained using the standard approach; for those ages 18 to 74, a 10% increase in cigarette taxes
is associated with a -0.2% change in both smoking participation and smoking intensity. Tests of the
validity of the identifying assumption underlying the DiD research design suggest that it is a valid
approach, although small spurious tax elasticities of smoking intensity of approximately -0.1 could not be
ruled out. Considering all the evidence, we conclude that there is insufficient justification for the
widespread belief that raising cigarette taxes will significantly reduce cigarette consumption among
adults, even young adults. Our evidence suggests that, at best, increases in cigarette taxes will be
associated with a small decrease in cigarette consumption and that it will take very sizable tax increases,
on the order of 100%, to decrease smoking by as much as 5%.
Previous Research on the Association between Adult Smoking and Tobacco Taxes and Prices
Traditionally, researchers have focused attention on teens when examining the association
between cigarette taxes and smoking, and most studies report evidence that teens reduce consumption
when prices (taxes) are increased and that the price responsiveness of teens is greater than that for adults
(Gallet and List 2003). However, estimates reported in the literature pertaining to adults are quite varied
and there is a relative lack of study of the association between taxes (prices) and adult smoking. Here we
review several, often cited studies of the association between cigarette taxes (prices) and adult smoking.
Using data from the 1976 National Health Interview Survey (NHIS), Lewit and Coate (1982)
found that younger smokers were more price responsive than older smokers and that the bulk of the effect
of price increases worked through the decision to smoke. The authors reported a smoking participation
price elasticity estimate for adults ages 35 and over of -0.15 and a smoking intensity elasticity of -0.07.
With data from the same survey, Evans and Farrelly (1998) and Farrelly et al. (2001) estimated smoking
participation and smoking intensity tax elasticities for a variety of years from 1976 to 1993. Like Lewit
and Coate, they found that younger smokers were more responsive to changes in cigarette prices (through
taxes), but reported no association between taxes and participation for adults over the age of 40.

Wasserman et al. (1991) used data from seven waves of the NHIS from 1970 to 1985 and found that both
the smoking participation and smoking intensity price elasticities for adults varied substantially over time.
Participation price elasticities for adults ranged from 0.06 in 1970 to -0.17 in 1985. Similarly, smoking
intensity price elasticities for adults ranged from 0.01 in 1970 to -0.09 in 1985.
Ohsfeldt et al. (1998) used data from the Current Population Survey Tobacco Use Supplements
(CPS-TUS) for September 1992, January 1993, and May 1993 to estimate the association between
cigarette taxes and cigarette consumption for males. Participation tax elasticity estimates for teens and
young adults ranged from -0.15 to -0.22. However, for adults ages 45 and over the participation elasticity
was estimated to be -0.07. Using nine waves of the CPS-TUS from 1992 to 1999 Tauras (2006) reported
participation price elasticity estimates for adults ages 18 and older of -0.12 and intensity elasticity
estimates of -0.07. Finally, DeCicca and McLeod (2008) used data from the Behavioral Risk Factor
Surveillance System (BRFSS) to estimate the association between cigarette tax increases in the post-2001
period, which were generally larger than previous tax increases, and smoking participation among adults
ages 45-59 and 45-64. The authors reported participation elasticities centered on -0.3 for 45-59 year olds
and -0.2 for 45-64 year olds. These estimates are substantially larger than those reported by Ohsfeldt et al.
(1998) and an order of magnitude larger than those reported by Farrelly et al. (2001).
In sum, a relatively small number of studies have examined the association between tobacco taxes
(prices) and adult smoking and these studies have not produced a consensus finding. In their review of
studies estimating adult responsiveness to changes in cigarette prices, Gallet and List (2003) reported a
median price elasticity for adults ages 24 and older of -0.32 with individual estimates varying widely. In
the studies just reviewed, adult smoking participation price elasticities ranged from -0.74 to 0.06 while
price elasticities of adult smoking intensity ranged from -0.28 to 0.01. In addition, with the exception of
DeCicca and McLeod (2008), no study has utilized recent increases in state cigarette excise taxes to
examine the association between taxes and adult smokers. In this paper, we extend the literature by
examining the association between tobacco taxes and adult smoking, which is under studied, using recent,
large tax changes and a novel, paired difference-in-differences research design.
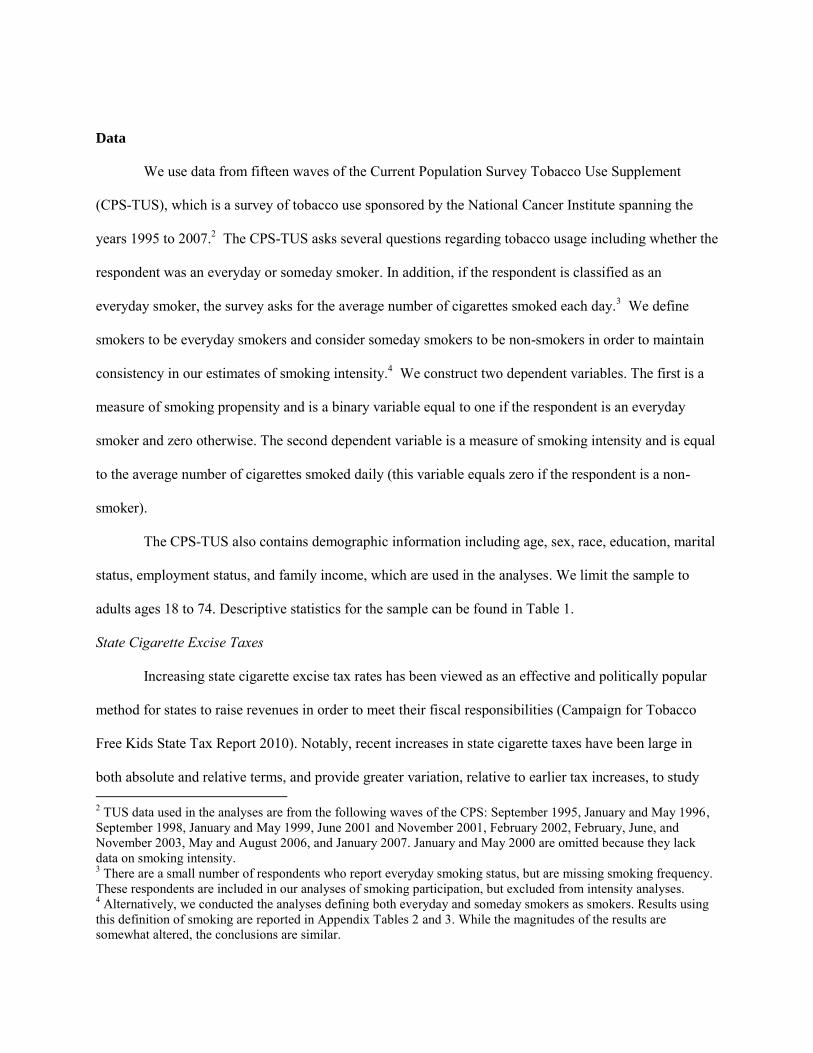
Data
We use data from fifteen waves of the Current Population Survey Tobacco Use Supplement
(CPS-TUS), which is a survey of tobacco use sponsored by the National Cancer Institute spanning the
years 1995 to 2007.2 The CPS-TUS asks several questions regarding tobacco usage including whether the
respondent was an everyday or someday smoker. In addition, if the respondent is classified as an
everyday smoker, the survey asks for the average number of cigarettes smoked each day.3 We define
smokers to be everyday smokers and consider someday smokers to be non-smokers in order to maintain
consistency in our estimates of smoking intensity.4 We construct two dependent variables. The first is a
measure of smoking propensity and is a binary variable equal to one if the respondent is an everyday
smoker and zero otherwise. The second dependent variable is a measure of smoking intensity and is equal
to the average number of cigarettes smoked daily (this variable equals zero if the respondent is a non-
smoker).
The CPS-TUS also contains demographic information including age, sex, race, education, marital
status, employment status, and family income, which are used in the analyses. We limit the sample to
adults ages 18 to 74. Descriptive statistics for the sample can be found in Table 1.
State Cigarette Excise Taxes
Increasing state cigarette excise tax rates has been viewed as an effective and politically popular
method for states to raise revenues in order to meet their fiscal responsibilities (Campaign for Tobacco
Free Kids State Tax Report 2010). Notably, recent increases in state cigarette taxes have been large in
both absolute and relative terms, and provide greater variation, relative to earlier tax increases, to study 2 TUS data used in the analyses are from the following waves of the CPS: September 1995, January and May 1996, September 1998, January and May 1999, June 2001 and November 2001, February 2002, February, June, and November 2003, May and August 2006, and January 2007. January and May 2000 are omitted because they lack data on smoking intensity. 3 There are a small number of respondents who report everyday smoking status, but are missing smoking frequency. These respondents are included in our analyses of smoking participation, but excluded from intensity analyses. 4 Alternatively, we conducted the analyses defining both everyday and someday smokers as smokers. Results using this definition of smoking are reported in Appendix Tables 2 and 3. While the magnitudes of the results are somewhat altered, the conclusions are similar.
the association between taxes and smoking (DeCicca and McLeod 2008). For example, the weighted
average, combined federal and state tax rate more than doubled from 1980 to 2009 (see Figure 1), and
most of this was due to changes in state taxes. Similarly, average tax increases over all states from 2005
to 2009 have been greater than $0.30 per pack (in 1990 dollars); nearly double the average increases in
the previous five year period (see Figure 2). Our empirical strategy, detailed in the following section,
utilizes these large increases in order to identify the association between cigarette taxes and smoking
participation and smoking intensity. We obtain data on state cigarette tax changes from The Tax Burden
on Tobacco, an annual compilation detailing tobacco taxes and tobacco revenue published by the
consulting firm Orzechowski and Walker.
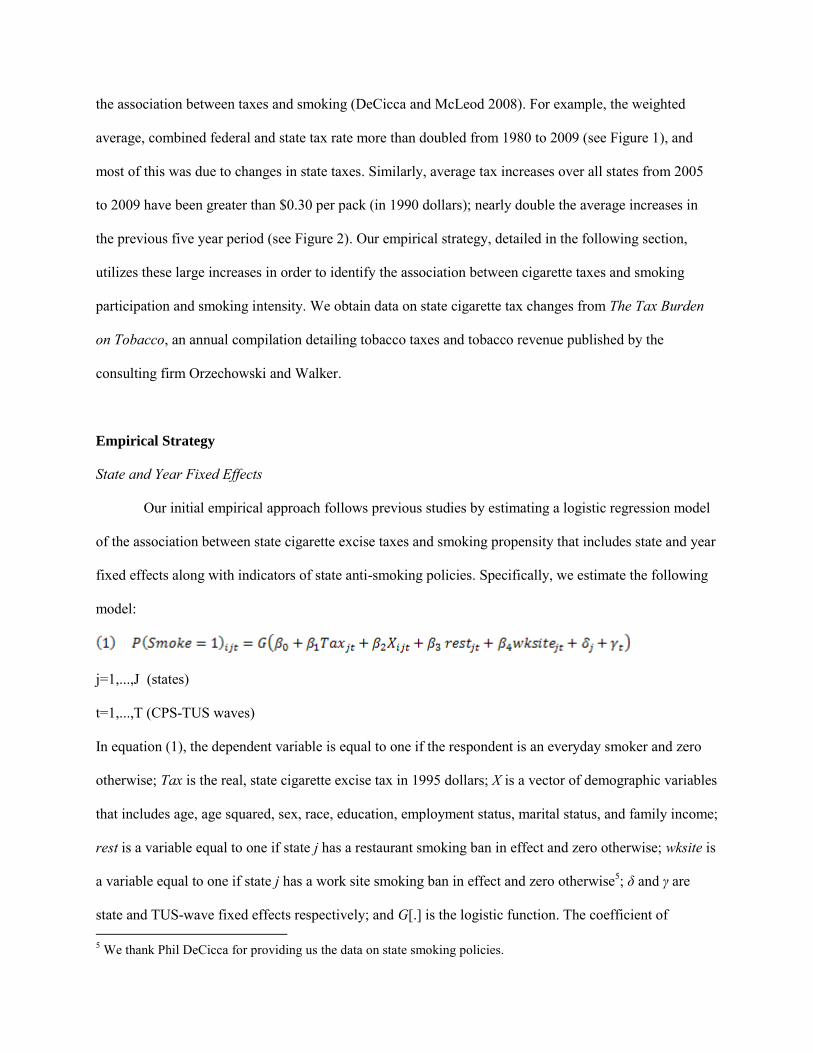
Empirical Strategy
State and Year Fixed Effects
Our initial empirical approach follows previous studies by estimating a logistic regression model
of the association between state cigarette excise taxes and smoking propensity that includes state and year
fixed effects along with indicators of state anti-smoking policies. Specifically, we estimate the following
model:
j=1,...,J (states)
t=1,...,T (CPS-TUS waves)
In equation (1), the dependent variable is equal to one if the respondent is an everyday smoker and zero
otherwise; Tax is the real, state cigarette excise tax in 1995 dollars; X is a vector of demographic variables
that includes age, age squared, sex, race, education, employment status, marital status, and family income;
rest is a variable equal to one if state j has a restaurant smoking ban in effect and zero otherwise; wksite is
a variable equal to one if state j has a work site smoking ban in effect and zero otherwise5; δ and γ are
state and TUS-wave fixed effects respectively; and G[.] is the logistic function. The coefficient of 5 We thank Phil DeCicca for providing us the data on state smoking policies.
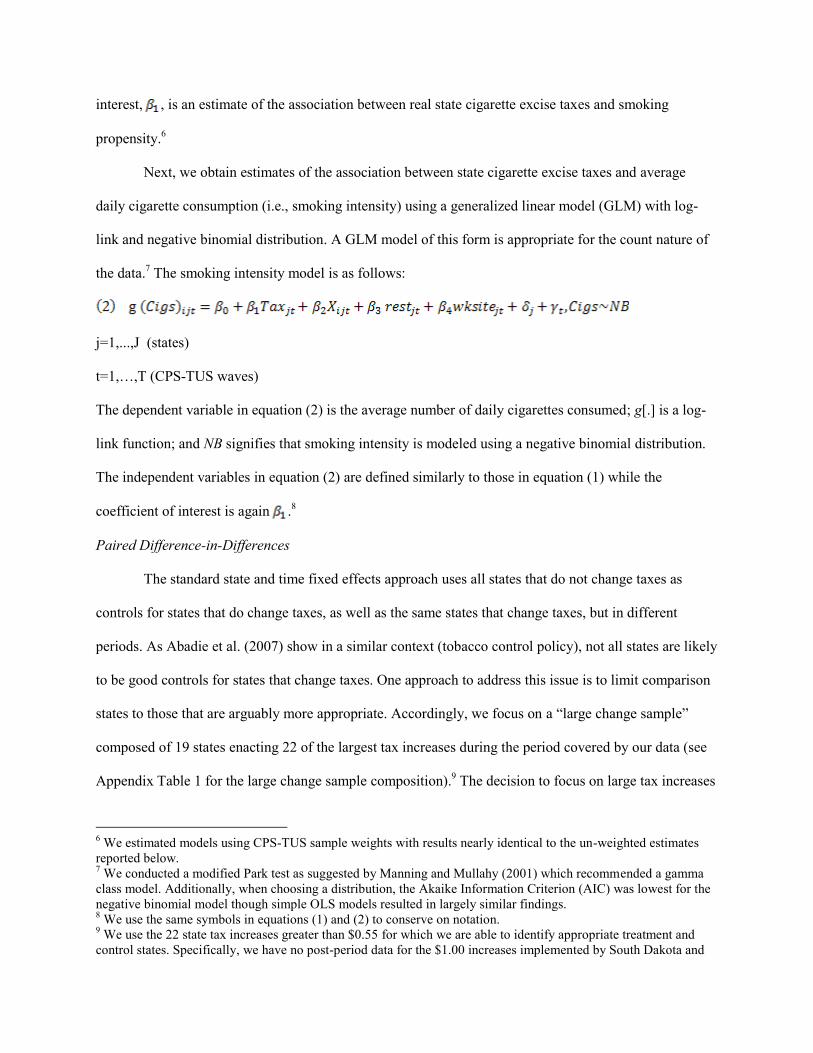
interest, , is an estimate of the association between real state cigarette excise taxes and smoking
propensity.6
Next, we obtain estimates of the association between state cigarette excise taxes and average
daily cigarette consumption (i.e., smoking intensity) using a generalized linear model (GLM) with log-
link and negative binomial distribution. A GLM model of this form is appropriate for the count nature of
the data.7 The smoking intensity model is as follows:
j=1,...,J (states)
t=1,…,T (CPS-TUS waves)
The dependent variable in equation (2) is the average number of daily cigarettes consumed; g[.] is a log-
link function; and NB signifies that smoking intensity is modeled using a negative binomial distribution.
The independent variables in equation (2) are defined similarly to those in equation (1) while the
coefficient of interest is again .8
Paired Difference-in-Differences
The standard state and time fixed effects approach uses all states that do not change taxes as
controls for states that do change taxes, as well as the same states that change taxes, but in different
periods. As Abadie et al. (2007) show in a similar context (tobacco control policy), not all states are likely
to be good controls for states that change taxes. One approach to address this issue is to limit comparison
states to those that are arguably more appropriate. Accordingly, we focus on a “large change sample”
composed of 19 states enacting 22 of the largest tax increases during the period covered by our data (see
Appendix Table 1 for the large change sample composition).9 The decision to focus on large tax increases
6 We estimated models using CPS-TUS sample weights with results nearly identical to the un-weighted estimates reported below. 7 We conducted a modified Park test as suggested by Manning and Mullahy (2001) which recommended a gamma class model. Additionally, when choosing a distribution, the Akaike Information Criterion (AIC) was lowest for the negative binomial model though simple OLS models resulted in largely similar findings. 8 We use the same symbols in equations (1) and (2) to conserve on notation. 9 We use the 22 state tax increases greater than $0.55 for which we are able to identify appropriate treatment and control states. Specifically, we have no post-period data for the $1.00 increases implemented by South Dakota and
is motivated by the argument that changes in consumption should be largest for the largest tax increases
(DeCicca and McLeod 2008).
To select control states for our sample of large tax increase states (i.e., treatment states), we used
two sampled t-tests to compare differences in mean smoking rates in the CPS-TUS wave prior to the tax
increase. States with statistically similar rates of smoking in the pre-period that had no corresponding
change in cigarette tax were paired with the treatment state enacting the tax increase. As an example,
Oklahoma’s state cigarette excise tax was raised from $0.23 to $1.03 on January 1, 2005. The CPS-TUS
waves immediately preceding (November 2003) and following (May 2006) January 1, 2005 were chosen
as the pre- and post-increase periods respectively. Six states (Kentucky, Missouri, Indiana, Kansas,
Tennessee, and West Virginia) had rates of smoking participation and smoking intensity statistically
similar to Oklahoma’s in the pre-period; however, from November 2003 to May 2006, Kentucky also
enacted a cigarette tax increase and therefore was excluded from the group of control states. This process
was repeated for all 22 instances of tax increases in the “large change sample” resulting in an average of
11.7 states qualifying as control states for each large tax increase treatment state.
We then used data from the pre- and post-tax increase waves of the CPS-TUS to estimate the
following models:
(4)
j=1,...,J (states)
t=1,…,T (CPS-TUS waves)
k=1,…,22 (treatment/control groupings)
Texas on January 1, 2007. Similarly, we were unable to identify appropriate control states for Alaska. Note that DeCicca and McLeod (2008) used all tax changes between 2000 and 2005 and did not limit the analysis to large increases, although during this period many increases were relatively large.
The dependent variables in equations (3) and (4) are the same as those used in equations (1) and (2);
smoke is an indicator for everyday smoking status and cigs is the average number of daily cigarettes
consumed. Tax is the real state cigarette tax in 1995 dollars in both the pre- and post-tax increase periods
(note that this is unchanged for the control state); X is the same vector of demographic variables used in
equations (1) and (2); State is an indicator for state j in treatment/control group k; Post is an indicator for
the post-tax increase period for treatment/control group k; and Group is an indicator for the state
(treatment and controls) and time (pre- and post-tax increase) grouping. Note that there is only one pre-
and post-tax change period for each of the 22 large tax changes analyzed.
To further illustrate the paired DiD strategy, consider the aforementioned tax increase in
Oklahoma on January 1, 2005. In this case, we would use CPS-TUS data from the pre- (November 2003)
and post-tax (May 2006) periods and estimate models analogous to equations (3) and (4). Here, State is an
indicator for each state in the grouping, Post is equal to one if the TUS-wave is May 2006, and Group is
equal to one if the state is Oklahoma or one of the control states matched with Oklahoma and the TUS-
wave is either November 2003 or May 2006.10 The coefficient estimate of the Tax variable is identified
through state variation resulting from Oklahoma’s increasing cigarette tax rate and the control states’ tax
rates remaining constant. Essentially, this paired DiD approach pools 22 separate DiD analyses using the
22 tax increases in the large change sample and a set of treatment and control states for each tax change.
Placebo Analysis
To test the validity of the paired, difference-in-differences research design, we created a placebo
experiment in which we chose the same treatment/control groupings, but in periods when there were no
tax changes for either the treatment state or control states. We then randomly assigned a $0.50 tax
increase to one of the states in the group and estimated equations (3) and (4). If the paired DiD analysis is
valid, then we expect estimates from the placebo experiment to be zero. In fact, the validity of the
research design is supported by this placebo analysis; coefficients on (pseudo) tax are statistically
insignificant and all placebo estimates are small for both dependent variables. We report these results 10 In this case, in which there is only one tax change, the variable Group would drop out.
below. Notably, no such placebo test is available in the context of the traditional empirical approach of
using all states and controlling for state and year effects.
Results
Ages 18 to 74
Table 2 presents results for the full sample—persons between the ages of 18 and 74. Logit
estimates related to the probability of smoking are listed in columns 1 through 4 and GLM estimates
related to the average number of cigarettes smoked are listed in columns 5 through 8.
The estimate in column 1 was obtained using the common, two-way fixed effects model that
controls for state and TUS-wave effects. The estimate indicates that a $1 increase in cigarette taxes is
associated with a small decrease in the probability of being a daily (everyday) smoker. The marginal
effect is -0.007—a 4 percent decrease in smoking propensity. The implied elasticity is -0.026, which is
quite small. The fixed effects estimate in column 2 was obtained using a sample that was limited to
persons living in one the 19 states that experienced a large tax change and it is similar to the estimate in
column 1—a small, negative association between cigarette taxes and smoking participation with an
implied elasticity of -0.058. Column 3 lists the estimate of the association between cigarette taxes and
smoking participation from the paired, difference-in-difference (DiD) regression model that used a
sample of persons in the 19 states that experienced a large tax change and their corresponding control
states, but only in the periods just prior to and just after the tax change occurred. The estimate in column
3 is negative, close to zero and not statistically significant—a $1 increase in cigarette taxes is associated
with a 2 percent decrease in smoking participation. The implied elasticity is -0.015. Finally, in column 4,
we present the estimate from the placebo experiment. The estimate is virtually zero. The near-zero
estimate from the placebo analysis suggests that the paired, DiD research design is valid. Standard errors
associated with the paired, DiD estimate in column 3 rule out an elasticity greater (more negative) than -
0.1. Overall, estimates in columns 1 through 4 of Table 2 indicate that increases in cigarette taxes have
very little effect on smoking participation for persons ages 18 to 74.
Columns 5 through 8 of Table 2 present estimates of associations between cigarette taxes and the
average number of cigarettes smoked daily. Estimates in columns 5 through 8 are quite similar and
suggest that the association between cigarette taxes and the quantity of cigarettes smoked is negative,
though small in magnitude. The implied tax elasticities of cigarette consumption range from -0.019 to -
0.035. Standard errors of the estimates rule out tax elasticities greater (more negative) than -0.13. Point
estimates suggest that a 100% increase in cigarette taxes would reduce the average number of cigarettes
smoked by between 2 and 4 percent. The DiD estimate in column 8 from the placebo analysis is negative,
small and not statistically significant; the implied elasticity is -0.037. Here too the placebo estimate
supports the validity of the paired DiD approach.
Estimates by Age Group
Previous studies suggest that the responsiveness of smoking to changes in taxes and prices is
greater for younger persons than older persons. To assess this hypothesis using our data, we divided the
sample into three age groups: 18-34, 35-54, and 55-74. We re-estimated all models presented in Table 2
for these age groups. Table 3 presents these estimates.
We begin with the top panel of Table 3, which lists estimates for persons ages 18 to 34. Fixed-
effects estimates in columns 1 and 2 and columns 5 and 6 are negative and small with implied tax
elasticities between -0.033 and -0.069. Standard errors associated with these estimates rule out tax
elasticities greater (more negative) than -0.2. Estimates in columns 3 and 7 from the paired, DiD are
small, positive and not statistically significant with elasticities of 0.04 and 0.009 respectively. Again,
placebo estimates in columns 4 and 8 suggest that the paired, DiD research design is valid, as estimates
are close to zero and not statistically significant indicating tax elasticities of 0.004 and -0.051.
The middle panel of Table 3 presents estimates for the sample of persons ages 35 to 54. Fixed
effects estimates in columns 1 and 2 and columns 5 and 6 are negative, small and not statistically
significant. Tax elasticities with respect to cigarette participation are between -0.015 and -0.043, and tax
elasticities with respect to the average number of daily cigarettes are between -0.027 and -0.031.
Estimates in columns 3 and 7 from the paired, DiD are negative, small and not statistically significant;
elasticities are -0.013 and -0.051. Estimates from the placebo analyses again support the validity of the
paired DiD research design with small, statistically insignificant elasticities of -0.004 for smoking
participation and -0.067 for smoking intensity.
The bottom panel of Table 3 presents results for the sample ages 55 to 74. Fixed effects estimates
(columns 1 and 3 and columns 5 and 6) are small, negative and not always statistically significant with
implied tax elasticities of between -0.030 to -0.064. The paired, DiD and placebo estimates are small and
not statistically significant with elasticities of 0.008 for smoking participation and -0.023 for smoking
intensity. It is notable that estimates in Table 3 provide no evidence to support the hypothesis that
smoking behavior is more responsive to taxes (prices) among younger persons than older persons.
Are Tax Elasticities Larger When Border State Taxes are Considered?
One of the potential mechanisms for avoiding state cigarette taxes is to cross state borders to
purchase cigarettes in states with lower tax rates (Lovenheim 2008). Not accounting for this possibility
may be a partial explanation for the small tax elasticities reported in Tables 2 and 3. To assess this
hypothesis, we re-estimated the two-way, fixed-effects models allowing the effect of tax to differ by the
distance to the nearest state with a lower cigarette tax. For this analysis, the sample is limited to persons
living in MSAs because this is the only group for which we could measure the distance to the nearest low-
tax state using CPS-TUS data. We follow the method used by DeCicca et al. (2010a) and measure
distance from the center of the MSA to the nearest low-tax border using Google Maps.11 An advantage of
this method is that distance is measured by roadway rather than “as the crow flies”. This allows for a
more accurate measure of the actual travel distance required to purchase cigarettes in a lower tax state.
We allowed the tax to have a different effect for persons living 0-60 miles, 61-120 miles, and 120 or more
miles from a low-tax state. Estimates from this analysis are reported in Table 4.
In column 1 of Table 4, we report the estimate from the same specification used in column 1 of
Table 2 to assess whether changes in sample composition affect our estimates, as the sample used to
11 A number of MSAs in our data cross state lines. To account for this, we use state/MSA pairs rather than MSA alone.
obtain estimates in Table 4 includes only those living in MSAs. The estimate (marginal effect) is -0.004
with an implied elasticity of -0.017. These are very similar to estimates in Table 2. Column 2 reports
estimates from the expanded specification that allows the effect of tax to differ by distance to the nearest
low-tax state. While there is evidence that tax increases have a larger (more negative) effect on smoking
participation and smoking intensity in MSAs farther from low-tax state borders, the effect does not appear
to be large in magnitude.12
Estimates in other columns of Table 4 support a similar conclusion. Estimates in columns 3, 5 and
7 are from models that are identical to those in Table 2, but include only the sample of persons living in
MSAs. These estimates are all similar to the analogous estimates in Table 2 indicating that changes in
sample composition are unimportant. For MSAs in states included in the “large change sample”, estimates
of the effect of tax by distance reveal that the effect of tax is slightly larger (more negative) for distances
between 61 and 120 miles than for distances between 0 and 60 miles. However, in the “large change
sample” MSAs farthest from low-tax states show smaller, not larger, tax effects. In short, there is little
evidence that the small elasticities reported in Table 2 are due to bias arising from cross-border cigarette
purchases.
Discussion
The magnitude of the association between state cigarette taxes and smoking is unresolved,
especially for older smokers. A review of the literature by Chaloupka and Warner (2000) suggests price
elasticities for smoking participation centered on -0.3 to -0.5, though more recent estimates using state
and time fixed effects methods find smaller estimates on the order of -0.3 to -0.1. An analysis of 17 price
elasticity estimates by Gallet and List (2003) found a median elasticity value of -0.32 for adults ages 24
12 This corresponds to direct evidence from six waves of the CPS-TUS that include a question asking the respondent if their last pack of cigarettes was purchased in a state other than their state of residence. Less than 15% of state/MSA pairs have a proportion of respondents greater than 0.10 reporting an out-of-state purchase of their last pack of cigarettes.
and older. Estimates of price elasticities for smoking intensity, though fewer in number, tend to range
from -0.25 to -0.15 (Chaloupka and Warner 2000).
In this paper, we revisited the issue of cigarette taxes and adult smoking and extend the literature
in two ways. First, we focus on recent, large tax changes, which provide the best opportunity to
empirically observe a response in cigarette consumption. Second, we employ a novel methodology, a
paired difference-in-differences approach, for which we can test the validity of the research design. We
also provide estimates of associations between cigarette taxes and smoking using a standard, two-way
fixed effects approach along with separate estimates by age groups (18-34, 35-54, 55-74).
Overall, estimates indicate that the association between cigarette taxes and either smoking
participation or the average number of daily cigarettes consumed is negative, small and not usually
statistically significant. Tax elasticities with respect to smoking participation and number of cigarettes
were typically in the -0.02 to -0.05 range. Importantly, standard errors of estimates rule out cigarette tax
elasticities with respect to smoking participation (intensity) among adults greater (more negative) than -
0.12 (-0.13). Additionally, we find little evidence that young adult (ages 18 to 34) smokers are more
responsive to tax changes than older adult smokers. For specific age groups, confidence intervals for tax
elasticities are larger because of smaller sample sizes, but still relatively small. Standard errors of
estimates rule out cigarette tax elasticities with respect to smoking participation (intensity) greater than -
0.21 (-0.22) for those 18 to 34; greater than -0.14 (-0.14) for those 35 to 54; and greater than -0.15 (-0.17)
for those 55 to 74.
Finally, estimates from the paired, difference-in-difference approach using the entire sample of
adults (ages 18 to 74) are similar to those obtained from the standard fixed-effects design, while placebo
analyses suggested that the paired, difference-in-differences approach was valid. However, standard
errors of the placebo DiD estimates could not rule out small spurious tax elasticities of the magnitude
found in standard two-way fixed effects analyses. This finding is worrisome because it suggests that even
under the best conditions, when treatment and comparison states are well matched on pre-tax smoking
means, the assumption that trends in smoking are the same for states that increase taxes and states that do
not may be invalid. Slightly diverging trends can result in estimates of the effect of taxes on smoking that
are small, statistically significant and of the same magnitude as some estimates reported in the literature.
In short, given current data and methods (quasi-experimental), it is difficult to detect reliably causal
estimates of cigarette tax elasticities with respect to smoking that are smaller (less negative) than -0.10.
To summarize, our analysis of the association between cigarette taxes and adult cigarette use
suggests that adult smoking is largely unaffected by taxes. At best, cigarette tax increases may have a
small negative association with cigarette consumption, although it is difficult to distinguish the effect
from zero, and in practical terms implies that it will take very large tax increases, for example, on the
order of 100%, to reduce smoking by 5%. This finding raises questions about claims that, at the current
time, tax (price) increases on cigarettes will have an important beneficial health impact through reduced
smoking. It may be that in a time (2010) when the median federal and state cigarette tax is approximately
$2.40 per pack, further increases in cigarette taxes will have little effect because the pool of smokers is
becoming increasingly concentrated with those with strong preferences for smoking. Alternatively, as
cigarette taxes and prices continue to rise, smokers are taking other steps to thwart the impact of the price
increase such as switching brands and increasing purchases on the black market. Notably, we rule out
border crossing as an important explanation of the small tax elasticities.
References
Abadie, A., A. Diamond, and J. Hainmueller. (2007). Synthetic Control Methods for Comparative Case Studies: Estimating the Effect of California’s Tobacco Control Program. NBER Working Paper 12831, National Bureau of Economic Research.
Campaign for Tobacco Free Kids. (2010). Tobacco Taxes: A Win-Win-Win for Cash Strapped States.
http://rwjf.org/files/research/20100209tobaccotax.pdf. Last accessed 8-03-12. Chaloupka, F.J. and K.E. Warner. (2000). The Economics of Smoking. In Culyer and
Newhouse (Eds.), Handbook of Health Economics vol. 1B, Amsterdam; Elsevier. DeCicca, P. and L. McLeod. (2008). Cigarette Taxes and Older Adult Smoking: Evidence
from Recent Large Tax Increases. Journal of Health Economics, 27(4) 918-929. DeCicca, P., D.S. Kenkel, and F. Liu. (2010a). Excise Tax Avoidance: The Case of State Cigarette Taxes.
NBER Working Paper 15941, National Bureau of Economic Research. DeCicca, P. D.S. Kenkel, and F. Liu. (2010b). Who Pays Cigarette Taxes? The Impact of Consumer Price
Search. NBER Working Paper 15942, National Bureau of Economic Research. Evans, W.N. and M.C. Farrelly. (1998). The Compensating Behavior of Smokers: Taxes,
Tar and Nicotene. RAND Journal of Economics, 29(3) 578-595. Farrelly, M.C., J.W. Bray, T. Pechacek, and T. Woollery. (2001). Responses by Adults to
Increases in Cigarette Prices by Sociodemographic Characteristics. Southern Economic Journal, 68(1) 156-165.
Gallet, C.A. and J.A. List. (2003). Cigarette Demand: A Meta-Analysis of Elasticities. Health Economics
12(10): 821-835. Hines, J.R. (2007). Taxing Consumption and Other Sins. Journal of Economic Perspectives, 21(1): 49-68. Hyland, A., J.E. Bauer, Q. Li, S.M. Abrams, C. Higbee, L. Peppone, and K.M. Cummings. (2005). Higher
Cigarette Prices Influence Cigarette Purchase Patterns. Tobacco Control, 14: 86-92. Lewit, E.M., and D. Coate. (1982). The Potential for Using Excise Taxes to Reduce Smoking. Journal of Health Economics, 1(2): 121-145. Lovenheim, M.F. (2008). How Far to the Border?: The Extent and Impact of Cross-Border Casual
Cigarette Smuggling. National Tax Journal, 61(1): 7-33. Manning, W.G. and J. Mullahy. (2001) Estimating Log Models: To Transform or Not to Transform.
Journal of Health Economics, 20(4): 461-494. Merriman. D. (2010). The Micro-geography of Tax Avoidance: Evidence from Littered Cigarette
Packs in Chicago.” American Economic Journal: Economic Policy, 2(2): 61-84.
Ohsfeldt, R.L., R.G. Boyle, and E.I. Capilouto. (1999). Tobacco Taxes, Smoking Restrictions, and Tobacco Use. In Chaloupka et al (Eds.), The Economic Analysis of Substance Use and Abuse: An Integration of Econometrics and Behavioral Economic Research, University of Chicago Press; Chicago, IL.
Orzechowski, W., and R.C. Walker. (2009). Tax Burden on Tobacco: Historical Compliation, Vol. 44.
Arlington, VA: Orzechowski and Walker. Stehr, M. (2005). Cigarette Tax Avoidance and Evasion. Journal of Health Economics, 24(2): 277-
297. Tauras, J. (2006). Smoke-Free Air Laws, Cigarette Prices, and Adult Cigarette Demand.
Economic Inquiry, 44(2) 333-342.
Wasserman, J., W.G. Manning, J.P. Newhouse, and J.D. Winkler. (1991). The Effects of Excise Taxes and Regulations on Cigarette Smoking. Journal of Health Economics, 10(1) 43-64.
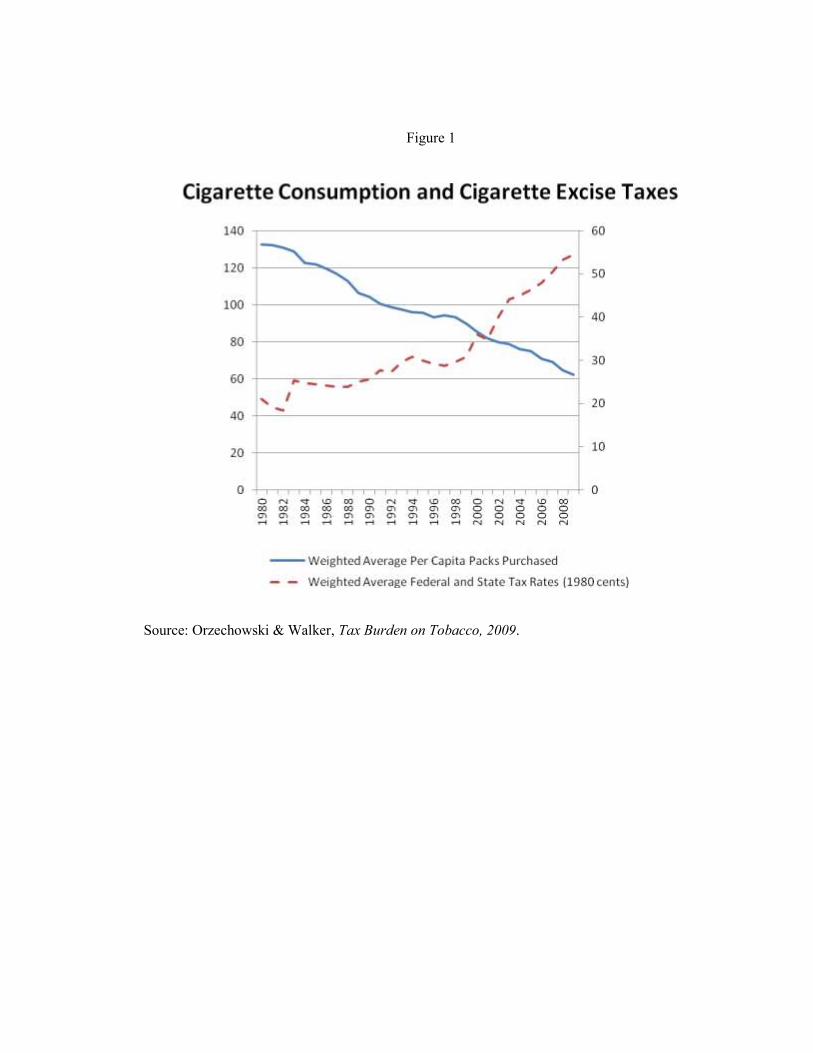
Figure 1
Source: Orzechowski & Walker, Tax Burden on Tobacco, 2009.
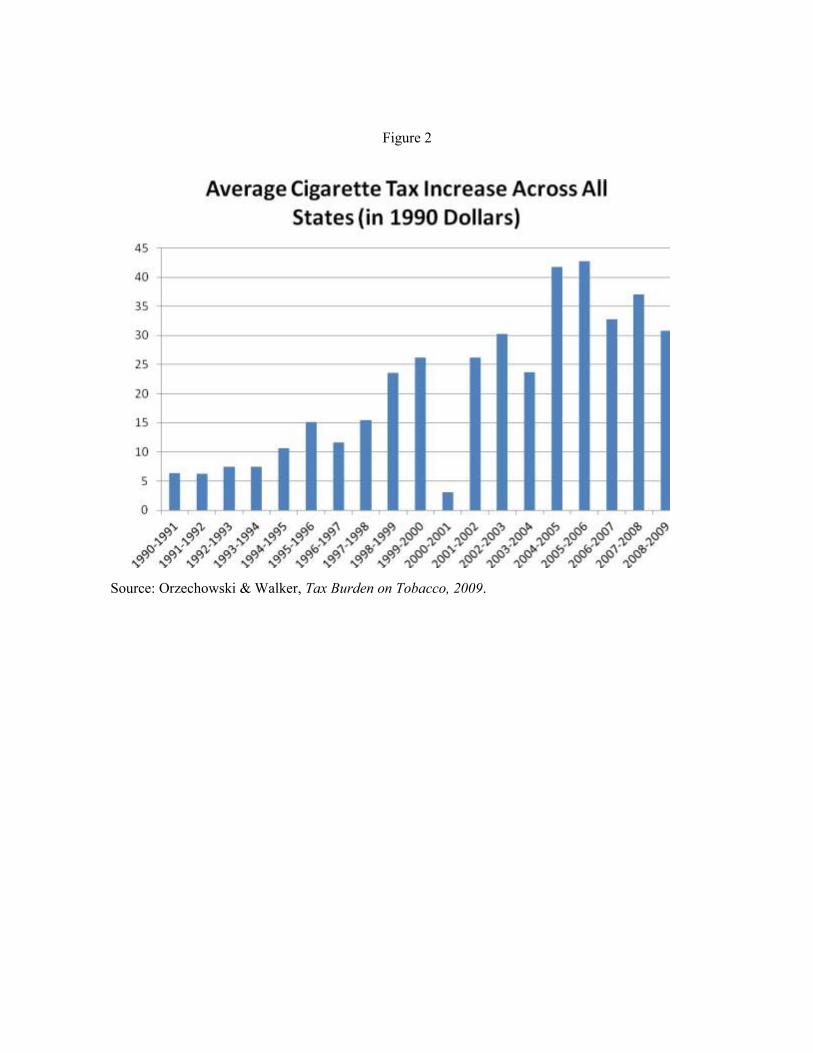
Figure 2
Source: Orzechowski & Walker, Tax Burden on Tobacco, 2009.
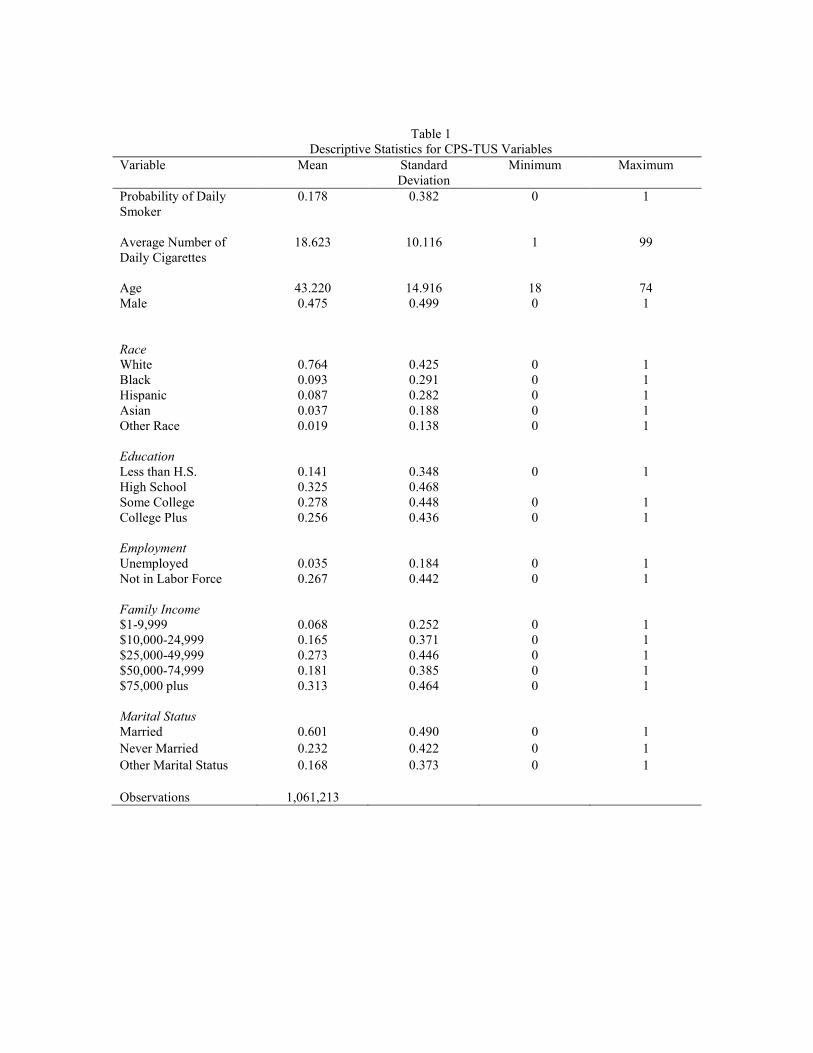
Table 1 Descriptive Statistics for CPS-TUS Variables
Variable Mean Standard Deviation
Minimum Maximum
Probability of Daily Smoker
0.178 0.382 0 1
Average Number of Daily Cigarettes
18.623 10.116 1 99
Age 43.220 14.916 18 74 Male 0.475
0.499 0 1
Race White 0.764 0.425 0 1 Black 0.093 0.291 0 1 Hispanic 0.087 0.282 0 1 Asian 0.037 0.188 0 1 Other Race 0.019 0.138 0 1 Education Less than H.S. 0.141 0.348 0 1 High School 0.325 0.468 Some College 0.278 0.448 0 1 College Plus 0.256 0.436 0 1 Employment Unemployed 0.035 0.184 0 1 Not in Labor Force 0.267 0.442 0 1 Family Income $1-9,999 0.068 0.252 0 1 $10,000-24,999 0.165 0.371 0 1 $25,000-49,999 0.273 0.446 0 1 $50,000-74,999 0.181 0.385 0 1 $75,000 plus 0.313 0.464 0 1 Marital Status Married 0.601 0.490 0 1 Never Married 0.232 0.422 0 1 Other Marital Status 0.168 0.373 0 1 Observations 1,061,213
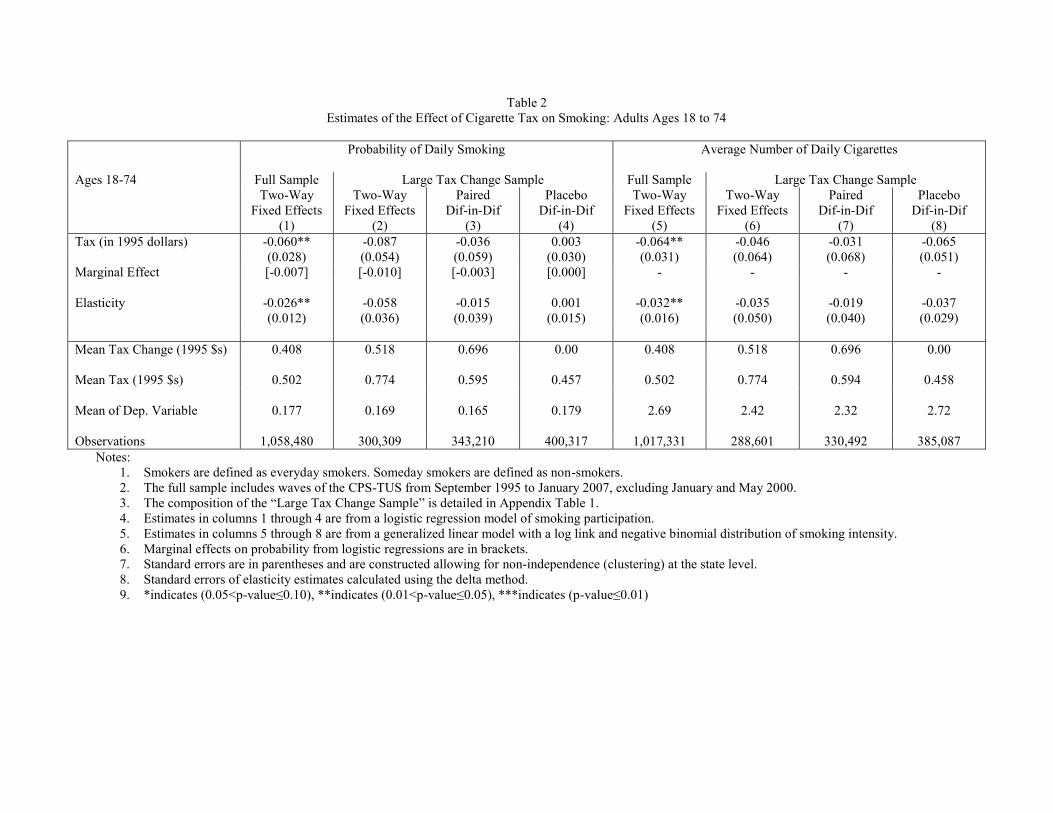
Table 2 Estimates of the Effect of Cigarette Tax on Smoking: Adults Ages 18 to 74
Probability of Daily Smoking
Average Number of Daily Cigarettes
Ages 18-74 Full Sample Large Tax Change Sample Full Sample Large Tax Change Sample Two-Way
Fixed Effects (1)
Two-Way Fixed Effects
(2)
Paired Dif-in-Dif
(3)
Placebo Dif-in-Dif
(4)
Two-Way Fixed Effects
(5)
Two-Way Fixed Effects
(6)
Paired Dif-in-Dif
(7)
Placebo Dif-in-Dif
(8) Tax (in 1995 dollars) -0.060** -0.087 -0.036 0.003 -0.064** -0.046 -0.031 -0.065 (0.028) (0.054) (0.059) (0.030) (0.031) (0.064) (0.068) (0.051) Marginal Effect [-0.007] [-0.010] [-0.003] [0.000] - - - - Elasticity -0.026**
(0.012) -0.058 (0.036)
-0.015 (0.039)
0.001 (0.015)
-0.032** (0.016)
-0.035 (0.050)
-0.019 (0.040)
-0.037 (0.029)
Mean Tax Change (1995 $s) 0.408 0.518 0.696 0.00 0.408 0.518 0.696 0.00 Mean Tax (1995 $s)
0.502
0.774
0.595
0.457
0.502
0.774
0.594
0.458
Mean of Dep. Variable
0.177
0.169
0.165
0.179
2.69
2.42
2.32
2.72
Observations 1,058,480 300,309 343,210 400,317 1,017,331 288,601 330,492 385,087
Notes: 1. Smokers are defined as everyday smokers. Someday smokers are defined as non-smokers. 2. The full sample includes waves of the CPS-TUS from September 1995 to January 2007, excluding January and May 2000. 3. The composition of the “Large Tax Change Sample” is detailed in Appendix Table 1. 4. Estimates in columns 1 through 4 are from a logistic regression model of smoking participation. 5. Estimates in columns 5 through 8 are from a generalized linear model with a log link and negative binomial distribution of smoking intensity. 6. Marginal effects on probability from logistic regressions are in brackets. 7. Standard errors are in parentheses and are constructed allowing for non-independence (clustering) at the state level. 8. Standard errors of elasticity estimates calculated using the delta method. 9. *indicates (0.05<p-value≤0.10), **indicates (0.01<p-value≤0.05), ***indicates (p-value≤0.01)
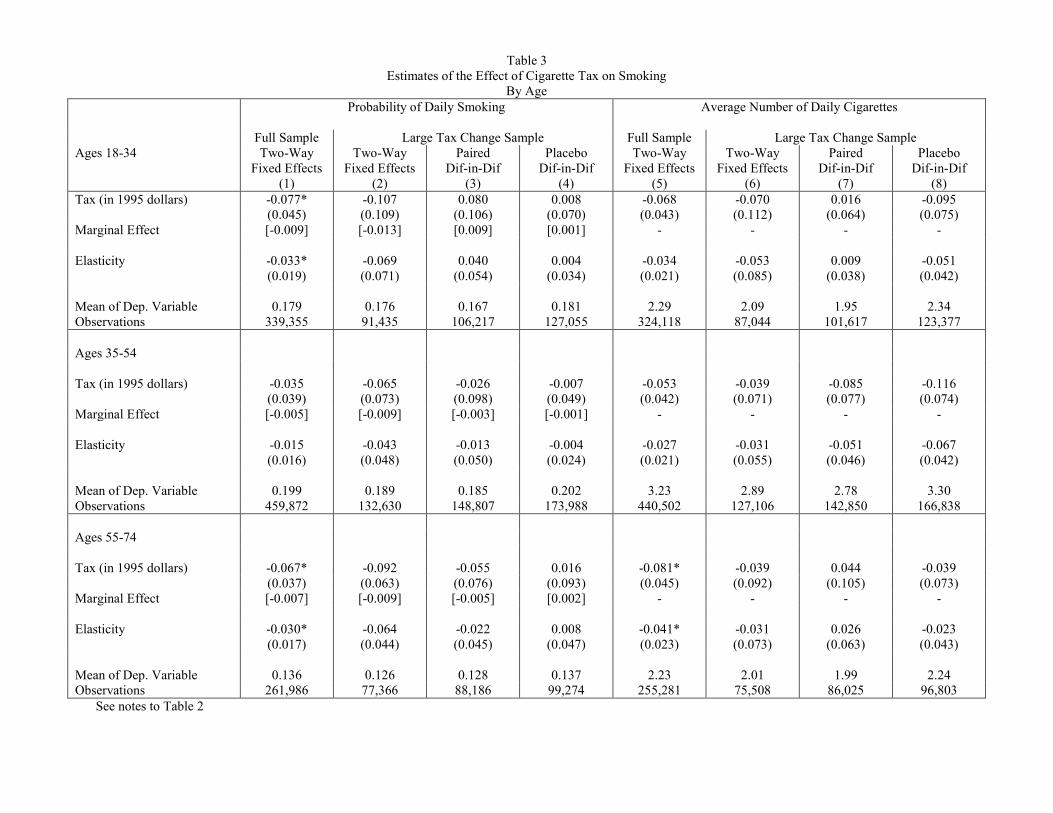
Table 3
Estimates of the Effect of Cigarette Tax on Smoking By Age
Probability of Daily Smoking
Average Number of Daily Cigarettes
Full Sample Large Tax Change Sample Full Sample Large Tax Change Sample Ages 18-34 Two-Way
Fixed Effects (1)
Two-Way Fixed Effects
(2)
Paired Dif-in-Dif
(3)
Placebo Dif-in-Dif
(4)
Two-Way Fixed Effects
(5)
Two-Way Fixed Effects
(6)
Paired Dif-in-Dif
(7)
Placebo Dif-in-Dif
(8) Tax (in 1995 dollars) -0.077* -0.107 0.080 0.008 -0.068 -0.070 0.016 -0.095 (0.045) (0.109) (0.106) (0.070) (0.043) (0.112) (0.064) (0.075) Marginal Effect [-0.009] [-0.013] [0.009] [0.001] - - - - Elasticity -0.033*
(0.019) -0.069 (0.071)
0.040 (0.054)
0.004 (0.034)
-0.034 (0.021)
-0.053 (0.085)
0.009 (0.038)
-0.051 (0.042)
Mean of Dep. Variable
0.179
0.176
0.167
0.181
2.29
2.09
1.95
2.34
Observations 339,355 91,435 106,217 127,055 324,118 87,044 101,617 123,377 Ages 35-54 Tax (in 1995 dollars) -0.035 -0.065 -0.026 -0.007 -0.053 -0.039 -0.085 -0.116 (0.039) (0.073) (0.098) (0.049) (0.042) (0.071) (0.077) (0.074) Marginal Effect [-0.005] [-0.009] [-0.003] [-0.001] - - - - Elasticity -0.015
(0.016) -0.043 (0.048)
-0.013 (0.050)
-0.004 (0.024)
-0.027 (0.021)
-0.031 (0.055)
-0.051 (0.046)
-0.067 (0.042)
Mean of Dep. Variable
0.199
0.189
0.185
0.202
3.23
2.89
2.78
3.30
Observations 459,872 132,630 148,807 173,988 440,502 127,106 142,850 166,838 Ages 55-74 Tax (in 1995 dollars) -0.067* -0.092 -0.055 0.016 -0.081* -0.039 0.044 -0.039 (0.037) (0.063) (0.076) (0.093) (0.045) (0.092) (0.105) (0.073) Marginal Effect [-0.007] [-0.009] [-0.005] [0.002] - - - - Elasticity -0.030*
(0.017) -0.064 (0.044)
-0.022 (0.045)
0.008 (0.047)
-0.041* (0.023)
-0.031 (0.073)
0.026 (0.063)
-0.023 (0.043)
Mean of Dep. Variable
0.136
0.126
0.128
0.137
2.23
2.01
1.99
2.24
Observations 261,986 77,366 88,186 99,274 255,281 75,508 86,025 96,803 See notes to Table 2
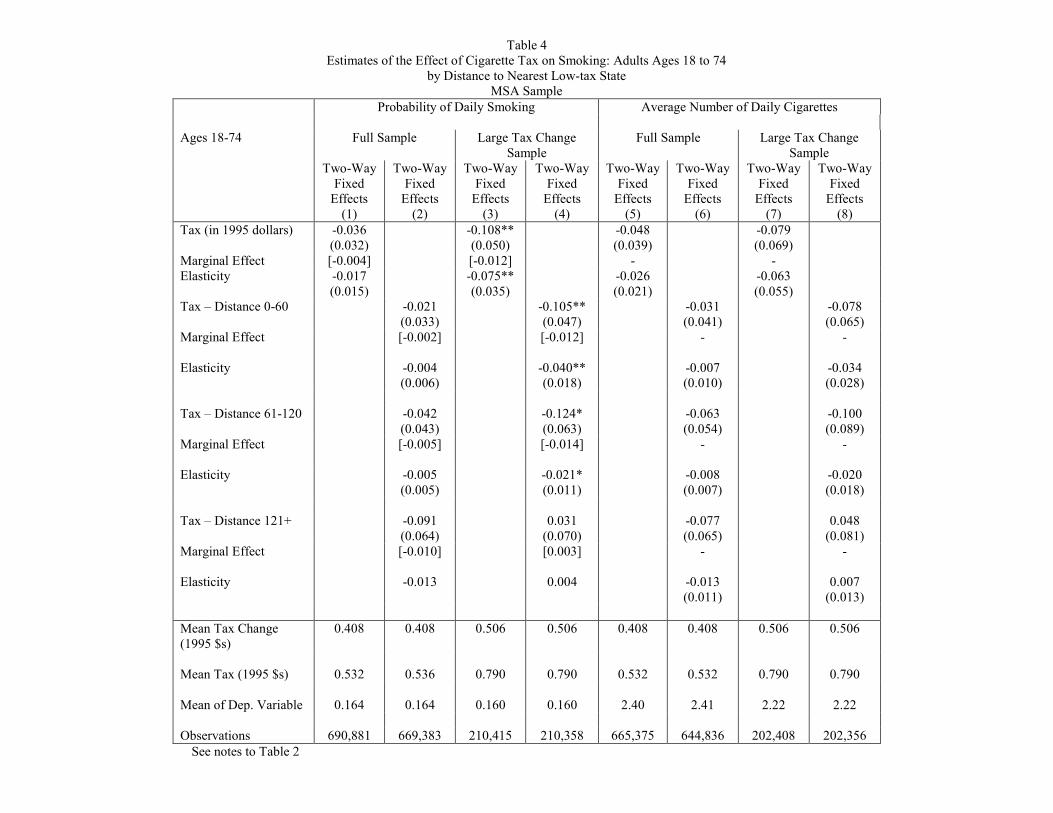
Table 4 Estimates of the Effect of Cigarette Tax on Smoking: Adults Ages 18 to 74
by Distance to Nearest Low-tax State MSA Sample
Probability of Daily Smoking Average Number of Daily Cigarettes Ages 18-74 Full Sample Large Tax Change
Sample Full Sample Large Tax Change
Sample Two-Way
Fixed Effects
(1)
Two-Way Fixed
Effects (2)
Two-Way Fixed
Effects (3)
Two-Way Fixed
Effects (4)
Two-Way Fixed
Effects (5)
Two-Way Fixed
Effects (6)
Two-Way Fixed
Effects (7)
Two-Way Fixed
Effects (8)
Tax (in 1995 dollars) -0.036 (0.032)
-0.108** (0.050)
-0.048 (0.039)
-0.079 (0.069)
Marginal Effect [-0.004] [-0.012] - - Elasticity -0.017
(0.015) -0.075**
(0.035) -0.026
(0.021) -0.063
(0.055)
Tax – Distance 0-60 -0.021 (0.033)
-0.105** (0.047)
-0.031 (0.041)
-0.078 (0.065)
Marginal Effect [-0.002]
[-0.012] - -
Elasticity -0.004 (0.006)
-0.040** (0.018)
-0.007 (0.010)
-0.034 (0.028)
Tax – Distance 61-120 -0.042
(0.043) -0.124*
(0.063) -0.063
(0.054) -0.100
(0.089) Marginal Effect [-0.005]
[-0.014] - -
Elasticity -0.005 (0.005)
-0.021* (0.011)
-0.008 (0.007)
-0.020 (0.018)
Tax – Distance 121+ -0.091
(0.064) 0.031
(0.070) -0.077
(0.065) 0.048
(0.081) Marginal Effect [-0.010]
[0.003] - -
Elasticity -0.013 0.004 -0.013 (0.011)
0.007 (0.013)
Mean Tax Change (1995 $s)
0.408 0.408 0.506 0.506 0.408 0.408 0.506 0.506
Mean Tax (1995 $s)
0.532
0.536
0.790
0.790
0.532
0.532
0.790
0.790
Mean of Dep. Variable
0.164
0.164
0.160
0.160
2.40
2.41
2.22
2.22
Observations 690,881 669,383 210,415 210,358 665,375 644,836 202,408 202,356
See notes to Table 2
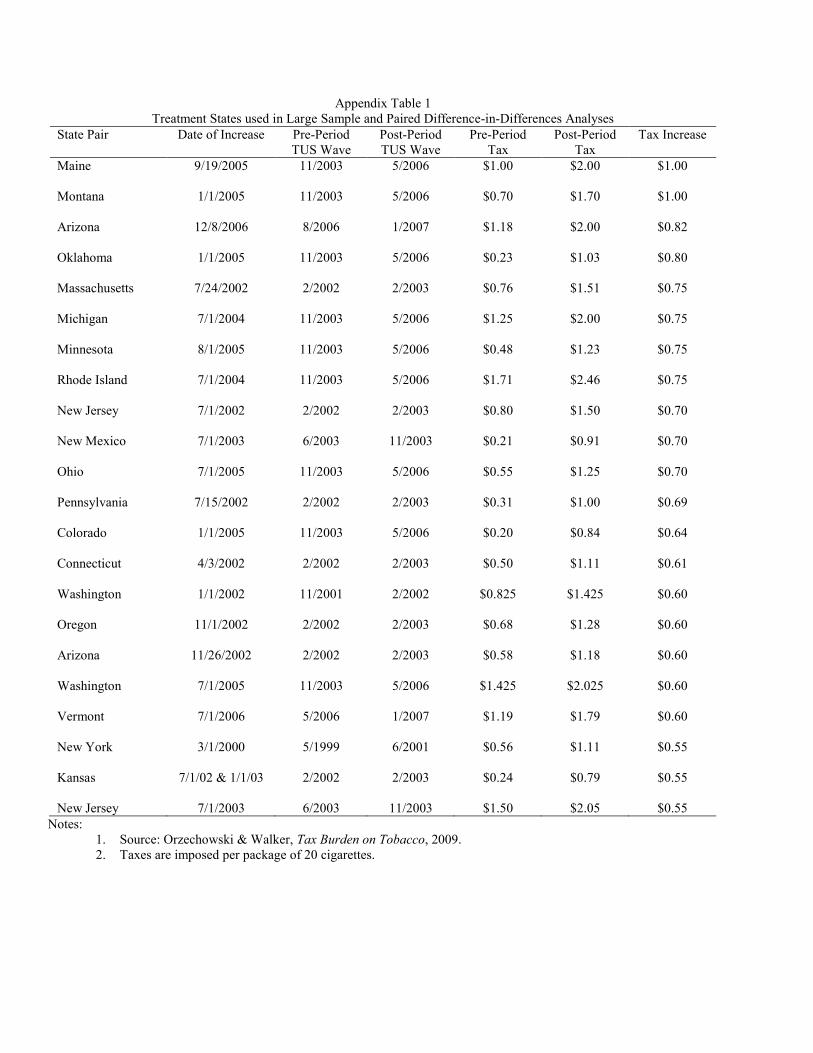
Appendix Table 1 Treatment States used in Large Sample and Paired Difference-in-Differences Analyses
State Pair Date of Increase Pre-Period TUS Wave
Post-Period TUS Wave
Pre-Period Tax
Post-Period Tax
Tax Increase
Maine 9/19/2005 11/2003 5/2006 $1.00 $2.00 $1.00 Montana 1/1/2005 11/2003 5/2006 $0.70 $1.70 $1.00 Arizona 12/8/2006 8/2006 1/2007 $1.18 $2.00 $0.82 Oklahoma 1/1/2005 11/2003 5/2006 $0.23 $1.03 $0.80 Massachusetts 7/24/2002 2/2002 2/2003 $0.76 $1.51 $0.75 Michigan 7/1/2004 11/2003 5/2006 $1.25 $2.00 $0.75 Minnesota 8/1/2005 11/2003 5/2006 $0.48 $1.23 $0.75 Rhode Island 7/1/2004 11/2003 5/2006 $1.71 $2.46 $0.75 New Jersey 7/1/2002 2/2002 2/2003 $0.80 $1.50 $0.70 New Mexico 7/1/2003 6/2003 11/2003 $0.21 $0.91 $0.70 Ohio 7/1/2005 11/2003 5/2006 $0.55 $1.25 $0.70 Pennsylvania 7/15/2002 2/2002 2/2003 $0.31 $1.00 $0.69 Colorado 1/1/2005 11/2003 5/2006 $0.20 $0.84 $0.64 Connecticut 4/3/2002 2/2002 2/2003 $0.50 $1.11 $0.61 Washington 1/1/2002 11/2001 2/2002 $0.825 $1.425 $0.60 Oregon 11/1/2002 2/2002 2/2003 $0.68 $1.28 $0.60 Arizona 11/26/2002 2/2002 2/2003 $0.58 $1.18 $0.60 Washington 7/1/2005 11/2003 5/2006 $1.425 $2.025 $0.60 Vermont 7/1/2006 5/2006 1/2007 $1.19 $1.79 $0.60 New York 3/1/2000 5/1999 6/2001 $0.56 $1.11 $0.55 Kansas 7/1/02 & 1/1/03 2/2002 2/2003 $0.24 $0.79 $0.55 New Jersey 7/1/2003 6/2003 11/2003 $1.50 $2.05 $0.55
Notes: 1. Source: Orzechowski & Walker, Tax Burden on Tobacco, 2009. 2. Taxes are imposed per package of 20 cigarettes.
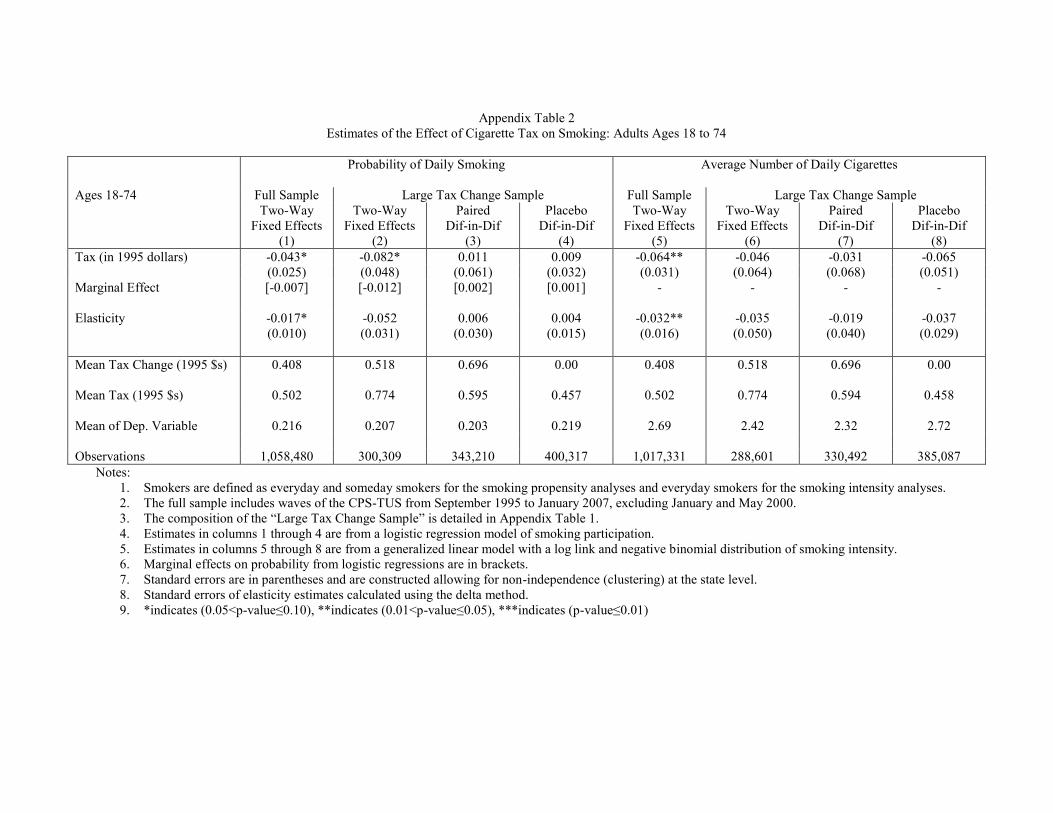
Appendix Table 2
Estimates of the Effect of Cigarette Tax on Smoking: Adults Ages 18 to 74
Probability of Daily Smoking
Average Number of Daily Cigarettes
Ages 18-74 Full Sample Large Tax Change Sample Full Sample Large Tax Change Sample Two-Way
Fixed Effects (1)
Two-Way Fixed Effects
(2)
Paired Dif-in-Dif
(3)
Placebo Dif-in-Dif
(4)
Two-Way Fixed Effects
(5)
Two-Way Fixed Effects
(6)
Paired Dif-in-Dif
(7)
Placebo Dif-in-Dif
(8) Tax (in 1995 dollars) -0.043* -0.082* 0.011 0.009 -0.064** -0.046 -0.031 -0.065 (0.025) (0.048) (0.061) (0.032) (0.031) (0.064) (0.068) (0.051) Marginal Effect [-0.007] [-0.012] [0.002] [0.001] - - - - Elasticity -0.017*
(0.010) -0.052 (0.031)
0.006 (0.030)
0.004 (0.015)
-0.032** (0.016)
-0.035 (0.050)
-0.019 (0.040)
-0.037 (0.029)
Mean Tax Change (1995 $s) 0.408 0.518 0.696 0.00 0.408 0.518 0.696 0.00 Mean Tax (1995 $s)
0.502
0.774
0.595
0.457
0.502
0.774
0.594
0.458
Mean of Dep. Variable
0.216
0.207
0.203
0.219
2.69
2.42
2.32
2.72
Observations 1,058,480 300,309 343,210 400,317 1,017,331 288,601 330,492 385,087
Notes: 1. Smokers are defined as everyday and someday smokers for the smoking propensity analyses and everyday smokers for the smoking intensity analyses. 2. The full sample includes waves of the CPS-TUS from September 1995 to January 2007, excluding January and May 2000. 3. The composition of the “Large Tax Change Sample” is detailed in Appendix Table 1. 4. Estimates in columns 1 through 4 are from a logistic regression model of smoking participation. 5. Estimates in columns 5 through 8 are from a generalized linear model with a log link and negative binomial distribution of smoking intensity. 6. Marginal effects on probability from logistic regressions are in brackets. 7. Standard errors are in parentheses and are constructed allowing for non-independence (clustering) at the state level. 8. Standard errors of elasticity estimates calculated using the delta method. 9. *indicates (0.05<p-value≤0.10), **indicates (0.01<p-value≤0.05), ***indicates (p-value≤0.01)
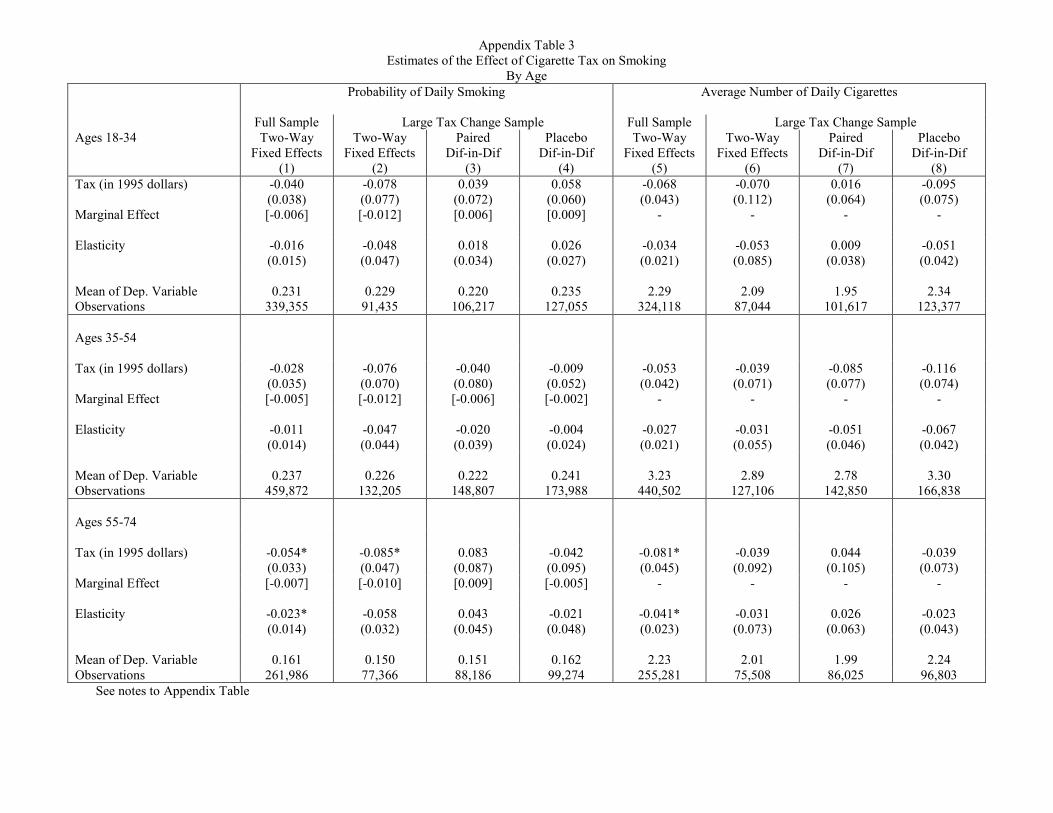
Appendix Table 3 Estimates of the Effect of Cigarette Tax on Smoking
By Age Probability of Daily Smoking
Average Number of Daily Cigarettes
Full Sample Large Tax Change Sample Full Sample Large Tax Change Sample Ages 18-34 Two-Way
Fixed Effects (1)
Two-Way Fixed Effects
(2)
Paired Dif-in-Dif
(3)
Placebo Dif-in-Dif
(4)
Two-Way Fixed Effects
(5)
Two-Way Fixed Effects
(6)
Paired Dif-in-Dif
(7)
Placebo Dif-in-Dif
(8) Tax (in 1995 dollars) -0.040 -0.078 0.039 0.058 -0.068 -0.070 0.016 -0.095 (0.038) (0.077) (0.072) (0.060) (0.043) (0.112) (0.064) (0.075) Marginal Effect [-0.006] [-0.012] [0.006] [0.009] - - - - Elasticity -0.016
(0.015) -0.048 (0.047)
0.018 (0.034)
0.026 (0.027)
-0.034 (0.021)
-0.053 (0.085)
0.009 (0.038)
-0.051 (0.042)
Mean of Dep. Variable
0.231
0.229
0.220
0.235
2.29
2.09
1.95
2.34
Observations 339,355 91,435 106,217 127,055 324,118 87,044 101,617 123,377 Ages 35-54 Tax (in 1995 dollars) -0.028 -0.076 -0.040 -0.009 -0.053 -0.039 -0.085 -0.116 (0.035) (0.070) (0.080) (0.052) (0.042) (0.071) (0.077) (0.074) Marginal Effect [-0.005] [-0.012] [-0.006] [-0.002] - - - - Elasticity -0.011
(0.014) -0.047 (0.044)
-0.020 (0.039)
-0.004 (0.024)
-0.027 (0.021)
-0.031 (0.055)
-0.051 (0.046)
-0.067 (0.042)
Mean of Dep. Variable
0.237
0.226
0.222
0.241
3.23
2.89
2.78
3.30
Observations 459,872 132,205 148,807 173,988 440,502 127,106 142,850 166,838 Ages 55-74 Tax (in 1995 dollars) -0.054* -0.085* 0.083 -0.042 -0.081* -0.039 0.044 -0.039 (0.033) (0.047) (0.087) (0.095) (0.045) (0.092) (0.105) (0.073) Marginal Effect [-0.007] [-0.010] [0.009] [-0.005] - - - - Elasticity -0.023*
(0.014) -0.058 (0.032)
0.043 (0.045)
-0.021 (0.048)
-0.041* (0.023)
-0.031 (0.073)
0.026 (0.063)
-0.023 (0.043)
Mean of Dep. Variable
0.161
0.150
0.151
0.162
2.23
2.01
1.99
2.24
Observations 261,986 77,366 88,186 99,274 255,281 75,508 86,025 96,803 See notes to Appendix Table