are we using support workers effectively? the relationship between patient and team characteristics...
TRANSCRIPT
Are we using support workers effectively? The relationship between patient and
team characteristics and support worker utilisation in older people’s
community-based rehabilitation services in England
Anna Moran PhD1, Susan Nancarrow BSc (Podiatry) MSc (Research) PhD
2, Pamela Enderby MBE PhD MSc FRCSLT
DSc (Hons)3 and Mike Bradburn MSc
3
1School of Community Health, Charles Sturt University, 2Health and Human Sciences, Southern Cross University,
Australia, and 3School of Health and Related Research, University of Sheffield, UK
Accepted for publication 2 February 2012
CorrespondenceAnna MoranSchool of Community HealthCharles Sturt UniversityPO Box 789, AlburyNSW 2640, AustraliaE-mail: [email protected]
What is known about this topic
d Support workers are utilised toincrease the flexibility and efficiencyof the health and social care work-force.
d Over 80% of community-basedrehabilitation services (CBRS) utilisesupport workers.
d CBRS staff perceive that supportworkers undertake the majority ofdirect patient care.
What this paper adds
d CBRS support workers do notundertake the greatest proportion ofdirect patient care, and the amountof care they provide is associatedwith patient and team factors.
d Less-dependent patients onadmission are more likely to havehigher proportion of supportworker input.
d Targeted utilisation of supportworkers according to patient andteam factors may enable a moreeffective use of the health andsocial care workforce.
AbstractThis research explores the relationship between support worker
utilisation and patient- and team-level characteristics using a prospectivelongitudinal study of 20 older people’s community rehabilitation teams.
Between January and September 2009, 462 Whole Time Equivalent Staff
and 1913 patients participated in the study. Patient dependency, health
status (Therapy Outcome Measures, EQ-5D and Levels of Care tool) and
demographic data were collected alongside detailed staff activity data
for patients during the recruitment period. Multivariate analyses were
used to determine the relationship between the proportion of care deliv-
ered by support workers team and patient variables. Support workersdelivered up to 36% of direct patient care and spent less time per patient
contact (36.0 minutes, SD 37.7, range 0–600) than qualified professionals
(mean time per contact 75.8 minutes, SD 32.9, range 0–334). Less-depen-
dent and female patients had a greater proportion of support worker
input, with a 4.9% increase in face-to-face support worker time for every
0.1 unit increase in EQ-5D (95% CI 0.3–9.6, P = 0.038), while females had
an additional 5.1% of their total contact time with support workers com-
pared with males (95% CI 1.9–8.4, P = 0.002). In an analysis without EQ-5D, older patients had a greater proportion of support worker time
(P = 0.006). Other factors associated with support worker input include
the referral source, intensity of care, usual living arrangements and pro-
portion of support staff in a team. Results indicate that patient- and
team-level factors are a determinant in the proportion of support worker
care delivered to older people in the community, suggesting that it may
be appropriate to introduce a more explicit targeted deployment of sup-
port workers based on patient-level characteristics, which may facilitatea more effective use of qualified practitioner time for more complex,
dependent patients.
Keywords: assistants, community rehabilitation, skill mix, support workers,
workforce
Introduction
Support workers are considered integral to service provi-
sion across many health settings. More than one million
support staff are utilised in public, voluntary and private
sector health and social care organisations across the
United Kingdom (Saks & Allsop 2007). Heralded as
conduits to increasing service capacity and improving
ª 2012 Blackwell Publishing Ltd 1
Health and Social Care in the Community (2012) doi: 10.1111/j.1365-2524.2012.01065.x

workforce efficiency within Community-Based Rehabili-tation Services (CBRS) (Rolfe et al. 1999, Stevenson 2000,
Hart et al. 2005, Stanmore et al. 2005, Stanmore & Water-
man 2007), over 80% of these services now utilise sup-
port workers to deliver care (Nancarrow et al. 2009).
Despite widespread deployment in CBRS, there is little
empirical evidence to demonstrate the cost benefits and
contribution support workers make to the delivery of
care in these settings.For the purpose of this research, the term support
worker refers to all workers who work with profession-
ally qualified staff who may have health or social care
training, such as National Vocational Qualifications, but
who do not have tertiary or equivalent qualifications.
These may include the following: assistants to profes-
sional groups (physiotherapy, occupational therapy,
social work, nursing, etc.), generic assistants (who workacross professional groups), technical instructors, health-
care workers, home helpers ⁄ enablers ⁄ carers and social
services support staff.
There are a number of assumptions about the way
that including support workers in the skill mix may be
used to enhance service outcomes. Managers report that
support workers are utilised for cost-effectiveness, flexi-
bility in working hours and also as a response toresource constraints such as nursing or therapist short-
ages (Thornley 2000). Within CBRS, support workers are
perceived as a means to enable more effective use of
qualified therapists, allowing them to concentrate more
on assessments, case management and complex treat-
ments by allocating prescribed treatment plans to assis-
tants (Russell & Kanny 1998, Steele & Wright 2001,
Mackey 2004, Reid 2004, Taylor & Birch 2004, Stanmore& Waterman 2007). As such, there is a perception
amongst CBRS staff that support workers undertake the
majority of direct patient care with qualified staff under-
taking a more assessment, triage and expert advisory
role (McClimens et al. 2010, Nancarrow et al. 2010).
Many of these assumptions have been translated into
policy directives in the UK. The role of support workers
has been endorsed as a means of increasing the flexibilityand efficiency of the workforce in meeting patient and
service needs (Department of Health 2000a,b, 2001,
2004). Given the current policy directives and assump-
tions, the increasingly ageing population and workforce
and the financial burdens of delivering care, the growth
in utilisation of support workers is likely to continue.
Yet the research findings on support worker skill mix
are varied, indicating that the use of less qualified staffmay not be effective in all situations (Buchan & Dal Poz
2002). In particular, there is a distinct lack of evidence
confirming the assumption that support workers facili-
tate improved workforce efficiency. Jenkins-Clarke &
Carr-Hill (2003), in their analysis of the activity and
workload of 5208 nurses and support staff from 19 hospi-tals in the UK, found that qualified nurses do not spend
more time on direct care when there are more support
staff present or when support staff undertake more time
on overheads ⁄ non-direct care. Furthermore, the authors
found that the speciality of the ward (paediatrics, ortho-
paedics, etc.) and patient severity did not consistently
have a large impact on the division of labour between
support and qualified staff. Overall, the study found thatthere was little difference in the types of tasks under-
taken by any level ⁄ type of staff. In CBRS, Knight et al.(2004) found similar levels of variation in activity among
generic support workers, with some spending nearly a
fifth of their time on administrative duties, while others
spent 95% of their time on therapeutic interventions.
This discrepancy between the perceived and actual
benefits of utilising support workers in CBRS is com-pounded by a lack of evidence to refute or confirm these
perceptions. Services and policy-makers therefore have a
limited evidence base from which to inform decisions
about staffing and delivering care. Given the ageing pop-
ulation and workforce, and increasing utilisation of ser-
vices like CBRS, there is a need to ensure the optimum
efficiency and appropriateness of the workforce in deliv-
ering their services to older people.A recent national survey of 171 CBRS found that 80%
of teams employ at least one whole time equivalent
(WTE) support worker, and on average, employ 10.6
WTE support workers (Nancarrow et al. 2009). However,
there are large variations across teams, and the way that
staff work and the client groups with which they work
are unclear.
The following research therefore aims to identify theproportion of direct care support workers deliver in
CBRS relative to qualified practitioners; to examine
whether or not patient and ⁄or team characteristics are
related to the proportion of care delivered by support
workers; and to examine whether the proportion of care
delivered by support worker is associated with patient
health status.
This research forms part of a larger 3-year mixedmethods research project investigating the impact of
workforce flexibility on the costs and outcomes of older
people’s services (Nancarrow et al. 2010).
Methods
The research involved a prospective longitudinal studyof 20 older people’s CBRS across England. Study partici-
pants included the teams, all staff involved in delivering
services within the teams and a cohort of newly admitted
patients to each team recruited consecutively over a 3-
month period. Data collection took place between Janu-
ary and September 2007.
A. Moran et al.
2 ª 2012 Blackwell Publishing Ltd
Recruitment
In the absence of a national database of older people’s
CBRS, several sources were drawn upon to recruit teams;
The community therapists’ network (n = 173 teams), Pri-
mary Care Trust (PCT) chief executives (n = 484) and sixlocal networks were contacted by post inviting them to
participate in a survey about intermediate care service
organisation and structure (Nancarrow et al. 2009).
Teams were eligible for inclusion if their primary cli-
ent base was people over the age of 65 and where their
clients received a package of care aimed at making
them more independent as classified by descriptive
information derived from a review of CBRS (Nancarrowet al. 2009b). All patients admitted to the team during
the recruitment period were eligible for inclusion. There
were no specific patient exclusion critieria for this
study.
Team staff members were responsible for identifying
and recruiting patients to the study. All staff involved in
the collection of patient-level data attended a half-day
training session in data collection and ethical recruit-ment. National Health Service ethical approval was
obtained in 2006 (06 ⁄ Q1606 ⁄ 132) and from Social Ser-
vices in January 2007.
Sampling
The teams that responded to the larger survey about
intermediate care service organisation and structure
(detailed above) (n = 186) were invited to participate in a
prospective study. Target recruitment was 20 teams,
with a view to represent diversity in terms of rurality,
host organisation (e.g. health- or social services-based)
and staffing models. All teams that expressed an interest
to participate in the prospective study and who were eli-gible for inclusion were recruited by consent of team
managers or leaders. Staff from participating teams were
formally invited to participate in the patient data collec-
tion process and written consent was gained.
A statistically generated power estimate was not cal-
culated for this study as this type of research and the
research questions being asked are exploratory and
novel in design. Team sample size was based on theresults from a scoping study of CBRS (Nancarrow et al.2009) and from a large-scale national evaluation of inter-
mediate care (Barton et al. 2005) where over 1000 patient
records from 10 teams over a 3-month recruitment per-
iod were generated and sound statistical analyses of
patient change in health status was possible from these
records. It was estimated therefore that the inclusion of
twenty teams would allow for around 2000 patientrecords to be collected and that this amount of data
would be sufficient to draw reasonably robust conclu-
sions.
Data collection
Data came from three sources: the Client Record Pack
(CRP), Service Proforma and Workforce Dynamics Ques-
tionnaire (WDQ; Box 1).
Client Record PackFor every patient recruited into the study, all staff mem-
bers completed a CRP, which captured detailed staffing
activity for every contact with the patient, as well as
detailed patient demographic and health dependency
information. This included type of contact provided
(face-to-face or administrative), job title and length of
time spent undertaking duties for or with the client. TheCRP also recorded patient demographics (year of birth,
gender), admission level of care need [using the Levels
of Care (LOC) tool; Box 2], admission and discharge
patient health status and other variables such as the
referring professional ⁄ organisation, usual living arrange-
ments and where care was delivered.
Patients were given an information sheet describing
the study and the way their data would be collected andused, and were given the option to ‘opt out’ of data col-
lection in line with Patient Information Advisory Group
(2006) guidelines.
Patient dependency and outcomes data were mea-
sured using the LOC tool, Therapy Outcome Measure
(TOMs) and the EQ-5D. The LOC tool is a matrix
describing eight possible categories of patient need. It
was used in this study as a proxy for the severity ofpatient illness, and to help identify potential groups of
patients based on their level of service requirement
(Enderby & Stevenson 2000). The TOMs scale is a thera-
pist-rated rehabilitation outcome measure containing
four dimensions: Impairment (degree of severity of dis-
order); Activity (degree of limitation); Social participa-
tion; and Wellbeing (effect on emotion ⁄ level of distress),
with each dimension scored from 0 to 5, including half-points. Lower scores indicate higher levels of severity
(Enderby et al. 2006). The EQ-5D is a patient-completed,
generic quality of life measure used to calculate quality-
adjusted life years (The Euroqual Group 1990). It uses a
single question to assess each of five health domains;
mobility, self-care, usual activities, pain ⁄discomfort and
anxiety ⁄ depression. The EQ-5D has a complex scoring
system, which ranges from 1, which indicates full health,to )0.59 (Dolan 1997).
Service ProformaAt team level, data depicting the WTE staff mix of each
team, were captured using a ‘Service Proforma’ (Nancar-
row et al. 2009), which was completed once at the begin-
ning of the study by the team leader. Of interest was the
proportion of WTE support staff in a team.
Rehabilitation support workers and outcomes
ª 2012 Blackwell Publishing Ltd 3
Workforce Dynamics QuestionnaireAt staff level, a WDQ was completed by all staff mem-
bers at the beginning of the prospective study at a train-
ing day held for all participating teams. The WDQ is a
validated, 58-item, Likert scale questionnaire, which is
self-completed by staff members. It explores 11 domains
of workforce flexibility in CBRS. It was developed and
validated in the context of older people’s CBRS to mea-
sure staff outcomes such as team integration and roleflexibility (Nancarrow et al. 2010). It is validated to do so
across teams, within teams and across different disciplin-
ary groups. Scores out of 100 are calculated for each sub-
scale, with 0 representing the worst possible outcome
and 100 representing the best possible outcome on the
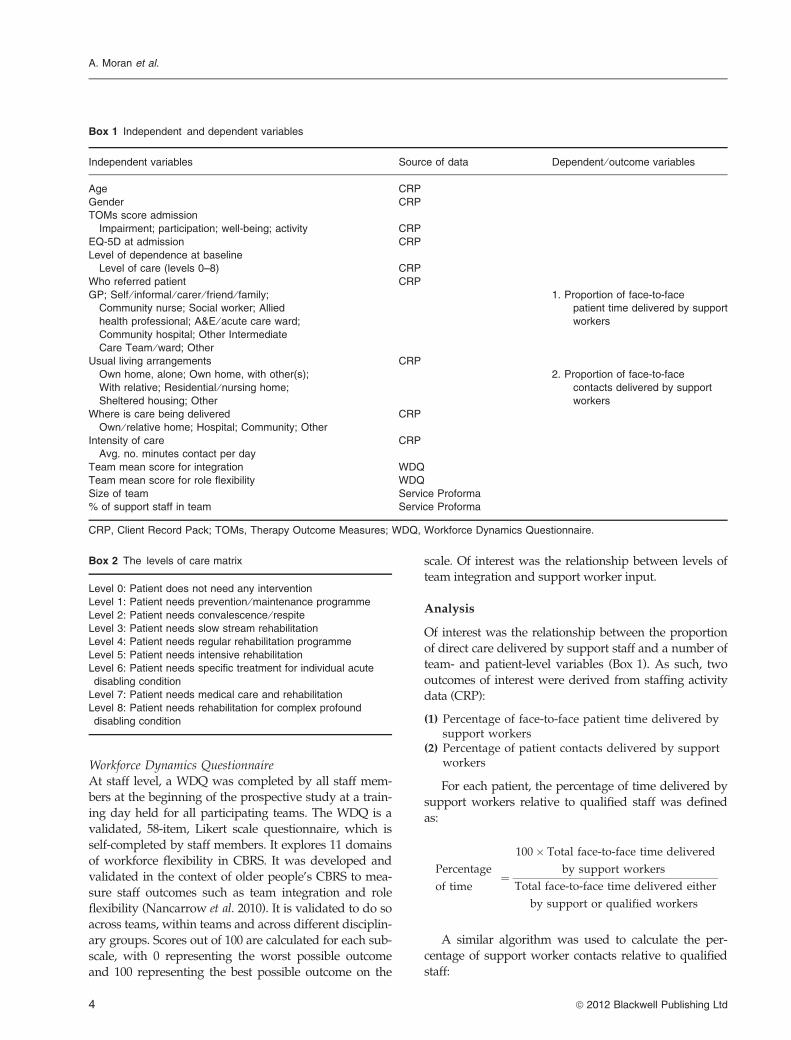
scale. Of interest was the relationship between levels ofteam integration and support worker input.
Analysis
Of interest was the relationship between the proportion
of direct care delivered by support staff and a number ofteam- and patient-level variables (Box 1). As such, two
outcomes of interest were derived from staffing activity
data (CRP):
(1) Percentage of face-to-face patient time delivered bysupport workers
(2) Percentage of patient contacts delivered by supportworkers
For each patient, the percentage of time delivered by
support workers relative to qualified staff was defined
as:
Percentage
of time¼
100� Total face-to-face time delivered
by support workers
Total face-to-face time delivered either
by support or qualified workers
A similar algorithm was used to calculate the per-
centage of support worker contacts relative to qualified
staff:
Box 2 The levels of care matrix
Level 0: Patient does not need any intervention
Level 1: Patient needs prevention ⁄ maintenance programme
Level 2: Patient needs convalescence ⁄ respite
Level 3: Patient needs slow stream rehabilitation
Level 4: Patient needs regular rehabilitation programme
Level 5: Patient needs intensive rehabilitation
Level 6: Patient needs specific treatment for individual acute
disabling condition
Level 7: Patient needs medical care and rehabilitation
Level 8: Patient needs rehabilitation for complex profound
disabling condition
Box 1 Independent and dependent variables
Independent variables Source of data Dependent ⁄ outcome variables
Age CRP
Gender CRP
TOMs score admission
Impairment; participation; well-being; activity CRP
EQ-5D at admission CRP
Level of dependence at baseline
Level of care (levels 0–8) CRP
Who referred patient CRP
GP; Self ⁄ informal ⁄ carer ⁄ friend ⁄ family;
Community nurse; Social worker; Allied
health professional; A&E ⁄ acute care ward;
Community hospital; Other Intermediate
Care Team ⁄ ward; Other
1. Proportion of face-to-face
patient time delivered by support
workers
Usual living arrangements CRP
Own home, alone; Own home, with other(s);
With relative; Residential ⁄ nursing home;
Sheltered housing; Other
2. Proportion of face-to-face
contacts delivered by support
workers
Where is care being delivered CRP
Own ⁄ relative home; Hospital; Community; Other
Intensity of care CRP
Avg. no. minutes contact per day
Team mean score for integration WDQ
Team mean score for role flexibility WDQ
Size of team Service Proforma
% of support staff in team Service Proforma
CRP, Client Record Pack; TOMs, Therapy Outcome Measures; WDQ, Workforce Dynamics Questionnaire.
A. Moran et al.
4 ª 2012 Blackwell Publishing Ltd
Percentage
of contacts¼
100�Number of face-to-face contacts
delivered by support workers
Number of face-to-face contacts delivered
either by support or qualified workers
Factors associated with support worker contribution tocareThe analysis strategy for all covariates was as follows:
univariate analyses were undertaken using a general-
ised least squares random-effects analysis clustering
on team. All covariates (Box 1) were then put into a
multivariate model, and those which had little impact
on any of the outcomes (P > 0.2) were manuallyremoved. The Stata statistical software (StataCorp LP,
College station, TX, USA) version 11.1 was used for
all data manipulation and analyses. Unstandardised
regression coefficients are presented, and indicate a
change in percentages: for example, females, on aver-
age, have an additional 4.5% of their total contact time
with support workers compared with males.
Missing dataMissing data were addressed in the following ways:The TOMs and EQ-5D scores were left blank if miss-
ing, and omitted from the analyses. The reported
results include only data that were complete. We ver-
ified the staff types by cross-checking patient-level
staff activity data against the service proforma. Miss-
ing data with respect to staff activity data (CRP)
were calculated separately for each team using the
average time spent by each type of practitioner ineither ‘face-to-face’ or ‘administration’. Staffing models
and assumptions were verified with team leaders,
where necessary. Where one or more items of data
were missing from any WDQ domain, we imputed
the individual mean score for that domain, unless all
data were missing, in which case, the item was not
calculated (Shrive et al. 2006).
Results
Expressions of interest were received from 27 teams to
participate in the prospective study and 20 were
included in the study. Complete CRPs and service pro-
formas were received for 1882 patients from 20 teams.
Complete staffing data were received for 1708 patients
with 298 WDQs received from staff across 20 teams.
Participating teams
Contextual and staffing data for participating teams
are summarised in Table 1. The most common type
of practitioner employed was support workers (95%),followed by physiotherapists (90%) and occupa-
tional therapists (90%). The mean percentage ofsupport workers per team was 41.1% (SD 14.9, range
0–82.4).
Patient characteristics
Of the 1882 patients for whom we received completepatient record packs, 63% were female with a mean age
of 79.7. Overall mean EQ-5D admission scores were low
across the board, with the average EQ-5D admission
score being 0.4 (SD 0.3, range )0.59 to 1), indicating that
the sample had generally poor health (1 is considered
full health and zero represents a health state considered
by the general population to be equally preferable to
being dead). The mean TOMs admission scores (3.1–3.7,range 0–5 for all domains) demonstrate that patients
admitted to these services also have moderate levels of
disability. Dependency at admission, as measured by the
EQ-5D, and TOMs impairment scores show some
differences between teams (Table 2). One-quarter of
all patients were identified as requiring a regular
rehabilitation programme at admission to the service
(LOC level 4) (Table 2).
Proportion of care delivered by support workers
Across all teams, the proportion of contacts delivered by
support workers was 31% and that by qualified staff,
69% (Table 3). The proportion of time patients spent withsupport workers was 27% and that with qualified staff,
73%. The mean time per contact for support workers
was 35.95 minutes compared to 75.76 minutes for quali-
fied staff. These results differed by team.
Factors associated with support worker
contribution to care
Univariate associations for outcomes of interest are pre-
sented in Table 4. Of the covariates considered for entry
(Box 1), a subset (TOMs, place in which care is being
delivered, team size, team integration and flexibility)
were found to be non-significant for all models. The
remaining covariates (the patient’s age, gender, EQ-5D atbaseline, level of dependence, professional referring,
usual living arrangements, intensity of intervention and
the percentage of support staff employed within their
care team) were generally found to be significant.
For ease of comparability, we present the same cova-
riates in the multivariate models for the two outcomes of
interest: (1) proportion of face-to-face patient time deliv-
ered by support workers (Tables 5 and 6) and (2) propor-tion of patient contacts delivered by support workers.
There were substantial missing data for two covariates
(EQ-5D at baseline, intensity of contact) both of which
were statistically significant. The approach taken was to
Rehabilitation support workers and outcomes
ª 2012 Blackwell Publishing Ltd 5

Table 1 Organisational characteristics of participating teams
Team ID Host
Location
(rural ⁄ urban)
WTE
clinical
staff*
No. diff.
type staff
Proportion of
WTE support
staff (%)‡Setting of care
provision
Patient
throughput (av
per annum)
A PCT Mixed 44.1 13 35 Client’s home 1800
B Social Services Urban 14.8 9 22 Client’s home 310
C PCT Urban 15.3 8 26 Client’s home 398
D PCT Rural 12.4 9 23 Client’s home 285
E PCT Rural 7.2 8 41 Client’s home 320
F Social Services Mixed 14.0 11 77 Resource Centre 183
G PCT Sub-urban 40.0 9 53 Client’s home 1650
J Acute Trust Urban 3.5 4 14 Accident and Emergency 777
L PCT Mixed 9.0 4 0 Client’s home 240
M PCT Urban 7.2 6 42 Client’s home 576
N PCT Urban 22.3 9 55 Client’s home 728
PA PCT 17.1 10 47 Client’s home 400
PB PCT Mixed 25.7 5 45 Community Hospital 166
Q Social Services Mixed 24.6 9 59 Client’s home 460
SA – – 24.3 8 24 Client’s home 365
SB PCT Sub-urban 50.7 11 37 Client’s home 2000
SG PCT Mixed 19.1 11 35 Client’s home 400
T PCT & Social Services Mixed 20.0 9 55 Client’s home 382
TA PCT & Social Services Mixed 19.1 10 46 Client’s home 267
U PCT Rural 6.0 4 50 Community hospital 533
PCT, Primary Care Trust; WTE, whole time equivalent.
*Excluding administrative staff.‡As a proportion of all clinical staff (not including administrative staff).
Table 2 Patient admission characteristics by team
Team ID n
Mean age
(SD)
Gender
(% female)
EQ-5D
(SD)
TOMs
Impairment
(SD)
TOMs
Activity
(SD)
TOMs
Participation
(SD)
TOMs
Wellbeing
(SD)
Modal level
of care need
(% patients)
A 313 80.2 (9.4) 193 (65) 0.4 (0.3) 3.3 (0.9) 3.2 (1.0) 3.2 (1.0) 3.7 (1.0) Level 4 (47)
B 85 83.8 (6.9) 64 (75) 0.5 (0.3) 3.1 (0.8) 3.3 (0.9) 3.2 (0.9) 3.6 (1.1) Level 3 (23)
C 18 72.3 (7.6) 12 (67) 0.3 (0.3) 3.3 (0.8) 2.9 (1.0) 2.7 (1.0) 3.7 (1.0) Level 5 (28)
D 53 80.5 (12.0) 32 (62) 0.4 (0.3) 2.8 (0.7) 3.0 (0.8) 3.3 (1.0) 3.7 (0.8) Level 4 (51)
E 69 78.6 (11.8) 46 (69) 0.3 (0.3) 3.1 (0.7) 3.0 (1.0) 3.4 (1.0) 3.8 (0.9) Level 3 (35)
F 52 82.4 (7.5) 40 (77) 0.4 (0.3) 3.2 (0.7) 3.3 (0.8) 3.7 (1.1) 3.9 (1.1) Level 4 (65)
G 173 78.0 (10.8) 113 (65) 0.3 (0.4) 3.3 (0.9) 3.2 (1.0) 3.3 (1.0) 3.9 (0.8) Level 3 (33)
J 81 81.5 (6.8) 65 (81) 0.5 (0.3) 3.2 (0.9) 3.2 (1.1) 3.5 (1.2) 4.1 (1.0) Level 1 (33)
L 30 77.8 (8.3) 18 (64) 0.5 (0.3) 2.5 (1.2) 3.3 (0.7) 3.2 (1.2) 3.6 (0.8) Level 6 (55)
M 98 82.0 (9.1) 58 (60) 0.4 (0.4) 3.3 (1.0) 3.1 (1.1) 3.5 (1.2) 3.9 (1.1) Level 4 (32)
N 100 80.5 (10.7) 66 (66) 0.5 (0.3) 3.1 (1.1) 2.9 (1.3) 3.2 (1.2) 3.7 (1.1) Level 1 (31)
PA 21 70.0 (12.6) 7 (39) 0.4 (0.3) 3.6 (1.1) 3.9 (0.6) 3.8 (0.8) 4.3 (0.5) Level 4 (64)
B 16 75.1 (12.0) 10 (71) 0.4 (0.3) 3.3 (0.9) 2.9 (0.9) 2.8 (0.7) 3.0 (0.8) Level 4 (81)
Q 46 80.3 (10.6) 28 (68) 0.6 (0.3) 2.9 (0.8) 2.9 (0.7) 2.7 (1.0) 3.5 (0.8) Level 4 (38)
SA 73 71.3 (14.2) 29 (43) 0.5 (0.3) 3.4 (1.0) 3.0 (1.1) 2.9 (1.0) 3.4 (1.0) Level 4 (41)
SB 225 82.9 (9.6) 144 (66) 0.3 (0.4) 3.1 (0.9) 3.2 (1.0) 2.8 (1.1) 3.6 (1.1) Level 4 (25)
SG 83 80.3 (6.1) 38 (68) 0.5 (0.3) 3.1 (0.8) 3.4 (0.9) 3.4 (1.2) 3.9 (0.9) Level 1 ⁄ Level
5 (26)
T 56 80.2 (11.2) 37 (76) 0.3 (0.4) 2.9 (1.0) 2.6 (1.1) 2.9 (1.2) 3.5 (1.1) Level 4 ⁄ Level
7 (28)
TA 241 76.5 (14.1) 158 (67) 0.4 (0.3) 3.1 (0.9) 3.1 (1.0) 3.2 (1.2) 3.6 (1.2) Level 3 (27)
U 49 82.4 (12.1) 32 (67) 0.2 (0.4) 2.5 (1.0) 2.6 (0.9) 2.7 (1.0) 3.3 (1.2) Level 7 (36)
All teams 1882 79.7 (11.0) 1190 (66) 0.4 (0.3) 3.1 (0.9) 3.1 (1.0) 3.2 (1.1) 3.7 (1.0) Level 4 (30)
TOMs, Therapy Outcome Measures.
A. Moran et al.
6 ª 2012 Blackwell Publishing Ltd

fit two models for each outcome: the first that includesthese terms (but uses less patients) (Table 5) and the sec-
ond that excludes them (an inferior model, but which
includes more patients) (Table 6). The resulting two
models allowed us to further investigate the relationship
between covariates and outcomes of interest with and
without the impact of patient dependency and intensity
of care.
Outcome (1): proportion of face-to-face patient timedelivered by support workersOn univariate analysis (Table 4), the most significant fac-
tors associated with a higher proportion of face-to-face
time with a support worker were increasing age (2.7%
increased support worker input for each increase in age
of 10 years) and being female (4.5% more input). None of
the dependency scores (TOMs or EQ-5D) was significantin this model.
However, clients requiring regular rehabilitation
(LOC 4) and intensive rehabilitation programmes (LOC
5) had around 12% more face-to-face time provided by a
support worker than clients who did not need any inter-
vention (LOC 0); required respite (LOC 2); or needed
treatment for an individual acute condition (LOC 6).
The source of referral produced surprising results,with patients who were referred from a community
hospital, and patients who had referred themselves hav-
ing 22% and 17% more face-to-face time with a support
worker respectively than those patients referred by a
general practitioner. The patient’s usual living arrange-
ments were also strongly associated with the proportion
of support worker input. Patients with more support (i.e.
living at home with a relative) received 10% less supportworker time than patients whose normal place of resi-
dence is a residential or nursing home. We included
‘usual living arrangements’ in the model on the assump-
tion that those patients who received their care at home,
and had a supporting relative, would require less sup-
port worker input. Patients who received their care in a
hospital received around 6% more of their care from sup-
port workers as compared with patients receiving care athome. More intensive models of care were also associ-
ated with higher support worker input.
Team characteristics (team size, measures of team
integration and role flexibility) were not associated with
proportion of support worker time. We included these
variables on the assumption that larger teams would be
more likely to have more support workers (Farndon &
Table 3 Proportion of face-to-face care delivered by support staff (by team)
Team ID
Total number of
face-to-face
contacts
Time per contact
support worker
(minutes)
Time per contact
qualified staff
(minutes)
Proportion of time
delivered by
support worker
(%)
Proportion of
contacts delivered
by support staff
(%)
Mean SD Mean SD Mean SD Mean SD
A 4908 43.4 28.1 81.0 17.7 29.1 22.1 34.7 25.8
B 2867 11.0 33.5 92.0 34.3 4.1 12.9 8.1 23.1
C 819 26.7 58.5 120.6 31.9 4.9 9.5 5.9 12.3
D 1960 34.0 24.6 66.6 20.8 37.1 28.9 41.6 30.9
E 1572 34.8 30.2 75.4 41.3 31.7 28.0 37.5 29.7
F 2749 28.6 22.2 55.0 26.0 49.5 34.2 56.3 35.4
G 1428 35.7 28.4 72.0 13.1 19.9 18.9 23.3 21.7
J 473 22.8 28.7 62.2 30.4 21.8 25.5 26.1 29.5
L* 343 1.9 6.8 72.9 18.5 0.7 2.1 1.3 4.6
M 1910 25.4 26.9 59.3 34.0 23.6 28.8 25.8 29.3
N 712 32.4 25.5 75.9 53.5 36.8 34.3 46.6 39.0
PA 469 35.4 40.1 100.9 34.1 24.6 31.3 27.7 33.2
PB – 88.1 12.2 88.7 12.5 40.7 3.4 40.9 5.0
Q 681 70.1 49.4 64.8 40.0 74.3 23.7 72.1 24.0
SA 2087 54.3 29.5 78.5 21.0 24.1 19.7 27.4 22.9
SB 5440 48.4 38.2 96.5 42.7 28.0 24.8 32.3 26.9
SG 65 28.7 18.3 52.3 16.6 17.9 14.3 21.7 14.7
T 1238 50.6 97.4 75.3 27.1 32.7 35.8 32.2 35.3
TA 5706 24.0 32.6 66.2 32.5 26.0 34.0 28.9 36.4
U 1356 32.7 32.8 80.9 27.9 28.0 29.9 30.2 31.2
All 36 783 36.0 37.7 75.8 32.9 27.0 28.1 30.8 30.4
*Team L reported that they had no support staff employed within their team (service proforma), but recorded the use of support staff
on occasion from other healthcare teams (staff activity data).
Rehabilitation support workers and outcomes
ª 2012 Blackwell Publishing Ltd 7

Nancarrow 2003) and that support worker utilisation
may be associated with better team integration (Nancar-
row 2004a, Moran et al. 2010) and more flexibility of staff
roles (Nancarrow 2003, Moran et al. 2010). Neither of
these relationships was shown to be true in this study.Not surprisingly, teams with a higher proportion of
support staff showed a slight increase in the proportion
of face-to-face time provided by support workers.
On multivariate analysis, model 1 (Table 5), incor-
porating the EQ-5D scores at baseline as a measure of
patient dependency and intensity of care, demonstrates
that patient dependency at admission had a significant
impact on the proportion of face-to-face time spentwith a support worker, with a 4.9% increase in face-
to-face support worker time for every 0.1 unit increase
in the EQ-5D (95% CI 0.3–9.6, P = 0.038). In other
Table 4 Univariate analysis for percentage of face-to-face patient time delivered by support workers (overall n = 1847)
Factor n
Unstandardised
regression
coefficient 95% CI P
Age (per 10 year increase) 1190 2.7 1.4, 4.0 <0.001
Gender (male as reference)* 4.5 1.7, 7.4 0.002
TOMs score on impairment at admission )0.3 )1.8, 1.2 0.701
TOMs score on activity at admission )0.5 )1.9, 0.9 0.476
TOMs score on participation at admission )0.1 )1.4, 1.1 0.835
TOMs score on wellbeing at admission 1.2 )0.1, 2.6 0.071
EQ-5D at admission (per 0.1 unit increase) 3.4 )0.9, 7.8 0.117
Level of dependence at baseline (level of care) <0.001
0 does not need any intervention 109
1 prevention ⁄ maintenance programme 248 2.7 )3.7, 9.1
2 convalescence ⁄ respite 43 )0.4 )10.3, 9.5
3 slow stream rehabilitation 315 8.3 2.0, 14.5
4 regular rehabilitation 488 12.0 6.0, 18.1
5 intensive rehabilitation 220 12.8 6.2, 19.4
6 specific treatment for acute condition 99 )1.1 )8.9, 6.8
7 medical care and rehabilitation 83 9.1 0.8, 17.3
8 rehabilitation for complex disabling condition 27 3.1 )8.5, 14.7
Who referred patient <0.001
General practitioner 330
Self ⁄ informal ⁄ carer ⁄ friend ⁄ family 22 17.0 5.1, 28.9
Community nurse 133 6.5 0.7, 12.3
Social worker 165 0.6 )5.3, 6.5
Allied health professional 384 5.2 0.7, 9.6
A&E ⁄ acute 135 4.2 )0.1, 8.6
Community hospital 103 22.2 15.6, 28.9
Other ICT ⁄ ward 13 10.2 )1.8, 22.3
Other 145 8.7 3.0, 14.3
Usual living arrangements 0.007
Own home, alone 804
Own home, with other(s) 529 )4.2 )7.2, )1.3
With relative 40 )8.1 )17.5, 1.3
Residential ⁄ nursing home 54 2.8 )4.5, 10.1
Sheltered housing 87 4.7 )1.5, 11.0
Other 11 )4.6 )21.0, 11.8
Where is care being delivered <0.001
Own ⁄ relative home 1201
Hospital 151 5.5 )9.0, 20.1
Community 305 2.0 )1.8, 5.7
Other 72 )22.1 )31.2, )13.1
Intensity (avg. no. minutes contact per day; log scale) 6.8 5.3, 8.4 <0.001
Team mean score for integration )0.1 )0.8, 0.6 0.770
Team mean score for role flexibility 0.2 )1.2, 1.5 0.806
Size of team 0.2 )0.3, 0.8 0.385
% of support staff in team 0.6 0.3, 0.9 <0.001
TOMs, Therapy Outcome Measures.
*On average, females have an additional 4.5% of their total contact time with support workers compared with males.
A. Moran et al.
8 ª 2012 Blackwell Publishing Ltd
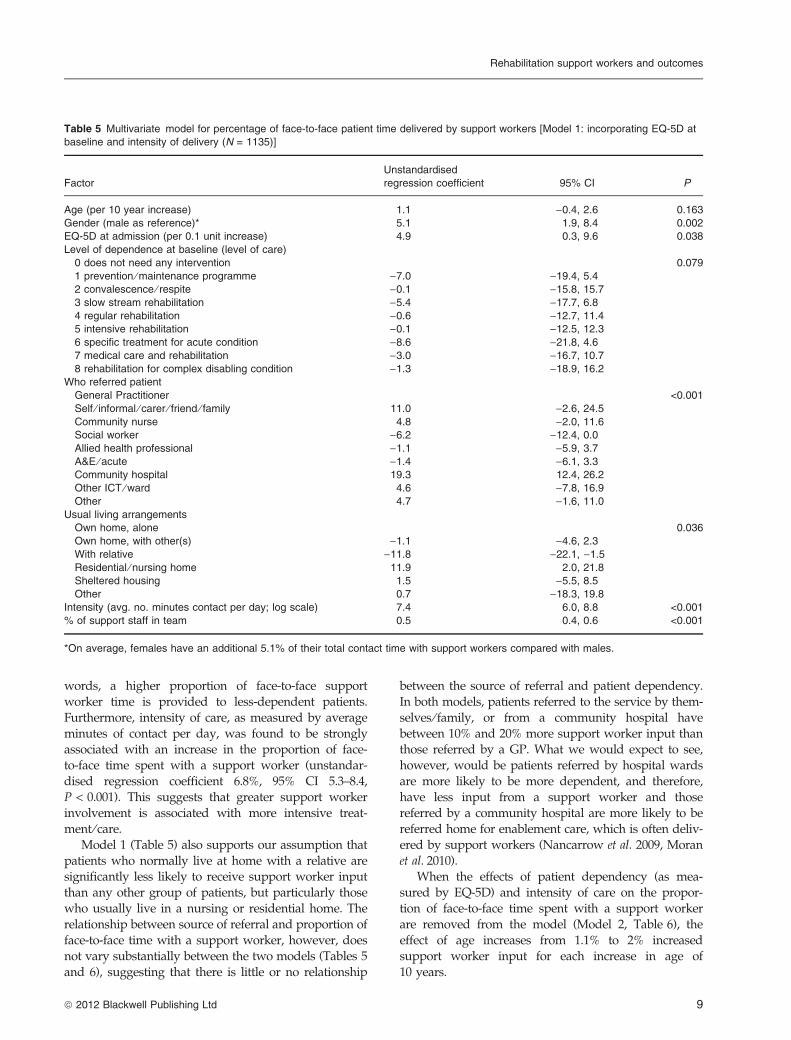
words, a higher proportion of face-to-face support
worker time is provided to less-dependent patients.
Furthermore, intensity of care, as measured by average
minutes of contact per day, was found to be stronglyassociated with an increase in the proportion of face-
to-face time spent with a support worker (unstandar-
dised regression coefficient 6.8%, 95% CI 5.3–8.4,
P < 0.001). This suggests that greater support worker
involvement is associated with more intensive treat-
ment ⁄ care.
Model 1 (Table 5) also supports our assumption that
patients who normally live at home with a relative aresignificantly less likely to receive support worker input
than any other group of patients, but particularly those
who usually live in a nursing or residential home. The
relationship between source of referral and proportion of
face-to-face time with a support worker, however, does
not vary substantially between the two models (Tables 5
and 6), suggesting that there is little or no relationship
between the source of referral and patient dependency.
In both models, patients referred to the service by them-
selves ⁄ family, or from a community hospital have
between 10% and 20% more support worker input thanthose referred by a GP. What we would expect to see,
however, would be patients referred by hospital wards
are more likely to be more dependent, and therefore,
have less input from a support worker and those
referred by a community hospital are more likely to be
referred home for enablement care, which is often deliv-
ered by support workers (Nancarrow et al. 2009, Moran
et al. 2010).When the effects of patient dependency (as mea-
sured by EQ-5D) and intensity of care on the propor-
tion of face-to-face time spent with a support worker
are removed from the model (Model 2, Table 6), the
effect of age increases from 1.1% to 2% increased
support worker input for each increase in age of
10 years.
Table 5 Multivariate model for percentage of face-to-face patient time delivered by support workers [Model 1: incorporating EQ-5D at
baseline and intensity of delivery (N = 1135)]
Factor
Unstandardised
regression coefficient 95% CI P
Age (per 10 year increase) 1.1 )0.4, 2.6 0.163
Gender (male as reference)* 5.1 1.9, 8.4 0.002
EQ-5D at admission (per 0.1 unit increase) 4.9 0.3, 9.6 0.038
Level of dependence at baseline (level of care)
0 does not need any intervention 0.079
1 prevention ⁄ maintenance programme )7.0 )19.4, 5.4
2 convalescence ⁄ respite )0.1 )15.8, 15.7
3 slow stream rehabilitation )5.4 )17.7, 6.8
4 regular rehabilitation )0.6 )12.7, 11.4
5 intensive rehabilitation )0.1 )12.5, 12.3
6 specific treatment for acute condition )8.6 )21.8, 4.6
7 medical care and rehabilitation )3.0 )16.7, 10.7
8 rehabilitation for complex disabling condition )1.3 )18.9, 16.2
Who referred patient
General Practitioner <0.001
Self ⁄ informal ⁄ carer ⁄ friend ⁄ family 11.0 )2.6, 24.5
Community nurse 4.8 )2.0, 11.6
Social worker )6.2 )12.4, 0.0
Allied health professional )1.1 )5.9, 3.7
A&E ⁄ acute )1.4 )6.1, 3.3
Community hospital 19.3 12.4, 26.2
Other ICT ⁄ ward 4.6 )7.8, 16.9
Other 4.7 )1.6, 11.0
Usual living arrangements
Own home, alone 0.036
Own home, with other(s) )1.1 )4.6, 2.3
With relative )11.8 )22.1, )1.5
Residential ⁄ nursing home 11.9 2.0, 21.8
Sheltered housing 1.5 )5.5, 8.5
Other 0.7 )18.3, 19.8
Intensity (avg. no. minutes contact per day; log scale) 7.4 6.0, 8.8 <0.001
% of support staff in team 0.5 0.4, 0.6 <0.001
*On average, females have an additional 5.1% of their total contact time with support workers compared with males.
Rehabilitation support workers and outcomes
ª 2012 Blackwell Publishing Ltd 9

Outcome (2): proportion of patient contacts delivered bysupport workersThe pattern of the relationships described above remains
the same when the percentage of face-to-face contacts isused as the independent variable: age (unstandardised
regression coefficient 2.4%, 95% CI 1.0–3.9, P = 0.001),
gender (unstandardised regression coefficient 2.9%, 95%
CI 0.4 to 6.1, P = 0.081) and % support staff in the team
(unstandardised regression coefficient 0.4%, 95% CI 0.3–
0.5, P < 0.001).
Discussion
This research demonstrates that although support work-
ers within CBRS do not undertake the greatest propor-
tion of the direct patient care workload compared with
qualified practitioners, the amount of care they provide
is associated with a number of patient- and team-level
factors. In summary, the results from this study demon-
strate that a higher proportion of input from support
workers, as measured by time and total face-to-face con-
tacts, is associated with the following patient and team
characteristics: decreasing patient dependency at admis-
sion, older age, being female, patients who normally livein a residential or nursing home, self-referral to the ser-
vice, referral by a community hospital, receiving a more
intensive model of care and having a higher proportion
of support staff in the team.
Research has demonstrated that there is little differ-
ence in the types of tasks undertaken by any level ⁄type of staff in acute hospitals in the UK (Jenkins-
Clarke & Carr-Hill 2003). The results of this study,however, indicate that CBRS may be better at differen-
tiating workload between staff types. Associations
were found between the proportion of support work-
ers in the team and the proportion of care delivered
by support staff, to the effect that a 1% increase in
proportion of support staff in the team was associated
with a 0.4% increase in support worker input with
patients (95% CI 0.3–05, P < 0.001).
Table 6 Multivariate model outcome for percentage of face-to-face patient time delivered by support workers [Model 2: excluding
EQ-5D at baseline and intensity of delivery (N = 1463)]
Factor
Unstandardised
regression coefficient 95% CI P
Age (per 10 year increase) 2.0 0.6, 3.4 0.006
Gender (male as reference)* 2.9 )0.2, 6.1 0.069
Level of dependence at baseline (level of care)
0 does not need any intervention <0.001
1 prevention ⁄ maintenance programme )0.4 )7.3, 6.5
2 convalescence ⁄ respite )0.3 )10.8, 10.2
3 slow stream rehabilitation 3.7 )3.1, 10.5
4 regular rehabilitation 8.8 2.2, 15.3
5 intensive rehabilitation 9.3 2.3, 16.3
6 specific treatment for acute condition )2.6 )10.8, 5.6
7 medical care and rehabilitation 8.7 0.1, 17.3
8 rehabilitation for complex disabling condition 1.9 )11.2, 14.9
Who referred patient
General Practitioner <0.001
Self ⁄ informal ⁄ carer ⁄ friend ⁄ family 14.9 1.5, 28.3
Community nurse 6.9 0.6, 13.2
Social worker )4.0 )9.9, 1.9
Allied health professional 4.1 )0.4, 8.7
A&E ⁄ acute 4.8 0.4, 9.1
Community hospital 23.8 16.7, 30.8
Other ICT ⁄ ward 10.1 )2.5, 22.7
Other 7.1 1.1, 13.1
Usual living arrangements
Own home, alone 0.257
Own home, with other(s) )2.3 )5.6, 1.0
With relative )9.9 )20.1, 0.3
Residential ⁄ nursing home 3.2 )4.4, 10.8
Sheltered housing 0.9 )5.8, 7.5
Other )0.3 )17.6, 17.1
% of support staff in team 0.4 0.3, 0.5 <0.001
*On average, females have an additional 2.9% of their total contact time with support workers compared with males.
A. Moran et al.
10 ª 2012 Blackwell Publishing Ltd
This suggests that as support worker numbers in theteam grow as a proportion of all staff members, so does
the proportion of care they deliver. Although a stronger
relationship was expected, as implied in the policy and
the evidence base, the association found may be partially
explained by the small amount of data available to deter-
mine the proportion of support staff at team level
(n = 20). The observed association, however, is further
supported by the finding that as the intensity of care pro-vided increased, so too did the proportion of support
worker input.
Another policy and service assumption that has
been partially confirmed by this research is the expec-
tation that support workers are utilised to ‘free-up’
qualified staff time (Russell & Kanny 1998, Steele &
Wright 2001, Mackey 2004, Taylor & Birch 2004). That
is, if qualified professionals focus their expertise andtime on more dependent patients with severe or com-
plex conditions (Anderson 1997, Saunders 1998,
Thornley 2000, Bowman et al. 2003, Leigh 2003, Reid
2004, Taylor & Birch 2004, Keeney et al. 2005), then
support workers should be spending a greater propor-
tion of their time with less impaired clients. The
results of this study demonstrate that in general this
was the case within CBRS with a higher proportion offace-to-face support worker time found to be directed
towards less-dependent patients. Once again, the
strength of the association is small, perhaps reflecting
the myriad external pressures that can and do impact
the organisation and type of care delivered by these
teams (McClimens et al. 2010).
The relationship between living arrangements and
support worker input is interesting. It suggests that liv-ing with a relative substantially reduces the likelihood of
a patient being seen by a support worker, indicating that
support workers are fulfilling some of the role normally
provided by family members. The trend for support
workers to play a carer role when providing health and
social care has been documented in other research (Bow-
man et al. 2003, Stanmore & Waterman 2007, Moran et al.2010). This relationship may also, in part, explain theincreased use of support workers by women. Older
women may be more likely to be living alone than older
men (Soule et al. 2005), thus increasing their need for
support.
As Nancarrow (2004a) and McClimens et al. (2010)
demonstrate, staff within CBRS perceive there to be a
clear division of labour between qualified staff and sup-
port workers, with support workers carrying out themajority of care provision and qualified practitioners
undertaking assessment, triage and care planning. Fur-
thermore, there is an overall acceptance that the provi-
sion of direct care is no longer effective use of qualified
practitioner time. Although the staff activity data suggest
that this division of labour is not as definite as that whichis perceived by CBRS staff and policy-makers, this
research goes some way to support these perceptions.
The findings also suggest that there may be further
potential for both groups of workers to be used more
systematically and effectively. For example, there is
potential for support workers to be deployed more sys-
tematically in patient care, possibly according to patient
severity, and for qualified staff to focus more on their‘expert’ role for more complex cases. These suggestions
reflect those reported in other workforce research. Sib-
bald, for example, has recently suggested that efficiency
gains are possible if general practitioners discontinue the
services that practice nurses provide and focus on the
tasks only doctors can perform (Sibbald 2008). Further-
more, analysis of patient outcomes as part of the longitu-
dinal component of this study demonstrated that agreater proportion of support worker input was associ-
ated with improved patient outcomes (Nancarrow et al.2010). This suggests that more focused utilisation of the
workforce according to patient admission characteristics
may have the potential to further influence the gains
observed in patient outcomes.
Study limitations
Workforce research is not straightforward. In an ideal
world, it would be possible to control for all external and
internal variables and therefore have a preferential skill-
mix with staff working optimally. These teams, however,
do not operate in a vacuum. There are many variablessuch as poor supporting services or staffing shortages
that influence their workforce efficiency (Nancarrow
2004b, McClimens et al. 2010). These variables may there-
fore account for the lack strength found in some of the
relationships explored between patient- and team-level
factors and support worker utilisation.
A key limitation to this study is the extent to which
the teams sampled and presented in this research arerepresentative of other community rehabilitation teams
in England and the heterogeneity of team composition,
structure and function. To overcome this limitation, the
sample of 27 teams was drawn from a much wider sur-
vey, which was sent to over 500 teams nationally (Nanc-
arrow et al. 2009a). The classification of and therefore
inclusion criteria for participating teams were based on a
comprehensive thematic analysis of policy documentsand peer-reviewed journals that sought to ‘define’ CBRS
(Nancarrow et al. 2009b). However, as has been reported
elsewhere, it is difficult to clearly define a community-
based rehabilitation team (Enderby & Stevenson 2000;
Enderby & Wade 2001) and the variability in teams, staff-
ing ratios and patient profiles within CBRS that has been
observed in this study and others (Enderby & Wade
Rehabilitation support workers and outcomes
ª 2012 Blackwell Publishing Ltd 11
2001; Nancarrow et al. 2009) reduces the strength of theconclusions we can draw. This reinforces the notion that
this is a complex area to research, and the heterogeneity
of community rehabilitation teams and lack of systematic
data collection to date mean that few studies attempt
comparisons at this level. To our knowledge, this is the
only study that has attempted to examine the relation-
ship between multidisciplinary staffing ratios in commu-
nity rehabilitation teams and patient profiles. Clearly,more research is needed in this area to help inform the
debate about the most effective, and cost-efficient way to
staff CBRS and the best way to measure skill-mix
changes.
This study has drawn on three main sources of data:
patient-level data, staff-level data and team-level data.
To undertake comparisons between the variables at a
team level has meant aggregating the findings fromsome of these variables, reducing the numbers of obser-
vations to 20, thus reducing the strength of the study to
draw conclusions at this level.
We have analysed and drawn conclusions on data
based on professional title or the difference between
‘support worker’ and ‘qualified professional’ rather than
on the specific roles carried out. Given the large
variations in the roles ascribed to each category, thesetitles are unlikely to be true reflections of the complexity
of the work performed by these practitioners. However,
recent evidence demonstrates that despite the heteroge-
neity of roles performed by support workers, there are
key generic features common to all support roles regard-
less of context (Moran et al. 2010).
We used EQ-5D in the multivariate analyses, as it is a
unidimensional measure of dependency, as opposed toTOMs, which has four domains. There is therefore a
chance that the choice of the EQ-5D over TOMs may
have limited the conclusions drawn from the analyses.
The LOC is also a measure of dependency, and inclusion
of this measure in the multivariate analyses reinforced
the relationship between dependency and support
worker input (although did not necessarily define the
direction of that dependency).The other significant limitation is that which is inher-
ent within an observational study, namely, that the vari-
ous relationships do not imply causality, and nor do
they suggest the direction of any causality. So, whilst
plausible explanations are possible that match up with
theory, rationales for policy and ⁄or intuition with each of
the identified relationships, these are best tested in a con-
trolled evaluation.
Conclusion
The ability and effectiveness of health and social care
services to delineate the workload carried out by
qualified and support workers is an important policyand service imperative. The findings of this research
demonstrate that rehabilitation teams for older people
based in the community are utilising their sup-
port:qualified skill-mix according to a number of
patient and team characteristics. In particular, this
research has provided evidence to suggest that sup-
port workers deliver a high proportion of care to
older people in the community and that they aremore likely to be involved in the care of older, female,
less-dependent patients. These findings suggest that
the targeted utilisation of support workers within a
support:qualified skill mix may enable a more effec-
tive use of qualified practitioner time and as such fur-
ther gains in workforce efficiency may be achieved.
Despite the findings of this research, there remains a
need for greater acknowledgement of the complexitiesthat influence workforce efficiency to provide more accu-
rate measures of the impact of skill-mix changes. In par-
ticular, that there are innumerable variables that will
have varying degrees of influence on how effective sup-
port workers are when added to the skill-mix and conse-
quently, the impact these variables have on the desired
effect they are intended to bring about.
Acknowledgement
This study was funded by National Institute for Health
Research Service Delivery and Organisation (NIHR SDO).
References
Anderson L. (1997) The introduction of generic workersinto the ward team: an exploratory study [erratumappears in J Nurs Manag 1997 Sep;5(5):319]. Journal ofNursing Management 5, 69–75.
Barton P., Bryan S., Glasby J. et al. (2005) A National Evalua-tion of the Costs and Outcomes of Intermediate Care for OlderPeople. Policy Research Programme, London, The Univer-sity of Birmingham and The University of Leicester.
Bowman S., Bray K., Leaver G., Pilcher T., Plowright C. &Stewart L. (2003) Health care assistants’ role, functionand development: results of a national survey. Nursing inCritical Care 8, 141–148.
Buchan J. & Dal Poz M.R. (2002) Skill mix in the healthcare workforce: reviewing the evidence. Bulletin of theWorld Health Organization 80, 575–580.
Department of Health (2000a) A Health Service of All the Tal-ents: Developing the NHS Workforce. Consultation Documenton the Review of Workforce Planning. HMSO, London.
Department of Health (2000b) Meeting the Challenge: AStrategy for the Allied Health Professions. HMSO, London.
Department of Health (2001) Working Together, LearningTogether: A Framework for Lifelong Learning for the NHS.HMSO, London.
Department of Health (2004) Social Care Workforce: Develop-ing a New National Agenda. HMSO, London.
A. Moran et al.
12 ª 2012 Blackwell Publishing Ltd
Dolon P. (1997) Modeling valuations for EuroQol healthstates. Medical Care 35, 1095–1108.
Enderby P. & Stevenson J. (2000) What is intermediate care?Looking at needs. Managing Community Care 8, 35–40.
Enderby P. & Wade D. (2001) Community rehabilitationin the United Kingdom. Clinical Rehabilitation 15, 577–581.
Enderby P., John A. & Petherham B. (2006) Therapy Out-come Measures for Rehabilitation Professionals. John Wileyand Sons Ltd., Chichester.
Farndon L. & Nancarrow S. (2003) Employment and careerdevelopment opportunities for podiatrists and foot care assis-tants in the NHS. British Journal of Podiatry 6 (4), 103–108.
Hart E., Lymbery M. & Gladman J. (2005) Away fromhome: an ethnographic study of transitional rehabilitai-ton scheme for older people in the UK. Social Science &Medicine 60, 1241–1250.
Jenkins-Clarke S. & Carr-Hill R. (2003) Workforce andWorkload: are nursing resources used effectively? Nurs-ing Times Research 8, 238–248.
Keeney S., Hasson F., Mckenna H. & Gillen P. (2005) Nurses’,midwives’ and patients’ perceptions of trained health careassistants. Journal of Advanced Nursing 50, 345–355.
Knight K., Lamer S. & Waters K. (2004) Evaluation of therole of the rehabilitation assistant. International Journal ofTherapy and Rehabilitation 11 (7), 311–317.
Leigh J. (2003) How a new health care assistant role cansupport junior doctors. Nursing Times 99, 32–34.
Mackey H. (2004) An extended role for support workers:the views of occupational therapists. International Journalof Therapy and Rehabilitation 11, 259–266.
McClimens A., Nancarrow S., Moran A., Enderby P. &Mitchell C. (2010) ‘Riding the bumpy seas’: the impact ofthe Knowledge Skills Framework component of theAgenda for Change initiative on staff in intermediatecare settings. Journal of Interprofessional Care 24, 70–79.
Moran A., Enderby P. & Nancarrow S. (2010) Defining andidentifying common elements of and contextual influ-ences on the roles of support workers in health andsocial care: a thematic analysis of the literature. Journal ofEvaluation in Clinical Practice, doi:10.1111/j.1365-2753.2010.01505.x.
Nancarrow S. (2003) Promoting flexibility in the intermedi-ate care workforce. Journal of Integrated Care 11, 25–30.
Nancarrow S. (2004a) Dynamic role boundaries in intermedi-ate care services. Journal of Interprofessional Care 18, 141–151.
Nancarrow S. (2004b) Improving intermediate care: givingpractitioners a voice. Journal of Integrated Care 12, 33–41.
Nancarrow S.A., Moran A., Freeman J., Enderby P., DixonS., Parker S. & Bradburn M. (2009) Looking inside theblack box of community rehabilitation and intermediatecare teams in the United Kingdom: an audit of serviceand staffing. Quality in Primary Care 17, 323–333.
Nancarrow S.A., Moran A.M. & Parker S.G. (2009a) Under-standing service context: development of a service proforma to describe and measure elderly peoples’ commu-nity and intermediate care services. Health & Social Carein the Community 17 (5), 434–446.
Nancarrow S., Moran A., Freeman J., Enderby P., Dixon S.& Parker S. (2009b) Looking inside the black box of com-munity rehabilitation and intermediate care teams in theUnited Kingdom: an audit of service and staffing config-uration. Quality in Primary Care 17 (5), 323–333.
Nancarrow S., Enderby P., Moran A. et al. (2010) The Rela-tionship Between Workforce Flexibility and the Costs and Out-comes of Older People’s Services. National Institute forHealth Research, Southampton.
Patient Information Advisory Group (2006) Informationabout Patients. An Introduction to the Patient InformationAdvisory Group for Health Professionals and Researchers.HMSO, London.
Reid C. (2004) Developing a tissue viability nursing assis-tant role. Nursing Standard 18, 68–72.
Rolfe G., Jackson N., Gardner L., Jasper M. & Gale A.(1999) Developing the role of the generic healthcare sup-port worker: phase 1 of an action research study. Interna-tional Journal of Nursing Studies 36, 323–334.
Russell K.V. & Kanny E.M. (1998) Use of aides in occupa-tional therapy practice. American Journal of OccupationalTherapy 52, 118–124.
Saks M. & Allsop J. (2007) Social policy, professional regu-lation and health support work in the United Kingdom.Social Policy and Society 6, 165–177.
Saunders L. (1998) Managing delegation, a field study of asystematic approach to delegation in out-patient physio-therapy. Physiotherapy 84, 547–555.
Shrive F.M., Stuart H., Quan H. & Ghali W.A. (2006) Deal-ing with missing data in a multi-question depressionscale: a comparison of imputation methods. BMC MedicalResearch Methodology 6, 57.
Sibbald B. (2008) Should primary care be nurse led? Yes.British Medical Journal, doi: 10.1136/bmj.39661.707083.59.
Stanmore E. & Waterman H. (2007) Crossing professionaland organizational boundaries: the implementation ofgeneric rehabilitation assistants within three organizationsin the northwest of England. Disability & Rehabilitation29, 751–759.
Stanmore E., Ormrod S. & Waterman H. (2005) New rolesin rehabilitation – the implications for nurses and otherprofessionals. Journal of Evaluation in Clinical Practice 12,656–664.
Steele V. & Wright R. (2001) Cutting it fine. Health ServiceJournal 111, 28.
Stevenson D. (2000) Rehabilitation outreach: a groundedtheory study. British Journal of Therapy & Rehabilitation 7,112–115.
Taylor L. & Birch J. (2004) Chemotherapy supportworker role: a one-year pilot. Cancer Nursing Practice 3,23–27.
The Euroqual Group (1990) EuroQol: a new facility for themeasurement of health related quality of life. Health Pol-icy 16, 199–208.
Thornley C. (2000) A question of competence? Re-evaluatingthe roles of the nursing auxiliary and health care assistantin the NHS. Journal of Clinical Nursing 9, 451–458.
Rehabilitation support workers and outcomes
ª 2012 Blackwell Publishing Ltd 13