are you creating or capturing value? a dynamic framework ... · are you creating or capturing value...
TRANSCRIPT

Mossavar-Rahmani Center for Business & Government
Weil Hall | Harvard Kennedy School | www.hks.harvard.edu/mrcbg
M-RCBG Associate Working Paper Series | No. 36
The views expressed in the M-RCBG Fellows and Graduate Student Research Paper Series are those of
the author(s) and do not necessarily reflect those of the Mossavar-Rahmani Center for Business &
Government or of Harvard University. The papers in this series have not undergone formal review and
approval; they are presented to elicit feedback and to encourage debate on important public policy
challenges. Copyright belongs to the author(s). Papers may be downloaded for personal use only.
Are You Creating or Capturing Value?
A dynamic framework for sustainable
strategy
Paul Verdin
Koen Tackx
January 2015
1
Are you creating or capturing value?
A dynamic framework for sustainable strategy
Paul Verdin Solvay Brussels School
of Economics and Management, Belgium Av. Franklin Roosevelt 42 – CP114/01 – B-1050
Brussels – Belgium [email protected]
+ 32 495 22 88 22
Mossavar-Rahmani Center for Business and Government, Harvard Kennedy School
79 J F Kennnedy Street Box 83 - Cambridge MA 02138 - USA
[email protected] + 1 617 495 8331
Koen Tackx Solvay Brussels School
of Economics and Management Av. Franklin Roosevelt 42 – CP114/01 – B-1050
Brussels – Belgium [email protected]
+32 475 80 58 29
Useful comments and suggestions by Prof. R. Zeckhauser and Senior Fellows at the M-RCBG (Harvard Kennedy School) are hereby gratefully acknowledged.
Any remaining errors or omissions are the authors’ responsibility.
2
Introduction
Is value the holy grail for every company? Definitely it is something executives, investors
and researchers are interested in since decades. If we only look at 4 major strategy
journals over the last 20 years (Strategic Management Journal, California Management
Review, Harvard Business Review and Sloan Management Review), together they
published 189 articles with the word value in the title, meaning that on average about
every month a new article was published focusing on the concept.
Yet, value is perhaps one of the most used and misused terms in the history of
management literature. To say the least, a lot of confusion persists not only about the
meaning of the term, even more about ways to achieve it in a sustainable way.
In this article, we start from a clear distinction between value creation and value
capturing and propose a simple and intuitive framework showing the critical role of
managing the interaction and the dynamics between these two strategic imperatives for
achieving sustainable success for any company. We illustrate the framework with recent
data from companies across a variety of industries providing further support for the
relevance of the model.
The Value Creation – Value Capturing framework (VC2)
We define value creation as the perceived benefit to the customer. This is in line with
the microeconomic concept of the utility of a company’s offering for its customers,
whether it enhances the quality of life for a final consumer (B2C) or increases the
profitability of a company (B2B). If a product or service is failing to do so, obviously
there is no point in bringing it to the market after all.
Offering a useful product or service alone is not sufficient. The pricing and cost
structures will have to accommodate sufficient value capturing1. The provider has to
generate sufficient revenue and profits for its shareholders. If the value created by a
private enterprise is not sufficiently captured, there is no long term viability of the
offering. Zooming in on the distinction and interaction of these two dimensions of value
creation and value capturing, leads us to the following dynamic model2 which is to be
seen as a framework to help us understand the strategic challenge affecting a company’s
situation in a given market or industry.

3
Figure 1: The Value Creation-Value Capturing (VC2) framework.
Waking up from the Dream
Let us start in the “dream” situation (bottom right in Fig. 1) where well established
companies generate substantial profits even if the value they create may be relatively
limited or even shrinking. This seems to hold for quite some companies with strong
market positions or (quasi-) monopolies, such as was the case for many players in
telecommunications, utilities or postal services before de-regulation and for the oil
majors in the 1960’ies, IBM in the 1980’ies and Kodak or De Beers up to the 1990’ies.
They all had been happily enjoying the benefits of their position, until anti-trust, de-
regulation or new competitors showed up, putting pressures on prices and margins. The
appearance and sudden growth of many newcomers, particularly those benefiting from
technology and internet based opportunities, provide many more examples of nicely
profitable businesses or industries under threat from creative newcomers, be it in the
taxi-business, hotel industry, financial services or retail sector. Pressures from
(de)regulation or “disruptive” innovators invariably push established companies to the
bottom left of figure 1 also known as “hell”.
At first, the pressure will go unnoticed and companies tend to be blinded by denial: “this
won’t happen to us”; “it will last our while”; “let’s enjoy the good times while they last”;
“business as usual” or “you don’t understand, we are different!”. However prices and

4
margins will be under pressure and provide a wake-up call, leading probably to some
strategic reflection and reaction. In reality, however, inertia often takes over, and the
tension between short term optimization and long-term strategic change often resolved
to the benefit of the former. The eternal fear of “cannibalization” clearly fits into this
mold.
Furthermore, a variety of stop-gap measures are at their disposal to try and avert or at
least delay the immediate pressures, potentially aggravating the eventual crisis in the
making. Such measures appear in different shapes and forms: price-fixing, colluding or
forming cartels, smuggling in hidden price increases3 or – just the opposite – cutting
prices in panic mode; cost-cutting and restructurings (without a cost-based strategy);
the usual suspects of “cross-selling” (even when the customer may not be interested in
“cross buying”), “one stop shopping” (even when the customer does not stop) or “value
added services” (without any value added); targeting “customer lock-in” rather than
creating true loyalty based on superior customer value; lobbying for more regulation;
and last but not least: mergers and acquisitions aimed at buying the competition rather
than beating them (in the name of economies of scale, synergies or “industry
consolidation”) just to name a few (all variations on what we call playing the “horizontal
game”, moving sideways in the lower part of the model).
Sooner or later defensive measures may not suffice to avert the fate of customer,
competitive or public pressures, pushing further towards the lower left corner: this is
“hell”! It is characterized by commoditization i.e. low value creation as well as low value
capturing (often referred to also as “commodity hell”, “the commodity trap” or “the
commodity magnet”4 ). This may be the plight or the final stage of companies in
declining industries before they end up in bankruptcy (e.g. American Airlines) or being
taken over (e.g. Nokia’s handset business).
Climbing out of Hell
The only way out of this situation is to start (re)focusing on creating more customer
value by making the offering more convincing towards customers. Such re-orientation
requires climbing the wall of innovation, represented by an upward move along the
vertical axis of our model, perhaps the most important strategic priority ever as stated
for example by former CEO Samuel Palmisano from IBM: “Either you innovate or you are
in commodity hell”.5

5
Creating and innovating value to customers of course requires hard work and long-term
investments. They are at the heart of strategic success, or at least the ultimate source
or key driver of it. And, as recent studies have argued and illustrated, and some based
on empirical evidence, there are only two ways to consistently add and create value
successfully: either by becoming the low(est)-price champion (requiring continuous “cost
innovation)” or by focusing on superior customer value (aiming for high price, requiring
continuous value innovation)6.
Simply put: unless you intend and manage to become the Wal-Mart or the Ryanair of
your industry offering the lowest – and ever lower – prices, your strategy should aim to
continuously offer better value – better than before, and better than competitors. Some
of the most recent findings seem to support the view that focusing on value in most
cases is the better way to go, rather than on price7. This allows capturing some of that
value by way of higher prices, while the low-price strategy should allow capturing more
thanks to ever lower costs (and the resulting volume increases).
We include here any kind of value innovation, covering the full spectrum from marginal
to radical or disruptive improvements in products, services or the business model8, as
long as they create additional value to the customer. It may be noted in passing that the
now so popular term of “disruptive” innovation in fact unduly reveals some defensive or
inward-looking bias, as in our view there is nothing disruptive or being disrupted for the
customer or consumer, only new opportunities and value added and the potential
disruption refers in the first place to the company offering it or being affected by the new
offering that risks being ‘disrupted’9.
It should be clear that value is created at the level of a company, not at the level of an
industry as Ted Levitt aptly argued now more than 50 years ago in his seminal article
“Market Myopia”: “In truth, there is no such thing as a growth industry, I believe. There
are only companies organized and operated to create and capitalize on growth
opportunities.”10 Since then it has also been repeatedly shown in a host of studies and
approaches that industry and other external factors in fact only explain only a small part
of the profitability variation across firms11, much in line with this perspective.
From Nightmare to Heaven
Value creation is a necessary but not sufficient condition for sustained superior
performance. If all you do is deliver value to customers and not keep enough in the
6
process you are obviously not in a good place, a situation that looks like a “nightmare”:
you work really hard at it, but do not get rewarded.
Such seems to be the situation of some established companies that manage to come up
with innovations that customers value but are not (yet) able to reap their benefits,
because of an ineffective business model or defective value proposition particularly in
highly competitive conditions (e.g. Philips).
Most if not all startups share this challenge. They may have large amounts of “eyeballs”
(see the dotcom bubble of 2000 or Facebook till recently) or even buyers (e.g. Amazon)
but little or no profit and can only survive as long as the investors keep holding faith that
sooner or later they will get handsomely rewarded (and thus move over to the upper
right as Facebook is).
By no means are we claiming that only later should we worry about value capturing,
since it may be hard to convince customers to start paying (more) later. As a principle it
seems that we should be able to align our pricing as much and as closely as possible with
the specific value bundle or value proposition we are offering. Paypal for instance
managed to adapt its pricing structure gradually in line with the features it was adding
over time and this may be at least one of the reasons for its success where other have
failed12 When you are able to do just that, you are well on the way to “heaven”.
Capturing value means that you should be able to turn your value creation (as realized in
a concrete value proposition) into a sustainable business, by means of what we usually
call a “business model” Strategy scholar David Teece for instance put it like this: “The
essence of a business model is in defining the manner by which the enterprise delivers
value to customers, entices customers to pay for value, and converts those payments to
profit”.13 This is the point where pricing becomes crucial14: the means to capture a
share of the value created to assure sustainability by providing return and resources for
further investment.
Nike is such a company that succeeded in creating more value for its customers by
approaching sequentially different sports through a “category offense”15 strategy while
focusing strongly on the customer experience rather than on the functional benefits.
Although at a lower level of both value creation and value capturing than Nike, Singapore
Airlines as well as Southwest Airlines or Ryanair at the other end of the spectrum
outperform their direct competitors on both dimensions thanks to a clear and ever
7
improving value proposition, remaining very profitable in a harsh industry and economic
environment.
In so doing we can arrive in “heaven” at last – however it is not a heaven where you can
sit back and relax. Even though the temptation will be there, especially when you have
been successful and you have created your new product, market, industry and gained a
respectable position, you cannot rest on your laurels. As more and more markets and
cases show, there hardly ever exists an inherently sustainable advantage. Ultimately
sustainability will result from our ability to constantly innovate, uphold and improve our
value (proposition) to the customer (as increasingly illustrated and argued, e.g. in the
recent contributions on “transient advantage”16 and “repeatability”17).
If you focus too much on the value capturing at the expenses of continued value
creation, you risk of falling into the trap of “the failure of success”. Most companies have
encountered this at some point in time, and many of them have not been able to keep up
their position or the record of success. For instance, only 13.4% of the companies that
were in the Fortune top 500 in 1955 are still there today18 and the average number of
years a company survives on that same list is now less than 15 years19.
There seems to be a certain “law of gravity” which pulls us invariably down from heaven,
by weakening our relative value creation efforts and putting us to sleep (in the dream
scenario), as we become too focused on optimizing the capturing (reflected in misleading
metrics like percentages margin, market share etc.) We may even increase our
capturing, while our value creation is going down, by milking, harvesting, improving
short-term financial results, while cutting investments and losing sight of future value
creation, until de-regulation, anti-trust, and/or new competitors show up pushing us into
the defensive, and eventually challenging our survival.
This type of movement can occur very quickly as shown by recent examples such as
Nokia and Blackberry in the mobile phone handset business, and it seems that the time
between the comfortable “dream” and a scramble for survival in “hell” has been shrinking
at a rapid pace, particularly in those areas where new technologies (and internet-based
models that often exhibit “winner-takes-all” features) increasingly dominate. Our
empirical results below on a large group of Fortune 500 companies illustrate and
elaborate on these points.
The dynamic picture
8
In sum, looking back at Fig. 1, for existing companies there is a natural clockwise flow
from the dream (lower right box) to the heaven (upper left box) through the
intermediate stages of hell and nightmare. From dream to hell we are pushed by the
inability to react to competitive or regulatory pressure. Successful companies find new
ways to create value for their customers and move vertically. If they also succeed in
monetizing their offering the shift towards heaven will occur. Once arrived in the heaven
situation, continuous improvement is needed in order not to become complacent and
resist the continuous temptation of slipping into a dream.
Most successful new entrants enter in the upper left: they found a new way to create
value for a number of customers who appreciate and are buying the product or services.
Unfortunately, quite a lot of these companies (even large ones like Amazon) do not
immediately succeed to extract a substantial profit from their offering and risk to
disappear if they do not deliver or manage to uphold investors’ expectations.
This tension between creation and capturing culminates to the point where we realize
that the only reliable way to know and test whether we are actually are creating
sufficient value remains… whether we are able to capture (enough of) it in the wake of
increasing competition. It is therefore not even “willingness to pay” but ultimately
whatever the customer is actually paying or has paid for, that matters most.
Measuring value creation and value capturing
While our framework is essentially conceptual, and at first sight perhaps no more than a
formalized “metaphor”, we can illustrate it empirically with actual data from major
companies across a variety of industries.
Even though clearly there are no “perfect” measures for both axes, we propose a simple
methodology to quantify the dimensions of value capturing and value creation at
company, yielding rather illuminating and sensible results supporting the key messages
and interpretations of our model.
For value capturing we refer to known measures of profit or profitability. For our
purpose, and since we are interested in operational results rather than financial leverage,
we use net profit divided by total assets as an indication of how much value (profit) a
firm is able to extract from the used resources (assets). It is a broadly used measure, is
relatively robust to financial market fluctuations or financing strategies20 and can be used
for comparisons with other studies.

9
Finding an appropriate measure for value creation is less obvious. If an appropriate and
generally accepted or applicable measure existed, value creation would have long been
better considered and integrated in strategy development and day-to-day management.
Actual value received or perceived can never be directly measured as micro-economic
theorists have long realized. Only by deduction can we conclude that if customers are
buying and paying the price, their expected value should exceed the price they paid.
Given these conceptual issues we turned to brand value as a reasonable proxy
representing the value creation as intended in our framework. As a “stock” or “strategic
resource” concept rather than the “flow” aspect of “expenses”, it can be seen as an
indicator of all the value that has been created over time and therefore has the benefit of
not depending on short term fluctuations or budget manipulations. True to the long-term
dynamic nature of our framework, and within the limits of available data, we collected
observations over a five year period (2008-2012). A more detailed description of the
methodology, the data sources and the list of companies covered, can be found in the
appendix.
General Overview
Figure 3: Companies’ position and movement (by industry) in the VC2 framework (2008-
2012). F&B=Food and Beverage
10
In the above scatter graph we grouped the firms into 18 industries or sectors21 (Fig. 3).
The X-axis represents Return on Assets as a measure of Value Capturing, and the Y-axis
represents Brand Value over Revenues as a measure of Value Creation. For each sector
we provide the companies’ position at the start of the observed period (2008) and at the
end (2012), with arrows indicating the sense of the movement over this period.
Clearly companies in sectors like Airlines, Telecom, Tires and Rubber and Conglomerates
seem to be struggling in “hell” (bottom right), more recently joined by those in Retail,
while Pharma, Cable and of course Oil companies seem to be more favorably positioned
in the “dream” scenario, indeed sectors that are traditionally characterized by a limited
competition (thus relatively less pressure to innovate and create value as a condition for
their continued value capturing). Companies in Apparel, Food and Beverage, Personal
Care, as well as Internet and Software seem to be much higher up (upper left).
At this aggregate level, it seems significant to observe that the majority of companies
have been moving down on both the value capturing and the value creation dimension
over the period observed, in what is probably a very clear manifestation of the “economic
crisis” during these times. Not only has value capturing clearly suffered during the crisis
it may be seen just as well as a crisis of value creation.
The slashing of investments in innovation, R&D, management development, and the
coinciding hoarding of cash especially on the balance sheets of most large established
companies is undoubtedly related to this general drop in value creation. In only few
industries in our sample were companies able to increase both their value created and
captured over this period of time (see companies in logistics, aerospace & defense,
rubber and cable).
Far more interesting is it to zoom in on the situation and the movements of individual
companies over the given period, as illustrated next.
Specific companies within their respective industries
a. Retail Companies
As noted above, most retail companies seem to be struggling in “hell” as shown in Fig. 4
below. Two of the main contenders in the US, Wal-Mart and Target are doing
significantly better than their main competitors, the latter scoring somewhat higher on
the value creation dimension. Tesco that was up in heaven showed early signs of

11
deteriorating in our framework probably just the precursor of the big slide that was just
around the corner.
In the meantime some of the also-rans in the lower left have initiated attempts and
strategies to try and climb out of the black hole, most notably Carrefour, aggressively
restructuring major international operations to refocus on domestic improvement. Initial
results seem to be positive if still subdued, only underscoring the difficulty of moving up
the vertical axis, especially under tough competitive pressures.
Although Amazon is not in our database (because too small in 2008) we mark their 2012
position up in the high left, way off the chart, showing poor financial performance, while
obviously creating a lot of perceived value for its customers and leaving the question how
and when they will move over to the upper right.
Figure 4: Retail Companies in the VC2 framework.
12
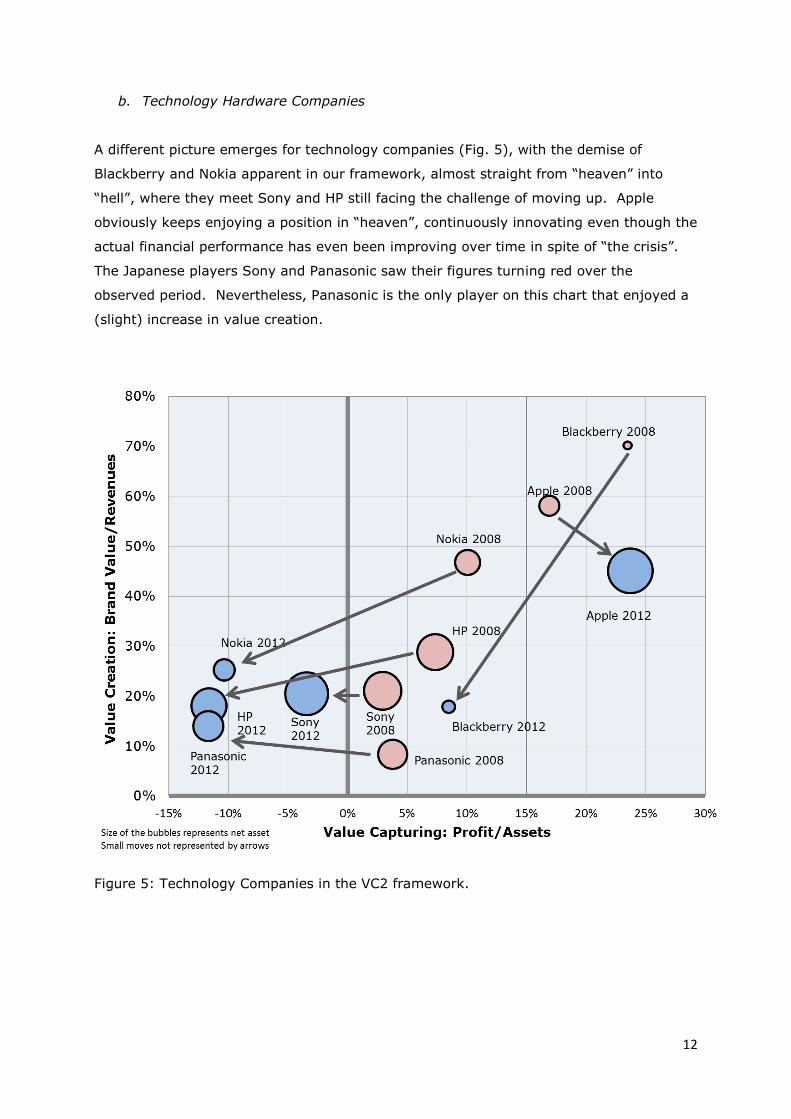
b. Technology Hardware Companies
A different picture emerges for technology companies (Fig. 5), with the demise of
Blackberry and Nokia apparent in our framework, almost straight from “heaven” into
“hell”, where they meet Sony and HP still facing the challenge of moving up. Apple
obviously keeps enjoying a position in “heaven”, continuously innovating even though the
actual financial performance has even been improving over time in spite of “the crisis”.
The Japanese players Sony and Panasonic saw their figures turning red over the
observed period. Nevertheless, Panasonic is the only player on this chart that enjoyed a
(slight) increase in value creation.
Figure 5: Technology Companies in the VC2 framework.
13
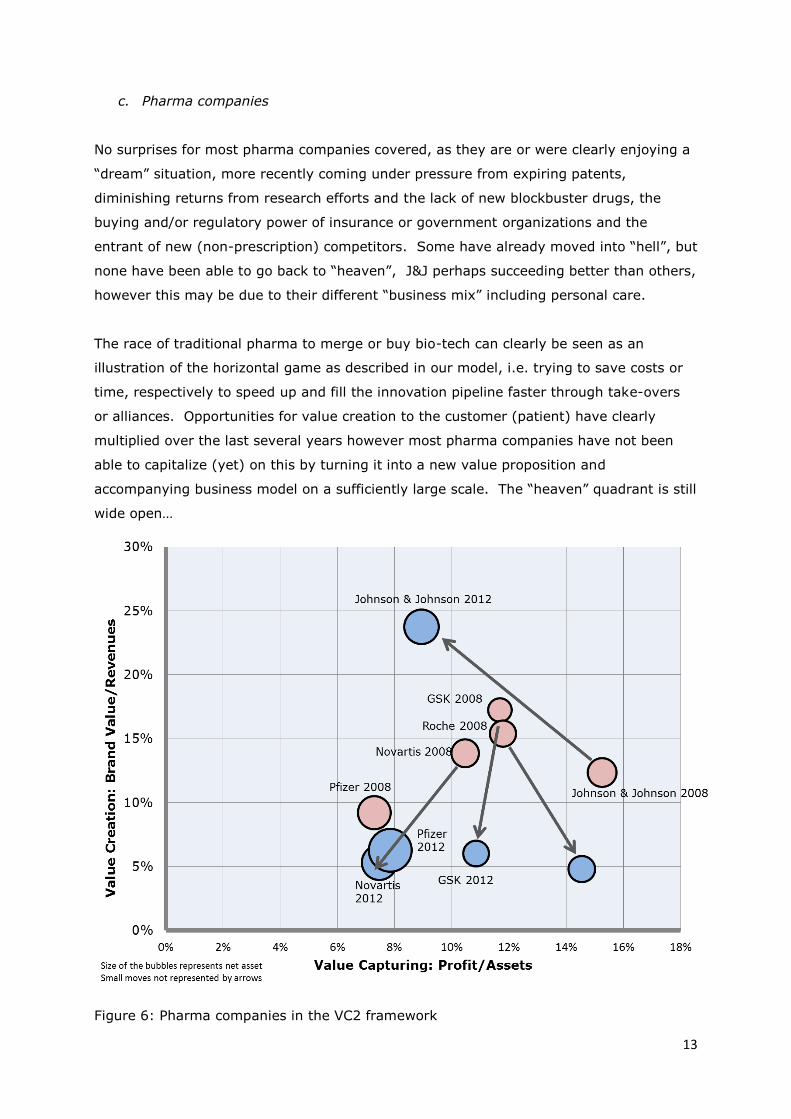
c. Pharma companies
No surprises for most pharma companies covered, as they are or were clearly enjoying a
“dream” situation, more recently coming under pressure from expiring patents,
diminishing returns from research efforts and the lack of new blockbuster drugs, the
buying and/or regulatory power of insurance or government organizations and the
entrant of new (non-prescription) competitors. Some have already moved into “hell”, but
none have been able to go back to “heaven”, J&J perhaps succeeding better than others,
however this may be due to their different “business mix” including personal care.
The race of traditional pharma to merge or buy bio-tech can clearly be seen as an
illustration of the horizontal game as described in our model, i.e. trying to save costs or
time, respectively to speed up and fill the innovation pipeline faster through take-overs
or alliances. Opportunities for value creation to the customer (patient) have clearly
multiplied over the last several years however most pharma companies have not been
able to capitalize (yet) on this by turning it into a new value proposition and
accompanying business model on a sufficiently large scale. The “heaven” quadrant is still
wide open…
Figure 6: Pharma companies in the VC2 framework
14
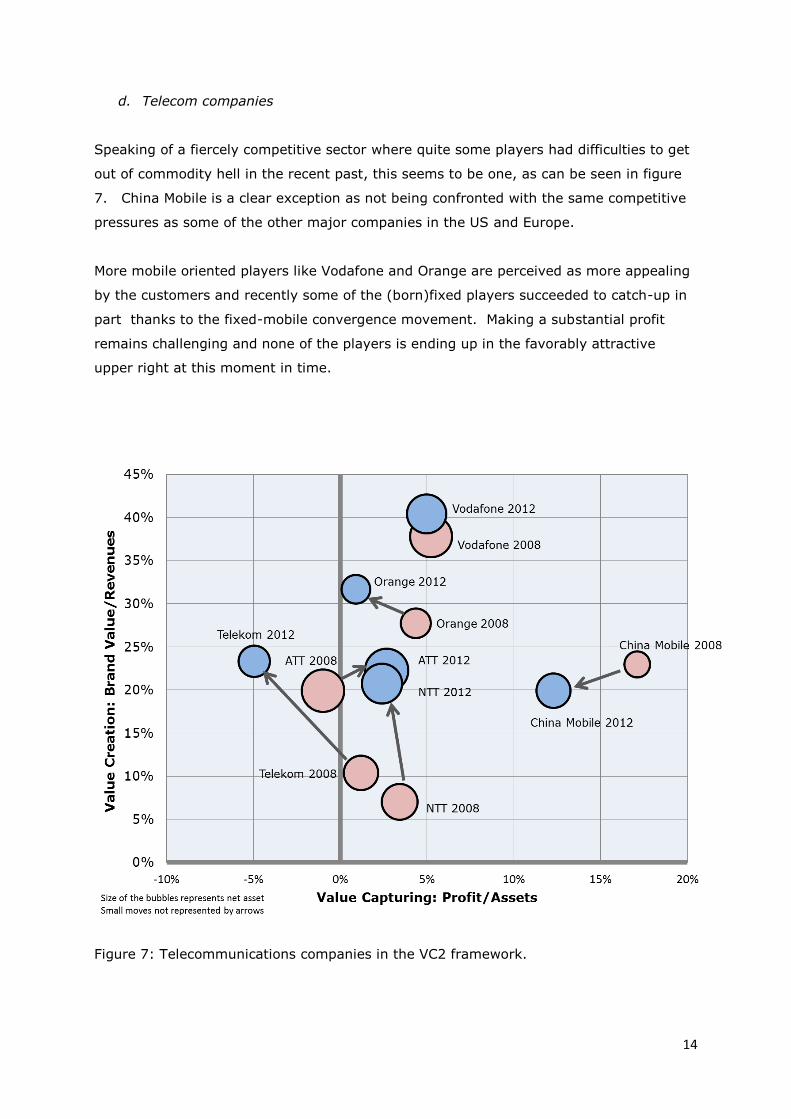
d. Telecom companies
Speaking of a fiercely competitive sector where quite some players had difficulties to get
out of commodity hell in the recent past, this seems to be one, as can be seen in figure
7. China Mobile is a clear exception as not being confronted with the same competitive
pressures as some of the other major companies in the US and Europe.
More mobile oriented players like Vodafone and Orange are perceived as more appealing
by the customers and recently some of the (born)fixed players succeeded to catch-up in
part thanks to the fixed-mobile convergence movement. Making a substantial profit
remains challenging and none of the players is ending up in the favorably attractive
upper right at this moment in time.
Figure 7: Telecommunications companies in the VC2 framework.
15
Conclusion: Strategy, Value creation and “the Einstein issue”.
Value creation and value capturing have increasingly been targeted in discussions and
publications on strategic management. Given the increasing and increasingly fast-
moving competitive pressures across markets and industries, and the search for renewed
economic growth, especially since the financial crisis, the need for (re)focusing on the
creation part of the equation has never been greater and more apparent. The data
shown for leading companies across a variety of industries support and illustrate this
point as well as the resulting strategic challenge.
We would argue that “The more competitive your business, the less you should focus on
the competition.” It is your capacity to continuously innovate and add value to the
customer that will determine strategic success and that will decide whether you will be
able to ‘beat your competition’ in the process. This view is clearly in line with (the need
for and recent publications about) the required shift in strategic focus for most if not all
companies from defensive or ‘value capturing’ tactics towards creating and maintaining
the key conditions for sustained value creation.
Creating value in a sustained way (a better, cheaper or faster offering than that of the
competitors) is a key condition for sustained capturing. Yet, we do not have equally
generally accepted measures for value creation as those generally used and accepted for
the capturing part, if only because ‘value’ is an elusive and multi-dimensional concept
that greatly varies with time, place and relevant customers, users or citizens.
In this paper we reverted to a carefully constructed and multi-dimensional concept of
brand value as an adequate proxy for value creation towards the customer. It is up to
the customer to decide what is compelling and what is not and to what value is attributed
after all. At the end of the day, these decisions of the company and its customers
determine what value is attributed, what price is charged and how much profit will result.
This goes back to what we like to call the “Einstein issue” inspired by the famous quote:
“Not everything that counts gets counted, and not everything that’s counted, counts.”
Perhaps no better and succinct summary of the key strategic challenge facing any
company (and other non-profit or public organizations alike22). As long as organizations
do not fully embrace the key strategic challenge of addressing both dimensions and their
interaction, sustained success and economic growth will remain elusive.
16
Appendix : Data sources and Methodology
We started from the largest 500 brands in the world as calculated by Brandfinance
(Brandfinance, 2014). Brandfinance uses a royalty relief methodology as described by
ISO 10668. Such a methodology has numerous advantages, including taking into account
industry specific valuations and is accepted by fiscal authorities23.
The brand value obtained through this methodology is the result of the product of “brand
strength index”, a royalty rate and revenues attributed to the brand. Underlying the
brand strength index are 30 attributes that represent different stakeholders (customers,
staff, financial and external). We focused on brands that were amongst these largest
brands in 2012 and/or 2008 – as we are also interested in how companies evolve. We
added available brand values for companies owing multiple large brands. It is to be
noted that as such smaller brands are neglected and the brand portfolio is not necessarily
the same for all companies in all years.
For the financial data we referred to the Thomson Reuters database that collects data of
companies that publish their financial results. As such private companies were excluded
from the dataset. Industries in which most of the companies manage a portfolio of
unrelated brands like tobacco or packaged foods were not withheld. We also excluded
banks, mainly because their key financial metrics are different and by their mere size,
including them would skew the averages on these metrics. If reporting currency is other
than USD, figures were translated by Thomson Reuters EIKON to USD using the fiscal
year end date exchange rate.
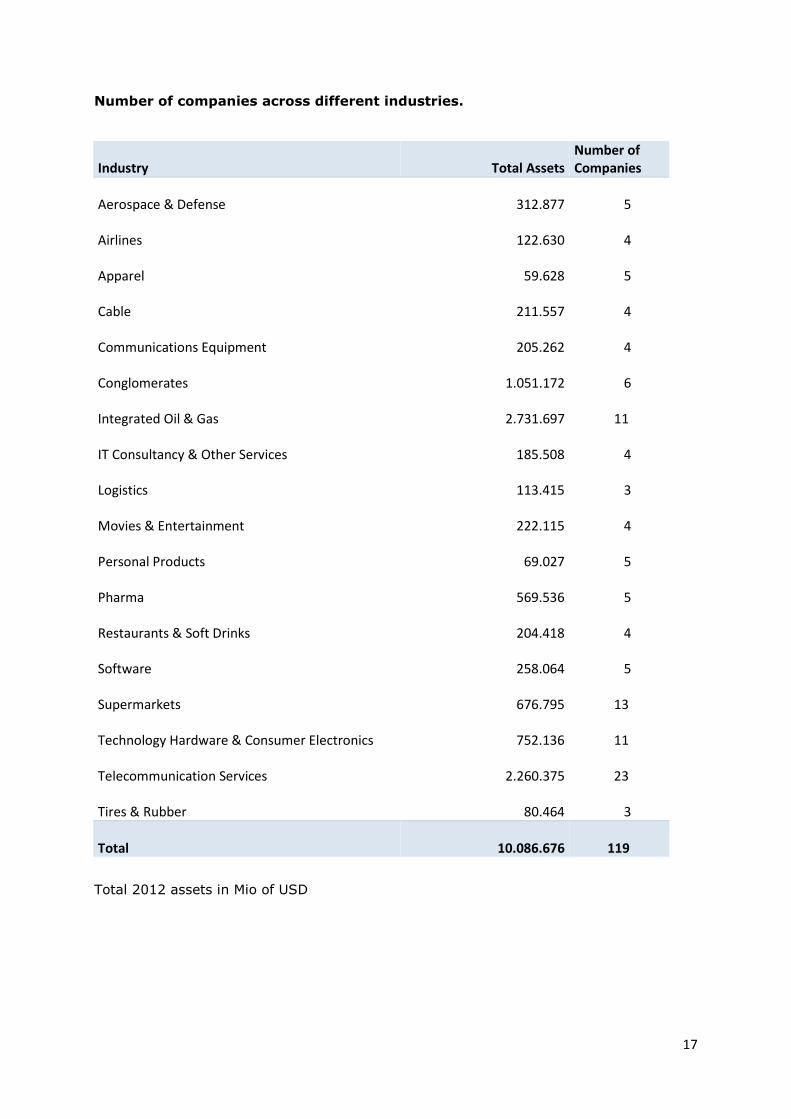
In the end, we considered 18 industries consisting of the same 119 companies in 2008
and 2012. These companies owned in 2012 in total $10,087 Bio assets, made $563 Bio
of profits and had a combined brand value was $1,301 Bio.
As a proxy for value creation we use the brand value as explained above, which we
divide by revenues to correct for size but also as it seemed to us the most logical from a
value creation perspective: how much value does the customer attributes (brand value)
for his or her money spend (revenues). We use a one year time-lag between the brand
value and the financial data. The logic behind this approach is that the value created at
the beginning of the year is compared with the value captured throughout the year. The
proxy we use for value capturing is profit/assets. The net profit, divided by the total
asset gives a good representation of potential shareholder return.
17
Number of companies across different industries.
Industry Total Assets Number of Companies
Aerospace & Defense
312.877 5
Airlines
122.630 4
Apparel
59.628 5
Cable
211.557 4
Communications Equipment
205.262 4
Conglomerates
1.051.172 6
Integrated Oil & Gas
2.731.697 11
IT Consultancy & Other Services
185.508 4
Logistics
113.415 3
Movies & Entertainment
222.115 4
Personal Products
69.027 5
Pharma
569.536 5
Restaurants & Soft Drinks
204.418 4
Software
258.064 5
Supermarkets
676.795 13
Technology Hardware & Consumer Electronics
752.136 11
Telecommunication Services
2.260.375 23
Tires & Rubber
80.464 3
Total
10.086.676 119
Total 2012 assets in Mio of USD

18
REFERENCES
1 Value Capturing in the literature also called Value Appropriation, Value Claiming or
Value Extraction, although the latter has more negative connotation nowadays, see e.g.
P. Strebel and S. Cantale. “Is Your Company Addicted to Value Extraction?” Sloan
Management Review 55 (2014): 95-96.
2 An earlier version of this model has been introduced in: G. Hawawini, V. Subramanian,
and P. Verdin, “Creating and Capturing Value: The Strategic Drivers of Performance”.
Working paper, INSEAD, Fontainebleau. 2003; illustrated with the PayPal Case (2006),
in: S. Nysten and P.Verdin. “Successfully creating and capturing value, the e-business
model of PayPal Inc”. Working Paper, ULB-Solvay Business School, 2004; and applied to
the asset management industry, in: P. Verdin, “The Strategic Imperative of Creating and
Capturing Value”, in: I. Walter and P. Verdin, eds., “Growth and Value Creation in Global
Asset Management, SimCorp StrategyLab/Palgrave, London/Copenhagen, June 2010;
reprinted in: I. Walter and M. Pinedo, eds., Handbook of Asset Management,
Palgrave/MacMillan, London/NY, 2013.
3 See e.g. The Daily Mail (UK), September 20, 2011, 18.
4 V.K. Rangan and G.T. Bowman. "Beating the commodity magnet." Industrial Marketing
Management 21 (1992): 215-224.
5 S. Lohr, “Big Blue's Big Bet: Less Tech, More Touch”, NYT, Jan. 25, 2004.
6 K. W. Chan and R. Mauborgne, "Strategy, value innovation, and the knowledge
economy." Sloan Management Review 40 (1999): 41-54.
7 M.E. Raynor and M. Ahmed. "Three rules for making a company truly great." Harvard
Business Review 91 -4 (2013): 108-117.
8 R. Amit and C. Zott. "Creating value through business model innovation." Sloan
Management Review 53 (2012): 41-49.
9 Peter Thiel, founder of PayPal, calls “disruption” a “self-congratulatory buzzword for
anything posing as trendy and new”, a “seemingly trivial fad” P. Thiel (with B. Masters),
“Zero to One. Notes on Startups or How to Build the Future” (Crown/Random House,
N.Y., 2014): 56.
10 T. Levitt, "Marketing myopia." Harvard business review (1960): 24-47.
11 E.g. G. Hawawini, V. Subramanian and P. Verdin. "Is performance driven by industry‐or firm‐specific factors? A new look at the evidence." Strategic Management Journal 24
(2003): 1-16., G. Hawawini, V. Subramanian and P. Verdin. "The home country in the
age of globalization: how much does it matter for firm performance?." Journal of World
Business 39, (2004): 121-135., M. Fitza, “The use of variance decomposition in
investigating CEO effect”, Strategic Management Journal (2014): 1839-1852.
12 S. Nysten and P.Verdin. “Successfully creating and capturing value, the e-business
model of PayPal Inc”. Working Paper, ULB-Solvay Business School, 2004; PayPal Case,
ULB-Solvay Business School, 2006, 21pp.
13 D. J. Teece. "Business models, business strategy and innovation." Long Range
Planning 43 (2010): 172-194.
14 Pricing and the pricing literature is mostly about capturing; however pricing can
become an attribute of value creation (perception) in some cases: (i) in luxury markets
(ii) for intangibles as a signal for expected value and (iii) at the margin and in a dynamic
context price movements may be used to influence quality or value perceptions.
15 D. Roberts: “Marrying Style with Tech”. Fortune, December 1st, 2014.
19
16 R. G. McGrath. “Transient advantage.” Harvard Business Review (2013): 62-70.
17 C. Zook and J. Allen, “Repeatability” (HBS Press, 2012).
18 M.J. Perry: http://mjperry.blogspot.be/2011/11/fortune-500-firms-in-1955-vs-2011-
87.html.
19 S. Denning: “Peggy Noonan On Steve Jobs And Why Big Companies Die”. Fortune,
November, 19, 2011.
20 G. Hawawini, V. Subramanian and P. Verdin (ref 13) J. Hagel, J. S. Brown and Lang
Davison. "The best way to measure company performance." HBR blog network. Available
from Internet: http://blogs. hbr. org/2010/03/the-best-way-to-measure-compan (2010).
21 It is to be noted that the “industry” data referred to here is the sum of the individual
companies in our dataset active in that particular industry and not on (total) industry
wide data.
22 The relevance of the model for public services and non-profit organizations is being
investigated in further research.
23 G. Salinas and Tim Ambler. "A taxonomy of brand valuation practice: methodologies
and purposes." Journal of Brand Management 17, no. 1 (2009): 39-61.