arizona climate summary - arizona state university
TRANSCRIPT
1
Arizona Climate Summary August 2017
Summary of conditions for July 2017
July 2017 Temperature and Precipitation Summary
July 1st – 15th: The dryness from the end of June spilled over into the first day of July, but was short-lived as a
shortwave moved through on the 2nd, 3rd, and 4th. The rain was light and highly localized in southern Arizona with 0.03”
at Bisbee-Douglas Airport, 0.40” at Elgin, 0.21” at Nogales, and 0.11” at Coronado National Monument. Temperatures
remained in the 107-110oF range during this time. By the 5th, high pressure had moved over the four corners and started
to bring more moisture northward from Mexico. The 5th was dry across the state, but by the 6th, thunderstorms started
firing across northern Arizona at the higher elevations. From the 6th through the end of the month it rained somewhere in
Arizona every day. Showers were highly isolated, with some smaller amounts and a few very heavy downpours.
Through the rest of the month dew points remained very high and southerly or easterly flow dominated the state. The
last “really” hot day was the 7th when Yuma, Phoenix and Mesa were 118oF. Once the moisture moved in, temperatures
statewide dropped to 111oF or below for the rest of the month. Unfortunately the moisture made the nights warmer and
urban areas in the lower deserts started accumulating nighttime lows in the upper 80s and lower 90s. High one day
rainfall totals through the 15th of July included 0.82” at Coronado National Monument on the 9th, 0.69” at Alpine on the
10th, 0.69” at Tucson Airport on the 11th, 1.10” at Payson on the 12th, 0.53” at Sonora Desert Museum on the 13th, 0.93”
at Safford on the 14th, and 0.88” at Payson on the 15th. Unfortunately the monsoon turned tragic on the 15th when even
heavier rains north of Payson caused flash flooding in Cold Springs that killed 10 members of one family.
July 16th – 31st: Rainfall continued the rest of the month across the state with localized heavy rain and flash flooding in
the higher terrain, and even some hail. Daily peak rainfall included 2.20” at Elgin on the 16th, 0.99” at Scottsdale on the
17th, 0.57” at Grand Canyon North Rim on the 18th, 1.10” at Castle Hot Springs on the 19th, 0.97” at Bellemont on the
20th, 1.02” at Bisbee-Douglas AP on the 21st, 1.12” at Nogales on the 22nd, 1.76” at Flagstaff on the 23rd, 1.64” at East
Mesa on the 24th, 1.39” at Valle on the 25th, 0.90” at Springerville on the 26th, 0.16” at Bellemont on the 27th, 1.37” at
Tucson AP on the 28th, 1.09” at Grand Canyon AP on the 29th, 0.91” at Bisbee-Douglas AP on the 30th, and 0.32” at
Show Low on the 31st. Tucson set a new record for wettest July with 6.80”. Hikers were rescued from flash flooding in
Tanque Verde Falls, Sabino Canyon and Bear Canyon in the Tucson area on the 23rd.
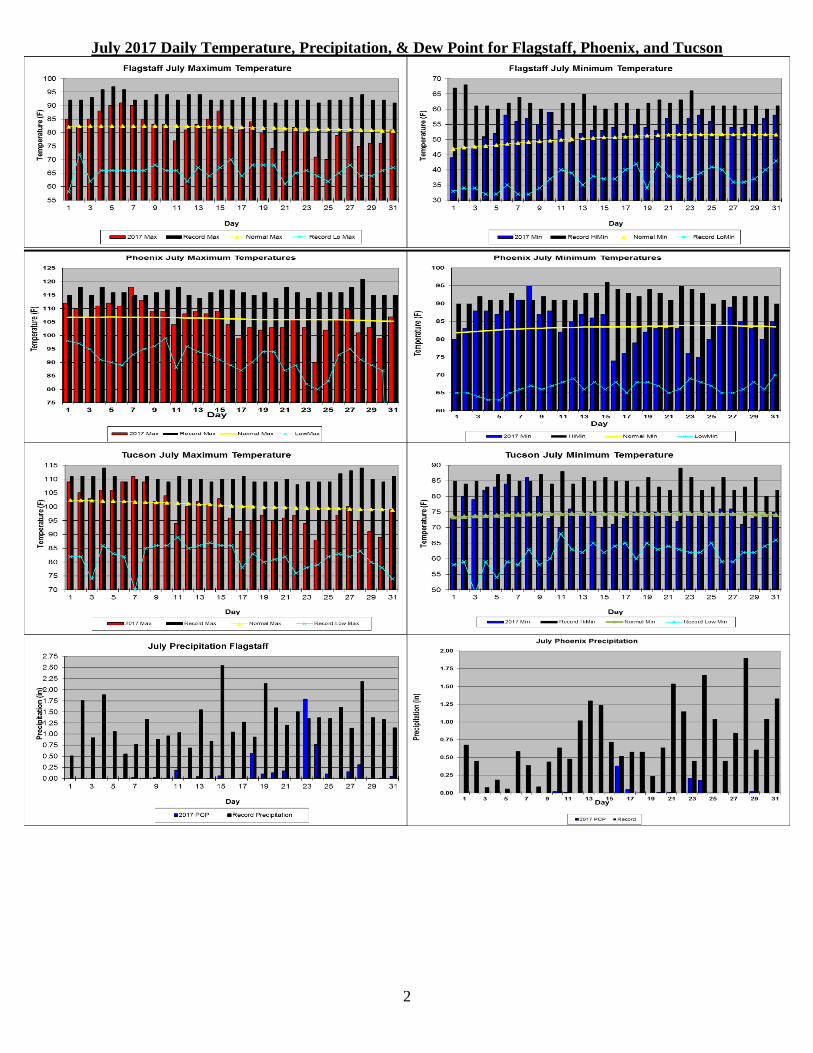
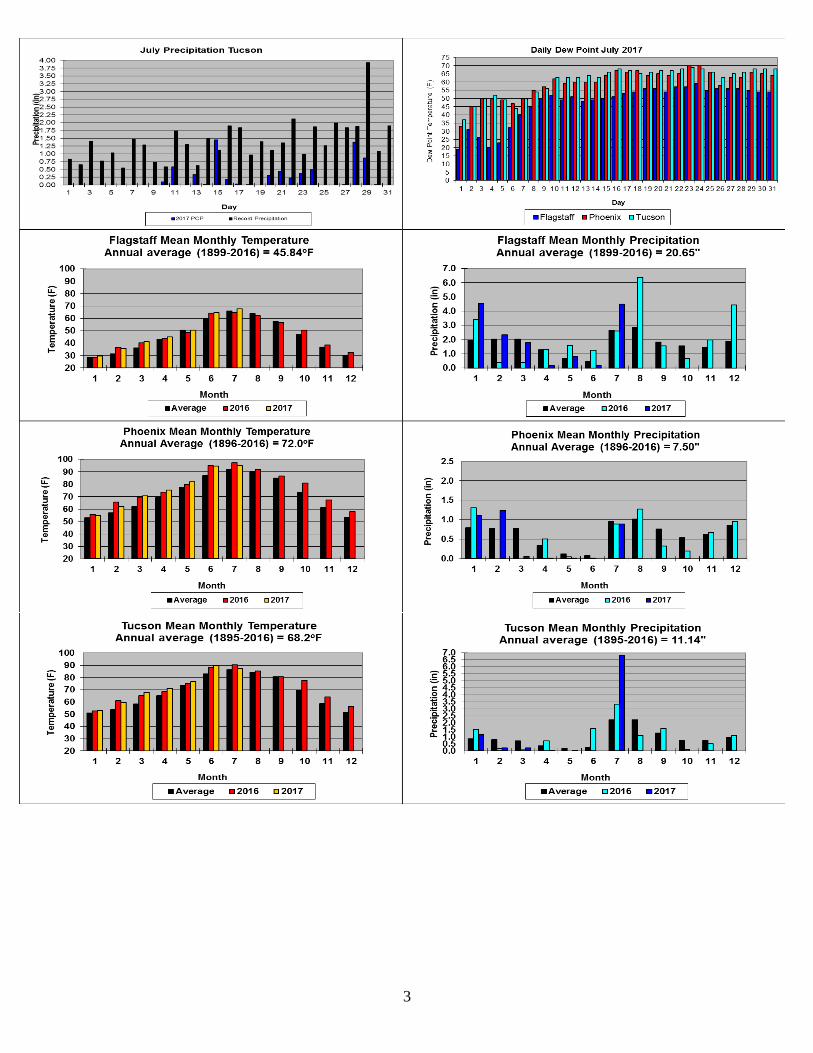
In This Issue: Overview of July, graphs of the July daily maximum and minimum temperatures, precipitation, mean
daily dew points for Flagstaff, Phoenix, and Tucson; July climate statistics, maps of mean monthly maximum and
minimum temperatures, precipitation, dew points, wind speeds for July; and graphs of the mean July temperature and
precipitation for the period of record for Tucson, Phoenix, and Flagstaff, graphs of the cumulative precipitation for the
calendar year for Flagstaff, Phoenix, and Tucson. Climate calendars for Flagstaff, Phoenix, Tucson, Prescott, Winslow
and Yuma, including daily and monthly normals and extremes, for each month of the year, are not yet updated through
2017. See p.19 of this report for calendar abbreviations. Data are preliminary and are from the National Weather
Service Forecast Offices in Flagstaff, Phoenix and Tucson.
**Note: The discrepancy between the Statewide Temperature and Precipitation values for Phoenix, Flagstaff and
Tucson and the daily values in their graphs are due to the reporting times. Statewide Temperature and Precipitation
values are taken at 5pm, while official daily records at the airports are taken from Midnight to Midnight.
Dr. Nancy J. Selover, State Climatologist
http://azclimate.asu.edu 480-965-6265
Edited by Nancy J. Selover
© 2017 Arizona State Climate Office
2
July 2017 Daily Temperature, Precipitation, & Dew Point for Flagstaff, Phoenix, and Tucson
3
4
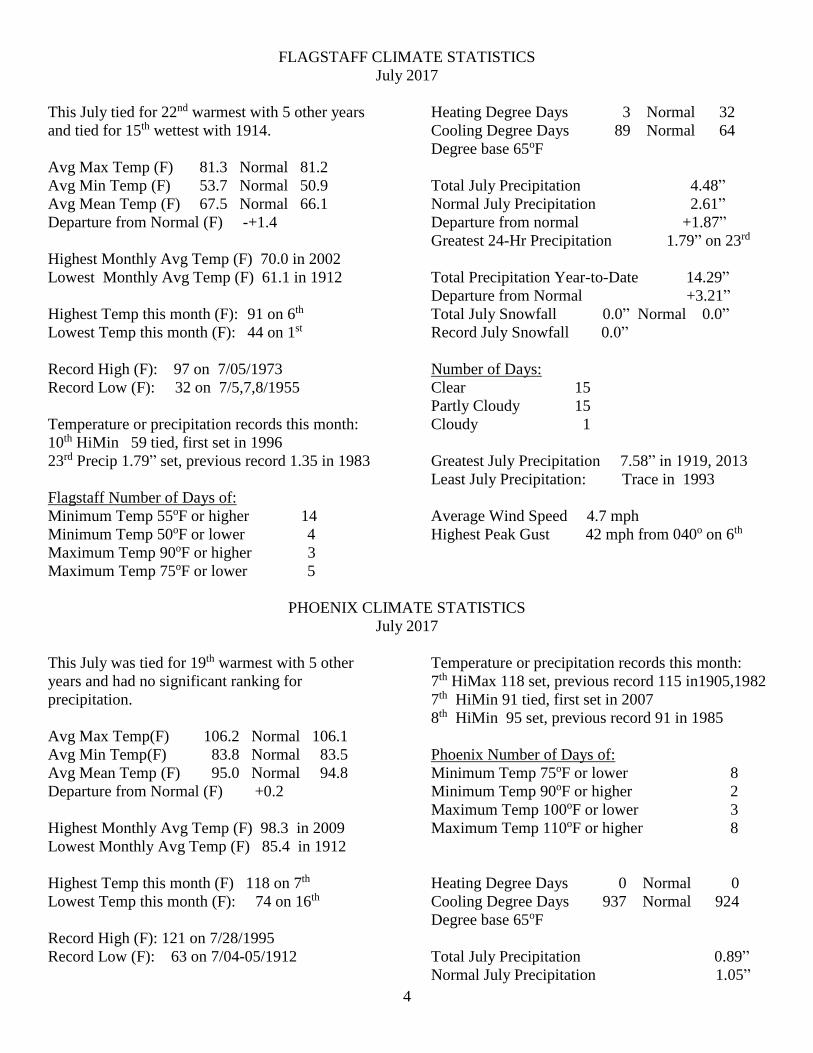
FLAGSTAFF CLIMATE STATISTICS
July 2017
This July tied for 22nd warmest with 5 other years
and tied for 15th wettest with 1914.
Avg Max Temp (F) 81.3 Normal 81.2
Avg Min Temp (F) 53.7 Normal 50.9
Avg Mean Temp (F) 67.5 Normal 66.1
Departure from Normal (F) -+1.4
Highest Monthly Avg Temp (F) 70.0 in 2002
Lowest Monthly Avg Temp (F) 61.1 in 1912
Highest Temp this month (F): 91 on 6th
Lowest Temp this month (F): 44 on 1st
Record High (F): 97 on 7/05/1973
Record Low (F): 32 on 7/5,7,8/1955
Temperature or precipitation records this month:
10th HiMin 59 tied, first set in 1996
23rd Precip 1.79” set, previous record 1.35 in 1983
Flagstaff Number of Days of:
Minimum Temp 55oF or higher 14
Minimum Temp 50oF or lower 4
Maximum Temp 90oF or higher 3
Maximum Temp 75oF or lower 5
Heating Degree Days 3 Normal 32
Cooling Degree Days 89 Normal 64
Degree base 65oF
Total July Precipitation 4.48”
Normal July Precipitation 2.61”
Departure from normal +1.87”
Greatest 24-Hr Precipitation 1.79” on 23rd
Total Precipitation Year-to-Date 14.29”
Departure from Normal +3.21”
Total July Snowfall 0.0” Normal 0.0”
Record July Snowfall 0.0”
Number of Days:
Clear 15
Partly Cloudy 15
Cloudy 1
Greatest July Precipitation 7.58” in 1919, 2013
Least July Precipitation: Trace in 1993
Average Wind Speed 4.7 mph
Highest Peak Gust 42 mph from 040o on 6th
PHOENIX CLIMATE STATISTICS
July 2017
This July was tied for 19th warmest with 5 other
years and had no significant ranking for
precipitation.
Avg Max Temp(F) 106.2 Normal 106.1
Avg Min Temp(F) 83.8 Normal 83.5
Avg Mean Temp (F) 95.0 Normal 94.8
Departure from Normal (F) +0.2
Highest Monthly Avg Temp (F) 98.3 in 2009
Lowest Monthly Avg Temp (F) 85.4 in 1912
Highest Temp this month (F) 118 on 7th
Lowest Temp this month (F): 74 on 16th
Record High (F): 121 on 7/28/1995
Record Low (F): 63 on 7/04-05/1912
Temperature or precipitation records this month:
7th HiMax 118 set, previous record 115 in1905,1982
7th HiMin 91 tied, first set in 2007
8th HiMin 95 set, previous record 91 in 1985
Phoenix Number of Days of:
Minimum Temp 75oF or lower 8
Minimum Temp 90oF or higher 2
Maximum Temp 100oF or lower 3
Maximum Temp 110oF or higher 8
Heating Degree Days 0 Normal 0
Cooling Degree Days 937 Normal 924
Degree base 65oF
Total July Precipitation 0.89”
Normal July Precipitation 1.05”
5
Departure from normal -0.16”
Greatest 24-Hr Precipitation 0.38”
Total Precipitation Year-to-Date 3.30”
Departure from Normal -0.98
Greatest July Precipitation 6.47” in 1911
Least July Precipitation 0.00” in 1993 and 1995.
Number of Days:
Clear 4
Partly Cloudy 26
Cloudy 0
Average Wind Speed 8.0 mph
Highest Peak Gust 62 mph from 030o on 16th
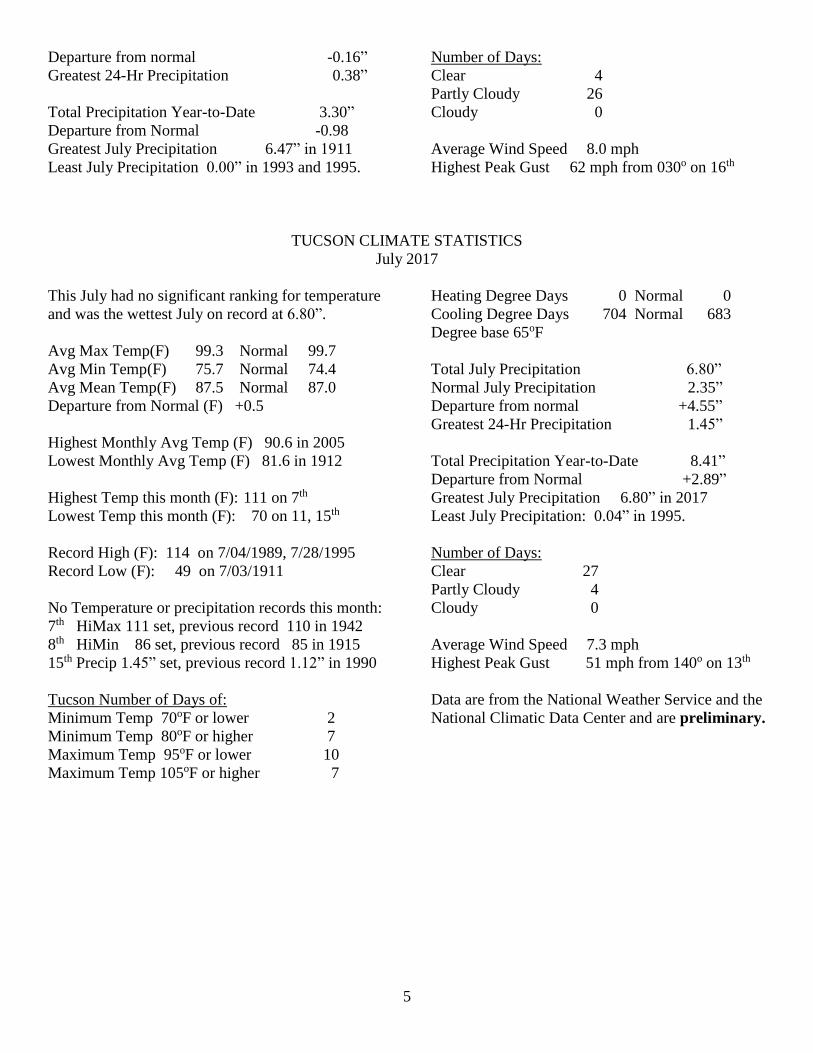
TUCSON CLIMATE STATISTICS
July 2017
This July had no significant ranking for temperature
and was the wettest July on record at 6.80”.
Avg Max Temp(F) 99.3 Normal 99.7
Avg Min Temp(F) 75.7 Normal 74.4
Avg Mean Temp(F) 87.5 Normal 87.0
Departure from Normal (F) +0.5
Highest Monthly Avg Temp (F) 90.6 in 2005
Lowest Monthly Avg Temp (F) 81.6 in 1912
Highest Temp this month (F): 111 on 7th
Lowest Temp this month (F): 70 on 11, 15th
Record High (F): 114 on 7/04/1989, 7/28/1995
Record Low (F): 49 on 7/03/1911
No Temperature or precipitation records this month:
7th HiMax 111 set, previous record 110 in 1942
8th HiMin 86 set, previous record 85 in 1915
15th Precip 1.45” set, previous record 1.12” in 1990
Tucson Number of Days of:
Minimum Temp 70oF or lower 2
Minimum Temp 80oF or higher 7
Maximum Temp 95oF or lower 10
Maximum Temp 105oF or higher 7
Heating Degree Days 0 Normal 0
Cooling Degree Days 704 Normal 683
Degree base 65oF
Total July Precipitation 6.80”
Normal July Precipitation 2.35”
Departure from normal +4.55”
Greatest 24-Hr Precipitation 1.45”
Total Precipitation Year-to-Date 8.41”
Departure from Normal +2.89”
Greatest July Precipitation 6.80” in 2017
Least July Precipitation: 0.04” in 1995.
Number of Days:
Clear 27
Partly Cloudy 4
Cloudy 0
Average Wind Speed 7.3 mph
Highest Peak Gust 51 mph from 140o on 13th
Data are from the National Weather Service and the
National Climatic Data Center and are preliminary.
6
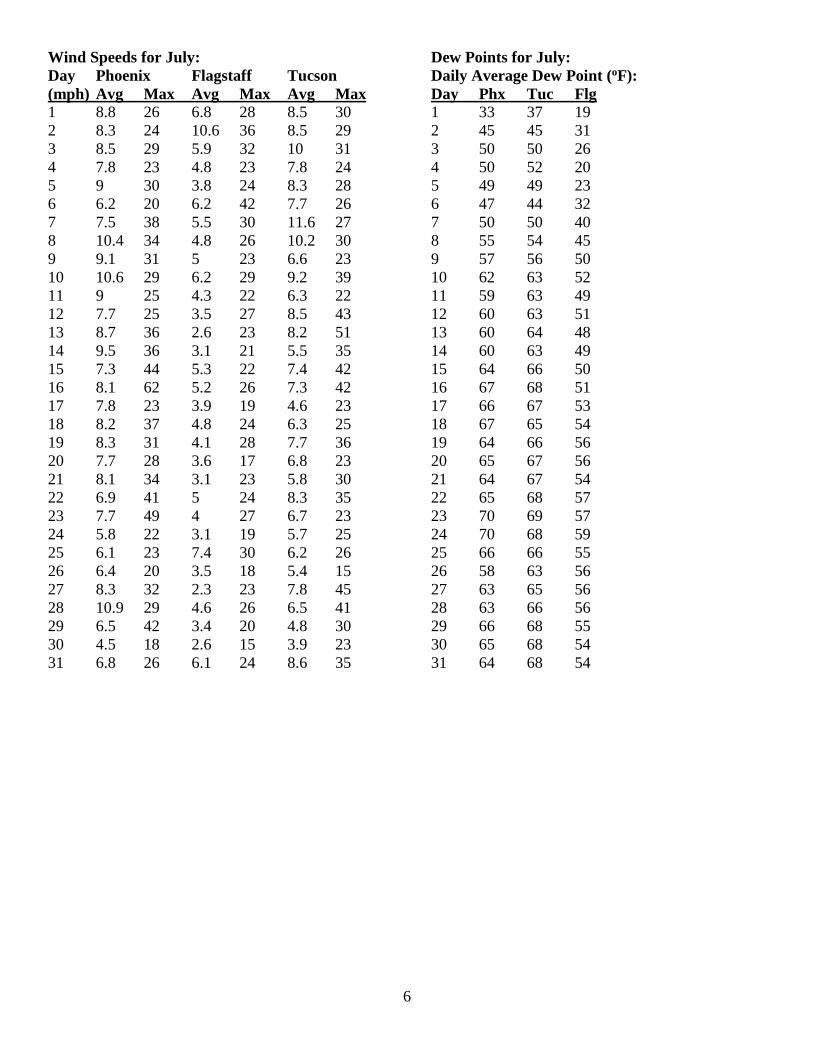
Wind Speeds for July:
Day Phoenix Flagstaff Tucson
(mph) Avg Max Avg Max Avg Max
1 8.8 26 6.8 28 8.5 30
2 8.3 24 10.6 36 8.5 29
3 8.5 29 5.9 32 10 31
4 7.8 23 4.8 23 7.8 24
5 9 30 3.8 24 8.3 28
6 6.2 20 6.2 42 7.7 26
7 7.5 38 5.5 30 11.6 27
8 10.4 34 4.8 26 10.2 30
9 9.1 31 5 23 6.6 23
10 10.6 29 6.2 29 9.2 39
11 9 25 4.3 22 6.3 22
12 7.7 25 3.5 27 8.5 43
13 8.7 36 2.6 23 8.2 51
14 9.5 36 3.1 21 5.5 35
15 7.3 44 5.3 22 7.4 42
16 8.1 62 5.2 26 7.3 42
17 7.8 23 3.9 19 4.6 23
18 8.2 37 4.8 24 6.3 25
19 8.3 31 4.1 28 7.7 36
20 7.7 28 3.6 17 6.8 23
21 8.1 34 3.1 23 5.8 30
22 6.9 41 5 24 8.3 35
23 7.7 49 4 27 6.7 23
24 5.8 22 3.1 19 5.7 25
25 6.1 23 7.4 30 6.2 26
26 6.4 20 3.5 18 5.4 15
27 8.3 32 2.3 23 7.8 45
28 10.9 29 4.6 26 6.5 41
29 6.5 42 3.4 20 4.8 30
30 4.5 18 2.6 15 3.9 23
31 6.8 26 6.1 24 8.6 35
Dew Points for July:
Daily Average Dew Point (oF):
Day Phx Tuc Flg
1 33 37 19
2 45 45 31
3 50 50 26
4 50 52 20
5 49 49 23
6 47 44 32
7 50 50 40
8 55 54 45
9 57 56 50
10 62 63 52
11 59 63 49
12 60 63 51
13 60 64 48
14 60 63 49
15 64 66 50
16 67 68 51
17 66 67 53
18 67 65 54
19 64 66 56
20 65 67 56
21 64 67 54
22 65 68 57
23 70 69 57
24 70 68 59
25 66 66 55
26 58 63 56
27 63 65 56
28 63 66 56
29 66 68 55
30 65 68 54
31 64 68 54
7
The
8
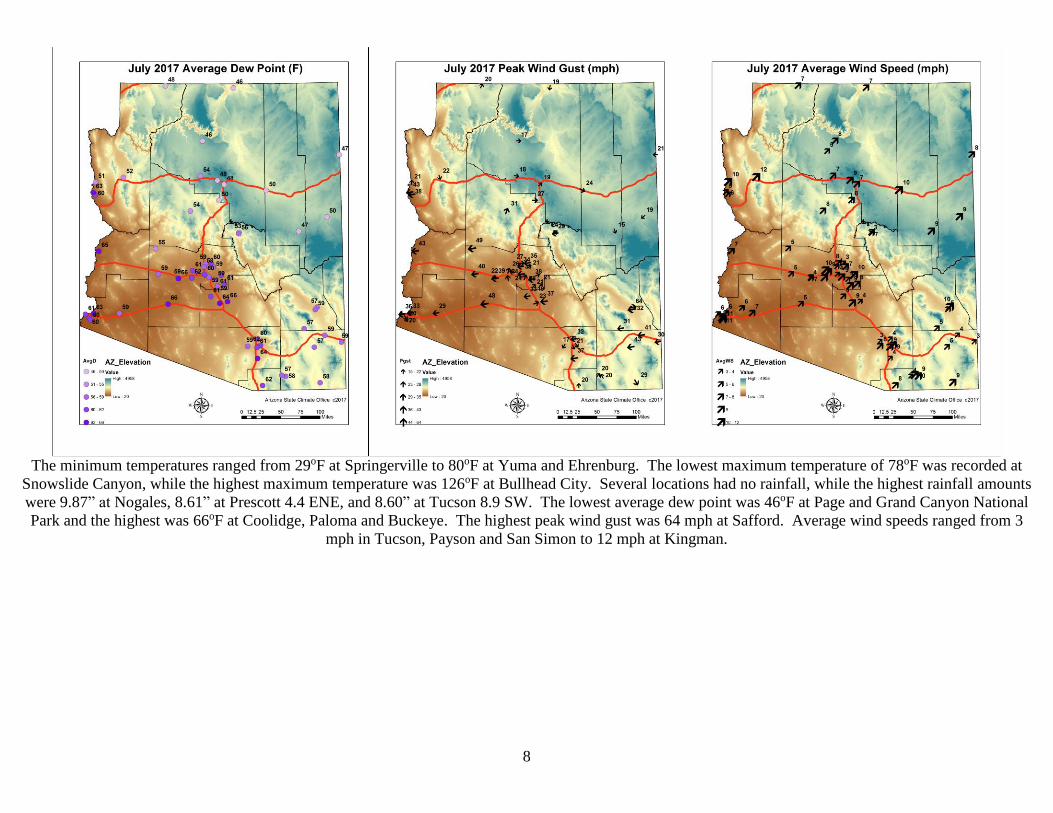
The minimum temperatures ranged from 29oF at Springerville to 80oF at Yuma and Ehrenburg. The lowest maximum temperature of 78oF was recorded at
Snowslide Canyon, while the highest maximum temperature was 126oF at Bullhead City. Several locations had no rainfall, while the highest rainfall amounts
were 9.87” at Nogales, 8.61” at Prescott 4.4 ENE, and 8.60” at Tucson 8.9 SW. The lowest average dew point was 46oF at Page and Grand Canyon National
Park and the highest was 66oF at Coolidge, Paloma and Buckeye. The highest peak wind gust was 64 mph at Safford. Average wind speeds ranged from 3
mph in Tucson, Payson and San Simon to 12 mph at Kingman.
9
T
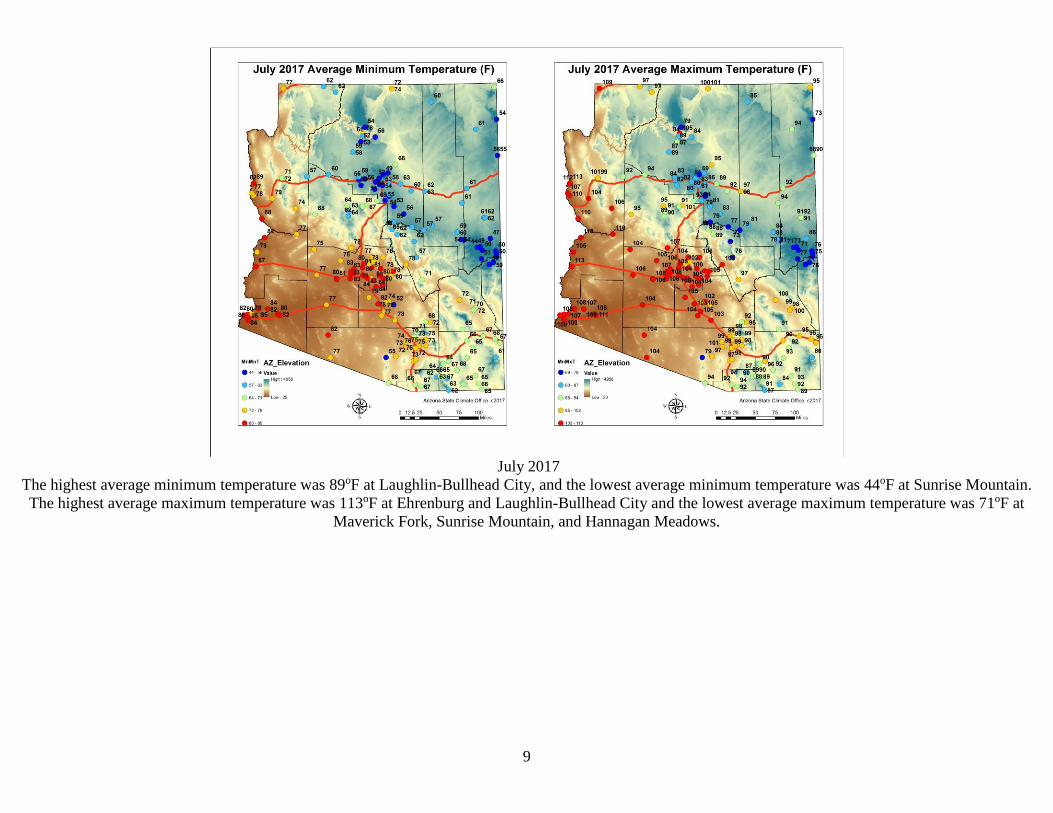
July 2017
The highest average minimum temperature was 89oF at Laughlin-Bullhead City, and the lowest average minimum temperature was 44oF at Sunrise Mountain.
The highest average maximum temperature was 113oF at Ehrenburg and Laughlin-Bullhead City and the lowest average maximum temperature was 71oF at
Maverick Fork, Sunrise Mountain, and Hannagan Meadows.
10
11
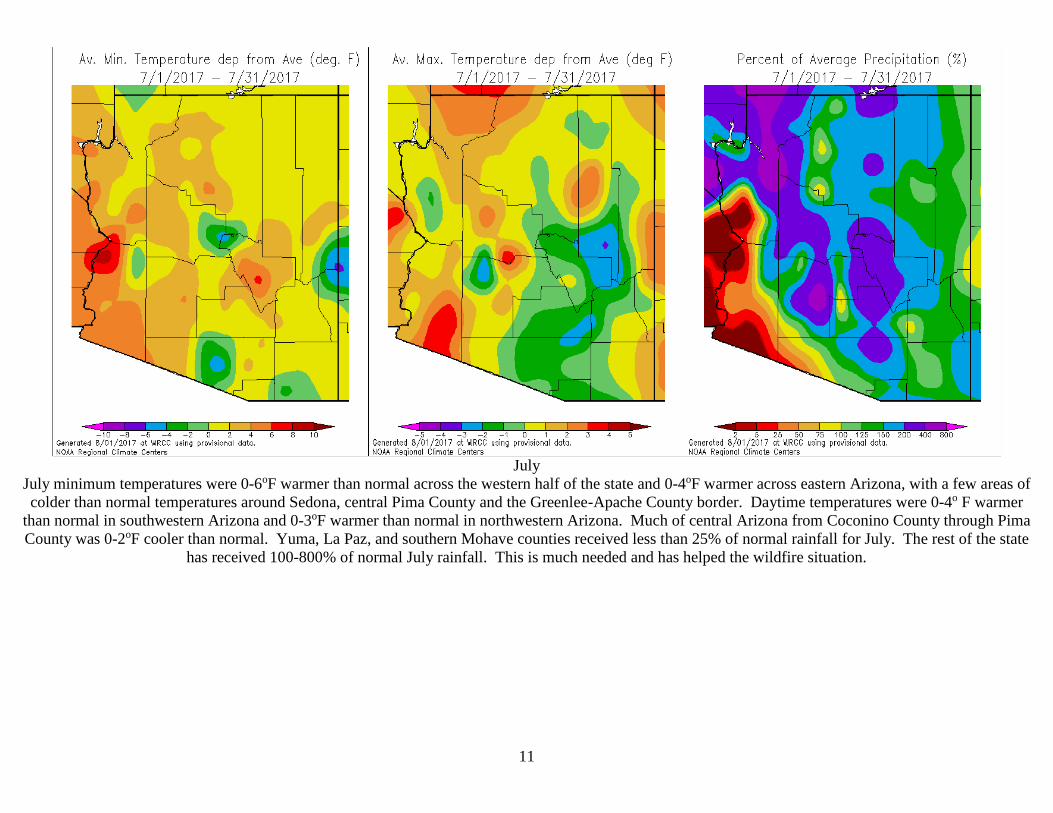
July
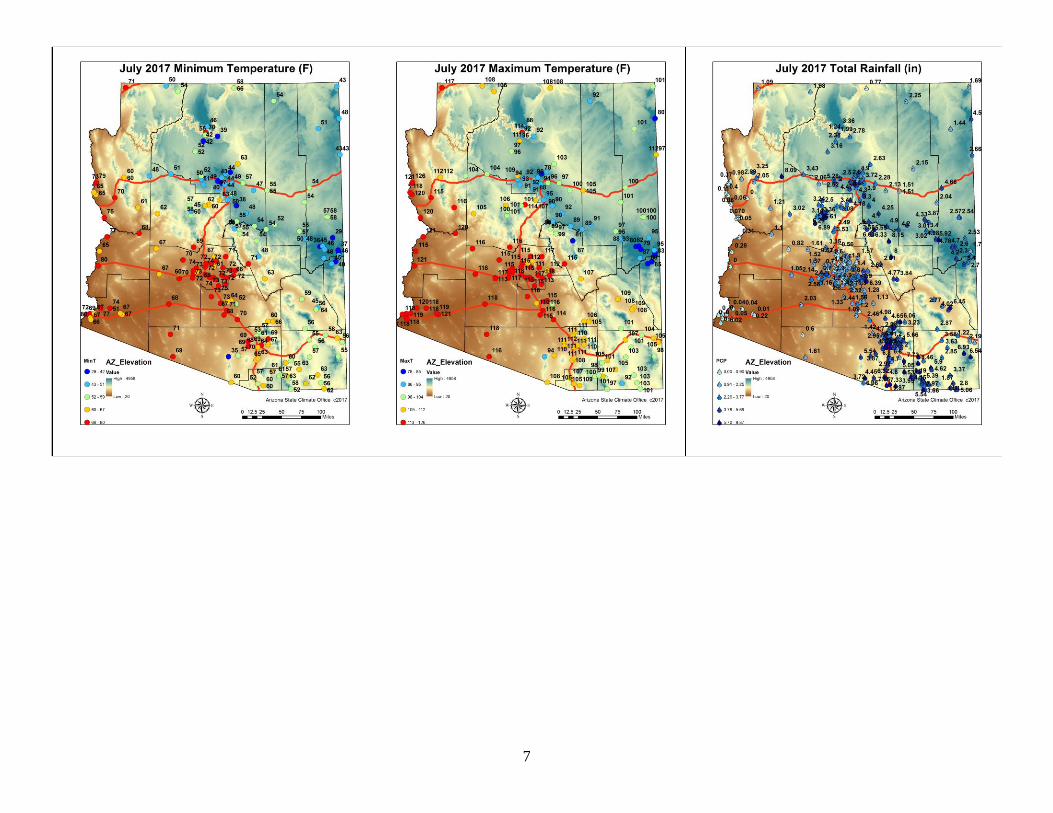
July minimum temperatures were 0-6oF warmer than normal across the western half of the state and 0-4oF warmer across eastern Arizona, with a few areas of
colder than normal temperatures around Sedona, central Pima County and the Greenlee-Apache County border. Daytime temperatures were 0-4o F warmer
than normal in southwestern Arizona and 0-3oF warmer than normal in northwestern Arizona. Much of central Arizona from Coconino County through Pima
County was 0-2oF cooler than normal. Yuma, La Paz, and southern Mohave counties received less than 25% of normal rainfall for July. The rest of the state
has received 100-800% of normal July rainfall. This is much needed and has helped the wildfire situation.
12
13
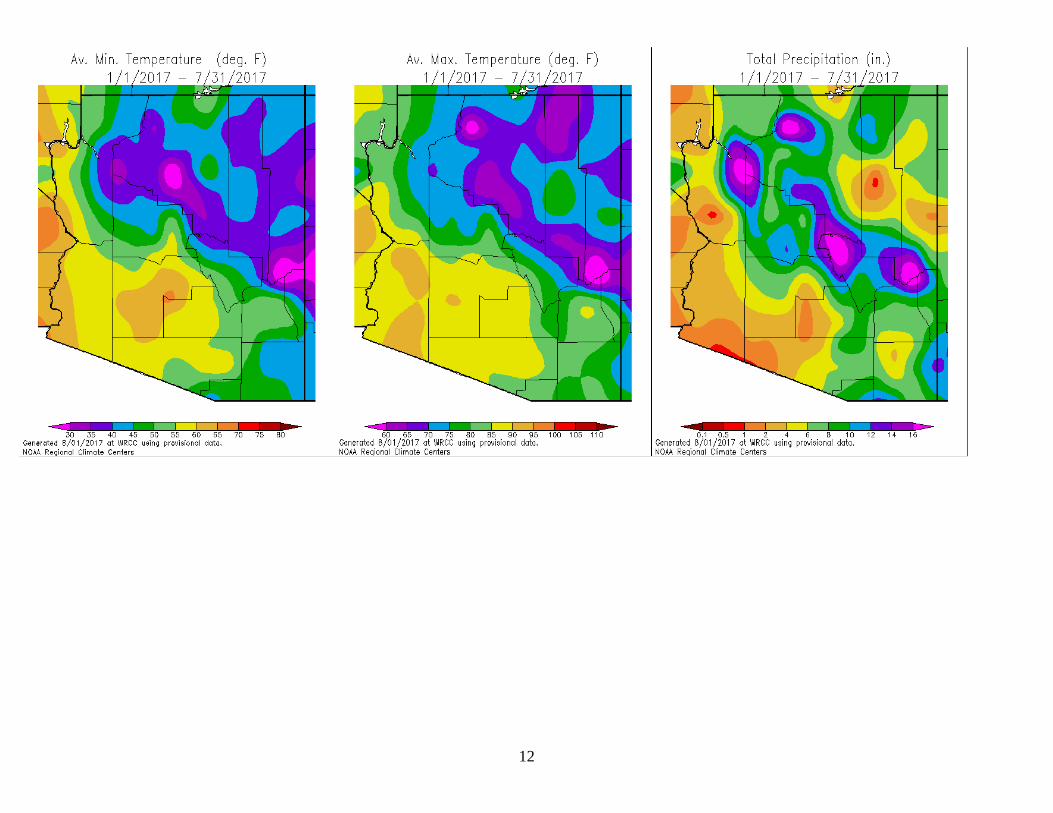
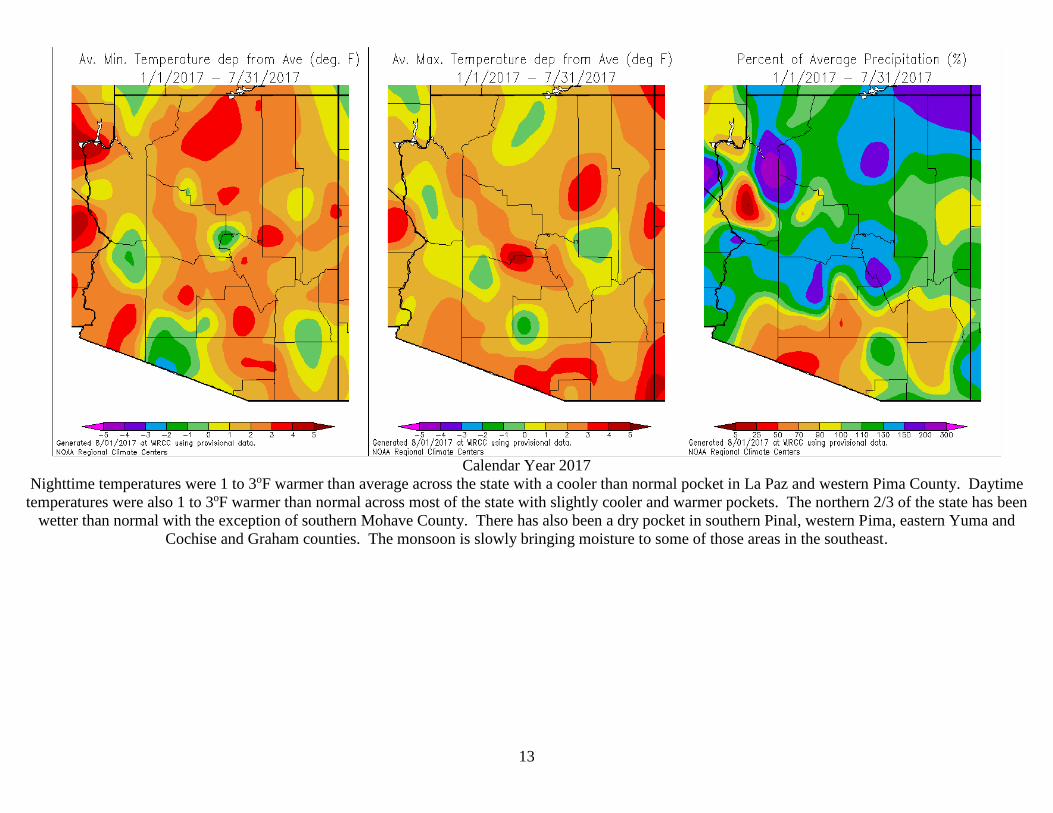
Calendar Year 2017
Nighttime temperatures were 1 to 3oF warmer than average across the state with a cooler than normal pocket in La Paz and western Pima County. Daytime
temperatures were also 1 to 3oF warmer than normal across most of the state with slightly cooler and warmer pockets. The northern 2/3 of the state has been
wetter than normal with the exception of southern Mohave County. There has also been a dry pocket in southern Pinal, western Pima, eastern Yuma and
Cochise and Graham counties. The monsoon is slowly bringing moisture to some of those areas in the southeast.
14
15
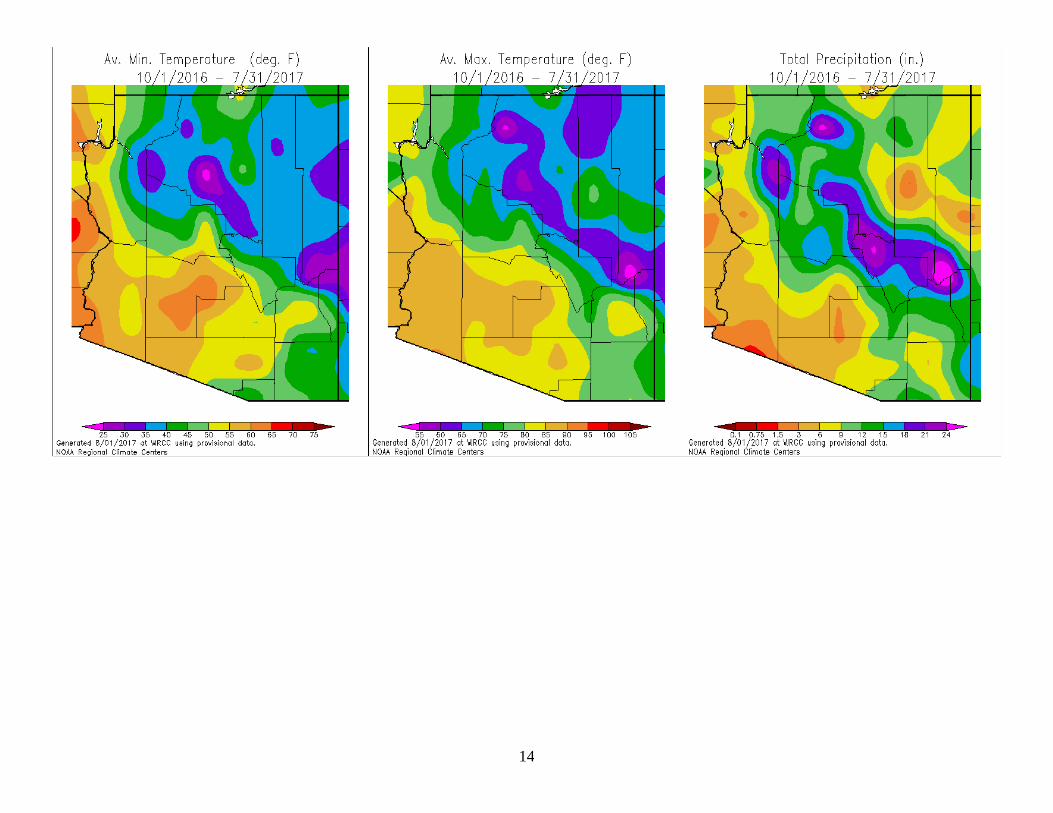
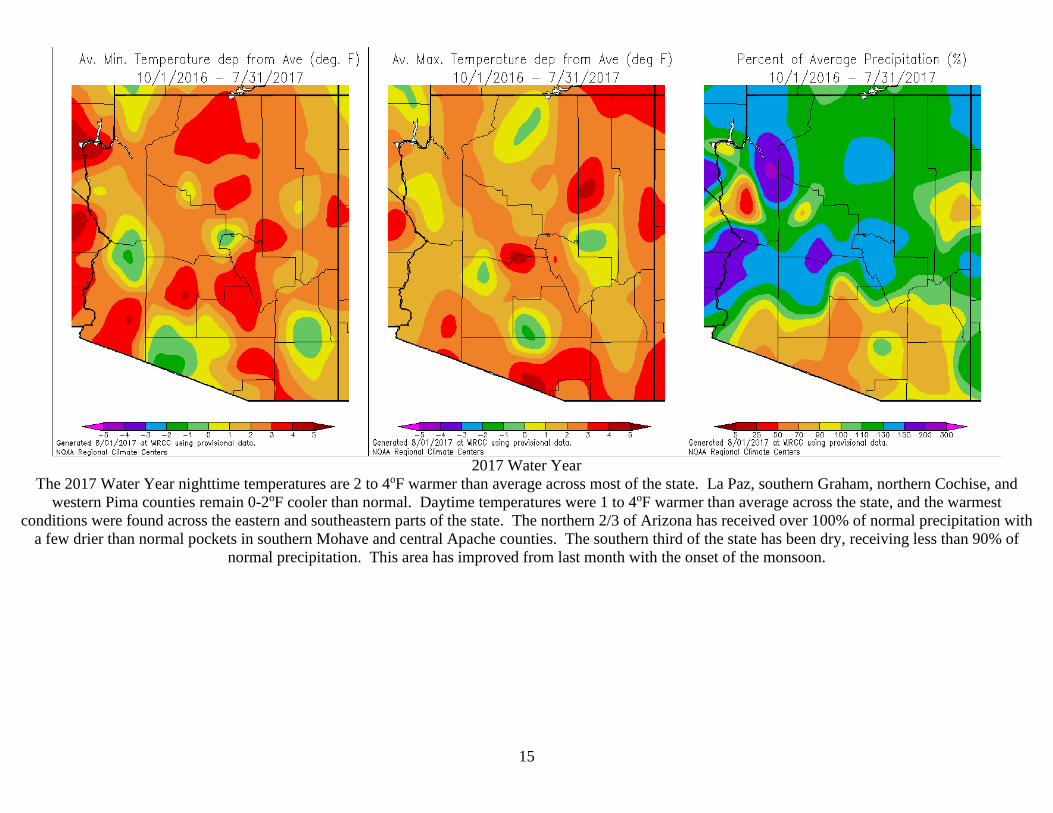
2017 Water Year
The 2017 Water Year nighttime temperatures are 2 to 4oF warmer than average across most of the state. La Paz, southern Graham, northern Cochise, and
western Pima counties remain 0-2oF cooler than normal. Daytime temperatures were 1 to 4oF warmer than average across the state, and the warmest
conditions were found across the eastern and southeastern parts of the state. The northern 2/3 of Arizona has received over 100% of normal precipitation with
a few drier than normal pockets in southern Mohave and central Apache counties. The southern third of the state has been dry, receiving less than 90% of
normal precipitation. This area has improved from last month with the onset of the monsoon.
16
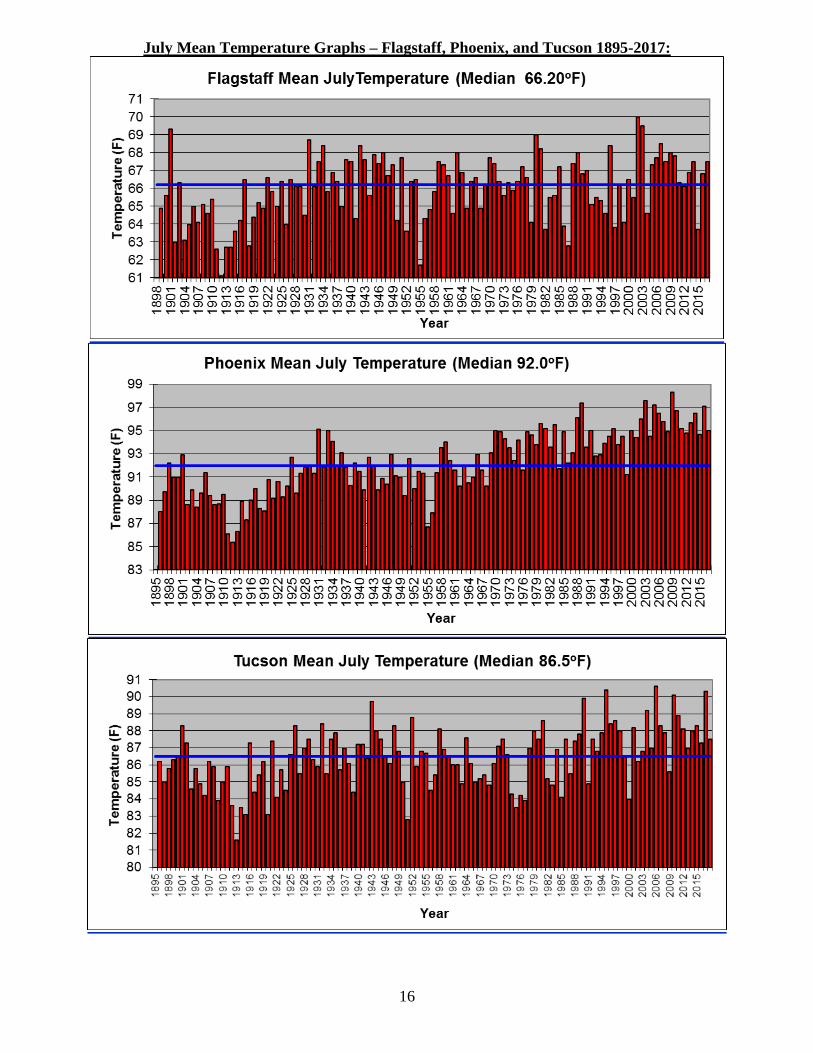
July Mean Temperature Graphs – Flagstaff, Phoenix, and Tucson 1895-2017:
17
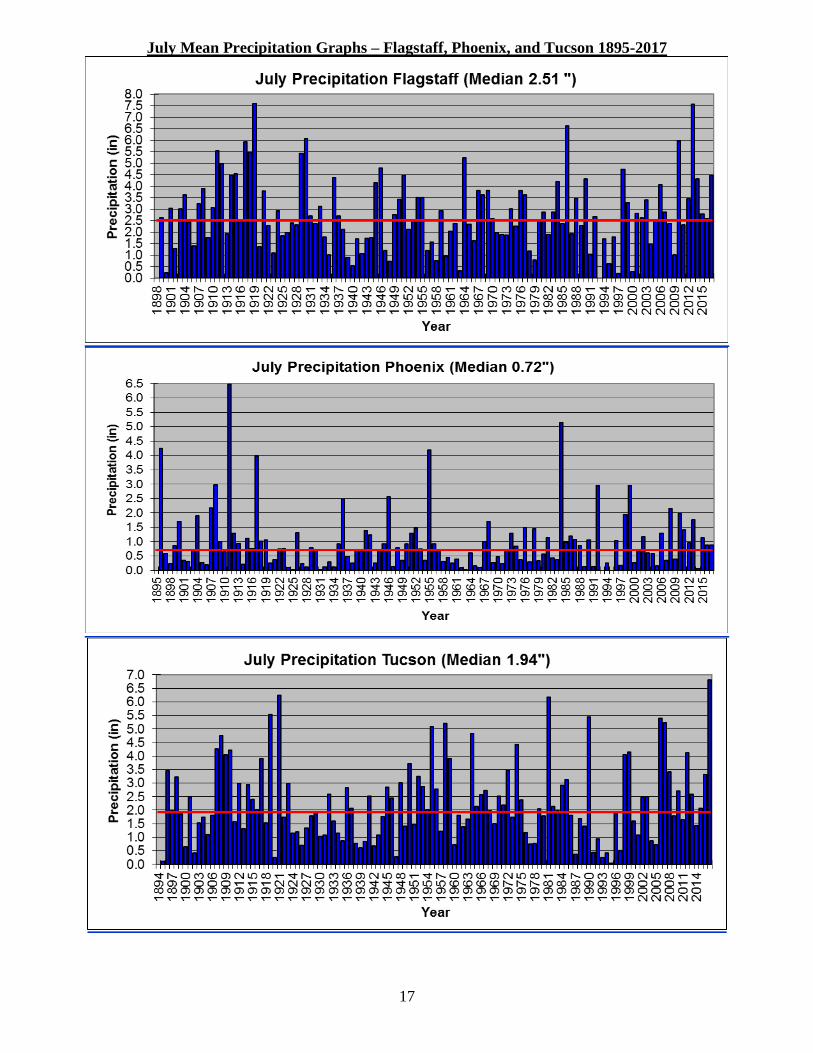
July Mean Precipitation Graphs – Flagstaff, Phoenix, and Tucson 1895-2017
18
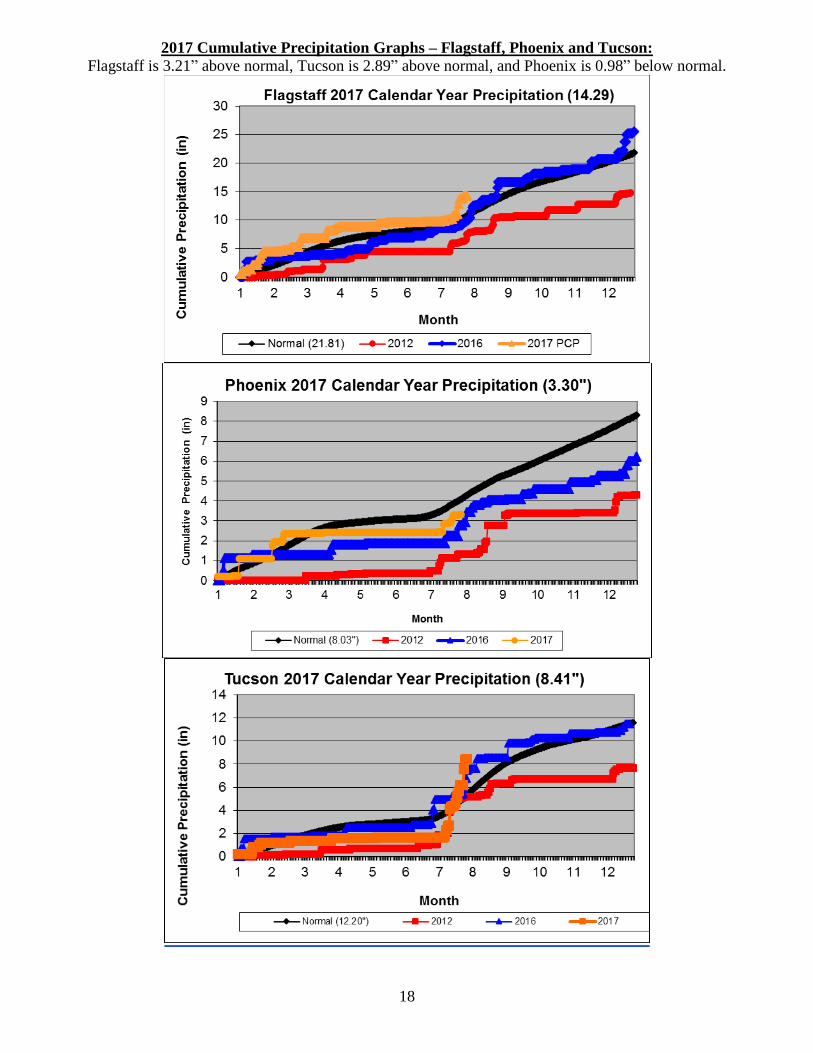
2017 Cumulative Precipitation Graphs – Flagstaff, Phoenix and Tucson:
Flagstaff is 3.21” above normal, Tucson is 2.89” above normal, and Phoenix is 0.98” below normal.
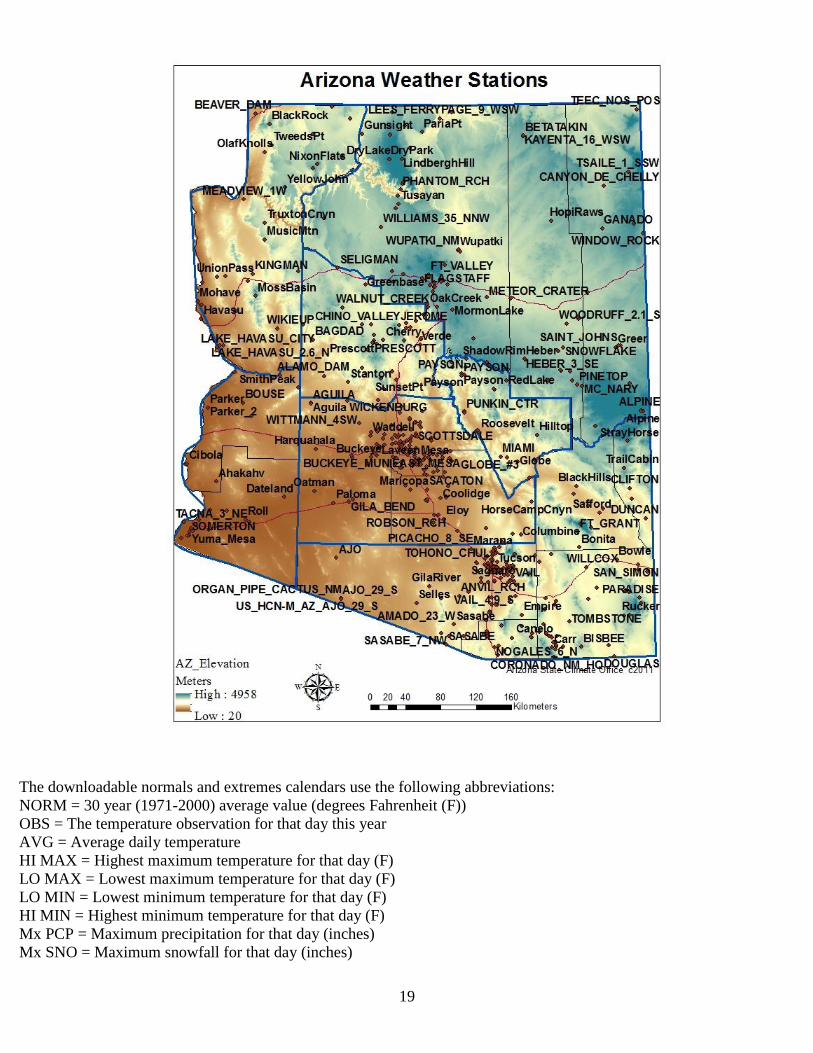
19
The downloadable normals and extremes calendars use the following abbreviations:
NORM = 30 year (1971-2000) average value (degrees Fahrenheit (F))
OBS = The temperature observation for that day this year
AVG = Average daily temperature
HI MAX = Highest maximum temperature for that day (F)
LO MAX = Lowest maximum temperature for that day (F)
LO MIN = Lowest minimum temperature for that day (F)
HI MIN = Highest minimum temperature for that day (F)
Mx PCP = Maximum precipitation for that day (inches)
Mx SNO = Maximum snowfall for that day (inches)