(army facilities components system) … 593 afcs (army facilities components system) climatic zone...
TRANSCRIPT

AD-A45 593 AFCS (ARMY FACILITIES COMPONENTS SYSTEM) CLIMATIC ZONE i/iLABOR ADJUSTMENT F..(U) CONSTRUCTION ENGINEERINGRESEARCH LAB (ARMY) CHAMPAIGN IL R L BRAUER ET AL.
UNCLASSIFIED AUG 84 CERL-TR-P-165 IAO-E8783iii F/G 5/1 NL
ILd

L
1111.25 I 1 1 1.6
MICOCOPY RESOLUTION TEST CKARTWATOWA hBfuJ OF STANDAAOS-i963-A
if-
US Army Corpsof Englws TECHNICAL REPORT P.165Construction Engineering August1984Rlessawh Laboratory
.
ZON LAORAD-A 145 593ADJUSTMENT FACTORS
byRoger L. BrauerGerald J. BrownEdward KoehnSamuel T. BroolinThomas Mahan
Approved for public release; distribution unlimited.
84. 09 14 007
.i-- -- . ---. . -. . -
4.... '
The contents of this report are not to be used for advertising, publication, or V.
promotional purposes. Citation of trade names does not constitute anofficial indorsement or approval of the use of such commercial products.The findings of this report are not to be construed as an official Departmentof the Army position, unless so designated by other authorized documents.
.0
DESTROY THIS REPORT WHEN IT IS NO LONGER NEEDEDDO NOT RETURN IT TO THE ORIGIN.4 TOR
. °

SECURITY CLASSIFICATION OF THIS PAGE (When Data Stewreo _
REPORT DOCUMENTATION PAGE BEFORE COMPLETING FORMT. REPORT NUMBER 2. GOVT ACCESSION NO. 3. RECIPIENT'S CATALOG NUMBER
USA-CERL TR P-165 "__-__"4. TITLE (and Subtitle) S. TYPE OF REPORT & PERIOD COVERED
AFCS CLIMATIC ZONE LABOR ADJUSTMENT FACTORS FINAL 0
6. PERFORMING ORG. REPORT NUMBER
7. AUTHOR(s) S. CONTRACT OR GRANT NUMBERfs)Roger L. Brauer Samuel T. BrooksGerald J. Brown Thomas Mahon IAO E87830111Edward Koehn
9 . PERFORMING ORGANIZATION NAME AND ADDRESS SO. PROGRAM ELEMENT, PROJECT. TASKU.S. Army Construction Engr Research Laboratory AREA IwORK UNIT NUMBERSP.O. Box 4005Champaign, IL 61820
1.. CONTROLLING OFFICE NAME AND ADDRESS 12. REPORT DATE 5August 1984
IS. NUMBER OF PAGES38
_14. MONITORING AGENCY NAME A ADDRESS(I1 differet fr m Controlling Office) IS. SECURITY CLASS. (of this reporf)
UNCLASSIFIED
IS. DECL ASSI FICATION/DOWNGRADINGSCHEDULE
IS. DISTRIBUTION STATEMENT (o. this Report)
Approved for public release; distribution unlimited.
17. DISTRIBUTION STATIEMEN4T (of the abstract ageed in Stock".0 It different h-rn RePort)
IS. SUPPLEMENTARY NOTES
Copies are available from the National Technical Information ServiceSpringfield, VA 22161
It. KEY WORDS (Continue an reverse oide if neeey and identify by block number)
Army Facilities Components Systemlaborproductivity -
constructi9..
as Ai Cbmh o rere, ad N neweeein, med ftdstt?~ by block -ia
• The Army Facilities Components System (AFCS) Climatic Zone Labor Adjust-ment Factors are used to estimate construction labor costs in different cli-matic zones for theater of operations countries. Existing AFCS factors areanalyzed for validity using published field data and computer technoLogy. A
regression analysis of the information used has generated revised factors.
(Continued)
ID Pa
I I
D 7m3 1431' EDITION OF I NOV 6S OBSOLETE UNCLASSIFIED
SECURITY CLASSIFICATION OF THIS PAGE (Ohm, Date fifee- -

UNCLASSIFIEDISCUNITY CLASSIFICATION OF THIS PAGE(Ihn Data SnaarQ)
BLOCK 29- (Cont'd)
-iabor adjustment factors were also developed for using local nationalversus troop labor in U.S. military theater of operations (TO) construction.These factors allow the estimator to allow for conditions such as poor commun-ication and little experience with U.S. equipment and methods.
These labor adjustment factors will be used when accessing the AFCS toestimate labor/cost for TO construction. - - -
U-.
J9
UNCLASSIFIED
SECURITY CLAsIICAION OF THIS PAOe(WMher Dote Ente**

FOREWORD
This investigation was performed for the Facilities Development Branch,
*U.S. Army Engineer Division, Huntsville, AL,. under Intra-Army Order (IAO), 0-* E87830111. The Technical Monitor was James Winters, HNDED-FD.
* R. L. Brauer, G. J. Brown, S. T. Brooks, and T. Mahon work in the Facil-
ities Systems Division (FS), U.S. Army Construction Engineering Research Lab-
oratory (USA-CERL). Dr. Edward Koehn is an Associate Professor at Purdue
* University.
E. A. Lotz is Chief of PS. COL Paul J. Theuer is Commnander and Director
of USA-CERL, and Dr. L. R. Shaffer is Technical Director.
3

CONTENTS
Page Il
-. DD FORM 14731*FOREWORD3*LIST OF TABLES AND FIGURES 5
1INTRODUCTION............................ ............. ...... 17* Background
ObjectivesApproach
* ScopeMode of Technology Transfer
*2 ANALYSIS OF EXISTING FACTORS ............................................ 9Methods for Standardizing Atmospheric ConditionsData CollectionAnalysisDiscussion
* ~3 OTHER AFCS ADJUSTMENT FACTORS. . .. .. .. .. . ... .. .. .. .. . .. .. ... .. . ... ..... 16
Indigenous Labor Adjustment FactorsAnnual Construction FactorTroop Versus Contract Labor
4 CONCLUSIONS AND RECOMMENDATIONS ...... . .. . ... .. .. .. .. . .. . .. . .. .. . .. . 22
REFERENCES 23
*APPENDIX: Monthly Productivity By Country Based on Temperature 25and Humidity
* DISTRIBUTION
4
TABLES
Number Page
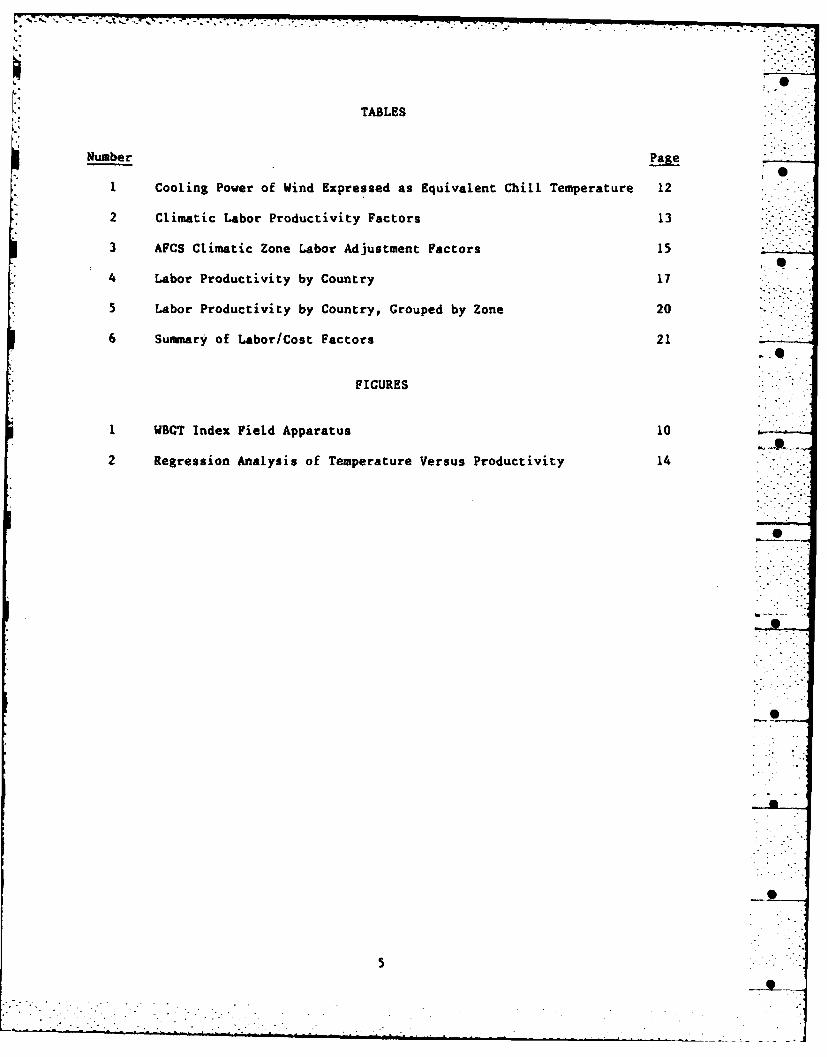
1 Cooling Power of Wind Expressed as Equivalent Chill Temperature 12
2 Climatic Labor Productivity Factors 13
3 AFCS Climatic Zone Labor Adjustment Factors 15
4 Labor Productivity by Country 17
5 Labor Productivity by Country, Grouped by Zone 20
6 Suammary of Labor/Cost Factors 21 -
FIGURES
I WBCT Index Field Apparatus 10
2 Regression Analysis of Temperature Versus Productivity 14 .
-775- . . . -

AFCS CLIMATIC ZONE LABORADJUSTMENT FACTORS
SINTRODUCTION
Background
The Army Facilities Components System (AFCS)1 is a computerized military 6
engineering construction support system designed in response to the need foran improved construction planning method in the theater of operations (TO).
One factor which must be considered in TO construction planning is worker pro-ductivity in different climates. To allow for these differences, the U.S.Army Construction Engineering Research Laboratory (USA-CERL) in 1971 adapted aset of multipliers for use with the AFCS. The multipliers had been used for .0several years in construction labor estimates, probably originating fromrecords on Army overseas experience.* The "AFCS Climatic Zone Labor Adjust-
2ment Factors were based on an earlier mathematical model, in which the oldfactors were scaled using a value of 1.00 for normal (temperate) conditionsand assuming normal worker output. Worker efficiency factors in the model hadbeen derived from a set of equations that measure average skin temperature asa function of air temperature, wind speed, relative humidity, solar radiation,type of task being d ne, and clothing worn. These results'were correlatedwith some field data on productivity to establish an expression of labor ef-ficiency. The factors resulting from this scale-up were to be used with the
corresponding four climatic zones for which the Army identifies standard con-~ditions.
* Based on its mission to supply accurate engineer estimates in support of" operation orders, the 416th Engineer Command asked the U.S. Army Engineer Div-
ision, Huntsville, AL, to validate the factors based on current knowledge of
climatic zones and improved analytical techniques. Huntsville tasked USA-CERLwith this project. Revised factors should reflect any changes since 1971 in
materials, construction methods, and equipment that could affect laborer pro-ductivity. Recent information on seasonal climatic factors was to be in-cluded, and a matrix was to be developed to account for use of local national(indigenous) labor rather than U.S. engineer troops. This information would
help base development planners, engineer commands or units, and Corps of Engi-neers estimators in developing accurate construction labor estimates.
ITechnical Manual (TM) 5-304, Army Facilities Components System: User's Guide(U.S. Department of the Army, October 1979).
*However, the exact origin is unknown.2 E. J. Kuipers, A Method of Forecasting the Efficiency of Construction Labor
in Any Climatological Conditions, Ph.D. Dissertation, University of Illinois(Ann Arbor, MI: University Microfilms International, 1976).
3NAVFAC P-385, Base Development Planning for Contingency Operations (U.S.Department of the Navy, Naval Civil Engineering Laboratory, July 1973).
4Army Regulation (AR) 70-38, Research, Development, Test, and Evaluation of
Material for Extreme Climatic Conditions (U.S. Department of the Army, August1979).
F ouPA ai
:.............-..... .. ..... . .- ..I . , . _ . .

Objectives
The objectives of this study were to (1) validate and/or revise the AFCS 0Climatic Zone Labor Adjustment Factors using field data and new mathematicaltechniques and (2) develop a matrix that includes local nationals and troopsin using these factors to estimate labor requirements.
Approach,. ..
State-of-the-art methods for adjusting labor factors based on climatewere investigated, and field data were collected on worker productivity forvarious outdoor climates. This information was used in a regression analysisto develop new factors that could be compared with the existing ones. .. -
Data were then collected on worker productivity for different local na-tionals under various climatic conditions, and these results were used to de-velop factors that would compare indigenous to troop labor. All informationwas compiled into matrices of extended labor adjustment factors.
Scope
This study considers only the 46 countries of primary interest to theFacilities Development Branch, U.S. Army Engineer Division, Huntsville, AL.These countries are the focus of Huntsville's Foreign Equivalent.ConstructionStock Items and Local Building Component Study, Phases I and II.,
Mode of Technology Transfer
It is recommended that the results from this study be incorporated intoArmy Technical.Manual (TM) 5-304, AFCS User's Guide.
5Louis Berger International, Inc., AFCS Foreign Local Building Components andConstruction Materials, Addendum "AT" Central and South America, Draft Report(U.S. Army Engineer Division, Huntsville, March 1984).
8I'" 8 '" .
.S

[-6
2 ANALYSIS OF VXSTILNC FACTORS
Methods for Standardizing Atmospheric Conditions --
The four AFCS Climatic Zones were established based on air gemperature,wind velocity, relative humidity, and solar radiation. AR 70-38 gives therange of environmenal factors associated with each climatic category and Fig- ""ure 2-1 of TM 5-304 shows the geographic extent of each.
In Kuipers' model, the atmospheric data used in the equations came from S
international records exchange between zone countries and the U.S. Department
of Commerce Environmental Sciences Services Administration. The factors werecalibrated using a complex association of temperature, wind speed, and rela-tive humidity. Measurement methods now exist that express atmospheric condi-tions as one value. These methods can be used to standardize different formsof reported climatological data for use 'in statistical analysis. (For hot .6climates, the technique measures heat stress; a different scale is used tomeasure cold stress for extremely cold regions.
Heat Strees Measurement
Four basic factors determine the degree of heat stress exerted by the en-vironment: air temperature, humidity, air movement, and heat radiation
(and/or direct conduction) from objects. Several heat stress indices have
been developed to predict whether exposures to hot environments will result inexcessive heat strain. The two used most are the Heat Stress Index (HSI) andthe Wet-Bulb Globe Temperature (WBGT) index. Instrumentation and calculationsrequired for a WBCT assessment are simpler than those for the HSI (Figure 1). - .
The WBGT index was developed as a simple method for determining if mili-
tary troops are likely to suffer from heat illness in hot environments. Only -
two or three measurements are needed: wet-bulb (static) temperature (WB),dry-bulb temperature (DB), and globe temperature (GT). 'To convert other formsof atmospheric data into WBGT values, one of two equations can be used, de- -pending on the presence of a solar load:
WBGT = 0.7WB + 0.2CT + 0.1DB (with solar Load) [Eq 11
WBGT = 0.7WB + 0.3GT (without solar load). [Eq 21
An average WGBT value can thus be computed if a person is exposed to a se-quence of differing thermal environments.
CoZid Stress Measurement
Two basic factors determine the degree of cold stress exerted by the en-
vironment: air temperature and wind velocity. High humidity at colder
6ARe70-38, Research. Development, Test, and Evaluation of Material for
Extreme Climatic Conditions.7 5-304, Army Facilities Components System: User's Guide.
8TB MED 507, Prevention, Treatment, and Control of Heat Injury (Headquarters,
Departments of the Army, Navy and Air Force, July 1980).
9

THERMOMETER DRY-BULB WET-BULBIN GLOBE THERMOMETER THERMOMETER0
TRMOME1TER THERMOME1TIER
musum CAROSOANO
WATIER
OLOSE PLASTIC(e DIAN) mTL
WB3GT 0.7 WS 0.20T +0.1 DB
(WITH A SOLAR LOAD) AFigure 1. WBGT index field apparatus.
10

temperatures lowers productivity; however, these effects can be reduced* greatly when laborers wear suitable clothing and are protected from the wind.
One of t~e few cold stress indices is the Windchill Index (WI) used bythe military.. The WI was devised to assess the relative discomfort of cold 0
in relation to the air temperature and wind speed. The basic concept recog-nizes that convection is the most important single avenue of heat loss in acold environment. Table I gives windchill effects expressed in equivalentchill temperatures, i.e., those which cause the same rate of cooling at dif-ferent wind velocities. This table was used to standardize the climatological-data used in the regression analysis.
Data Collection
A literature search revealed that most studies on work environment havebeen done by physiologists or by firms investigating design procedures for 6heating and ventilating systems. In addition, work on identifying comfortzones has been largely for indoor environments. Six sources were located thatcontain raw data on productivity in different climates;Y 0 these data were usedin the analysis. (Not all sources reported data for all 46 countries, and in-formation was unavailable for five of those countries.)
USA-CERL also consulted Corps of Engineers officials, the Bureau of LaborStatistics (Foreign Labor Statistics Branch), the U.S. Department of Housingand Urban Development, and the National Constructors Association. However,very little additional data on this subject were available.
Analysis
Temperature and Humidity Versus Productivity
Matrices were developed for each of the 46 countries studied (see appen-dix). These matrices were based on average monthly temperature and relativehumidity versus productivity predictions from the six sources. A mean wascalculated for each month and this column was averaged for an annualized mean.The last column in the matrix, "Multiple," was calculated by taking the in-verse of the mean, or productivity factor. Thus, an average annual multiplier
can be figured for each country. Table 2 lists the average annual data from
9MIL-HDBK-759, Human Factors Engineering Design for Army Material (U.S. De-partment of Defense, March 1975).J. A. Havers, and R. M. Morgan, Optimal Construction Plans for Cold-Weather
Conditions (U.S. Army Cold Regions Research and Engineering Laboratory(CRRELI, June 1969); Extra for Winter Allowance (Chicago Bridge and Iron,April 23, 1968); C. T. Grimm and N. K. Wagner, "Weather Effects on MasonProductivity," Journal of the Construction Division, American Society forCivil Engineers (ASCE), (September 1974); E. Koehn and D. Meilhede, "ColdWeather Construction Costs and Accidents," Journal of the Construction Divi-sion, ASCE (December 1981); All-Weather Home Building Manual (National As-sociation of Home Buildings (NAHBI Research Foundation, November 1975); TheEffect of Temperature on Productivity (National Electrical Contractors As-socation, Inc. [NECA], 1974).
11 JL

. .-. In
=e - - -
40 w 0
-to-~p
U) 2 ain
g ' S~~LVa a g a a.
0 We
M3 S I a I I
03. 2~a 00
o o 2 2 1
L 4-CD 0 U
manNEU
W1

Table 2
Climatic Labor Productivity Factors
NORTESIN GROUP
NEAN NULTIPLE
ZONE I-UNITED KINGOON 0.92 1.0
England 0.93 1.06
Iceland 1.92 1.19Scotland 0.92 1.09
ZONE I-NORTWIE1U 0 EUROPE 0.91 1.10Lonulenbero 6.92 1.09Netherlands 6.92 1.69
Bolgium 0.91 1.10Germany 6.91 1.10Swedes 0.9 1.11 -.
Norway 6.9 I.ODOenmrk 6.91 t.19
2006 1-IOUtNN EUROPg 0.92 1.09
Spait 6.92 1. tipporttgal 0.92 1.09franes 0.91 1.09
Italy 6.94 1.66
Switetland 0.91 1.09Austria 0.92 1.09
Turkey 6.93 1.00
Greece 0.66 1.14
ZONE 4-IDODLE EAST 6.64 t.18
Egypt 0.64 1.19
Saudi Arabia 6.61 t.23Ones 6.04 1.19Kuwait 6.01 1.12Israil 0.88 1.14
Lebanon 6.09 1.12Paklwtla 1.62 1.22
ZONE 5-VAn EAST 0.91 1.16Korea 6.69 1.12
Japan 1.91 1.69
Taiwan 6.91 1.16
UOVTNSN GROUP
NAN MULTIPLE
- ---- - --- - ---- - --- - ---------------
ZONE 1 0.9 1.1•
Cost& a -c-.a. 0.69 1.12
El Salvador 0.69 1.12
deatemala 6.90 1.11
enuawras 6.89 1.1Neulco 6.66 1.14
20161 2 6.83 1.26Colombia 0.62 1.26
Ecuador 0.9 1.11.
panama 6.99 .3?
Venesela 0.00 1.25
ZONE I 0.90 1.11aIal 0.1? .11oliela 6.90 1.11Chile 0.90 1.IIParaguay 6.91 .t,'
Polo 6.91 .16
Uroualy 6.9t 1.09
ZONE 4 6.66 1.14
Dolnhlemi topub 0.6? 1.15
HaitI 6.91 1.10 .OJmasica 6.06 1.16
13

the appendix according to theater of operations zone for northern and southerngroups.
As an example of how these multipliers might be used, consider a projectthat, in a temperate zone (1.00) and with normal worker efficiency, takes an 0
estimated 1000 manhours to complete. If the same project were to be done in asouthern group zone 1 country, the 1000 manhours would be multiplied by 1.12(Table 2) for a new estimate of 1120 manhours.
Re.reasion Curve
Figure 2 was developed from a regression analysis of data in the appen-dix. The values for average temperature and relative humidity were adjustedusing the methods described above, with WBGT used for high temperatures and WIused for low ones. To define frigid, temperate, desert, and tropical zones,values of -25"F, 60*F, 90*F, and 100F, respectively, were assigned. Thus, WI --
was used to adjust to frigid; WBGT was used for the other three values. The
regression curve in Figure 2 is the best fit using the Statistical Package forSocial Sciences (SPSS) computer program.
0.9
0.8--
0.7-
0.6- ...
0.5-
0.4-
0.3-
0.21
0.1
-40 -20 0 20 40 6 50 100 120WIND CHILL / WUOT
. Figure 2. Regression analysis of temperature versus productivity.
14
- . .

- - - - -- -o.... .
The new Climatic Zone Labor Adjustment Factors were derived by locatingthe temperature coordinates corresponding to each zone and reading the produc-tivity value. The multiplier was obtained by taking the inverse of thisvalue. Table 3 compares the results 6f this analysis with the existing fac-tors.,
Table 3
AFCS Climatic Zone Labor Adjustment Factors
MultipliersZone Existing Revised
Temperate (60°F) 1.00 1.00Tropical (100°F) 1.45 1.45 .Desert (900F) 1.15 1.25Frigid (-25°F) 2.57 2.41
Discussion
The factors developed in this study are very similar to those used pre-viously in the AFCS, with desert and frigid zones differing by .10 and .16,respectively. The lack of raw data limits this study's statistical validity.However, these new factors represent the best method now available for adjust-ing labor estimates according to climate. As better records are compiled onatmospheric conditions and worker efficiency, it will become possible torefine construction estimation techniques in TO countries.
15
-.......-- . ..

,0
3 OTHER AFCS ADJUSTMENT FACTORS
For the second part of this work, Huntsville Division had asked USA-CERL -
to compare productivity for U.S. troop construction labor versus local nation-al labor. During the study, two subtasks were also requested: (1) to form anannual construction factor matrix for labor and materials and (2) to comparetroop versus contract labor.
Indigenous Labor Adjustment Factors 0
The purpose of comparing U.S. troop productivity with local nationals'was to account for unavoidable worksite conditions that reduce labor efficien-cy. Examples of conditions that may hinder the local laborer's productivityare: 0
e Language barrier
* Unfamiliar equipment and methods
* Limited skill in reading blueprints
e Suboptimal physical condition.
Data Collection and Analyjsie
A literature search and queries to some firms involved with overseas con- 0struction produced several data sources comparing U.S. construction labor withindigenous labor. Most information came from the companies with construc-tion experience Outside the continental United States (OCONUS). In addition,an estimator at the USACE Mediterranean Division-Rear was contacted to deter-mine how Army productivity factors were derived for construction in the MiddleEast (Saudi Arabia, Egypt, and Oman). It was learned these factors are devel-oped by doing annual surveys; this information is included in the Army: UnitPrice Book, part of the Computer-Aided Cost Estimating System (CACES).11
In this analysis, the fully acclimated, physically fit U.S. militarylabor was assigned a value of 1.00. Table 4 shows the data reported from eachsource, with means shown in the last column for each country. Again, taking
llWorldwide Cost Multipliers (Marshal and Swift Publishing Co., November1982); Housing and Building Technology in Developing Countries, MSU Inter-national Business and Economic Studies (Michigan State University - EastLansing, 1966); Detail Cost Manual (Cost Systems Engineers, Inc., 1981-82);Anonymous Firm, Response to request for data (July 1983); Delphcon Builders,Inc., ltr dated 22 July 1983; Kemper Group, International Cost Indices, ltrdated 20 July 1983.
12Engineering Pamphlet (EP) 415-345-5, Computer-Aided Cost Estimating System(CACES) (U.S. Army Corps of Engineers, March 1983).
16
• m ll l I1 l I - - I I . .. .. . . . . . . . . . . .. . . . . . . . . .. . . . . . . . - . . . . . - - -: 0

.. .. . . .- . . .- .- . .
*4b
aa
MO 4Cw101, 0 o*Z
go I
'A I
0 "M -1
sw .. .p
* .0,* C
mmma
A do
16 a- 1
i~ 40z-. I Ia . a 0 -
e69
o emmm 17

m a~ a.. e**cc@mO eCC*****O *C*
- m w. C
~ a
11111: ~ jU
a .404C m~* 0~000 ccc. CeceCe w -.
:::::: ::: 0.1
- cecec C* ..... c Cc.CC
C C
S
a:S ~ 0 0 000 0
Ca C C C 000 0a .
* C c CC. 0
a
a! IAa:
a Ua * - C U
a -w S A 4 0 U A
.1. S U - Ua A -SUm U--
ii I I I18
0~-~-1
the inverse of these productivity means, a multiplier can be calculated (Table5). These indigenous labor adjustment factors should be multiplied by thecorresponding climatic factor (Table 2) when estimating indigenous labor re-quirements for a particular country.
Annual Construction Factor
USA-CERL was to develop a matrix of annual construction cost factors thatinclide both labor and materials. This information was to come from AR 415-17, which covers only 15 of the 46 countries in this study.
As an example of work done in this area, USA-CERL consulted a USAC draftreport for adjustment factors in the Continental United States (CONUS)."This study assumes productivity rates are constant throughout the country, andthe total index is based on an assumed 45 percent labor/55 percent materials.
In the international sphere, however, labor productivity is not a con-stant value as discussed in Chapter 2. Also, the 45/55 labor-to-materialratio may not apply. Therefore, it was concluded that the current factors inAR 415-17 are still the best for estimating this parameter (Table 6).
Troop_ Versus Contract Labor
To determine the efficiency of troop versus contract labor, USA-CERL con-tacted the U.S. Army Engineer School in Fort Belvoir, VA. This agency hasproponency for Fifs and TMz that guide Army construction contracting. The in-formaon obtained showed that standard estimating methods such as Dodge andMeans are used to estimate troop labor. No multiplier exists to distinguishbetween troops and contractors, and was determined to be beyond the scope ofthis study.
13AR 415-17, Cost Estimating for Military Programaing (U.S. Department of the
14Army, February 1980).Hanscomb Associates Inc., CONUS Location Adjustment Factor Analysis ReportDACA-87-C-0040, Task 3, Vol I (U.S. Army Engineer Division, Huntsville,1983).
15L. Dallania, Estimating General Construction Costs (F. W. Dodge Corporation,1957).
19
-A-.- W6. - -

Table 5
Labor Productivity by Country, Grouped by Zone
LABOR ADJUSTHENT RATES
NORTHEN GROUP MAN MLTIPLE
ZONK 1-UNITED KINGDOM 0.64 15Egland 0.6? 1.50Iceland 0.63 1.60Scotland 6.6t 1.63
ZON11 2-NORTHERN EUROPE 0.06 1.16Lesbourg 0.95 10Netherlands .0 1.24Belli"m 0.00 1.36Germany 0.91 1.10Sweden 0.0? 1.15I NHarvey 0.02 .3Denmack 0.0? 1.15
ZONK 3-SOUTHRN EUROPE 6.65 1.54Spain 0.56 1.79pertolal 0.40 2.50francs 0.74 1.35Italy 0.73 1.30Switzerland 0.95 1.05 -~~
Age tla 0.63 1.50Terkey 0.43 2.3Greece 0.75 1.34
ZONE 4-MIDDLE EAST 0.50 1.71Egypt 0.40 2.09Saudi Arabia 0.53 1.00Oman 0.55 1.02Kuwait 0.54 1.0?Israel 60 1.240Lebaun 0.61 1.23Pakistan 0.3? 2.76
ZONE 5-VAR EAST 0.61 1.49Korea 0.79 1.26Japan 0.76 8.29Taiwan 0.44 3.2?
SOUTHERN GROUP MEAN NULTIPLE
ZONE 1 0.50 1.96Costa Rea 0.55 1.74E1 Salvador 0.40 ZI?7Guatemala 0.47 2.18Vo:d:ras 0.46 2.18Magi. 0.51 1.95
ZONE9 2 0.53 186Colombia 0.50 1.99tcigder 0.50 .0Panama 0.55 8.03Veneusela 0.59 1.71
ZONE1 3 0.50 1.99Brasil 0.43 2.38Bolivia 0.00 2.00Chile 0.54 1.06Paraguay 0.50 2.00Peru 0.46 2.6Urugea 0.58 1.74
ZON 4 0.49 2.04Dominica* Rtepublic 0.50 2.00NAMt 0.4? 2.15Jamaica 0.58 1.9, 7
20
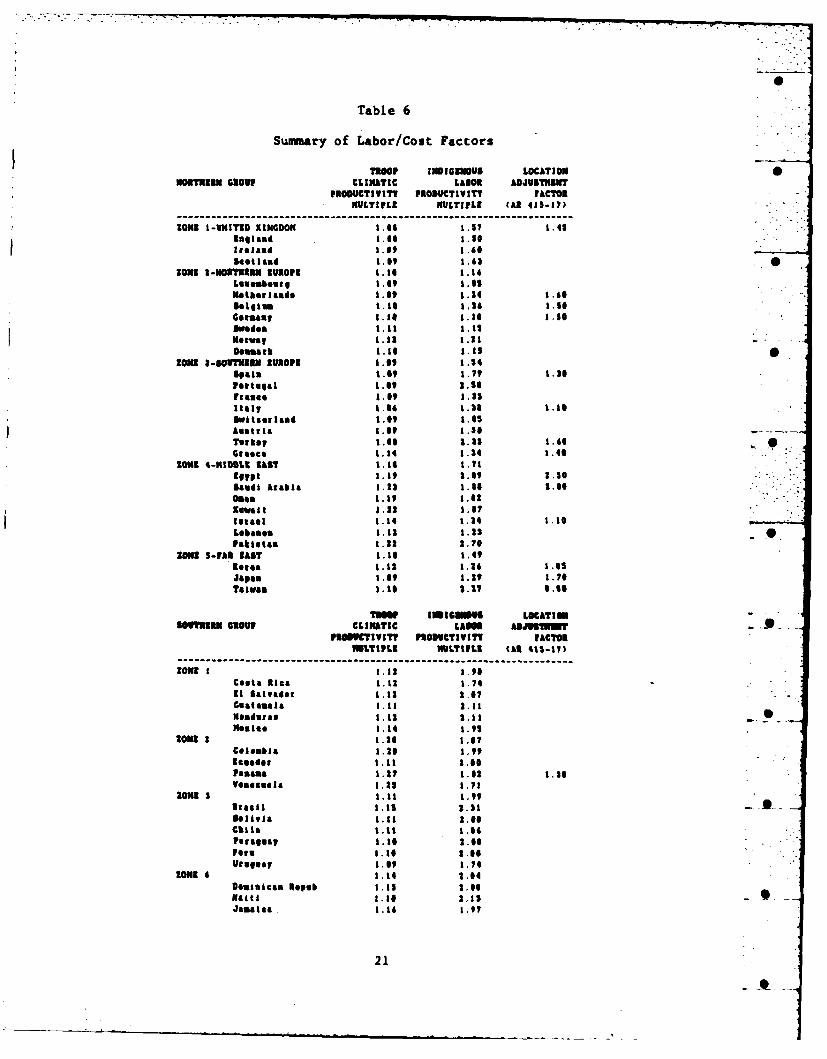
Table 6
Summary of Labor/Cost Factors
TorP IN|DIGENOUS LOCATIONNORMABN GROUP CLIMATIC WAOR AD)JOUISTN
PRODUCTIVITY PRODUCTIVITY FACTOR
NULTIPLE NILTIPLE (AR 435-17)
ZONE 1-UNITED KINGOM 1.0 .? .1.4-England 1.6 1.56
alrd 1.19 .60.Scotland 1.9 1.63
ZONE I-NORTNIRN IUROPE 1.16 .16Luueubourg 1.09 1.0sNetherlands 1.09 1.24 1.60.l1l1mm 1.10 .26 3.10
Germany 3.0 1.t0 1.50Jedea 1.38 3.31
Norway 1.12 .21Donmark 1.16 1.35
ZOn I-EOVTNION EUROPE 1.69 1.54Spais 1.69 1.79 1.3O
portulal 1.09 2.S0France 1.09 .5Italy 1.06 1.10 1.10Switzurland 1.09 1.65Austria 1.09 3.5.Turkey 1.00 2.33 1.60 64Greece 1.14 1.34 1.40
ZONE 4-MIDULZ 9LST 1.10 1.71Egypt 1.19 2.09 :.5oSaudi Arabia 3.22 1.00 2.O0Oan 1.19 1.02Kuwait 133 1.5?if'*1 1.14 1.34 1.10
Lobasm .12 1.23 .Pakltas 1.22 2.70
ZONE $-FA EAST 1.11 1.49Korea 3.12 1.26 1.O5Japan 3.09 1.29 3.70
Talvan 1.10 .27 6.00
TOM Inl3Wle LOCATIONSNO UN GROUP CLINATIC LAM 5,W -i o-t
PRODUCT IVIY PRODUCTIVIT FACTORMULTIPLE MULTIPLE (AS 411-1?)
-----------------------------------------------------ZONE 1 1.3 3.9
Celia tRica 1.11 1.74 . "
33 Salvador 1.12 2.0?Guatemala 1.11 2.11Nendsuas 1.12 2.11 _
Noiie 1.14 1.91ZONE 2 1.26 3.0?
Colo bia 1.20 1.99Euador 1.11 2.0Panama 1.1? 1.02 1.20
Voauuela 1.25 1.71IONi 2 1.11 1.99
Urauil 1.11 2.31
Uolivia 1.11 3.06C01lel 1.11 1.0Paraguay 3.30 2.00
Peru 1.10 2.00Uruguay 1.09 1.74
ZONE 4 1.14 2.04Dominlcan Ropub I.1 2.06
Jamaica 1.16 1.9?
21
CONCLUSIONS AND RECOMMENDATIONS
Published field data and computer technology have been used to revise the 0
four AFCS Climatic Zone Labor Adjustment Factors. The updated version is tem-
perate--l.OO, tropical--l.45, desert--l.25, and frigid--2.41. In addition,
adjustment factors have been developed for using Local national labor versus -
troop labor in OCONUS construction projects. Multipliers have been given foreach of the 46 countries of primary interest to USACE Huntsville Division.
It is recommended that these factors be used as multipliers when access-ing the AFCS database to prepare labor and cost estimates. Although this sys- -.-.
tem is not exact, it represents the best available technology for making ad- "-justuents due to climate and indigenous labor efficiency.
22

REFERENCES
Army Regulation (AR) 415-17, Cost Estimatinj for Military Programing (U.S.Department of the Army, February 1980)...
AR 70-38, Research, Development, Test and Evaluation of Material for ExtremeClimatic Conditions (U.S. Department of the Army, August 1979).
All-Weather Home Building Manual (National Association of Home Builders [NAHB]Research Foundation, November 1975). 0
Anonymous Firm, response to request for data (July 1983).
Dallania, L., Estimating General Construction Costs (F. W. Dodge Corporation,1957).
Delphcon Builders, Inc., ltr dated 22 July 1983.
Detail Cost Manual (Cost Systems Engineers, Inc., 1981-82).
Engineering Pamphlet (EP) 415-345-5, Computer-Aided Cost Estimating System(CACES) (U.S. Army Corps of Engineers, March 1983). -..
Extra for Winter Allowance (Chicago Bridge and Iron, April 23, 1968).
Field Manual (FM) 31-70, Basic Cold Weather Manual (U.S. Department of theArmy, April 1968).
Grim, C. T. and N. K. Wagner, "Weather Effects on Mason Productivity,"Journal of the Construction Division, American Society for Civil Engineers(ASCE) (September 1974).
Hanscomb Associates, Inc., CONUS Location Adjustment Factor Analysis ReRort,DACA-87-C-0040, Task 3, Vol 1 (U.S. Army Engineer Division, Huntsville,1983).
Havers, J. A., and R. M. Morgan, Optimal Construction Plans for Cold-WeatherConditions (U.S. Army Cold Regions Research and Engineering Laboratory[CURELJ, June 1969).
Housing and Building Technology in Developing Countries, MSU InternationalBusiness and Economic Studies (Michigan State University-East Lansing,1966).
Kemper Group, International Cost Indices, ltr dated 20 July 1983.
Koehn, E., and D. Meilhede, "Cold Weather Construction Costs and Accidents,"Journal of the Construction Division, ASCE (December 1981).
Kuipers, E. J., A Method of Forecasting the Efficiency of Construction Laborin any Climatological Conditions, Ph.D. Dissertation, University ofIllinois (Ann Arbor, MI: University Microfilms International, 1976).
23

Louis Berger International, Inc., AFCS Foreign Local Building Components andConstruction Materials, Addendum "A". Central and South America, DraftReport (U.S. Army Engineer Division, Huntsville, Maich 1984).
Military Handbook (MIL-HDBK)-759, Human-Factors Engineering Design for ArmyMaterial (U.S. Department of Defense, March 1975).
NAVFAC P-385, Base Development Planning for Contingency Operations (U.S.
Department of the Navy, Naval Civil Engineering Command, July 1973).
Technical Bulletin Medical (TB MED) 507, Prevention, Treatment, and Control of
Heat Injur (Headquarters, Departments of the Army, Navy, and Air Force,
July 1980.
Technical Manual (TM) 5-304, Army Facilities Components System: -User's Guide
(U.S. Department of the Army, October 1979).
The Effect of Temperature on Productivity (National Electrical ContractorsAssociation, Inc. [NECA], 1974).
Worldwide Cost Multipliers (Marshal and Swift Publishing Co., November 1982).
24.-7-

APPENDIX:
MONTHLY PRODUCTIVITY BY COUNTRY BASEDON TEMPERATURE AND HUMIDITY
ENUNTE: NGAnD
AVEKAG9 AV. EEL. CHICAGOMUTHY TEN?. NMIDITY CRUEL 91.412ON LICs LICE MAU M9CA MEAN MULTIPLE
January 39.56 66.60 969 0.93 6.19 6.91 6.96 6.66 1.14February 40.66 13.66 6.96 6.93 61 1.66 6.99 6.96 1.11
Match 44.66 63.66 6.99 6.90 6.63 1.66 1.66 6.92 1.69
April 46.66 56.66 6.99 1.66 6.61 1.66 1.66 0.93 8.66may 14.66 19.66 6.96 1.66 6.69 1.66 1.66 6.91 8.61just 66.66 59.664 6.9? 1.66 6.11 1.66 8.00 6.94 1.64
Jell 04.6 15.60 6.10 1.66 0.1.9 1.00 8.60 0.91 5.05August 6.66 511.61 6.90 1.66 6.76 8.00 8.06 6.91 1.65
septesheg 19.66 03.66 6.97 5.60 0.74 1.06 1.66 6.94 1.6
Octobe 1.66 6.6 .9 1.00 o.4 8s .66 1.66 6.99 8.6?Itweabu 4 4.60 114 19.0 .99 8.00 0.63 1.66 0.99 6.91 8.9
December 46.50 81.00 0.90 8.66 0.61 1.66 0.96 6.91 1.09
MEAN 56.10 00.00 6.90 6.99 6.06 0.99 ERWR 5.66 6.93 1.60
COVMVE: 1IRELAND
AVERAGE AV. EE9L. CHICAC1OHONTN TENP. NUNIDI10TV CREEL 22.41R0M ALIK LWE MANE Mgt& MEAM NULTIPLE--- -----------------------------------------------------------------------------------------------------
January 48.00 $8.06 0.90 0.93 6.6 1.06 6.90 6.69 1.11
rebruary 48.009 100 0.96 11.93 6.0.66 11 6.90 6.69 1.83
March 43.56 63.60 0.96 6.90 61 1.60 0.99 6.91 1.10
Apill 40.60 76.00 6.99 8.60 64 1.66 6.99 6.92 8.00
Nal 56.16 10.60 1.66 5.06 0.07 1.061 1.60 0.91 1.61
June 5183 ?11.06 198 0.96 1.60 .6 56 .00 0.94 1.1
July 19.06 16.6 6.91 1.66 0.13 1.66 8.00 0.90 8.01
August 19.66 68.64 6.9? 1.0 0.75 8.00 1.06 0.94 8.01
September 5.0 64.66 6.96 1.00 6.06 1.00 3.66 6.93 1.6?
October 5o 6.66 606 .60 5.60 0.01 8.66 5.66 6.99 1.60
Mewesiber 44.16 00.66 0.96 5.00 0.04 8.66 6.99 6.93 1.06
Daesber 48.116 00.06 0.90 8.00 6.08 1.06 6.96 6.91 8.69--------------------------------------------------------------------------------------------------------------
HEAR 40.96 02.31 6.90 6.99 60 1.66 0.99 6.93 1.69
*Sources: CRREL - Havers, A., and R. M. Morgan, Optimal Construction Plansfor Cold-Weather Conditions (U.S. Army Cold Regions Research and EngineeringLaboratory [CR.RELJ, June 1969); Chicago Br. and Iron = Extra for WinterAllowance (Chicago Bridge and Iron, April 23, 1968); ASCEII = Grimm, C. T.and N. K. Wagner, "Weather Effects on Mason Productivity," Journal of theConstruction Division, American Society for Civil Engineers (ASCE) (September1974); ASCEI2 =Koehn, E. and D. Meilhede, "Cold Weather Construction Costsand Accidents," Journal of the Construction Division, ASCE (December 1981);NAHB - All-Weather Home Building Manual (National Association of HomeBuilders (NAHBI Research Foundation, November 1975); NECA = The Effect ofTemperature on Productivity (National Electrical Contractors Association,Inc. [NECA), 1974).
25

- - * - .- ,. . 1 - * L.- r'no-S- -
COuIrlV: SCOTLAND
AVERAGE AV. 2EL CHICAGOMONTH TEMP. HUMIDITY CREEL 8R.IRSON LICE LICE HAME MCCA MEAN MULTIFLE---- ----------------------------------------------------------------------------------------------------------
January 59.06 54.00 0.9? 0 95 0.60 0 92 0 97 0.60 I 14hrobazr 09.00 s3.00 6.9? 0 93 6.60 0 93 0 97 0.68 1.14Match 41.56 61.00 0.90 0 96 0.61 1.00 0 96 0 91 3 1
SApril 44.36 76.00 0.96 1 00 0.63 1 t6 1 99 0 92 1 69Ny 49.6 76,.60 0.99 i 06 6.6? 1 so i 00 6 9 1.0.
. Joo 55.60 73.00 0 96 joo 0.10 I00 1 0o 0.94 1.,-July 00.5 77.0 0.97 i 0.72 1.00 1 00 6.94 1.07
August 56.00 79.00 0 97 1.00 0.71 1.00 1 00 6.94 1.-Seplmber 54.00 60.00 0.98 1.00 0.67 1.00 1.00 0.9 1.06"October 48.10 61.00 0.99 1.00 6.65 1.00 0.99 0.93 1.06November 43.00 83.00 0.90 1.00 0.63 1.00 0,99 0.9 1.09"December 40.00 64.00 0.96 1.00 0.59 1.00 0.96 0.91 1.10
--------------------------------------------------------------------------------------------------------------HEAN 47.50 79.73 0.98 0.99 0,65 0.99 0.99 0.91 1.09
COUNTRY: LUEMOOU8.,c
AVERAGE AV. REL. CHICAGO"ONTh TEHP. HUMIDITY CREEL NR.i1RON aCE ASCE KAH MECA MEAN MULTIPLE
Jaouary 32.50 86.00 0.97 0.93 0.55 0.92 0.93 0.66 1.16 .februaty 55.0 76.00 0.97 0.93 0.30 0.92 0.96 0.86 1.15
Hatch 41.60 62.60 0.90 0.96 0.61 1.00 1.00 0.91 1.16
April 49.06 57.00 1.00 1.00 0.67 I.06 1,01 0.93 1.67may 55.50 60.00 0.96 1.00 0.75 1.6 1.00 6.94 1.66
Jon 61.50 61.00 0.96 1.06 0.76 1.66 100 0.94 1.66July 64.50 59.00 0.95 1.06 0.79 1.60 1.00 0.95 1.65
August 64.00 60.00 0 95 1.00 6.00 1.00 3.00 0.95 1.65Sptember 57.50 69.60 0.97 1.00 0.75 1.00 3.00 0.94 1.06October 49.50 75.00 1.00 1.60 0.67 1.00 0.99 0.93 1.07November 41.00 06.00 0.96 1.00 0.60 1.00 0.96 0.91 1.10December 55.50 91.00 0.97 1.00 0.57 0.92 0.94 6.88 1.14
MEAN 46.8 76.17 0.97 0.99 0.67 0.98 0.98 0.91 1.09 " . -
COUNTRY: THE NETHERLANDS
AVERAGE AV. 2EL. CHICAGOMONTH TEMP. HUMIDITY CRREL R.&IRON ASCE LSCK NHH HECK MEAN MULTIPLE
January 57.06 84.00 0.97 0.93 0.56 0.92 0.91 0.6? 1.14 -Pebroary 57.50 19.00 0.97 0.93 0.55 6.91 6.9? .8? 3.14
match 43.50 71.00 0.96 0.96 0.61 1.00 0.99 6.91 1.36Apri 47.50 66.00 0.96 1.0 6.65 1.60 0.99 6.91 1.66
May 55.60 63.06 0.90 1.06 0.71 1.06 1.00 0.94 1.07Joe 60.60 63.00 0.97 1.00 0.74 1.00 1.06 6.94 1.06July 64.60 65.00 0.96 1.00 0.71 1.00 1.00 0.95 1.06
August 63.50 66.00 0.97 1.00 0.7? 1.00 1.00 0.95 1.65Seplmbar 60.06 69.60 0.97 1.00 0.74 1.00 3.00 0.94 3.06Otober $5.60 75.00 0.97 1.60 0.60 1.00 1.06 0.93 1.60November 44.60 62.00 0.97 1.06 0.63 1.60 0.99 6.95 1.09D*eember S4.10 06.00 6.9? 1.00 0.50 6.93 0.96 0.09 1.13
MEAN 56.60 12.42 6.97 0 99 0.67 0.98 0.99 0.92 3.09
26

C6UEMV: 41IN
AVINACE AV. IL. CRICAGONUNIN . 13. UNIDITY CIARL 6.I.63@ &acE "Cc "Aus MICA MAN 3WLTIPL&
January 36.66 79.46 6.91 6.66 6.16 0.63 0.94 64 3.26februaly 91.66 49.66 6.96 6.66 6.36 6.93 6.91 0.6 .3
March 45.36 66.66 6.99I 6.93 6.64 1664 8.66 6.91 .336il $.66 33.66 6.91 3.66 6.19 1.006.P 6.99 .1
way $4.66 14.66 6.I6 3.66 0.96 1.66 1.66 6.94 3.697...Jose 4.66 11.66 6.91 8.66 6.75 3.66 3.66 6.94 1.64Juil 43.66 33.66 6.94 1.66 6.71 3.66 1.66 6.93 1.6
LActual 43.66 36.66 6.9? 3.6 @a 6.16 3.66 3.66 6.91 3.65*September 54.66 66.66 6.96 1.66 6.13 3.66 3.66 6.94 3.64
October 44.56 49.66 6.99 1.66 .6.45 1.66 6.99 6.93 3,66November 34.16 66.66 6.91 3.66 6.16 6.91 6.91 6.69 9.3
*December 31.66 63.6 6.94 6.93 6.11 6.93 6.91 6.6? 3.3---- -----------------------------------------------------------------------------------------------------
Mall 45.94 44.41 6.91 6.91 064 6.9? 6.96 6.93 3.16
* CS"MI: 81911
AVERA9E AV. RIL. CNICAOM010111 1131. N11MDII CARlL UN.4130 ASIIE AuCg NM MCA HM MLTIVLg
January 31.66 67.66 6.91 6.66 6.11 6.63 6.93 6.61 3.33Februar, 14.1 11.66 6.91 6.66 6.11 6.63 6.93 6.61 8.38.
matcih 33.16 41.66 6.94 6.93 6.11 6.95 6.91 6.61 1.11Apri1 36.16 41.66 6.9? 1.66 6.19 6.93 6.98 6.69 1.33
may 49.06 54.66 6.99 1.66 64 8.66 8.66 6.93 1.61June $1.66 81.66 6.96s 1.66 6.13 1.66 3.66 6.94 3.6July is.16 19.66 6.91 8.66 6.14 3.66 3.60 6.91 1.6
Assest 19.16 44.0# 6.04 8.6 .11 3.5 .61 1.66 6.91 1.64September 3.6 6.66 6.99 1.66 6.46 3.66 1.66 6.98 3.6, f
October 43.16 14.66 6.99 8.66 6.43 3.66 6.96 6.93 3.69November 34.16 64.66 6.91 3.66 6.11 6.93 6.91 6.It 1.3Decmer 39.56 64.66 6.94 6.96 6.11 6.63 6.92 6.63 1.36
----- -----------------------------------------------------------------------------------------------------
AVINACE AV. AIL. CNICAGOX0011 TEMP. NUMIDITY CREL 11.1104M AacE AacE maNs MCA MAN NELTtFLI
January 21.66 63.66 6.91 6.63 6.13 6.63 6.93 6.63 .3February 34.66 11.66 6.94 6.63 6.13 6.63 6.93 6.63 1.33
March i3.16 4516 6.91 6.66 6.146 6.93 6.91 6.64 3.34Apri3 43.66 14.66 6.96 6.91 6.46 3.66 6.99 6.96 8.33
may 53.1 13.66 6.99 3.0# 69 8.66 1.66 61.94 3.61just 4.66 54.66 6.9? 3.66 6.16 3.66 3.66 6.94 3.64July 64.1 111.## 6.94 8.66 6.16 186 3.66 6.91 3.61
Auguet 48.66 43.66 6.91 1.66 6.11 3.66 1.66 6.94 1.64September 53.16 4S16 6.96 1.66 69 1.66 1.66 6.93 3.6?
October 62.66 13.66 6.96 3.66 6.43 1.66 6.99 6.93 1.69November 13.66 63.#6 6.9? 6.98 6.61 6.91 6.94 6.61 3.31December 1.56 6$16 6.91 6.66 6.14 6.63 6.91 6.63 3.28
MkAN 43.13 41.11 6.91 6.94 63 6.94 6.1 .69 3.82
27

* COUNTRY: SEN"31
AVEMAGI AV. 2EL. CNICAGONOm11 TEMP. HUMIDITY CREEL .6100M ACE AICE HNI MICA MEAN NULTIFLE
January St.m$ 66.06 6.96 6.93 6.16 6.91 6.93 6.66 1.16ebrueary 31.16 61.69 6.96 6.93 6.16 6.93 6.96 6.6? 1.1-march 34.16 74.60 0.97 6.96 6.1 6.93 6.96 6.66 1.1"April 44.66 63.66 6.96 1.66 6.63 1.06 6.99 6.93 1.69
Nay 11.51 19.66 0.99 1.16 6.69 1.10 1.66 6.94 1.67Jose 16.1 63.60 6.96 1.66 6.71 1.00 1.06 6.91 3.06July 62.66 66.0 0.97 1.66 6.71 1.00 0.99 6.94 1.66
August 61.16 66.66 6.97 1.66 6.74 1.00 6.99 0.94 1.66 * SSeptember 56.66 73.60 0.96 1.66 0.69 1.00 1.00 6.93 1.6?October 47.16 78.66 6.99 1.66 6.64 1.66 6.99 6.92 1.1.Noember 41.61 66.60 0.98 1.06 0.19 1.60 6.96 0.91 1.10December 31.16 69.66 6.97 1.66 6.17 6.92 6.94 6.66 1.14
---------------------------------------------------------------------------------------------------------------MEAN 46 31 74.60 6.96 6.99 6.61 6.97 0.96 0.91 1.10
COUNTW: SPAIN
AVIAGE AV. EEL. CHICAGOMONTN TEMP. NUNIDITY CREEL DER.IROM ACE ASCE NAME MCA MEAN MULTIPLI
January 46.1 66.66 0.99 6.67 1.00 0.69 1.13 a ...february 16.16 19.66 1.00 9-6 1.00 6.69 1.12
march 14.6 61.60 0.96 6.66 1.00 0.69 1.13 .. .April 17.16 61.06 0.96 6.72 1.00 6.96 1.11may 64.66 61.60 6.96 6.66 1.00 6.92 1.69 .Joe 76.06 61.66 6.91 6.96 0.75 1.00 6.96 1.11Jul 71.66 61.00 0.92 6.90 6.71 0.99 6.91 1.16
August 71.16 63.0 6.91 6.99 0.71 0.9t 0.91 , 1.10September 71.16 64.00 0.94 0.91 6.75 0.99 6.96 1.11 OOctober 64.16 66.60 0.96 0.79 1.00 0.91 1.19November 16.60 63.0 0.96 6.73 1.60 1.96 1.11December 16.16 66.0 1.00 0.69 1.00 6.96 1.12
MEAN 61.42 61.67 0.96 0.60 6.71 1.00 6.96 1.11
COUNTRY: PORTUGAL
AVERAGE AV. 1EL. CHICAGOmomTN TENP. MUMIDITY CREEL 12.9O0M AC ALCE MANE MICA HEAN MULTIPLE
Jamuary 14.66 72.66 6.98 6.76 1.60 1.#1 6.93 1.09 0ebruery 14.66 69.60 0.96 6.76 1.00 1.66 6.93 1.69March 16.50 66.60 0.96 6.71 1.60 1.66 6.93 1.66April $9.16 63.60 0.97 0.76 1.0 1.66 6.93 1.67Hey 64.16 19.60 0.96 6.66 1.60 1.66 6.94 1.66Jose 66 16 11.06 6.96 1.64 6.71 1.66 6.69 1.13Jell 73.0 1.66 6.94 0.96 6.75 0.99 0.96 1.12
August 74.1 1.00 0.93 6.92 6.71 0.99 6.96 1.11September 71.6 19.06 0.91 6.91 6.71 6.99 6.96 1.11October 61.10 65.60 0.96 6.61 1.60 1.60 6.94 1.06November 19.66 71.66 6.9 1.74 1.06 1.60 6.93 1.60December 11.66 71.60 0.99 0.71 1.00 3.0 6.93 1.11
WEAN 62.96 62.92 6.97 6.79 6.92 1.00 6.12 1.69
28 *

3311113: 1313CR
£133161 AV. 49L. CHICAGONomu 13W. EUKIDITI Cl12EL uuWAIO AgCs 15CR HN NBC& MEAN N.w...r.
Jauary 27.616 11.06 6.90 .2 1 6.93 0.911:Ut 0.88 3.30Vsbtuary 29.00 60.10 0.90 $-to 0.19 6.93 6.96 6.66 .1
Narch 00.001 1t.60 0.96 6.96 6.62 3.661 1.06 6.91 1.09April 56.1 16.00 3.00 1.6 0.47 3.66 1.66 6.92 1.0?may 116 12.60 6.96 a.ge *.ia 1.1 1.6o 6.94 1.6Joe. 62.16 11.66 0.96 1.66 6.1 1.66 1.66 0.94 1.66July 64.30 11.60 6.96 3.60 0.90 3.66 3.06 6.91 1.01
August 61.06 14.66 6.96 1.60 0.79 1.60 3.00 0.91 3.01September 19.10 29.80 0.1 3.05 0.26 1.06 1.66 0.96 1.01
*Oter $1.16 66.66 6.99 1.60 0.60 1.06 1.6 6.91 .6Nesember 42.1 76.66 6.90 3.6, 0.62 1.00 6.99 6.91 1.@9Daeaber 26.60 66.$6 6.9? 3.00 0.16 6.92 0.90 6.99 11--- -------------------------------------------------------------------------------------------- ft--------
KlAN 13.66 61.62 0.90 0.99 40 6.96 0.99 6.91. 3.6
COURDI: 1113.1
£113161 AV. 11L. CHICAGO141h1 TRW. 333331?? C11191,U111.612 6C1 ASCI HAR UB MICA KNO NULT3913
January 46.31 60.06 6.99 6.92 0.64 3.00 6.99 0.91 1.30-February 41.0o 60.00 6.99 0.92 0.61 3.66 3.66 6.91 3.099
Natch 110 16.66 0.99 6.96 0.69 3.6 1.00 6.91 1.06Apri1 11.60 14.06 6.96 3.66 0.72 3.66 3.00 0.94 3.06may 64.16 14.66 0.96 3.00 0.7f 3.06 3.00 0.91 3.61Joe 13.00 40.66 6.94 1.60 6.01 3.66 6.99 0.9t 1.61July 96.06 42.60 6.90 1.00 0.19 3.66 0.99 6.94 3.6?
* uut 76.60 41.06 0.90 3.00 0.1 3.00 0.99 6.94 1.66september 12.00 10.00 0.90 3.66 0.83 1.06 6.99 0.96 1.61October 62.6 19.00 0.96 3.00 0.96 3.60 3.00 0.91 3.15ANovember 14.10 66.66 6.90 1.6 0.69 3.06 1.00 0.92 1.01December 40.16 ?0.60 6.99 3.00 0.61 3.66 6.99 0.91 1.66
-- -----------------------------------------------------------------------------------------------------MEAN 6E5 £1. 1. C.6 .9 .7C.AS.O 69
------------------------------------------------------------------------------- -----------------------
Jaseary 14.00 1.60 6.91 6.91 0.1 6.93 6.96 0.0? 3.31Mebury 16.10 13.66 6.96 6.92 6.16 0.92 6.98 0.80 3.34
Nasek 0.16 63.6 0.90 0.96 0.61 1.06 I.60 0.91 3.36April 49.1 11.0 3.66 3.00 0.67 3.06 3.06 6.99 3.61may 64.6 17.66 0.96 3.60 0.79 1.60 3.66 0.91 .0
Ju8e 69.16 11.00 0.96 3.00 6.1 3.00 1.0 .96 3.01July 67.10 11.06 6.96 3.61 .01 3.1 .00 3.66 0.93 3.01
August 66.16 11.68 0.96 3.66 0.63 3.60 3.06 6.91 3.01Septembef 60.10 62.00 0.9? 3.6 .1 6 3.00 3.06 0.91 3.66
Otober 13.00 69.00 6.O9 3.60 6.66 3.66 3.60 6.91 3.6?November 42.06 76.06 6.90 3.66 0.61 3.66 0.90 0.93 3.09eembeg 11.10 70.00 6.91 3.66 0.11 6.92 6.91 6.69 3.13
-- -----------------------------------------------------------------------------------------------------MRAN 13.46 66.1 0.97 0.99 0.69 6.90 6.99 0.93 3.6
29

* COUNTS: AUSTRIA
AVERAGE LV. 1EL. CHICAGOMONTHN TERW. MUMIDITI CARL 1861011 &act ABCE NmeU MICA MIAN 3ULTIFLE
January 96.66 74.81 6.96 0.93 6.56 6.92 0.97 0.0? 1.791ohiuall 33.66 66.9A 6.97 0.99 0.10 6.92 6.96 A.$$ 3.72
m atch 46.10 17.6 6.96 6.90 6.61 1.46 1.66 0.91 1.64*Apri8 040 51.06 3.6# 3.66 0.72 5.60 8.06 0.1041 8.9
may 56.68 19.66 6.11 1.16 6.71 3.66 3.66 6.91 1.33Jose 63.51 1.66 6.97 3.06 6.701 3.66 3.6 6.91 32Jell 67.16 14.66 6.96 1.66 6.11 3.66 1.66 6.91 132
August 61.51 11.60 6.97 3.66 0.63 3.66 3.66 0.96 1332Imlpteabor 19.1 12.66 6.97 3.66 0.71 3.66 1.66 6.94 132
October 49.16 67.66 1.66 3.66 0.60 3.66 6.99 6.93 3.47
m::::ber 46.609 1.0 6.96 3.66 6.63 3.60 0.99 6.92 3.64Deebr 3.83.6 69 .66 6.16 6.92 6.96 6.66 3.79
MEAN 49.64 63.56 6.96 0.99 6.69 6.90 6.99 6.92 3.49
COUTRY: TUREEW
AVERAGE AV. EEL. CUICAGOILMNOW TEMP. HUKIDITI CREL IR.&IEGH LICE ASI MANN MECA MEAN MULTIPLE 0
January 46.16 74.66 6.90 6.61 1.66 6.99 6.96 1.3
lebruar, 42.66 73.66 6.96 6.61 3.66 6.99 6.96 3.32
March 46.16 65.66 6.99 6.61 3.66 6.99 6.93 3.30
Apri3 13.60 62.66 6.90 6.76 3.66 3.1 6.92 3.69Nay 66.10 62.66 1.97 6.76 3.10 3.66 1.98 3.67Jose. 60.16 17.66 0-.96 01 3.66 3.60 6.94 3.66July 13.16 11.66 0.94 0.93 3.06 0.99 1.911 2.04
Atest 71.%# 11.61 0.94 6.93 3.60 1.16 6.96 3.64Septeabor 606 9.66 6.96 6.64 3.66 3.66 6.91 3.1
October 66.1 164.46 6.97 6.70 3.66 3.66 6.93 3.60November 51.36 73.66 6.90 6.67 3.66 1.66 6.93 3.16December 46.66 74.66 6.119 6.62 3.66 6.99 6.96 3.33
---- -----------------------------------------------------------------------------------------------------
AVERAG9 AV. EEL. CHICAGOMONTH TEMP. MUHIDITI CRE9L. IR.IIROM &&cE LICE HAUB MICA HELM MULTIPLE------------------------------------------------------------------------------------------Jauary 46.66 62.60 0.99 6.66 3.66 6.69 1.33
February 49.66 63.66 3.66 6.66 3.66 6.59 3.32March 13.66 14.06 6.90o. 0.78 3.60 6.19 3.33Apr83 19.16 47.66 6.90 6.73 3.66 0.96 3.33
may 60.16 44.66 6.96 6.79 3.66 6.92 3.09just 70.66 46.06 6.01 6.79 6.99 66 3.34July 03.60 32.66 6.66 6.72 6.79 6.90 6.62 2.22
Amoset 03.66 13.16 6.06 6.72 6.79 6.96 0.62 3.2
s amber 14.168 36.66 6.62 6.70 @.Of 0.66 3.36
October 67.66 12.66 6.96 6.66 3.66 6.92 3.69November $6.66 66.6 6.96 6.71 3.66 6.93 3.36Macoember 13.10 63.66 6.99 6.66 3.66 0.69 3.32
MEAN 62.92 463 6.93 6.74 6.79 3.60 6.66 1.13
30

hWM;1400APl ARABIA
AVEELSE AV. EEL. CHICAGO
momT TEND. MUNIIT? CulIL U-6120N IEt LICE Nava ICA NEAM MULTIPLE
January 10.66 44.6 0.90 6.11 5.00 0.90 1.12febroarl 60.16 57.661 0.97 6.71 6.79 1.66 061 .11 I.I
March W9.6 16.06 0.96 0.7s 0.79 1.66 160 1.14April 16.10 $4.66 0.64 9.7s 6.79 6.99 6.04 1.19may 66.66 91.06 0.10 0.60 0.79 6.96 0.76 3.26Joan 92.06 21.61 0.6 0.62 6.19 *I~t 0.11 5.01Jail 92.1 19.00 6.1 0.17 0.79 6.95 60 1.44
August 91.11 19.66 6.1 6.57 6.79 6.91 6.69 1.44September 07.60 24.06 6.70 0.63 0.79 0.94 6.76 131October 77.16 2210 01.62 6.67 0.79 0.99 0.02 1.12Maaber 6.9.1 22.06 0.91 6.73 6.19 1.00 0.6? 8.85December 19.56 12.00 0.P7 6.72 1.00 0.96 1.11-----------------------------------------------------------------------------------------
RILM 76.50 22.66 6.76 6.66 1.10 0.97 6.01 1.11
COUMU: IMYASIT-----------------------------------------------------------------------------------------
AVEELCE AV. EEL. CICA40Now=i TEND. N1UHIIITI CAMi 1.6120% LBCE LOCR MAve MICA MEAN IELTIPLE-----------------------------------------------------------------------------------------January 11.06 61.6 6.90 0.73 1.66 6."6 1.11 _-
lebguery 16.06 61.66 6.96 0.72 1.66 6.96 1.11 ..March 61.16 61.66 6.96 6.01 0.11 1.00 6.66 1.14April 71.1 11.66 0.65 0.99 6.1 6.99 6.60 1.14may 01.16 15.60 .1 6.71 6.71 6.96 6.66 1.26
June t0.00 49.60 0.16 0.69 6.11 0.96 I.72 1.89Jell 94.56 41.6 0.1 6.61 6.71 6.96 6.76 1.43
August 9316 46.06 6.16 6.64 6.11 6.66 6.69 1.44Sept "ar 96.56 11.06 0.10 0.67 0.71 6.92 6.71 1.46October 62.06 60.66 6.75 0.61 6.11 6.97 6.02 8.20 9Movember 69.56 19.06 0.16 0.86 0.11 5.00 #.I9 1.52December 19.6 61.66 6.96 6.74 1.20 0.91 1.16
man 16.61 15.92 0.77 6.11 6.1 6.96 6.02 1.24
COI!M: IREL
AVEELCE AV. EEL. CEICAGOmomT TEND. NMNIDITT CRAEL 111U6SON LICE LICE nme MICA HELM MULTIFLE
Jassor? 11.66 56.06 6.96 0.72 1.06 6.96 1.11February 16.56 166 @.96 6.74 1.6 6.91 1.16
March 62.66 56.6 6.9? 0.76 1.66 6.91 1.56April 60.10 17.60 6.96 6.02 0.1 1.66 6.60 1.13
Mal 74.66 19.66 6.66 6.96 6.71 6.99 t.98 5.12just 76.60 66.66 6.76 6.96 0.11 0.90 0.67 3.1July 01.56 60.6 0.16 6.96 6.71 0.96 6.04 1.39
August 65.66 69.6 6.11 6.66 6.11 6.91 6.61 1.22September 05.60 66.00 0.76 0.96 0.71 0.96 6.04 1.19
October 76.56 66.66 6.62 0.91 6.1 6.90 0.67 1.11M..embet 69.66 16.00 6.96 61 0.11 1.00 6.t0 5.52December 66.10 $6.00 6.97 0.76 1.60 6.91 1.10
MEAN 70.11 60.93 6.60 0.04 0.71 $.99 0.63 1.14
31

* COUTmRY LEBANONI
AVERAGE AV. 19L. CHICAGOmoWm TEMP. MUMIDITY CulIL 1S.&13CM ABCs LBCs MANI NECA MEAN MULTIPLE
*January 16.16 76.00 6.96 6.72 1.66 6.96 2.11Pebruar, 17.66 10.60 6.96 6.72 1.66 .6 22
R are% 66.66 69.60 6.97 6.71 0.99 4.96 1.12Apri2 61.66 67.66 6.96 6.66 6.99 6.92 1.09
hay 71.60 64.66 6.6 6: .96 6.71 0.99 6.66 1.13June 76.66 62.0 6.64 6.90 6.75 6.99 6.69 I'llJuly 60.6 56.66 6.76 6.96 6.71 0.96 6.61 1.16
August 12.46 17.66 6.71 6.96 6.71 6.97 0.04 2.19September 79.16 17.66 0.77 0.92 6.71 0.96 0.66 1.17
ctober 71.66 62.66 6.61 6.90 6.71 6.99 69 2.12November 67.66 62.66 6.96 6.61 1.66 6.94 1.07December 66.66 69.06 6.97 6.71 2.60 6.92 1.20
------------------------------------------ -------------------------------------------------------------------MELM 69.64 62.71 6.09 6.61 6.71 6.99 6.09 1.12
* COUNT1W: PAKISTAM
AVERAGE AV. 1IL. CHICAGO*MONTH TEMP. MUMICITT CREEL 22.4114 LICs LBCs MAMI MICA MELM MULTIPLE
January 61.16 63.60 6.97 6.16 1.66 0.91 1.26lebruacy 61.16 71.66 6.96 6.79 6.99 6.91 1.09
Merck 76.66 79.66 6.01 0.76 6.71 6.96 6.64 2.26April 62.50 67.66 6.76 6.92 0.71 6.93 6.79 1.27
Hal 66.6 66.66 6.72 6.61 6.71 6.66 0.71 2-.22Jena 67.10 06.66 6.62 160 6.711 6.67 0.72 1.17Jell 66.66 66.6 6.72 6.61 6.71 6.60 6.11 2.93
Lugust 63.16 904.60 6.27 6.66 0.71 $.96 6.7? 3.36September 62.16 69.66 6.76 6.60 6.71 6.91 6.76 1.26 -
October 62.51 63.06 0.79 6.73 6.71 6.92 0.56 126November 71.16 66.66 6.67 6.92 6.71 6.96 6.60 1.24December 60.16 64.60 6.96 0.61 6.71 2.60 6.96 2.2
MEAN 77.16 79.71 6.62 6.74 6.71 6.92 0.62 1.22
CDUMU: 110112
AVERACE AT. 9EL. CHICAGO*MoIm TEMP. NUMIO2TW CBUEL 61.&16GM ABCs LBCE MANI NICA MEAN MULTIPLE
--------------------------------------------------------------------------------------------------------------
January 23.10 61.66 0.92 6.03 6.19 0.63 6.91 6.62 2.23Pebruar 26I.10 4.1.6 6.96 0.63 0.11 6.63 6.97 6.63 2.22
Mote% 20.60 1.66 6.96 0.0 6.19 6.92 6.99 6.67 1.11April 11.1 19.66 6.99 6.91 6.66 2.66 1.0 6.93 2.0
may 6216 19.6 6.96 2.00 0.96 2.66 2.00 6.94 2.6June 76.10 72.66 0.94 1.6 0.62 1.66 6.71 6.99 6.92 2.69
bJuly 77.60 76.66 6.64 2.66 6.6 1.66 6.71 0.96 6.09 2.22August 79.60 72.6 6.77 2.66 06 2.66 0.71 6.97 6.09 2.22
September 60.169 64.66 6.96 2.66 0.67 2.66 6.71 2.66 6.92 2.6Octoer 16.66 14.6 6.96 2.66 6.73 2.00 2.60 0.94 2.06November 42.1 12.60 6.90 0.93 6.66 1.66 2.66 0.96 1.12December 20.16 49.66 6.96 6.00 0.11 6.02 6.96 6.64 2.29--------------------------------------------------------------------------------------------------------------
MEAN 12.06 17.10 6.94 6.94 0.1 0.91 6.11 6.90 0669 1.12
32
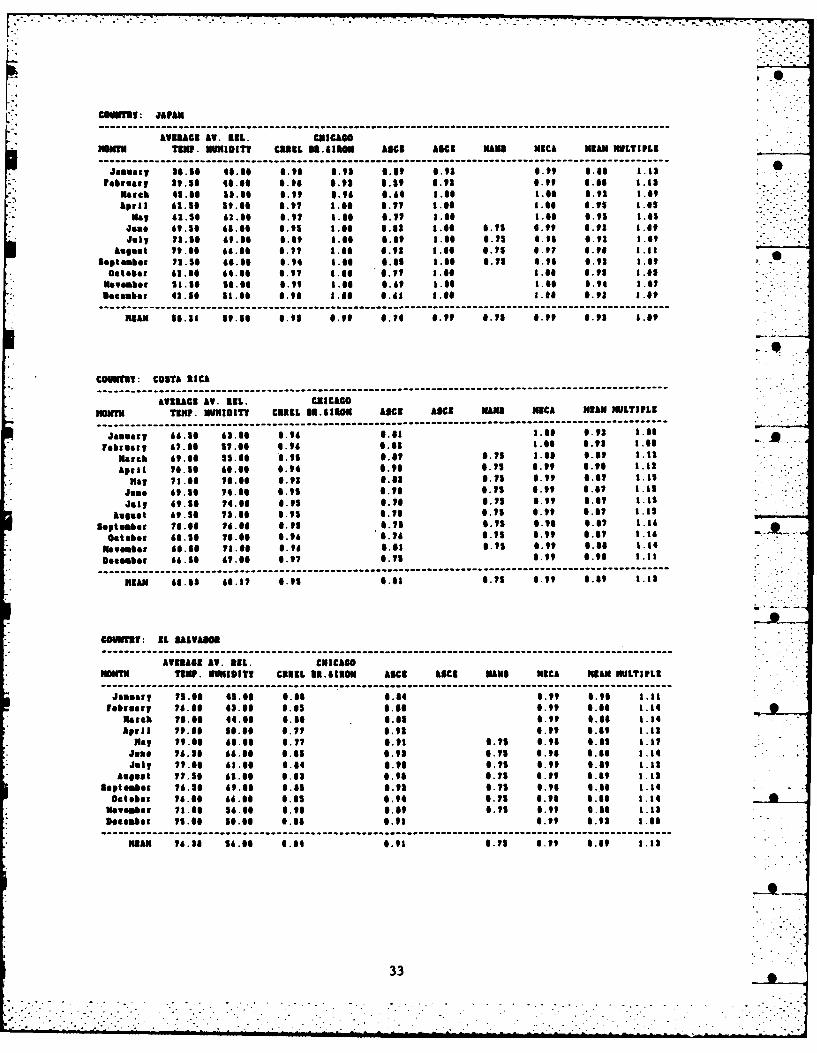
COUEIII: JAPAN
LIKUACS AV. 1L. CNIcA*momIN T11W. NUNIDITV CUlL 11.611011 lCE LIIE NANI NICA NIAN MULTIFL_e--o--- --- - -- - - ----ee e - ~~ ---- -- -- ---o -- -- -- -- -- -- -- -- ---- e e e v - - e-- --- --- e--- -------
Jamuary 2.1O 46.66 6.96 1.91 6.69 6.91 6.99 .61. .11
February 29.1 46.60 6.961 6.92 6.19 6.92 6.99 6.66 1.92mich 41.16 12.66 .99 6.96 6.66 1.6i 1.61 6.91 1.69April 62.1 $9.6 6.91 1.6O 6.91 1.66 1.66 6.91 8.1
may, 62.16 62.66 6.9? 8.66 6.11 8.66 1.66 6.91 1.01Joao 69.16 66.66 6.91 1.66 6.63 1.66 6.11 6.99 6.91 8.61July 13.16 69.66 1.69 8.66 6.69 1.6 1.11 6.96 6.92 1.69
August 19.#6 66.66 6.9? 8.66 6.92 8.66 6.71 0.91 6.96 8.1
septeabor 12.16 66.66 6.94 8.66 6.61 8.66 1.15 6.96 6.92 8.9 ' •
October 61.66 66.66 6.91 I.66 6.11 8.66 8.66 6.91 8.01
November 18.6 16.66 6.99 1.66 6.69 8.66 1.66 6.96 8.61
.eehaber 62.16 %8.66 6.96 I.66 1.41 8.66 1.60 0.92 1.#9
RUN 16.1 It.56 6.93 6.99 6.14 6.9 0.11 0.99 0.92 1.69
COVINTUT: COSTA RICA---- -----------------------------------------------------------------------------------------------------
AVRAGI AV. 111. CHICAGO
KO8NU TaW. NUfIDITV CUL INIION ASCE ACE NAME MCA IAN MLTIFL1
January 66.16 62.61 6.96 6.81 1.66 6.92 1.66
February 61.66 11.61 6.96 6.3 1.66 0.93 8.66match 69.66 11.06 1.91 0.61 6.11 1.66 6.6 1.11
April 16.1 66.66 6.94 6.96 6.15 6.99 6.96 8.82
Na it.66 ?1.66 0.92 6.62 6.15 0.99 6.61 1.1,
Jouo 69.16 10.66 6.91 6.16 6.11 6.99 6.61 8.1
July 69.10 14.66 6.911 6.1 6.11 6.99 6.61 1.11
August 69.16 13.66 6.9 0.16 6.91 6.99 6.6? 1.1"
ieptivabor ?6.o6 76.0 6.95 6.71 0.71 6.16 6.61 1.16
October 66.1 16.66 6.96 0.16 6.71 6.99 6.01 1.16
November 66.16 91.00 I.ti 6.61 6.11 0.99 6.66 8.80DUeember 66.16 61.66 6.91 6.91 0.99 6.96 8.88
---- ----------------------------------------------------------------------------------- -----------------KAN 66.63 66.1 6.95 6.68 6.1 6.99 69 1.18
CONTEt: EL IALVA O
AVERAGS AT. 11L. CNICAGOmom m. INIIITI CR8EL 11.61101 LCI LICE KNm NECA HIN MULTIPLE
January 11.06 41.66 6.00 6.84 6.99 6.96 8.88
Vebruary 16.66 43.66 6.61 6.66 0.99 6.6 1.14lrch 1.60 44.66 6.66 6.65 6.99 6.60 8.14April 19.66 16.00 6.11 6.93 0.99 0.69 8.11
pla 19.66 66.66 6.11 6.98 6.11 6.96 6.61 1.1
Juos 16.16 6i.6l 6.01 6.92 6.11 6.96 6.60 1.84
Jul 11.6 61.60 0.04 6.98 6.11 6.99 6.09 1.11Ausst 77.16 62.66 6.62 6.96 6.11 6.99 0.89 1.13
iepteaor 16.1 69.66 i.01 0.91 6.11 6.96 1.66 .14
October 16.06 66.66 6.61 6.94 1.11 6.98 6.68 8.14
November 1.66 16.0 0.96 0.69 6.11 6.99 6.66 8.83Doeember 11.66 50.O 6.06 6.98 6.99 6.93 8.68
KIAN 16.38 16.60 6.64 6.91 0.11 6.99 6.69 8.1
33
. .. . ..
. " ." . '" ' - - - , , " ,* . ,

COUNUW: GVATIKAL
AVERAGE AV. I. CUICAGOMNun TIMP. NUKIDIT! C1291, 011.62011 LBCs ABCs MANI NIC& MIAN MULTIPLE
January 63.66 47.16 6.97 6.71 6.99 6.91 8.16February 61.56 61.66 6.96 6.82 86 6.91 8.68
Match 69.66 51.66 6.91 6.63 1.66 6.95 1.66
A pril 76.66 58.66 6.91 6.65 1.66 6.95 8.66
*Np 72.66 55.66 6.96 6.69 6.71 6.99 6.66 1.15Jose 71.66 76.66 6.94 6.65 6.75 6.99 6.66 8.85July 610.06 67.60 6.95 0.69 6.75 9.11t 6.96 8.82
August 69.56 72.66 6.95 6.62 6.75 6.99 6.66 8.84September 69.56 78.66 6.91 6.62 6.75 6.99 6.66 1.84October 66.66 WI~G 6.96 6.77 6.75 6.99 6.67 8.85
November £5.56 7186 6.96 6.76 6.99 6.91 1.86
December 61.56 76.66 6.97 6.76 6.99 6.91 8.86
MILN 67.96 61.33 6.95 6.62 6.75 6.99 6.96 8.88
COUNrT: MIZI1CO
LVILG AV. NIL. CNICONINTM TEMP. HUMIDITY CR91. 21.6110M L&C ABCs MNI N9CA MILN MULTIPLE
ILJanuary 54.66 34.66 6.991 6.65 6.79 1.66 6.66 8.87February 66.66 26.66 6.96 6.67 0.19 8.66 6.66 8.87
match 68.66 16.66 6.97 6.64 6.79 8.66 6.65 8.8Apti 11 4.66 29.60 6.964 6.66 6.79 8.66 6.66 8.87
May 66.66 29.66 6.96i 0.66 6.79 1.66 6.66 1.17Juno 65.56 46.66 6.96 6.76 8.66 6.98 8.69Jo8, 63.66 55.66 6.97 6.76 1.66 6.92 8.69
Augus1 63.56 56.66 6.117 6.76 8.66 6.98 8.86September 163.56 54.66 6.97 6.77 8.66 6.91 1.69
iOctober 6.66 47.66 6.917 6.73 8.661 6.96 8.181November 57.66 4186 6.96 6.69 8.66 6.69 8.82December 54.56 37.66 6.9 .6 8.66 6.66I'l 8.85
MELN 68.56 39.65 6.907 6.78 6.79 8.66 6.66 1.83
COUNT: COLOMBIA
AVIELCI AV. NIL. CNICLCOmomT lIMP. NUKIDIT? CREEL 82.91IO1 ABCs ABCs MANI NICA KILN MUILTIPLZ
Jam..,1 57.56 58.66 6.96 6.71 3.66 6.19 8.88February 56.56 52.66 6.96 6.74 8.66 6.91 8.86
Marck 56.56 52.66 6.96 6.74 8.66 6.98 8.86April 59.66 17.66 6.96 6.75 8.66 6.98 8.86may 56.16 56.66 6.96 6.75 8.66 1.98 8.86Jose 56.66 56.66 6.96 6.75 8.66 6.98 8.86July 17.66 56.66 6.919 6.72 8.66 6.98 8.86
August 57.56 54.66 6.96 6.71 8.66 6.96 8.88September 57.16 14.66 6.96 6.72 8.66 6.96 8.88
Outabor 16.66 68.66 6.96 6.74 8.66 6.98 8.8November 16.66 64.66 6.96 6.74 8.66 6.98 8.861Dfembor 17.56 56.66 6.96 6.79 8.66 6.96 8.88
KILN 17.96 56.66 6.96 6.74 8.66 6.98 8.86
L3

COOMIT: XCULUU
AVIIAE AV. 1EL. CHICAGOHIM TRP. NMIDITV C11,L 1.611 LE ABCE NAle MC& KMAN MULTIPLE
January 19.66 14.66 0.96 6.11 1.6 6.91 1.16
Nebgoury 19.66 19.66 4.90 0.61 1.6 0.66 1.1.match 19.66 19.60 0.95 6.61 1.66 6.66 1.13April 16.16 66.66 6.90 6.16 1.06 0.9 1.10
Rai 16.16 60.06 6.96 6.14 1.66 0.91 1.16Jun0 16.66 11.06 6.99 6.96 1.66 6.91 1.16 -1 ".
jei9 16.60 00.0 0.99 6.1 1.66 0.96 1.11Lugust 14.66 46.60 6.99 6.6? o.6 6.69 1.12
SeCptember 14.06 44.66 0.99 6.48o 1.66 6 89 1.12Oetoher 14.66 11.66 6.99 0.11 1.66 6.96 1.11November 11.10 12.66 6.99 6.64 3.06 0.08 1.14December $4.66 4.66 6.99 6.61 3.66 6.69 1.10
MN~ 16.63 11.16 6.99 0.16 1.66 6.96 1.111
"--0
----- -----------------------------------------------------------------------------------------------------AVEIAG AV. 22L. CEICAGO
HNOW11 T9lIP. U113iITT CREEL ,3.ION LBCe LBCs mugI MCA MAN IMLTIPL------ -----------------------------------------------------------------------------------------------------JaIuary 19.16 66.16 6.11 6.16 6.T1 6.99 6.19 1.1?
ebrur9 U.66 61.06 0.16 6.12 0.7I 6.91 6.19 1.2?
ktch 11.66 01.66 6.11 6.14 6.11 0.91 6.66 1.21
April 52.60 11.66 6.14 6.14 0.,1 6.91 6.66 1.26
may 1.1160o.66 0.96 6.19 11 1.91 6.19 1.21Juse 66.6 96.66 6.16 6.69 0.11 0.92 6.1 1.38
jJeff 66.16 96.66 6.16 6.69 6.11s 6.92 6.15 1.26&lGuet 66.06 96.66 6.16 6.69 1.11 6.92 0.78 1.28 _
September 19.66 91.66 6.1 .. 69 6.71 6.91 6.19 1.17October 79.60 96.66 6.11 6.69 6.11 6.92 6.79 1.2?&te0br 19.06 93.00 0.17 6.60 6.11 6.1 6.16 1.16December 86.66 96.66 0.76 0.69 6.11 0.91 0.T0 1.0-
MAN O0.64 01.O0 6.76 6.16 6.11 6.95 6.19 1.21
CUOIUWN : VNBEZULA"
AVERAGI AV. EIL. CHICAGOONN TINIP. NUNIDITI CR1L 31.6101 AIC AICE MANN MCA MAN MUlTIFL
January i3.16 63.66 0.1 0.05 0.11 6.9T 6.02 1.26 hebrueac 63.10 61.0 6.11 6.61 6.71 1.91 0.69 .16match 62.1 63.06 6.11 6.64 6.11 0.97 6.02 32April 64.06 61.66 6.12 0.91 0.11 6.97 6.06 1.25Now 64.10 62.66 6.71 6.7 6.11 6.96 6.66 1.16 . ,Juse 6.06 66.66 6.71 6.11 6.11 6.96 6.19 1.1.July 61.66 61.06 6.12 6.12 6.11 6.96 6.19 1.21
Louing 61.S1 62.66 6.71 6.12 6.1s 6.96 6.79 1.17 "tapter 1 01.1 62.06 6.1 6.12 6.11 6.96 6.19 1.21October 04.00 62.06 6.7 .11 0.TO 6.96 6.66 3.1Neveber 6.16 0.66 0.74 6.16 6.11 6.96 6.66 1.21Socamber 62.60 63.60 6.14 6.11 0.1 6.97 6.66 3.21
MAN 11.19 63.67 6.12 6.11 6.1s 6.96 0.60 1.1
3535 - --

couffaw RAZIL
AVRAGE AV. AEL. CHICAGO
"mT TEMP. NUNIDITY CABEL 33.831033 AMC LICE NAME NECA MAN MULTIPLE&Rusty 1.16 1966 6.16 6.93 0.11 6.91 6.61 .11
Pebroary 19.66 11.66 6.11 6.96 6.71 6.9? 6.61 1.36march 11.16 14.66 6.63 6.64 6.11 6.91 6.61 1.16Apr13 14.16 13.66 6.61 6.61 6.15 6.96 6.66 3.37
may 713.1 1.6 6.96 1.as 6.11 $.t6 0.66 3.16Jose 76.66 61.06 6.91 6.13 6.11 6.99 6.66 1.t4July 69.66 66.66 6.91 6.62 6.11 6.99 6.66 1.140IAugust 71.6 66.66 61.91 6.67 6.11 6.99 6.69 3.32
September 16.66 72.66 6.91 6.62 6.11 6.99 6.66 1.14October 13.16 12.6 6.96 6.02 6.11 6.96 6.66 1.16November 13.16 12.66 6.66 6.41 6.71 6.96 6.61 3.16December 16.1 12.66 6.61 6.69 6.71 6.91 1.61 3.36
---------------------------------------------------------------------------------------------------------------ME9AN 73.46 16.11 6.66 0.61 6.11 6.96 6.6? 3.36
COUNT: BOLIVIA--- -----------------------------------------------------------------------------------------------------
AVERAGE AV. EEL. CICAGO-*MONTH TEMIP. NUMIDIT? CIRE 1191ION LICE ASI MNM MECA MAN MLTIPLE
---------------------------------------------------------------------------------------------Jamsip 71.10 63.06 6.61 0.96 6.11 6.99 6.69 3.12Pebro::p 16.66 74.66 8.4 6.62 6.11 6.96 0.61 3.16
6ac 50 7.9 66 .69 6.11 0.96 6.61 3.16Apri1 69.66 6316 6.91 4.87 6.11 0.99 6.69 1.32may 713.66 63.66 0.96 6.92 6.11 6.99 6.69 1.12
Joine 66.66 61.66 6.96 6.6 .11 3.3 .66 6.96 3.31July 67.16 11.66 01.96 6.62 1.66 1.616 6.91 1.66 .
&%test 71.16 41.66 0.96 61.61 3.66 6.99 6.92 3.66September 16.56 49.66 0.60 6.92 3.60 6.99 6.92 3.06October 11.60 16.6 064 6.96 6.11 6.99 6.69 1.12Mewsuber 11.66 63.60 6.61 1.66 6.71 6.99 6.96 3.13December 11.16 69.66 6.64 6.93 6.11 6.99 6.61 1.1---------------------------------------------- -----------------------------------------------------------------
ME9AN 12.29 61.17 6.66 6.96 6.61 6.99 6.96 3.32 .
COUNTRY: CHILE
AVERIAGE AV. EE9L. CHICAGOpMONTHl TEMPF. HUMIDITY CREEL ERC6ION LBCE LIC NAME MICA MAN MULTIPLE :_
Jasus:, 69.66 16.66 6.15 0.11 1.66 6.96 1.11Fobroary, 6.66 46.66 6.96 6.16 1.66 6.91 3.36
March 61.16 43.66 6.9? 0.11 3.66 6.93 1.16Apri3 19.16 46.66 6.96 6.13 3.06 6.96 3.33
*may 13.66 16.66 6.99 6.96 3.66 6.96 1.12doe 41.16 64.66 6.99 6.61 3.66 6.69 1.13
July 46.66 66.66 6.99 0.66 1.60 6.69 1.32August 16.16 16.66 3.66 6.69 3.06 6.96 3.12
September 14.66 11.6 6.90 6.11 3.66 61.96 3.32October 516.116 56.66 6.96 6.74 3.061 6.91 3.16Noeomber 63.66 43.66 6.96 6.14 1.66 6.96 3.33December 61.66 36.06 6.96 6.11 3.66 6.96 3.33
HELM 16.63 49.66 6.96 6.12 1.6 6.96 1.13
36

COUIIIRY: ILERAGULY
AVERAGE AV. 9EL. CHICAGOmom ~ TEMP. HUMOID17Y CREL 11A.631H ACE LICS MaNs NE9CA MEAN MULTIPLE
Jaur 53.06 10.66 6.15 0.96 0.75 0.97 0.04 3.191ehruary 02.56 5.60 6.13 6.91 6.71 6.97 6.64 3.190
March 956 11.06 0.7? 6.95 6.71 6.9? 6.65 3.17
April 74.16 19.0 6.61 6.90 6.71 0.99 6.69 1.15may 67.56 61.06 0.96 0.01 1.66 1.66 6.91 1.111
June 41.10 61.06 0.1 0.?& 1.60 3.06 6.93 1.6?July 63.10 56.0 0.97 6.76 1.66 3.6 6.94 3.67
August 67.1 52.60 6.96 0.03 3.66 1.610 6.94 3.06September 71.10 40.6 6.91 0.63 1.66 6.99 6.94 3.06October 74.6 50.60 0.00 6.69 3.00 6.99 6.94 1.46November 77.56 53.86 6.03 6.93 1.00 6.99 0.94 3.0?December 01.016 56.60 0.71 6.93 1.6 6.90 0.93 3.30
MEAN 73.06 14.02 0.56 0.07 0.92 6.99 6.93 1.30
AVERAGE AV. E1L. CHICAGO............MONH TEMP. HUMIDITY CREEL 22ESIRON AS LICE NMER HCA MEAN MULTIPLEzJamuar, 74.66 69.60 6.66 6.90 0.7;5 6.95 6.06 3.3;4tebroarp 710 46.00 6.414 1.f3 0.75 0.96 6.05 3.14
March 74.51 64.06 6.56 0.94 6.95 0.99 6.09 3.32Apri1 1131 66.6 6.91 6.09 0.71 0.99 6.96 1.12
may 67.60 76.60 0.96 6.77 3.0 0.99 0.92 3.66Jose 62.66 00.66 0.97 6.71 3.00 6.96 6.92 3.09Jly~ 62.60 77.06 6.97 0.72 3.66 0.99 0.92 1.06
August 61.66 76.00 0.97 0.72 1.06 0.99 0.92 3.69September 62.16 76.66 6.9?' 0.3.60 6.99 6.92 1.00October 64.1 72.00 6.96 6.70 1.00 0.99 6.93 1.67-
Nlogember 6716 73.06 0.96 6.70 3.00 0.99 0.93 3.07December 73.6 704.60 6.619 6.00 0.71 0.95 6.00 1.14
WEAN 67.92 73.00 0.93 6.02 6.96 6.99 0.91 1.36
COUNTRY; URUGUAY
AVERAGE AT. EEL. CHICAGOM01117H TEMW. HUMIDITY CRUEL U61110H AICE AKCE HANI MCA MEAN ILTIFLE
Jaguar 731.16 12.66 6.96 6.0a 3.66 0.99 6.94 1.07febroery 73.169 51.00 6.91 6.96 6.71 0.99 6.09 3.13
Marcb 66.16 17.66 6.91 0.06 6.71 3.66 0.I9 3.3Apri3 62.66 63.66 6.97 0.77 3.00 3.00 0.94 3.07
May 16.66 66.00 6.96 6.75 3.66 1.66 6.92 3.00Jose. 11.60 9.00 8.00 11.611 3.00 3.66 6.92 3.008Jell 10.101 69.66 3.0 6.66 3.66 3.00 6.92 3.09
6uut $.8 6.1 14 .66 1.00 1.00 0.92 3.09Septeber 54.1 65.00 0.96 6.76 3.60 1.60 0.92 3.09October 18.16 62.66 0.96 6.71 1.0 3.66 6.95 3.67November 64.0 56.00 -.96 6.66 3.06 3.66 6.94 3.06Decemtber 69.0 1 S2.0 6.4 6.62 3.0 1.6 6.94 1.66
---MEA;N --- 0 .75 63- .66 0.96------- 6.77 6-------.96 3..669 1.04...6 a---;.6
37

COUNTRY: DOMINICAN REPUBLIC
AVERAGE AV. 29L. CHICAGOMOVN TEM. HMIDITY CREE9L ER.SIROM LICE LICE MNM MICA MEAM MULTIPLE
January 75.66 64668 6.56 6.93 0.75 6.99 6.69 1.13february 75.56 55.60 6.64 6.96 6.75 6.99 6.69 1.12
Match 75.56 d6.66 6.64 61.9t 6.75 6.99 6.69 1.12April 77.66 62.66 0.04 6.96 6.75 61.111 6.61 1.13
may 76.56 65.66 0.61 6.93 6.75 6.97 6.67 1.16Jose 7t.56 66.66 6.76 6.92 6.75 6.9? 6.66 1.17July s6.66 66.66 6.76 6.96 6.75 6.97 6.65 1.16
August 66.56 66.66 6.76 6.69 6.75 6.96 6.64 1.19September 66.66 66.66 6.76 6.96 6.75 6.97 6.65 1.16
October 79.56 66.66 6.76 6.92 6.75 6.97 6.66 1.17November 76.66 66.66 6.61 6.93 6.75 6.97 6.67- 1.16
December 76.60 66.66 6.62 6.93 6.75 6.9? 6.67 1.15
MEAN 77.92 64.25 6.61 6.93 6.75 6.96 6.67 1.15
COUNTRY: HAITI
AVERAGE AV. EEL. CHICAGO"on TEMP.- HUMIDITY CR119L 32.91RO1 LICE AICE NAME NECA MEAN MULTIFLE
January 77.56 44.66 6.62 6.65 1.66 0.99 6.92 1.69February 76.66 44.66 6.76 61.66 1.66 6.99 6.91 1.16
March 79.66 45.66 6.77 6.69 1.66 6.99 6.91 1.16ApirIl 6 6.66 49.06 6.76 6.92 1.66 6.99 6.92 1.69may 61.66 54.66 6.75 6.91 1.66 6.96 6.91 1.16
J... 62.56 56.66 6.74 6.93 1.66 0.96 6.91 1.16jely $6.66 43.66 6.73 6.61 1.66 6.97 6.69 1.13
August 63.66 49.66 6.74 6.91 1.66 6.96 6.91 1.16September 62.66 54.66 6.75 6.91 1.06 6.96 6.91 1.16October 61.66 55.66 6.75 6.911 6.75 6.96 6.65 1.16November 79.56 54.66 6.7? 6.911 1.66 6.99 6.92 1.6December 76.66 46.66 6.63 6.92 1.66 6.99 6.94 1.67
*MEAN 66.46 49.66 6.77 6.96 6.96 6.96 6.91 1.16
COUNTRY: JAMAICA
AVEELGE AV. ERL. CHICAGOMNTHn TEMP. HUMIDITY CREEL URSI1ROM ASCE LICE KANA MICA HELM MULTIPLE0
January 76.56 61.66 6.64 1.06 1.75 0.9f 6.96 1.12*February 76.56 62.66 6.64 6.99 6.75 6.99 5.69 1.12
march 77.66 62.66 6.63 6.96 6.75 0.1 9 6.69 1.13Apri1 76.56 66.66 6.60 6.95 6.75 6.97 6.67 1.15
may 79.56 66.66 6.66 6.91 6.75 6.9? 0.66 1.1?Juse 61.56 66.66 6.75 6.9 6.75 6.96 6.64 1.19Jull 611.36 65.66 6.75 6.69 6.75 6.96 6.64 1.19 -
August 61.56 76.66 6.75 6.96 6.75 6.96 0.64 1.19September 01.66 76.66 6.75 6.69 6.75 6.96 6.66 1.19October 66.5 73.66 6.76 6.65 6.75 6.96 0.63 1.36November 79.66 66.66 f.77 0.91 6.75 0.97 6.65 1.16December 761.10 63.66 6.76 6.94 6.75 0.97 6.66 1.14
MEAN 79.25 66.25 6.79 6.93 6.75 6.9? 6.66 1.17
38

CERL DISTRIBUTION
Chief ,.r E~gLd.eter 1[SCom - Ch. Inst. Div.CifN: TOc Monitor ATTN: Poeittttes Engineer (1) -
ATTN: OA9N-ASI-L (2) NOWATrN: DAN-CC? T .W (AT N: OAEN--CW 61rr: OE (1)
ATTN: DAEN-CW"ATTN: DAEN-CM-R MTCAIIM: DAEN-CVO ATTN: MTMC-SA 20115AT" : DAFN-C0 ATTN: Facilities Engineer (3)
ATTN: DACN-ECATTN: AEN-KCC NARADCOM. ATTN: DRDNA-7 01760
ATTN: DAEN-ECR TL.1.ATTN: IAEN-RO HQ, TRADOC. ATTN: ATEN-DEHATTN: DAIN-RDC ATTN: OEM (19)ATIN: DAN-RHATTN: DAEN-ZCZ TSAICOM. ATTM: STSAS-F 63120 -ATTN: DARN-ZCZA"2TN: DAEN-ICC USACC
ATT: DAN-ZCI AIN: Facilities Engineer (2)
ATTN: OARM-ZO4IESTCOM
FESA. ATTN: Library 22060 ATTN: DE"
ATTN: OET 1(1 79906 part Shater 96858
ATTN: AF9N-1M
II Army tnginaer Dietricts A.M:A...
TTN: Library (41) SHAPE 09055
ATTN: Survivability Section, CC-0?S
US Army Engineer Divietons Iearastructure Branch, LoDA
ATTN: Library (14)
N USSUCOM 09128US Army Europe ATs SW 4/7-LOg
AEAR-OtICSIIngr 09403
ISAR 09081 Fort gelvoir, VA 22060 (7)
V Corps ATTM: Canadian iUalson Officer
ATTN: DEH (11) ATTN: Vater Resources Support Center
Vi1 Corps ATTN: Egr Studies Center
ATTN: DElN (1) ATM: Engr Topographic Lab
21st Support Command Amh ATA-DIE-SO
ATTN: OCR (12) AmTN: ATZA-OtE-D-
USA Berlin ATM: RD Command
ATTN: OI (11)
USAS:TAF C(0r)L. ATTII Library 03755
Allied Coemand Europe (ACE) WES, ATM: Library 39180
ATIM: DEN (3)
8th USA, Korea (19) SQ, XVT
II Air b
orne Corps andFt. Bragg 28307
ROK/US Combined Forces Command 96301 AITN: AFZA-E-Bg
AITM: ZUSA-HC-CFC/glSr Chanute A?%, IL 61866
3345 CS/01, Stop 27
USA Japan (USA8J) .
AmTN: AJmN-F8 96343 Norton AFl CA 92409
AIT: DIN-Sonshu 96343 ATIM: AJRCC-MI/DSI
ATI: Og.-O .awa 96331Tyndall At, FL 32403
Area Engineer, AIDC-Area Office APESC/lnineertn & Service Lab
Arnold Air Force Stat toe, TM 37389NAFAC
416th Engineer Comeand 60623 ATI: iOt&E Liaison Office (6)
ATM: Facilities Engineer ATTm: Sr. Tech. FAC-03T 22332ATTN: Asst. CDR R&D. FAC-03 22332
US Military Academy 10966
ATTN: Facilities Engineer NE 93041
ATTN: Dept of Geography A AI"s Library (Code L0A)
Computer Science
ATTM: OSCFER/N/AdN-A Defense Technical Info. Center 22314
~IINC, ATM: Oa1wR-Wg 02172 AT: ODA (12)
JSA ARRCOM 61299 Engineering Societies Library . . -
ATTN: )qCtS-RI-I Ne York, NY 10017
ATMl: a¢SaR-LS National Guard Bureau 20310
DARCDO - Dir.. Inst.. & Svcs. Installation Division
ATT N: agH (23) US Government Printing Office 22304
O.A A-r": DLA-wd 22314 Receiving SectIon/Depository Copies (2)
NA A-N.: ADS 20305 US Army Env. Hyiene Agency
iA A : HSHS-E 21010
TOASCOM National Bureau of Standards 20760rmOKamt e~nsxaer, ATTN.: AFEN-8H ,
AITN: oDm (23)
H5C
Anx: HSLO-F 78234ATTm: Facuilties g8Ineer
ritssiaone AMC 0240 8/6/64
Walter Reed ANC 20012

AFCS climatic tons 14bor adjustment factors by Roger L. Brauer ... (et aI.)-Chapain Il :Construction Engineering Research laboratory, 1964.
38 p. (Tecbica report ; P-165)
1. Army Facilities Components System. 2. Construction workers produc-tivity. 3. Construction industry - Labor productivity. 4. Climatic zones.r1. Brauer, Roger L. 11. Brow, Gerald J. III. Koehn, Edward. IV. Brooks,Samuel T. V. Hehons Thomas. VI, Series ;Technical report (Contruction ~Engineering Reseearch Laboratory) ;P-165.
*- If
4.fsoo
11 I0 4
41Y
St