around the world - valuewalk.com · \爀屲this isn’t all bad in that crisis creates ......
TRANSCRIPT

AROUNDTHE
WORLD
WITH KENNEDY WILSON

2
DISC
LOSU
RES
DISCLAIMER
The analyses and conclusions of Broyhill Asset Management, LLC (“BAM") contained in this presentation are based on publiclyavailable information. BAM recognizes that there may be confidential information in the possession of the companies discussed inthe presentation that could lead these companies to disagree with BAM’s conclusions. This presentation and the informationcontained herein is not a recommendation or solicitation to buy or sell any securities.
The analyses provided may include certain statements, estimates and projections prepared with respect to, among other things, thehistorical and anticipated operating performance of the companies, access to capital markets and the values of assets and liabilities.Such statements, estimates, and projections reflect various assumptions by BAM concerning anticipated results that are inherentlysubject to significant economic, competitive, and other uncertainties and contingencies and have been included solely for illustrativepurposes. No representations, express or implied, are made as to the accuracy or completeness of such statements, estimates orprojections or with respect to any other materials herein. Actual results may vary materially from the estimates and projected resultscontained herein. Accordingly, no party should purchase or sell securities on the basis of the information contained in thispresentation. BAM expressly disclaims liability on account of any party’s reliance on the information contained herein with respect toany such purchases or sales.
Accounts managed by BAM and its affiliates have invested in the equity of Kennedy-Wilson Holdings, Inc (KW). It is possible thatthere will be developments in the future that cause BAM to change its position regarding the companies discussed in thispresentation. BAM may buy, sell, cover or otherwise change the form of its investment regarding such companies for any reason.BAM hereby disclaims any duty to provide any updates or changes to the analyses contained here including, without limitation, themanner or type of any BAM investment.

3
AG
EN
DA
Forever Blowing Bubbles
Kennedy Wilson Does Europe
Net Asset Value
Introduction
Appendix

INTRO

5
OU
RH
ISTORY
We are a boutique investment firm, established as afamily office and guided by a strict value orientation.Our family office foundation provides the security of astable capital base.
We invest alongside our clients as partners in ourprocess. As a result, we do not feel the constant pressureto gather assets, which ultimately results in poor short-term decisions.
Capital preservation is first and foremost our overridingpriority. We seek to provide consistent returns with alow probability of loss, through concentrated, long-termholdings.
We do not follow the crowd, but instead remainindependent in our decision-making. We are willing toaccept short-term underperformance in exchange forlong-term success.

6
STRIVE
FOR
BA
LAN
CE
If I could say one thing to your investors, it's try to achieve balance.
- Ray Dalio, Davos World Economic Forum

7
PE
RFORM
AN
CE
HISTO
RYGROWTH OF $10,000 INVESTED IN BROYHILL HIGH QUALITY COMPOSITE

8
CA
SHISK
ING
Cash is like oxygen. You don’t notice it 99% of the time, but if it’s absent it’s the only thing you notice.

9
TH
EV
ALU
EO
FE
XTE
RNA
LM
AN
AG
ERS
Our external investments with like-minded, long-term investors complement our internal capabilities, expand our investable universe, and deepen our understanding of financial
markets. Simply put, External Managers, expand our circle of competence.

BLOWINGBUBBLES

11
FO
REV
ER
BLO
WIN
GB
UBBLE
SCONNECTING THE DOTS BETWEEN “THE KING OF COOL” & “THE MAESTRO”
I'm forever blowing bubblesPretty bubbles in the air
They fly so high, nearly reach the skyThen like my dreams they fade and die
Fortune's always hidingI've looked everywhere
I'm forever blowing bubblesPretty bubbles in the air
Source: “I’m Forever Blowing Bubbles”
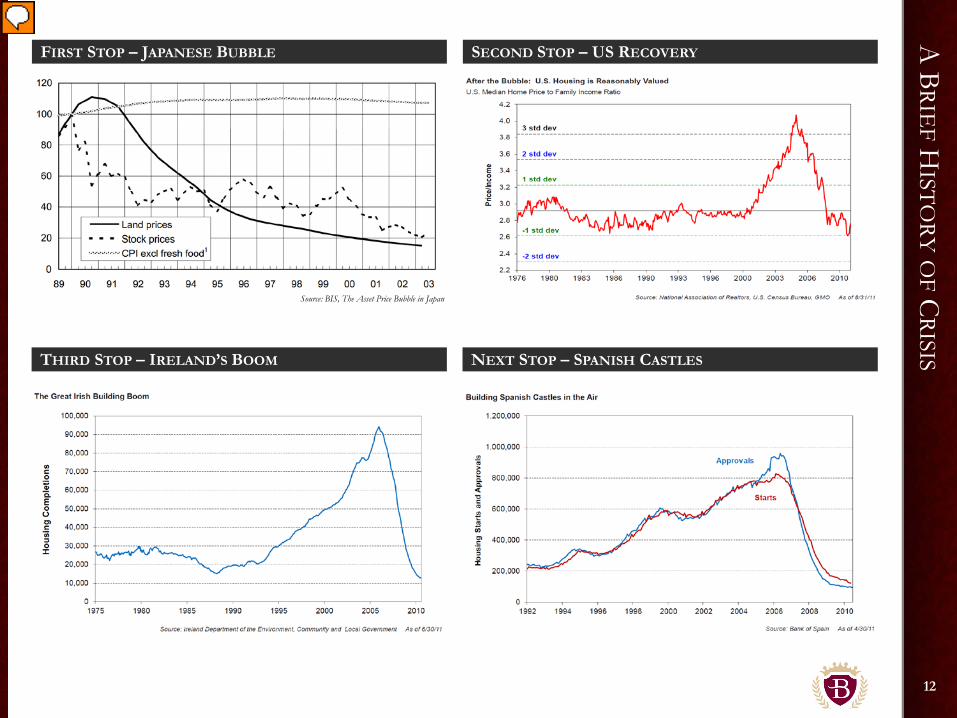
12
Source: BIS, The Asset Price Bubble in Japan
A B
RIEF
HISTO
RYO
FC
RISISFIRST STOP – JAPANESE BUBBLE
THIRD STOP – IRELAND’S BOOM
SECOND STOP – US RECOVERY
NEXT STOP – SPANISH CASTLES

13
SWIM
MIN
GL
ESSO
NS
The best swimming in the financial markets is when panic breaks loose. By
that time, the damage has been done and those with the courage to dive in head first will find it extremely rewarding.
The increasing number and magnitude of crises begs the question of whether central
bank policies are fanning the flames of destabilizing speculation.
Source: “MarketWatch”

14
SETTIN
GTH
ESTA
GE

15
NPL O
PPORTU
NITY
EUROPEAN BANKING SNAPSHOT
Source: E&Y

16
FLO
CK
ING
TOE
URO
PEA RECORD YEAR FOR NON CORE LOANS
Source: PwC
KWDOES
EUROPE

18
A T
ALE
NTE
DSW
IMM
ER
We’d like to introduce you to a very talented swimmer we recently discovered while surveying the investment landscape for sharks.
Kennedy Wilson went public in 2009 and remains underfollowed and misunderstood despite management’s investment success.
Management has a demonstrated nose for value and a proven track record of identifying and capitalizing on shark-infested waters.
Previous investments have systematically exploited the historical cycle of boom and bust.
WHO IS KENNEDY WILSON?

19
TH
ISSH
OU
LDSO
UN
DF
AM
ILIAR
INVESTING IN OUR CIRCLE OF COMPETENCE
We generally think that asset management is a terrific business.
There’s a natural growth in global demand for financial assets and while thebarriers to entry are fairly low, the barriers to success are fairly high.
Brand, distribution and long-term performance make a big difference.
That results in established companies for the most part generating high margins,high returns on capital and excellent free cash flow.
- Mario Gabelli
A SUSTAINABLE COMPETITIVE ADVANTAGE
Truly durable competitive advantages arise from the intersection of supply anddemand, from the linkages of economies of scale with customer captivity.
Competitive advantages based on economies of scale are in a class by themselves.They tend to be far longer lived than the other types and therefore more valuable.The best course is to establish dominance in a local market and then expandoutward from it. Economies of scale, especially in local markets, are the key tocreating sustainable competitive advantages.
The appropriate strategy is to identify niche markets, understanding that not allniches are equally attractive. Ideally, it will also be readily extendable at theedges. The key is to “think local.”
- Bruce Greenwald and Judd Kahn, “Competition Demystified”
STICKY ASSETS GENERATE DURABLE RETURNS
Those who seek to succeed as long-term investors need time, capital, and fortitude.
Time is important because gaps between fundamentals and expectations are notalways closed quickly.
A stable base of investment capital is also crucial because great investment ideasaren’t worth anything if you have no money to invest.
Investors with a stable and countercyclical base of capital stand at a hugeadvantage to those who work with fleet-footed capital.
– Michael Mauboussin
SECULAR TAILWINDS
Alternative assets make up a small portion of global investable assets but areoutgrowing traditional assets for a number of reasons that we believe are likely tocontinue for some time. With interest rates at generational lows and public marketvolatility near generational highs, investors are diversifying away from conventionalasset classes with subpar returns.
The favorable return attributes of alternative assets are increasingly important asmany liability-matched funds face significant shortfalls. This problem isexacerbated by high rates of expected returns on pension assets - a hurdle that isincreasingly difficult to reach in today’s low return environment.
One way to achieve this return, however, is by committing assets for extendedperiods of time to managers with proven track records.
- Me
Source: Broyhill Asset Management, Solid as an Oak

20
BU
SINE
SSO
VE
RVIE
W
KENNEDY WILSON SERVICES KENNEDY WILSON INVESTMENTS

21
KW
’SC
OM
PETITIV
EA
DV
AN
TAG
EA PROVEN MODEL FOR CAPITAL ALLOCATION
Source: Company Filings

22
EX
CE
PTION
AL
RE
TURN
SO
NC
APITA
LRECENT EXITS DEMONSTRATE POTENTIAL FOR VALUE CREATION
Date Acquired
Purchase Price
($ millions)
Partners Equity
($ millions)
KW Equity
($ millions)Property Name
Sales Proceeds
KW Gains
KW Multiplier
Oct-08 $88.5 $27.8 $3.2(3) Saybrook Pointe, 324-unit apartment building, San Jose, California
$140.8 $2.2 1.7x
Jun-09 $33.5 $5.8 $5.9(3) The Mercury, LA condominiums $52.2 $9.4 2.6x
Sep-09 $210.4 $54.7 $17.5(3) Four multifamily properties in Western US $243.0 $7.9 1.5x
Dec-09 $218.0 $32.2 $44.3(3) 6 multifamily properties in Western US $251.7 $19.5 1.4x
Jun-10 $56.0(1) 9.6(2) $6.4NoHo, 180 unit apartment building; 11,000 sq. ft retail space; increased NOI from $2.3 to $3.1 million
$74.0 $7.2 2.1x
(3) Assume 1.85x Leverage where information is unavailable
(1) Calculated using 4.1% cap rate at sale and $2.1 million of NOI before acquisition(2) Assume 40% participation in partnerships based on company f ilings
Source: Company Filings, Broyhill Asset Management Estimates
“Major corrections create new opportunities that, if seized, can transform companies to even greater heights.”
- Bill McMorrow, 2009 Letter to Shareholders

23
TH
EK
EN
NE
DY
WILSO
NT
OU
CH
VIA VERDE THE ARTISAN
Source: ShowMeTheRent Source: The Artisan Apt Homes

24
GO
OD
CO
MPA
NY
FAIRFAX ANNUAL LETTER EXCERPTS
We continued to purchase commercial real estate investments with Bill McMorrow and his team at Kennedy Wilson. We purchased, 50/50 with Kennedy Wilson, perhaps the finest office building in Dublin, built in 2009 and 100% leased to State Street Bank for 25 years, for one-third of its construction cost with an unleveraged yield of approximately 8.5%. We also own, with Kennedy Wilson, some of the finest apartment buildings in Dublin with similar return characteristics. Rest assured we return Bill’s calls very promptly!
As I mentioned to you last year, one such call from Bill in 2011 led to our investment (along with W.L. Ross, Fidelity and Capital Research) in Bank of Ireland – the first significant investment in Ireland by foreign investors since the financial market collapse. Only one year later, Ireland and its economy have made significant strides towards recovery. The Bank of Ireland has been one of our most successful investments1
We continued to invest with Bill McMorrow from Kennedy Wilson in 2013. We invested in the Clancy Quay apartments and some well-leased office buildings in Dublin and we also invested in a U.K. loan pool. We have invested a net cumulative $305 million in real estate deals with Kennedy Wilson in California, Japan, the U.K. and Ireland – deals at significant discounts to replacement costs and with excellent unlevered cash on cash returns, in which Kennedy Wilson is the managing partner and an investor. Also, we continue to own a fully diluted 10.9% interest in Kennedy Wilson.2
1Fairfax 2012 Annual Letter2Fairfax 2013 Annual Letter

25
DE
ALSSO
URC
ED
FROM
AD
OZ
EN
INSTITU
TION
SKW HISTORY IN EUROPE
Source: Company Filings

26
WA
ITF
OR
IT

27
ATTRA
CTIV
EA
SSETS
AC
ROSS
THE
UK
& IRE
LAN
DKWE ACQUISITIONS SINCE IPO EXCEED £1 BILLION
Source: Company Filings, Broyhill Asset Management Estimates
28
NA
MA
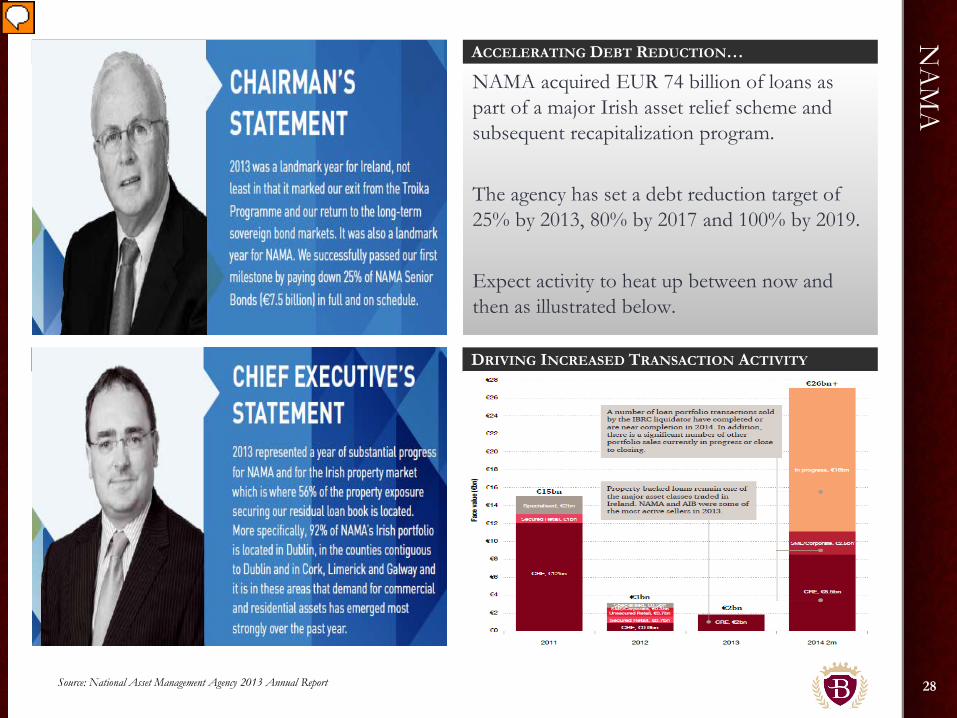
ACCELERATING DEBT REDUCTION…
NAMA acquired EUR 74 billion of loans as part of a major Irish asset relief scheme and subsequent recapitalization program.
The agency has set a debt reduction target of 25% by 2013, 80% by 2017 and 100% by 2019.
Expect activity to heat up between now and then as illustrated below.
DRIVING INCREASED TRANSACTION ACTIVITY
Source: National Asset Management Agency 2013 Annual Report
29
TH
EL
UC
KO
FTH
EIRISH
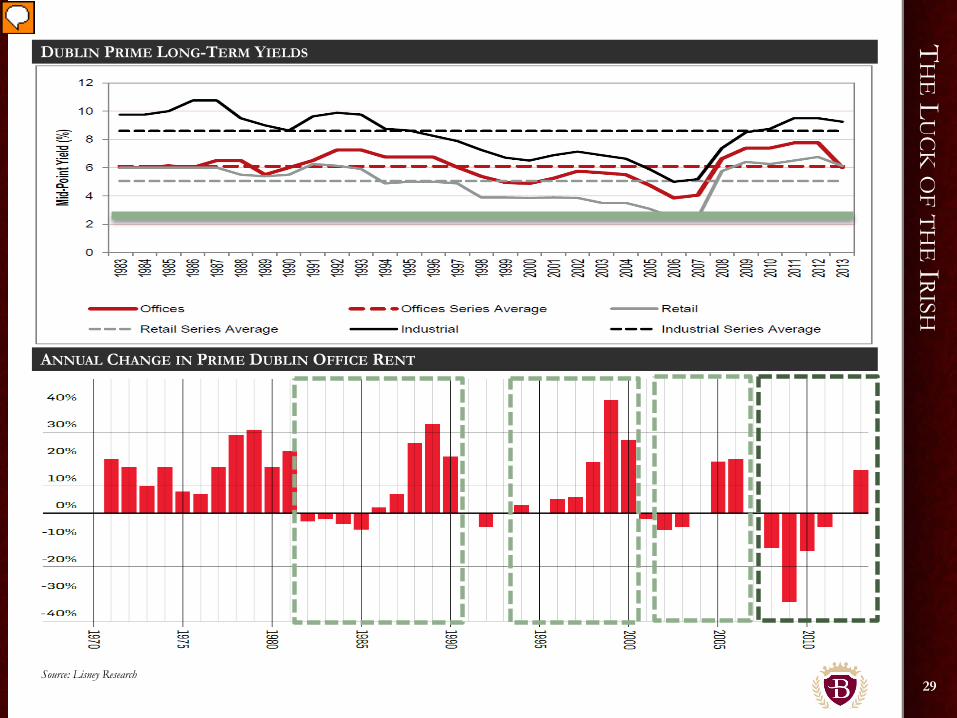
DUBLIN PRIME LONG-TERM YIELDS
ANNUAL CHANGE IN PRIME DUBLIN OFFICE RENT
Source: Lisney Research

30
UPSID
EIN
SEC
ON
DA
RYM
ARK
ETS
UK YIELDS & INTEREST RATES
PRIME PROPERTY PERFORMANCE PRIME INVESTMENT YIELDS
Source: Cushman & Wakefield
31
“PO
PULA
R” GRO
WTH
INM
AD
RID
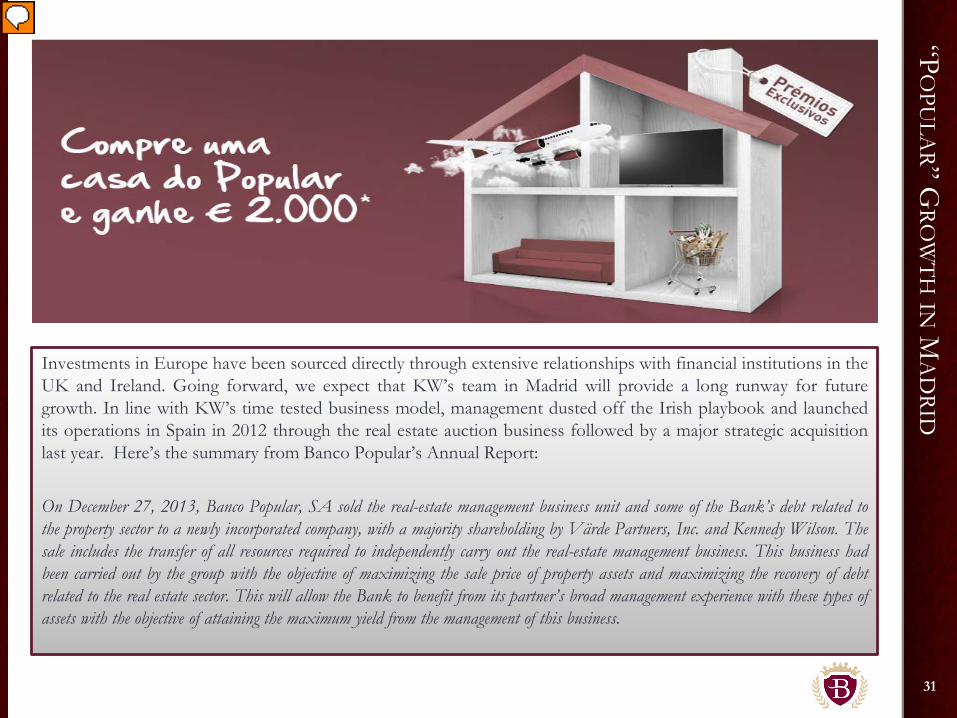
On December 27, 2013, Banco Popular, SA sold the real-estate management business unit and some of the Bank’s debt related to the property sector to a newly incorporated company, with a majority shareholding by Värde Partners, Inc. and Kennedy Wilson. The sale includes the transfer of all resources required to independently carry out the real-estate management business. This business had been carried out by the group with the objective of maximizing the sale price of property assets and maximizing the recovery of debt related to the real estate sector. This will allow the Bank to benefit from its partner’s broad management experience with these types of assets with the objective of attaining the maximum yield from the management of this business.
Investments in Europe have been sourced directly through extensive relationships with financial institutions in theUK and Ireland. Going forward, we expect that KW’s team in Madrid will provide a long runway for futuregrowth. In line with KW’s time tested business model, management dusted off the Irish playbook and launchedits operations in Spain in 2012 through the real estate auction business followed by a major strategic acquisitionlast year. Here’s the summary from Banco Popular’s Annual Report:
On December 27, 2013, Banco Popular, SA sold the real-estate management business unit and some of the Bank’s debt related tothe property sector to a newly incorporated company, with a majority shareholding by Värde Partners, Inc. and Kennedy Wilson. Thesale includes the transfer of all resources required to independently carry out the real-estate management business. This business hadbeen carried out by the group with the objective of maximizing the sale price of property assets and maximizing the recovery of debtrelated to the real estate sector. This will allow the Bank to benefit from its partner’s broad management experience with these types ofassets with the objective of attaining the maximum yield from the management of this business.
32
SARE
B

NETASSETVALUE

34
A R
ATIO
NA
LA
PPROA
CH
MODERN SECURITY ANALYSIS
“It seems very hard to try to beat the market consistentlyby trying to beat the market. Rather it seems to us a morerational approach is to be value conscious rather thanoutlook conscious.”
- Martin J. Whitman, Modern Security Analysis

35
$0
$5
$10
$15
$20
$25
$30
$35
$11
$32$7
$4
$5
$5
$0
$5
$10
$15
$20
$25
$30
$35
Net LTInvestments
STInvestments
KWServices
KWEMgmt Fees
IncentiveFees
UpsidePotential
NET ASSET VALUE & UPSIDE POTENTIAL
Source: Company Filings, Broyhill Asset Management Estimates
Valued at 1.4x-1.6x Book
Value Net of Debt and
Non-controlling Interests
Cash & Receivables
14x–18xNOI
14x–18xNOI
Assuming Fully
Invested Assets
4x-8x Incentive
Fee-Related Earnings Assuming
1.6x Multiple Over 3 Year
Holding Period
WH
AT’S
ITW
ORTH?
36
SUPE
RM
ARIO
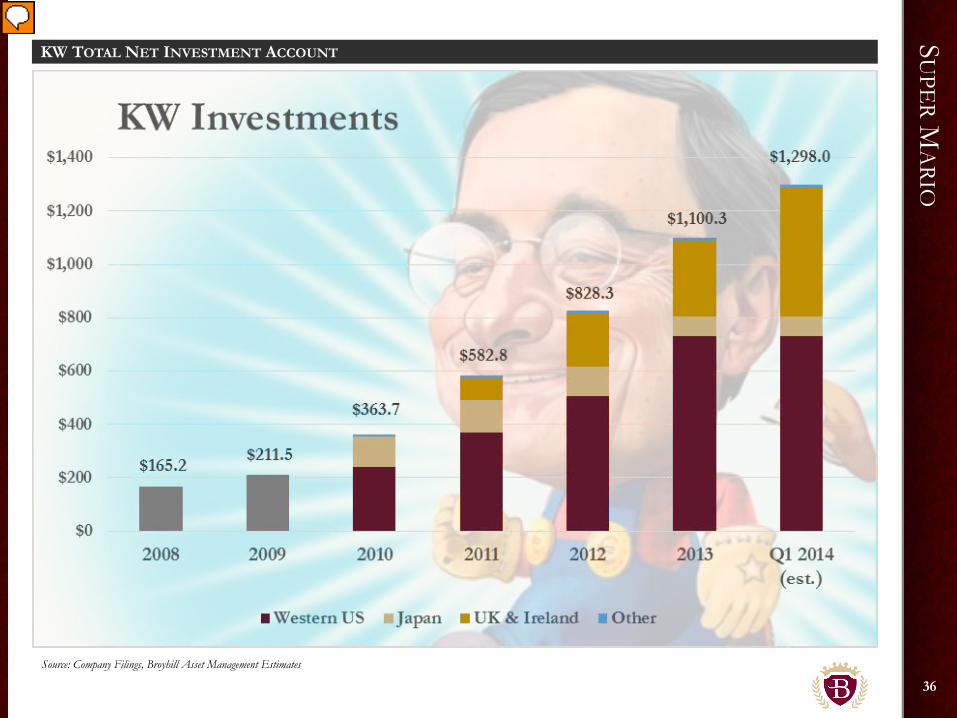
KW TOTAL NET INVESTMENT ACCOUNT
Source: Company Filings, Broyhill Asset Management Estimates

APPENDICES

38
UPSID
EIN
RE
NT
GRO
WTH
& C
AP
RA
TES
KWE SENSITIVITY ANALYSIS
Annual Rent Growth
£ 1.8 0% 2% 4% 6% 8% 10% 12% 14%
9.00% 0.63 0.74 0.87 1.00 1.13 1.28 1.43 1.59
Exi
t Cap
Rat
e
8.50% 0.72 0.85 0.98 1.11 1.26 1.41 1.57 1.74
8.00% 0.83 0.96 1.10 1.25 1.40 1.56 1.73 1.91
7.50% 0.95 1.09 1.24 1.40 1.56 1.73 1.91 2.10
7.00% 1.09 1.24 1.40 1.57 1.74 1.93 2.12 2.32
6.50% 1.25 1.41 1.58 1.76 1.95 2.15 2.36 2.58
6.00% 1.44 1.61 1.80 2.00 2.20 2.42 2.64 2.88
5.50% 1.66 1.85 2.05 2.27 2.49 2.73 2.97 3.23
5.00% 1.93 2.14 2.36 2.59 2.84 3.10 3.37 3.65
Source: Company Filings, Broyhill Asset Management Estimates
39
TIG
ER
PO
RTFOLIO
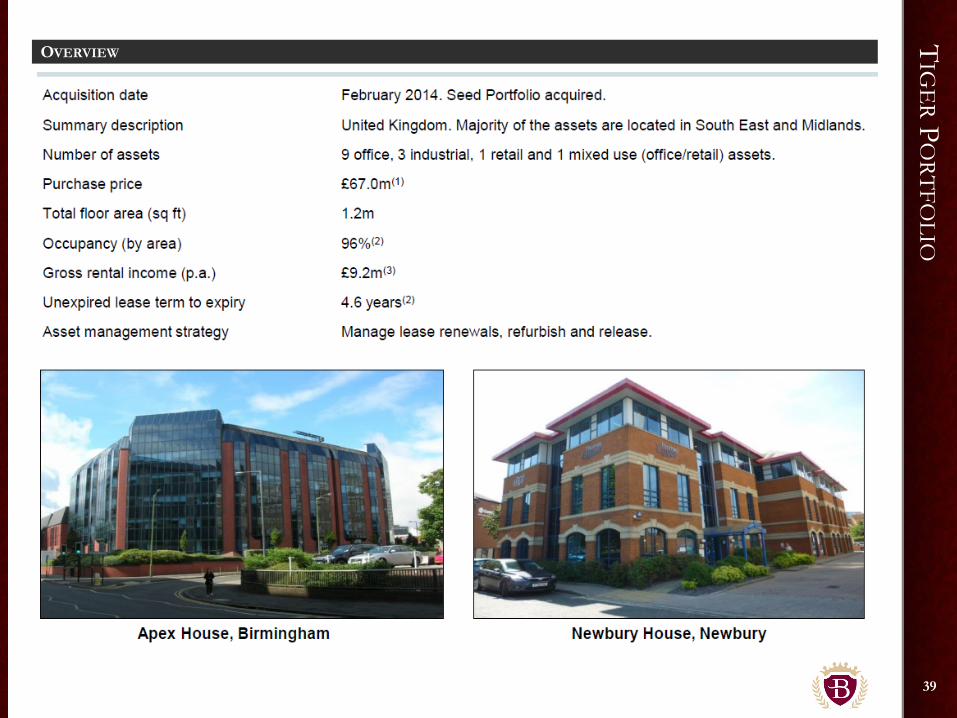
OVERVIEW

40
ARTE
MISP
ORTFO
LIOOVERVIEW
41
OPE
RAP
ORTFO
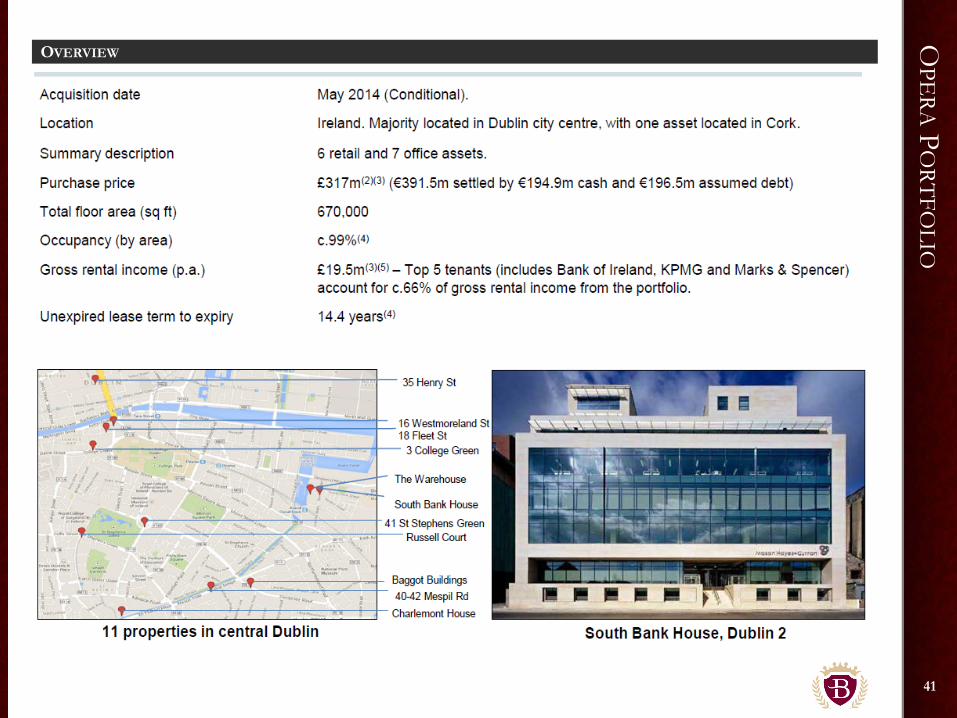
LIOOVERVIEW

42
CE
NTRA
LP
ARK
PO
RTFOLIO
OVERVIEW

43
PO
RTMA
RNO
CK
HO
TEL
& G
OLF
LIN
KS
OVERVIEW

44
LIFFE
YT
RUST
BU
ILDIN
GOVERVIEW

45
FO
RDG
ATE
JUPITE
ROVERVIEW

46
AV
ON
LO
AN
PO
RTFOLIO
OVERVIEW

47
DISC
LAIM
ER
DISCLAIMER
PAST PERFORMANCE IS NOT NECESSARILY INDICATIVE OF FUTURE RESULTS.
This material has been prepared solely for the purposes of illustration and discussion. “Broyhill Asset Management” is the marketing name forthe investment management business conducted by Broyhill Asset Management, LLC. and its affiliates. Broyhill Asset Management, LLC is anSEC Registered Investment Advisor.
Under no circumstances should the information contained herein be used or considered as an offer to sell, or solicitation of an offer to buy anysecurity. Any security offering is subject to certain investor eligibility criteria as detailed in the applicable offering documents. The informationcontained herein is confidential and may not be reproduced or circulated in whole or in part. The information is in summary form forconvenience of presentation, it is not complete and should not be relied upon as such.
Any information, data, statement, opinions, or projections made herein may contain certain forward looking statements, projections, andinformation that are based on the beliefs of Broyhill Asset Management as well as assumptions made by, and information currently available to,Broyhill Asset Management. Such statements reflect the view of Broyhill Asset Management with respect to future events and are subject tocertain risks, uncertainties and assumptions (including, but not limited to, changes in general economic and business conditions, interest rate andsecurities market fluctuations, competition from within and without the investment industry, new products and services in the investmentindustry, changes in customer profiles, and changes in laws and regulations applicable to Broyhill Asset Management). Should one or more ofthese other risks or uncertainties materialize, or should underlying assumptions prove incorrect, actual results may vary materially from thosedescribed herein.
All information, including performance information, has been prepared in good faith; there are no representations or warranty expressed orimplied, as to the accuracy or completeness, of the information, and nothing herein shall be relied upon as a promise or representation as to thepast or future performance. This material may include information that is based, in part or in full, on hypothetical assumptions, models, and/orother analysis (which may not necessarily be described herein). No representations or warranty are made as to the reasonableness of any suchassumptions, models, or analysis. The information set forth herein was gathered from various sources which are believed, but not guaranteed, tobe reliable. Unless stated otherwise, any opinions expressed herein are current as of the date hereof and are subject to change at any time.Accordingly, neither Broyhill Asset Management nor its principals or affiliates make any representations as to the timeliness of any information inthis presentation.

Broyhill Asset Management
Christopher R. Pavese, CFA