arras people project management benchmark report … · welcome to the 2011 project management...
TRANSCRIPT
Arras People
Project Management Benchmark Report 2011
Issued Feb 2011
©Arras People 2011 www.arraspeople.co.uk

Contents
Management Summary Page 1
About the Survey Page 2
Job or Profession? Page 4
PPM Accreditation & Qualifications Page 6
Social Media Page 9
Unemployed Practitioners Page 12
Job Hunting Page 14
Current Economic Climate Page 17
Hours, Remuneration and Rewards Page 20
Contractor Review Page 22
Employee Review Page 25
Remuneration Trends Page 28
If you require any further detail about the report or how Arras may be able to help you please get in contact with us. If you have any comments about
the survey itself, please do feed them back to us through our dedicated email address [email protected]
PRINCE2® MSP™ and M_o_R® are Registered Trade Marks of the Office of Government Commerce in the United Kingdom and other countries PMI® is a registered mark of Project Management Institute, Inc.
©Arras People 2011 www.arraspeople.co.uk
Arras House 47 York Street
Heywood
Lancashire
OL10 4NN
Tel: 0845 680 6444
Fax: 0845 680 8047
Email: [email protected]
©2011 A rras Services Ltd
Unauthorised Reproduction Prohibited

Welcome to the 2011 Project Management Benchmark Report (PMBR) from Arras People.
This is our sixth annual report on the UK Project Management community and firstly I would like
to thank the many participants who took time to complete our online survey. Without their valued
participation we would not be have been able to create this work.
2010 saw the UK economy officially come out of recession, though only low levels of growth were
recorded; continuing pressures on the private sector; a new Government who accelerated deficit
reduction bringing a new series of challenges to the public sector. According to the ONS average
earnings grew during the year by 2.1% with the public sector riding the storm on average
increases of 2.4%. To add further misery, unemployment hit the 2.5 million mark (7.9%) and
inflation appeared on the march at 3.7% on the Consumer Price Index or 4.8% on the Retail Price
Index.
As we entered 2011 talk still abounded about a possible double dip recession and levels of
business confidence were questioned; VAT increased to 20%; food and energy prices were on the
up, and a raft of other tax changes appeared in the pipeline. Added to all that, the wider impact of
the deficit reduction programme started to become apparent as news of cuts and job losses
started to appear.
So overall we had lots to ask our respondents about on the economic and jobs front through our
survey. This year we also took the opportunity to revisit the training and accreditation position
and explored the impact of social media in the world of project management.
Some of the highlights which are found in the report include;
• Unemployment amongst the PPM respondents recorded at 15%
• Amongst the public sector employees, 14% of respondents entered 2011 under the threat of
redundancy
• For 83% of practitioners, remuneration was down during 2010 both in real terms and
against increased levels of inflation
• Practitioners reported an increased feeling that ageism is once again flourishing in the
recruitment process
• After a tough couple of years contractors report seeing light at the end of the tunnel with
more opportunity, though rates are still under pressure
• Private sector confidence is rising, though pay it would appear is not; whilst the public sector
prepare for hard times
• Training budgets under further strain in 2011, but Prince2 still holds it dominating position
as the de-facto standard in the UK
• One respondent reports that the much maligned “office smoker” has a new challenger in the
form of “social media users” in respect of time off the job!
Whether you are a project management professional looking to benchmark yourself against your
peers or an employer looking to benchmark your rates, we hope you find this report to be a useful
window into the UK PPM community. Over the coming months we look forward to releasing further
snippets from the data on our blog “How to Manage a Camel” and through our newsletter “Project
Management TipOffs”.
If you require any further detail about the report or how Arras may be able to help you please get
in contact with us. If you have any comments about the survey itself, please do feed them back to
us through our dedicated email address [email protected]
John Thorpe
Managing Director @ Arras People
©Arras People 2011 www.arraspeople.co.uk Page 1
Management Summary

Our Data Source
Arras People, the UK based project management recruitment specialists, used independent
research company Benchpoint’s unique real time polling technology to question 1,525 Programme
and Project management practitioners through December 2010 and January 2011. Through the
structure of the survey, we have been able to capture and analyse data which is relevant to those
practitioners delivering in the UK. This year the survey was also structured to allow us to separate
practitioners who are currently unemployed to create different windows into the UK marketplace.
The respondents are all project management professionals, some of whom are currently live in the
Arras People candidate database and were invited personally by email. Crucially in terms of
creating a wider market view 48% of the respondents are not known /not active with Arras
People, these being attracted through our web and social media campaigns.
The results have been independently audited and analysed.
The survey has a confidence level of 95%, and a confidence interval of 2.49
i.e. you can be 95% certain that the views of the entire project management population are
within +/- 2.49% of the numbers in the survey. We treat small demographic clusters with caution,
and ignore them in the analysis.
Aims of the survey
As the UK’s only Project Management Company that is 100% focussed on the field of Programme
and Project Management (PPM) recruitment, Arras People are committed to the development and
professionalisation of our chosen field. As well as forging links to the professional bodies such as
APM (Association of Project Management) and PMI (Project Management Institute), we continue to
invest in the creation, accumulation and distribution of knowledge through our website
(www.arraspeople.co.uk) and our blog “How to Manage a Camel”. Part of this commitment is our
undertaking of the unique benchmarking survey which has for the last six years examined the
people aspects of PPM, building a detailed picture of project professionals’ careers, earnings and
prospects which we freely share with our clients, practitioners and professional bodies here in the
UK and worldwide.
Annually we build a consistent dataset for cross reference against the data gathered in previous
surveys and take in some topical subjects within our emerging profession; this year we chose to
focus on training, social media as well as the economic impact on remuneration, job opportunity
and the general feeling of well-being amongst the community.
Demographics of the respondents
2010 saw a change in Government and the UK economy still running on dual tracks with the
Private and Public sectors in differing phases of the economic cycle. With the ongoing challenges
for organisations and individuals we took the decision to split out practitioners who are currently
in a position of unemployment. This decision allows us to ensure data integrity for the engaged
population whilst at the same time offering us the opportunity to explore the circumstances of
those without work.
As can be seen in the table, 15% of respondents
registered as unemployed at the point of the survey
which is significantly higher than the figures of 7.9%
nationally issued by the Office for
National Statistics (ONS) 19/01/2011. The remaining respondents split across employed (PAYE)
56% and contractors 29%.
About The Survey
Respondent Status 2010
Employee 56%
Contractor 29%
Unemployed 15%
©Arras People 2011 www.arraspeople.co.uk Page 2

Once again the domiciliary status of
the PPM practitioners shows a mix of
UK and non-UK nationals. The splits
have remained relatively consistent
over the last three years and it will be interesting to see how the new Government’s legislative
programme impacts these figures over the next twelve months.
The demography of all respondents split by role, age and gender can be seen in the following
table. In terms of segmentation by role the population has once again returned to relatively
consistent levels which at the top level do not suggest any significant shifts.
The age distribution is still skewed
against the under 34’s at 25:75, which
supports the continuing emphasis on
experience rather than growing new
practitioners during difficult economic
conditions. Whilst this is understand-
able at one level, the lack of
investment today may well be
storing up future difficulties for the
sector as full economic recovery takes
hold and the “talent wars begin”! On
the other hand it may reflect the fact
that for many practitioners project
management is not a first career, rather one that they come to after experiencing work in other
roles?
Gender levels have moved back to 30:70 in this years data, a level not seen since 2007. Specific
areas of interest by gender are explored throughout the remainder of the survey.
The project management community
once again confirmed that they have a
solid education background as can be
seen in the table. The data when cut
by age clearly shows a picture of
changing routes of education with the
HND/HNC in steep decline whilst the
numbers with a degree steadily
increase.
In terms of respondents’ “work” location we once
again see a concentration on the South East and
London which accounts for just under 60%,
whilst the other regions remain relatively
consistent over the three year span.
About The Survey
Role 2010 2009 2008
Project Manager 56% 56% 55%
Programme Manager 21% 24% 17%
Change Manager 9% 8% 9%
Prog/Proj Support 14% 12% 20%
Age Group 2010 2009 2008
Under 34 24% 18% 26%
35 to 49 46% 52% 46%
50+ 29% 28% 27%
Not disclosed 1% 1% 1%
Gender 2010 2009 2008
Male 70% 75% 75%
Female 29% 25% 25%
Not disclosed 0% 1% 0%
Work Location - All 2010 2009 2008
London & Home Counties 43.5% 40.5% 42.6%
South East 14.7% 10.8% 12.7%
Midlands 11.3% 10.1% 8.0%
North West 9.3% 6.7% 9.4%
South West 6.9% 5.9% 6.1%
East Anglia 4.4% 3.0% 2.9%
Yorkshire 4.4%
Scotland 3.1% 3.6% 2.1%
Wales 1.3% 1.2% 1.6%
North East 0.9% 4.3% 3.5%
N.Ireland 0.2% 0.3% 0.6%
©Arras People 2011 www.arraspeople.co.uk Page 3
Domiciliary Status 2010 2009 2008
UK National 85% 88% 86%
EU National 6% 6% 6%
Non UK/EU National 9% 6% 9%
Education Level <34 35to49 50+
PhD 1% 3% 5%
Masters 31% 30% 21%
Bachelors 50% 36% 34%
HND/HNC 6% 13% 21%
Vocational 3% 4% 4%
A-Level / Higher 8% 9% 10%
Secondary 3% 5% 7%

With no news to report on the APM’s initiative to take on the “chartership” for project
management professionals here in the UK we looked at the considerable challenges that
practitioners face when trying to quantify their experience in the field.
Career Level
One of the biggest challenges that PPM practitioners and the users of their services face is the
quantification of where they sit within the career hierarchy. Each year in the survey we ask
respondents to indicate their career
level. As can be seen in the table the
vast majority (90%) see themselves as
practitioners or senior. This has been
consistent over the last three years
when it suddenly jumped from the pre
downturn average of 75%. This would
again support the concerns that we have
a low level of new entry into the sector.
When asked to rationalise their choice of
career level against their EAE levels
( Educa t i on , A cc r ed i t a t i on and
Experience) we see a fairly consistent
result with a “combination of EAE” con-
s i s t e n t l y a t t a i n i n g t h e t o p s c o r e a t a n a v e r a g e o f 6 5 % ,
followed by Experience (24%), Accreditation (9%) and Education at 2%.
The third dimension we request is the respondents’ years of PPM experience which is typically the
measure that most people push when looking for a new opportunity or advancement.
The graphical representation to the left
shows the plot of EAE against PPM
experience. Whilst it does not provide
an unexpected result in terms of the
less experienced practitioners using
their “education” to justify their career
level it does show how quickly
education fades into perceived
irrelevance as the “real” level of
experience grows.
We also see a similar pattern when reviewing how Accreditation is used to rationalise career level,
with 20% of practitioners with between 2 and 3 years experience stating this as the basis of their
position. The figure falls to less than 4% for those with more than 10 years experience, which
may point to specialist accreditation being demanded or relevant to the roles that they undertake.
When the data is cut by age we can
once again see similar trends for both
education and accreditation.
Across all respondents there are 63%
who believe that their career level is
justified by a combination of Education,
Accreditation and Experience which
leaves us with 27% who lean on just
their Experience.
Job or Profession?
©Arras People 2011 www.arraspeople.co.uk Page 4
Career Level 2010 2009 2008
Entry 2% 1% 2%
Foundation 7% 6% 9%
Practitioner 47% 45% 44%
Senior 45% 48% 44%
Career Rationale 2010 2009 2008
A Combination of all three 63% 66% 67%
My Experience 27% 25% 20%
My Accreditation 10% 8% 11%
My Education 1% 1% 3%
Years PPM Experience 2010 2009 2008
<1 2% 2% 3%
2 to 3 11% 9% 14%
4 to 5 13% 11% 14%
5 to 10 26% 28% 26%
10+ 47% 50% 43%

It is interesting how the figure has steadily grown since we first started asking this question back
in 2008, steadily rising from 20% to 25% to this year’s 27%. Looking at the market this increase
may well be attributable to the changing conditions which have occurred in the market as we have
moved through recessionary times. As recruiters we have noticed many organisations have been
very specific when recruiting and experience has come to the fore when specifying requirements.
This has not only been a push to look for “years of experience” in terms of programme and project
management but also specific experience in terms of the role; ie. “the candidate must have
demonstrable experience of implementing xx CRM solution in a financial services environment.”
The group who rationalise their career levels on experience alone are potentially the biggest
challenge to any push for “professional recognition” as they would appear to hold little stock for
education and accreditation which must surely be key building blocks for any profession?
When this data is further cut by membership of a professional body; e.g. APM, the number who
record experience alone rises to 33% for non-members whilst dropping to 19% for those who
have membership.
Registered Project Professionals
With the Association for Project Management due to launch its latest initiative the “APM Registered
Project Professional” under the strap line of professionalism in every dimension, it will be
interesting to see which practitioners look to achieve this status and how the market reacts to its
creation.
For those that aren’t aware, the standard is being marketed as follows;
From the 1st March 2011, APM will be accepting applications for a new pan-sector standard for
project professionals. APM Registered Project Professional will recognise competent professionals
through their ability to be a responsible leader, manage complex projects and use appropriate
tools, processes and techniques. It will, for the first time, assess all elements of the APM 5
Dimensions of Professionalism in a single standard thereby enhancing professional status and
recognition.
Job or Profession?
©Arras People 2011 www.arraspeople.co.uk Page 5
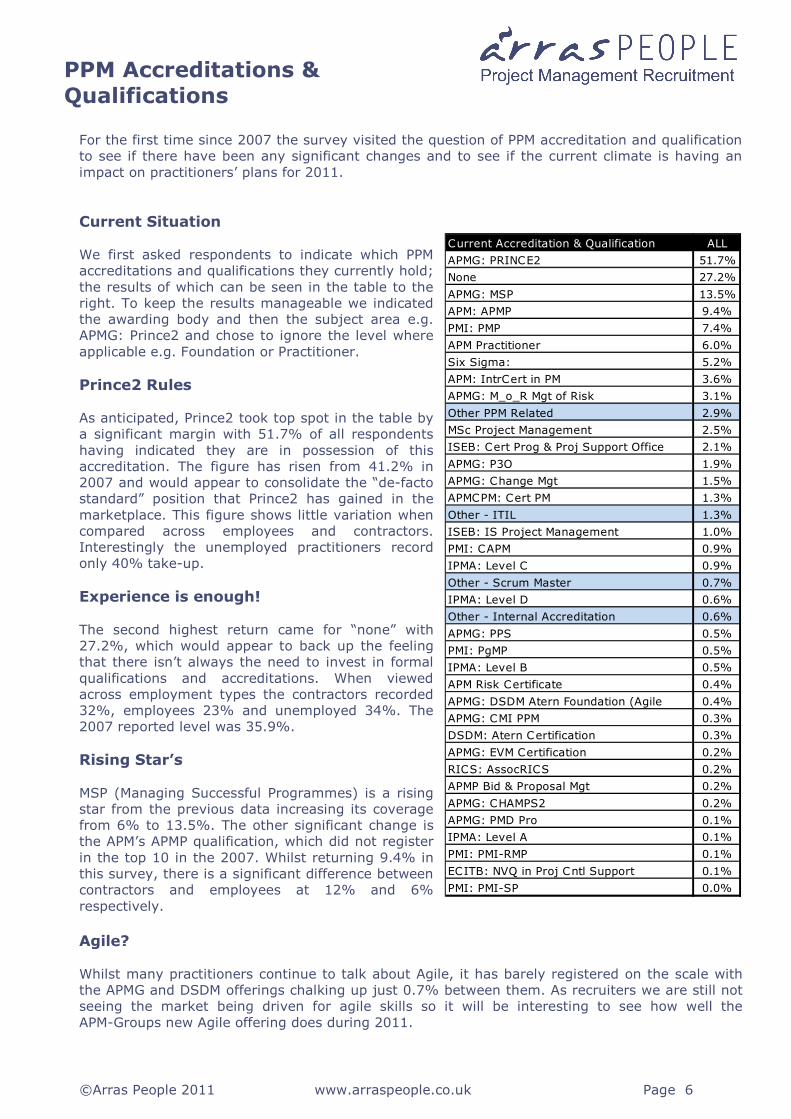
For the first time since 2007 the survey visited the question of PPM accreditation and qualification
to see if there have been any significant changes and to see if the current climate is having an
impact on practitioners’ plans for 2011.
Current Situation
We first asked respondents to indicate which PPM
accreditations and qualifications they currently hold;
the results of which can be seen in the table to the
right. To keep the results manageable we indicated
the awarding body and then the subject area e.g.
APMG: Prince2 and chose to ignore the level where
applicable e.g. Foundation or Practitioner.
Prince2 Rules
As anticipated, Prince2 took top spot in the table by
a significant margin with 51.7% of all respondents
having indicated they are in possession of this
accreditation. The figure has risen from 41.2% in
2007 and would appear to consolidate the “de-facto
standard” position that Prince2 has gained in the
marketplace. This figure shows little variation when
compared across employees and contractors.
Interestingly the unemployed practitioners record
only 40% take-up.
Experience is enough!
The second highest return came for “none” with
27.2%, which would appear to back up the feeling
that there isn’t always the need to invest in formal
qualifications and accreditations. When viewed
across employment types the contractors recorded
32%, employees 23% and unemployed 34%. The
2007 reported level was 35.9%.
Rising Star’s
MSP (Managing Successful Programmes) is a rising
star from the previous data increasing its coverage
from 6% to 13.5%. The other significant change is
the APM’s APMP qualification, which did not register
in the top 10 in the 2007. Whilst returning 9.4% in
this survey, there is a significant difference between
contractors and employees at 12% and 6%
respectively.
Agile?
Whilst many practitioners continue to talk about Agile, it has barely registered on the scale with
the APMG and DSDM offerings chalking up just 0.7% between them. As recruiters we are still not
seeing the market being driven for agile skills so it will be interesting to see how well the
APM-Groups new Agile offering does during 2011.
PPM Accreditations &
Qualifications
Current Accreditation & Qualification ALL
APMG: PRINCE2 51.7%
None 27.2%
APMG: MSP 13.5%
APM: APMP 9.4%
PMI: PMP 7.4%
APM Practitioner 6.0%
Six Sigma: 5.2%
APM: IntrCert in PM 3.6%
APMG: M_o_R Mgt of Risk 3.1%
Other PPM Related 2.9%
MSc Project Management 2.5%
ISEB: Cert Prog & Proj Support Office 2.1%
APMG: P3O 1.9%
APMG: Change Mgt 1.5%
APMCPM: Cert PM 1.3%
Other - ITIL 1.3%
ISEB: IS Project Management 1.0%
PMI: CAPM 0.9%
IPMA: Level C 0.9%
Other - Scrum Master 0.7%
IPMA: Level D 0.6%
Other - Internal Accreditation 0.6%
APMG: PPS 0.5%
PMI: PgMP 0.5%
IPMA: Level B 0.5%
APM Risk Certificate 0.4%
APMG: DSDM Atern Foundation (Agile 0.4%
APMG: CMI PPM 0.3%
DSDM: Atern Certification 0.3%
APMG: EVM Certification 0.2%
RICS: AssocRICS 0.2%
APMP Bid & Proposal Mgt 0.2%
APMG: CHAMPS2 0.2%
APMG: PMD Pro 0.1%
IPMA: Level A 0.1%
PMI: PMI-RMP 0.1%
ECITB: NVQ in Proj Cntl Support 0.1%
PMI: PMI-SP 0.0%
©Arras People 2011 www.arraspeople.co.uk Page 6
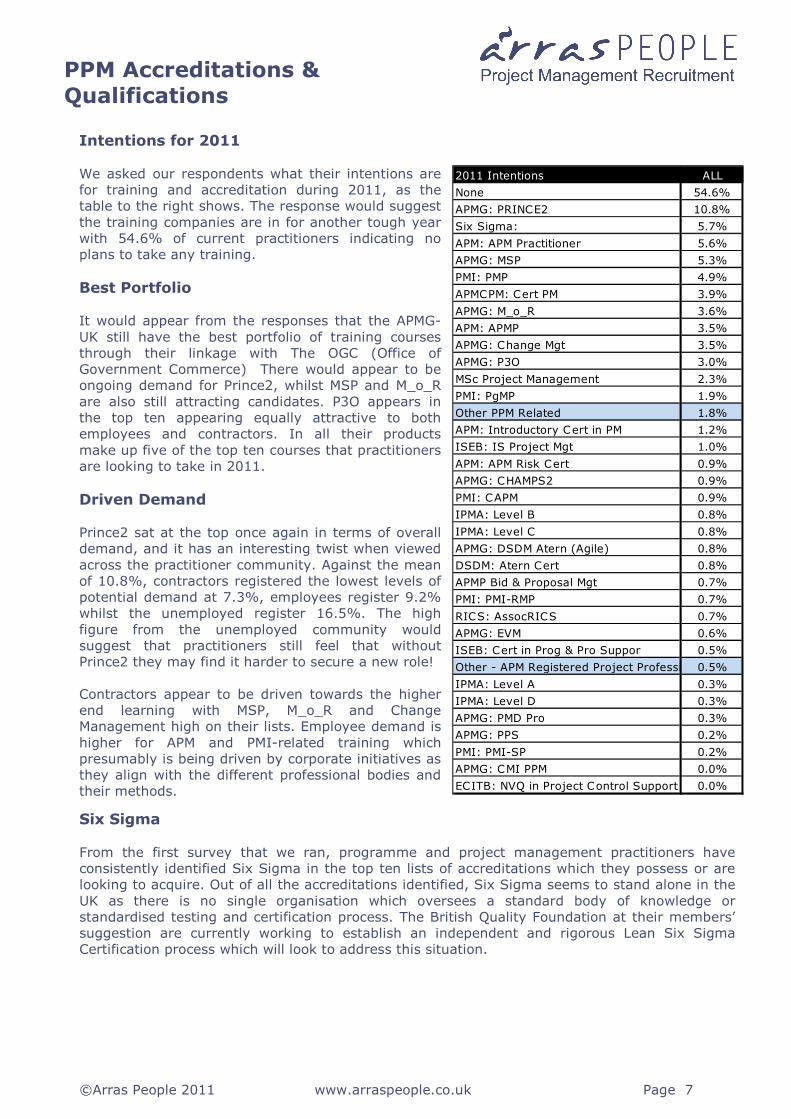
Intentions for 2011
We asked our respondents what their intentions are
for training and accreditation during 2011, as the
table to the right shows. The response would suggest
the training companies are in for another tough year
with 54.6% of current practitioners indicating no
plans to take any training.
Best Portfolio
It would appear from the responses that the APMG-
UK still have the best portfolio of training courses
through their linkage with The OGC (Office of
Government Commerce) There would appear to be
ongoing demand for Prince2, whilst MSP and M_o_R
are also still attracting candidates. P3O appears in
the top ten appearing equally attractive to both
employees and contractors. In all their products
make up five of the top ten courses that practitioners
are looking to take in 2011.
Driven Demand
Prince2 sat at the top once again in terms of overall
demand, and it has an interesting twist when viewed
across the practitioner community. Against the mean
of 10.8%, contractors registered the lowest levels of
potential demand at 7.3%, employees register 9.2%
whilst the unemployed register 16.5%. The high
figure from the unemployed community would
suggest that practitioners still feel that without
Prince2 they may find it harder to secure a new role!
Contractors appear to be driven towards the higher
end learning with MSP, M_o_R and Change
Management high on their lists. Employee demand is
higher for APM and PMI-related training which
presumably is being driven by corporate initiatives as
they align with the different professional bodies and
their methods.
PPM Accreditations &
Qualifications
2011 Intentions ALL
None 54.6%
APMG: PRINCE2 10.8%
Six Sigma: 5.7%
APM: APM Practitioner 5.6%
APMG: MSP 5.3%
PMI: PMP 4.9%
APMCPM: Cert PM 3.9%
APMG: M_o_R 3.6%
APM: APMP 3.5%
APMG: Change Mgt 3.5%
APMG: P3O 3.0%
MSc Project Management 2.3%
PMI: PgMP 1.9%
Other PPM Related 1.8%
APM: Introductory Cert in PM 1.2%
ISEB: IS Project Mgt 1.0%
APM: APM Risk Cert 0.9%
APMG: CHAMPS2 0.9%
PMI: CAPM 0.9%
IPMA: Level B 0.8%
IPMA: Level C 0.8%
APMG: DSDM Atern (Agile) 0.8%
DSDM: Atern Cert 0.8%
APMP Bid & Proposal Mgt 0.7%
PMI: PMI-RMP 0.7%
RICS: AssocRICS 0.7%
APMG: EVM 0.6%
ISEB: Cert in Prog & Pro Suppor 0.5%
Other - APM Registered Project Professional0.5%
IPMA: Level A 0.3%
IPMA: Level D 0.3%
APMG: PMD Pro 0.3%
APMG: PPS 0.2%
PMI: PMI-SP 0.2%
APMG: CMI PPM 0.0%
ECITB: NVQ in Project Control Support 0.0%
©Arras People 2011 www.arraspeople.co.uk Page 7
Six Sigma
From the first survey that we ran, programme and project management practitioners have
consistently identified Six Sigma in the top ten lists of accreditations which they possess or are
looking to acquire. Out of all the accreditations identified, Six Sigma seems to stand alone in the
UK as there is no single organisation which oversees a standard body of knowledge or
standardised testing and certification process. The British Quality Foundation at their members’
suggestion are currently working to establish an independent and rigorous Lean Six Sigma
Certification process which will look to address this situation.

Budgets under threat
In view of the economic conditions we asked
our respondents to best describe their
personal position regarding training budgets
for 2011. The responses have been broken
down and are shown in the table to the right
for employees and contractors.
Employees reported that 23% have no
training budget for 2011 as all budgets have
been cut. When viewed across sector this
increased to 32% for the public sector and 16% for private sector employees. As would be
expected when purse strings are tight many employees anticipate training to be available on a
case-by-case basis with just 15% stating that they have an agreed training budget / plan. 15 %
of employees stated that they would consider self funding their training in 2011 if they saw
suitable returns.
For the contractor community the question of investment in training is always an ongoing
conundrum requiring a balancing of available time, cost and return on investment. Many training
organisations run weekend courses which look to address the time issues, and the results show
that 47% will invest if there is a potential ROI.
Thoughts on Accreditation
Across the respondent group;
• 57% agreed that employers expect them to have PPM qualifications and
accreditations, whilst 20% disagreed.
• 63% agreed that PPM qualifications and accreditations help them to secure new
roles, whilst 14% disagreed.
• 69% agreed that they see PPM qualifications and accreditations as an important part
of their ongoing professional development, whilst 14% disagreed.
• 66% agreed that most employers confuse PPM qualifications and accreditations with
PPM competence, whilst 9% disagreed.
• 51% agreed that most employers overstate the value of PPM qualifications and
accreditations, whilst 19% disagreed.
Comments
Many comments were left by respondents which supported, questioned the relevance and begged
clarification regarding PPM qualifications and accreditations
• “My employer does not view accreditation as important - I disagree strongly with that
view”
• “Not sure whether client organisations require certain qualifications or whether
agencies suggest them (to make filtering easier?)”
• “Until it is possible to become a Chartered Project Manager there is no Profession.
Accreditations are therefore based on commercial organisations views on what PM is.
Training in methods and techniques is valuable but is not the basis for a Profession.”
PPM Accreditations &
Qualifications
Training Budget 2011 All
Employee - All budgets cut 23%
Employee - Allocate case by case 47%
Employee - Agreed training budget 15%
Employee - Will consider self funding 15%
All
Contractor - No budget 30%
Contractor - Will allocate if secures work 47%
Contractor - Time and budget in place 23%
©Arras People 2011 www.arraspeople.co.uk Page 8

Today it seems impossible to pick up any newspaper, magazine or news source without some
story about the positive or negative impact of the “social media” phenomenon. Not only is it big
news but also big money as the various companies try to attract more users and find new ways of
generating revenues. With the advent of smart mobile devices it is no longer an activity that takes
place behind closed doors, it is almost omnipresent and that means it is in the workplace. So with
that in mind we decided to take a look at how social media is seen by the project management
practitioners and their employers.
Personal use
We first asked our respondents which social media tools
they use personally outside of their work environment.
As can be seen in the table the group would appear to
embrace social media, with LinkedIn the “professional”
platform being used by 72% of the respondents and
other “social” platforms such as Facebook being used
by 60%.
LinkedIn is predominantly used by the 35-50 age range
category – 77%, compared with 67% of the <34 age
range category. Not surprisingly perhaps, 85% of the
<34 age range use Facebook, MySpace etc compared
with 61% of the 35-50 age range category and 38% of
the >50 age category. In terms of gender use, 28% of females use Facebook compared with 22%
of males and a slight reversal for LinkedIn, with 30% of males compared to 27% of females.
Using social media tools to acquire and share knowledge has also increased in popularity with
39% of respondents using webinars, podcasts and blogs to both broadcast and participate.
Tweeting and blogging is predominantly carried out by the <34 age category with 30% compared
to the nearest age group 35-50 at 20% in using Twitter and 20% blogging compared to 11% of
the 35-50 age group.
But not everyone is switching on to new channels of media, 10% of respondents don’t use any
social media tools citing time commitments and preferring human interaction as their main given
reasons.
In-Role use
We then asked our respondents which social media
tools they use in their current role (Job related, not
personal use during work hours) 45% of respondents
use LinkedIn – predominantly for networking with
other professionals and keeping in contact with
colleagues and peers as opposed to any specific
project related activity.
The use of LinkedIn in the workplace sees a significant
split between males and females with 30% of males
versus 19% of females.
Just over a third of respondents don’t use any social media tools in the workplace with security
issues, network capabilities, distractions and trust cited as being the main reasons for non-use.
Instant Messaging scores the highest as a communication tool for interacting with colleagues
internally at 20%. Instant Messaging is used predominantly by the private sector at 24% versus
just 11% in the public sector.
Social Media
Personally use %
Linkedin 72%
Facebook ,MySpace etc 60%
Internet forums 25%
Instant messaging (MSN etc) 23%
Twitter 20%
Webinars 14%
Podcasts 13%
Blogs 12%
None 10%
Other 1%
In-Role use %
Linkedin 45%
None 33%
Internet forums 20%
Instant Messaging (MSN etc) 20%
Webinars 19%
Blogs 8%
Twitter 8%
Facebook, MySpace etc 7%
Podcasts 7%
Other 4%
©Arras People 2011 www.arraspeople.co.uk Page 9

Respondents were also able to leave individual comments on other tools they use both within the
workplace and for personal use. Skype, the internet calling tool, was the tool used most frequently
in both work and personal capacities.
Further workplace based social media tools included SharePoint, company specific intranets and
Yammer, the private social network specifically for organisations and corporates.
Role of social media in the workplace
We then asked our respondents “do you
believe social media tools have a role in the
workplace?” The respondents were almost
equally split between seeing the upside
(52%) and downsides (44%)
Respondents across the age groups were almost unanimous that social media had a part to play
in networking with other professionals (42% of total respondents). 32% of total respondents could
see the benefit of using social media to help communicate with the project team; 43% of the <34
age group agreed compared with 33% of the 35-50 and 29% of >50 age groups.
34% of respondents have not yet seen a role for social media in the workplace; 29% of the <34
age group agreed with this statement versus 36% of the >50 age group. Of the 10% of respon-
dents who believed that social media has no relevancy in the workplace; 15% came from the >50
age group versus 7% of the <34 age group.
Jury Still Out?
Respondents who chose “Other” were invited to leave individual comments about the role social
media has in their organisations. There were three main areas where respondents showed their
concern about the adoption of social media in the workplace:
• Time commitments to use social media effectively was the biggest concern with some
respondents calling social media a “time-waster”, “a time bandit” and a “distraction”.
One respondent even compared social media use in the workplace to that of a “habitual
smoker” taking frequent time out through the working day. Senior management
responses indicated that until the benefits of social media could be seen it would
continue to be seen as a distraction to the working day. On the other hand there were
responses that indicated that people wanted to embrace a more social media way of
working, but felt that they had too many constraints on their own time to be able to
explore it further.
• Communication ‘v’ collaboration was the second area of concern shown by
respondents, with the jury still out on whether social media tools are actually good
communication tools – both internally and externally in an organisation. Tools that
promote instant communication (Instant Messaging) were seen as the better tool to use
in the workplace, however there were views that there are too many social media tools
available that don’t necessarily promote communication. Many respondents saw the main
benefits for social media tools as research, information gathering and collaboration.
• Social ‘v’ work use of social media is still seen as a barrier for the uptake of social
media in organisations. Trusting employees to use social media tools professionally and
for work purposes only – not for social engagement with family and friends, is the third
main area of concern. Interestingly in this survey, LinkedIn was the most popular work
based social media tool at 45% however some would argue that it is primarily used for
business contact networking and not “work”. The lines are blurred between what is
acceptable as social networking and professional networking on work time and is further
highlighted by the responses to the social media policy question below.
Social Media
Social media in the workplace %
Network with other professionals 42%
Not yet found a role for them at work 34%
Communicate with the project team 32%
Communicate with external stakeholders 25%
Not relevant in the professional environment 10%
Other 4%
©Arras People 2011 www.arraspeople.co.uk Page 10

Response comments to the use of social media in the workplace also showed that many project
management professionals believe that there will be a “social media revolution” that will change
the way people will communicate in business. Comments included; “Not utilising social media
tools makes a workplace appear archaic”, “The jury is still out. Lots of people are stuck in a time
warp and only use e-mail and attachments to communicate. Until there is a revolution these
people will block progress.” And finally “There is a senior view that these tools are timewasters.
However; this is the next industrial revolution and social media will become irresistible.”
Organisations view of social media tools
We asked our respondents “how is the use of social media viewed in your
organisation?” The question was asked to compare the project professional’s own view of social
media and that of the organisation they work within. The top four responses, with only 5%
between them showed that the jury is still out from an organisation’s point of view. 22% are still
unsure of the benefits whilst 18% see the benefits of using social media for collaboration.
Respondents leaving comments on the organisational view of social media were split into three
main categories. The vast majority responded that their organisation has made a conscious
decision to block all access to social media tools externally to the organisation; reasons cited
included security issues, trust, and brand
protection. Other respondents commented
that no social media activity takes place at
all – it has never been mentioned or
discussed. Finally, the time and distraction
issue of employees using any social media
tools during work time. Just 1% see social
media as a passing fad therefore the onus is
on the organisation to explore social media
further and understand the benefits for their
specific organisation, the rules of
engagement for employees and the infrastructure required to support social media activities in the
future.
Social Media Policy
We finally asked our respondents “does your organisation
have a social media policy?” Because respondents are
almost split evenly between yes and no and with a further
third unsure about policies regarding social media use, this
is further evidence that organisations should be reviewing
their stance on social media and communicating the decision effectively to their employees.
Perhaps, by using social media tools?
Social Media
View of social media in the workplace %
Experimental- unsure of benefits 22%
Distraction, not seen as a workplace tool 20%
Good tool for collaboration 18%
A security risk ? not allowed 17%
Discourage -open to abuse 11%
Other 6%
Keep the project team engaged 5%
A fad 1%
Social Media Policy in place %
Yes 37%
No 36%
Unsure 27%
©Arras People 2011 www.arraspeople.co.uk Page 11
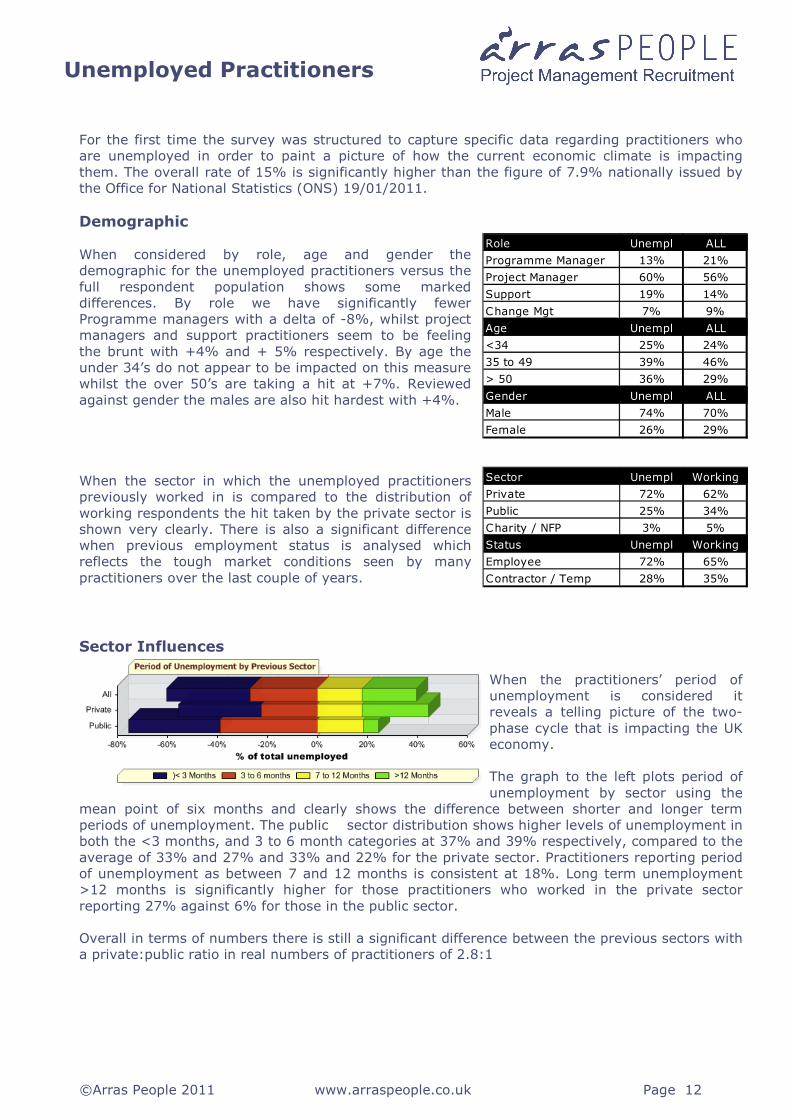
For the first time the survey was structured to capture specific data regarding practitioners who
are unemployed in order to paint a picture of how the current economic climate is impacting
them. The overall rate of 15% is significantly higher than the figure of 7.9% nationally issued by
the Office for National Statistics (ONS) 19/01/2011.
Demographic
When considered by role, age and gender the
demographic for the unemployed practitioners versus the
full respondent population shows some marked
differences. By role we have significantly fewer
Programme managers with a delta of -8%, whilst project
managers and support practitioners seem to be feeling
the brunt with +4% and + 5% respectively. By age the
under 34’s do not appear to be impacted on this measure
whilst the over 50’s are taking a hit at +7%. Reviewed
against gender the males are also hit hardest with +4%.
When the sector in which the unemployed practitioners
previously worked in is compared to the distribution of
working respondents the hit taken by the private sector is
shown very clearly. There is also a significant difference
when previous employment status is analysed which
reflects the tough market conditions seen by many
practitioners over the last couple of years.
Sector Influences
When the practitioners’ period of
unemployment is considered it
reveals a telling picture of the two-
phase cycle that is impacting the UK
economy.
The graph to the left plots period of
unemployment by sector using the
mean point of six months and clearly shows the difference between shorter and longer term
periods of unemployment. The public sector distribution shows higher levels of unemployment in
both the <3 months, and 3 to 6 month categories at 37% and 39% respectively, compared to the
average of 33% and 27% and 33% and 22% for the private sector. Practitioners reporting period
of unemployment as between 7 and 12 months is consistent at 18%. Long term unemployment
>12 months is significantly higher for those practitioners who worked in the private sector
reporting 27% against 6% for those in the public sector.
Overall in terms of numbers there is still a significant difference between the previous sectors with
a private:public ratio in real numbers of practitioners of 2.8:1
Unemployed Practitioners
Role Unempl ALL
Programme Manager 13% 21%
Project Manager 60% 56%
Support 19% 14%
Change Mgt 7% 9%
Age Unempl ALL
<34 25% 24%
35 to 49 39% 46%
> 50 36% 29%
Gender Unempl ALL
Male 74% 70%
Female 26% 29%
Sector Unempl Working
Private 72% 62%
Public 25% 34%
Charity / NFP 3% 5%
Status Unempl Working
Employee 72% 65%
Contractor / Temp 28% 35%
©Arras People 2011 www.arraspeople.co.uk Page 12

Previous Income ranges
As can be seen in the graph to the
right hand side the unemployed
practitioners span the full range of
incomes we have come to associate
with the project management field.
Taking the average income in the
£40K to £50K band those with higher
incomes appear to be hardest hit with
46% of the total whilst those
practitioners earning below this level
account for 37% of the total.
For those practitioners that were
previously contractors the percentage
above the £40K to £50K band
increases to 74% whilst for
employees it is 38%.
The full complexity of income range is shown below with comparisons across role, age, gender
and sector against the mean.
Unemployed Practitioners
©Arras People 2011 www.arraspeople.co.uk Page 13
As part of this years survey we took a look at the challenges of job hunting and specifically
those associated with changing sector. This data was compiled from those practitioners who are
unemployed and also those currently in employment (PAYE & Contractors) who are seeking to
change roles.
Overall amongst those currently employed 62% confirmed that they are currently looking for a
new role, increasing to 66% in the public sector against 60% in the private sector. This
probably reflects the impending challenges for public sector workers, whilst in the private
sector after a period of stagnation 2011 for many may be the year to make a change.
Sources of opportunity
We asked both groups of job hunters to indicate their perception of how effective various
channels are when it comes to identifying new opportunities:
The results are not surprising in today's market, where many organisations are still trying to fill
roles without actively marketing through agencies or jobsites but preferring to use word of
mouth, employees personal networks and referrals.
Agencies such as Arras People are seen by many organisations as suitable for their “hard to fill
roles” when they have exhausted their in-house channels, though for others they are the first
port of call.
Social media is still unproven, although sites such as LinkedIn are trying to tie together the
personal networks and some of the offerings of the job boards and is certainly one to watch.
Finally in the world of New Media the trade journals and newspapers continue to suffer and
appear to be no longer an effective channel for most job seekers, interestingly public sector
workers rate them higher than others!
Online Job Boards As the top result for the unemployed practitioners, 78% saw this
channel as effective (25% very effective) whilst the
employed job seekers rated this at 74% & 21%, respectively.
Personal Network As the top result for the employed job seekers 76% saw this
channel as effective (34% very effective) whilst the unemployed
practitioners rated this at 62% & 21%, respectively.
Agencies 71% of the employed job seekers saw this channel as effective
(21% very effective) whilst the unemployed practitioners rated
this at 66% & 14%, respectively.
Social Media Both sets of practitioners are not sure that this is yet an
effective channel for new opportunities with 60% either not
using or finding it ineffective.
Trade Journals Both sets of practitioners do not see this as an effective channel
for new opportunities with 75% of the unemployed practitioners
and 65% of those employed either not using or finding it
ineffective.
Newspapers The most ineffective channel for both sets of practitioners with
81% of the unemployed practitioners 75% of those employed
either not using or finding it ineffective.
Job Hunting
©Arras People 2011 www.arraspeople.co.uk Page 14

Job Boards
We then asked both groups of job hunters a series of questions about the large job boards such
as Monster and Jobsite which amongst other things offer “Let us do the hard work for you
and take the hassle out of job hunting.” Taking career management to a new level of
passiveness? Or setting unreal expectations?
Firstly we asked respondents if in their experience these job boards “do the hard work for me
and take the hassle out of job hunting?” Whilst some practitioners did feel that they agreed
with the statement, one third of the unemployed practitioners disagreed with this statement,
with 27% of those currently in employment holding the same opinion. The most vocal group
who disagreed with 38% were unemployed in the 35 to 49 age group. Maybe this difference
could be accounted for by the differing realities of the unemployed and those “looking” for a
new role; the former need a new role and are closer to the reality, whereas those already
employed may be more relaxed about the service provided?
With regular stories in the media about identity theft and abuse of personal details we then
asked the practitioners if they ever “worry that their CV and personal details are freely
available on the web and may be used fraudulently?” Once again there was a mixed response
to this question with 41% of unemployed practitioners admitting that this is a concern to them;
of the employed respondents this figure rose to 48%. When we analysed the responses by age
group the unemployed under 34’s increased to 46%, whilst the 50+ employed grouping fell to
42%. The final cut by gender saw an increase in both groups to 57% for the female respon-
dents! It possibly begs the question, are the under 34’s and females much more savvy when it
comes to managing personal data, whilst the over 50’s need to maybe think about it a little bit
more?
A common complaint we always hear about job boards is that they are full of roles that don’t
really exist. The perception being that many roles are created by employers and agencies to
either “fish” in the market to see what is available or to add candidate CV’s to their database.
To this point we had never had a handle on how many candidates hold this view so we asked
the question. The result, across the board 50% of employed and unemployed practitioners
looking for a role today believe that many roles advertised are not real. An interesting statistic
that both advertisers and job seekers should bear in mind when deciding which job boards to
use! At Arras People we have a policy that only genuine and live roles are advertised, as
per the legal requirement.
The second most common complaint about job boards is that they appear to be “black holes”.
Details are entered, never to be seen again leaving users to wonder what ever happened and
also reinforcing the view discussed above. When asked for their personal experience
unemployed job seekers responded that 66% found the large job boards impersonal as they did
not receive any response, the working job seekers responded with 55%. In terms of those
candidates who had a positive experience the figures were 15% and 20% respectively, possibly
the candidates that potentially had a good match?
Job Seeker Challenges
Finding a new role for most practitio-
ners is a challenge, though for some
it appears to be much harder than
others. For the
unemployed practitioners the biggest
challenge is securing an interview at
68%, compared to 51% for those in
employment.
Adding to this difficulty is the perception amongst many job seekers that ageism is still a
major issue when organisations are looking to recruit.
Job Hunting
©Arras People 2011 www.arraspeople.co.uk Page 15

In all 46% of the unemployed practitioners stated that ageism is an issue, compared to 22% of
their peers in employment. This figure rises to a staggering 78% and 47% respectively, for
practitioners who are in the 50+ age group. By way of a contrast it reduces to 25% and 18%
for the under 34’s.
Compensation or finding the right package is also a challenge for the unemployed practitioners
with 45% indicating that this is a big issue. For those in work the issue of finding the right
package is smaller at 27%. This reflects the challenges of the marketplace today where we
continue to see a squeeze on many packages that are being offered, impacting the unemployed
who may well have been removed from well paid roles. The challenge for those still working is
generally lessened as they do not need to move, thus having the choice of staying in their
current role or leveraging an increase in package from the new employer. The lack of a real
increase in the packages on offer for many roles is adding to the overall reduction in churn in
the marketplace with many practitioners choosing to stay in their current roles until they
increase.
Changing Sector or Specialism
Whilst many practitioners see the skills associated with project management as transferable
across sector and specialism, the market appears to hold a different view.
During recent years the tough economic conditions have created conditions where changing
sector has become more attractive; firstly we saw private sector practitioners trying to get
work in the public sector and we now have the opposite trend occurring. At the same time
many employers (recruiters?) became much
more focussed and risk averse demanding de-
monstrable relevant experience when looking
to fill roles. Of those respondents looking for a
new role 65% indicated that they were also
looking to change specialism of sector as
shown in the table.
Reasons for the inclination to change varied widely, 45% indicated a desire to broaden their
experience, 26% stated a lack of opportunity in their current sector / specialism and 20%
expressed that they perceived the opportunity for better prospects / rewards.
As for outcomes, 29% of employed job seekers said that they have managed at some point to
make a successful transition, whilst this figure dropped to just 6% for those currently
unemployed. So why do practitioners believe it is so difficult?
• 91% agree that organisations recruit with “blinkers on”
• 78% agree that it is a “catch 22” situation – No experience = No job and No job
= no experience!
• 76% agree that many recruiters lack the knowledge to identify transferable
skills
• 68% agree that the differences between private and public sector are
overstated
• 55% agree that project management skills are not generally seen as
transferable
Whilst it is easy to dismiss this as a one eyed view, organisations looking to recruit and grow
their project management capability will need to address these perceptions at some point.
Investing in and developing talent will become more important as the economic situation
improves and the “talent wars” begin, you may not be able to afford exactly what you want!
Job Hunting
Change tried to make Emp Unemp
Public to Private 30% 21%
Private to Public 12% 22%
Specialism within Private 48% 49%
Specialism within Public 10% 8%
©Arras People 2011 www.arraspeople.co.uk Page 16

For the third year we have included a section in the survey called “Current Climate and Me”,
asking respondents to answer questions about their personal well-being, the sector they work
in and confidence levels looking forward into 2011. For many 2010 was once again a tough
year, though the UK economy officially came out of recession there was continual talk about
“double dip” and the change of Government meant many policy changes. There is great hope
that the private sector is recovering and growth will follow but for many in the public sector the
full squeeze is about to be applied.
Sector confidence moving into 2011
The sector confidence levels expressed over the last
three years are shown in the table to the right. At
the highest level of analysis sector
confidence is at its highest since 2008 with 42%
feeling above neutral compared to 36% and 34% in
previous surveys. Those feeling neutral also
report good news with just 22% compared to the
previous 30% & 27%. Whilst contraction and hard
times is up at 1% from 34 last year it is not as bad as the 39% reported at the beginning of the
downturn.
When the 2010 survey figures are viewed in detail by sector and employment type we can see
stark differences when compared to the overall picture as shown in the table below.
Private sector confidence has once again risen from the bottom in 2008 when it was red across
all levels. Since last year respondents expecting contraction and hard times has contracted by
6%, those feeling neutral is also down by 5%. On the up side we see normal growth at +5%
and those feeling buoyant at +6%.
For the public sector we have also seen an about-face moving from all green in 2008 to all red
in 2010 in anticipation of tough times ahead. Those anticipating hard times in 2011 has hit
36% which is +19% on last years levels, the highest level we have recorded in this category.
With 80% of respondents’ not expecting any growth it would appear that 2011 is going to be
tough for these practitioners.
After a couple of tough years it would appear that the contractor community are feeling more
bullish about their prospects in 2011 with +10% in the expecting activity above neutral and -
3% expecting contraction and hard times.
Employees driven by the mood in the public sector report +8% in hard times, at the same time
+2% in buoyant suggesting a real bag of mixed fortunes during 2011.
Current Economic Climate
Survey 2010 2009 2008
Buoyant 10% 6% 7%
Steady Normal Grow th 32% 30% 28%
Neutral 22% 30% 27%
Contraction 19% 21% 23%
Hard Times 17% 13% 16%
Current Sector Confidence moving into 2011 - versus ALL
All Private Public Contractor Paye
Buoyant 10% 13% 5% 8% 11%
Steady Normal Grow th 32% 42% 17% 33% 32%
Neutral 22% 26% 17% 26% 21%
Contraction 19% 15% 25% 20% 18%
Hard Times 17% 5% 36% 13% 18%
©Arras People 2011 www.arraspeople.co.uk Page 17

Personal confidence moving into 2011
When asked about personal confidence levels the
practitioners have consistently expressed levels
which are more stoic than their views on their
sectors. As can be seen in the table to the right the
levels of personal confidence once again increased
in this year’s survey whilst the numbers feeling low
or gloomy fell by 50% on last year to just 14%.
When the 2010 responses are viewed in detail by sector and employment type we can see the
differences compared to the overall picture, as shown in the table below.
Most noticeable is the stark difference between those working in the public and private sectors
where low and gloomy respondents are -16% and -5% respectively on last year. Private sector
buoyancy is also up this year by +2% whilst it has dropped -1% for the public sector.
The responses also confirm the increased levels of confidence being expressed by contractors
with +3% on the buoyancy level and +13% feeling steady compared to 2009 responses.
Employees still have 13% of respondents feeling low or gloomy, but again this is -9% when
compared to 22% last year.
Job confidence moving into 2011
When asked about their personal concerns about jobs, respondents painted a picture that is
still full of concern. 48% of all working practitioners are worried that they may see their role
cut during 2011, a 3% increase on last year’s survey!
As can be seen in the table the public sector practitioners are especially concerned with 61%
expressing a worry (21% very worried) compared to 43% and (14%) respectively last year.
This level of concern is not necessarily unexpected at this point based on the media coverage
about the possible impacts of the Governments austerity measures.
Possibly more concerning is the still high levels of concern amongst the private sector
practitioners with 40% expressing a worry (9% very worried) compared to 45% and (16%)
last year. Whilst we can see a lowering in the level of concern, the 7% shift may suggest that
overall confidence in the recovery is still fragile!
Current Economic Climate
Personal Conf idence 2010 2009 2008
Buoyant 13% 12% 11%
Steady 73% 59% 63%
Low 11% 20% 18%
Gloomy 3% 8% 8%
Personal Confidence moving into 2011 - versus ALL
2010 All Private Public Contractor Paye
Buoyant 13% 16% 9% 15% 12%
Steady 73% 74% 71% 70% 74%
Low 11% 8% 15% 11% 11%
Gloomy 3% 2% 4% 4% 2%
Concern about role being cut - versus ALL
2010 All Private Public Contractor Paye
Very w orried 14% 9% 21% 14% 14%
Fairly w orried 34% 31% 40% 28% 36%
Not at all w orried 39% 46% 27% 36% 40%
Not sure 14% 14% 12% 21% 9%
©Arras People 2011 www.arraspeople.co.uk Page 18

Personal Wellbeing?
Each year we ask the participants in the survey to
indicate how they feel their personal well being feels
compared to the same time 12 months ago. Whilst
this is not a scientific measure, it offers a
temperature gauge on the respondent population. As
we can see in the table to the right the practitioners
are generally feeling better than 12 months ago with
a 5.6% rise to 27% for those feeling better off.
Those feeling the same also saw an increase of 4.5% to 34% whilst those feeling worse off
reduced by 10.1%.
When the 2010 responses are viewed in detail by sector and employment type we can see the
differences compared to the overall picture, as shown in the table above.
After taking their share of the pain during the last couple of years the practitioners who are
working in the private sector appear much happier this year whilst the public sector workers
have started to feel tougher times. The contractor community confirm here the bounce that has
been indicated responses to
other questions and employees
show further mixed fortunes.
Actual changes by segment can
be seen in the table to the right
With pay rises expected to be
tight again in 2011 and increases in the tax burden and general inflation the results at the next
survey will be an interesting comparison.
Respondent Comments
Respondents left a wide range of comments on this subject describing the full spectrum of
experience and circumstance. Representative selections include;
• “Interim/Contract assignments are fewer and rates much lower therefore
ncome suffers as does the family.”
• “I have had no contract for 50% of the year; and my rates have been down by
14%; so that’s an overall drop of 57% on the year. However; I have just
secured another contract so 2011 looks more positive.”
• “I have been working for the same company for almost 3 years without a
proper salary increase. The current market place seems to take advantage of
the fact that those that have a job should be grateful to have one”
• “The collapse in demand in public sector has had a significant (25%) impact on
rates and availability of contract roles.”
• “Salary cuts took place 2009/2008; slight increase last year”
• “I now have a job; so better off.. not so well paid as last job.”
• “I received a welcome bonus for achieving goals”
Current Economic Climate
Living Standards 2010 2009 2008
Much Better Off 7% 5% 8%
Slightly Better Off 20% 16% 22%
About Same 34% 29% 33%
Slightly Worse Off 29% 27% 23%
Much Worse Off 10% 22% 14%
Compared to this time last year I am - versus ALL
Living Standards All Private Public Contractor Employee
Much Better Off 7% 9% 4% 9% 6%
Slightly Better Off 20% 21% 18% 20% 19%
About Same 34% 35% 32% 31% 35%
Slightly Worse Off 29% 27% 34% 26% 31%
Much Worse Off 10% 9% 12% 13% 9%
2009/10 Comparison All Private Public Contractor Employee
Much Better Off 2.0% 2.7% -0.9% 1.8% 2.2%
Slightly Better Off 3.6% 3.1% 3.2% 7.3% -0.5%
About Same 4.5% 7.7% -4.7% 4.2% 1.6%
Slightly Worse Off 2.2% -3.4% 8.4% -1.7% 2.1%
Much Worse Off -12.2% -10.1% -6.0% -11.7% -5.4%
©Arras People 2011 www.arraspeople.co.uk Page 19

Working Hours
Much has been written and spoken about the perceived
long hours culture of the UK workforce and special
mention has been made that workers have been expected
to put in extra hours during this period of recession. It
was therefore a pleasant surprise to see the results posted
by the practitioners about their typical hours.
As can be seen in the table typical hours worked has dropped since the last reporting period
returning to a similar level as those reported in 2008. One other interesting result was the
number of respondents working less than 35 hour rising by 3%. This may be a blip as jobs are
created on a shorter hour’s basis whilst confidence is still low or it may point to a slight change
in hiring patterns?
To try and capture this fact
we have increased the
granularity of the data at
the lower hours to see if
there is a trend over the
coming years.
As can be seen in the table above there are still 51% of practitioners reporting a working week
greater than 40 hours. However this figure has dropped by 7% over last year, and those
working more than 48 hours has dropped by 3%. Contractors and private sector workers still
report longer hours over their public sector and employee counterparts, but they have dropped
by 8% and 6%, respectively.
Remuneration Patterns
Each survey shows a wide variation of earnings and outlook, reflecting the diverse mix of
winners and losers amongst the PPM practitioners who take part in the survey. Once again this
year’s results paint a picture that shows the pressure points and differences between the
sector’s and employment categories.
As we can see in the graph to the
right, overall remuneration change
across all respondents was again
very flat with 41% reporting no
change in 2010. Those seeing a
g r e a t e r t h a n 5 %
increase rose 4 points to 17% whilst
respondents seeing a fall reduced by
9 points to 18%.
The largest change was in those
receiving increases between 1 and 5
percent, which grew by 6 points to
24% of all respondents. As can be
seen in the next table this was driven
by employees who registered 34% in this group compared to 6% for contractors.
Hours, Remuneration & Rewards
Work Hours 2010 2009 2008
<35 Hrs 7% 4% 4%
35 to 40 Hrs 42% 38% 42%
40 to 48 Hrs 37% 41% 40%
> 48 Hrs 14% 17% 14%
Work Hours All Private Public Contractor Employee
<20 Hrs 2% 2% 1% 5% 1%
20 to 35 Hrs 5% 4% 7% 7% 4%
35 to 40 Hrs 42% 34% 53% 30% 48%
40 to 48 Hrs 37% 41% 32% 41% 35%
> 48 Hrs 14% 19% 7% 18% 12%
0%
5%
10%
15%
20%
25%
30%
35%
40%
45%
Movement in Earnings Comparison
2010
2009
2008
©Arras People 2011
©Arras People 2011 www.arraspeople.co.uk Page 20

If we take all respondents who saw no change or a fall in remuneration during 2010:
• This takes in 78% of contractors, consistent across sector. Compared to 2009
when it was 82% with 78% public and 84% private sector splits.
• This takes in 49% of employees, with 54% public and 47% private sector
splits. Compared to 2009 when it was 60% with 52% public and 40% private
sector splits.
If we take all respondents who saw their remuneration increase by more than 5% in 2010:
• This takes in 16% of contractors, with 19% public and 15% private sector
splits. Compared to 2009 when it was 14% with 18% public and 11% private
sector splits.
• This takes in 17% of employees, with 11% public and 20% private sector splits.
Compared to 2009 when it was 12% with 12% public and 12% private sector
splits.
2011 Remuneration Outlook
We once again asked the respondents
to indicate how they felt their
remuneration would fare during 2011.
As can be seen in the graphical
representation to the right the
employees were once again more
bullish in terms of anticipating growth
with 40%. Contractors appear much
more circumspect with 80% once again
anticipating either no increase or a fall (18%)
When reviewed in detail and against projections for
2009/10 it would appear that the contractor community
feels that the worst is over with significantly fewer
expecting a fall in day rates (-8%). As for employees there
is little difference from the 2010 forecast at the top level. A
further level of breakdown to sector provides significant
differences with 33% of public sector contractors expecting
their remuneration levels to fall in 2011 compared to 11%
in the private sector where rates have already been hit
during the last three years. Private sector employees are
also more bullish with 47% anticipating an increase against 31% for those in the public sector.
Hours, Remuneration & Rewards
Movement in Earnings 2010 breakdow n - versus ALL
ALL Contractors C.Pub C.Priv Employees E.Pub E.Priv
>10% Inc 8% 7% 5% 7% 9% 4% 11%
+8 to 10% 4% 5% 6% 4% 3% 4% 3%
+5 to 8% 5% 4% 7% 3% 5% 4% 6%
+1 to 5% 24% 6% 4% 7% 34% 35% 33%
No Change 41% 47% 45% 47% 38% 45% 34%
-1 to 5% 3% 4% 2% 5% 3% 2% 3%
-5 to 8% 2% 3% 4% 3% 1% 0% 1%
-8 to 10% 3% 6% 6% 6% 1% 1% 1%
>10% Fall 10% 18% 20% 17% 6% 5% 7%
Contractor Rates 2011 2010 2009
Fall 18% 26% 28%
Unchanged 63% 58% 60%
Increase 18% 16% 12%
Salary Expectation 2011 2010 2009
Fall 8% 9% 15%
Unchanged 52% 50% 45%
Increase 40% 41% 40%
©Arras People 2011 www.arraspeople.co.uk Page 21

The following section reviews the Contractor responses to questions posed in the survey about
their operation during 2010 and their views looking forward into 2011.
Contractor Demographics
Of the respondents who identified themselves as contractors, 66% delivered in the private
sector during 2010, 30% delivered in the public sector and the remaining 4% delivered into the
Charity / NFP sector. Once again the most popular vehicle for delivery was the limited company
which accounted for 73% of the contractor population, though this figure was slightly down
with umbrella companies increasing by 2 points to 15% and sole traders up 3 points to 12%. In
terms of longevity as a contractor 84% have been contractors for more than one year, with
16% (+3) moving into contract work from permanent employment during 2010. Out of the
group those who have been contracting for more than five years remained consistent at 45%.
In terms of gender, the contractor population reported an 80:20 split in terms of male :
female.
Challenging times continue
2010 saw another year of challenges for
many in the contractor community with
continued pressures on day rates and
availability of new contracts.
47% of respondents reported no change in
their remuneration in 2010 which could be
seen as a good result bearing in mind the
market conditions. 32% reported a fall in
earnings, with 18% reporting a fall greater
than 10% which is down from 24% last
year.
On the plus side, 22% of respondents
reported a rise in their remuneration during
2010 with 7% indicating over 10% increase, 3 points down from 10% last year.
Contractor Rates
For the 2010 survey we introduced more
granularity in the day rates scale. Overall
the number of contractors earning between
£300 and £650 per day remained consistent
at 69%, with peaks at £300/£349, £450/
£500 and £750/£999.
As can be seen in the graph to the right
there continued to be a marked difference
in the distribution of public and private
sector day rates. Public sector rates peaked
at £400/449 compared to £450/499 in the
private sector. For rates £500 to £749 the
public sector also had a higher distribution
with 36% of respondents reporting these
rates compared to 26% in the private sector.
Contractor Review
0%
10%
20%
30%
40%
50%
60%
Contractor Movement in Remuneration
2010
2009
2008
©Arras People 2011
0%
5%
10%
15%
20%
PMBR - Day Rate Spread - All by Sector
All Private Public©Arras People 2011
©Arras People 2011 www.arraspeople.co.uk Page 22

It will be interesting to see what happens to
the public sector rates over the next 12
months as spending tightens as it has done
already in the private sector.
When gender is taken into account 49% of
females report a day rate £349 or less
compared to 27% of the male respondents,
an 11% increase over last year when it was
38%.
For rates £500 to £749 there were 15% of
the female group (down 20%) compared to
33% of the males. The most consistent
grouping being £350 to £549 where there
were 42% female compared to 46% of the males.
Whilst these are interesting changes, it may
be in part due to the distribution of gender
across roles. As we can see in the table be-
low the PMO Support and Management
group has 62% of respondents reporting
day rates of up to £349 per day compared
to 46% last year.
The graph to the right, shows the project
managers which is the largest data group,
we can see that the peaking profile is very
similar which would rule out gender bias on
rates and we can see a lower number of
female practitioners operating at the higher
day rates. Beyond this and the possible
role factor, it is not possible to establish detailed reasons from the data sample for these
changes.
The table above shows the reported distribution of day rates by respondents against the major
job functions. Detailed plots of this data can be seen in the latter sections where comparisons
are made with previous year’s data to show overall trends at the function level.
Contractor Review
Contractor Day Rates 2010 - BY Role
Day Rate Achieved All Prog. Mgr Change Mgr Project Mgr Support
< £149 4% 2% 6% 2% 13%
£150 to £199 5% 0% 0% 7% 10%
£200 to £249 5% 2% 2% 4% 18%
£250 - £299 7% 3% 8% 6% 15%
£300 - £349 11% 7% 4% 17% 5%
£350 - £399 9% 10% 4% 10% 10%
£400 - £449 11% 10% 12% 12% 8%
£450 - £499 13% 12% 8% 17% 5%
£500 - £549 11% 12% 16% 11% 5%
£550 - £599 6% 7% 14% 3% 10%
£600 - £649 6% 8% 10% 5% 0%
£650 - £699 2% 5% 4% 1% 0%
£700 - £749 4% 8% 6% 2% 0%
£750 - £999 4% 10% 6% 2% 0%
>£1,000 1% 2% 2% 0% 0%
0%
5%
10%
15%
20%
PMBR - Day Rate Spread - All by Gender
All Male Female©Arras People 2011
0%
5%
10%
15%
20%
25%
Project Manager - Day Rates
Project Mgr Male Female©Arras People 2011
©Arras People 2011 www.arraspeople.co.uk Page 23

Contract Availability
Once again for long periods during 2010 many contractors found the availability of work a
challenge along with the reduced rates that were available for new contracts.
As we can see in the table to the right, 46% of
contractors reported that the number of contracts
available decreased, down on 2009, but still a long
way from the 24% recorded in 2007. The numbers
finding the market stable was back to 2008 levels
whilst those finding increased opportunity rose by 5%
to 13%, which is good news.
Typical contract durations are shown in the table to
the right which once again show 3 to 6 months with
the highest response. Those receiving 6 to 12 month
contracts are back up to 2007/8 levels at 47%, which
is a positive sign.
When asked about their position moving into 2011,
43% of the respondents reported that they have more
than 3 months contract work in hand which again is
approaching the 2008 level of 45%. The number of
respondents reporting no contract at the start of 2011
is still high at 34%, but this is a 10% decrease on last
year’s response.
Contractor Challenges for 2011
When asked about the biggest challenge that
they face looking forward to 2011 contractors
once again identified lack of opportunity at the
top of the list, though significantly lower than
the last two years at 54%. Concerns about
falling rates are on the increase again
registering 15%. Following a spate of
conversations during 2010 we also added
Ageism to the list and this registered third with
12% of contractors identifying this as their biggest issue. When split down across sector this
dropped to 10% for those engaged in the public sector, rising to 14% in the private sector.
Across gender 13% of males saw this as their biggest challenges which for females it came in
at 8%.
Other comments left by contractors included:
• "A combination of sector blindness creating lack of opportunity; with ageism/
sexism (still allowed for contractors) and falling rates."
• “Sector specific experience is an issue as it acts as an immovable barrier; when
you get in I find that sector specific experience should not have been required.
If you continue to recruit from the same sector you recycle the same ideas
views & approaches”
• "Current extremely low level of rates"
• "Market flooded by newly released project managers"
• "Contract not being terminated in light of the spending review."
Contractor Review
During the year contract availability
2010 2009 2008
Decrease 46% 63% 46%
Stable 32% 18% 35%
Increase 13% 8% 8%
During the year typical contract length w as:
2010 2009 2008
1 to 3 Months 22% 23% 19%
3 to 6 Months 31% 35% 34%
6 to 9 Months 22% 19% 22%
9 to 12 Months 25% 22% 25%
I am starting the year w ith:
2011 2010 2009
No Contract 34% 44% 41%
< 3 Months 23% 20% 22%
3 to 6 Months 27% 26% 25%
> 6 Months 15% 10% 11%
Biggest challenge 2011 2010 2009
Lack of opportunity 54% 72% 69%
Falling Rates 15% 13% 14%
New Legislation 3% 4% 4%
Ageism 12%
Training Costs 4% 2% 3%
Other 11% 9% 10%
©Arras People 2011 www.arraspeople.co.uk Page 24

The following section reviews the Employee responses to questions posed in the survey about
their working conditions during 2010 and their views looking forward into 2011.
Employee Demographics
Of the employees who responded to the survey 87% are in permanent positions, 4% in
temporary roles and 9% in fixed term positions: figures that match those seen in 2008 and
showing that during 2010 the number of permanents rose by 4% whilst fixed term positions fell
by the corresponding amount. In terms of public:private split we have 60%:36% with 4% in
the charity/NFP sector.
The number of respondent who have been in their position less than one year is up on last year
by 5% to 27%, but this is still 4% lower than 2008. Employees who have been in position for
more than 3 years remained constant at 43%, both these figures support the general
consensus that there is lower level of churn in the employment market with longer serving
employees sticking with employees rather than entering the job market.
Respondents who have moved from contracting to permanent employment is once again up by
1% to 8%, a small increase, but over the last three years this figure has been slowly increasing
again reflecting tough conditions for many contractors.
Salary increases?
As can be seen in the graph to the right
2010 was once again a year when base
salaries did not make significant changes
compared to the previous two years. 38%
of employees reported that their base
salary did not change in 2010, with a
further 11% saying that they saw an actual
fall. So 49% of employees saw a negative
impact when inflation is taken into account,
the good news being that this figure was
60% in 2009!
On the up side, 34% of employees saw
their base salary rise between 1-5%, with
17% seeing increases over 5%, an 11%
increase on the 2009 figures.
Employee Salary Levels
The graph to the right shows the spread of
base salaries by sector in 2010 as reported
by the respondents. As we can clearly see
the public sector practitioners peak in the
£30 to £40K band with 36% of the
respondents, whereas the private sector
peaks at the £40 to £50K band with 26% of
the respondents. For the over £60k the
private sector reports more practitioners
with 24%, compared to 10% of public
sector respondents.
Employee Review
0%5%
10%15%20%25%30%35%40%45%50%
Employee Movement in Remuneration
2010
2009
2008
©Arras People 2011
0%5%
10%15%20%25%30%35%40%
PMBR - Salary Spread - All by Sector
All Private Public©Arras People 2011
©Arras People 2011 www.arraspeople.co.uk Page 25

When we compare the employee salaries by
gender we can again see significant
differences.
Firstly the female bands peak at the £30 to
£40K band with 34% of the respondents,
whereas the male practitioners data forms
at plateau across the £30 to £50K band,
with 47% of the respondents.
Once over £50k, the male respondents
report more practitioners with 40% in the
higher earning brackets, compared to 15%
of the female respondents.
When we look specifically at the
respondents who classify themselves as
Project Managers we get the salary
distribution shown in the graph to the right.
Under the £30K the distribution is very
similar across gender. In the £30 to £40K
band there are 14% more females at 43%
compared to 29% for the male
respondents. Numbers are equal at the £40
to £50k band at 26%, then once over £50k,
the male respondents report more
practitioners with 30% in the higher earning
brackets, compared to 12% of the female
respondents.
Once again the responses to the question on base salary for employees showed the breadth of
the project management family across sector, gender and role as shown in the table below.
Detailed plots of this data can be seen in the latter sections where comparisons are made with
the data collected in previous years to show overall trends at the function level.
Employee Benefits and Bonus
Benefits such as private healthcare, company vehicle or car allowance, gym membership etc
are seen by many practitioners as a key element in their remuneration package and can
sometimes have a significant impact on the attractiveness of a new role. As we can see in the
following graphs the value of such benefits vary substantially across the project management
community and would appear to be under pressure. This year 52% of employees reported that
they get no benefits on top of base salary, by sector this was 39% (-5%) for private and 71%
(-6%) for public sector employees.
Employee Review
0%5%
10%15%20%25%30%35%40%
PMBR - Salary Spread - All by Gender
All Male Female©Arras People 2011
0%
10%
20%
30%
40%
50%
Project Manager - Salary Spread - by Gender
All PM Male PM Female PM©Arras People 2011
Salary Band All Private Public Charity/NFP Male Female Prog. Mgr Change Mgr Project Mgr Support
<£20K 3% 3% 4% 3% 2% 5% 0% 3% 3% 10%
£20 to £25k 4% 4% 5% 8% 3% 7% 1% 8% 3% 13%
£25 to £30K 11% 8% 13% 22% 8% 16% 2% 14% 10% 24%
£30 to £40k 27% 21% 36% 41% 24% 34% 11% 28% 33% 27%
£40 to £50k 23% 26% 19% 16% 23% 22% 23% 14% 26% 12%
£50 to £60k 13% 14% 13% 5% 16% 9% 17% 8% 14% 6%
£60 to £75k 11% 13% 7% 5% 14% 5% 23% 6% 8% 5%
£75 to £100k 6% 8% 3% 0% 8% 2% 15% 19% 2% 3%
>£100k 2% 3% 1% 0% 3% 0% 7% 0% 1% 1%
©Arras People 2011 www.arraspeople.co.uk Page 26
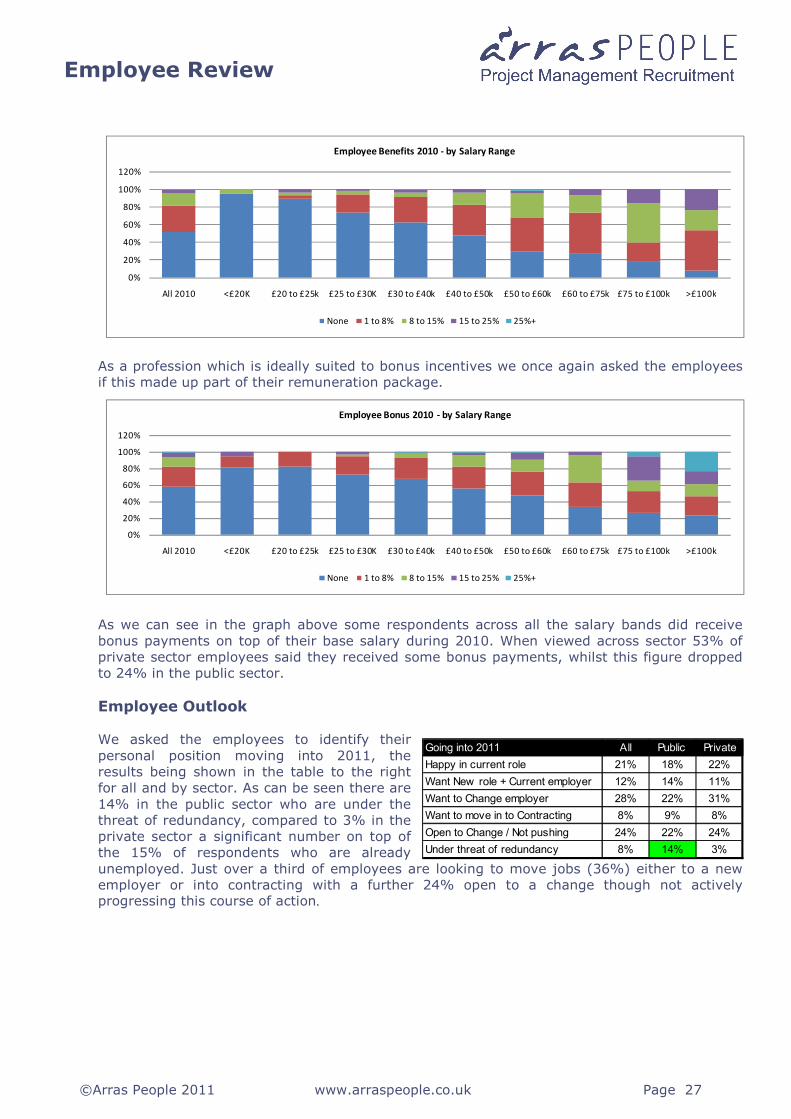
As a profession which is ideally suited to bonus incentives we once again asked the employees
if this made up part of their remuneration package.
As we can see in the graph above some respondents across all the salary bands did receive
bonus payments on top of their base salary during 2010. When viewed across sector 53% of
private sector employees said they received some bonus payments, whilst this figure dropped
to 24% in the public sector.
Employee Outlook
We asked the employees to identify their
personal position moving into 2011, the
results being shown in the table to the right
for all and by sector. As can be seen there are
14% in the public sector who are under the
threat of redundancy, compared to 3% in the
private sector a significant number on top of
the 15% of respondents who are already
unemployed. Just over a third of employees are looking to move jobs (36%) either to a new
employer or into contracting with a further 24% open to a change though not actively progressing this course of action.
Employee Review
0%
20%
40%
60%
80%
100%
120%
All 2010 <£20K £20 to £25k £25 to £30K £30 to £40k £40 to £50k £50 to £60k £60 to £75k £75 to £100k >£100k
Employee Benefits 2010 - by Salary Range
None 1 to 8% 8 to 15% 15 to 25% 25%+
0%
20%
40%
60%
80%
100%
120%
All 2010 <£20K £20 to £25k £25 to £30K £30 to £40k £40 to £50k £50 to £60k £60 to £75k £75 to £100k >£100k
Employee Bonus 2010 - by Salary Range
None 1 to 8% 8 to 15% 15 to 25% 25%+
Going into 2011 All Public Private
Happy in current role 21% 18% 22%
Want New role + Current employer 12% 14% 11%
Want to Change employer 28% 22% 31%
Want to move in to Contracting 8% 9% 8%
Open to Change / Not pushing 24% 22% 24%
Under threat of redundancy 8% 14% 3%
©Arras People 2011 www.arraspeople.co.uk Page 27

The following pages take remuneration data collected from the last three Arras People surveys.
From this we have been able to plot the trends in remuneration for the UK based Project
Management community with each graph showing the results for the years 2010, 2009 and
2008.
Roles covered on these pages are:
• Programme Manager
• Change Manager
• Project Manager
• PMO & Support
For each role we are able to plot the trends for;
• Contractor Day Rates
• Employee Base Salary
• Employee Bonus as a percentage of base salary
• Employee Benefits as a percentage of base salary
Remuneration Trends
©Arras People 2011 www.arraspeople.co.uk Page 28
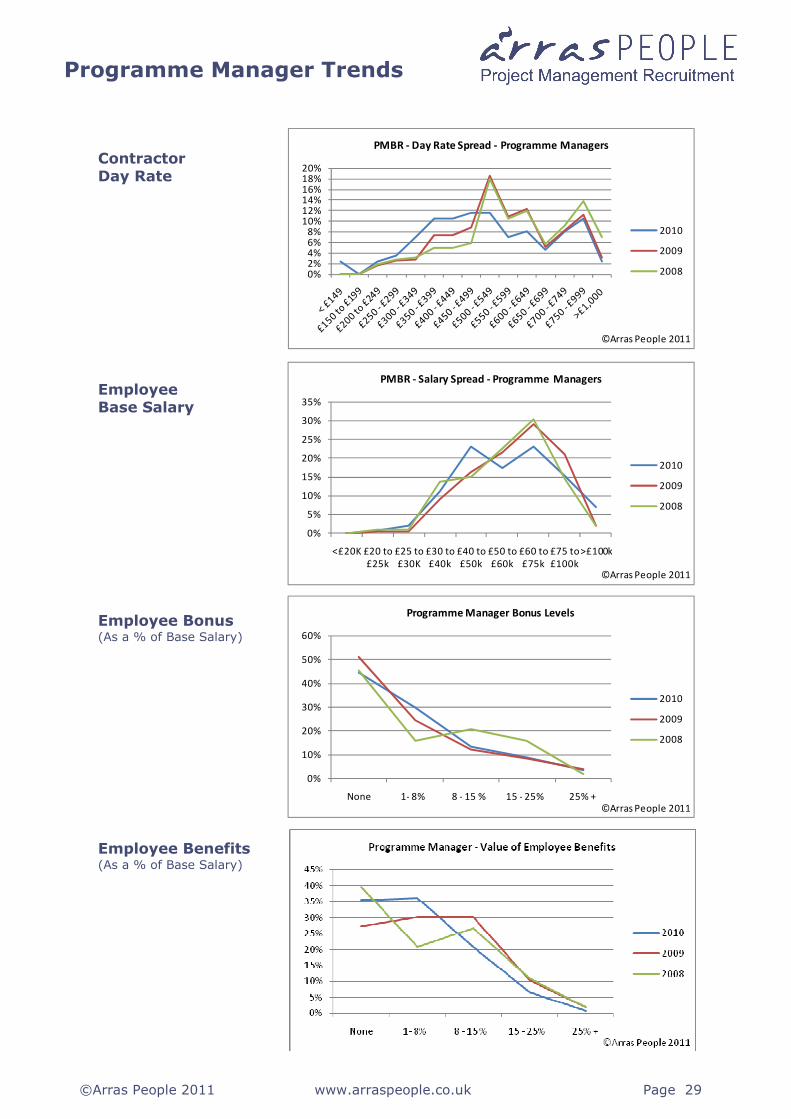
Contractor Day Rate
Employee Base Salary
Employee Bonus (As a % of Base Salary)
Employee Benefits (As a % of Base Salary)
Programme Manager Trends
0%2%4%6%8%
10%12%14%16%18%20%
PMBR - Day Rate Spread - Programme Managers
2010
2009
2008
©Arras People 2011
0%
5%
10%
15%
20%
25%
30%
35%
<£20K £20 to
£25k
£25 to
£30K
£30 to
£40k
£40 to
£50k
£50 to
£60k
£60 to
£75k
£75 to
£100k
>£100k
PMBR - Salary Spread - Programme Managers
2010
2009
2008
©Arras People 2011
0%
10%
20%
30%
40%
50%
60%
None 1- 8% 8 - 15 % 15 - 25% 25% +
Programme Manager Bonus Levels
2010
2009
2008
©Arras People 2011
©Arras People 2011 www.arraspeople.co.uk Page 29

Contractor Day Rate
Employee Base Salary
Employee Bonus (As a % of Base Salary)
Employee Benefits (As a % of Base Salary)
Project Manager Trends
0%2%4%6%8%
10%12%14%16%18%20%
PMBR - Day Rate Spread - Project Managers
2010
2009
2008
©Arras People 2011
0%
5%
10%
15%
20%
25%
30%
35%
<£20K £20 to
£25k
£25 to
£30K
£30 to
£40k
£40 to
£50k
£50 to
£60k
£60 to
£75k
£75 to
£100k
>£100k
PMBR - Salary Spread - Project Managers
2010
2009
2008
©Arras People 2011
0%
10%
20%
30%
40%
50%
60%
70%
None 1- 8% 8 - 15 % 15 - 25% 25% +
Project Manager Bonus Levels
2010
2009
2008
©Arras People 2011
0%
10%
20%
30%
40%
50%
60%
None 1- 8% 8 - 15 % 15 - 25% 25% +
Project Manager - Value of Employee Benefits
2010
2009
2008
©Arras People 2011
©Arras People 2011 www.arraspeople.co.uk Page 30

Contractor Day Rate
Employee Base Salary
Employee Bonus (As a % of Base Salary)
Employee Benefits (As a % of Base Salary)
Change Manager Trends
0%
2%
4%
6%
8%
10%
12%
14%
16%
18%
PMBR - Day Rate Spread - Change Managers
2010
2009
2008
©Arras People 2011
0%
5%
10%
15%
20%
25%
30%
<£20K £20 to
£25k
£25 to
£30K
£30 to
£40k
£40 to
£50k
£50 to
£60k
£60 to
£75k
£75 to
£100k
>£100k
PMBR - Salary Spread - Change Managers
2010
2009
2008
©Arras People 2011
0%
10%
20%
30%
40%
50%
60%
70%
None 1- 8% 8 - 15 % 15 - 25% 25% +
Change Manager - Value of Employee Benefits
2010
2009
2008
©Arras People 2011
©Arras People 2011 www.arraspeople.co.uk Page 31

Contractor Day Rate
Employee Base Salary
Employee Bonus (As a % of Base Salary)
Employee Benefits (As a % of Base Salary)
PMO Support & Management
Trends
0%2%4%6%8%
10%12%14%16%18%20%
PMBR - Day Rate Spread - PMO Support & Managers
2010
2009
2008
©Arras People 2011
0%
5%
10%
15%
20%
25%
30%
<£20K £20 to
£25k
£25 to
£30K
£30 to
£40k
£40 to
£50k
£50 to
£60k
£60 to
£75k
£75 to
£100k
>£100k
PMBR - Salary Spread - PMO Support & Managers
2010
2009
2008
©Arras People 2011
0%
10%
20%
30%
40%
50%
60%
70%
None 1- 8% 8 - 15 % 15 - 25% 25% +
PMO Support & Manager Bonus Levels
2010
2009
2008
©Arras People 2011
0%
10%
20%
30%
40%
50%
60%
70%
80%
None 1- 8% 8 - 15 % 15 - 25% 25% +
PMO Support & Manager - Value of Employee Benefits
2010
2009
2008
©Arras People 2011
©Arras People 2011 www.arraspeople.co.uk Page 32

Arras People The Project Management Recruitment Specialists
Arras House 47 York Street
Heywood
Lancashire OL10 4NN
Phone: 0845 680 6444 Fax: 0845 680 8047
Web: www.arraspeople.co.uk Email: [email protected]
©Arras People 2011 www.arraspeople.co.uk