project - arraspeople · introduction if you have any questions, comments or feedback please do get...
TRANSCRIPT

Arras People 2017
Issued February 2017
©
MANAGEMENT
arras~
PROJECTBENCHMARK
2017
APM qualifications are designed to meet your needs throughout your project management career demonstrating your knowledge, experience and commitment to the profession. Aligned to the APM Body of Knowledge 6th edition, APM qualifications remain fresh and relevant:
APM Project Fundamentals Qualification (PFQ), offers a fundamental awareness of project management terminology and is for those wishing to gain a broad understanding of the principles of the profession.
APM Project Management Qualification (PMQ), is a knowledge based qualification that allows candidates to demonstrate knowledge of all elements of project management. It is aimed at those wishing to achieve a broad level of project management knowledge. There is a special route to PMQ designed exclusively for registered PRINCE2® Practitioners
APM Project Professional Qualification (PPQ), is an examination based qualification that offers a progressive step for project professionals and provides the most comprehensive assessment of project management capability available.
APM Practitioner Qualification (PQ) is an assessment based qualification for relatively experienced professionals (project management practitioners) who can demonstrate an ability to manage a non-complex project.
PRINCE2® is a registered trade mark of AXELOS Limited
Find out more about how APM qualifications can boost your career:
apm.org.uk/APMqualifications

Introduction
If you have any questions, comments or feedback please do get back to us:[email protected]
John Thorpe, Managing DirectorArras People, 2017
In preparing this document we acknowledge that all trademarks used are the property of their respective owners. All trademarks are recognised. The copyright to the content in this document resides with Arras Services Limited and all content remains the property of Arras Services Limited. Unauthorised Reproduction is Prohibited.
Arras People 2017© www.arraspeople.co.uk
arrasPEOPLE~
Welcome to the 2017 Arras People Project Management Benchmark Report (PMBR).
The 2017 Project Management Benchmark Report is our twelfth annual report on the Project Management domain and once again our thanks go out to all the practitioners who contributed to the dataset, by completing our online Census.
We have had our regular contributors, many of whom have supported us over all the years, along with many new practitioners which is always great to see. Without these people taking the time to contribute, we would not be able to collate the data and paint this unique, unbiased view of the project management domain.
2016 was an interesting year with ‘Project Fear’ failing to dissuade the UK’s voters from returning a Brexit vote; a new Prime Minister installed and then the election of Donald Trump as the President-elect of the United States of America.
At the same time the forecasted end of the world did not materialise, the UK economy confounded the experts post Brexit after stagnating in the first six months due to the economic uncertainty. The pound fell, the stock market’s rose, employment rose, unemployment rose, inflation rose and interest rates dropped again.
2017 looks set to deliver more instability, with the triggering of Article 50 to commence the formal process of the UK’s withdrawal from the European Union being just one of the many events that will initiate further change.
With this as the backdrop, the report is underlined by continuing austerity in the public sector and mixed fortunes in the private sector. 2016 delivered much of the same for many practitioners in terms of low, if any rises in living standards and many challenges for those working as contractors; a picture that does not look set improve in 2017.
However, the spirits remain high for the majority as we head forwards into more change, the very lifeblood of the project management domain.
I hope you enjoy the report and find it a useful benchmark for the year ahead.

C
M
Y
CM
MY
CY
CMY
K
Planview-Advert-PMO-Benchmark-Report-2017-B-outline-cmyk.pdf 1 1/17/2017 11:51:03 AM

Table of Contents
Arras People 2017© www.arraspeople.co.uk
About the Survey...................................................................................... Page 1Role, Age and Gender............................................................................... Page 2Chartered Status...................................................................................... Page 3Off-Payroll Workers.................................................................................. Page 5Career Breaks........................................................................................... Page 7PPM Accreditation................................................................................... Page 8PPM Domain and Gender......................................................................... Page 9PPM - Career of First Choice.................................................................... Page 11Unemployed PPM Practitioners............................................................... Page 12UK Economic Climate............................................................................... Page 13UK Living Standards and Confidence........................................................ Page 14UK Remuneration Patterns....................................................................... Page 15UK Contractor Overview........................................................................... Page 16Employee Overview.................................................................................. Page 18Actual Remuneration................................................................................ Page 20Programme Manager................................................................................ Page 21PPM Consultant........................................................................................ Page 22Portfolio Manager..................................................................................... Page 23Project Manager....................................................................................... Page 24Change Manager....................................................................................... Page 25PMO Manager.......................................................................................... Page 26Project Support........................................................................................ Page 27
arrasPEOPLE~

arrasPEOPLE~
©Arras People 2017 www.arraspeople.co.uk Page 1
About the Survey
The data used to create the Arras People 2017 Project Management Benchmark Report was collected during the months of December 2016 and January 2017, through an on-line survey which was marketed as the Arras People 2016 Project Management Census. This was an open survey and respondents were invited through social media channels, direct invite and the Arras People newsletter. Once again, the survey attracted responses from a global audience which totalled 2,021 with the majority identifying themselves as UK based PPM Practitioners.
Relationship to Arras:
In terms of the validity of the data set we are happy to report that the breadth of respondents was again wide and included a mix of practitioners who have a record in the Arras People candidate database; those who do not and those who chose to remain anonymous. This mix gives us the confidence that we are not just surveying job seekers and the data provides a valid cross-section of the UK PPM practitioner community.
Respondent Status:
As is shown in the table to the right respondents were segmented during the early phase of the survey. This allowed us to present different question sets to them and ensure that the responses/analysis represents a true PPM Practitioner view.
Our experience over the twelve years of producing the PMBR has shown that effective segmentation is critical if results are to be representative of the PPM community. The field of PPM is so broad that without effective segmentation the results will be too generic or out of context, a feature we often see in reports which attempt to paint a picture of the PPM domain.
PPM Practitioners:
The PPM practitioner group of respondents were split 76% to 24% in terms of those who are UK based versus the rest of the world (ROW).
In terms of the UK based respondents 86% were UK Nationals, 10% EU Nationals and 4% Non-EU nationals.
As can be seen in the Fig. 3 to the right, the Project Managers made up the largest group within the overall practitioner set for both the UK (39%) and the ROW (43%).
Respondent Status 2016 2015 2014 PPM Practitioner - UK Based 71% 69% 68% PPM Practitioner - Non UK 17% 16% 23% PPM Aligned 5% 6% 3% Career change to PPM / Student 6% 6% 5% PPM Recruiter /Manager 1% 2% 1%
Fig 2 - Breakdown of Respondents
Fig 3 - PPM Practitioner Response
0% 5% 10% 15% 20% 25% 30% 35% 40%
Project Manager
Programme Manager
Prog/Proj Mgt Consultant
Prog/Proj Office Manager
Portfolio Manager
Prog/Proj Support
Change Manager
Analyst
Planner
PPM Practitioner's By Role
UK ROW
Respondent Relationship 2016 2015 2014 Current Candidate Database 38% 35% 16% Non Candidate Database 40% 50% 56% Anonymous 22% 15% 28%
Fig 1 - Respondent Status

arrasPEOPLE~
©Arras People 2017 www.arraspeople.co.uk Page 2
0% 5% 10% 15% 20% 25% 30%
EuropeNorth America
Sub-Saharan AfricaAsia
Australia and OceaniaMiddle East and North Africa
South AmericaCentral America and the…
Location of Non UK PPM Practitioners
2016
Role, Age and Gender:
We again used the role categories which can be seen in the Figure to the right in order to sub-divide the PPM practitioners for detailed analysis. Within each category such as Project Manager, we saw a breadth of job titles such as Agile PM and IT PM but for the purposes of this report no sub-group was large enough to warrant its own analysis.
In terms of overall spread we saw a slight decline in both Project and Programme Managers as a percentage of the UK Practitioner group, with a corresponding increase in roles around the PMO.
In terms of age distribution there has been no significant change as can be seen in the table to the right.
By gender, we again saw a slight increase in the number of female respondents though there is no significant movement from the 70:30 split which we have seen on a consistent basis.
Geographical Distribution:
In terms of UK based practitioners, London was again the largest cohort accounting for 25% of our respondents. When considered with those living in the Home Counties and the South East they again accounted for over 50% of the total response set.
In terms of the rest of the UK, the South West and the Midlands maintained their positions as vying for the second hotspot for Project Management outside of London and its surrounding areas with both contributing 11% each.
The much-vaunted Northern Powerhouse has not had any impact on the survey at this point with the Northwest and Yorkshire seeing static responses with 9% and 5% respectively.
In terms of the rest of the world, we saw an increase of 9% in the number of practitioners taking part in this year’s survey.
As a percentage, practitioners living in Europe made up the largest set with 27%, closely followed by those living in Sub-Saharan Africa at 24%.
In terms of individual countries, the top three contributors were South Africa which contributed 19%, followed by the USA at 11% and Australia at 7%.
Role 2016 2015 2014 Project Manager 39% 43% 43% Programme Manager 16% 19% 20% PPM Consultant 12% 12% 7% PPM Office Manager 12% 10% 14% Change Manager 4% 3% 3% PPM Support 7% 5% 5% Portfolio Manager 7% 5% 6% Analyst 2% 2% 1% Planner 1% 1% 1%
Age Group 2016 2015 2014 Under 34 17% 16% 16% 35 to 49 44% 46% 44% 50+ 38% 37% 38% Not disclosed 1% 1% 1%
Gender 2016 2015 2014Male 68% 71% 73%Female 31% 29% 26%Not disclosed 1% 1% 1%
Fig 4 - Role, Age & Gender of UK Based PPM Practitioner Respondents
0% 5% 10% 15% 20% 25% 30%
London
Anglia
Home Counties
Midlands
North East
North West
Northern Ireland
Scotland
South East
South West
Wales
Yorkshire
UK Based Practitioners - Home Location
2014 2015 2016
Fig 5 – Home Location UK Based PPM Practitioners
Fig 6 – Location of Non-UK Based PPM Practitioners

arrasPEOPLE~
©Arras People 2017 www.arraspeople.co.uk Page 3
Fig 8 - Chartered Status Importance - UK Based Practitioners
Fig 9 - Chartered Status Importance - UK Based Practitioners
Chartered Status
Following the announcement in October 2016 that the Privy Council had issued an Order of Grant, which triggered the process which will see the APM (Association for Project Management) awarded a Charter; we took the opportunity to ask our respondents about this decision which occurred just short of 10 years after the process began.
We asked all resondents a simple question, “How important do you think this step is for the Project Management domain?” and then gave the opportunity to add their comments.
46% of our respondents felt that this was either Extremely or Very important. (same % for All and UK)
27% of of our respondents felt that this was either Moderately or Slightly important. (32 % for UK)
26% of of our respondents felt that this was either Not at All important or were Unaware. (23 % for UK)
Across the many cuts such as gender, sector and role there were slight variances around these levels as would be expected but nothing that jumped out as significant.
Some larger variances were found when the data was cut by age, with the under 50’s showing a higher level of positivity than those aged 50+ . Interestingly the 50+ respondents had lower levels of those who were unaware and higher levels (x2) who expressed the opinion that it is Not at All important.
Industry Impact:
The most noticable differentials were seen when we looked at the responses based on the industry in which the UK practitioners are working. As can be seen in Figure 9, we identified the top 15 Industries in which the respondents are currently working and then plotted the responses.
The data when cut this way offers up something that is of great concern in terms of where the support of importance is coming from. The top levels of support by Industry could almost be a heatmap of where the APM is recognised and has focus/traction. By contrast these are not the Industry sectors where the greater population of PPM practitioners are going about their work!
Most worrying in this digital age, IT – Software development has the lowest levels of support and the highest levels of ‘Not at All’ and ‘Not aware’.
0% 20% 40% 60% 80% 100%
(6) IT - Software development
(8) Government - Local
(14) Logistics, Transport &…
(2) IT - Products or Services
(1) Financial Services -…
(12) Utilities
(4) Government - Central
(3) Business or Professional…
(5)Private Sector - Other
(10) Manufacturing
(9) Telecoms
(13) Automotive/Engineering
(15) Education/Academia
(7) Building & Construction
(11) Aerospace/Defence
Charted Status Importance - By Industry (UK)
Extremely Very Moderately
Slightly Not at All Not Aware
Fig 7 – Chartered Status Importance - UK Based PPM Practitioners
0% 20% 40% 60% 80% 100%
Female
Male
Charted Status Importance - By Gender (UK)
Extremely Very Moderately
Slightly Not at All Not Aware
0% 20% 40% 60% 80% 100%
PhDMasters Degree
Bachelors DegreeHND/HNC or Equivalent
VocationalCollege/Further Education
High School
Charted Status Importance - UK By Education level
Extremely Very Moderately
Slightly Not at All Not Aware

arrasPEOPLE~
©Arras People 2017 www.arraspeople.co.uk Page 4
The breakdown across industry seen in Figure 9, is also reflective of the data issued by the APM in their Salary and Market Trends Surveys (2015/2016) which show Aerospace & Defence and Building & Construction as their two largest sectors accounting for 25% of respondents compared to 7.8% in the PMBR and broadly reflects their membership. Whilst the fact that Financial Services – Banking/Insurance consistently top the Industry listing in the PMBR (11%), it is not driven by the Arras People business activities, as this industry sector has never accounted for more than 5% of turnover.
The Chartered Challenge:
In many ways the journey is just about to begin and the APM have many challenges ahead as they look to implement the procedural, legal and accounting transition to re-constitute itself as a Chartered body. Not only will there be the need for internal change, but the needs and wants of the stakeholders will need to be addressed as will the wider challenges of meeting its obligation of working in the public interest.
Along with their commitment to raise standards of project delivery, enhance the status of the profession to improve our economy and society, and facilitate collaboration and research to develop the practice and theory of delivering beneficial change, they will also need to settle on the criteria for admission to its planned register of Chartered project professionals.
A broad selection of comments from respondents below help paint the picture:
“Regarding the above question ... providing membership focuses on those that do not just have theoretical knowledge that can be gained from text books and classrooms. Most of the poorly performing PMs I have experience of have multiple accreditations and qualifications but can't actually deliver anything useful because they do not understand how to implement into a human environment with all the complexities that brings with it. I keep my accreditations up to date because I need to to get through any sift ... I actually think they add little or no value!”
“It will provide a much clearer understanding of PPM professionalism to the wider population and to recruiters and senior managers”
“It is a great move and much needed however in doing so APM needs to transform itself and position to be the go to body for things related to Project, Programmes, Portfolios and Organisational Change.”
“Really pleased about this. But Chartered Project Professional doesn't sound very sexy….”
“I have been involved with 2 other bodies getting chartered status. In both cases it was hard to keep the enthusiasm for qualifying as a chartered member high after about 18 months. The APM needs to plan ahead for this dip.”
“I hope that it will enable APM to become more active in the PM community across more organisations to aid, develop and learn more about PPM.”
“Getting chartered MUST cover the full range of types and levels of project management. It cannot just play to the traditional types of project management - must represent change managers, analysts, agile etc..”
“Important for those in it. I doubt it will be of great importance to those outside it.”
“Just means a gravy train for the APM ! they make enough already from….”
“I prefer the Project management approach taken by the PMI and see the chartership of APM which is very UK based as a retrograde step and an opportunity missed.”
“If you're into badge collecting I'm sure this is good news; however I'm not much of a Blue Peter fan.”
As a broad church, the field of Project Management has a broad stakeholder group and many challenges, lets hope that it is remembered that the Charter is for Project Management and not just Project Managers.

arrasPEOPLE~
©Arras People 2017 www.arraspeople.co.uk Page 5
Off-Payroll Workers
2017 is set to see another significant change as the UK Government presses ahead with its changes to the working landscape in the Public sector. In an unprecedented change the Government is looking to overwrite elements of both Employment Law and Company Law by using the Tax Laws to change the way workers are treated when working in the Public sector. A change scheduled for 5th April 2017, though it is yet to pass through Parliament.
The change will mean that contractors operating through a limited company and deemed to be a PSC (Personal Services Company) will no longer be in control of deciding if their assignments are caught up by the IR35 legislation. Instead, the hiring organisation will have to make the decision about the status of all roles offered. Based upon that decision, any contractor that accepts a position that is deemed as “within the legislation” will have their invoices subjected to PAYE deductions at source as well as Employers National Insurance becoming due. They will be deemed under Tax laws to be Employees, but accrue no Employment rights as per Employment legislation. The liability for deduction and payment of all money due will fall upon the organisation paying the PSC, be that the hiring organisation, an Agency or any other third party.
This is a significant change that will impact the UK’s PPM practitioners and the organisations that hire them so we thought it worthy of inclusion in this year’s PMBR.
The Hirers View:
Why do you use Off-Payroll Workers Total Allows the business to flex its workforce based on demand 64% Easier to hire and fire - No long term commitment 57% Gives access to key skills that are not available within the business 50% Cheaper than taking on employees 21%Fig 10 - UK use of OPW
Level of Concern about Proposed Changes Private Public 3rd SectExtremely concerned 25% 33% 0%Very concerned 0% 33% 0%Moderately concerned 38% 0% 33%Slightly concerned 0% 0% 33%Not at all concerned 0% 0% 33%Not aware of this 38% 33% 0%Fig 12 - UK Concern OPW
Impact of Proposed Changes Total Increased costs 67% Loss of staffing flexibility 33% Reduction in available talent pool 33% Additional administrative burden 22% Contractors leaving current assignments 22% None 11%Fig 11 - UK OPW Concerns
We asked those responsible for hiring PPM practitioners a number of questions to understand their current thinking about the proposed changes in legislation the results of which can be seen in the tables to the right hand side.
Overall 76% of the respondents indicated that their organisations use Off-Payroll workers (Contractors/Freelancers) of which 64% unsurprisingly indicated that they do so as it allows them to flex their workforce based upon levels of demand. This coupled with the fact that the workers engaged in this manner come with no long term commitment (57%) and provide access to key skills that they do not have in their business (50%).
In terms of engagement methods we saw similar levels between those engaging directly and those using the services of an Agency.
When asked about the potential impact of the changes on their organisations, increased cost (67%) came out on top of the pile as the legislation will potentially have direct as well as indirect costs. Loss of flexibility and a reduction in the available talent pool came next, both with 33% a major concern for the Public sector as contractors will potentially have the option of moving into the Private sector.
Levels of concern were naturally higher within the Public sector where the implementation is planned to happen. Whilst 66% being concerned is not unexpected, 33% being unaware of this significant change is a major concern and possibly indicates that the preparation for implementation is not at a level required to meet the April 2017 deadline that the Government has decided upon.
arrasPEOPLE~
©Arras People 2017 www.arraspeople.co.uk Page 6
Fig 14 – OPW Anticipated Impact
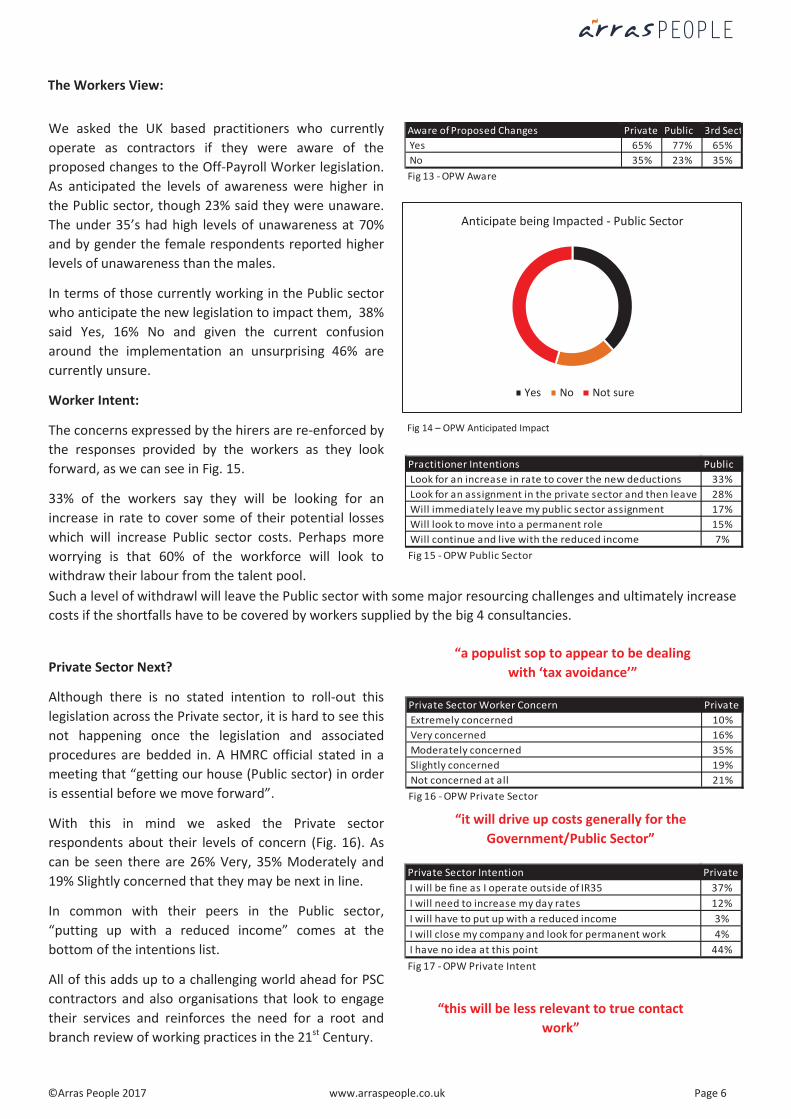
The Workers View:
Anticipate being Impacted - Public Sector
Yes No Not sure
Aware of Proposed Changes Private Public 3rd Sect Yes 65% 77% 65% No 35% 23% 35%Fig 13 - OPW Aware
Practitioner Intentions Public Look for an increase in rate to cover the new deductions 33% Look for an assignment in the private sector and then leave 28% Will immediately leave my public sector assignment 17% Will look to move into a permanent role 15% Will continue and live with the reduced income 7%Fig 15 - OPW Public Sector
Fig14 – Public Sector Impacted
Private Sector Worker Concern Private Extremely concerned 10% Very concerned 16% Moderately concerned 35% Slightly concerned 19% Not concerned at all 21%Fig 16 - OPW Private Sector
Private Sector Intention Private I will be fine as I operate outside of IR35 37% I will need to increase my day rates 12% I will have to put up with a reduced income 3% I will close my company and look for permanent work 4% I have no idea at this point 44%Fig 17 - OPW Private Intent
We asked the UK based practitioners who currently operate as contractors if they were aware of the proposed changes to the Off-Payroll Worker legislation. As anticipated the levels of awareness were higher in the Public sector, though 23% said they were unaware. The under 35’s had high levels of unawareness at 70% and by gender the female respondents reported higher levels of unawareness than the males.
In terms of those currently working in the Public sector who anticipate the new legislation to impact them, 38% said Yes, 16% No and given the current confusion around the implementation an unsurprising 46% are currently unsure.
Worker Intent:
The concerns expressed by the hirers are re-enforced by the responses provided by the workers as they look forward, as we can see in Fig. 15.
33% of the workers say they will be looking for an increase in rate to cover some of their potential losses which will increase Public sector costs. Perhaps more worrying is that 60% of the workforce will look to withdraw their labour from the talent pool.
Such a level of withdrawl will leave the Public sector with some major resourcing challenges and ultimately increase costs if the shortfalls have to be covered by workers supplied by the big 4 consultancies.
Private Sector Next?
Although there is no stated intention to roll-out this legislation across the Private sector, it is hard to see this not happening once the legislation and associated procedures are bedded in. A HMRC official stated in a meeting that “getting our house (Public sector) in order is essential before we move forward”.
With this in mind we asked the Private sector respondents about their levels of concern (Fig. 16). As can be seen there are 26% Very, 35% Moderately and 19% Slightly concerned that they may be next in line.
In common with their peers in the Public sector, “putting up with a reduced income” comes at the bottom of the intentions list.
All of this adds up to a challenging world ahead for PSC contractors and also organisations that look to engage their services and reinforces the need for a root and branch review of working practices in the 21st Century.
“a populist sop to appear to be dealing with ‘tax avoidance’”
“it will drive up costs generally for the Government/Public Sector”
“this will be less relevant to true contact work”

arrasPEOPLE~
©Arras People 2017 www.arraspeople.co.uk Page 7
Fig 19 – CB Age Compare
Career Breaks
As a recruiter we often have discussions with candidates about returning to work after a career break or have to spend time unravelling candidates CV’s as they try to hide the fact they have had one! So, this year we decided to ask our respondents some questions that may help lift the lid on this apparently tricky subject.
Taken Career Break > 3 Months Female Male All Yes 25% 24% 24% No 75% 76% 76%Fig 18 - CB Taken
0% 20% 40% 60% 80% 100%
Under 30
30 to 34
35 to 42
43 to 49
50 to 59
60+
Age and Career Break
Yes No
Why did you have Career Break Female Male All To take a well earned break 27% 34% 32% To Travel 32% 27% 29% Education/Self development 17% 22% 21% Raising a family (childcare) 27% 9% 15% To care for family (sickness) 12% 11% 12% A sabbatical 6% 14% 12% To build/renovate a property 7% 13% 11% Other 5% 10% 9% Voluntary/Charity work 7% 6% 7% Health & Medical reasons 1% 6% 4% To write a book 1% 3% 2%Fig 20 - CB Why
How long a Career Break Female Male All 6 months or less 43% 55% 51% 7 to 12 months 37% 28% 31% 1 to 2 years 17% 12% 14% 2 to 5 years 2% 5% 4% More than 5 years 0% 1% 0%Fig 21 - CB Duration
Did CB have a long term impact? Female Male All Yes 28% 37% 34% No 53% 47% 49% Not sure 19% 16% 17%Fig 22 - CB Impact
Long Term Impact was: Female Male All Negative 72% 38% 46% Positive 28% 62% 54%Fig 23 - CB Impact was
We started by identifying the UK based practitioners who have taken a career break of 3 months or more which provided a 24% response in the affirmative, a figure that was similar across gender.
Breaking this data by age group as we can see in Fig. 19, the levels of those who have taken a career break as a percentage of the total increase with age.
When looked at by age and gender the results show an interesting distribution change in the 35-42 group where females having taken a career break increases to 25% compared to 14% for males. Similarly we see a significant difference in the 43-49 grouping where females having taken a career break increase to 31% compared to 23% for males. Those under 30 and over 60 also record a difference with males having taken a career break recording a higher frequency than their female peers.
Reason for Career Break:
We asked why practitioners have taken a career break (Fig. 20) and can see an interesting spread of reasons and combinations. As anticipated the female practitioners reported childcare and caring significantly higher than their male peers with these two categories accounting for 40%, compared to 20% for the males. At the other extremes males recorded higher levels than females when it comes to sickness and building/renovating property.
Long term impact on career:
We asked practitioners if they felt their career break had had a long term impact on their career which reported 37% of males saying yes compared to 28% of females.
Analysis of the comments that explained this impact into either positive or negative, 78% of females suggest that it was negative compared to 38% of males. Of these females 71% took a break to raise a family.
The other major negative expressed by respondents was the suspicion both agencies and employers have around career breaks and the difficulties restarting a career. On the positive side practitioners felt they came back to the workforce refreshed for the work ahead.

arrasPEOPLE~
©Arras People 2017 www.arraspeople.co.uk Page 8
PPM Accreditation
Over the many years that we have been producing the PMBR we have tracked the most popular PPM accreditations that our practitioner respondents have been collecting. By way of a change, this year we decided to ask our respondents to identify their most valuable accreditation and which accreditation they would most like to have.
As Fig. 24 shows, the number of practitioners with no PPM accreditations remains constant for both the UK and the Rest of the World (RoW). The Axelos stable of PPM accreditations come in at number one for the UK with PMI (Project Management Institute) at number one for the RoW. Interestingly the percentage for most valued are significantly lower than the previous figures returned for those that have attained accreditations, and 10% of those with PPM accreditations in the UK do not see any as most valuable.
Most Valued?
As we can see in Fig. 25, the UK based practitioners responses reflect the major providers of PPM accreditation in the UK with Axelos, APM and PMI all in the top five. Looking across the PPM role categories the Axelos offerings have a significantly higher rating than any other offering. The table may also offer suggestions where gaps appear in each stable offerings in terms of POM (Programme/Project Office
Manager) and CM (Change Managers). The CM’s are an interesting case with 23% saying none are valued and Lean/6 Sigma and Prosci have a higher showing.
Breaking the Axelos and APM offerings down into individual titles we can see that PRINCE2 is top of the list for all practitioners with the exception of PgM (Programme Managers) who chose MSP. Agile returns are unexpectedy low across the board, given the hype being generated within the project management domain over the last few years.
For the APM offerings we see levels much lower than the Axelos products in terms of most valuable. One point of interest being RPP (Registered Project Professional) which has higher returns for PfMgr (Portfolio Manager) and Con (Consultants) who presumably are looking to attain Chartered Status.
Most Wanted?
As we can see in Fig. 28, the UK based practitioners still have a desire for further accreditation over and above those they already have. Agile accreditation makes a showing in this table but still the potential demand is not overly significant when compared to the traditional areas of accreditation. The RPP from APM is also suprisingly low.
Provider PfMgr PgM PM POM Con CM Axelos 37% 46% 45% 51% 43% 19% No PPM Accreditation 14% 15% 19% 7% 17% 19% APM 12% 13% 15% 11% 11% 8% None valued 14% 11% 6% 12% 9% 23% PMI 5% 4% 6% 8% 6% 2% Other 4% 5% 2% 2% 4% 8% Agile 2% 1% 2% 1% 3% 0% Masters 3% 2% 1% 3% 1% 2% MBA 3% 1% 0% 1% 2% 2% Mix 2% 0% 1% 1% 1% 0% Lean 0% 0% 0% 1% 1% 8% APMG 1% 0% 0% 1% 0% 4% Prosci 0% 0% 0% 0% 0% 8%Fig 25 - Most valued PPM Accred by Role
Provider UK RoW Axelos 42% 14% No PPM Accreditation 17% 22% APM 12% 1% None valued 10% 7% PMI 6% 35% Other 4% 8% Agile 2% 2% Masters 2% 2% MBA 1% 0% Mix 1% 0% Lean 1% 0% APMG 1% 0% BCS 1% 0% Degree 1% 0%Fig 24 - Most valued PPM Accred
Axelos Provided PfMgr PgM PM POM Con CM PRINCE2 12% 18% 39% 21% 25% 13% MSP 8% 24% 4% 13% 14% 4% P30 9% 0% 0% 13% 0% 0% MoP 6% 0% 0% 3% 1% 0% ITIL 0% 0% 0% 0% 1% 2% MoR 2% 1% 0% 0% 1% 0% P2 Agile 0% 0% 0% 1% 1% 0% MoV 0% 1% 0% 0% 0% 0% No PPM Accreditation 14% 15% 19% 7% 17% 19%Fig 26 - Axelos PPM Accred by Role
APM Provided PfMgr PgM PM POM Con CM APMP 3% 3% 8% 5% 2% 6% APM 1% 4% 4% 1% 4% 0% CAPM 0% 0% 0% 0% 1% 0% MAPM 3% 3% 1% 3% 1% 0% PMQ 0% 0% 1% 1% 1% 0% PQ 0% 0% 0% 0% 0% 2% RPP 4% 2% 1% 1% 3% 0% No PPM Accreditation 14% 15% 19% 7% 17% 19%Fig 27 - APM PPM Accred by Role
Area of Study PfMgr PgM PM POM Con CM None 31% 38% 23% 26% 24% 40% Programme 4% 14% 7% 5% 6% 8% Agile 5% 2% 10% 5% 8% 2% PRINCE2 4% 3% 6% 3% 4% 2% PMP 1% 3% 7% 3% 4% 0% P30 5% 0% 1% 22% 2% 0% Other 2% 6% 3% 5% 4% 6% Portfolio 17% 4% 0% 4% 4% 0% APMP 0% 0% 2% 2% 4% 2% RPP 3% 2% 2% 2% 1% 0%Fig 28 - Desired Accreditation

arrasPEOPLE~
©Arras People 2017 www.arraspeople.co.uk Page 9
Fig 29 – UK Practitioner Gender Bias
Fig 30 – Gender defined by Gender
Fig 31 – Gender defined by Age
PPM Domain and Gender
With gender balanced workforces again making many high profile stories in the news during 2016; we took the opportunity to ask our PPM practitioners a few questions about their views on gender equality and the impact of gender within the PPM domain.
Our starting point centred around the data gathered over the last 12 years which has shown an average gender split of 70:30 in terms of males to females across the total population of practitioners. This figure has shown some slight deviations, though to date no significant shift. Many argue that this split is to be expected, as it is driven by the fact that for many practitioners PPM is a second career; where the feeder professions such as construction and engineering are in themselves male dominated.
To get the ball rolling we asked respondents a simple question, “ Do you see PPM as a gender biased profession?”.
As we can see in Fig. 29 whilst overall 63% said no, within the female cohort that figure reduced to 46% and in the male cohort it rose to 71%. Amongst the female cohort, 39% said they believe that PPM is a gender biased profession, compared to 20% of the males.
Our second question asked our respondents if they “feel that any aspect of your work life is defined by gender stereotyping?
As we can see in Fig. 30, overall 79% said no, with this figure increasing to 87% for males and falling to 62% for the females.
Of those respondents who felt that they were impacted by gender stereotyping, “by my colleagues and organisation” gained the higest response for both females and males with 22% and 5% respectively. Second on the list was “by my colleagues” for females with 8% and third was “by my organisation” at 6%. For male respondents these were switched with 4% saying “by my organisation” and 3% “by my colleagues”.
When analysed by age, we see some interesting but maybe not unexpected results from the respondents. Those who feel that their work life is impacted by gender stereotyping by colleagues is at its highest amongst those under 35 and then decreases across the subsequent age brackets.
The under 35’s also report colleagues and organisation highest with decreases across the subsequent age brackets.
Those reporting the organisation is pretty much consistent across all the age ranges.
0%
10%
20%
30%
40%
50%
60%
70%
80%
Yes No Not sure
UK - See PPM as Gender Biased
Female Male All
0% 20% 40% 60% 80% 100%
Female
Male
All
Defined by Gender - UK Practitioners by Gender
By Colleagues By Colleagues & Org By Organisation
By Myself No
0% 20% 40% 60% 80% 100%
Under 35
35 to 49
50+
All
Defined by Gender - UK Practitioners by Age
By Colleagues By Colleagues & Org By Organisation
By Myself No

arrasPEOPLE~
©Arras People 2017 www.arraspeople.co.uk Page 10
Fig 32 – Female Gender defined by Role Fig 33 – Male Gender defined by Role
Fig 34 – Impacted Career by Gender
Fig 35 – Personal Choice in Career by Gender
Career Limiting:
We then asked our respondents the following question, “Assuming that you have the required levels of Education, Knowledge, Training, Experience and Skill, do you feel that any other external factors have limited your own ability to progress your career?” This was a multi-select question.
As can be seen in Fig. 34, the responses when broken down by gender show quite significant differences. Overall 39% of the UK based respondents said that nothing had impacted their career progression, which increased to 44% for the males and fell to 32% for the females.
Conscious or Unconscious bias was the highest response from the female respondents with 44% indicating that this has impacted their career progression. They also indicated that the glass ceiling and sticky floor were issues at 19% and 12% respectively. For the male respondents, quotas was the only category where they recorded a higher response than the females with 9% and 7% respectively.
Personal Choice:
The final question we asked in this series was to understand if respondents thought personal choice is all too often ignored when gender equality targets are set by Governments and organisations. After all, individuals own their labour and ultimately their career.
As can be seen in Fig. 35, 36% of our respondents agreed that it is. Amongst the males 33% have seen others or have themselves taken a decision to limit their own career, whilst for the females this figure increased to 45%.
0%5%
10%15%20%25%30%35%
PfMgr PgM PM POM Sup Con
Defined by Gender - UK Females by Role
Yes - by my colleagues Yes - by my colleagues & organization
Yes - by my organization Yes - by myself
0%5%
10%15%20%25%30%35%
PfMgr PgM PM POM Sup Con
Defined by Gender - UK Males by Role
Yes - by my colleagues Yes - by my colleagues & organization
Yes - by my organization Yes - by myself
0% 25% 50% 75% 100% 125% 150%
Male
Female
All
Have Impacted My Own Career Progression
None Conscious or Unconscious bias
Glass ceiling Discrimination
Sticky floor Quotas
Other
0% 20% 40% 60% 80% 100%
Male
Female
All
Personal Choice & Gender Discussion
Yes - I have limited my own career through personal choice
Yes - I have seen colleagues limit their careers based on personal choice
No
I don't know
In a final cut Fig. 32 shows the female responses broken down by role and Fig. 33 the male responses broken down in the same way. Shown on the same scale the figures paint a startling picture of the differentials across gender to this question.

Ever feel like you’re herding cats?
www.AXELOS.com/herding-cats
PRINCE2 helps keep your project on track, even with

arrasPEOPLE~
©Arras People 2017 www.arraspeople.co.uk Page 11
Fig 37 – Career of First Choice – UK by Age
PPM – Career of First Choice
1st Career 2nd Career All Practitioners 30% 70% Role Splits 1st Career 2nd Career PfMgr 30% 70% PgM 32% 68% POM 36% 64% PM 27% 73% CM 24% 76% Sup 29% 71% Con 30% 70% Global Splits 1st Career 2nd Career UK National 28% 72% All Working in UK 29% 71% Working in RoW 32% 68%
Regional Splits 1st Career 2nd Career Asia 65% 35% Australia and Oceania 24% 76% Europe 34% 66% Middle East and North Africa 26% 74% North America 16% 84% South America 42% 58% Sub-Saharan Africa 31% 69%Fig 36 - Career of first choice demographics
UK - Status 1st Career 2nd Career Freelancer 24% 76% Employee 33% 67% Unemployed 35% 65% UK - Sector 1st Career 2nd Career Private Sector - For Profit 31% 69% Public Sector - Government 25% 75% Third Sector - Not for Profit/Charity 16% 84% UK - Oganisation Size 1st Career 2nd Career <7 Employees 22% 78% 7 to 49 Employees 33% 67% 50 to 249 Employees 28% 72% 250 to 1,000 Employees 23% 77% > 1,000 Employees 31% 69%Fig 38 - Career of first choice Working
Over recent years the field of Programme and Project Management (PPM) has been positioned as a ‘career of first choice’ as more Universities have offered Degrees and Masters in the subject areas. This idea has also been promoted in the UK with the introduction of Modern Apprenticeships in project management.
This push to ‘career of first choice’ is in stark contrast to the historical view that PPM practitioners would come to their positions as a second career, having already established themselves within the domain or discipline of their first career. As such, the demographic profile by age has always been dominated by the older end of the scale.
So, for the first time we asked our respondents to identify if PPM is in fact their first career or their second to see if this ‘choice’ is having any immediate impact. Just as importantly this will also allow us to set a benchmark for any future data to be compared against.
Taking into account all the responses the global picture shows a 70:30 split in favour of second career; this moves to 72:28 for just the UK respondents and 68:32 for our respondents from the rest of the world (RoW).
When the UK respondents are cut by age, as in Fig. 37, we can see that the percentage of the population in a first career are certainly higher amongst those under the age of 42. As an overall number though, they are lower accounting for 43% of the respondents.
In the under 34’s we see a wider gap and the actual number is higher, accounting for 54% of the respondents, so maybe the career of first choice is taking traction?
Across other areas the data does not give any unexpected or substantial differences between the two sets of practitioners. One point of note is a slightly higher percentage of first career practitioners in the under £40k pay scale at 31% compared to 27% for the second career respondents.
Time will tell, but at this point we have a reference from which to monitor any future developments in this area.
0%
5%
10%
15%
20%
25%
30%
35%
40%
Under 24 25 to 29 30 to 34 35 to 42 43 to 49 50 to 59 60+
UK Practitioners by Age
1st Career 2nd Career

ThePMOConference
www.pmoconference.co.uk7th June, 2017, Central London
Focused on portfolio, programme and project offices, this one day conference is all about learning more about your chosen profession. From a full programmeof PMO expert speakers, a dedicated PMO exhibitionfull of PMO products and services and time to networkwith new PMO contacts or reconnect with friends and ex-colleagues, the day is 100% PMO focused.
AgilePM guidance offers a practical and repeatable methodology that achieves an ideal balance between the standards, rigour and visibility required for good project management, and the fast pace, change and empowerment provided by Agile.
www.apmg-international.com/AgilePM
The UK’s leading guidance and certification for Agile Project Management
Over 50,000 exams since
2011!!
www.agilebusiness.org
In partnership with
Half page (130x194) APMG.AgilePM.indd 1 05/01/2017 15:51

arrasPEOPLE~
©Arras People 2017 www.arraspeople.co.uk Page 12
Unemployed PPM Practitioners
Domiciliary Status 2016 2015 2014 UK National 78% 80% 92% EU National 19% 9% 5% Non UK/EU National 4% 11% 3% Age <34 10% 10% 10% 35 to 49 40% 40% 28% > 50 49% 48% 61% Gender Male 70% 70% 77% Female 30% 30% 21% Previous Sector Private 80% 72% 73% Public 15% 16% 20% Charity / NFP 5% 12% 7% Previous Status Employee 78% 66% 78% Contractor / Temp 22% 26% 18% Years PPM Experience <1 Year 10% 8% 6% 2 to 3 Years 6% 14% 7% 4 to 5 Years 8% 7% 9% 5 to 10 Years 20% 11% 19% 10+ Years 56% 60% 59% Period of unemployment < 3 Months 33% 38% 32% 3 to 6 months 27% 16% 25% 7 to 12 Months 23% 16% 15% >12 Months 18% 29% 28%Fig 39 - UK Unemployed Practitioners
>2017 9% 18% 8% 48% 18%
>2016 8% 18% 20% 32% 22%Fig 40 - UK Unemployed Confidence
25% of UK practitioners say their confidence was negatively
impacted by BREXIT
“Despite claims to the contrary we live in an ageist culture here in the UK”
“I had anticipated it being easy to find a contracting job, given my years of experience and delivery reputation.
Not so!”
With UK unemployment as a whole continuing in a downward direction during 2016, we once again took a snapshot of those PPM practitioners who identified themselves as unemployed when participating in the survey.
The ONS (Office for National Statistics) reported in the latest figures for the three months to November 2016, that UK unemployment at 4.8% was steady and at an 11-year low. However, for the second month in a row the number of people actually in work declined by 9,000 to just over 31.8 million; the first time that we have seen consecutive falls since mid-2015. Figures that some suggest, shows that the labour market growth of recent years is grinding to a halt.
In terms of our respondents, the unemployment figure remained consistent year-on-year at 6% for UK based practitioners. Interestingly this year the UK Nationals figure dropped by 2% yet the EU Nationals figure increased by 10%.
In terms of regional spread, London based practitioners accounted for 33% of the total with half of these being EU Nationals. The South West had the second highest number with 12%, followed by the South East and the North West which each accounted for 10% of the total number.
Respondents reporting long term unemployment i.e. greater than 12 months dropped substantially in this years survey, down 11% to 18% which may be due to practitioners leaving the available labour pool. At the same time practitioners reporting unemployment of between three and twelve months increased substantially which may indicate a tightening UK job market.
Same Challenges for Unemployed:
When asked about their challenges in gaining employment the respondents again reported that securing interviews is the biggest challenge, followed by finding suitable roles that align to their skills and experience.
Unemployed Confidence and Brexit:
The confidence heading into 2017 responses from the unemployed practitioners have shifted for those not feeling negative, as can be seen in Fig. 40. After the 2016 Brexit vote, we asked our respondents if the result had impacted their level of confidence; 62% reported that it had not, whilst 25% reported that it had, negatively. A further 9% reported that their confidence had been impacted positively whilst 4% did not want to share this information.

arrasPEOPLE~
©Arras People 2017 www.arraspeople.co.uk Page 13
Fig 42 – Sector Confidence in to 2017 – UK Practitioners
Fig 44 – Impact of Brexit – UK Practitioner
Fig 45 – Job Hiring Forward View – UK Practitioner
UK Economic Climate
Organisation Confidence Into 2017 Into 2016 Into 2015 Buoyant 18% 22% 26% Steady 38% 36% 38% Neutral 20% 20% 17% Contraction 11% 12% 11% Hard Times 10% 8% 9%Fig 41 - UK Confidence
0%
5%
10%
15%
20%
25%
30%
35%
40%
45%
Buoyant Normal Growth Neutral Contraction Hard Times
UK Sector Confidence into 2017
Private Public ALL
0%5%
10%15%20%25%30%35%40%45%
No impact No impact,anticipate
detrimental
No impact,anticipatepositive
A positiveimpact
A negativeimpact
UK Sector - Impact of Brexit into 2017
Private Public All
0% 10% 20% 30% 40% 50% 60% 70%
No Hiring
Some Hiring
Major Hires
No view
UK - Anticipating PPM Job Hiring
Into 2015 Into 2016 Into 2017
With the latest initial estimate from the ONS (Office for National Statistics) showing that the UK economy grew once again in the final quarter of 2016, the much anticipated, immediate economic slowdown of the UK economy following the Brexit vote has not materialised.
The UK economy grew by 0.6% in the latest figures for October to December, meaning that for the year a growth figure of 2% was recorded, which whilst healthier than many predicted is still down on the figures recorded for 2015 and 2014 (2.2% and 3.1% respectively).
With this post Brexit bounce in mind, we asked our UK based respondents about their views in respect of the organisation where they are currently working as we head into 2017.
As can be seen in Fig. 41, the numbers feeling buoyant once again dropped year on year, down from the high point recorded heading into 2015 following the challenges of the great recession. Those anticipating contraction or hard times increased slightly, though again to nothing like the figures seen in the recessionary period where they topped 23% and 16% respectively. Steady as she goes, seems to be the message with 58% suggesting neutral or steady.
In terms of the immediate Brexit impact, we asked our respondents what impact, if any, the outcome of the vote had had within their organisations. As we can see in Fig. 44, there were slightly differing responses from those working in the Public and Private sectors. Overall 37% said there is no impact; 36% have seen no immediate impact but anticipate a detrimental one; whilst 12% anticipate that any impact when it arrives will be positive. In terms of immediate impact, 3% said it has been positive to their organisation whilst 12% said it has been negative.
In terms of outlook for organisations hiring new PPM practitioners during 2017, the picture remains somewhat static. Major hiring does not look to be on the cards for another year, though the same can be said when it comes to laying off.
Once again it looks like UK Plc will be running nervously along in anticipation of any future shocks.

arrasPEOPLE~
©Arras People 2017 www.arraspeople.co.uk Page 14
Fig 47 – Financial position by Sector – UK Practitioner
Fig 50 – Brexit Impact by Age – UK Practitioner
UK Living Standards & Confidence
2016 has seen lots of talk about a socioeconomic grouping in UK society who have been given the title ‘JAM’ (Just About Managing) by the business and political circles. Whilst not many PPM practitioners are in the £18,000 to £24,000 a year earning bracket associated to this group, many do have their own challenges in maintaining their lifestyles.
Feeling the pinch:
With inflation as measured through the CPI (Consumer Prices Index) up to 1.6% in December and the average wage increase running at 2.7%, 2016 did not see the general wage inflation that some forecast. With further inflation increases anticipated due to the post Brexit falls in the value of sterling, 2017 could be another tough year for UK households.
The number of respondents who reported that they are feeling slightly/much worse off than twelve months previously rose to 22% as can be seen in Fig. 46, an increase of 8%. Whilst at the other end of the scale those who reported that they feel slightly/much better off fell by 6% to 37%. Public sector workers as can be seen in Fig. 47, appear to be fairing much worse than their private sector counterparts as Government austerity continues to hold down income.
Confidence dented?
As we have seen over the years the PPM practitioners are a hardy group when it comes to sharing their personal confidence for the year ahead. Once again, we see the majority entering 2017 with a smile on their faces (65%) whilst at the other end of the scale those feeling less than neutral have increased by 6% to 17%.
We asked our respondents if the Brexit vote had impacted their shared confidence level and 48% said that it had not. Across the practitioner group 38% said Brexit had impacted their confidence negatively, whilst just 9% said it had a positive impact.
Analysing this question the biggest differential was found when analysing the respondents by age, specifically older or younger than 42. Here we saw the largest positive/negative reaction.
Financially Feeling 2016 2015 2014 2013 Much Better Off 10% 11% 11% 8% Slightly Better Off 27% 32% 29% 25% About Same 41% 43% 40% 35% Slightly Worse Off 17% 11% 16% 25% Much Worse Off 5% 3% 5% 7%Fig 46 - UK Practitioner Financial Status
0%5%
10%15%20%25%30%35%40%45%
Much BetterOff
Slightly BetterOff
About Same Slightly WorseOff
Much WorseOff
UK Practitioners - Financial Position Y on Y Comparison
UK Private UK Public All
>2017 3% 14% 18% 50% 15%
>2016 2% 9% 15% 53% 21%Fig 48 - UK Employed Practitioners Confidence
0%
10%
20%
30%
40%
50%
None Yes - negatively Yes - positively Prefer not to share
Impact of Brexit on Personal Confidence into 2017
Age =< 42 Age 43+ All
Personal Confidence moving into:2017 2016 2015 2014 2013 2012 201115% 21% 23% 19% 18% 15% 13%50% 53% 54% 55% 53% 45% 46%18% 15% 11% 13% 11% 17% 27%14% 9% 10% 11% 14% 19% 11%3% 2% 2% 1% 3% 4% 3%
Fig 49 - UK PractitionerPersonal Confidence

arrasPEOPLE~
©Arras People 2017 www.arraspeople.co.uk Page 15
Fig 52 – 2016 Remuneration change – UK Practitioner
Fig 54 – 2017 Anticipated Remuneration change – UK Practitioner
UK Remuneration Patterns
2016 Remuneration:
As we can see in Fig. 51, the movement in remuneration achieved by our respondents in 2016 varied significantly with 49% indicating an increase; 38% reporting stagnation and 13% reporting a fall compared to their 2015 levels. When compared to the 2015 data, the number of UK respondents indicating no-change or a fall in remuneration we saw an increase from 44% to 51%.
For contractors, the position seems to be once again challenging, with 69% recording no-change or a fall in their day rates; this compares to 36% for those who are employees. By sector, we can see that the squeeze on contractor rates continues with 74% reporting no-change or a fall, compared to 66% in the private sector.
For the employees, the picture looks somewhat healthier with 66% of those working in the private sector reporting that their salary increased, of these though 36% said it was by less than 3%. The public sector employees faired a little worse with 58% reporting an increase in salary, though 44% said it was less than 3%.
2017 Remuneration Outlook:
With UK inflation expected to rise during 2017 the majority of our UK based practitioners are not anticipating their base earnings to cover this increase in living costs.
Whilst the 68% of employees are expecting their salary to increase, just 27% are anticipating that the increase will be 3% or more. 30% anticipate that they will see no salary increase in 2017 and 2% anticipate that their salary will fall.
For contractors, the picture of the outlook painted by our respondents is once again gloomy, with 56% anticipating that their rates in 2017 will remain stagnant. A further 11 % are anticipating that they will see cuts to their rates in 2017. Of the 33% who anticipate an increase in rates, just 23% see this as being 3% or greater.
For contractors, especially those in the public sector who get caught in the off-payroll changes, 2017 could be a challenging year.
Movement in Earnings 2016ALL Cont'trs Emplyee Public Private Public Private
>8% Fall 6% 13% 1% 20% 9% 1% 1% -5 to 7% 4% 6% 2% 6% 6% 2% 2% -3 to 4% 1% 2% 0% 2% 2% 0% 1% -1 to 2% 2% 2% 1% 2% 3% 1% 1% No Change 38% 46% 32% 43% 47% 39% 30% +1 to 2% 23% 5% 39% 8% 4% 44% 36% +3 to 4% 10% 7% 13% 4% 8% 5% 16% +5 to 7% 5% 7% 3% 3% 9% 2% 4% >8% Inc 10% 12% 8% 11% 13% 7% 10%Fig 51 - 2016 Movement in remuneration 2016 UK
Contractors Employees
0%
10%
20%
30%
40%
50%
>8%Fall
-5 to7%
-3 to4%
-1 to2%
NoChange
+1 to2%
+3 to4%
+5 to7%
>8% Inc
2016 Remuneration Change UK Practitioners
Cont'trs Emplyee ALL
Employee Salary into Year 2017 2016 2015 2014 2013 2012 Fall 2% 2% 3% 2% 3% 4% Unchanged 30% 32% 28% 31% 36% 41% Increase 68% 67% 70% 67% 61% 55%Fig 53 - Anticipated movement in remuneration UK Employees
0%
10%
20%
30%
40%
50%
60%
Fall Unchanged Increase 1to 2%
Increase 3to 4%
Increase 5to 7%
Increase>8%
Anticipated Remuneration Change 2017 - UK Practitioners
Cont'trs Emplyee All
Contractor Rates into Year 2017 2016 2015 2014 2013 2012 Fall 11% 9% 11% 12% 18% 21% Unchanged 56% 51% 51% 58% 59% 58% Increase 33% 40% 38% 30% 23% 21%Fig 55 - Anticipated movement in remuneration UK Contractors

arrasPEOPLE~
©Arras People 2017 www.arraspeople.co.uk Page 16
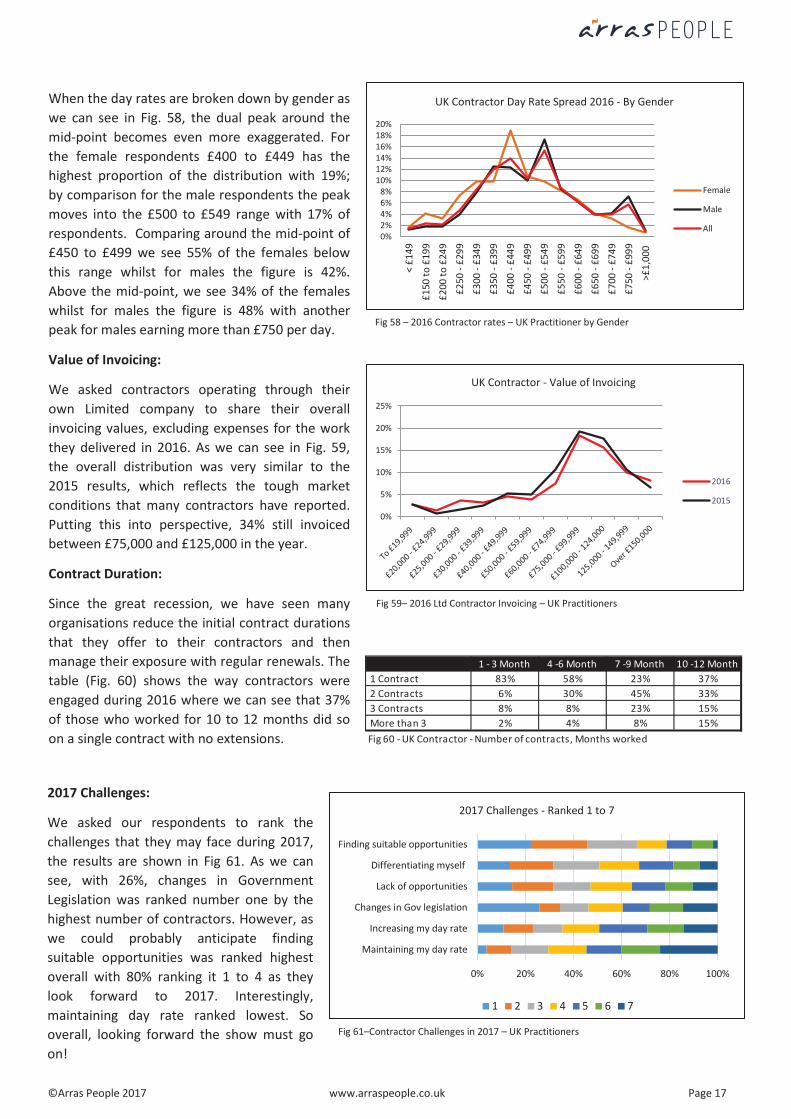
Fig 57 – 2016 Contractor rates – UK Practitioner
UK Contractor Overview
Mode of Operation 2016 2015 2014 2013 2012 Ltd Company 89% 88% 85% 78% 76% Umbrella Company 5% 8% 8% 12% 13% Sole Trader 5% 4% 7% 10% 11%Paying Clients Engaged with: 2016 2015 2014 2013 2012One 76% 79%Two 16% 12%Three 4% 5%Four or More 4% 4%Time as Contractor 2016 2015 2014 2013 2012 Under 1 Year 17% 13% 16% 16% 17% 1 - 3 years 26% 32% 25% 28% 23% 4 - 5 years 11% 15% 11% 11% 12% Over 5 years 46% 53% 48% 45% 48%Contracted for work during year 2016 2015 2014 2013 20121 to 3 Months 10% 8% 7% 13% 18%4 to 6 Months 16% 18% 17% 14% 14%7 to 9 Months 26% 22% 23% 23% 25%10 to 12 Months 48% 52% 53% 49% 43% Contract Availability 2016 2015 2014 2013 2012 Decreased 31% 17% 12% 28% 37% Stable 47% 45% 40% 40% 38% Increased 22% 38% 48% 32% 26% Typical Contract Length 2016 2015 2014 2013 2012 1 to 3 Months 22% 23% 22% 30% 25% 4 to 6 Months 36% 41% 38% 36% 32% 7 to 9 Months 12% 12% 15% 12% 14% 10 to 12 Months 30% 24% 25% 22% 30% I was Contracted 2016 2015 2014 2013 2012 1 time 41% 27% 29% 33% 45% 2 times 33% 41% 37% 33% 34% 3 times 16% 19% 20% 20% 10% More than 3 times 10% 13% 14% 14% 11%I am starting the current year with 2016 2015 2014 2013 2012 No Contract 30% 28% 28% 30% 32% < 3 Months Contract 27% 24% 27% 29% 22% 3 to 6 Months Contract 26% 33% 28% 28% 31% > 6 Months Contract 17% 15% 17% 13% 15% Pressure on day rate 2016 2015 2014 2013 2012 Decreased 13% 20% 19% 13% 16% Was Stable 53% 49% 50% 49% 41% Increased 34% 31% 31% 38% 43%Fig 56 - UK Contractor Facts
0%2%4%6%8%
10%12%14%16%18%
< £1
49
£150
to £
199
£200
to £
249
£250
- £2
99
£300
- £3
49
£350
- £3
99
£400
- £4
49
£450
- £4
99
£500
- £5
49
£550
- £5
99
£600
- £6
49
£650
- £6
99
£700
- £7
49
£750
- £9
99
>£1,
000
UK Contractor Day Rate Spread 2016
2014
2015
2016
Respondents who identified themselves as contractors made up 41% of practitioners currently working in the UK. As we have seen elsewhere in the report, 2016 was a challenging year for many contractors with 2017 looking to continue that trend. Many expressed the feeling that they are under an unfair level of attention from HMRC as the Government seeks to increase their tax take from this section of the working population. Some went so far as to express the opinion that they are an endangered species.
Who are they?
Gender split 75% male with 25% female 75% are aged 43+ 70% have over 10 years of PPM experience 80% have some form of PPM accreditation 41% live in London and the South East 32% do not work where they live 10% have no fixed work location
What do they do?
In terms of sector, 65% of our respondents work in the private sector with 30% in the public sector and 5% in the third sector. Once again Project Managers made up the largest group with 37%, those identifying themselves as PPM Consultants accounted for 20% and 17% as Programme Managers. Of the Consultants, 19% say they are involved in operational delivery activities, 6% provide expert advice to their clients and 75% provide a combination of the two. The contractor group are on average, contracted to work 36 hours per week but deliver 42.5 hours.
Day Rates:
The data recorded for day rates achieved by our UK based contractors during 2016 showed an interesting shift around the mid-point of £450 to £499 as can be seen in Fig. 57. Compared to previous years we saw a significant drop (-6%) giving dual peaks in the ranges below and above. The numbers earning rates under the mid-point increased on 2015 by 2%, reversing the trend of the last 2 years. On the plus side, those earning rates over the mid-point increased by 4% on the 2015 results and creating some differentials, a point worthy of further investigation.
arrasPEOPLE~
©Arras People 2017 www.arraspeople.co.uk Page 17
Fig 58 – 2016 Contractor rates – UK Practitioner by Gender
Fig 59– 2016 Ltd Contractor Invoicing – UK Practitioners
Fig 61–Contractor Challenges in 2017 – UK Practitioners
2017 Challenges:
We asked our respondents to rank the challenges that they may face during 2017, the results are shown in Fig 61. As we can see, with 26%, changes in Government Legislation was ranked number one by the highest number of contractors. However, as we could probably anticipate finding suitable opportunities was ranked highest overall with 80% ranking it 1 to 4 as they look forward to 2017. Interestingly, maintaining day rate ranked lowest. So overall, looking forward the show must go on!
When the day rates are broken down by gender as we can see in Fig. 58, the dual peak around the mid-point becomes even more exaggerated. For the female respondents £400 to £449 has the highest proportion of the distribution with 19%; by comparison for the male respondents the peak moves into the £500 to £549 range with 17% of respondents. Comparing around the mid-point of £450 to £499 we see 55% of the females below this range whilst for males the figure is 42%. Above the mid-point, we see 34% of the females whilst for males the figure is 48% with another peak for males earning more than £750 per day.
Value of Invoicing:
We asked contractors operating through their own Limited company to share their overall invoicing values, excluding expenses for the work they delivered in 2016. As we can see in Fig. 59, the overall distribution was very similar to the 2015 results, which reflects the tough market conditions that many contractors have reported. Putting this into perspective, 34% still invoiced between £75,000 and £125,000 in the year.
Contract Duration:
Since the great recession, we have seen many organisations reduce the initial contract durations that they offer to their contractors and then manage their exposure with regular renewals. The table (Fig. 60) shows the way contractors were engaged during 2016 where we can see that 37% of those who worked for 10 to 12 months did so on a single contract with no extensions.
0%2%4%6%8%
10%12%14%16%18%20%
< £1
49
£150
to £
199
£200
to £
249
£250
- £2
99
£300
- £3
49
£350
- £3
99
£400
- £4
49
£450
- £4
99
£500
- £5
49
£550
- £5
99
£600
- £6
49
£650
- £6
99
£700
- £7
49
£750
- £9
99
>£1,
000
UK Contractor Day Rate Spread 2016 - By Gender
Female
Male
All
0%
5%
10%
15%
20%
25%
UK Contractor - Value of Invoicing
2016
2015
0% 20% 40% 60% 80% 100%
Maintaining my day rate
Increasing my day rate
Changes in Gov legislation
Lack of opportunities
Differentiating myself
Finding suitable opportunities
2017 Challenges - Ranked 1 to 7
1 2 3 4 5 6 7
1 - 3 Month 4 -6 Month 7 -9 Month 10 -12 Month 1 Contract 83% 58% 23% 37% 2 Contracts 6% 30% 45% 33% 3 Contracts 8% 8% 23% 15% More than 3 2% 4% 8% 15%Fig 60 - UK Contractor - Number of contracts, Months worked

arrasPEOPLE~
©Arras People 2017 www.arraspeople.co.uk Page 18
Fig 63 – Employee Salary Distribution – UK Practitioners
Fig 64 – Employee Salary Distribution – UK Practitioners by Sector
Fig 65 – Employee Salary Distribution – UK Practitioners by Gender
UK Employee Overview
Employment Status 2016 2015 2014 2013 Permanent 89% 93% 92% 92% Temp 2% 6% 7% 1% Fixed Term 9% 1% 1% 7% Time with Employer 2016 2015 2014 2013 Under 1 year 26% 24% 20% 21% 1 to 3 years 32% 32% 32% 30% 4 to 5 years 9% 11% 10% 9% Over 5 years 32% 33% 37% 41% Gender 2016 2015 2014 2013Male 62% 64% 69% 66%Female 38% 35% 31% 34%Fig 62. UK Employee data
Respondents who identified themselves as employees made up 53% of practitioners currently working in the UK. Of this group 85% are UK Nationals, 11% EU Nationals and 4% from the rest of the world.
Who are they?
Gender split 62% male with 38% female 47% are aged 43+ 48% have over 10 years of PPM experience 87% have some form of PPM accreditation 45% live in London and the South East 12% live in the South West 11% live in the Midlands 19% do not work where they live 5% have no fixed work location
What do they do?
Full time permanent employees still make up the largest group at 89%, whist the number of fixed term employees has risen significantly to 9% and the number of temporary workers has fallen. In terms of sector, 70% of our respondents work in the private sector with 23% in the public sector and 7% in the third sector. Once again Project Managers made up the largest group with 35%, those identifying themselves as Project Office Managers accounted for 16% and 15% as Programme Managers. The employee group are on average contracted to work 36.7 hours per week and report that they deliver 43.8 hours on average.
Salary distribution:
The data recorded for base salary rates achieved by our UK based employees is shown in Fig. 63, where we can see that the mean remained in the £40k to £50k range with 23%. Above and below this range there were slight variances over last year’s data but nothing of any great significance.
When plotted by sector (Fig. 64) we can see that there is still a significant difference in the distribution of remuneration, with 55% of those in the private sector earning over the mean, compared to 35% of those in the public sector.
By gender we also see a similar difference, with 57% of males earning over the mean, compared to 33% of the females.
0%5%
10%15%20%25%30%
UK Employees - Salary Distribution
2015 2014 2016
0%5%
10%15%20%25%30%
2016 Comparative Salary distribution by Sector
Public Private
0%5%
10%15%20%25%30%
2016 Comparative Salary distribution by Gender
Male Female

arrasPEOPLE~
©Arras People 2017 www.arraspeople.co.uk Page 19
Benefits and Bonus:
As we can see in Fig.66, 50% of our UK based PPM practitioners received some form of bonus on top of their base salary; with significant differences between those in the private and public sectors. For the majority, these payments are based on a combination of personal and organisation performance; paid at a level worth 1% to 8% of base salary for 54% of those who receive them.
In terms of benefits which the UK based employees receive, pension contributions still rank at the top with 13% reporting that they still enjoy access to a non-contributory scheme. The company car and car allowance once again saw a fall, continuing the downward trend we have seen over the last few years.
Overall 59% of respondents said that their benefits package is worth 1% to 8% of base salary, 30% they are worth 9% to 15%, with 11% valuing them at over 15%.
Changing roles:
Amongst our employees we again saw a consistent level of churn with 24% saying that they had changed role or job during 2016. We also saw an increase in the number of contractors returning to permanent employment. As we can see in Fig. 68, there were a selection of reasons given for change, a possible surprise being that only 19% said they changed for a better package.
Into 2017:
When asked about their status heading into 2017 the employees painted a consistent picture based on previous post great recession years, that suggests the employment market is still pretty tight, or confidence is still low.
In terms of top concerns for the year:
36% see a lack of new opportunity externally 63% see a lack of opportunity for promotion 57% see a challenge in securing a decent rise 57% see a lack in budget for development
The facts, coupled with the comments left by our respondents suggest that 2017 will be another year of tight purse strings as organisations continue to monitor an uncertain future.
“Usual deal of delivering more with less, expectation of long hours and insufficient
time for CPD and self-learning”
Bonus Payment Received 2016 2015 2014 2013 2012 All 50% 44% 49% 47% 50% Public 17% 20% 18% 25% 30% Private 64% 51% 60% 56% 59% Bonus Calculated 2016 2015 2014 2013 2012 Personal Performance 15% 18% 15% 16% 19% Company Performance 15% 14% 15% 16% 18% Combination 69% 68% 70% 68% 63% Bonus Level 2016 2015 2014 2013 2012 None 50% 56% 51% 53% 50% 1- 8% of Salary 27% 23% 27% 26% 29% 9 - 15 % of Salary 13% 14% 12% 14% 13% 16 - 25% of Salary 8% 5% 7% 5% 6% 25%+ of Salary 2% 3% 3% 2% 2%Fig 66 - UK Employee Bonus Data
Employee Benefits 2016 2015 2014 2013 2012 None 3% 26% 26% 22% 29% Yes 97% 74% 74% 78% 71% Benefits Received 2016 2015 2014 2013 2012 Pension Plan – Contributory 84% 89% 89% 88% 85% Pension Plan – Non-Contributory 13% 11% 12% 10% 11% Healthcare Benefits 54% 61% 63% 57% 60% Life Insurance 43% 42% 49% 43% 43% Long-Term Care Insurance 6% 7% 8% 7% 5% Company Car 6% 10% 11% 10% 14% Car Allowance 18% 23% 26% 31% 28% Fuel Allowance 7% 7% 6% 8% 9% Mobile Phone 46% 51% 50% 53% 53% Gym Membership 11% 6% 10% 7% 10% Child Care Subsidies 14% 12% 13% 14% 12% Other 12% 12% 12% 8% 6%Fig 67 - UK Employee Benefits Data
Changed Job/Role in 2016 2016 2015 2014 2013 2012 Yes 24% 23% 23% 25% 27% No 76% 77% 77% 75% 41%Reason for Changing 2016 2015 2015 2012 Promotion 29% 28% 30% 14% Redundancy 16% 22% 10% 18% Better package 19% 26% 23% 11% Better prospects 23% 31% 28% 19% Increase in challenge 29% 40% 32% 17% Change in lifestyle 18% 19% 16% 10% Other 17% 18% 16% 12%Fig 68. UK Employee Role change data
Going into 2017 2016 2015 2014 2013 2012 Happy in current role 29% 31% 32% 28% 31% Want New role - Current employer 11% 10% 11% 13% 13% Want to Change employer 21% 21% 20% 21% 20% Want to move in to Contracting 6% 9% 5% 5% 3% Open to Change but Not pushing 27% 25% 26% 28% 27% Under threat of redundancy 3% 3% 3% 3% 3%Fig 69. UK Employee Role into 2017

arrasPEOPLE~
©Arras People 2017 www.arraspeople.co.uk Page 20
UK Actual Remuneration
Every year in the Census survey we ask our respondents to place themselves in a band to represent their current salary or day rate so that we are not too intrusive regarding what many see as really intersting but personal information. We also include an optional question to see if they are willing to share their actual salary and day rate information. Of the contractors who provided a rate category, 74% went on to share an actual day rate figure, whilst of the employees who provided a salary category, 60% went on to share an actual salary day rate figure.
It is with this in mind that we have shared the tables below to give an indication of rate data against the seven main roles used throughout the survey to categorise our respondents. The figures whilst indicative to a point also show the difficulties in answering questions such as “how much am I worth?” and “how much would I have to pay for a project manager?” The added dimensions that are not included here are PPM experience, industry, domain expertise, location etc which will all impact the numbers that are generated. Detailed profiling of candidates and roles are just one of the many advantages that clients of Arras People have when they engage our unique project management recruitment services.
Rest of the World
We would like to thank the respondents from outside of the UK who took part in the Arras People 2016 Project Management Census. The data you provided creates many reference points against which we can hold up the UK based practitioners and trends, some of which are included in this report and some which will be used in the future.
Unfortunately, the numbers who respond from each individual country/region are not of sufficient volume for us to create a detailed review assessment on the level of the UK based practitioners, however your inputs are greatly valued.
All Max Min Private Public Delta Female Male Delta Change Manger 517£ 750£ 390£ 533£ 492£ 8% 523£ 511£ 2% PPM Consultant 525£ 1,500£ 150£ 523£ 532£ -2% 518£ 527£ -2% Portfolio Manager 609£ 1,100£ 300£ 604£ 625£ -3% 375£ 638£ -70% Programme Manager 587£ 1,000£ 250£ 611£ 566£ 7% 549£ 595£ -8% Project Manager 425£ 700£ 130£ 446£ 392£ 12% 417£ 427£ -3% PPM Office Manager 530£ 800£ 350£ 542£ 500£ 8% 561£ 514£ 8% PPM Support 262£ 400£ 130£ 256£ 271£ -6% 304£ 213£ 30% Average 490£ 505£ 469£ 7% 473£ 495£ -5%
Fig. 70 - Actual Day Rates - UK Practitioners
All Max Min Private Public Delta Female Male Delta Change Manger 56,957£ 130,000£ 32,500£ 65,357£ 49,717£ 24% 44,229£ 69,686£ -58% PPM Consultant 56,082£ 85,000£ 33,000£ 62,405£ 46,044£ 26% 47,683£ 58,181£ -22% Portfolio Manager 76,903£ 350,000£ 32,000£ 89,390£ 58,476£ 35% 56,091£ 84,287£ -50% Programme Manager 65,943£ 123,000£ 26,000£ 69,682£ 58,367£ 16% 65,277£ 66,059£ -1% Project Manager 45,968£ 95,000£ 23,000£ 47,585£ 40,889£ 14% 43,985£ 47,072£ -7% PPM Office Manager 55,371£ 115,000£ 27,500£ 59,499£ 42,609£ 28% 47,566£ 64,377£ -35% PPM Support 37,463£ 200,000£ 16,500£ 40,206£ 32,875£ 18% 34,140£ 43,636£ -28% Average 54,182£ 57,674£ 46,288£ 20% 45,532£ 59,077£ -30%
Fig. 71 - Salary Rates - UK Practitioners

Helping businesses be Agile in allbusiness change initiatives – regardless of scale
At the Agile Business Consortium - the new name for the DSDM Consortium - we believe that Agile ways of working can improve your business.
Bene�ts• Agile Business Strategy – ensuring that business strategy always remains aligned with business and market imperatives• Agile Portfolio Management – ensuring change initiatives are properly aligned with the over-arching strategy and remain so throughout their life• Agile Culture and Leadership – providing advice and guidance on leading Agile change from whatever your position in the organisation• Agile Enablement and Governance – recasting PMO services to embrace a philosophy of enablement and governance centred around people• Agile Service Evolution – focusing on developing business services (with or without IT enablement) to promote a collaborative, customer-centric approach
Training and certi�cation in AgilePM®, AgilePgM® and AgileBA® is o�ered by organisations accredited by both the Agile Business Consortium and APMG International.
The Agile Business Consortium – Supporting your Agile Business Change initiatives For more information please see our website www.agilebusiness.org
The Agile Business Change FrameworkWe have embraced the current suite of DSDM products to create a single Agile framework.
Our Mission:“To provide global leadership in promoting, supporting and
enabling Business Agility“
by o�ering advice, guidance and accredited products and services to organisations through an international network of partners.

Programme Manager
Location19% of PgMs reside in London, 18% in the South East, 12% in the NorthWest
Age36% of PgMs are aged 50 to 59, 7% are under the age of 34, 12% are 60+
Gender82% of PMs are male versus 18% women. It’s 69% versus 30% across the whole PPM domain
Education40% of PMs have a Bachelors degree; 35% have a Masters degree and 0% a PhD Work
51% work on a permanent basis; 43%are freelance and 6%are currently unemployed
Experience41% have been doing the job for over 10 years; 7% have less than one year experience
Careercame to project management as a second career
68%
46%have been working for their current employer for less than 3 years
CAREER
26% have taken a career break over 3 months
ACCREDITAT
ION0102
Accreditation
Money03
Work04
Programmes05
Outlook06
Brexit07
Gender08
MONEY
WO
RK
PROGRAMMES
OUTLOOK
BREXITGENDER
9% believe their confidence has been positively a�ected by Brexit - 37% think its had a negative a�ect.
26%earn between £60-75K. 32% earn over £75K
18%earn a day rate of £500to £550
9%
1%
20% of PgMs think project management is a gender biased profession - 1% believe that their work life has been defined by
gender stereotyping - the culprit? Themselves.
31%are happy intheir role
27% are open for a change in employer but are not pushing it - 14% are looking to change employers
77%of their assignments are strategically important
99% of freelance PgMs operate a Limited Company; 59% believe their rate will remain static in 2017; 74% are aware of the O�-Payroll Worker Regulation
78% of permanent PgMs are working on business transformation projects;24% have a span of control of between 21 and 40 people; 55% have no P&L responsibility.
67%of PgMs are workingin the private sector - IT, consultancy & aerospace (11%)
25%
25% of freelance PgMs have no contract in place as they headed into 2017; 45% were pressured to reduce their day rate during 2016
41%Chartered Status - Extremely and Very Important
9%The PgM and their family are much better o� than last year
39% of freelance PgMs saw their ratesremain fixed in 2016; 16% earned between £750 and £1000/day.52% of permanent PgMs received nobonus in 2016.
15%have no accreditationat all
13%value their APMaccreditation
Value of the accreditations PgMs have: 46% see value in 2 Axelos products - 24% of those, MSP the most and 18% PRINCE2
38% of PgMs are not planning on any further training in 2017. Most like to have for 2017 for PgMs? Programme (MSP) related training

Portfolio Manager
Location21% of PfMs reside in London, 16% in the Midlands, 13% in the South East
Age34% of PfMs are aged 50 to 59, 6% are under the age of 34, 8% are 60+
Gender68% of PfMs are male versus 31% women. It’s 69% versus 30% across the whole PPM domain
Education31% of PfMs have a Bachelors degree; 47% have a Masters degree and 1% a PhD Work
74% work on a permanent basis; 21%are freelance and 4%are currently unemployed
Experience31% have been doing the job for over 10 years; 9% have less than one year experience
Careercame to project management as a second career
66%
51%have been working for their current employer for less than 3 years
CAREER
33% have taken a career break over 3 months
ACCREDITAT
ION0102
Accreditation
Money03
Work04
Portfolio05
Outlook06
Brexit07
Gender08
MONEY
WO
RK
PORTFOLIO
OUTLOOK
BREXITGENDER
37% believe their confidence has been positively a�ected by Brexit - 14% think its had a negative a�ect.
25%earn between £60-75K. 32% earn over £75K
17%earn a day rate of £500to £550
14%
0%
17% of PfMs think project management is a gender biased profession - 0% believe that their work life has been defined by
gender stereotyping - the culprit? Themselves.
30%are happy intheir role
27% are looking for a change in employer whilst 21% are open to a change in employer but are not pushing it
77%of their assignments are strategically important
100% of freelance PfMs operate a Limited Company; 25% believe their rate will remain static in 2017; 81% are aware of the O�-Payroll Worker Regulation
28% of permanent PfMs have no direct reports; 24% have a span of control of between 21 and 40 people; 55% have no P&L responsibility.
62%of PfMs are workingin the private sector - 22% Financial Services and 14% IT
13%
13% of freelance PfMs have no contract in place as they headed into 2017; 45% were pressured to reduce their day rate during 2016
48%Chartered Status - Extremely and Very Important
8%The PfM and their family are much better o� than last year
54% of freelance PfMs saw their ratesremain fixed in 2016; 25% earned between £750 and £1000/day.44% of permanent PfMs received nobonus in 2016.
14%have no accreditationat all
12%value their APMaccreditation
Value of the accreditations PfMs have: 37% see value in 4 Axelos products - 12% PRINCE2; 9% P3O; 8% MSP; 6% MoP
31% of PfMs are not planning on any further training in 2017. Most like to have for 2017 for PfMs? Portfolio Management

Project ManagerLocation
23% of PMs reside in London, 17% in the South East, 12% in the Midlands
Age27% of PMs are aged 50 to 59, 21% are under the age of 34, 7% are 60+
Gender71% of PMs are male versus 29% women. It’s 69% versus 30% across the whole PPM domain
Education40% of PMs have a Bachelors degree; 27% have a Masters degree and 1% a PhD Work
51% work on a permanent basis; 41%are freelance and 8%are currently unemployed
Experience51% have been doing the job for over 10 years; 6% have less than one year experience
Careercame to project management as a second career
74%
66%have been working for their current employer for less than 3 years
CAREER
23% have taken a career break over 3 months
ACCREDITAT
ION0102
Accreditation
Money03
Work04
Projects05
Outlook06
Brexit07
Gender08
MONEY
WO
RK
PROJECTS
OUTLOOK
BREXITGENDER
Just 5% believe their confidence has been positively a�ected by Brexit - 41% think its had a negative a�ect.
29%earn between £40-49K. 26% earn between£30-39K
21%earn a day rate of £400to £450
5%
1%
28% of PMs think project management is a gender biased profession - 1% believe that their work life has been defined by
gender stereotyping - the culprit? Themselves.
30%are happy in their role
25% are open to changing employers but are not pushing it - 21% are looking to change employers
67% measured on time; 54% on quality; 48% on assigned tasks; 45% on budget; 37% on customer satisfaction and 13% on profit
28%are managing 5 or more projects at a time
86% of freelance PMs operate a Limited Company; 57% believe their rate will remain static in 2017; 65% are aware of the O�-Payroll Worker Regulation
61% of permanent PMs are working on business transformation projects;25% have a span of control of between 10 and 20 people; 58% have no P&L responsibility.
71%of PMs are workingin the private sector - financial services the most popular (17%)
35%
35% of freelance PMs have no contract in place as they headed into 2017; 34% were pressured to reduce their day rate during 2016
50%Chartered Status - Extremely and Very Important
13%The PM and their family are much better o� than last year
19%have no accreditationat allValue of the accreditations Project
Managers have: 45% see value in 2 Axelos products - 39% of those, PRINCE2 the most and 4% MSP
23% of Project Managers are not planning on any further training in 2017. Most like to have for 2017 for PMs? Agile related training
15%value their APMaccreditation

ChangeManager
Location31% of CMs reside in London, 14% in the North West and 10% in the South East
Age41% of CM are aged 50 to 59; 25% are 43 to 49; 6% are 60+
Gender57% of CMs are male versus 43% women. It’s 69% versus 30% across the whole PPM domain
Education37% of CMs have a Bachelors degree; 43% have a Masters degree and 2% a PhD Work
43% work on a permanent basis; 49%are freelance and 8%are currently unemployed
Experience42% have been doing the job for over 10 years; 6% have less than one year experience
Careercame to project management as a second career
74%
43%have been working for their current employer for less than 3 years
CAREER
41% have taken a career break over 3 months
ACCREDITAT
ION0102
Accreditation
Money03
Work04
Change05
Outlook06
Brexit07
Gender08
MONEY
WO
RK
CHANGE
OUTLOOK
BREXITGENDER
16% believe their confidence has been positively a�ected by Brexit - 59% think its had a negative a�ect.
29%earn between £50-60K. 10% earn over £100K
25%earn a day rate of £450 to £499
59%
0%
33% think project management is a gender biased profession - 0% believe that their work life has been defined by
gender stereotyping - the culprit? Themselves.
21%are happy intheir role
37% are open for a change in employer but are not pushing it - 32% are looking to change employer
84%work on Business Transformation
95% of freelance CMs operate a Limited Company; 70% believe their rate will remain static in 2017; 68% are aware of the O�-Payroll Worker Regulation
41% of CMs report through the Board of Directors and 77% work in organisations with over 1000 employees.
56%are workingin the private sector - 32% Financial Services; 16% Professional Servs
28%
28% of freelance CMs have no contract in place as they headed into 2017; 42% were pressured to reduce their day rate during 2016
34%Chartered Status - Extremely and Very Important
16%CMs and their family are much better o� than last year
70% of freelancers saw their ratesremain fixed in 2016; 5% earned between £750 and £999/day.62% of permanent CMsreceived no bonus in 2016.
19%have no accreditationat all
8%value theirAPM accreditations
19% of Change Managers value 3 AXELOS products; 13% PRINCE2; 4% MSP and 2% ITIL. They also value products from Lean and APMG
32% of CMs work on more than 5 projects at any one time. 55% are measured on quality more than anything else
40% of Change Managers are not planning for training in 2017. Of those that are Programme, Change and PROSCI feature.

PMO Manager
Location28% of PMO Mgrs reside in London, 24% in the South East and 14% in the Midlands
Age28% of PMO Mgrs are aged 35 to 42; 26% are 43 to 49; 5% are 60+
Gender53% of PMO Mgrs are male versus 46% women. It’s 69% versus 30% across the whole PPM domain
Education41% of PMO Mgrs have a Bachelors degree; 30% have a Masters degree and 1% a PhD Work
69% work on a permanent basis; 27%are freelance and 4%are currently unemployed
Experience27% have been doing the job for 2 to 3 years; 9% have less than one year experience
Careercame to project management as a second career
65%
53%have been working for their current employer for less than 3 years
CAREER
14% have taken a career break over 3 months
ACCREDITAT
ION0102
Accreditation
Money03
Work04
PMO05
Outlook06
Brexit07
Gender08
MONEY
WO
RK
PMO
OUTLOOK
BREXITGENDER
9% believe their confidence has been positively a�ected by Brexit - 46% think its had a negative a�ect.
25%earn between £40-50K. 18% earn over £75K
21%earn a day rate of £450 to £499
46%
2%
23% think project management is a gender biased profession - 2% believe that their work life has been defined by
gender stereotyping - the culprit? Themselves.
27%are happy intheir role
34% are open for a change in employer but are not pushing it - 22% are looking to change employer
38%manage a ProgrammeManagementO�ice
88% of freelance PMO Mgrs operate a Limited Company; 25% believe their rate will remain static in 2017; 68% are aware of the O�-Payroll Worker Regulation
44% of PMO Mgrs report to a Head of Department and 37% see themselves as Advanced practitioners. 74% work in organisations with over 1000 employees
75%are workingin the private sector - 31% Financial Services and 11% IT
22%
22% of freelance PMO Mgrs have no contract in place as they headed into 2017; 50% were pressured to reduce their day rate during 2016
46%Chartered Status - Extremely and Very Important
7%The PMO Mgr and their family are much better o� than last year
34% of freelancers saw their ratesremain fixed in 2016; 9% earned between £750 and £1000/day.41% of permanent PMO Mgrs received no bonus in 2016.
7%have no accreditationat all
11%value their APMaccreditation
Value of the accreditations PfMs have: 51% see value in 5 Axelos products - 21% of those, PRINCE2; 13% P3O; 13% MSP; 3% MoP;1% PRINCE2 Agile
26% are not planning on any further training in 2017. Most like to have for 2017 for PMO Mgrs? P3O
36% of PMO Mgrs report through the IT department and 24% through the senior board.

Project Support
Location43% of Support reside in London, 18% in the South East and 13% in the South West
Age24% of Support are aged 50 to 59; 20% are 35 to 42; 6% are less than 24
Gender48% of Support are male versus 52% women. It’s 69% versus 30% across the whole PPM domain
Education47% of Support have a Bachelors degree; 27% have a Masters degree and 1% a PhD Work
63% work on a permanent basis; 27%are freelance and 11%are currently unemployed
Experience31% have been doing the job for 2 to 3 years; 8% have less than one year experience
Careercame to project management as a second career
72%
80%have been working for their current employer for less than 3 years
CAREER
12% have taken a career break over 3 months
ACCREDITAT
ION0102
Accreditation
Money03
Work04
Support05
Outlook06
Brexit07
Gender08
MONEY
WO
RK
SUPPORT
OUTLOOK
BREXITGENDER
7% believe their confidence has been positively a�ected by Brexit - 29% think its had a negative a�ect.
38%earn between £30-40K. 2% earn over £60K
27%earn a day rate of £250 to £299
29%
15%
39% think project management is a gender biased profession - 15% believe that their work life has been defined by
gender stereotyping - the culprit? Themselves.
9%are happy intheir role
32% are looking for a new role within their current organisation - whilst 27% are open for a change but not pushing it
27%have 2 to 3 years experiencein PM
73% of freelance Support operate a Limited Company; 55% believe their rate will remain static in 2017; 50% are aware of the O�-Payroll Worker Regulation
44% of Support report to a PMO Manager and 46% see themselves as Practitioners. 64% work in organisa-tions with over 1000 employees
61%are workingin the private sector - 20% So�ware Dev 13% Financial Services
24%
24% of freelance Support have no contract in place as they headed into 2017; 42% were pressured to reduce their day rate during 2016
57%Chartered Status - Extremely and Very Important
16%Support and their family are much better o� than last year
50% of freelancers saw their ratesremain fixed in 2016; 5% earned between £450 and £499/day.65% of permanent Supportreceived no bonus in 2016.
17%have no accreditationat all
3%have the APM Fundamentals Qualification
54% of Project Support have a PRINCE2 Foundation; 46% have the PRINCE2 Practitioner; 10% have P3OPractitioner
45% of Support work in a Programme Management O�ice; 44% see their future as Project Managers

APM’s membership grades have been crafted to support professionals at any stage of their career.
AS A MEMBER, YOU CAN EXPECT TO:
improve your career progression opportunities;
develop your skill set through our collection of learning resources;
share knowledge with a global community of project managers.
Student
Fellow
Member
Associate
career progress, visit apm.org.uk/membership
Whether you are new to the profession and looking to develop your subject knowledge, or an
raise awareness and standards in the profession.
FELLOW MEMBER
to the profession.
ASSOCIATE MEMBER
FULL MEMBER
addition, they have access to a suite of membership features that are designed to aid career progression and professional development.
STUDENT MEMBER
Student membership is now free, making it the perfect choice for anybody studying for a career in project management. Use our learning resources and global project management community to develop your knowledge and springboard your career.
CAREER DEVELOPMENTWe’ve got your
COVERED
APMMEMBERSHIP

arrasPEOPLE~Arras People are the UK’s Specialists in Portfolio, Programme and Project Management Recruitment
0845 680 6444
www.arraspeople.co.uk
Arras House, 47 York Street, Greater Manchester OL10 4NN
www.facebook.com/ArrasPeople
www.twitter.com/ArrasPeople