arsenic stability and characterization of … · arsenic stability and characterization of cesl...
TRANSCRIPT

ARSENIC STABILITY AND CHARACTERIZATION OF CESL PROCESS RESIDUES
*R. Bruce1 and K. Mayhew
1, G. P. Demopoulos
2, A. Heidel
3
1TECK RESOURCES LIMITED
12380 Horseshoe Way
Richmond, Canada V7A 4Z1
(*Corresponding author:[email protected])
2McGILL UNIVERSITY
Montreal, Canada H3A 2B2
3AURUBIS AG
Hovestraße 50
20539 Hamburg, Germany
ABSTRACT
Teck and Aurubis are working together to commercialize a technology for the processing of
copper arsenic sulphide concentrates that is economic and sustainable with regards to the environment and
community. The pressure hydrometallurgical approach is a desirable option as mineral extraction and
arsenic fixation can take place in a single autoclave vessel.
A test work program was carried out where a range of copper concentrates with varying arsenic
grades was processed under CESL leach conditions. This paper discusses the stability character (in terms
of arsenic) of the resulting residues and their mineralogy. The basic ferric arsenate sulphate phase (BFAS;
otherwise known as type 2) was identified as the main arsenic carrier. All CESL residues demonstrated
high stability (<1 mg/L As) through a range of aggressive (pH and ORP) environmental leach conditions.
KEYWORDS
Arsenic, Aurubis, autoclave, CESL, environment, hydrometallurgy, stability, sustainable, Teck.

INTRODUCTION
Arsenic deportment and control in the copper industry needs an integrated approach involving
each stage of the value chain, i.e. exploration, mine operation, refining process and mine closure. Teck
Resources Limited (Teck), Canada’s largest diversified mining company and Aurubis, Europe’s largest
copper producer, have formed a partnership to advance the application of CESL copper-gold technology
for the development of high arsenic bearing copper resources (Bruce et al., 2011).
Among the options for arsenic control in the metallurgical treatment of copper concentrates is the
precipitation of ferric arsenate, which is widely accepted as the most suitable method for stabilizing arsenic
(Ferron and Wang, 2003). The pressure hydrometallurgical approach to processing arsenic bearing copper
concentrates is a favorable option as mineral extraction and arsenic fixation can take place in a single
autoclave vessel. Under CESL pressure leaching conditions (150 °C, 1380 kPa) high copper extraction and
arsenic (V) fixation is possible.
Within the pressure leach autoclave, arsenate and ferric iron react to form scorodite type phases.
The precipitate formed under CESL conditions is dependent on the Fe (III) /As (V) ratio and the tenor of
cations and anions, particularly excess sulphate (Gomez et al., 2011a). Previous studies on CESL residues
have found arsenic to be present as crystalline scorodite (FeAsO4.2H2O) (Bruce et al., 2011), basic ferric
arsenate sulphate (BFAS: Fe(AsO4)1−x(SO4)x(OH)x·(1−x)H2O, where 0.3<x<0.7), and/or arsenate adsorbed
on to hematite (Gomez et al. 2011b). Although not a focus of previous work, scorodite was the
predominant precipitate formed when the concentrate Fe/As was <1.5 (Mayhew et al., 2010), and BFAS
was the predominant precipitate when the concentrate Fe/As was >10 (Gomez et al. 2011b).
The stability of crystalline scorodite and BFAS has been researched through a range of studies on
pure samples. Gomez et al. determined that both compounds exhibited negligible amounts of arsenic (<1
mg/L) in a TCLP-like 24 hour leachate. Longer-term testing implied that these compounds were quite
stable at a pH of ≤7, with BFAS being equally or slightly more stable than scorodite (Gomez et al., 2011a).
Characterization of arsenic precipitates in a dynamic copper leach plant is complex and requires
stability data to assist in identifying and characterizing such materials. Ultimately, study of environmental
and extrinsic factors that affect residue stability is required to ensure responsible mining, refining and
residue management practices. This paper discusses the stability character of CESL residues and their
mineralogy.
RESIDUE SAMPLE PRODUCTION
The residues to be analyzed for arsenic stability were produced at Teck’s CESL facility in
Richmond, BC. The CESL facility employed a fully integrated pilot plant flowsheet to process copper
concentrate continuously to produce LME Grade A copper cathode and a washed residue stream for
testing. The residues discussed in this paper were produced in 2010 when several different copper arsenic
sulphide concentrates were processed to examine metals extraction, arsenic deportment to the final plant
residue, and final residue stability. The results of this work are summarized below and were published
(Bruce et al., 2011). The chemical and mineralogical analyses of the four concentrates processed during
the 2010 pilot plant campaign are presented in Table 1 and Table 2.
Table 1 – Pilot plant concentrate elemental composition
Element (wt. %) A B C D
As 0.7 1.4 1.5 4.6
Cu 21.2 25.8 27.1 29.5
Fe 24.5 24.5 24.9 19.6
S 26.8 36.0 33.9 33.5

Table 2 – Pilot plant concentrate mineralogy
Mineral (wt. %) Formula A B C D
Chalcopyrite CuFeS2 43 22 49 38
Bornite Cu5FeS4 8 6 10 7
Luzonite/Enargite Cu3AsS4 -- 5 6 20
Tennantite Cu12As4S13 -- 1 2 2
Chalcocite / Covellite Cu2S / CuS 3 18 4 5
Pyrite FeS2 9 38 20 18
Arsenopyrite FeAsS 2 -- -- --
Gangue - 23 9 9 8
Concentrate A was processed to assess the health and safety controls in place at lower arsenic
tenors. Once the performance of these controls was confirmed, materials with a higher arsenic grade were
introduced to the plant. Test work on concentrate A is not discussed in this study.
The concentrates were introduced to the autoclave along with acidic feed liquor containing
chloride ions at a concentration of 12 g/L. Oxygen was sparged into the slurry and the resultant mixture
was processed at 150°C and 1380 kPag for 90 minutes. The autoclave discharge slurry was sent to a
thickener for solid liquid separation. The residue proceeded to a counter current decantation circuit for
final washing while the copper rich PLS was processed in a solvent extraction circuit for copper recovery.
Following solvent extraction the raffinate was sent to an evaporator circuit to recover water for use as wash
solution throughout the process. A portion of the evaporator product was processed through a low (1.8 pH)
and high (8.5 pH) neutralization circuit for sulphate and impurity removal. Finally, the evaporator product
and neutralization product solutions were combined and recycled to the autoclave as feed liquor.
The residues produced in the copper pilot plant were subsequently processed through the CESL
gold pilot plant to assess the impact that alkaline processing (10.5 pH) might have on the stability of the
arsenic compounds. In the gold plant the residues were repulped with lime and processed through a
stainless steel pressure vessel at ambient temperature and a pressure of 2700 kPag. NaCN solution was
added to the pressure vessel and the residue was processed for 90 minutes prior to being discharged and
filtered. Their chemical compositions are given in Table 3.
Table 3 – Chemical composition of copper and gold pilot plant residues
Element
(wt. %)
Concentrate B Concentrate C Concentrate D
Cu Plant
Residue
Au Plant
Residue
Cu Plant
Residue
Au Plant
Residue
Cu Plant
Residue
Au Plant
Residue
As 1.8 2.0 2.0 1.7 6.1 5.7
Cu 1.2 1.0 1.0 0.8 1.3 1.7
Fe 29.7 28.1 34.2 27.4 25.7 27.6
S (total) 26.2 26.4 27.0 25.3 27.7 25.9
S° 16.9 17.7 23.3 17.7 23.4 21.5
In addition to these pilot plant residues, a flotation test was conducted on the concentrate C copper
plant residue to produce a concentrate and tailing sample. The purpose of this flotation test was to upgrade
the elemental sulphur content of the residue to examine the impact that this may have on the stability of the
arsenic phases contained. The chemical composition of these residues is presented in Table 4.

Table 4 – Chemical composition of residues produced by flotation of concentrate C copper plant residue
Element (wt. %) Flotation Concentrate Flotation Tailings
As 0.99 2.4
Cu 1.93 0.75
Fe 17.2 42.5
S (total) 72.9 10.5
S° 66.0 7.5
The 2010 pilot plant operations met metallurgical performance targets by achieving ≥ 97% copper
extraction for all concentrate samples and arsenic deportment of 99.5% to the final plant residues. Further
work however was required to assess the stability and suitability of residues for long term disposal. To
determine this, a comprehensive residue stability assessment program was developed.
STABILITY PROGRAM DESCRIPTION
McGill University was contacted to assist in generating a program. The stability program
comprises a detailed work plan that can be broken down into two main categories: residue characterization
and residue stability testing.
Residue Characterization
The characterization of the residue solids focused mainly on mineralogical analysis. The analyses
included X-ray diffraction (XRD), scanning electron microscopy coupled with energy dispersive X-ray
spectrometry (SEM-EDS, MLA), X-ray photoelectron spectroscopy (XPS), Micro-Raman analysis
(Raman), and Attenuated Total Reflectance Fourier Transform Infrared Spectroscopy (ATR-FTIR). All
residues produced were subjected to XRD and MLA analysis at Teck’s Applied Research and Technology
center (ART) in Trail, BC. Following these analyses, selected residues were sent to McGill for XPS,
Raman, and ATR-FTIR analysis.
Residue Stability Testing
The stability of the residues produced in the copper and gold plants were tested using two
different methods. The first was the Toxicity Characteristic Leaching Procedure (TCLP, EPA Method
1311). This method involves gently agitating the solids in a pH adjusted solution for a period of 18-24
hours prior to analyzing the content of the filtered slurry. Maximum levels are set for the allowable
concentration of various elements in the filtrate. Arsenic was of the greatest interest for this study. The
TCLP analyses were conducted at the CESL research facility.
The second type of stability testing was conducted externally by Maxxam Analytics International
for a period of 8 weeks. The range of conditions tested for the various residues are presented in Table 5
with 98 tests being completed in total. The pH and Eh for all tests were either controlled to a set value or
adjusted at the beginning of the test and allowed to drift for the duration of the test. For the highest arsenic
content residues (concentrate D) additional tests were conducted at elevated temperatures (40°C), while all
other tests were conducted at ambient temperature (21°C).

Table 5 – Test conditions for the first batch of residue samples
Variable Conc. B & C,
all residues
Conc. D,
all residues
pH
6, 7, 8 controlled
8 drifting
5, 6, 7, 8, 9 controlled
7, 8, 9 drifting
Eh 50 mV, 300 mV,
Unadjusted
50 mV, 300 mV,
Unadjusted
These medium term stability tests involved placing 75 g of residue solids in 1.5 L of distilled
water and subjecting the mixture to mild agitation using a gyratory shaker at 100-110 rpm with a lateral
motion of 2 cm. The pH, conductivity, and potential of the tests were measured at scheduled times. This
was done daily for the first week, every two days until the end of the fourth week of testing and twice per
week thereafter. Upon measurement, if the pH or potential of a controlled test had deviated from the
target, an adjustment would be made using concentrated H2SO4 or 5% Ca(OH)2 slurry for pH and Na2SO3
or Na2S·9H2O for Eh. At times tests that were below the potential target were allowed to agitate without
being capped in order to allow the potential to naturally increase through air entrainment. In all other
cases, the tests were purged with nitrogen for 1 minute prior to replacing the caps.
A 20 mL slurry sample was collected and filtered through a 0.2 µm filter and submitted for ICP-
OES analysis. On days when sampling was scheduled to coincide with measurement of pH, conductivity
and potential, the sample for analysis was taken prior to measurement. The final sample was performed in
duplicate.
RESULTS
Residue Characterization
Characterization of residues produced from hydrometallurgical processes poses challenges as the
residues are generally finely intergrown with multiple compounds present in low concentrations when
compared to the bulk of the material. The CESL Process residue samples contained an abundance of
elemental sulphur and hematite when compared to the relatively low arsenic content. The XRD analysis
provided a quantitative assessment of the crystalline phases present but detected the presence of amorphous
materials. Insufficient crystalline arsenic phases were detected to host the required amount of arsenic
suggesting that a portion of the arsenic was present in an amorphous state.
The MLA analysis is able to provide better resolution than XRD and is not limited to identifying
only crystalline phases though it can be limited by fine grain sizes and intergrown species. The MLA
results were able to detect a Fe-SO4-As-hydrate species that contained the majority of the arsenic
contained in the residue samples. This Fe-SO4-As-hydrate phase appeared in the samples as a fine-grained
matrix of agglomerate material and also as disseminated free spheres. The MLA was able to detect the As-
phases in the residues but without a positive identification of the mineral associations.
Based on the XRD and MLA results, further analysis was required to positively identify the
arsenic phases present in the CESL plant residues. Four samples were submitted to McGill which included
concentrate B, C, and D copper plant residues and concentrate D gold plant residue.
XPS investigates the surface chemistry of a substance, being able to determine elemental
composition of materials as well as providing chemical state and phase information. Two types of XPS
analysis were conducted. First, scans were conducted that focused on the As 3d orbital to determine the
oxidation state of the arsenic contained in the residue samples (+3 vs +5). These scans showed a good
correlation to the As 5+ curve as opposed to the As 3+ curve. This confirms that the arsenic contained
within these residues is present as some type of arsenate phase. Scans were also conducted on several
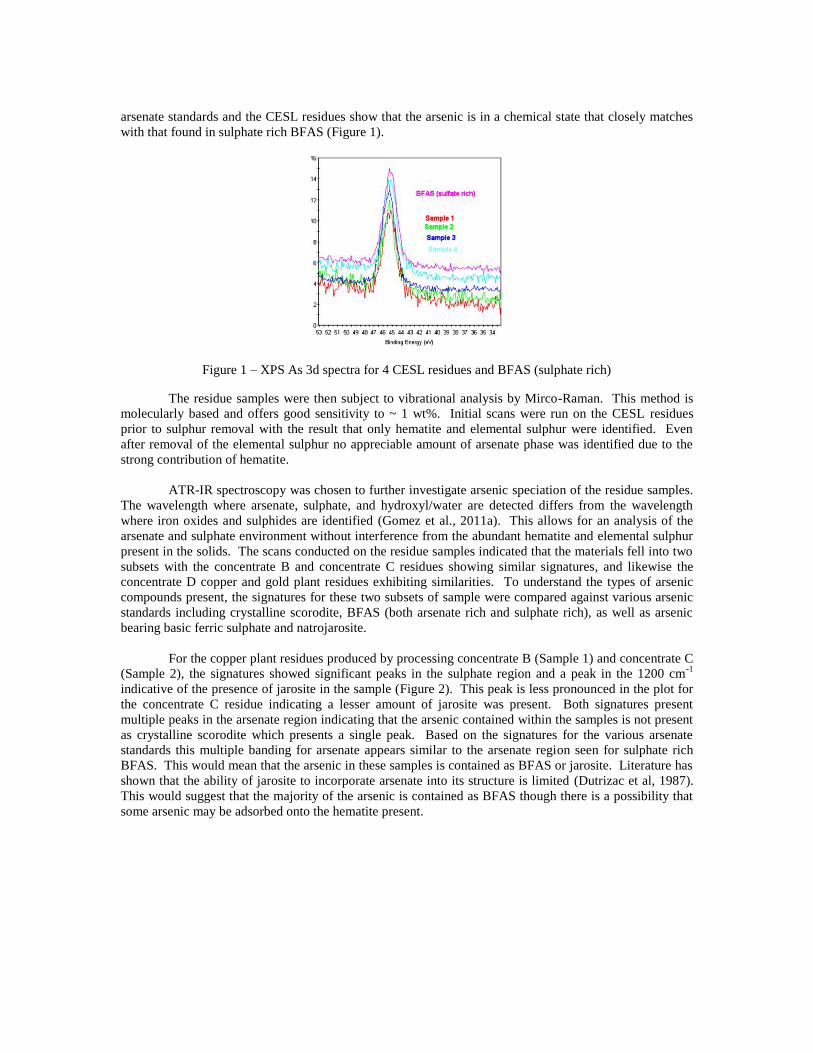
arsenate standards and the CESL residues show that the arsenic is in a chemical state that closely matches
with that found in sulphate rich BFAS (Figure 1).
Figure 1 – XPS As 3d spectra for 4 CESL residues and BFAS (sulphate rich)
The residue samples were then subject to vibrational analysis by Mirco-Raman. This method is
molecularly based and offers good sensitivity to ~ 1 wt%. Initial scans were run on the CESL residues
prior to sulphur removal with the result that only hematite and elemental sulphur were identified. Even
after removal of the elemental sulphur no appreciable amount of arsenate phase was identified due to the
strong contribution of hematite.
ATR-IR spectroscopy was chosen to further investigate arsenic speciation of the residue samples.
The wavelength where arsenate, sulphate, and hydroxyl/water are detected differs from the wavelength
where iron oxides and sulphides are identified (Gomez et al., 2011a). This allows for an analysis of the
arsenate and sulphate environment without interference from the abundant hematite and elemental sulphur
present in the solids. The scans conducted on the residue samples indicated that the materials fell into two
subsets with the concentrate B and concentrate C residues showing similar signatures, and likewise the
concentrate D copper and gold plant residues exhibiting similarities. To understand the types of arsenic
compounds present, the signatures for these two subsets of sample were compared against various arsenic
standards including crystalline scorodite, BFAS (both arsenate rich and sulphate rich), as well as arsenic
bearing basic ferric sulphate and natrojarosite.
For the copper plant residues produced by processing concentrate B (Sample 1) and concentrate C
(Sample 2), the signatures showed significant peaks in the sulphate region and a peak in the 1200 cm-1
indicative of the presence of jarosite in the sample (Figure 2). This peak is less pronounced in the plot for
the concentrate C residue indicating a lesser amount of jarosite was present. Both signatures present
multiple peaks in the arsenate region indicating that the arsenic contained within the samples is not present
as crystalline scorodite which presents a single peak. Based on the signatures for the various arsenate
standards this multiple banding for arsenate appears similar to the arsenate region seen for sulphate rich
BFAS. This would mean that the arsenic in these samples is contained as BFAS or jarosite. Literature has
shown that the ability of jarosite to incorporate arsenate into its structure is limited (Dutrizac et al, 1987).
This would suggest that the majority of the arsenic is contained as BFAS though there is a possibility that
some arsenic may be adsorbed onto the hematite present.

Figure 2 – ATR-IR plots for various arsenate standards, concentrate B copper plant residue (Sample 1), and
concentrate C copper plant residue (Sample 2)
The second subset of residues, concentrate D copper plant residue (Sample 3) and concentrate D
gold plant residue (Sample 4), are compared to arsenate containing BFS, BFAS (sulphate rich) and
natrojarosite in Figure 3.
Figure 3 – ATR-IR plots for various arsenate standards, concentrate D copper plant residue (Sample 3),
and concentrate D gold plant residue (Sample 4)
Due to the multiple bands detected in the arsenate environment and the lack of matching water
hydroxyl bands, the conclusion is drawn that the arsenate is not present as scorodite in these samples. One
item of interest is the presence of the jarosite sulphate band in the concentrate D copper plant residue and
its absence in the concentrate D gold plant residue. This can be attributed to the additional retention time
by processing the copper plant residue at an elevated pH in the gold process. There are definite similarities
in the character of the arsenic bands for both residue samples as well as the sulphate regions when
compared to BFAS. This would suggest that the arsenic present in these solids is contained in BFAS.

Residue Stability Testing
The TCLP testing was carried out by collecting residue samples from the pilot plant operations
and analyzing them several times a week. This resulted in the collection of 58 samples, with the values for
arsenic in filtrate given in Figure 4.
Figure 4 – Arsenic in filtrate for residue samples submitted for TCLP analysis
The TCLP results were positive with all residues produced in the copper and gold pilot plants
being well below the arsenic EPA limit of 5 mg/L and the British Columbia limit of 2.5 mg/L. The
majority of the samples were below the detection limit for arsenic by ICP-OES of 0.1 mg/L (any samples
below the detection limit are shown as having 0.05 mg/L As in filtrate in Figure 4). The highest arsenic
value of 0.3 mg/L was obtained when analyzing residues produced from processing concentrate D (~ 6%
As). Processing the material through the gold pilot plant did not negatively impact the results of the TCLP
analysis. These results compare well with TCLP results from literature for scorodite and BFAS (Swash
and Monhemius, 1994; Gomez et al. 2011a).
The results from the medium term stability test work are extensive and include charts of arsenic
solubility, pH, and potential for all 98 tests completed. Of these results, it is apparent that the residues
tested fell into two distinct categories: Low arsenic (~ 2%) materials that exhibited little arsenic solubility
regardless of the conditions tested and high arsenic (~ 6%) materials that showed variable arsenic solubility
and provided insight on the impact of the conditions tested on the stability of the arsenic bearing materials.
The low arsenic materials consisted of: concentrate B copper and gold plant residues, concentrate
C copper and gold plant residues, and the residues produced during the flotation of concentrate C copper
plant residue. The results from the tests on these residues showed that after eight weeks of stability testing,
the arsenic value in filtrate was less than the ICP-OES detection limit. This result held true for all
conditions tested. An ICP-MS scan was conducted on a selection of filtrate samples after 4 weeks of
testing to confirm the accuracy of the ICP-OES results. The MS scan confirmed that there was arsenic
present in solution and that in all cases it was at concentrations below 0.1 mg/L. As the arsenic in filtrate
values for all tests conducted for the low arsenic content samples presented the same low values after 8
weeks of testing they warrant no further discussion. However, the slurry potential of the tests conducted
on the flotation concentrate and tailings produced from concentrate C copper plant residue are of interest as
the elemental sulphur content in the residues varies by a factor of close to 10. This is worthy of
consideration as it is thought that the presence of elemental sulphur within the residue sample would lead
to reducing conditions which have been shown to result in solubility of various arsenic compounds
(McCreadie et al, 2000). The slurry potentials for tests conducted on the flotation concentrate and tailings

produced from concentrate C copper plant residue without adjustment of the test potential are shown in
Figure 5 and Figure 6.
Figure 5 – Slurry potential for concentrate C
flotation concentrate test
Figure 6 – Slurry potential for concentrate C
flotation tailings test
The slurry potentials shown in these charts indicate similar trends for both materials tested. For
tests where the pH was maintained at a set target the potential decreased slightly throughout the test
reaching a final value of 150-200 mV after 8 weeks. For the tests where the pH was allowed to drift (pH 8,
Drifting), the slurry potential increased throughout the test with 8 week values being 300-350 mV. The
concentrate C flotation concentrate sample did have the lower potential after 8 weeks when compared to
the tailings sample. Based on the large difference in elemental sulphur content (66% in concentrate versus
7.5% in tailings) between the two samples, if the presence of this compound created reducing conditions,
the difference in test potentials measured should have been far more pronounced.
For the high arsenic materials (concentrate D copper plant residue and concentrate D gold plant
residue) measurable values for arsenic in filtrate were detected. The results from these tests are more
informative than those for the low arsenic materials. For these tests, a broader range of pH was tested (pH
5 through pH 9) as well as one set of tests conducted at elevated temperature (40 °C). Figure 7 and Figure
8 present the arsenic in filtrate values for tests conducted on concentrate D copper plant residue with
constant pH as well as a drifting pH, but with no adjustment of the slurry potential.
Figure 7 – Arsenic in filtrate for concentrate D Cu
Plant residue with constant pH and drifting Eh
Figure 8 – Arsenic in filtrate for concentrate D Cu
Plant residue with drifting pH and Eh
After 8 weeks of testing, the arsenic concentration in filtrate for all tests was low (< 0.3 mg/L)
with no test showing an increasing trend in the amount of arsenic present in solution. From Figure 7 it is
apparent that at a pH of 8 the amount of arsenic in filtrate increased as compared to the lower pH tests.
This behavior was even more pronounced for the test conducted at a pH of 9 as would be expected based
on literature (Bluteau and Demopoulos, 2007). For all tests conducted at a pH of less than 8 the arsenic in
filtrate after 8 weeks of testing was less than 0.1 mg/L. With both figures, it is apparent that an initial
amount of arsenic was detected after one day of testing. This can be partially attributed to entrained

arsenic from the residue sample. The immediate decrease noted after one week of testing is believed to be
through hematite adsorption of the arsenic.
Figure 8 shows that though the initial pHs of the tests were elevated (pH 8 – 9), the final arsenic
in filtrate did not match those of the tests conducted at the matching controlled pH. This can be attributed
to the fact that for all drifting pH tests the slurry pH quickly decreased to the 4-5 range and remained there
for the duration of the test. This range of pH has been shown in literature (Bluteau and Demopoulos, 2007)
to be most favorable for arsenic stability for many arsenic bearing compounds. The same series of tests for
concentrate D gold plant residue are shown in Figure 9 and Figure 10.
Figure 9 – Arsenic in filtrate for concentrate D gold
plant residue with constant pH and drifting Eh
Figure 10 – Arsenic in filtrate for concentrate D
gold plant residue with drifting pH and Eh
The gold plant residues show low solubility of arsenic (0.1 – 0.2 mg/L) for the conditions tested.
Once again the tests conducted without pH control gave more favorable results when compared to the tests
where the slurry pH was controlled to achieve a specific target. This can be attributed to the slurry pH
decreasing to a value of approximately 4. This decrease in pH was more gradual for these tests which may
account for the brief increase in arsenic concentration followed by a gradual decrease. It is also worth
noting that the initial arsenic peak detected for the copper plant residues after one day of testing was not
apparent in these tests. This suggests that the soluble arsenic was ‘washed’ from the residue within the
gold plant.
To compare to the results for the scenario where no adjustment was made to the slurry potential,
two thresholds were considered: a slurry potential of less than 300 mV Eh and less than 50 mV Eh. For
these tests the slurry potential would only be adjusted should it exceed the target potential. The results of
tests conducted on concentrate D copper plant residue at both of these potential thresholds are shown in
Figure 11 and Figure 12.
Figure 11 – Arsenic in filtrate for concentrate D
copper plant residue with Eh less than 300 mV
Figure 12 – Arsenic in filtrate for concentrate D
copper plant residue with Eh less than 50 mV

The tests conducted at a potential of less than 300 mV produced results that were similar to those
conducted without any potential control. At the end of the eight week test cycle, a final arsenic in filtrate
value of less than 0.l mg/L was achieved. The tests conducted below an Eh of 50 mV provided very
different results. In these tests the arsenic in filtrate began to increase after 2 weeks of testing and were
still increasing at the end of the 8 week test cycle. The results for tests conducted on the concentrate D
gold plant residue showed similar behavior. This data suggests that a modest decrease in slurry potential
should not be detrimental to the stability of the residues produced within the CESL autoclave but that a
strong reducing environment can result in increased arsenic solubility. This phenomenon has been shown
in literature for various arsenate compounds.
The final variable considered in this study was the impact of increased temperature on the stability
of the residues produced. The results for these tests are presented in Figure 13 and Figure 14. The arsenic
in filtrate values for these tests were higher than those for tests conducted under the same conditions at
ambient temperature, in agreement with previous observations (Bluteau and Demopoulos, 2007), though
the arsenic in filtrate values were still less than 0.5 mg/L.
Figure 13 – Arsenic in filtrate for concentrate D
copper plant residue at 40°C
Figure 14 – Arsenic in filtrate for concentrate D
gold plant residue at 40°C
CONCLUSIONS AND FUTURE WORK
The test program conducted on the various arsenic bearing concentrates and the subsequent
residue stability testing of the materials produced was successful with all materials passing TCLP analysis
for arsenic as well as producing low concentrations of arsenic in filtrate after leaching the samples for 8
weeks. The findings from this work have helped to advance the collective efforts of the Teck-Aurubis
partnership for the future development of high arsenic bearing copper resources. The main conclusions that
can be drawn from this work are as follows:
The material produced when processing arsenic bearing material through an autoclave under
CESL conditions and 90 minutes retention time is thought to be Basic Ferric Arsenate Sulphate
(BFAS), previously identified as “Type 2”. This theory is supported by TCLP results which
match those for synthetic BFAS as well as XPS and ATR-IR data that exhibit similarity to these
synthetic materials.
When tested under various pH and potential regimes, material containing 1-2.5% arsenic did not
present detectable levels of arsenic in filtrate after 8 weeks of leaching. This was achieved even
though the amount of elemental sulphur contained within the samples varied from 7.5-66%.
The materials that contained elevated (>6%) levels of arsenic performed well, producing less than
0.1 mg/L arsenic in filtrate after 8 weeks of testing under a variety of conditions. Tests conducted
at elevated (>7) pH and low (<50 mV) Eh produced the highest levels of arsenic in filtrate as
supported by existing literature. All leachates produced through the 8 week trial were far below
the EPA TCLP limit of 5 mg/L.
To continue this work, several items have been highlighted for further study. Firstly, explore the
impact of autoclave retention time on the character of the residue produced. At 90 minutes retention time,
the autoclave residue still contains amorphous material that may be eliminated at longer retention times.
Secondly, conduct testing on materials containing even higher amounts of arsenic to determine whether
there is a critical level of arsenic that, once exceeded, impacts the character of the residues produced.
Finally, advanced characterization methods such as the use of the synchrotron at the Canadian Light
Source have been suggested as a method to more quantitatively identify the arsenic phases present in the
CESL residue regardless of the complex environment.
The impact of the stability results contained in this paper will be explored further in future
projects, through integrating the leach results into an environmental assessment and permitting process
related to a mineral development project.
ACKNOWLEDGEMENTS
Thank-you to all Teck operations and maintenance staff who were integral in the production of the
residues studied in this paper. A special thanks to all Teck and Aurubis technical staff involved in the
analysis of this data as well as the residue characterization work at ART. The authors would also like to
thank the staff of McGill University, specifically Mario Gomez, and Maxxam Analytics International for
their fine work and guidance.
REFERENCES
Bluteau, M. and Demopoulos, G.P., 2007. The incogruent dissolution of scorodite – Solubility, kinetics
and mechanism. Hydrometallurgy, Volume 87, p. 163-177.
Bruce, R., Heidel, A., Kadereit, H., Mayhew, K., Mean, R. and Wagner, O., 2011. Unlocking Value in
Copper Arsenic Sulphide Resources with the Cu-As CESL Technology, Hydrocopper 2011 Proceedings,
Viña del Mar, Chile.
Ferron, J. and Wang, Q., 2003. Striving for a Sustainable Mining Industry: Arsenic Control through an
Integrated Approach. SGS Lakefield Research Limited, Mining and the Environment Conference,
Sudbury.
Gomez, M. A., Becze, L., Celikin, M. and Demopoulos, G.P., 2011b. The effect of copper on the
precipitation of scorodite (FeAsO4·2H2O) under hydrothermal conditions: Evidence for a hydrated copper
containing ferric arsenate sulfate-short lived intermediate. Journal of Colloid and Interface Science,
Volume 360, Issue 2, p. 508–518.
Gomez, M., Becze, L., Cutler, J. and Demopoulos, G.P., 2011a. Hydrothermal reaction chemistry and
characterization of ferric arsenate phases precipitated from Fe2(SO4)3-As2O5-H2SO4 solutions.
Hydrometallurgy 107, p. 74-90.
Mayhew, K., Parhar, P. and Salomon-de-Friedberg, H., 2010. CESL Process as Applied to Enargite-Rich
Copper Concentrates. Proceedings of the 7th International Copper-Cobre Conference 2010, vol. 5, p. 1983-
1998.
McCreadie, H., Blowes, D. W., Ptacek, C. J., Jambor, J. L., 2000. Influence of Reduction Reactions and
Solids-Phase Composition on Porewater Concentrations of Arsenic. Environmental Science &
Technology, Volume 34, No. 15, p. 3159-3166.
Swash, P., & Monhemius, A., 1994 Hydrothermal precipitation from aqueous solutions containing
iron(III), arsenic and sulphate. Proceedings Hydrometallurgy ’94. Chapman and Hall (eds), pp. 177-190.