arterial spin labeling qualifying exam oral presentation ajna borogovac department of biomedical...
TRANSCRIPT

Arterial Spin LabelingArterial Spin Labeling
Qualifying Exam Oral PresentationQualifying Exam Oral Presentation
Ajna BorogovacAjna Borogovac
Department of Biomedical EngineeringDepartment of Biomedical EngineeringColumbia UniversityColumbia University

MotivationMotivation
Perfusion: Delivery of nutrients and oxygen to brain Patho-physiological correlate Viability of ischemic tissue
Applications: Quantify damage due to vascular diseases (e.g. Quantify damage due to vascular diseases (e.g.
cancer, stroke)cancer, stroke) Longitudinal perfusion studiesLongitudinal perfusion studies
Disease progressionDisease progression Drug/treatment efficacyDrug/treatment efficacy
Brain function – activation studiesBrain function – activation studies

OverviewOverview
Arterial Spin Labeling (ASL) Technique overviewTechnique overview Quantification of CBFQuantification of CBF
ASL Applications Clinical studies of pathologyClinical studies of pathology Functional ImagingFunctional Imaging
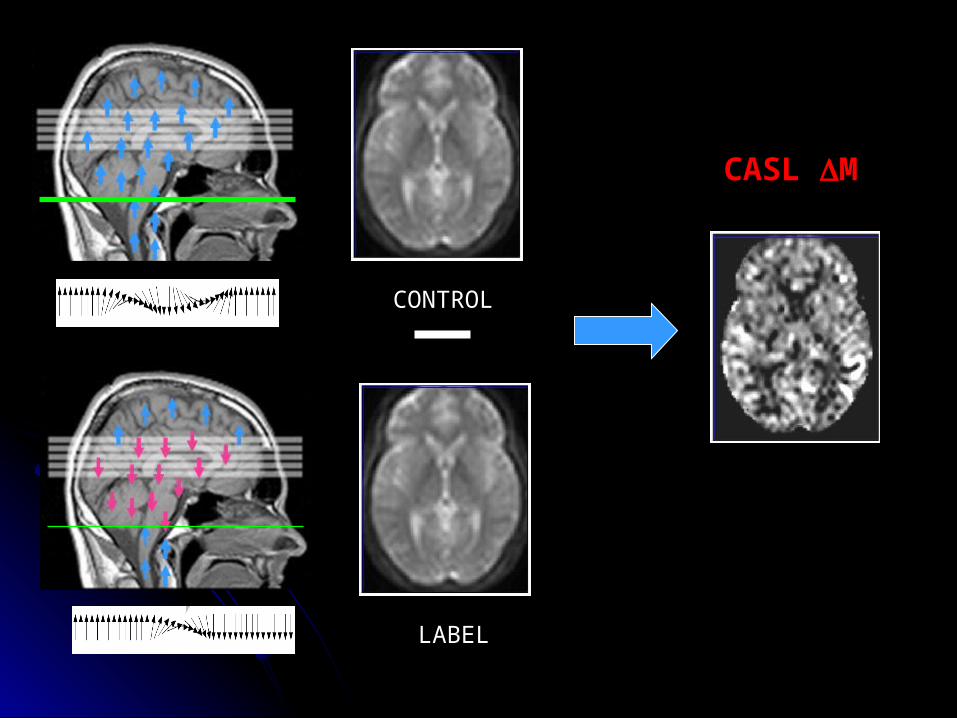
CONTROL
LABEL
CASL M

CONTROL
LABEL
PASL M

ASL Technique OverviewASL Technique Overview
Inverted blood flows through vasculature and exchanges with tissue.
Inflow reduces total tissue magnetization in slice (~1%) compared to control.
““Control” – “Labeled” Control” – “Labeled” CBF CBF

CASL CASL vs.vs. PASL PASL
We focus on CASL!
•Absolute quantification of CBF more straight forward
•SNR higher
•Whole brain coverage
•But, more affected by Magnetization Transfer (MT) effects

0
,0 ( )( )2 ( )( ) a
t
M c dt mM f tt r
Buxton’s Model:
Buxton et al., MRM, 40:383(1998)
Tissue signal = Arterial signal Tissue response
M = control-label tissue magnetizationf = CBF Ma,0 = arterial equilibrium magnetizationc(t)=exp(-a/T1a) = Inflow functionr(t-t’)=exp(-f(t-t’)/) = Residual functionm(t-t’)= exp(-(t-t’)/T1t) = T1 decay functionT1a =Longitudinal relaxation of bloodT1t = Longitudinal relaxation of tissuea = Arterial transit time = Blood-tissue partition coefficient
Tracer Kinetics Theory – Kety Schmidt Method
Ta v
dC tCBF c t c t
dt

Buxton et al., MRM, 40:383(1998)
• Assuming plug flow and a single vascular compartment:
Buxton’s Model (Cont.)
M(t)=0 t<a=2MaoT1appfe-a/T1a(1-e -(t- a)/T1app) a<t<a+=2MaoT1appfe-a/T1a e-(t--a)/T1app(1- e -/T1app) t>a+
T1app=1/T1t+f/

Advanced ModelsAdvanced Models
Optimize model for inflow, residual and TOptimize model for inflow, residual and T11 decay functions decay functions
Acquire images after a PLD to decrease sensitivity to Acquire images after a PLD to decrease sensitivity to aa
Account for off-resonance effectsAccount for off-resonance effects
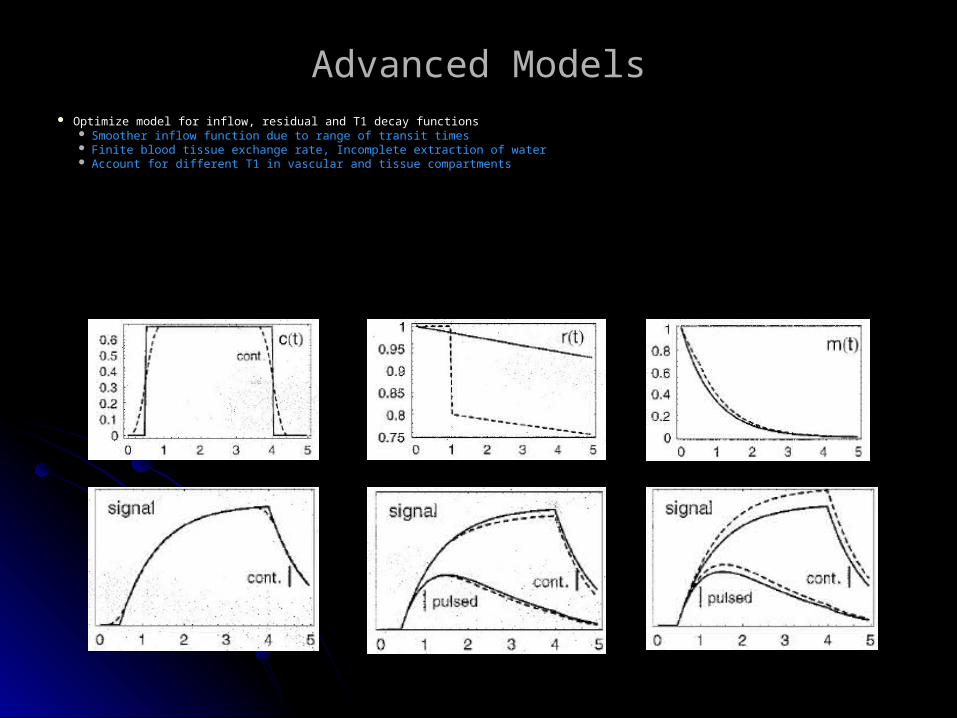
Advanced ModelsAdvanced Models Optimize model for inflow, residual and T1 decay functionsOptimize model for inflow, residual and T1 decay functions
Smoother inflow function due to range of transit times Finite blood tissue exchange rate, Incomplete extraction of water Account for different T1 in vascular and tissue compartments

Advanced ModelsAdvanced Models
Decrease sensitivity to arterial transit time:Decrease sensitivity to arterial transit time:
Insert Post Labeling Delay (PLD)>Insert Post Labeling Delay (PLD)>a before imaginga before imaging
Alsop et al. J. CBF & Met. 16 (1996)

Advanced ModelsAdvanced Models
+
)ee(efTM2
M)T/)w(()T/)0,w(min(T/app1
0b app1app1a1

Advanced ModelsAdvanced Models
Account for off-resonance effects.Account for off-resonance effects.Long off-resonance tagging saturates macromolecule bound protons.Saturated protons exchange with free water: Magnetization Transfer (MT)
Solution:Solution:Acquire Control in presence of a long RF pulseAcquire Control in presence of a long RF pulseCorrect CBF estimation:Correct CBF estimation:
T1app = T1s T1app = T1s during taggingduring tagging T1app = T1ns T1app = T1ns otherwise.otherwise.Place labeling plane farther from imaging volumePlace labeling plane farther from imaging volume
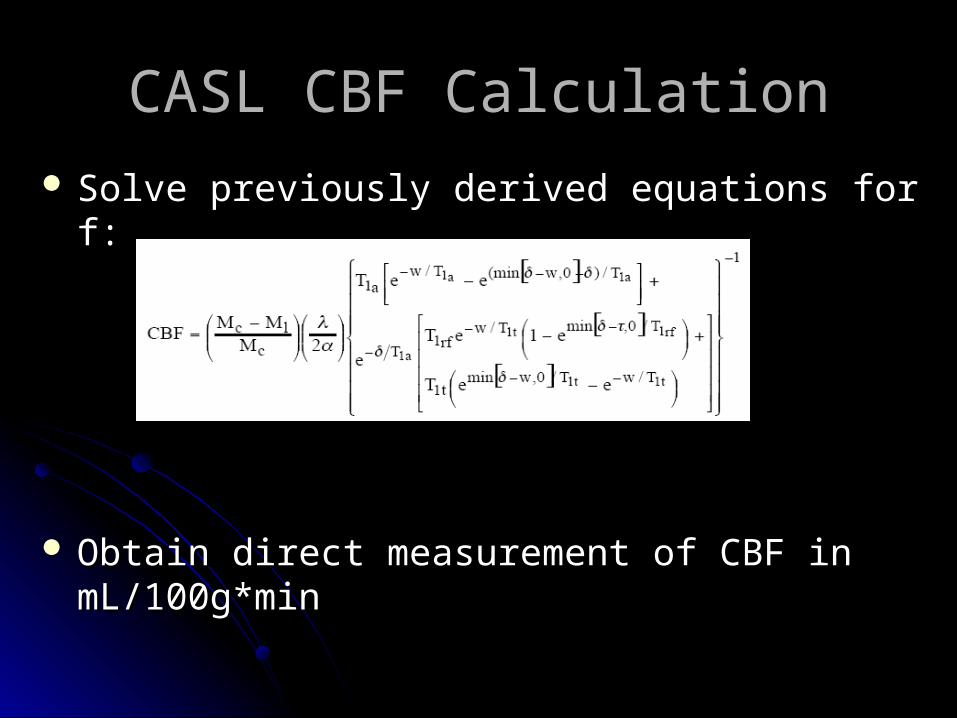
CASL CBF CalculationCASL CBF Calculation Solve previously derived equations for f:Solve previously derived equations for f:
Obtain direct measurement of CBF in mL/100g*minObtain direct measurement of CBF in mL/100g*min

ApplicationsApplications
Study baseline effects of a disease/drug Study baseline effects of a disease/drug on CBFon CBFAlzheimer’s DiseaseAlzheimer’s Disease
Functional MRI (fMRI)Functional MRI (fMRI)Quantify vascular response to stimulusQuantify vascular response to stimulus
Activation due to motor taskActivation due to motor taskActivation due to olfactory stimulusActivation due to olfactory stimulus
Longitudinal activation studyLongitudinal activation studySleep DeprivationSleep Deprivation

Alzheimer’s DiseaseAlzheimer’s Disease
Nerve degeneration, hypometabolismNerve degeneration, hypometabolism
Alsop Alsop et al.et al. and our CASL study showed marked, and our CASL study showed marked, widespread hypoperfusion present in AD groupwidespread hypoperfusion present in AD group
Voxelwise (Healthy – AD) perfusion mapsVoxelwise (Healthy – AD) perfusion maps ROI analysisROI analysis
Alsop et al

Alzheimer’s DiseaseAlzheimer’s Disease Alsop Study
Used Gradient Echo (GE) sequence Mini-mental state examination (MMSE) score = 20.8 ± 7 Studied only several global ROIsStudied only several global ROIs ROIs were hand-drawn on a single subjectROIs were hand-drawn on a single subject Incomplete brain coverageIncomplete brain coverage
Our Study: Used spin echo (SE) sequence Higher MMSE score = 38.6 ± 7 More ROIs, many small gray matter structures Used publicly available atlas More brain coverage Included multivariate analysis

Image ProcessingImage Processing

Voxelwise difference in CBF between AD and Voxelwise difference in CBF between AD and Healthy ControlsHealthy Controls
Yellow: p<0.001 uncorrectedRed: p<0.01 uncorrected
Yellow: p<0.01 uncorrectedRed: p<0.05 corrected
Our Study Alsop et al Study

Our Study: ROI AnalysisOur Study: ROI Analysis

Covariance Analysis of AD StudyCovariance Analysis of AD Study
CASL data CASL cov. pattern applied to PET data

CASL advantages over BOLD fMRICASL advantages over BOLD fMRI
1.1. Provides absolute quantification of CBFProvides absolute quantification of CBFBOLD signal = coupled effect of CBF, CMRO2, CBV CASL has better localization
2. Quantifies resting and activated CBFBOLD can only measure activated states
3. Flat power spectra allows low-frequency fMRIpower spectra allows low-frequency fMRIBOLD negatively affected by 1/f noise
4. Insensitive to magnetic susceptibility effects to magnetic susceptibility effectsBOLD signal based on susceptibility effects
5. Lower inter-subject variability than BOLD inter-subject variability than BOLD

3. CASL flat power spectra allows low-frequency fMRI3. CASL flat power spectra allows low-frequency fMRI
Aguirre et al., Neuroimage (2002)
Avg. across-subject, voxel average power spectra for BOLD and perfusion data.

Finger Tapping
0
1.04
2.08
3.12
4.16
5.2
0 48 96 144 192 240 288 336 384 432 480 528 576 624 672 720 768 816 864 912 960
Low Frequency (24hr) Task Activation
High frequency (1min) Task Activation
Wang et al. Our experiment
3. CASL flat power spectra allows low-frequency fMRI3. CASL flat power spectra allows low-frequency fMRI

Effect of 48hrs Sleep Deprivation on CASL CBF
Good Agreement with PET:
3. CASL flat power spectra allows low-frequency fMRI3. CASL flat power spectra allows low-frequency fMRI

4. CASL insensitivity to susceptibility effects
BOLD relies on susceptibility changesBOLD relies on susceptibility changes
-> Requires Gradient Echo sequence (T2* weighted)-> Requires Gradient Echo sequence (T2* weighted) CASL signal is not based on susceptibility.CASL signal is not based on susceptibility.
-> Can use Spin Echo sequence (T2 weighted)-> Can use Spin Echo sequence (T2 weighted)

Olfaction Study
CASL (our experiment)
4. CASL insensitivity to susceptibility effects
BOLD (Poellinger et al.)BOLD (Poellinger et al.)

Aguirre, G.K. et al. Aguirre, G.K. et al. NeuroimageNeuroimage
5. Reduced inter-subject variability
• Group data more signicicant with perfusion than BOLD• ROI in visual cortex, T-values across subjects

Future DirectionsFuture Directions
Imaging at 3TImaging at 3T Benefits: Longer T1 relaxation Benefits: Longer T1 relaxation Higher Signal Higher Signal Downside: Shorter coilDownside: Shorter coil
PASL at 3TPASL at 3T Regional Perfusion Imaging TechniquesRegional Perfusion Imaging Techniques
Optimization of acquisition parameters to increase SNROptimization of acquisition parameters to increase SNR Separate Coils and/or SENSE coilSeparate Coils and/or SENSE coil

AcknowledgementsAcknowledgements
Iris Asllani, PhDIris Asllani, PhDEric Zarahn, PhDEric Zarahn, PhDJohn Krakauer, MDJohn Krakauer, MDChristian Habeck, PhDChristian Habeck, PhDTruman Brown, PhDTruman Brown, PhD

Normalization/Coregistration IssuesNormalization/Coregistration Issues