article effects of tunnel-soil-structure interaction and
TRANSCRIPT
Article 1
Effects of Tunnel-Soil-Structure Interaction and 2
Tunnel Location on the Seismic Response of Steel 3
Structures 4
Arash Rostami 5
Department of Civil Engineering Islamic Azad University, Central Tehran Branch, Tehran, Iran, 6 [email protected] 7
8
Abstract: Research shows that in earthquakes the ground response changes in areas 9
where there are underground cavities. Due to the fact that subways and underground 10
tunnels pass from beneath buildings in urban areas, these changes in ground response have a 11
direct impact on the seismic behavior of structures. In this study, first by model validity and 12
reliability of the results, steel structures modeling was conducted and steel structure 13
behavior was evaluated due to Tunnel-Soil-Structure seismic interaction. Parameters studied 14
are number of stories, soil type, tunnel depth, horizontal tunnel-structural distance and 15
dynamic loading. Considering that one of the most important parameters of structural 16
control is drift and story displacement, so this important factor will be considered. The 17
results show that tunneling has a direct effect on the rate of structural displacement and 18
increases the structural response. Also, the behavior of the structure is affected by the 19
position of the structure at the ground level and the position of the tunnel and this should be 20
considered during the design phase of the structures. 21
Keywords: Seismic Interaction, Tunnel-Soil-Structure, Steel Structures, Drift, Seismic Response 22
23
1- Introduction 24
25
Nowadays it can be seen that in megacities, traffic and transportation problems could not be 26
solved on the ground surface. Past experience has revealed that the best and fastest way to solve 27
urban transportation in populated areas is to use underground structures. The main phenomena of 28
underground excavations are ground surface displacement, tunnel surrounding displacement and 29
earthquake acceleration changes. Nowadays underground structures such as tunnels, Metro 30
stations and underground parkings are vital infrastructures in most megacities. For many years it 31
was thought that underground tunnels were safe structures and showed an appropriate 32
performance in earthquakes, but in recent earthquakes a lot of tunnel failures have been reported 33
from these underground structures [1-3]. This was more tangible in shallow underground 34
structures; in between what has mainly attracted the attention of researchers is the destruction and 35
damage to the surface structure due to the magnification of surface response which is affected by 36
the presence of these underground spaces [4-12]. In this regard Tabatabaei fard et al. studied on the 37
simplified structure and soil interaction method and presented an equation for evaluating the 38
research results [13]. On the other hand Abat and et al concentrated on modeling and numerical 39
Preprints (www.preprints.org) | NOT PEER-REVIEWED | Posted: 15 November 2019
© 2019 by the author(s). Distributed under a Creative Commons CC BY license.

2 of 22
analysis of the structures’ seismic response in the tunnel and said that the settled tunnel in soil 40
causes shrinkage throughout the tunnel [14-15]. Pitilakis et al. assessed the circle tunnel effects on 41
the ground surface response and behavior and acceleration changes, and presented that the 42
presence of circle tunnels causes acceleration changes on the ground surface. 43
In this regard, several scientists such as Osmarini, Wang, Mitra, and Sagar [16-19] focused on 44
changes in Earth's acceleration. On the other hand, Rostami et al. looked at the amount of force 45
applied to the wall of underground tunnels, and concluded that most internal force was applied on 46
rectangular tunnels [20-21]. Tsinidis et al. Investigated the effect of rectangular cavities in soft soils 47
by numerical and laboratory methods. The study suggested that numerical models may produce 48
more accurate results by considering all the uncertainties involved in the problem that rectangular 49
tunnel responses have recorded in centrifuges [22]. 50
Baziar et al. focused on the ground surface seismic response using physical modeling with 51
shaking table and centrifuges [23]. Fatahi and Tabatabaeifar studied on the seismic behavior of 52
structures on soft soil and did not study further and mainly concentrated on soft soil behavior. The 53
results of this research indicated that the differences between the calculated base shear by 54
equivalent linear method and fully non-linear method were not remarkable [24]. Regarding 55
asymmetry at ground level, Rostami et al. studied the response of ground surface in sloped ground 56
and stated that the amount of response in upstream and downstream slopes was quite different 57
[25]. Numerous efforts have been made in this field, such as the studies of Sika, Rostami, Tsouar, 58
Liu, and Luen [26-34]. Various studies have been carried out to address this issue. 59
One of the most important points in the study of structures and in the design of structures is 60
the displacement of structure floors or floor drift. In the previous studies, many efforts have been 61
made on the effect of the tunnel on changes in ground acceleration and soil-structure interaction. 62
But a detailed study of Tunnel-Soil-Structure interaction has been undertaken. On the other hand, 63
Tunnel-Soil-Structure interactions focusing on ground-level structures located over buried tunnels 64
have not been studied. Therefore, in this study, a state-of-the-art Tunnel-Soil-Structure model was 65
developed by direct design using the very powerful Abacus software to accurately and precisely 66
achieve the dynamic Tunnel-Soil-Structure interaction. The modeling sample can easily calculate 67
the nonlinear behavior and nonlinear geometry of the structure in dynamic analysis. Due to the 68
application of a completely nonlinear behavior in modeling, nonlinear soil behavior in analyzing 69
the dynamic system of Tunnel-Soil-Structure interaction and any nonlinear structural relationships 70
that may arise for the analysis can be calculated with this type of model. 71
72
2- Introducing Parametric Studies 73
74
In this study, the effects of parameters such as tunnel depth, frequency content, number of 75
floors, type of structure, distance of structure from tunnel on the seismic response of ground surface 76
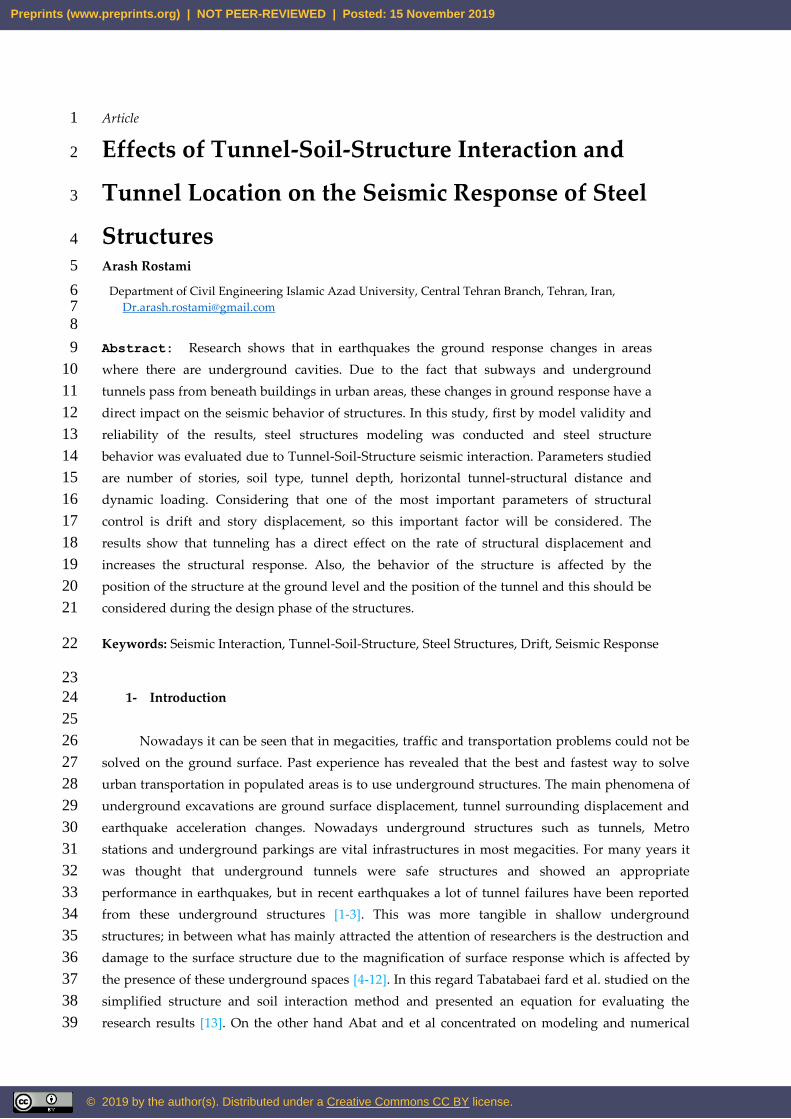
structure will be investigated. Figure (1) shows a schematic form of system modeling. As can be 77
seen from the figure, the structure is located on the soil bed in the depth of the tunnel. For detailed 78
review, as mentioned above, various parameters have been changed and the changes of the 79
parameters will be examined for the behavior and response of the structure. In this figure R is the 80
tunnel diameter , D the depth of the tunnel, H the horizontal distance of the structure from the 81
tunnel, S the height of the structure, a the depth of the soil mass, and b the mass of the soil mass, 82
Preprints (www.preprints.org) | NOT PEER-REVIEWED | Posted: 15 November 2019
3 of 22
and the input wave is applied to the model bed. Also for a more accurate analysis, parameters were 83
made dimensionless so more accurate results were conducted. 84
85
Figure1: Schematic shape of modeling and the soil, structure and tunnel location 86
87
In this figure, 20R = b and 6R = a, and in this analysis, dimensional parameters have been 88
used for detailed analysis. These dimensionless parameters include D / R depth to diameter ratio, H 89
/ D depth to horizontal distance ratio and S / D tunnel depth to structural height ratio. Also in this 90
study, the Ormsby wavelet was applied to the soil bed and then seven real acceleration mappings 91
were used for applying the earthquake force, which will be describe below. 92
93
2-1- Input WAVE 94
2-1-1-Ormsby Wave 95
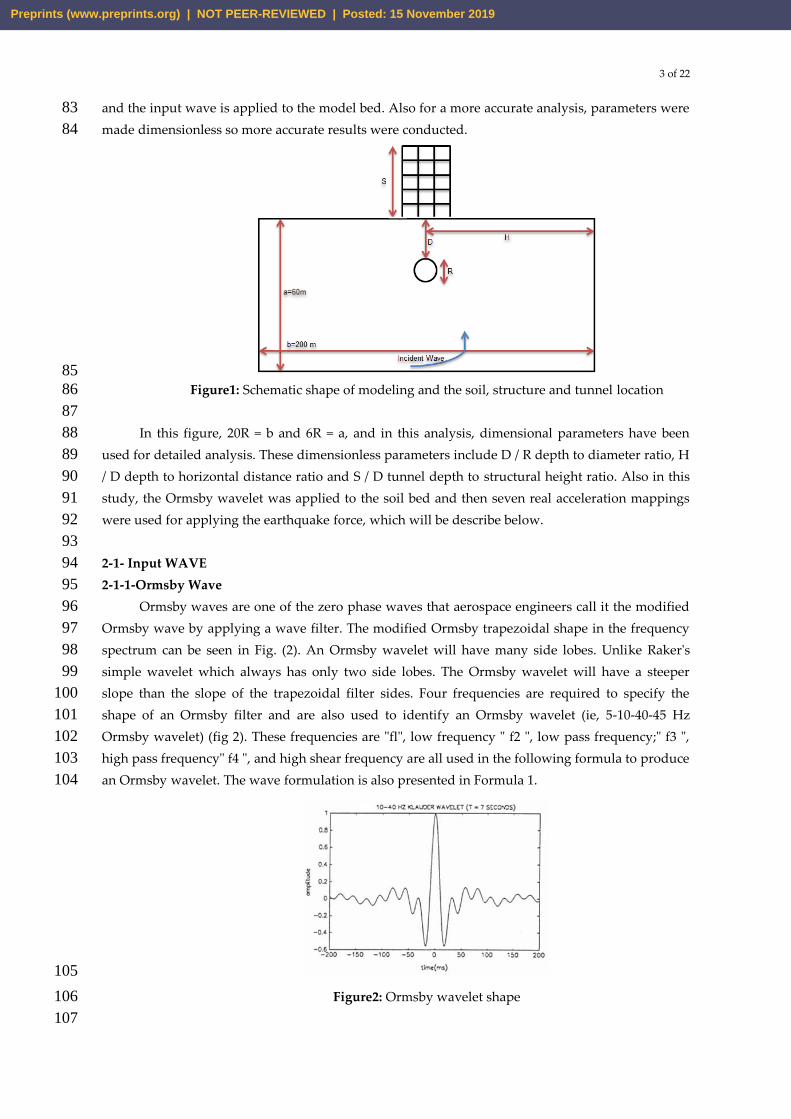
Ormsby waves are one of the zero phase waves that aerospace engineers call it the modified 96
Ormsby wave by applying a wave filter. The modified Ormsby trapezoidal shape in the frequency 97
spectrum can be seen in Fig. (2). An Ormsby wavelet will have many side lobes. Unlike Raker's 98
simple wavelet which always has only two side lobes. The Ormsby wavelet will have a steeper 99
slope than the slope of the trapezoidal filter sides. Four frequencies are required to specify the 100
shape of an Ormsby filter and are also used to identify an Ormsby wavelet (ie, 5-10-40-45 Hz 101
Ormsby wavelet) (fig 2). These frequencies are "fl", low frequency " f2 ", low pass frequency;" f3 ", 102
high pass frequency" f4 ", and high shear frequency are all used in the following formula to produce 103
an Ormsby wavelet. The wave formulation is also presented in Formula 1. 104
105
Figure2: Ormsby wavelet shape 106
107
Preprints (www.preprints.org) | NOT PEER-REVIEWED | Posted: 15 November 2019

4 of 22
(1)
Ormsby (t) = [(πf4)2
((πf4) − (πf3)) sin2(πf4t) −
(πf3)2
((πf4) − (πf3)) sin2(πf3t) ]
− [(πf2)2
((πf2) − (πf1)) sin2(πf2t) −
(πf1)2
((πf2) − (πf1)) sin2(πf1t) ]
108
After applying this wavelet to the structure, since the study process is based on the reference 109
article and at first the Riker wave is radiated, in this study because of a larger range of Ormsby 110
wave that covered more wavelengths this wave was used. We used and applied the wave to the 111
model first and then applied the actual mapping acceleration to the model. Since the study is 112
general and aims to determine the structural response to different earthquakes, therefore, based on 113
the soil type, the modeling and its conformity was conducted according to Euro Code earthquake 114
characteristics of these seven real earthquakes based on the Euro Code recommended by this Code, 115
so these records are used in the analysis. For modeling process based on the 2800 Code [35] 116
earthquakes are applied to the soil mass floor (Table 1). 117
118
Table1: the characteristics of the seven Euro code earthquakes 119
Magnitude
(Richter)
Distance of
Fault (Km)
Year Station Name Earthquake Name
6.9 119 1995 TOT KOBE
6.93 9.64 1989 Station Gilory LOMAPRIETA
6.06 19.5 1986 Silent Station Valley NORTHPALM
6.69 27.7 1994 Station Vasquez NORTHRIDGE
6.19 11.7 1996 Temblorpre PARKFIELD
5.28 11.13 1957 Golden gate Park SANFRANCISCO
5.99 22.4 1987 Station Mt Wilson WHITTIERNARROWS
120
121
3- Verification and Modeling 122
123
This section examines how structures are modeled and the validation for modeling in the 124
Abacus software. Regarding modeling and validation in different softwares, they are described in 125
the following. 126
127
Preprints (www.preprints.org) | NOT PEER-REVIEWED | Posted: 15 November 2019
5 of 22
3-1- Verification 128
129
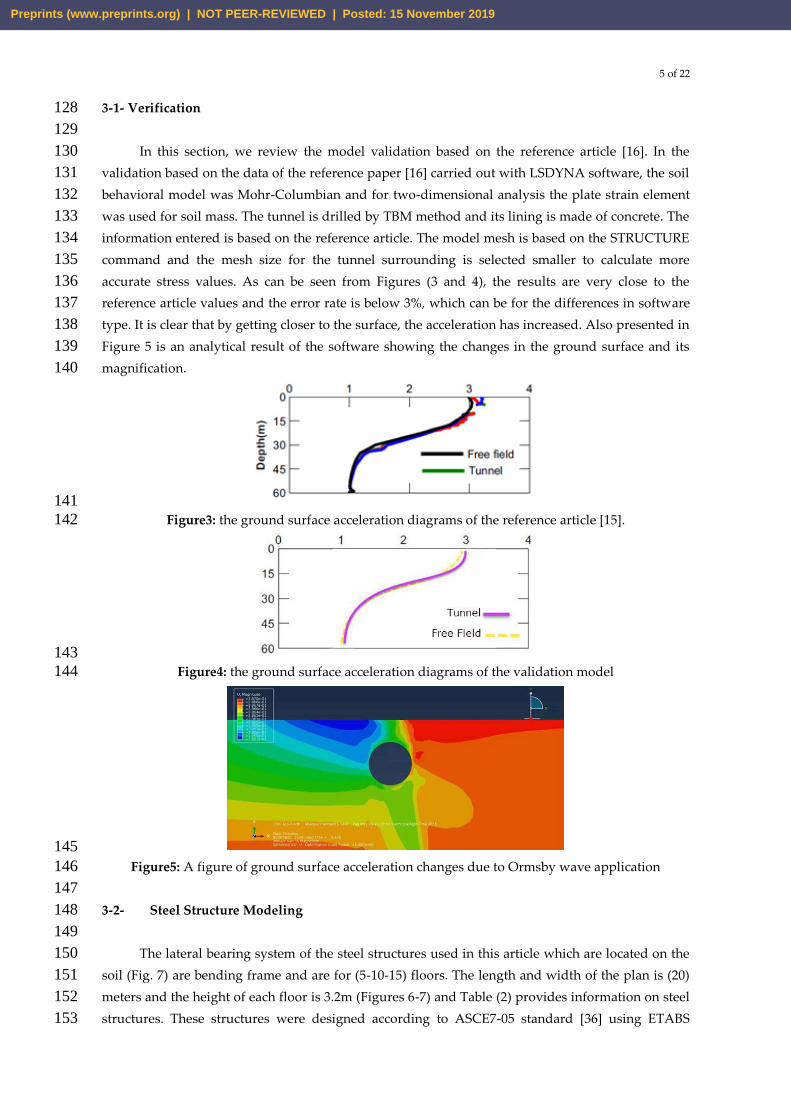
In this section, we review the model validation based on the reference article [16]. In the 130
validation based on the data of the reference paper [16] carried out with LSDYNA software, the soil 131
behavioral model was Mohr-Columbian and for two-dimensional analysis the plate strain element 132
was used for soil mass. The tunnel is drilled by TBM method and its lining is made of concrete. The 133
information entered is based on the reference article. The model mesh is based on the STRUCTURE 134
command and the mesh size for the tunnel surrounding is selected smaller to calculate more 135
accurate stress values. As can be seen from Figures (3 and 4), the results are very close to the 136
reference article values and the error rate is below 3%, which can be for the differences in software 137
type. It is clear that by getting closer to the surface, the acceleration has increased. Also presented in 138
Figure 5 is an analytical result of the software showing the changes in the ground surface and its 139
magnification. 140
141
Figure3: the ground surface acceleration diagrams of the reference article [15]. 142
143
Figure4: the ground surface acceleration diagrams of the validation model 144
145
Figure5: A figure of ground surface acceleration changes due to Ormsby wave application 146
147
3-2- Steel Structure Modeling 148
149
The lateral bearing system of the steel structures used in this article which are located on the 150
soil (Fig. 7) are bending frame and are for (5-10-15) floors. The length and width of the plan is (20) 151
meters and the height of each floor is 3.2m (Figures 6-7) and Table (2) provides information on steel 152
structures. These structures were designed according to ASCE7-05 standard [36] using ETABS 153
Preprints (www.preprints.org) | NOT PEER-REVIEWED | Posted: 15 November 2019

6 of 22
software. The analysis for these structures is linear-time-history type so that they are analyzed by 154
earthquake records in a non-tunnel state. The roof structures are block joists weighing (600) kg dead 155
load and (200) kg live load in each square meter. The surrounding walls load are also applied on the 156
side beams for each floor (600) kg/m and for the roof (160) kg/m. for gravity loading the 6th 157
Standard code[37] and for seismic loading the 2800 standard [35] was used. The beam and column 158
sections were chosen from the software by (EURO.PRO) . The sections used in each class are in 159
accordance with Table (3). in Linear and nonlinear time history analysis scaled earthquake records 160
should be used. To scale the records, acceleration mapping coordination is used in accordance with 161
the 2800 standard. In the linear time-history analysis, the obtained base shear is coordinated with 162
the base shear of linear static analysis due to structural standards. 163
164
Table2: Size and Dimensions of the Used Frames 165
Total
Width
(m)
Total
Height
(m)
Bay
Width
(m)
Story
Height
(m)
Number
of Bays
Number
of Stories
Reference
Name
12 12 4 3 3 4 S 4
12 24 4 3 3 8 S 8
12 36 4 3 3 12 S12
166
Figure6: 5, 10 and 15 floor steel structure plans 167
Preprints (www.preprints.org) | NOT PEER-REVIEWED | Posted: 15 November 2019

7 of 22
168
Figure7: 5, 10 and 15 floor steel structures 169
170
Table3: the sections used in the steel structure 171
Beam Column Storey Structure Num
IPE270 HE280B 1 & 2
5 Storey
1
IPE270 HE260B 3 & 4 2
IPE240 HE260B 5 3
IPE360 H400*237 1 & 2
10 Storey
1
IPE360 H400*237 3 & 4 2
IPE360 HE400B 5 & 6 3
IPE270 HE360B 7 & 8 4
IPE240 HE360B 9 & 10 5
IPE600 H400*744 1 & 2
15 Storey
1
IPE600 H400*744 3 & 4 2
IPE600 H400*634 5 & 6 3
IPE600 H400*634 7 & 8 4
IPE600 H400*340 9 & 10 5
IPE500 H400*340 11 & 12 6
IPE360 H400*237 13 & 14 7
IPE270 HE400B 15 8
172
3-3- Modeling the soil and tunnel 173
In this section the tunnel and soil are modeled. In this study the tunnel is excavated using a 174
TBM and the lining of the tunnel is made from high strength concrete which its characteristics is 175
mentioned in table4. The tunnel is assumed to be buried in the ground so that the displacements are 176
applied directly from soil. Also in the tunnel lining modeling Beam elements are used and the tunnel 177
is connected to soil by the Tie command. On the other hand, for modeling the soil, the elastic-plastic 178
or Mohr-Columbian behavioral model is used which are presented in Table 5. The size of the 179
structure is selected according to the reference article, which is 200 meters long and 60 meters wide. 180
Preprints (www.preprints.org) | NOT PEER-REVIEWED | Posted: 15 November 2019
8 of 22
Of course, certain criteria for determining these dimensions have been stated by the researchers, 181
which will be discussed in the following. The mesh size is small enough to allow fine accuracy in the 182
results and also to prevent divergence of the analysis so that the mesh size can easily simulate wave 183
propagation. For this purpose, the dimensions of the elements are smaller than one tenth of the shear 184
wavelength (Δl˃λ / 10) propagated in the medium on the basis of the recommendation of Collimer 185
and Lyselmer [38]. The damping value is 5% and Rayleigh damping is used. To prevent the waves 186
from spreading into the soil, the Lysmar Free Field model was used and springs were used to absorb 187
the incoming waves. 188
189
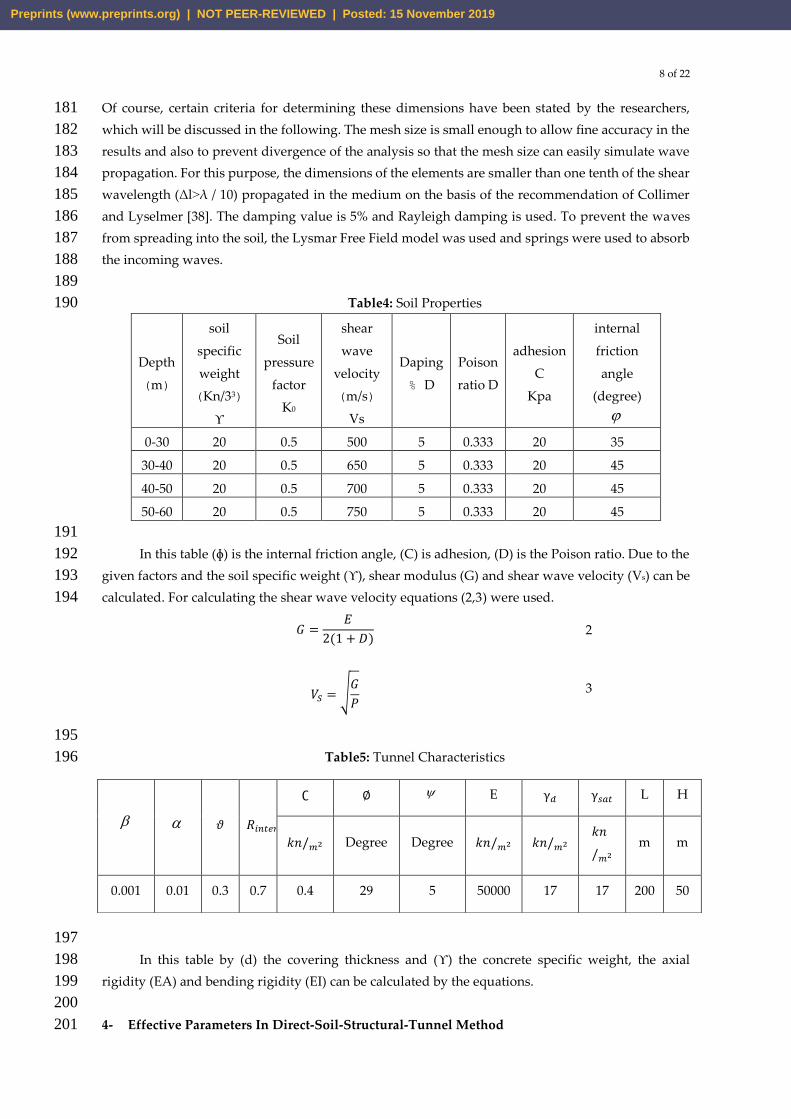
Table4: Soil Properties 190
internal
friction
angle
(degree)
adhesion
C
Kpa
Poison
ratio D
Daping
D %
shear
wave
velocity
(m/s )
Vs
Soil
pressure
factor
K0
soil
specific
weight
(3Kn/3 )
ϒ
Depth
(m)
35 20 0.333 5 500 0.5 20 0-30
45 20 0.333 5 650 0.5 20 30-40
45 20 0.333 5 700 0.5 20 40-50
45 20 0.333 5 750 0.5 20 50-60
191
In this table (ɸ) is the internal friction angle, (C) is adhesion, (D) is the Poison ratio. Due to the 192
given factors and the soil specific weight (ϒ), shear modulus (G) and shear wave velocity (Vs) can be 193
calculated. For calculating the shear wave velocity equations (2,3) were used. 194
2 𝐺 =𝐸
2(1 + 𝐷)
3 𝑉𝑆 = √𝐺
𝑃
195
Table5: Tunnel Characteristics 196
197
In this table by (d) the covering thickness and (ϒ) the concrete specific weight, the axial 198
rigidity (EA) and bending rigidity (EI) can be calculated by the equations. 199
200
4- Effective Parameters In Direct-Soil-Structural-Tunnel Method 201
H L γ𝑠𝑎𝑡 γ𝑑 E ∅ ∁
𝑅𝑖𝑛𝑡𝑒𝑟 𝜗
m m 𝑘𝑛
/𝑚2 𝑘𝑛/𝑚2 𝑘𝑛/𝑚2 Degree Degree 𝑘𝑛/𝑚2
50 200 17 17 50000 5 29 0.4 0.7 0.3 0.01 0.001
Preprints (www.preprints.org) | NOT PEER-REVIEWED | Posted: 15 November 2019
9 of 22
In this section, we investigate various factors in modeling and theory of Tunnel-Soil-Structure 202
system. The important point here is to integrate the tunnel system into the soil-structure system. 203
Considering that the tunnel is buried in the soil, the behavior of the tunnel and its displacements and 204
stresses are directly related to the soil mass, so that the Tunnel-Soil-Structure system can be adapted 205
from the direct soil-structure model. So, here are the things to come. 206
207
4-1- Introduction 208
The equations governing the interaction movements of the hybrid structures (soil and 209
structures) and the method of solving these equations are relatively complex. Therefore, the direct 210
method is the method in which the whole soil-structure system is formed in one step, which is used 211
in this study. The use of direct method requires a computer program that can simultaneously discuss 212
the behavior of soil and structures in equal proportions [39]. Therefore, the Abacus finite element 213
software, version 2-14-6, is used to model the structure-soil-tunnel system and to solve complex 214
geometric equations and boundary conditions. The program can simulate a variety of soil and 215
structural behavior models. The materials are provided by elements that can be adjusted to suit the 216
geometry of the model. Each element behaves according to a defined basic model in response to 217
applied forces or applied constraints. To model the structure-soil-tunnel system in a straightforward 218
way, a new advanced Tunnel-Soil-Structure model is designed in Abacus that simulates and 219
analyzes all interactive aspects of the complex dynamical system present in this interaction in a 220
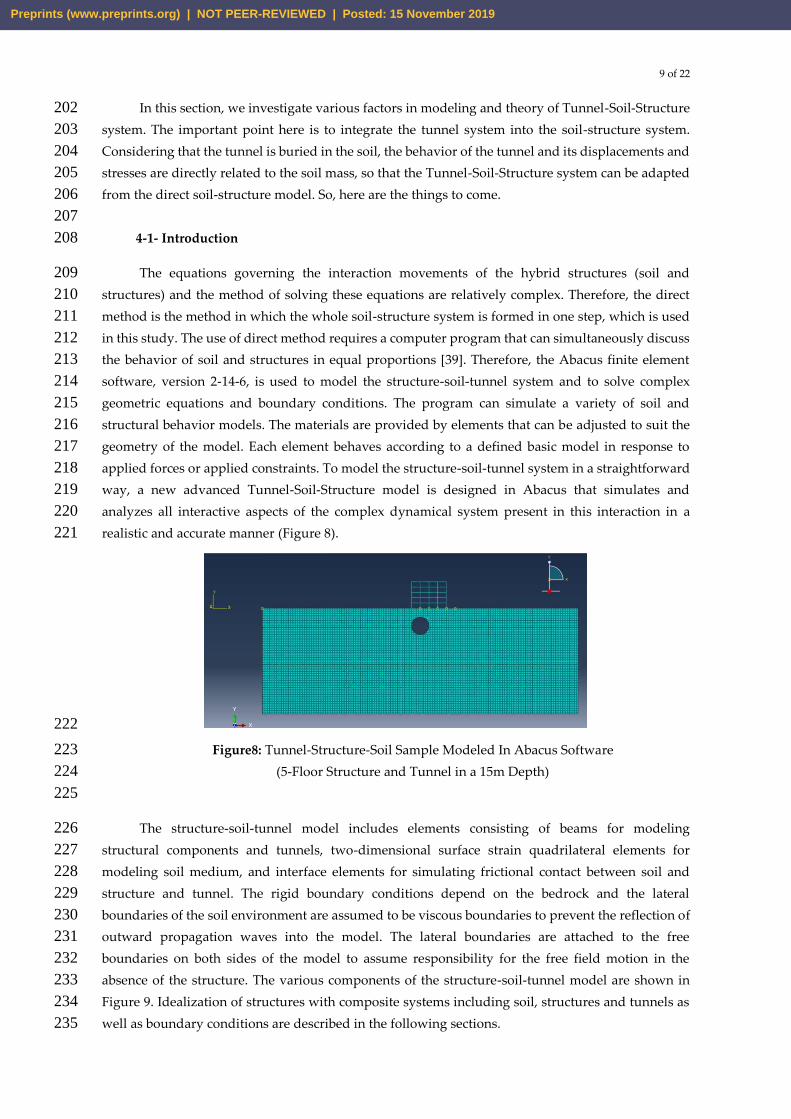
realistic and accurate manner (Figure 8). 221
222
Figure8: Tunnel-Structure-Soil Sample Modeled In Abacus Software 223
(5-Floor Structure and Tunnel in a 15m Depth) 224
225
The structure-soil-tunnel model includes elements consisting of beams for modeling 226
structural components and tunnels, two-dimensional surface strain quadrilateral elements for 227
modeling soil medium, and interface elements for simulating frictional contact between soil and 228
structure and tunnel. The rigid boundary conditions depend on the bedrock and the lateral 229
boundaries of the soil environment are assumed to be viscous boundaries to prevent the reflection of 230
outward propagation waves into the model. The lateral boundaries are attached to the free 231
boundaries on both sides of the model to assume responsibility for the free field motion in the 232
absence of the structure. The various components of the structure-soil-tunnel model are shown in 233
Figure 9. Idealization of structures with composite systems including soil, structures and tunnels as 234
well as boundary conditions are described in the following sections. 235
Preprints (www.preprints.org) | NOT PEER-REVIEWED | Posted: 15 November 2019

10 of 22
236
Figure9: Components of the Tunnel-Soil-Structure Model 237
238
239
4-2- Elastic Dynamic Analysis and Design 240
Workshop civil engineers usually use nonlinear analytical methods for seismic evaluation and 241
design of existing and new buildings. The main purpose of seismic analysis is to accurately predict 242
the expected behavior of the structure against future earthquakes. This has become an important 243
goal with the emergence of a performance-based design (PBD) as a technique for seismic evaluation 244
and design using performance prediction for structural safety and risk assessment [41]. Since 245
structural damage implies inelastic behavior, traditional design and analysis methods are based on 246
linear elastic techniques and can only implicitly predict the level of performance. In contrast, the 247
purpose of the seismic analysis method is to directly estimate the amount of non-elastic and 248
distortion (performance level) changes. Performance levels classify structural states after being 249
exposed to a particular hazard as either 1) fully operational, 2) operational, 3) life safety, 4) near 250
collapse, and 5) collapse. Overall lateral deflection, ductility demand, and inter story drift are the 251
most commonly used damage parameters [42-43]. These five levels of quality performance 252
correspond to the maximum inter story drift (as a damage parameter): 0.2% - 0.5% - 1.5% - 2.5% and 253
more than 2.5%, respectively. Therefore, analysis and seismic design method in this study are 254
directly used to estimate the level of performance of structural system. In structural analysis and 255
design of seismic design, the final load of the structure is considered as the design criterion. This is a 256
fast approach and provides a rational approach to structural analysis. It also provides a cost-effective 257
design because the sections required in this method are smaller in size than the linear method. Also, 258
this method uses a plastic moment to determine the plastic behavior of column and beam elements. 259
260
4-3- Structure 261
Structural elements such as beams, columns, slabs, foundations and tunnel lining are defined 262
using beam elements in the structure-soil-tunnel model (Figure 2). Structural elements of the 263
two-node beam element, finite elements, with six degrees of freedom per node include three 264
Preprints (www.preprints.org) | NOT PEER-REVIEWED | Posted: 15 November 2019

11 of 22
transitional and three rotational components. Structural element logic is applicable by explicit 265
solution method. By default, the beam acts as an isotropic, linear, boundless elasticity material; 266
however, a restrictive plastic moment can be specified to shape the structure's rigid behavior. Large 267
displacements, including nonlinear geometrical displacements, can be replaced by the 268
determination of a larger solution; and the complete dynamic response of the system in the time 269
domain can be obtained with the dynamic analysis option. As mentioned earlier, non-elastic 270
structural analysis has been used in this study. The general process of non-elastic structural analysis 271
resembles conventional linear methods in which engineers create a structural model that is then 272
subjected to a predicted earthquake-related motion or external excitation. In this study, the 273
non-elastic bending is simulated by the determination of a finite plastic moment in the structural 274
elements. If a plastic moment is specified, its value can be calculated with respect to a flexible 275
bending structural member with a b width and an h height with yield stress of the material σy 276
(Formula 4). If a composed element member has a perfectly elastic behavior, MP plastic resisting 277
moments for rectangular sections can be calculated as follows: 278
4 )𝑏ℎ2
4(y σ= PM
279
Where b is the width, h the cross-section height, and σy is the yield stress of the materials. The 280
present formulations used in this study assume that the structural elements behave flexibly until 281
they reach (or become) the specified plastic moment. In the parts where the plastic moment is 282
obtained, they can deform without resistance. 283
284
4-4- Soil 285
The soil environment of the substructure has been simulated using two-dimensional 286
plane-strain networks. In this scheme, the solid soil mass is divided into a finite element network 287
consisting of four elements. The Mohr-Coulomb model in the present study has been used as a 288
constructive model in the structure-soil model to simulate the nonlinear behavior of soil medium 289
and Tunnel-Soil-Structure system. The Mohr-Coulomb model is a complete plastic model developed 290
by many researchers (e.g. [23,45-44]) and has been used to model the effect of structure – soil 291
dynamic interaction to simulate soil behavior at seismic loads in soil – structure – tunnel systems. 292
293
4-5- Interface Elements 294
The foundation location in numerical simulations is separated from the adjacent soil zone by 295
interface elements to simulate frictional contact. The relationship between foundation and soil is 296
modeled using Ks shear springs and ordinary Kn between two surfaces that are in contact with each 297
other using linear system springs. These relationships are defined using the shear failure criterion of 298
the Mohr-Columb failure criterion (Figure 10). 299
Preprints (www.preprints.org) | NOT PEER-REVIEWED | Posted: 15 November 2019

12 of 22
300
Figure 10- Interface Elements Including the Shear and Normal Spring Stiffness 301
302
The relative motion of the interface is controlled by the interface of hard values in normal and 303
tangential directions. The stiffness values of ordinary shear springs for the soil-structure model 304
interface element are set to 10 times the stiffness of the adjacent region. This is based on the 305
relationship recommended by EL Naggar [45] and the Itasca Consulting Group [46] for soils having 306
similar isotropic properties (Formula 5): 307
308
5 𝐾𝑠 = 𝐾𝑛 = 10 [𝑘 + (4/3)𝐺
∆𝑧𝑚𝑖𝑛
]
309
Where K and G are the shear and mass coefficients of the neighboring region, and Δzmin is 310
the smallest width of an adjacent region in the normal direction. The current numerical model 311
employs the contact logic defined by Cundall and Hart [47] for both sides of the interface. This code 312
maintains a list of grid points (i, j) located on each side of each specific level. Each point is taken in 313
turn and examined for contact with the nearest neighbor on the opposite side of the interface. During 314
each time step, the velocity (u_i) of each grid point is calculated. Since the displacement velocity 315
units are in the time step, and the calculation of the time step unifies to accelerate convergence. The 316
incremental displacement for any given time is equal to the incremental relative displacement vector 317
at the point of contact is inclined toward the normal and shear components, and the normal shear 318
forces are generally determined as follows: 319
6 ∆𝑢𝑖=𝑢𝑖̇
7 𝐹𝑛(𝑡+∆𝑡)
= 𝐹𝑛(𝑡)
− 𝑘𝑛∆𝑢𝑛(𝑡+0.5∆𝑡)
𝐿
8 𝐹𝑠(𝑡+∆𝑡)
= 𝐹𝑠(𝑡)
− 𝑘𝑠∆𝑢𝑠(𝑡+0.5∆𝑡)
𝐿
320
Where ks is the shear spring stiffness, kn is the normal spring stiffness, L is the effective 321
contact length, Fs is the total shear force and Fn is the total normal force, us is the relative 322
displacement vector in the shear direction and un is the incremental relative displacement vector in 323
the normal direction and Δt is the time step. 324
325
4-6- Lateral Boundary Conditions Of The Model 326
Preprints (www.preprints.org) | NOT PEER-REVIEWED | Posted: 15 November 2019

13 of 22
Chopra and Gutierrez [48] proposed that stationary conditions can be assumed at numerical 327
grid points at the lateral boundaries of the soil in the vertical direction, whereas free conditions can 328
be assumed in the horizontal direction. These types of borders are called primitive borders. In the 329
vertical state, free boundaries can be realistically assumed horizontally. However, in dynamical 330
problems, such boundary conditions can reflect the outward propagation waves into the model and 331
do not allow the required energy radiation. In this regard, Roesset and Ettouney [49] proposed an 332
alternative as the best solution to this problem and proposed viscous boundaries to avoid the 333
reflection waves generated by the lateral boundaries of the soil. They concluded this after a 334
comprehensive study of the performance of different types of soil boundary conditions for dynamic 335
problems. Therefore, for lateral boundaries of the soil medium, viscous boundaries have been 336
proposed and developed by Lysmer and Kuhlemeyer [50] for use in this study. The proposed 337
method is based on the use of independent bumpers in the normal and shear directions at the model 338
boundaries. This bumper creates a normal viscosity and shear traction provided by the following 339
formula: 340
9 Tn= -ρCpvn
10 Ts= -ρCsvs
341
In these equations Tn and Tz are respectively normal and shear raction at model boundaries; 342
vn and vs are normal and shear elements at velocity boundaries; ρ is the density of matter. And Cp 343
and Cs are the wave forms of p and s, respectively. Numerical analysis of the seismic response of 344
surface structures requires the division of an area adjacent to the materials near the foundation. 345
Seismic input (or applied seismic force) is typically propagated by plane waves propagating upward 346
beneath the material. Ground responses that are not affected by the presence of structures are 347
considered as free ground movements. In this study, in the extended structure-soil-tunnel model, 348
the boundary conditions on both sides of the model are considered for the free-field displacement 349
that exists in the absence of the structure. The boundaries of free land have been simulated using an 350
advanced technique that involves performing one-dimensional free calculations in parallel with the 351
main grid analysis. 352
353
Figure11: Tunnel-Structure-Soil Schematic Shape and Lateral Boundaries 354
355
Preprints (www.preprints.org) | NOT PEER-REVIEWED | Posted: 15 November 2019

14 of 22
As shown in Fig. 11, the lateral boundaries of the main grid are connected to the simulated 356
free-surface grid by the bumpers, which represent the viscous boundaries on both sides of the 357
model, and the unbalanced forces from the free-field grid are applied to the main grid boundary. 358
Both conditions applied to the left border are expressed as follows: 359
360
11 𝐹𝑥 = − [𝜌𝐶𝑝(𝜈𝑥𝑚 − 𝜈𝑥
𝑓𝑓) − 𝜎𝑥𝑥
𝑓𝑓]∆𝑆𝑦
12 𝐹𝑦 = − [𝜌𝐶𝑠(𝜈𝑦𝑚 − 𝜈𝑦
𝑓𝑓) − 𝜎𝑥𝑦
𝑓𝑓]∆𝑆𝑦
361
In these equations, ،𝐹𝑥 and و𝐹𝑦 are the unbalanced forces applied to the free land grid 362
towards the main boundary grid in the x and y directions. ∆𝑆𝑦 is the average vertical zone size at 363
the network boundary point. 𝜈𝑥𝑚 is the velocity of the x point of the network in the main network. 364
𝜈𝑦𝑚 is the speed of the point y in the main grid. 𝜈𝑥
𝑓𝑓 the velocity of the point x grid on free ground. 365
𝜈𝑦𝑓𝑓 The velocity of the point y of the grid on free ground. 𝜎𝑥𝑥
𝑓𝑓 is the mean horizontal stress of free 366
land at grid point and 𝜎𝑥𝑦𝑓𝑓 is the mean free shear stress at grid point. Also, similar expressions may 367
be written for the right border. 368
As such, the plane waves traveling upwards do not cause any distortion at the boundary, 369
since the free land network provides conditions similar to those in the infinite model. It should be 370
noted that if the main grid is uniform and there are no surface structures, lateral bumping will not be 371
applied because the free land grid performs the same movement as the main grid. 372
373
4-7- The Model bedrock boundary conditions 374
In terms of bedrock boundary conditions, Kocak and Mengi [51] explained that hard 375
boundary conditions are the most suitable conditions for modeling the main bedrock for dynamic 376
analysis of soil-structure. Dutta and Roy [52] also reached the same conclusion in their critical 377
review of the idealization of the soil-structure system. In addition, in numerical analysis performed 378
by other researchers (e.g. [53-54]) the boundary conditions for the hard bedrock are assumed. 379
According to previous studies, hard bedrock boundary conditions in the numerical model of 380
structure-soil-tunnel have been used in this study. In addition, earthquake acceleration is directly 381
applied to grid points along the hard bedrock of the grid in the present study. 382
383
4-8- Soil boundary distances 384
Concerning the distance between the boundaries, Rayhani and Naggar concluded that the 385
horizontal distance of the lateral boundaries of the soil should be at least five times the width of the 386
structure. In addition, Rayhani and Naggar [45] recommend a 30-meter maximum bedrock depth in 387
numerical analysis after conducting comprehensive numerical modeling and centrifuge model 388
testing, since the highest magnification occurs at the first 30-meter soil level. The horizontal distance 389
of the soil mass is 5 times the width of the building. In addition, modern seismic codes (e.g. [56-41]) 390
only address the effects of location based on features 30 m above the soil surface. Considering that in 391
this study the effects of tunnel depth are also considered, we consider 60 m depth. Therefore, in this 392
study, the maximum bedrock depth is 60 meters, while the horizontal distance of soil boundaries is 393
100 meters. However, it should be noted that according to Luco and Hadjian [57] when there is deep 394
Preprints (www.preprints.org) | NOT PEER-REVIEWED | Posted: 15 November 2019

15 of 22
bedrock, the representation of the three-dimensional soil system interaction with the 395
two-dimensional models can lead to the underestimation of the maximum response. 396
397
5- Discussing the results 398
In this section, the results of modeling are examined. Due to the factors under consideration 399
including the number of floors, tunnel depth, and horizontal distance of the structure from the 400
tunnel, we therefore focus on examining these factors individually and the interaction between 401
Tunnel-Soil-Structure. The studied structures consist of three types of simple bending frame steel 402
with different heights. Also, to investigate the effect of tunnel depth, the tunnel was set at a depth of 403
10-20-30-40-50 meters and also to investigate the effect of horizontal distance between tunnel and 404
structure of buildings they were located in distances of 5-10-15-20 meters from the tunnel and the 405
effects of this interaction were calculated. In the numerical analysis performed by other researchers 406
on two-dimensional and three-dimensional modeling in soil-structure systems (e.g. [50, 52, 57-58]), 407
the difference between the final results of two-dimensional plane strain and three-dimensional 408
models using artificial rigid bedrock is not remarkable. For example, Seo et al. [57] developed 409
three-dimensional frequency-dependent elements for soil-structure interaction analysis and 410
compared the analytical results of their three-dimensional model with the other three simple 411
two-dimensional models from previous studies. They showed that although good results were 412
obtained using three-dimensional elements, the results of the three-dimensional and 413
two-dimensional analysis were negligible with some conditions such as rigid bedrock. A similar 414
approach has been used in this paper by several other researchers such as Zheng and Takeda [53], 415
Galal and Naimi [59], Tabatabaiefar et al. [60]. 416
417
5-1- Five-Floor Building 418
419
In the modeling, a complete nonlinear time history analysis was used to evaluate the response 420
of the steel structure due to Tunnel-Soil-Structure interaction. In this case, more than 70 analysis 421
were performed for each structure with respect to the number of acceleration records (7 cases) and 422
the number of evaluation modes (5 depth modes and 5 horizontal modes) and the average results 423
have been presented in Fig. 12 (a and b). As shown in Fig. 12a, the horizontal axis is the structural 424
floors and the vertical axis is the structural displacement in centimeters. This figure shows that the 425
tunnel has a direct impact on the movement of the structural floors. A closer look at this figure 426
reveals that the structure at the 5-meter location of the axis tunnel has the highest displacement, 427
meaning that the magnification occurs not at the tunnel axis but at a distance of 5 meters. It is clear 428
from this figure that by distancing from the tunnel axis the tunnel's impact on the displacement of 429
the structure decreases. Fig. 12b shows the amount of drift in the structure as the horizontal axis is 430
based on meter, and as can be seen, the maximum amount of drift has occurred in the structure 431
when the structure is within 5 m of the Tunnel axis and as the structure distances from the tunnel 432
axis this rate decreases. Fig. 13 (a and b) shows the displacement and drift rate of the 5-story 433
structure with tunnel displacement in depth. It is speculated that the tunnel has a direct impact on 434
the displacement and drift of the structure, and on the other hand, this displacement decreases as the 435
depth increases and the maximum displacement is at a depth of 5 m near the surface. The drift 436
amount is calculated according to the standard from Formula 13: 437
Preprints (www.preprints.org) | NOT PEER-REVIEWED | Posted: 15 November 2019

16 of 22
438
13
𝑑𝑟𝑖𝑓𝑡 = (𝑑𝑖+1 − 𝑑𝑖)/ℎ
Which 𝑑𝑖+1 is the floor displacement in the (i+1) floor and 𝑑𝑖 is the floor displacement in the 439
(i) floor and h is the structure height. 440
441
442 Figure12: Displacement and Drift Diagram of a 5-Story Structure Due To Changes in the Horizontal 443
Distance between the Structure and the Tunnel. The Right-Hand Shape, the Displacement of the 444
Structure; the Left-Hand Shape, Floor Drifts 445
446
Figure13: Displacement and Drift Diagram of a 5-Story Structure Due To Changes in the Vertical 447
Distance between the Structure and the Tunnel. The Right-Hand Shape, the Displacement of the 448
Structure; the Left-Hand Shape, Floor Drifts 449
450
5-2- Ten-Floor Building 451
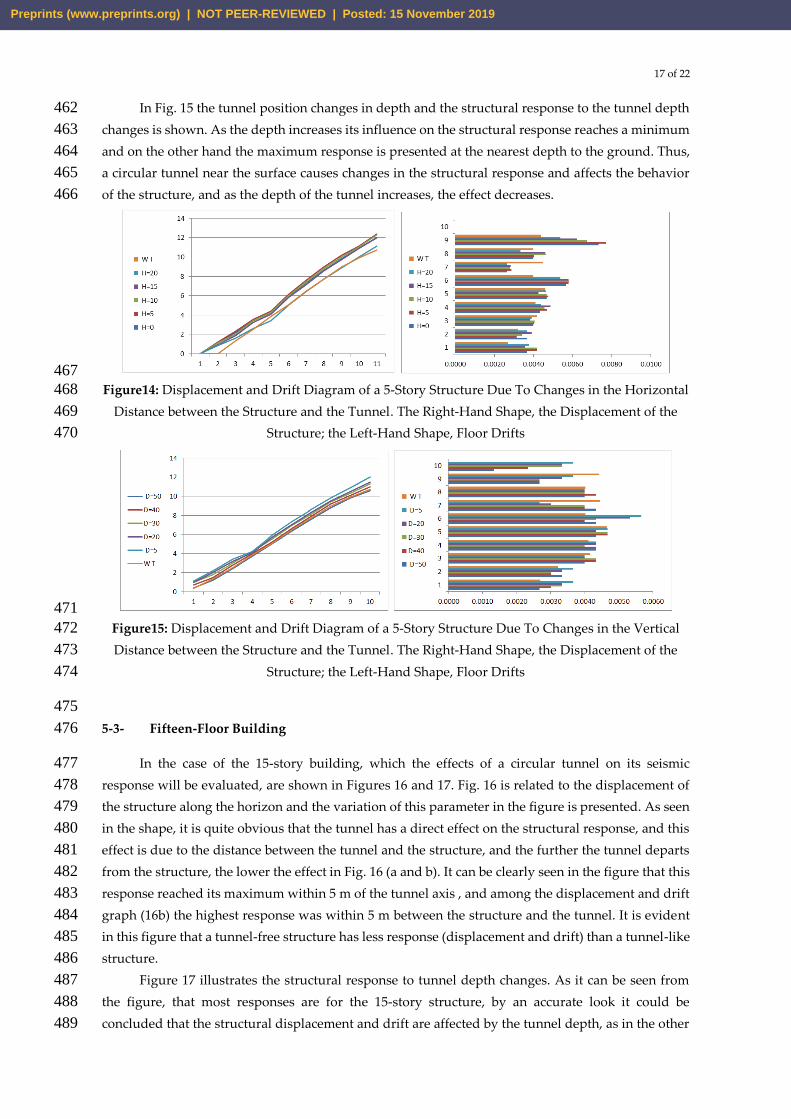
The next case is to investigate the tunnel-structure-soil interaction effect of the ten-floor steel 452
structure. As it can be seen from Fig. 14a, the tunnel has a direct effect on the displacement of the 453
structure and the presence of the tunnel causes a change in the displacement of the floors. In the 454
figure where the horizontal axis represents the number of floors and the vertical axis shows 455
displacement in centimeters, it is clear from Fig. 14a and b that the displacement decreases with the 456
distance between the structure and the tunnel increases, meaning that the tunnel is magnified 457
around itself and affects the structural response and by distancing from the tunnel this effect 458
reduces. It is important to note that in the figure the maximum displacement and drift is visible at 5 459
m from the axis of the tunnel, and that the responses before and after this position are less than this 460
value. 461
Preprints (www.preprints.org) | NOT PEER-REVIEWED | Posted: 15 November 2019
17 of 22
In Fig. 15 the tunnel position changes in depth and the structural response to the tunnel depth 462
changes is shown. As the depth increases its influence on the structural response reaches a minimum 463
and on the other hand the maximum response is presented at the nearest depth to the ground. Thus, 464
a circular tunnel near the surface causes changes in the structural response and affects the behavior 465
of the structure, and as the depth of the tunnel increases, the effect decreases. 466
467
Figure14: Displacement and Drift Diagram of a 5-Story Structure Due To Changes in the Horizontal 468
Distance between the Structure and the Tunnel. The Right-Hand Shape, the Displacement of the 469
Structure; the Left-Hand Shape, Floor Drifts 470
471
Figure15: Displacement and Drift Diagram of a 5-Story Structure Due To Changes in the Vertical 472
Distance between the Structure and the Tunnel. The Right-Hand Shape, the Displacement of the 473
Structure; the Left-Hand Shape, Floor Drifts 474
475
5-3- Fifteen-Floor Building 476
In the case of the 15-story building, which the effects of a circular tunnel on its seismic 477
response will be evaluated, are shown in Figures 16 and 17. Fig. 16 is related to the displacement of 478
the structure along the horizon and the variation of this parameter in the figure is presented. As seen 479
in the shape, it is quite obvious that the tunnel has a direct effect on the structural response, and this 480
effect is due to the distance between the tunnel and the structure, and the further the tunnel departs 481
from the structure, the lower the effect in Fig. 16 (a and b). It can be clearly seen in the figure that this 482
response reached its maximum within 5 m of the tunnel axis , and among the displacement and drift 483
graph (16b) the highest response was within 5 m between the structure and the tunnel. It is evident 484
in this figure that a tunnel-free structure has less response (displacement and drift) than a tunnel-like 485
structure. 486
Figure 17 illustrates the structural response to tunnel depth changes. As it can be seen from 487
the figure, that most responses are for the 15-story structure, by an accurate look it could be 488
concluded that the structural displacement and drift are affected by the tunnel depth, as in the other 489
Preprints (www.preprints.org) | NOT PEER-REVIEWED | Posted: 15 November 2019

18 of 22
5 and 10-story structures, and most of the responses are at the nearest tunnel depth. This effect has 490
been reported to decrease as the depth increases, and after the 50m depth it has no effect which 491
correlates with the results of other researchers mentioned earlier, and in fact the magnification 492
happens up to 30 m below ground level. 493
494
Figure16: Displacement and Drift Diagram of a 5-Story Structure Due To Changes in the Horizontal 495
Distance between the Structure and the Tunnel. The Right-Hand Shape, the Displacement of the 496
Structure; the Left-Hand Shape, Floor Drifts 497
498
499
Figure17: Displacement and Drift Diagram of a 5-Story Structure Due To Changes in the Vertical 500
Distance between the Structure and the Tunnel. The Right-Hand Shape, the Displacement of the 501
Structure; the Left-Hand Shape, Floor Drifts 502
503
6- Conclusion 504
In this study, an accurate, complete and state-of-the-art model was modeled in Abacus 505
software to analyze Tunnel-Soil-Structure interactions and was affected by various earthquakes 506
based on Eurocode accelerographs. In this study, parameters such as type of structure, number of 507
floors, depth of tunnel and horizontal distance of structure and tunnel were investigated and the 508
following results were obtained: 509
• The existence of a circular tunnel changes the surface response and magnification. 510
• The variation of the ground response due to the circular tunnel is such that the ground 511
surface response at the sides of the tunnel gives greater magnification than the axis and the 512
vertical axis of the tunnel. 513
• As the depth of the circular tunnel increases, the effect on the surface response decreases. 514
• The highest ground surface response is observed at the position closest to the ground. 515
• The further the distance from the tunnel along the horizon, the lower the impact. 516
Preprints (www.preprints.org) | NOT PEER-REVIEWED | Posted: 15 November 2019

19 of 22
Circular tunneling affects the response of structures located on the ground. 517
• The highest response of structures with different floors of structures along the displacement 518
horizon is reported within 5 m of the structure and tunnel. 519
• Maximum drift of structures with different floors of structures observed along the 520
displacement horizon of 5 m distance between the structure and tunnel. 521
• All drift and displacement values of the structures have decreased with the tunnel and 522
structure spacing along the horizon. 523
• The depth of the tunnel has an adverse effect on the response of structures. As the tunnel 524
depth increases, the response of the structures decreases. 525
• The maximum response of structures is at a depth of 5 m below the surface of the tunnel. 526
• The highest structural and drift response and tunnel impact is on high-rise structures, and 527
looking at the displacement and drift of the 15-story structure the impact of the tunnel and 528
consequently, the ground surface magnification can be observed. 529
According to the above mentioned, it can be stated that Tunnel-Soil-Structure interaction is a 530
new issue and challenge in civil engineering and urban construction. Because due to the 531
construction of old structures as well as designing and constructing structures that ignore 532
Tunnel-Soil-Structure interactions in design and construction considerations, according to the 533
results of this study, they will be damaged in case of earthquake. This is important because 534
tunnels, especially subways and subway stations, are located in cities and towns with old 535
textures or high-rise structures. And because in this study the 15-floor structure is in its 536
threshold performance, concerns rise in this issue. 537
538
539
540
541
1. Nakamura, S., Yoshida, N., and Iwatate, T. (1996) Damage to Daikai Subway Station During the 1995 542
Hyogoken-Nambu Earthquake and Its Investigation. Japan Society of Civil Engineers, Committee of 543
Earthquake Engineering, 287-295. 544
2. Hashash, Y.M.A., Hook, J.J., Schmidt, B., and Yao, J.I. (2001) Seismic design and analysis of 545
underground structures. Tunneling and Underground Space Technology, 16, 247–293. 546
3. Youd, T.L. and Beckman, C.J. (1996) Highway culvert performance during past earthquakes. National 547
Center for Earthquake Engineering Research, Buffalo. Technical Report NCEER-96-0015. 548
4. Gizzi, F.T. and Masini, N. (2006) Historical damage pattern and differential seismic effects in a town 549
with ground cavities: a case study from Southern Italy. Engineering Geology, 88, 41-58. 550
5. Tabatabaiefar HR, Fatahi B, Samali B. Numerical and experimental investiga-tions on seismic 551
response of building frames under influence of soil–structure interaction. Adv Struct Eng 2014; 552
17(1):109–30. 553 6. Lee, V.W. (1977) on deformations near a circular underground cavity subjected to incident plane 553
SH-waves. Proceedings of the Application of Computer Methods in Engineering Conference. Los 554
Angeles, California, U.S.A., II, 951-62. 555
7. Lee, V.W. and Trifunac, M.D. (1979) Response of tunnels to incident SH-waves. Journal of 556
Engineering Mechanics Division, 105(4), 643-59. 557
8. Lee, V.W. (1988) Three-dimensional diffraction of elastic waves by a spherical cavity in an elastic 558
half-space. International Journal of Soil Dynamic and Earthquake Engineering, 7(3), 149-161. 559
Preprints (www.preprints.org) | NOT PEER-REVIEWED | Posted: 15 November 2019
20 of 22
9. Lee, V.W. and Karl, J. (1993) Diffraction of SV waves by underground, circular, cylindrical cavities. 560
International Journal of Soil Dynamic and Earthquake Engineering, 11(8), 445-56. 561
10. Manoogian, M.E. and Lee, V.W. (1996) Diffraction of SH-waves by sub-surface inclusions of arbitrary 562
shape. Journal of Engineering Mechanics, 122, 122-129. 563
11. Lee, V W., Chen, S., and Hsu, I.R. (1999) Antiplane diffraction from canyon above a subsurface 564
unlined tunnel. Journal of Engineering Mechanics, 25(6), 668-675. 565
12. Tabatabaiefar HR, Fatahi B, Samali B. An empirical relationship to determine lateral seismic response 566
of mid-rise building frames under influence of soil– structure interaction. Struct Des Tall Special Build 567
2014; 23(7):526–48 (Wiley- Blackwell). 568
13. Tabatabaiefar HR, Massumi A. A simplified method to determine seismic responses of reinforced 569
concrete moment resisting building frames under influence of soil–structure interaction. Soil Dyn 570
Earthq Eng 2010; 30(11): 1259–67 (Elsevier Ltd.). 571
14. Abate, G., Rossella Massimino, M., (2016), "Numerical modelling of the seismic response of a tunnel–572
soil–aboveground building system in Catania (Italy)", Bull Earthquake Eng, DOI 573
10.1007/s10518-016-9973-9. 574
15. Abate, G., Rossella Massimino, M., (2016), “Parametric analysis of the seismic response of coupled 575
tunnel–soil–aboveground building systems by numerical modelling 2016”, Bull Earthquake Eng, DOI 576
10.1007/s10518-016-9975-7. 577
16. Pitilakis, K. (2014) Seismic Behavior of Circular Tunnels Accounting for above Ground Structures 578
Interaction Effects. Soil Dynamics and Earthquake Engineering, 67, 1-15. 579
doi:10.1016/j.soildyn.2014.08.009. 580
581
17. Smerzini, C., Aviles, J., Sanchez-Sesma, F.J, and Paolucci, R. (2009) Effect of Underground Cavities on 582
Surface Earthquake Ground Motion under SH Wave Propagation. Earthquake Engineering and 583
Structural Dynamics, 32(12), 1441-1460. 584
18. Huai-feng Wang, Meng-lin Lou, Ru-lin Zhang – 2017- “Influence of presence of adjacent surface 585
structure on seismic response of underground structure”. Soil Dynamics and Earthquake Engineering 586
100 (2017) 131–143. http://dx.doi.org/10.1016/j.soildyn.2017.05.031. 587
19. Yiouta-Mitra, P., Kouretzis, G., Bouckovalas, G., and Sofianos, A. (2007) Effect of underground 588
structures in earthquake resistant design of surface structures. Dynamic Response and Soil Properties. 589
Geo-Denver: New Peaksin Geotechnics. 590
20. Baziar, M.H., Rabeti Moghadam, M., Kim, D.S., and Choo, Y.W. (2014) Effect of underground tunnel 591
on the ground surface acceleration. Tunneling and Underground Space Technology, 44, 10-22. 592
21. Rostami, A., Asghari, N., Ziarati, M. A., Jahani, S., & Shahi, B. (2016). Investigating Effect of Tunnel 593
Gate Shapes with Similar Cross Section on Inserted Forces on Its Coverage and Soil Surface 594
Settlement. Open Journal of Civil Engineering, 6(03), 358–369. doi:10.4236/ojce.2016.63030. 595
22. Tsinidis Grigorios – 2013 - EXPERIMENTAL AND NUMERICAL INVESTIGATION OF THE 596
SEISMIC BEHAVIOR OF RECTANGULAR TUNNELS IN SOFT SOILS - Computational Methods in 597
Structural Dynamics and Earthquake Engineering. 598
23. Hamid Reza Tabatabaiefar, Behzad Fatahi. 2014 - Idealization of soil–structure system to determine 599
inelastic seismic response of mid-rise building frames. Soil Dynamics and Earthquake Engineering 66 600
(2014) 339–351 http://dx.doi.org/10.1016/j.soildyn.2014.08.007. 601
Preprints (www.preprints.org) | NOT PEER-REVIEWED | Posted: 15 November 2019

21 of 22
24. Fatahi Behzad – 2014 - Fully Nonlinear versus Equivalent Linear Computation Method for Seismic 602
Analysis of Midrise Buildings on Soft Soils - International Journal of Geomechanics - ASCE, ISSN 603
1532-3641/04014016(15). 604
25. Rostami, A., Alielahi, H., Zare, M., & Haghighi, K. (2016). Frequency and Surface Slopes Effects on the 605
Surface Displacement by Drilling Shallow and Deep Tunnels under Dynamic Loads. Open Journal of 606
Marine Science, 6(03), 353–370. doi:10.4236/ojms.2016.63030. 607
26. Sica Stefania – 2013 - Ground motion amplification due to shallow cavities in nonlinear soils - 608
Springer Science - DOI 10.1007/s11069-013-0989-z. 609
27. Tsaur Deng-How – 2012 - MULTIPLE SCATTERING OF SH WAVES BY AN EMBEDDED 610
TRUNCATED CIRCULAR CAVITY - Journal of Marine Science and Technology - Vol. 20, No. 1, pp. 611
73-81. 612
28. Liu Qijian – 2013 - Scattering of plane P, SV or Rayleigh waves by a shallow lined tunnel in an elastic 613
half space – Elsevier - 10.1016/j.soildyn.2013.02.007. 614
29. Luzhen Jiang – 2010 - Seismic response of underground utility tunnels: shaking table testing and FEM 615
analysis - EARTHQUAKE ENGINEERING AND ENGINEERING VIBRATION - Vol.9, No.4. 616
30. Rostami, A., Ziarati, M. A., Shahi, B., & Jahani, S. (2016). Evaluation of Seismic Behavior and Earth’s 617
Surface Acceleration, by Interaction of Tunnels with Different Shapes and Different Types of Soils. 618
Open Journal of Civil Engineering, 6(02), 242–253. doi:10.4236/ojce.2016.62022. 619
31. Rostami, A., Dehkordi, P. K., Ziarati, M. A., Jahani, S., & Lotfi, K. (2016). The Types of Tunnels 620
Maintenance in Umbrella Arch Method. Open Journal of Civil Engineering, 6(02), 156–162. 621
doi:10.4236/ojce.2016.62014. 622
623
32. Rostami, A., Firoozfar, A., Adhami, B., & Asghari, N. (2016). Impact of Soil Type Used in Tunneling 624
on Land Subsidence and Mobility Effective Time under Different Earthquake Records. Open Journal 625
of Geology, 6(11), 1469–1480. doi:10.4236/ojg.2016.611104. 626
33. Arash Rostami, Hamid Alielahi, Abdoreza Sarvghad Moghadam, Mahmood Hosseini. Steel 627
Buildings’ Seismic and Interaction Behavior, Under Different Shapes of Tunnel Drilling. International 628
Journal of Geotechnical Earthquake Engineering. Volume 7 • Issue 2 • July-December 2016. DOI: 629
10.4018/IJGEE.2016070101. 630
34. Behzad Fatahi, Aslan S. Hokmabadi, and Bijan Samali. Seismic Performance Based Design for Tall 631
Buildings Considering Soil-Pile-Structure Interaction. Advances in Soil Dynamics and Foundation 632
Engineering GSP 240. ASCE 2014. 633
35. BHRC, Iranian Code of Practice for Seismic Resistance Design of Buildings, Standard no. 2800 (3rd 634
edition), Building and Housing Research Center (2005). 635
36. ASCE/SEI 7-05, Minimum Design Loads for Buildings and Other Structures. 636
37. Standard No. 519, Part 6, Iranian National Building Code for Structural Loadings, Ministry of 637
Housing and Urban Development, Tehran, Iran (2004). 638
38. Kuhlemeyer R.L. and Lysmer J. (1973) Finite element method accuracy for wave propagation 639
problems. Journal of Soil Mechanics and Foundations, ASCE, 99(SM5), 421-427. 640
39. Kramer SL. Geotechnical earthquake engineering. Prentice Hall Civil Engineering and Engineering 641
Mechanics Series; 1996. 642
40. ABAQUS Software. V 6.14.2. 643
Preprints (www.preprints.org) | NOT PEER-REVIEWED | Posted: 15 November 2019
22 of 22
41. ATC-40. Seismic Evaluation and Retrofit of Concrete Buildings. Applied Technology Council, Seismic 644
Safety Commission, State of California; 1996. 645
42. Vision 2000 Committee. Performance Based Seismic Engineering of Buildings. Sacramento, CA: 646
Structural Engineers Association of California (SEAOC); 1995. 647
43. FEMA 440. NEHRP Recommended Provisions for Improvement of Nonlinear Static Seismic Analysis 648
Procedures, ATC-55 Project. Washington, DC: Emergency Management Agency; 2005 649
44. Conniff DE, Kiousis PD. Elasto-plastic medium for foundation settlements and monotonic soil–650
structure interaction under combined loadings. Int J Numer Anal Methods Geomech 2007; 31:789–807. 651
45. Rayhani MH, El Naggar MH. Numerical modelling of seismic response of rigid foundation on soft 652
soil. Int J Geomech 2008; 8(6):336–46. 653
46. Itasca Consulting Group. FLAC2D: fast lagrangian analysis of continua, version 6.0. User’s manual. 654
Minneapolis; 2008. 655
47. Cundall PA, Hart RD. Numerical modeling of discontinued. Eng Comput 1992; 9: 101–13. 656
48. Chopra AK, Gutierres JA. A substructure method for earthquake analysis of structures including 657
structure–soil interaction. Earthq Eng Struct Dyn 1978; 6(1):51–69. 658
49. Roesset JM, Ettouney MM. Transmitting boundaries: a comparison. Int J Numer Anal Methods 659
Geomech 1977; 1:151–76. 660
50. Lysmer J, Kuhlemeyer RL. Finite dynamic model for infinite media. J Eng Mech Div ASCE 1969; 661
95(6):859–77. 662
51. Kocak S, Mengi Y. A simple soil–structure interaction model. Appl Math Model 2000; 24(8–9):607–35. 663
52. Dutta CH, Roy R. A critical review on idealization and modelling for interaction among soil–664
foundation–structure system. Comput Struct 2002; 80(3): 1579–94. 665
666
53. Zheng J, Takeda T. Effects of soil–structure interaction on seismic response of PC cable-stayed bridge. 667
Soil Dyn Earthq Eng 1995; 14(6):427–37. 668
54. Koutromanos IA, Maniatakis CHA, Spyrakos CC. Soil–structure interaction effects on base-isolated 669
buildings founded on soil stratum. Eng Struct 2009; 31(3):729–37. 670
55. NEHRP Recommended Provisions for Seismic Regulation for New Buildings and Other Structures 671
(FEMA 450). Washington, DC, Edition: Federal Emergency Management Agency; 2003. 672
56. Luco JE, Hadjian AH. Two dimensional approximations to the three-dimensional soil–structure 673
interaction problem. Nucl Eng Des 1974; 31: 195–203. 674
57. Zhang X, Wegner JL, Haddow JB. Three-dimension dynamic soil–structure interaction analysis in the 675
time domain. Earthq Eng Struct Dyn 1999; 28: 1501–24. 676
58. Seo CG, Yuna CB, Kimb JM. Three-dimensional frequency-dependent infinite elements for soil–677
structure interaction. Eng Struct 2007; 29:3106–20. 678
59. Galal K, Naimi M. Effect of conditions on the response of reinforced concrete tall structures to near 679
fault earthquakes. Struct Design Tall Special Build 2008; 17(3):541–62. 680
60. Tabatabaiefar HR, Fatahi B, Samali B. Numerical and experimental investigations on seismic response 681
of building frames under influence of soil–structure interaction. Adv Struct Eng 2014; 17(1):109–30. 682
Preprints (www.preprints.org) | NOT PEER-REVIEWED | Posted: 15 November 2019