article in press - michigan technological...
TRANSCRIPT
1
2
3
4
5
6
7
8
9
10111213141516171819202122232425
26
27
28
29
30
31
32
33
al Research xx (2006) xxx–xxx
+ MODEL
www.elsevier.com/locate/jvolgeores
ARTICLE IN PRESS
Journal of Volcanology and Geotherm
OF
The volatile content of magmas from Arenal volcano, Costa Rica
Jennifer A. Wade a,⁎, Terry Plank a, William G. Melson b, Gerardo J. Soto c, Erik Hauri d
a Department of Earth Sciences, Boston University, Boston, MA 02215, USAb Division of Petrology and Volcanology, National Museum of Natural History, Smithsonian Institution, Washington, DC 20560, USA
c Apdo. 360-2350 San Francisco de Dos Ríos, Costa Ricad Department of Terrestrial Magnetism, Carnegie Institution of Washington, Washington, DC 20015, USA
Received 17 June 2005; accepted 28 March 2006
ORREC
TEDPRAbstract
We provide the first direct measurements of water in mafic melts from Arenal volcano, Costa Rica. Ion microprobe analyses ofolivine-hosted melt inclusions (MI) from the prehistoric ET3 and ET6 tephra layers reveal high concentrations of volatile species:∼ 1–4 wt.% H2O, 50–300 ppm CO2, and N3000 ppm S and Cl. The MI with the highest water concentrations are the most mafic,and the dataset as a whole records a history of degassing coupled with fractionation and ascent from ∼ 2 kbar to 0.2 kbar. ArenalMI form two groups based on their Al, CO2 and S contents. The ET3 high-Al MI were trapped at the highest pressure, are closest toequilibrium with their host olivines (∼ Fo79), which are closest to equilibrium with the bulk-rock liquid. These MI are excellentcandidates for Arenal parental liquids, and can generate most Arenal volcanic rock compositions by crystal accumulation (up to30%), or crystal fractionation at a range of pressure (0.5–3 kb) and H2O contents (0.5–3.5 wt.%). The new sulfur data reported herepredict total sulfur output over the past ∼ 30 years from bulk basaltic andesite liquid that matches well spectroscopic estimates, andresolves the previously noted imbalance. MI from different ET3 and ET6 samples show different F/Cl, while most trace elementratios show a limited range similar to that of the host rocks. The high water content (4 wt.% H2O) of Arenal basaltic magma issomewhat surprising given the weak subduction signal recorded geochemically (e.g., low 10Be and B). The Arenal MI datacontribute to a positive correlation between primary water contents and Ba/La in Central American volcanoes, although furthertesting is required given the small number of data points, and the expectation that water and trace elements should have differentsources in the subduction zone.© 2006 Published by Elsevier B.V.
34
35
36
37
38
39
40
41
NCO1. Introduction
Arenal volcano is a small (∼ 15 km3; Carr, 1984) andyoung (∼ 7000 years, Soto et al., 1998; Soto andAlvarado, this issue) stratovolcano located in northwestCosta Rica. It falls in the center of the Costa Rican portionof the Central American volcanic front. Arenal's historyhas been dominated by four ∼ 800-year-long cycles
U 4243
44
45⁎ Corresponding author. Tel.: +1 617 353 4085; fax: +1 617 353 3290.E-mail address: [email protected] (J.A. Wade).
0377-0273/$ - see front matter © 2006 Published by Elsevier B.V.doi:10.1016/j.jvolgeores.2006.03.045
between subplinian eruptions, with strong strombolianand minor eruptions in between (Ghigliotti et al., 1993;Borgia et al., 1988; Soto et al., 1998).
The volcano's cyclic eruptive history has beenrecorded in a layered stratigraphy that has been well-studied, particularly since the onset of the current, steady-state andesitic eruption in 1968 (Melson and Saenz, 1973;Melson, 1983; Reagan et al., 1987; Borgia et al., 1988;Beard and Borgia, 1989; Cigolini, 1998; Streck et al.,2002, 2005, andmanuscripts from this issue). Petrologicalmodels for the evolution of Arenal magmas place diffe-rent emphasis on the importance of crystal fractionation,
VOLGEO-03532; No of Pages 27

OOF
46
47
48
49
50
51
52
53
54
55
56
57
58
59
60
61
62
63
64
65
66
67
68
69
70
71
72
73
74
75
76
77
78
79
80
81
82
83
84
85
86
87
88
89
90
91
92
93
94
95
96
97
98
99
100
101
102
103
104
105
106
107
108
109
110
Fig. 1. Map of Central America, with arc-front volcanoes as triangles.
2 J.A. Wade et al. / Journal of Volcanology and Geothermal Research xx (2006) xxx–xxx
ARTICLE IN PRESS
UNCO
RREC
magma mixing, crystal accumulation, and entrainment ofxenoliths and xenocrysts of different compositions. Acommon theme, however, is the continuous supply to theArenal system of mafic precursor magma. This often“unseen” parent magma is inferred to have high watercontents (≥3 wt.%), manifest in eruptives with high Alconcentrations, high An plagioclase, and most signifi-cantly, hornblende (Reagan et al., 1987; Borgia et al.,1988). This view of a prevalent, parentalmagmawith highinitial water contents runs counter to geochemical evi-dence that Arenal magmas have a weak ‘subductionsignal,’with low values of various slab tracers (e.g., 10Be,Tera et al., 1986; B/La, Leeman et al., 1994). Resolvingthis apparent contradiction requires direct measurementsof the water content of Arenal magmas, which is thepurpose of this study.
Water plays a vital role in subduction zones. Originallypresent in slab sediments and hydrous minerals of thesubducting lithosphere, and later released in dehydrationand melting reactions, water drives mantle melting, andinfluences crystal fractionation and eruption style (Sissonand Grove, 1993; Stolper and Newman, 1994; Roggen-sack et al., 1997). Despite its central role in these pro-cesses, few quantitative measurements of H2O have beenmade in arc volcanoes, as all magma degasses upon ascentand eruption. Rare olivines, however, may trap melt atdepths greater than H2O-vapor saturation and the analysisof such melt inclusions may thus permit robust estimatesof the initial H2O content of arc magmas (Anderson,1979; Sisson and Layne, 1993).
Central America is a good place to look for variationsin magmatic water content because other tracers from theslab, such as 10Be, Ba/La, and U/Th show systematicvariations along strike, peaking in Nicaragua and des-
TEDPRcending to the northwest into Guatemala, and southeast
into Costa Rica (Carr et al., 1990; Leeman et al., 1994;Patino et al., 2000). Water concentration has been mea-sured in olivine-hosted melt inclusions in a few volcanoesalong theCentral American arc. CerroNegro inNicaragualies near the geographical peak in slab tracers (including10Be and Ba/La), and basaltic melt inclusions contain, onaverage,∼ 5 wt.% H2O (Roggensack et al., 1997, 2001a,b). To the northwest in Guatemala and southeast in CostaRica, where Ba/La is generally much lower, magmaticwater contents are also lower (∼ 2 wt.% at Pacaya and∼ 4wt.% at Fuego;Walker et al., 2003 and∼ 3% at Irazú;Benjamin et al., 2004). Still it is unclear whether or not“slab tracers” like Ba/La are directly related to H2Ocontents. Specifically, are the sources of Ba and Be (andthemeans bywhich they are transported from the slab) thesame as those which deliver H2O?
We havemade the first direct measurements of H2O, inaddition to several other volatile species (e.g. CO2, S, Cl,F) dissolved in olivine-hosted melt inclusions fromArenal tephra, in order to better constrain the nature ofthe parent magma, as well as to evaluate whether or nottraditional “slab tracers” are accurate fluid proxies. Bothgeographically and geochemically, Arenal falls in themiddle, between Cerro Negro's wet, high-slab signal andIrazú's low slab signal near the southeast terminus of theCentral American volcanic arc (Fig. 1).
2. Background
2.1. Eruptive history of Arenal
Arenal awoke from its most recent period of quies-cence (since ∼ 1700 AD) in July, 1968 and continues to

TEDPR
OOF
111
112
113
114
115
116
117
118
119
120
121
122
123
124
125
126
127
128
129
130
131
132
133
134
135
136
137
138
139
140
141
142
143
144
145
146
147
148
149
150
151
152
153
Fig. 2. a) Summary of previous H2O estimates for Arenal compositions, plus new melt inclusion data in ET3 and ET6 olivines. Reagan et al. (1987)estimate N4% H2O based on the presence of hornblende and An94 plagioclase in the early phases of the current eruption, requiring pH2O up to 5 kbar.Estimate from Beard and Borgia (1989) is also based on the presence of hornblende. The estimate by Ryder et al. (2005) is derived from MELTSmodeling. Data points are olivine-hosted melt inclusions from this study (Table 1) and plag-, cpx-, and magnetite-hosted melt inclusions fromAnderson (1979). Open NMNH ET6 points are original sum–deficit estimate from Melson (1983). Values adjacent to data points indicate H2O–CO2
vapor saturation pressures from Fig. 9. b) Plagioclase–melt Ca/Na exchange hygrometer from Sisson and Grove (1993). Lines of constant waterrepresent KD(plag−melt)
Ca/Na of 5.5 (2 kbar H2O-saturated), KD=3.4 (1 kbar H2O-saturated), and KD=1.7 (2 wt.% H2O). Ca/Na ratios are molar. H2Osaturation at 1 and 2 kbar revised from values given by Sisson and Grove (1993) to be consistent with the solubility model in Newman andLowenstern (2002) used in this study (e.g. see Fig. 9). Plag Ca/Na is based on maximum An (92.8–93.1) measured in basal ET3 units (Bolge et al.,2004).
3J.A. Wade et al. / Journal of Volcanology and Geothermal Research xx (2006) xxx–xxx
ARTICLE IN PRESS
UNCO
RRECerupt as of this writing. Borgia et al. (1988) describe the
stratigraphy based on alumina content within each of thefour eruptive cycles in Arenal's past, composed of a highalumina group (HAG,N20% Al2O3), low alumina group(LAG), an intermediate group, and finally the dacitic andbasaltic tephras, two of which are discussed in detail inthis text (tephra units ET3 and ET6, originally describedby Melson, 1983). In their model, an ‘unseen’ basalticmagma evolves early, and through fractionation and theredistribution of phases, generates a zoned andesite body,which then evolves into an andesite/dacite cap. Through-out this period of zonation and fractionation, the mafic,parent magmamay bemixing with its own products (suchas plagioclase or gabbroic cumulates) or entraining crustalxenoliths (Cigolini, 1998). When this zoned magma bodyerupts, it generates the Al-zoned stratigraphy observed onthe slopes of Arenal today. Based on the observance ofhornblende solely in material from the first blasts of thecurrent eruption (Reagan et al., 1987; Borgia et al., 1988),this model proposes that the beginning of each eruptivephase is marked by high-pH2O, which decreases over thecourse of the cycle.
2.2. Previous H2O estimates from Arenal eruptives
The first estimates of water concentration in Arenalmagmas were made using the difference from 100% ofmajor element analyses by electron microprobe (sum–deficit technique). Anderson (1979) studied lapilli from theearliest blast of the 1968 eruption. The recent eruption isolivine-poor, and the only inclusions available were pla-gioclase-, pyroxene-, andmagnetite-hosted andesite–dacitemelts, which yielded H2O contents of 0–7 wt.% (Fig. 2a).The inclusions with the lowest water concentration aremost likely degassed, but if Arenal magmas do indeedcontain up to 7% H2O, these would be the highest-watercontents measured in mafic Central American magmas.Sum–deficit H2O estimates of 3.6 and 4.5 wt.%weremadeby Melson (1983; Fig. 2a) in 2 basaltic–andesite meltinclusions in one olivine (Fo75) from a prehistoric tephra,ET6 (recently re-named AR-16 by Soto and Alvarado, thisissue). Such high water contents are not surprising con-sidering the units were explosive.Melson (1983)'s estimateof the H2O content in ET6 is the estimate most widely usedas representative of the Arenal mafic parent.

154
155
156
157
158
159
160
161
162
163
164
165
166
167
168
169
170
171
172
173
174
175
176
177
178
179
180
181
182
183
184
185
186
187
188
189
190
191
192
193
194
195
196
197
198
199
200
201
202
203
204
205
206
207
208
209
210
211
212
213
214
215
216
217
218
219
220
221
222
223
224
225
226
227
228
229
230
231
232
233
234
235
236
237
238
239
240
241
242
243
244
245
246
247
248
249
250
251
252
253
4 J.A. Wade et al. / Journal of Volcanology and Geothermal Research xx (2006) xxx–xxx
ARTICLE IN PRESS
UNCO
RREC
Other estimates of magmatic water contents at Arenalare more indirect. Borgia et al. (1988) suggest that abuildup of pH2O (leading to variable H2O contents) in thepre-eruptive body beneath Arenal might contribute to thevolcano's cyclic explosivity. Streck et al. (2005) suggest acorrelation between high An plagioclase and deep, con-tinuously-replenishing high-H2O source magmas. Reaganet al. (1987) note that hornblende is present in materialsejected during the early, explosive stages of the currenteruption, but then disappears, indicating high pH2O con-ditions (4–9wt.%H2O, although they ultimately preferredthe lower end of that range) (Fig. 2a). Beard and Borgia(1989) also use the presence of hornblende in gabbroicenclaves to indicate 3–5% H2O in Arenal basalticandesites.
In summary, previous estimates support a water-richmagma parental to Arenal, but considerable uncertaintyexists as to actual H2O abundances. Sum–deficit measure-ments can yield useful estimates of water concentration(within 1% of measured values; Sisson and Layne, 1993),but pitfalls in microprobe analyses can lead to low sums.The stability of amphibole is dependent on several para-meters, including temperature, pressure, and Na content(Sisson and Grove, 1993), in addition to water. Our goal isthus to make the first direct measurements of water andother volatile species in Arenal magmas, in order to con-strain primary volatile compositions and test existing pe-trologic models.
2.3. Explosive tephra units ET3 and ET6
As the first formedmineral in amaficmagma, olivine isthe most likely to trap primitive melt at high pressures,before the magma has substantially degassed its water.Olivines found in lapilli tephra, rather than lavas, arestrongly preferred, as the inclusions within them coolquickly, minimizing loss of H out of the olivine bydiffusion or through cracks (Hauri, 2002). Lapilli b 3 cmfurther minimizes post-entrapment effects such as crys-tallization of the glass, or reaction between the melt andthe host grain (Luhr, 2001).We have therefore focused oursampling on two of themostmafic tephra units inArenal'seruptive history: ET3 (deposited ∼ 930 BP) and ET6(deposited ∼ 1250 BP; Soto and Alvarado, 2005). Thenew nomenclature in Soto and Alvarado (this issue)redefines ET3 as AR-19 and ET6 as AR-16, but we retainhere the original ET sample names to prevent confusionwith the previous work cited within this study. These unitswere first described by Melson (1983) at ‘El Tajo’ (aformer quarry west of the volcano, presently under thewater of Arenal reservoir). ET3 and ET6 mark the maficeruptions that end two of the four 800-year-long eruptive
TEDPR
OOF
cycles in Arenal's history (Melson and Saenz, 1973;Melson, 1983; Borgia et al., 1988; Soto et al., 1998).These prehistoric units contrast with materials from thecurrent ‘andesitic steady-state eruption’ in which olivine isexceedingly rare (Reagan et al., 1987; Streck et al., 2005).
Tephra from the ET3 and ET6 units are very similar toeach other in composition, although ET3, which belongsto the HAG of Borgia et al. (1988) is higher in Al and Na,and contains fewer plagioclase phenocrysts than ET6(part of the LAG; Borgia et al., 1988). Stratigraphically,ET3 is much thicker and more voluminous than ET6,although erosion during the repose period after deposi-tion of each may have obscured their true eruptivevolumes (Melson, 1983; Soto et al., 2000). Both deposits(ET6 and ET3) are characterized by several layers ofcoarse, black lapilli separated by fine lapilli, ashes, andaccretionary lapilli, which most likely indicate repeatedexplosive events, probably separated by short reposeperiods marked by unconformities, as can be seen in themost proximal sections of ET3 (Melson, 1983; Soto etal., 1998, 2000). Compositional variations with the ET3unit are systematic with stratigraphic level, and recorddecreasing crystal accumulation towards the top (Bolgeet al., 2004).
Two new samples of lapilli from ET3 (AR0301 andAR0302; Table 1) were collected in January, 2003 from aroadcut along the Entrance to Mirador El Silencio, be-tween La Fortuna and Sangregado Dam (UTM coordi-nates: 456150 m.E, 274080m.N). These samples bothyielded olivine-hostedmelt inclusions, and are the primaryfocus of this study. Sample AR0302 was taken immedi-ately above ET4, and represents the basal deposit and thusthe first tephra of the ET3 eruption. AR0301was collected20 cm above AR0302. The dominant phenocryst inAR0301 is plagioclase, and grains are fairly uniformly-sized. This vesicular sample also contains clinopyroxeneandminor olivine. The dominant phenocryst inAR0302 isalso plagioclase, with larger populations of clinopyroxeneand olivine than AR0301. AR0302 is much coarser-grained and less vesicular than AR0301.We also analyzedolivine-hosted melt inclusions in thin sections from theET3 and ET6 samples originally described by Melson etal. (1983) from the type El Tajo section. These samples areindicated by their National Museum of Natural History(NMNH) sample number (Table 1).
3. Analytical methods
Each hand sample was brushed, rinsed with MilliQwater to remove surface impurities, and dried. Visiblyunweathered sections were cut from each sample, and aportion was powdered for bulk-rock analysis while the

UNCO
RREC
TEDPR
OOF
Table 1t1:1
Major element and volatile analyses of melt inclusionst1:2
t1:3 Unit ET3 ET3 ET3 ET3 ET3 ET3 ET3
t1:4 Sample name AR0301-1a AR0301-2a AR0301-3b AR0301-13a AR0301-13b AR0302-1a AR0302-1b
t1:5 Notes LAMI HAMI HAMI HAMI HAMI HAMI HAMIt1:6 SiO2 57.42 53.23 51.73 50.29 51.97 49.71 50.60t1:7 TiO2 1.68 0.85 2.77 0.82 1.36 0.70 0.57t1:8 Al2O3 15.64 18.40 19.90 18.83 18.15 17.92 19.08t1:9 FeO 6.07 7.90 5.41 7.36 6.67 7.79 6.51t1:10 Fe2O3 1.69 2.19 1.50 2.04 1.85 2.16 1.81t1:11 MnO 0.12 0.23 0.16 0.20 0.30 0.22 0.17t1:12 MgO 3.02 3.24 2.74 4.76 3.97 4.18 2.21t1:13 CaO 5.88 8.02 10.80 9.56 7.51 9.20 9.64t1:14 Na2O 2.30 2.56 2.53 3.14 4.15 2.53 2.84t1:15 K2O 0.60 0.45 0.32 0.63 0.73 0.46 0.50t1:16 P2O5 0.27 0.17 0.20 0.19 0.16 0.13t1:17 Total 94.7 97.3 97.9 97.8 96.8 95.0 94.1t1:18 Mg# 47.0 42.3 47.4 53.5 51.5 48.9 37.7t1:19 H2O (wt.%) 2.95 2.61 3.56 3.88 3.93t1:20 CO2 (ppm) 118 310 c.c 170 179t1:21 F (ppm) 649 610 576 315 326t1:22 S (ppm)1 1070 2000 2480 2170 2770t1:23 S (ppm)2 1060 1970 2300 1980 2190t1:24 S (ppm)3 887 1790 3020 3400t1:25 % SO4 of total sulfate 84% 84% 78%t1:26 Log fO2 (ΔNNO) +1.10 +1.10 +0.93t1:27 Cl (ppm)1 2920 1540 1290 1490 1740t1:28 Cl (ppm)2 2790 1320 1100 1780 1970t1:29 Cl (ppm)3 2550 1540 1280 1720t1:30
t1:31 Host-corrected compositionst1:32 Olivine added 1% 3% 3% 0% 0% 0% 6%t1:33 SiO2 57.23 52.78 51.35 50.29 51.97 49.71 49.88t1:34 TiO2 1.68 0.83 2.77 0.82 1.36 0.70 0.54t1:35 Al2O3 15.49 17.86 19.32 18.83 18.15 17.92 18.00t1:36 FeO 6.24 8.4 5.89 7.36 6.67 7.8 7.61t1:37 Fe2O3 1.67 2.1 1.46 2.04 1.85 2.2 1.70t1:38 MnO 0.12 0.22 0.16 0.20 0.30 0.22 0.16t1:39 MgO 3.37 4.22 3.81 4.76 3.97 4.18 4.14t1:40 CaO 5.82 7.79 10.49 9.56 7.51 9.20 9.09t1:41 Na2O 2.28 2.49 2.46 3.14 4.15 2.53 2.68t1:42 K2O 0.59 0.44 0.31 0.63 0.73 0.46 0.47t1:43 P2O5 0.27 0.17 0.20 0.19 0.16 0.12t1:44 Total 94.8 97.3 98.0 97.8 96.8 95.0 94.4t1:45 Mg# 49.0 47.2 53.6 53.5 51.5 48.9 49.2t1:46 Fo source LA LA LA LA LA EMP EMPt1:47 Fohost 76.6 75.4 78.6 77.3 77.3 75.7 75.7t1:48 Foequilibrium olivine 75 71 75 79 78 76 67t1:49 Long axis (μm) 95 125 37 75 23 250 300t1:50 Short axis (μm) 50 55 12 60 15 155 250t1:51 MI shape Oval Rectangular Oval Football Oval Oval Ovalt1:52 MI features b a,b a a
t1:53 Unit ET3 ET3 ET3 ET3 ET3 ET3 ET3
t1:54 Sample name AR0302-4a AR0302-4a AR0302-5a AR0302-5a AR0302-5b NMNH ET3a NMNH ET3b
t1:55 Notes LAMI Replicate HAMI Replicate HAMI LAMI LAMIt1:56 SiO2 58.23 59.47 50.51 51.66 52.22 57.93 58.21
(continued on next page )
5J.A. Wade et al. / Journal of Volcanology and Geothermal Research xx (2006) xxx–xxx
ARTICLE IN PRESS

UNCO
RREC
TEDPR
OOF
t1:57 Table 1 (continued )t1:58 Unit ET3 ET3 ET3 ET3 ET3 ET3 ET3
t1:59 Sample name AR0302-4a AR0302-4a AR0302-5a AR0302-5a AR0302-5b NMNH ET3a NMNH ET3b
t1:60 TiO2 1.28 1.13 0.91 0.80 0.77 1.25 1.21t1:61 Al2O3 16.27 16.52 17.63 18.13 18.80 15.83 15.81t1:62 FeO 5.81 5.48 8.00 8.01 7.14 8.50 7.36t1:63 Fe2O3 1.61 1.52 2.22 2.22 1.98 2.36 2.04t1:64 MnO 0.12 0.08 0.19 0.19 0.16 0.23 0.14t1:65 MgO 2.68 2.55 4.21 4.15 1.99 2.24 2.10t1:66 CaO 6.03 5.93 8.24 8.13 8.05 7.88 6.69t1:67 Na2O 2.44 2.59 1.74 1.99 1.98 2.99 2.85t1:68 K2O 0.39 0.34 0.24 0.25 0.32 0.86 0.48t1:69 P2O5 0.41 0.36 0.17 0.12t1:70 Total 95.3 96.0 94.1 95.7 93.4 100.1 96.9t1:71 Mg# 45.1 45.4 48.4 48.0 33.2 32.0 33.7t1:72 H2O (wt.%) 3.26 3.54 1.10 2.41t1:73 CO2 (ppm) 83.7 177.4 41.0 47.5t1:74 F (ppm) 667 308 461 557t1:75 S (ppm)1 890 2170 447 619t1:76 S (ppm)2 834 970 1950 2190 567 820t1:77 S (ppm)3 852 1880t1:78 % SO4 of total sulfate 78% 58%t1:79 Log fO2 (ΔNNO) +0.93 +0.51t1:80 Cl (ppm)1 2570 1670 1570 1780t1:81 Cl (ppm)2 2140 2540 1270 1090 1880 1970 1910t1:82 Cl (ppm)3 2340 1850t1:83
t1:84 Host-corrected compositionst1:85 Olivine added 2% 2% 3% 3% 12% 8% 6%t1:86 SiO2 57.84 59.058 50.16 51.286 50.68 56.40 57.03t1:87 TiO2 1.26 1.11 0.88 0.78 0.69 1.16 1.21t1:88 Al2O3 15.95 16.20 17.12 17.60 16.79 14.66 14.92t1:89 FeO 6.17 5.83 8.4 8.4 9.1 10.0 8.6t1:90 Fe2O3 1.58 1.49 2.2 2.2 1.8 2.2 1.9t1:91 MnO 0.12 0.08 0.18 0.18 0.14 0.23 0.13t1:92 MgO 3.37 3.25 5.25 5.18 5.66 4.56 3.90t1:93 CaO 5.91 5.93 8.00 7.89 7.19 7.30 6.31t1:94 Na2O 2.39 2.54 1.69 1.93 1.77 2.77 2.69t1:95 K2O 0.38 0.33 0.23 0.24 0.29 0.80 0.45t1:96 P2O5 0.40 0.35 0.17 0.12t1:97 Total 95.4 96.2 94.2 95.8 94.1 100.1 97.1t1:98 Mg# 49.4 49.9 52.7 52.4 52.5 44.7 44.8t1:99 Fo source EMP LA LA EMP EMPt1:100 Fohost 76.9 79.0 79.0 73.3 72.7t1:101 Foequilibrium olivine 73 73 76 75 62 61 63t1:102 long axis (μm) 95 205 40 35 110t1:103 short axis (μm) 70 115 35 30 40t1:104 MI shape oblong oblong oval oval oval round hourglasst1:105 MI features b b a a c
t1:106 Unit ET3 ET3 ET3 ET6 ET6 ET6 ET6 ET6 ET6
t1:107 Sample name NMNHET3c
NMNHET3d
NMNHET3e
NMNHET6a
NMNHET6b
NMNHET6c
NMNHET6d
NMNHET6e
NMNHET6f
t1:108 Notes LAMI LAMI LAMI LAMI LAMI LAMI LAMI LAMIt1:109 SiO2 55.69 58.60 58.17 53.74 51.11 56.27 54.92 53.36t1:110 TiO2 1.09 1.10 1.21 1.11 1.09 0.67 0.93 0.88t1:111 Al2O3 15.64 16.76 15.89 17.04 16.09 18.00 17.74 17.12t1:112 FeO 5.54 5.35 6.57 6.33 6.92 4.58 6.26 7.15t1:113 Fe2O3 1.54 1.49 1.82 1.76 1.92 1.27 1.74 1.98t1:114 MnO 0.19 0.16 0.14 0.15 0.17 0.14
6 J.A. Wade et al. / Journal of Volcanology and Geothermal Research xx (2006) xxx–xxx
ARTICLE IN PRESS

UNCO
RREC
TEDPR
OOF
t1:115 Table 1 (continued )t1:116 Unit ET3 ET3 ET3 ET6 ET6 ET6 ET6 ET6 ET6
t1:117 Sample name NMNHET3c
NMNHET3d
NMNHET3e
NMNHET6a
NMNHET6b
NMNHET6c
NMNHET6d
NMNHET6e
NMNHET6f
t1:118 MgO 1.38 0.94 1.52 2.36 2.64 2.75 1.95 2.86t1:119 CaO 7.07 6.44 6.97 7.80 8.11 5.62 8.79 8.56t1:120 Na2O 4.00 1.55 1.32 3.40 2.76 3.73 2.92 2.84t1:121 K2O 0.83 0.40 0.24 0.59 0.56 0.59 0.61t1:122 P2O5 0.26 0.32 0.19 0.58 0.38 0.30t1:123 Total 93.2 92.8 93.8 94.6 91.5 93.6 96.2 95.7t1:124 Mg# 30.8 23.9 29.2 40.0 40.5 51.7 35.7 41.6t1:125 H2O (wt.%) 2.30 3.16 3.50 2.80 2.75t1:126 CO2 (ppm) c.c c.c c.c 149 137t1:127 F (ppm) 497 398 433 233 981t1:128 S (ppm)1 527 950 969 524 566t1:129 S (ppm)2 625 426 449t1:130 S (ppm)3 1160 1100 679 727 800t1:131 % SO4 of total sulfate
t1:132 Log fO2 (ΔNNO)t1:133 Cl (ppm)1 1650 1290 1430 688 3430t1:134 Cl (ppm)2 2320 1840 1920t1:135 Cl (ppm)3 1330 1400 631 3660 2600t1:136t1:137 Host-corrected compositionst1:138 Olivine added 5% 8% 7% 3% 4% 1% 6% 3%t1:139 SiO2 54.80 56.95 56.78 53.27 50.61 56.18 53.94 52.91t1:140 TiO2 1.04 1.02 1.13 1.08 1.05 0.67 0.88 0.85t1:141 Al2O3 14.90 15.52 14.85 16.54 15.47 17.91 16.74 16.62t1:142 FeO 6.74 7.42 8.2 6.91 7.6 4.66 7.44 7.68t1:143 Fe2O3 1.46 1.38 1.7 1.70 1.8 1.27 1.64 1.92t1:144 MnO 0.18 0.15 0.13 0.15 0.16 0.14t1:145 MgO 2.85 3.11 3.53 3.34 3.94 2.94 3.84 3.84t1:146 CaO 6.73 5.96 6.51 7.57 7.80 5.59 8.29 8.31t1:147 Na2O 3.81 1.44 1.23 3.30 2.65 2.76 2.76t1:148 K2O 0.79 0.37 0.22 0.57 0.54 1.53 0.56 0.59t1:149 P2O5 0.24 0.31 0.18 0.58 0.36 0.29t1:150 Total 93.5 93.3 94.3 94.8 91.9 91.5 96.4 95.8t1:151 Mg# 43.0 42.8 43.5 46.3 47.9 52.9 31.8 47.1t1:152 Fo source EMP EMP EMP EMP EMP EMP EMP EMP EMPt1:153 Fohost 72.0 72.0 72.0 74.7 74.9 76.4 79.0 74.9 74.9t1:154 Foequilibrium olivine 60 51 58 69 69 78 65 70t1:155 Long axis (μm) 35 25 60 40 30 40t1:156 Short axis (μm) 30 20 40 35 22 25t1:157 MI shape Round Oval Round Rectangular Round Round Ovalt1:158 MI features a c
Major elements in melt inclusions were acquired by EMP at either the AMNH or MIT (in italics) except for NMNH ET6e and ET6f, which arereproduced from Melson (1983). H2O, CO2, and F data collected by SIMS at DTM, ‘c.c’ indicates carbon contamination. S and Cl data werecollected at 3 different labs, indicated by footnotes: 1=SIMS at DTM; 2=EMP at MIT; 3=EMP at AMNH. See Section 3.1 of the text for adiscussion of accuracy and inter-lab calibration. Percent sulfate determined by S–Kα shift analyses at AMNH. log fO2 calculated at 1100 °C and3 kbar fromHuebner and Sato (1970). FeO−Fe2O3 calculated assuming 20% total Fe as Fe3+ (based on fO2 from S–Kα and pMELTS Fe-speciationmodel (Ghiorso et al., 2002)). Melt inclusion major element compositions have been corrected for sidewall crystallization by adding equilibriumolivine back into the glass composition in 1% increments until the glass was in equilibrium with the adjacent host. Fo (molar Mg / (Mg+Fe))acquired by either EMP at MIT or LA-ICP-MS at BU. MI features: a=vapor or shrinkage bubble present,b=oxide crystal present, c= fracturerunning through.t1:159
AR0301 and AR0302 samples were collected for this study from tephra units ET3 and ET6 (originally defined by Melson (1983) and recentlyrenamed AR-19 and AR-16, respectively, by Soto and Alvarado (this issue)). NMNH samples are thin sections from the Smithsonian NationalMuseum of Natural History (ET3 ID: 113852-3.4; ET6 ID: 113852-3.2).t1:160
7J.A. Wade et al. / Journal of Volcanology and Geothermal Research xx (2006) xxx–xxx
ARTICLE IN PRESS

254
255
256
257
258
259
260
261
262
263
264
265
266
267
268
269
270
271
272
273
274
275
276
277
278
279
280
281
282
283
284
285
286
287
288
289
290
291
292
293
294
295
296
297
298
299
300
301
302
303
304
305
306
307
308
309
310
311
312
313
314
315
316
317
318
319
320
321
322
323
324
325
326
327
328
329
330
331
332
333
334
335
336
337
338
339
340
341
342
343
344
345
346
347
348
349
350
351
352
353
8 J.A. Wade et al. / Journal of Volcanology and Geothermal Research xx (2006) xxx–xxx
ARTICLE IN PRESS
UNCO
RREC
remainder was gently crushed in an alumina jaw-crusherand sieved for mineral picking.
3.1. Melt inclusions: major, trace, and volatile elementanalyses
While picking olivine-hosted inclusions, we soughtnaturally glassy melt inclusions, avoiding those that werecracked or breached, or touching the outer edge of the hostolivine. Olivines were very rare in the fractions picked(ranging from 250–1000 μm), averaging only one olivinegrain per 150 g of sample. Of those olivines, ∼ 30%yielded viable inclusions. Olivines were polished to ex-pose inclusions, and then mounted either directly inindium metal (to minimize background in the ion probe;Hauri et al., 2002), or first in dental resin to be transferredto indium for volatile analysis.
Major element, S, and Cl concentrations in someinclusions were determined by electron microprobe on aJEOL JXA-733 Superprobe at theMassachusetts Instituteof Technology using a 10 nA beam current, 10 μm spot,and 15 kV accelerating voltage. Elements were countedfor 40 s, except for Na which was counted for 5–10 s.Major element concentrations were also determined on aCameca SX 100 electron microprobe at the AmericanMuseum of Natural History using somewhat differentconditions: 10 nA, 12 μm, and 15 kV, with on-peak counttimes of 30 s. Chlorine and sulfur were acquired at 40 nA,12 μm, and 15 kV. Low totals in some samples are mostlikely due to alkali loss (especially Na) during analysis, acommon consequence of electron probe analysis ofhydrous glass (Devine et al., 1995). Uncertainty on Sand Cl by EMP is ∼ 3% at AMNH (based of replicateanalyses of the JDF glass standard in one session) andb12% atMIT (based on replicate analyses of inclusions in2 separate sessions).
Volatile (H2O, CO2, F, Cl, and S) concentrations inmeltinclusions were determined at the Carnegie Institution ofWashington using a Cameca 6-F ion microprobe using an8 nA beam current, 30 μm spot, 5 kVaccelerating voltage.On-peak count time was ∼ 5 s, and other protocols fol-lowed those in Hauri (2002). Some inclusions which hadbeen carbon-coated for EMP analysis prior to SIMSyielded very high CO2 concentrations (1000's of ppmCO2)whichwe interpreted as carbon contamination (Table1). Precision on the SIMS (at DTM) is b1.5% 2σ based onreplicate analyses of melt inclusions during the same ses-sion. However, the accuracy may be closer to 10% basedon uncertainty in the working curves developed for eachsession. Because S and Cl contents were determined in 3separate labs, during 7 different sessions, there is vari-ability between multiple analyses of single inclusions.
TEDPR
OOF
Lab-to-lab variations arise from the different standards andcalibration strategies used, for example the use of sulfidestandards versus natural glasses (typically MORB), noneof which are ideal for arc melt inclusions. Nonetheless,replicate analyses agree on average by 12% (for S) and 9%(for Cl).
Wavelength dispersive S Kα scans were performedon 5 inclusions to determine speciation of dissolved S(Wallace and Carmichael, 1992). Analyses were per-formed by EMP at the AMNH, following the methods ofMandeville et al. (in review). FeS and BaSO4 wereanalyzed as in Carroll and Rutherford (1988), using a40 nA beam current, 12 μm spot, and 15 keVacceleratingvoltage. Twelve to sixteen continuous S X-ray scanswere carried out for each inclusion, and the beam wasmoved within the inclusion every 4–5 accumulations, inorder to avoid oxidation effects due to local heating(Wallace and Carmichael, 1992;Metrich and Clocchiatti,1996). fO2 was calculated from the sulfur-speciationmodel of Wallace and Carmichael (1994).
Trace element concentrations were determined ininclusions larger than 50 μm in diameter by laser ablationinductively coupled plasma mass spectrometry (LA-ICP-MS) at BostonUniversity using aMerchantek/VGMicro-probe II 213 nmNd-YAG laser ablation system coupled toa VG PQ ExCell quadrupole ICP-MS. Samples wereablated in a He–Ar mixture at a flow rate of 700 mL/min.The laser was operated in spot-drill mode at 5 Hz, at 80%power (0.118–0.137 mJ/pulse), for an energy density of∼ 6 J cm−2. The beam expander (collimator) and iris wereboth set to 0%, resulting in a spot size of 40 μm. Dwelltime for all elements was 20 ms. Laser data were acquiredin time-resolvedmode, and calibrated against USGS glassBHVO-2 g using the values in Kelley et al. (2003), with43Ca as an internal standard. Precision on replicateanalyses of BCR-2 g was 8% rsd.
3.2. Bulk-rock major and trace element analyses
In order to provide context for the melt inclusions fromnewly-sampled material, host bulk−rocks were analyzedfor major and trace elements at Boston University, fol-lowing the techniques described by Kelley et al. (2003).Solutions were prepared for major element analysis usingLiBO2 fusions, and each resulting solution was diluted∼ 4300×the original sample weight. Ten major elementswere measured in these solutions using a Jobin–Yvon170C ICP-AES. Sample powders were prepared for traceelement analysis followingHF–HNO3 digestion in Teflonscrew-top vials, and resulting solutions were diluted to∼ 2000×the original powder weight. Thirty trace ele-ments were measured in these solutions using the VG PQ

TEDPR
OOF
354
355
356
357
358
359
360
361
362
363
364
365
366
367
368
369
370
371
372
373
374
375
376
377
378
379
380
381
382
383
384
385
386
387
388
389
390
391
392
393
394
Fig. 3. Photographs of Arenal ET3 olivine-hosted melt inclusions. a) Transmitted-light photograph taken pre-ablation. b) Reflected-light photographtaken post-ablation, showing LA-ICP-MS raster tracks used to measure olivine Fo and ablation pit used to measure trace elements in glass. c)AR0302-1a and 1b are the ET3 inclusions with the highest-measured water contents (both ∼ 3.9 wt.% H2O).
9J.A. Wade et al. / Journal of Volcanology and Geothermal Research xx (2006) xxx–xxx
ARTICLE IN PRESS
UNCO
RRECExCell quadrupole ICP-MS at Boston University. Raw
ICP-MS and ICP-ES counts were blank-subtracted,corrected for drift using an external solution (analyzedevery 5 samples), and corrected for the dilution weight.USGS standards BHVO-1 and BIR, as well as internal labstandards K1919 and MAS1722 were used as calibrationstandards, using the values in Kelley et al. (2003).Reproducibility of replicate ICP-ES and ICP-MS analysesis generally b3% rsd.
3.3. Olivine hosts: major and trace element analyses
Major element concentrations in olivines were de-termined by electron microprobe on a JEOL JXA-733Superprobe at MIT, using the same conditions as theglass, although on-peak counting times were 60 s for Fe,20 s for Na, Ca, and Si, and 40 s for all other elements,and at the AMNH, with on-peak counting times of 20 sfor Na and Al, and 30 s for all other elements (Fig. 3).Transition metal, and Mg, and Fe concentrations weremeasured at BU by LA-ICP-MS as above, except thelaser was operated in line scan (raster) mode at 10 Hz,50% power (0.176 mJ/pulse), and a scan rate of 3 μm/s.
Raster width was ∼ 20 μm, with the beam expander(collimator) set to100%, and the iris to 10%. Dwell timefor all elements was 20 ms. Laser data were acquired intime-resolved mode, and calibrated against USGS stan-dard BIR-1g. Reproducibility of forsterite in the SanCarlos Olivine standard was b1% 2σ (Table A1).
4. Results
4.1. Whole-rock compositions
Tephra from ET3 and ET6 contain some of thehighest MgO, FeO, CaO, and Al2O3, and lowest Na2Oreported for Arenal (Fig. 4; Table 3). The new ET3samples reported here (AR0301 and AR0302) arebasalts (50–52 wt.% SiO2; Mg#=53) and fall withinthe range of previous ET3 analyses, correlating withthe high Al2O3 (N20 wt.%), CaO (∼ 11 wt.%) and Ba/La (N43) of the base of the ET3 section (Bolge et al.,2004; Fig. 5). Some of these chemical characteristicsare thought to derive from excess plagioclase at the topof the magma body prior to eruption of ET3 (Bolgeet al., 2004).

ECTEDPR
OOF
395
396
397
398
399
400
401
402
403
404
405
406
407
408
409
410
411
412
413
414
415
416
417
418
419
420
421
422
423
424
425
426
427
Fig. 4. Major element variations in Arenal whole rocks, as well as melt inclusions from ET tephras. Whole rocks studied here labeled in panel a.Olivine-hosted MI, as well as matrix glass from ET3 and ET6 are from this study and Melson (1983; Table 1). Large, light gray field encompassesArenal whole rocks (Carr et al., 2003; data points shown); small, darker gray field encompasses the main population of ET3 matrix glass from Bolgeet al. (2004); data points not shown. Pyroxene, plagioclase, and magnetite-hosted melt inclusions from the current eruption from Anderson (1979),and pyroxene-hosted inclusions from Williams-Jones et al. (2001). Point labeled “1968–2003 WR” from Ryder et al. (this issue). Melt inclusioncompositions from this study have been corrected for post-entrapment olivine crystallization (Table 1). All compositions plotted have beennormalized to volatile-free, 100% totals, except those melt inclusions in Table 1 that have low totals (b96%, in part due to alkali loss). In these cases,compositions have been normalized volatile-free, assuming an original total of 96%, in order to prevent over-correction.
10 J.A. Wade et al. / Journal of Volcanology and Geothermal Research xx (2006) xxx–xxx
ARTICLE IN PRESS
UNCO
RR4.2. Olivine phenocrysts
Nineteen olivines from ET3 and five from ET6 wereanalyzed for major and, in some cases, trace elementconcentrations (Table A1). Fig. 6 shows a histogram ofthe olivine population from ET3 samples AR0301 andAR0302. Cores range from Fo76 to Fo81 and rims rangefrom Fo75–68, and thus the olivine grains as a group shownormal zoning. The upper range of the olivine forsteritecontents (Fo81) is the dominant population, and is inapproximate equilibrium with the whole rock Mg#(assuming KD (Oliv−Liq)
Fe /Mg =0.3 and Fe3+/FeΣFe =10–20%).The olivine rims approach composition in equilibriumwith ET3 matrix glass (fromMelson, 1983; Fig. 7). Thusthe olivines in these ET3 samples could have formed byclosed-system crystallization, with the first olivinescrystallizing from the bulk magma, and later olivinesand rims forming from the residual liquids. In compar-
ison, the current eruption includes rare olivines (Strecket al., 2005), and while some compositionally overlapwith those from ET3 (Fig. 6), the population's peak isshifted to lower mean Fo contents (b Fo75), consistentwith the more evolved whole rocks observed.
4.3. Melt inclusions—major elements and trace elements
Fifteen olivine-hosted melt inclusions from ET3 andfour from ET6 were analyzed for this study. All but oneinclusion (NMNH ET3b) are fully enclosed, with round,oval, oblong, or rectangularmorphologies (Table 1). Fig. 7shows the Mg# of the melt inclusions plotted against theFo content of the host olivines. As is commonly observed,Arenalmelt inclusions haveMg#'s that are too low to be inequilibrium with their host olivines. This is typically in-terpreted as a result of post-entrapment crystallization ofolivine within the melt inclusion during cooling (e.g.,

ROOF
428
429
430
431
432
433
434
435
436
437
438
439
440
441
442
443
444
445
446
447
448
449
450
451
452
453
454
455
Fig. 5. a) The two ET3 samples studied here derive from the base of the ET3 tephra unit, where both CaO and Ba/La are highest (white squares areET3 whole rocks from Bolge et al., 2004). Line marks the expected position of the NMNHET3 sample within Bolge et al.'s geochemical stratigraphy,given its CaO content (Table 3). Error bars represent 3% uncertainty based on replicate analyses. b) Trace elements systematically vary along theCentral American arc, and the Arenal MI fall within the range of Arenal whole rocks (shaded field). Irazú and Cerro Negro, and Arenal whole rockdata from Carr et al. (2003). Error bars represent 8% uncertainty (Table 4).
11J.A. Wade et al. / Journal of Volcanology and Geothermal Research xx (2006) xxx–xxx
ARTICLE IN PRESS
ECCervantes and Wallace, 2003). Notably, however, a fewET3 melt inclusions are in actual equilibrium with theirolivine hosts (Fig. 7), and so were likely trapped at atemperature similar to that of the pre-eruptive magma.Melt inclusions trapped in higher-Fo olivines (N Fo75) tendto be closer to equilibrium with their hosts than thosetrapped in lower-Fo olivine (b Fo75). The six inclusionshosted in the lowest-Fo olivines are from the NMNH ET3and ET6 thin sections, and all have lowAl2O3 (see below).We assume that post-entrapment crystallization is themainprocess that has led to a lack of equilibrium between meltinclusion and host, and to correct for this, we addedequilibrium olivine in 1% increments into glass composi-tions until glass and olivine host satisfied KD (as above).
UNCO
RR
Fig. 6. Histogram of the olivine analyses from ET3 samples AR0302 and AR0grain (see Table A1). Forsterite content (Fo) in equilibrium with whole rocks imelt is Fe3+. Also shown is the total range of Fo contents of olivines that hostanalyses of olivine from the current eruption for comparison after Fig. 2c in Sto fit the figure.
TEDPThe amount of olivine that was added to achieve equili-
brium ranged from 0–12%, and averaged 4% (Table 1),typical again of other studies (Sisson and Layne, 1993;Cervantes and Wallace, 2003).
Melt inclusion compositions range from basalt to an-desite (∼ 50–59 wt.% SiO2), whether considering theuncorrected data and or the data corrected for post-entrap-ment crystallization of olivine (Table 1). Once renorma-lized to volatile-free compositions, the melt inclusions shiftto a higher range in SiO2 (∼ 51–61wt.%)and fall generallywithin the range of other Arenal whole rocks in MgO andSiO2 (Fig. 4). Notably, FeO in the renormalized meltinclusion compositions are higher than the whole rockcompositions, and so have not suffered from the kinds of
301. Some olivines were analyzed in multiple locations within the sames plotted as a circle, assuming KD
Fe/Mg=0.3 and 5–20% of total Fe in themelt inclusions. The shaded field encloses a compilation of microprobetreck et al. (2005). Their olivine frequency was reduced by a factor of 6

PROO
F456
457
458
459
460
461
462
463
464
465
466
467
468
469
470
471
472
473
474
475
Fig. 7. Mg# of the melt inclusion versus forsterite of the adjacent olivine. These melt compositions have not been corrected for post-entrapmentcrystallization (e.g. raw EMP data, Table 1). The curve plotted KD
Fe/Mg=0.3) represents equilibrium between inclusion and host. Data (from Table 1)are plotted as bars, for which Fe3+/ΣFe in the melt is allowed to vary from 5% (bar bottom) to 20% (bar top). Also shown are compositions along thecurve that would be in equilibrium with various relevant whole rock and glass compositions.
12 J.A. Wade et al. / Journal of Volcanology and Geothermal Research xx (2006) xxx–xxx
ARTICLE IN PRESS
EC
Fe-loss effects described by Danyushevsky et al. (2004;Fig. 4). However, nearly all inclusions have lower Al2O3
than Arenal whole rocks at the same MgO (including allET3 and ET6 whole rocks; Fig. 4). Not only are they low,but they break into two groups of high- and low-Al, whichcorrelate with volatile concentrations (discussed below).For this reason, we will hereafter refer to the two groups asHAMI (HighAluminumMelt Inclusions, withN16.5wt.%Al2O3 in the olivine-corrected compositions in Table 1) andLAMI (≤16.5 wt.% Al2O3). Note that these groups are
UNCO
RR
Fig. 8. Chondrite-normalized rare earth element (REE) patterns for Arenal Mrock data (sources as in Fig. 2).
TED
different from those defined by Borgia et al. (1988), whichwere based on whole rock compositions and discriminatedby a much higher Al2O3 (20 wt.%). AR0301 HAMI haveslightly higher Al2O3 than the HAMI from AR0302. TheLAMI form a systematic trend in their disequilibrium fromhost olivines (Fig. 7), and in general represent moremodified compositions. In fact, there are no volcanic rockserupted from Arenal that overlap with the LAMI, althoughmany overlap with ET3 matrix glass compositions (Bolgeet al., 2004; Fig. 4).
I's and whole rocks (Table 4). The shaded field encloses Arenal whole

DPR
OOF
476
477
478
479
480
481
482
483
484
485
486
487
488
489
490
491
492
493
494
495
496
497
498
499
500
501
502
503
504
505
506
507
508
509
510
511
512
513
514
515
516
517
518
519
520
521
522
523
524
525
Fig. 9. Volatile (H2O and CO2) concentrations in Arenal melt inclusions, plotted with vapor saturation isobars calculated for basaltic melts fromVolatileCalc (Newman and Lowenstern, 2002). Samples compromised by carbon contamination not plotted, but listed in Table 1. Error bars indicate10% rsd, external SIMS precision (see Section 3.1 of text). Solid black curve traces a closed-system degassing path assuming starting conditions of1100 °C, 10% exsolved vapor, and 49% SiO2. Fo of host olivine decreases with progressive degassing. Inset relates Arenal MI to Cerro Negro MICerro Negro data from Roggensack et al., 1997, 2001a.
13J.A. Wade et al. / Journal of Volcanology and Geothermal Research xx (2006) xxx–xxx
ARTICLE IN PRESS
UNCO
RREC
Melt inclusion REE patterns are nearly parallel to eachother, as well as tomost whole-rocks fromArenal (Fig. 8).REE concentrations rise with SiO2 and P2O5, and decrea-sing MgO, consistent with magma fractionation. Traceelement ratios (e.g. Sm/La and Ba/La; Fig. 5b) fall withinthe range for other Arenal rocks. Ba/La in the AR0301melt inclusions (41–43) is nearly identical to that in theAR0301 whole rock (43; Fig. 5b). The AR0302 meltinclusions include an anomalously low Ba/La value (35)and one (48) that is similar to the whole rock value (45).The similarity in Ba/La between the ET3 melt inclusionsand whole rocks provides evidence that the melt in-clusions are indeed derived from ET3 magma, and thatET3 whole rock Ba/La is not strongly affected by pla-gioclase accumulation.
4.4. Melt inclusions—volatile content
Water concentrations in Arenal melt inclusions rangefrom 1.1 to 3.9 wt.% (Table 1, Fig. 9). These valuescorrelate broadly with host Fo content (Fig. 9) and theSiO2 concentration in the melt inclusion (Fig. 2a), re-flecting coupled crystal fractionation and H2O degassing.CO2 in the melt inclusions varies from 50–300 ppm, anddescribes what is best modeled as a closed-systemdegassing trend with H2O (Fig. 9). Mixed H2O–CO2
TEvapor-saturation isobars suggest that the highest-H2Oinclusions from Arenal were trapped at ∼ 2 kbar, and thelowest at ∼ 0.2 kbar (Fig. 9). HAMI were trapped athigher pressures (N1.2 kbar) than LAMI, as indicated bytheir higher H2O and CO2 contents. These pressures areminima, however, as S and Cl will lower CO2 and H2Osolubility in melts, and so raise vapor saturation pressures(Webster, 2005). Based on crystal–melt equilibria,Reagan et al. (1987), Cigolini (1998) and Ryder et al.(this issue) estimate 4–10 kbar crystallization pressuresfor modern Arenal magmas.
The melt inclusions with the highest water concentra-tions also have the highest sulfur (∼ 3000 ppm; Fig. 10a),and H2O and S together define a degassing trend ana-logous to that of H2O and CO2. Modeling such a trend ismore difficult than for H2O–CO2, given the lack ofexperimental constraints on sulfur solubility in melts thatare saturated with a mixed vapor, and the complication ofmultiple sulfur species as a function of oxidation state(Wallace and Carmichael, 1992). We thus take theapproach of Sisson and Layne (1993), and calculate adegassing path based on a constant partition coefficientbetween vapor and melt, and independent constraints onthemodal proportion of vapor, liquid, and crystals, derivedfrom the H2O–K2O relationships (Fig. 10a). While thisexercise does not take into account the importance of T, P,
PROO
F
526
527
528
529
530
531
532
533
534
535
536
537
538
539
540
541
542
543
544
545
546
547
548
549
550
551
552
553
554
555
556
557
558
559
560
561
562
563
564
565
566
567
568
569
570
571
572
573
574
575
576
577
578
579
580
581
582
583
584
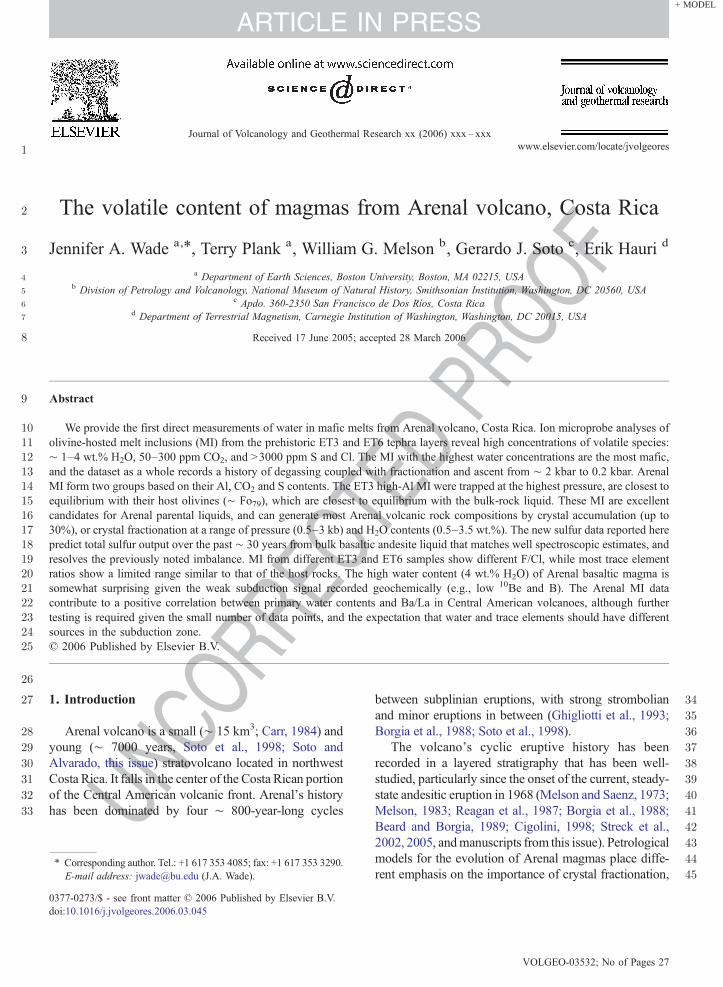
585
Fig. 10. Water, sulfur, and Cl degassing in Arenal MI's, compared to other Central American MI's. The solid degassing paths are after Fig. 6 in Sissonand Layne (1993), calculated for Arenal assuming a constant DS
fluid/melt =70 and DClfluid/melt =6. The dashed lines are Fuego S and Cl degassing paths
from Sisson and Layne (1993). Inset shows K2O–H2O data used to calculate the proportion of H2O vapor in the bulk separating assemblage (lineshows model for 6% H2O vapor, assuming KD(Xtal–Melt)=0 for K2O. Sulfide solubility from Wallace (2005), and corresponds to the limit for sulfide-saturated basaltic melt (1150 °C, 8 wt.% FeOT, 1 bar and NNO-2). Cerro Negro data from Roggensack et al. (1997) and Roggensack (2001a), Fuegodata from Roggensack (2001b) and Sisson and Layne (1993). Error bars for H2O indicate 10% rsd. S and Cl plotted as average (+/− SD) of themultiple measurements listed in Table 1. If single measurements were made, error bars are the average uncertainty (12% for S and Cl; see Section 3.1of text).
14 J.A. Wade et al. / Journal of Volcanology and Geothermal Research xx (2006) xxx–xxx
ARTICLE IN PRESS
UNCO
RREC
and fO2 controls on sulfur solubility, it does at least pro-vide a comparison to Sisson and Layne's calculation forFuego melt inclusions. We can create the Arenal S–H2Odegassing path given 6 wt.% vapor in the bulk separatingassemblage (e.g. with the other 94% being crystals), and aD(vapor / liquid) for sulfur of 70. This calculation is consistentwith the H2O–CO2 path shown in Fig. 9, as the vapor isdominated by H2O along the path (N97 wt.%; Newmanand Lowenstern, 2002). The parameters calculated abovefor Arenal are broadly similar to those estimated forFuego, with Arenal having slightly less H2O in the mode(6% vs. 8% for Fuego) and a higherD for S (70 vs. 34 forFuego). The differences are consistent with Arenal meltshaving lower overall water contents (1–4wt.%vs. 1–6wt.% for Fuego), and so less water vapor in the mode. Arenalmelts also record lower vapor saturation pressures(b2 kbar vs. N3 kbar for Fuego), consistent with a lowersulfur solubility in the melt (higher D).
The calculated sulfur degassing curve passes through allof the ET3 and ET6 melt inclusions, except for two HAMIfromAR0301.Melts from this sample appear to have lowerwater for a given sulfur,which could be a primary feature ofthe parental melt. All of the LAMI have b1200 ppm S, andso reflect more degassed compositions than HAMI. K-αmeasurements indicate that most of the sulfur dissolved inArenal melt inclusions is speciated as sulfate (58–84% oftotal sulfur; Table 1), which means that none of the MIcontain enough sulfide species to saturate a sulfide phase(assuming 1200 ppm as the limit of sulfide solubility inmelts with≤8 wt.% FeOT;Wallace and Carmichael, 1992;
TEDFig. 10a). The high sulfur concentrations in least degassed
Arenal melt inclusions, many N2000 ppm, also appear toreflect a lack of sulfide saturation during mantle melting,and possible excess sulfur in the mantle source (Wallace,2005). The measured sulfur species, combined with theformulations in Wallace and Carmichael (1992) yield arange of fO2 from 0.5 to 1.1 log units above NNO, or anaverage fO2 of NNO+0.9 (Table 1). Such high fO2
estimates are typical of arc magmas (Carmichael, 1991;Wallace and Carmichael, 1992, 1994; Metrich andClocchiatti, 1996; Wallace, 2005) and fall within therange of estimates made for Arenal by some previousworkers. Reagan et al. (1987) calculate∼NNO+0.3 basedon coexisting titanomagnetite and ilmenite grains in agabbroic xenolith expelled during the recent eruption,while Beard andBorgia (1989) calculate NNO+1 based onmagnetite in gabbroic enclaves. Ryder et al. (this issue)conclude that fO2must be at least QFM+2 (∼NNO+1.2)in order to match the fractionation assemblage of Stage 1(1968–1971) Arenal magmas. With the exception of thehigher gabbroic estimates in Cigolini (1988) (∼ NNO+2),most studies, including the melt inclusion-derived esti-mates here, thus support fO2 in the range from NNO+0.5to+1 for Arenal mafic magmas.
In contrast to the progressive degassing of H2O, CO2,and S (Figs. 9, 10), Arenal melt inclusions record increas-ing concentrations of F and Cl with SiO2 (Fig. 11). This isconsistent with the higher solubility of F andCl (relative toH2O, CO2 and S) in mafic to intermediate melt com-positions (Webster, 2004). Similar degassing calculations

ECTEDPR
OOF
586
587
588
589
590
591
592
593
594
595
596
597
598
599
600
601
602
603
604
605
606
607
608
609
610
611
612
613
614
615
616
617
618
619
620
621
Fig. 11. a) Cl vs F and b) Cl vs. U in Arenal melt inclusions (Tables 1, 3). As Cl and F increase during fractionation, so do incompatible elements suchas U. Values adjacent to data points denote olivine-corrected SiO2 content of the inclusion in wt.%. The ET6 point without a SiO2 value was notanalyzed for major elements (Table 1). Lines of constant ratio are shown for reference. Error bars indicate 8% rsd for U, and 9% for F and Cl (seeSection 3.1 of text).
15J.A. Wade et al. / Journal of Volcanology and Geothermal Research xx (2006) xxx–xxx
ARTICLE IN PRESS
UNCO
RRfor S and Cl predict a D(vapor / liquid) of 6 for Cl, althoughvalue between 0 and 13 will produce a degassing curvethat passes through some portion of the melt inclusiondata. The lowerD values, however, are consistent with thegreater melt solubility of Cl than S, and the incompatiblebehavior of Cl. Chlorine correlates well with other traceelements, such as U (Fig. 11b), that are highly incompa-tible in crystals and vapors under these conditions. Cl andF also correlate well in the ET6melt inclusions, andwithinHAMI from different samples (Fig. 11a). Different F/Clvariations may reflect different parental magma composi-tions for ET6, and different phases of the ET3 eruption.ET6 melt inclusions also appear to have lower Cl for thesame S as ET3 inclusions.
In summary, the most primitive melt inclusions fromArenal are high-alumina basaltic liquids hosted in Fo76–79 olivines and contain up to 4 wt.% H2O, N200 ppmCO2, N2000 ppm S, ∼ 1500 ppm Cl and N300 ppm F.
The olivines that host these melt inclusions are nearequilibrium with whole rock compositions, and the meltinclusions have trace element ratios similar to those inthe whole rock hosts. Thus these volatile estimates arereasonable for the ET3 parent magma. The ET6 meltinclusions are more evolved, but have similar H2O–CO2
and S histories to the ET3 magmas, and so presumablyreflect a magma with a similar volatile budget to ET3(albeit with slightly different Cl and F). Taken as awhole,the melt inclusions record the systematic degassing ofH2O, CO2, and S upon ascent from N2 kbar to 0.2 kbar.Measures of magma differentiation, such as Si, K and Focovary with volatile contents, suggesting a coupled pro-cess of ascent, degassing, and crystallization. The mostdegassedmelt inclusions,withH2O–CO2 vapor saturationpressures of b1.2 kbar, also have unusual, low-Alcompositions that are unlike most volcanic rocks fromArenal.

622
623
624
625
626
627
628
629
630
631
632
633
634
635
636
637
638
639
640
641
642
643
644
645
646
647
648
649
650
651
652
653
654
655
656
657
658
659
660
661
662
663
664
665
666
667
668
669
16 J.A. Wade et al. / Journal of Volcanology and Geothermal Research xx (2006) xxx–xxx
ARTICLE IN PRESS
5. Discussion
5.1. Implications for the differentiation of Arenalmagmas
The data we report here for Arenal melt inclusionsprovides us with the opportunity to reassess petrologicmodels for the differentiation of Arenal magmas. Mostrock samples collected from arc volcanoes are mixtures ofcrystals and liquid to varying degrees. This is especiallytrue of Arenal, where a high degree of crystallinity, in theform of phenocrysts (Bolge et al., 2004), xenocrysts(Streck et al., 2004) and xenoliths (Reagan et al., 1987;Beard and Borgia, 1989; Cigolini, 1998), is widespread inmafic and intermediate eruptives. Melt inclusions repre-sent rare samples of magmatic liquid, and can clarify therelative role of liquid and crystal in making up whole rockcompositions, and the extent to which whole rocks repre-sent liquid compositions.
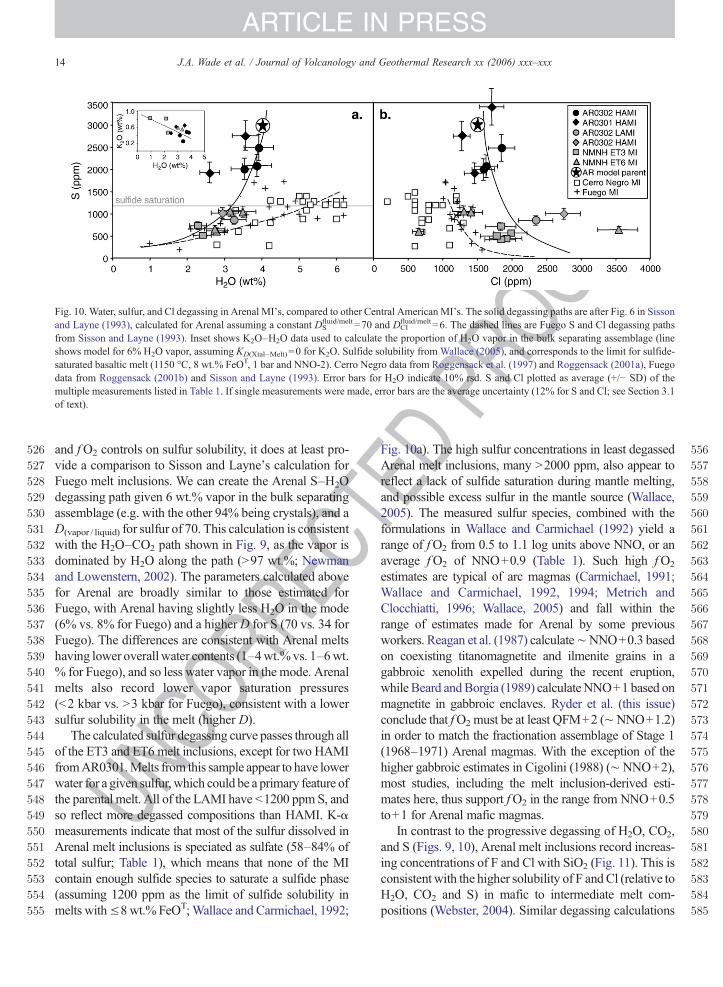
Here we provide an overview of the compositionalspectrum of Arenal volcanic rocks. Our inferences arebased largely onMgO–Al2O3 systematics, as alumina haslong been recognized as a dominant vector of variability inArenal volcanics, and relates directly to processes invol-ving plagioclase, the dominant crystalline phase (Borgia
UNCO
RREC
Fig. 12. Al2O3 variation with MgO in Arenal whole rocks and melt inclusionfield encompasses main population of ET3 matrix glass (Bolge et al., 2004). Tend-member cumulate assemblages containing plagioclase and cpx in the paddition. Lower, dashed black line is liquid line of descent (LLD) generated fBlack solid line is LLD generated from pMELTS (Ghiorso et al., 2002) with 3high pressure LLD because it includes significantly more phase equilibrium cfor the state properties of water dissolved in melt (Ghiorso et al., 2002). MELThe clinopyroxene used for mixing calculations contains 5 wt.% Al2O3 andobserved parent of Ryder et al. (this issue) to their calculated daughter comp
DPR
OOF
et al., 1988; Bolge et al., 2004) and (Fig. 12). We beginwith the premise that the HAMI of ET3 are potentialliquids. These inclusions represent melt trapped at thehighest pressures, have the least degassed compositions,and are closest to equilibrium with the host olivines. Itfollows that their major element compositions are theclosest to actual parental Arenal liquids.
In order to facilitate discussion ofmagma variation, wepresent a model composition which we believe to be thebest estimate of an Arenal parent magma (Table 2). Westart with the major element composition of the highestMgO melt inclusion (after olivine-correction, AR0302-5b). Because Na2O in this MI was likely lost during themicroprobe analysis, and P2O5 was not measured, we usevalues appropriate to whole rocks in the same composi-tional range. A water content of 4.0 wt.% was chosen toreflect the maximum measured in Arenal melt inclusions(3.93 wt.%), Other volatile species were chosen to beconsistent with H2O of 4 wt.%, given the trends in Figs. 9and 10 and F/Cl of 0.2 (Fig. 11). The composition wasthen re-normalized to 100% (both including the volatiles,and without; Table 2). Clearly more than one parentalmagma feeds the Arenal system, but the compositionalfeatures of this parent provides a useful reference to thewhole rock population.
TE
s. Data sources and corrections/normalizations as in Fig. 4. Small grayhin gray line calculated by mixing between model parent (Table 2) androportion indicated. Tick marks on the line represent 5% total crystalrom MELTS (Ghiorso and Sack, 1995) with 0.5 wt.% H2O at 500 bars..5 wt.% H2O at 3 kbar. We chose to use pMELTS for the high H2O andonstraints at N1 atm pressure, as well as an improved reference modelTS is preferred for low-P, low-H2O calculations (Asimow et al., 2004).15 wt.% MgO. Thick gray line represents the possible LLD from theositions.
670
671
672
673
674
675
676
677
678
679
680
681
682
683
684
685
686
687
688
689
690
691
692
693
694
695
696
697
698
699
700
701
702
703
704
705
706
707
708
709
710
711
712
713
714
715
716
717
718
719
720
721
722
723
724
725
726
727
728
729
730
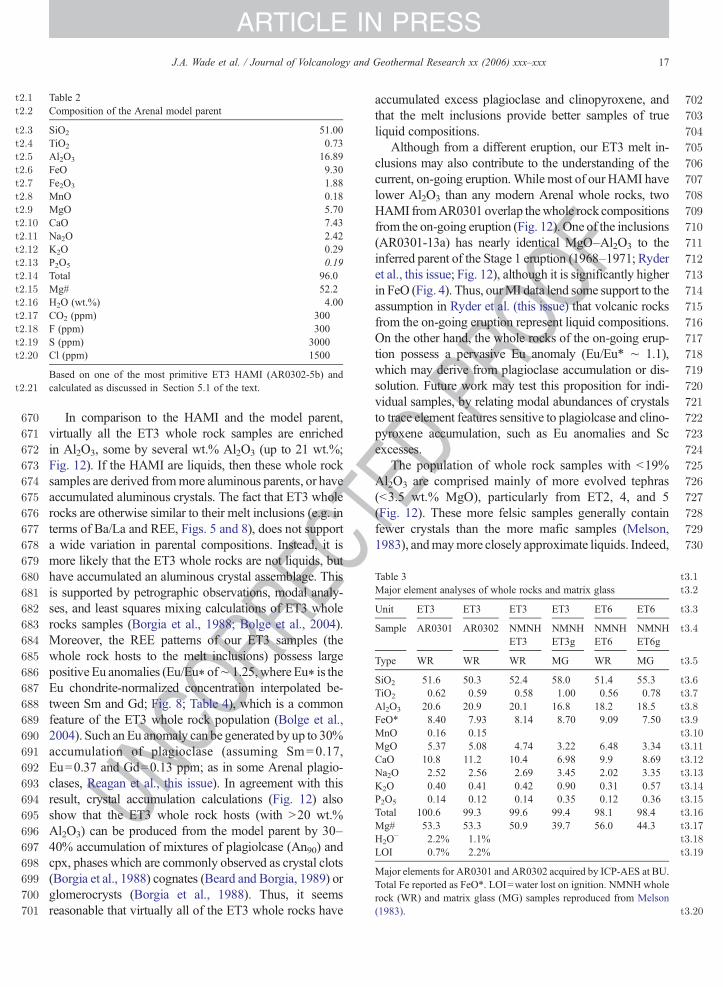
Table 3 t3:1
Major element analyses of whole rocks and matrix glass t3:2
t3:3Unit ET3 ET3 ET3 ET3 ET6 ET6
t3:4Sample AR0301 AR0302 NMNHET3
NMNHET3g
NMNHET6
NMNHET6g
t3:5Type WR WR WR MG WR MG
t3:6SiO2 51.6 50.3 52.4 58.0 51.4 55.3t3:7TiO2 0.62 0.59 0.58 1.00 0.56 0.78t3:8Al2O3 20.6 20.9 20.1 16.8 18.2 18.5t3:9FeO* 8.40 7.93 8.14 8.70 9.09 7.50t3:10MnO 0.16 0.15t3:11MgO 5.37 5.08 4.74 3.22 6.48 3.34t3:12CaO 10.8 11.2 10.4 6.98 9.9 8.69t3:13Na2O 2.52 2.56 2.69 3.45 2.02 3.35t3:14K2O 0.40 0.41 0.42 0.90 0.31 0.57t3:15P2O5 0.14 0.12 0.14 0.35 0.12 0.36t3:16Total 100.6 99.3 99.6 99.4 98.1 98.4t3:17Mg# 53.3 53.3 50.9 39.7 56.0 44.3t3:18H2O
− 2.2% 1.1%t3:19LOI 0.7% 2.2%
Major elements for AR0301 and AR0302 acquired by ICP-AES at BU.Total Fe reported as FeO*. LOI=water lost on ignition. NMNH wholerock (WR) and matrix glass (MG) samples reproduced from Melson(1983). t3:20
Table 2t2:1
Composition of the Arenal model parentt2:2
t2:3 SiO2 51.00t2:4 TiO2 0.73t2:5 Al2O3 16.89t2:6 FeO 9.30t2:7 Fe2O3 1.88t2:8 MnO 0.18t2:9 MgO 5.70t2:10 CaO 7.43t2:11 Na2O 2.42t2:12 K2O 0.29t2:13 P2O5 0.19t2:14 Total 96.0t2:15 Mg# 52.2t2:16 H2O (wt.%) 4.00t2:17 CO2 (ppm) 300t2:18 F (ppm) 300t2:19 S (ppm) 3000t2:20 Cl (ppm) 1500
Based on one of the most primitive ET3 HAMI (AR0302-5b) andcalculated as discussed in Section 5.1 of the text.t2:21
17J.A. Wade et al. / Journal of Volcanology and Geothermal Research xx (2006) xxx–xxx
ARTICLE IN PRESS
UNCO
RREC
In comparison to the HAMI and the model parent,virtually all the ET3 whole rock samples are enrichedin Al2O3, some by several wt.% Al2O3 (up to 21 wt.%;Fig. 12). If the HAMI are liquids, then these whole rocksamples are derived frommore aluminous parents, or haveaccumulated aluminous crystals. The fact that ET3 wholerocks are otherwise similar to their melt inclusions (e.g. interms of Ba/La and REE, Figs. 5 and 8), does not supporta wide variation in parental compositions. Instead, it ismore likely that the ET3 whole rocks are not liquids, buthave accumulated an aluminous crystal assemblage. Thisis supported by petrographic observations, modal analy-ses, and least squares mixing calculations of ET3 wholerocks samples (Borgia et al., 1988; Bolge et al., 2004).Moreover, the REE patterns of our ET3 samples (thewhole rock hosts to the melt inclusions) possess largepositive Eu anomalies (Eu/Eu⁎ of∼ 1.25,where Eu⁎ is theEu chondrite-normalized concentration interpolated be-tween Sm and Gd; Fig. 8; Table 4), which is a commonfeature of the ET3 whole rock population (Bolge et al.,2004). Such an Eu anomaly can be generated by up to 30%accumulation of plagioclase (assuming Sm=0.17,Eu=0.37 and Gd=0.13 ppm; as in some Arenal plagio-clases, Reagan et al., this issue). In agreement with thisresult, crystal accumulation calculations (Fig. 12) alsoshow that the ET3 whole rock hosts (with N20 wt.%Al2O3) can be produced from the model parent by 30–40% accumulation of mixtures of plagiolcase (An90) andcpx, phases which are commonly observed as crystal clots(Borgia et al., 1988) cognates (Beard and Borgia, 1989) orglomerocrysts (Borgia et al., 1988). Thus, it seemsreasonable that virtually all of the ET3 whole rocks have
TEDPR
OOF
accumulated excess plagioclase and clinopyroxene, andthat the melt inclusions provide better samples of trueliquid compositions.
Although from a different eruption, our ET3 melt in-clusions may also contribute to the understanding of thecurrent, on-going eruption. While most of our HAMI havelower Al2O3 than any modern Arenal whole rocks, twoHAMI fromAR0301 overlap thewhole rock compositionsfrom the on-going eruption (Fig. 12). One of the inclusions(AR0301-13a) has nearly identical MgO–Al2O3 to theinferred parent of the Stage 1 eruption (1968–1971; Ryderet al., this issue; Fig. 12), although it is significantly higherin FeO (Fig. 4). Thus, ourMI data lend some support to theassumption in Ryder et al. (this issue) that volcanic rocksfrom the on-going eruption represent liquid compositions.On the other hand, the whole rocks of the on-going erup-tion possess a pervasive Eu anomaly (Eu/Eu* ∼ 1.1),which may derive from plagioclase accumulation or dis-solution. Future work may test this proposition for indi-vidual samples, by relating modal abundances of crystalsto trace element features sensitive to plagiolcase and clino-pyroxene accumulation, such as Eu anomalies and Scexcesses.
The population of whole rock samples with b19%Al2O3 are comprised mainly of more evolved tephras(b3.5 wt.% MgO), particularly from ET2, 4, and 5(Fig. 12). These more felsic samples generally containfewer crystals than the more mafic samples (Melson,1983), andmaymore closely approximate liquids. Indeed,

ECTEDPR
OOF
731
732
733
734
735
736
737
738
739
740
741
742
743
744
745
746
747
748
749
750
751
752
753
754
755
756
757
758
759
760
761
762
763
764
Table 4t4:1
Trace element compositions of ET3 melt inclusions and whole rockst4:2
t4:3 Unit ET3 ET3 ET3 ET3 ET3 ET3 ET3
t4:4 Sample name AR0301–1a AR0301–2a AR0301–13a AR0302–4a AR0302–5a BCR–2g AR0301 AR0302
t4:5 Type MI MI MI MI MI Average %RSD WR WR
t4:6 Li 9.12 11.66 7.95 8.92 4.61 10.085 12% 6.45 5.90t4:7 Sc 22.57 21.51 26.97 16.76 17.53 34.54 7% 23.88 21.52t4:8 V 260 186 165 134 160 389 6% 204 179t4:9 Cr 3.93 16.05 10.68 5.30 13.24 13.79 9% 37.73 33.34t4:10 Co 18.2 26.2 36.8 14.9 26.2 39.3 9% 28.4 27.0t4:11 Ni 9.56 12.76 26.27 1.02 8.20 10.4 16% 27.97 25.80t4:12 Cu 255 470 428 313 69.4 28.5 12% 114.5 99.1t4:13 Zn 67.6 105 143 60.1 75.6 152 10% 67.1 60.7t4:14 Rb 15.92 11.82 11.84 11.56 6.33 52.5 9% 7.00 6.37t4:15 Sr 450 772 682 397 420 348 10% 691 667t4:16 Y 26.6 18.8 14.7 19.6 10.1 38.4 10% 13.7 12.1t4:17 Zr 60.2 46.6 37.1 72.3 27.2 209 7% 37.5 32.0t4:18 Nb 5.90 2.97 3.10 5.30 2.89 14 4% 3.03 2.77t4:19 Ba 922 511 397 514 347 670 4% 364 325t4:20 La 21.3 12.4 9.45 14.4 7.25 25.5 3% 8.48 7.20t4:21 Ce 43.1 29.3 22.3 31.6 15.6 55.1 3% 18.3 15.6t4:22 Pr 6.07 4.14 2.45 4.78 1.86 7.10 7% 2.44 2.11t4:23 Nd 23.8 15.7 9.70 18.8 9.27 30.0 6% 10.64 9.19t4:24 Sm 6.14 3.08 2.61 4.07 2.28 6.90 3% 2.51 2.23t4:25 Eu 2.00 1.20 0.808 1.29 0.750 2.10 6% 1.037 0.941t4:26 Gd 5.97 3.96 2.32 4.74 2.26 7.50 10% 2.63 2.35t4:27 Tb 1.05 0.815 0.354 0.571 0.305 1.16 13% 0.391 0.350t4:28 Dy 5.82 3.81 3.28 3.98 2.13 6.99 14% 2.37 2.08t4:29 Er 2.79 1.56 1.27 2.09 1.03 3.87 11% 1.30 1.16t4:30 Yb 2.62 1.59 1.28 2.20 1.09 3.71 11% 1.29 1.15t4:31 Hf 1.83 1.12 0.97 2.44 1.07 5.43 9% 1.06 0.91t4:32 Ta 0.310 0.278 0.169 0.570 0.200 0.890 15% 0.161 0.146t4:33 Pb 5.95 3.97 3.25 3.39 2.35 11.1 8% 2.14 1.94t4:34 Th 1.34 0.570 1.03 1.19 0.450 6.29 11% 0.604 0.499t4:35 U 0.594 0.348 0.285 0.567 0.276 1.77 7% 0.237 0.205
Melt inclusion (MI) trace elements acquired by LA-ICP-MS at BU. 43Ca was used as an internal standard (see Table 1). Whole-rock (WR) traceelements acquired by solution ICP-MS. Average RSD of replicate analyses of BCR—2 g was 8%.t4:36
18 J.A. Wade et al. / Journal of Volcanology and Geothermal Research xx (2006) xxx–xxx
ARTICLE IN PRESS
UNCO
RRliquid line of descent calculations (using the pMELTSalgorithm of Ghiorso et al., 2002) demonstrate that thesetephras, as well as most of the HAMI, may be derivedfrom the model parent by crystal fractionation of a wetmagma (3–4% H2O) at moderate pressure (∼ 3 kbar;Fig. 12). Thus, the HAMI and these tephras, taken toge-ther, may record a dominant, wet liquid line of descent forArenal magmas. The break along the LLD between rockswith increasing Al2O3 with decreasing MgO, and thosewith decreasing Al2O3 may mark the late appearance ofplagioclase on the high-pH2O cotectic. The cumulatecomplements to low-MgO liquids on this liquid line ofdescent also predict solid compositions very similar tothose needed to generate high-MgO, high-Al2O3 rocksfrom the HAMI by crystal accumulation (Fig. 12). If thevolcanic rocks of the on-going eruption represent liquidcompositions, then they require even greater suppression
of plagioclase, due to higher water contents and/or higherpressures of crystallization than the low alumina tephras.This inference is consistent with the high pressures(∼ 4 kb) of differentiation also estimated by Ryder et al.(this issue) from their MELTS modeling.
The remaining Arenal magma compositions are theLAMI from ET3 and ET6. These inclusions contain lessCO2 and S than the HAMI of Group A, and so reflecttrapping at lower pressures (1.2–0.2 kbar) along decom-pressing, degassing paths (Figs. 9 and 10). Fig. 7 showsthat these inclusions become progressively further out ofequilibrium as host Fo contents decrease, reflecting pro-gressively more post-entrapment crystallization and cool-ing prior to eruption. The low aluminum compositions areconsistent with calculated LLD resulting from earlyplagioclase fractionation at low-pH2O (∼ 0.5 kb, similarto their trapping pressures; Fig. 12). While this low pH2O
765
766
767
768
769
770
771
772
773
774
775
776
777
778
779
780
781
782
783
784
785
786
787
788
789
790
791
792
793
794
795
796
797
798
799
800
801
802
803
804
805
806
807
808
809
810
811
812
813
814
815
816
817
818
819
820
821
822
823
824
825
826
827
828
829
830
831
832
833
834
835
836
837
838
839
840
841
842
843
844
845
846
847
848
849
850
851
852
853
854
855
856
857
858
859
860
861
862
863
864
865
866
19J.A. Wade et al. / Journal of Volcanology and Geothermal Research xx (2006) xxx–xxx
ARTICLE IN PRESS
UNCO
RREC
origin of the LAMI seems reasonable given the observa-tions, it is somewhat problematic in that these composi-tions are never observed in the whole rock population.LAMI do, however, resemble ET3 matrix glass (Fig. 12),supporting the notion that these are residual liquidsformed at low pressure, and not caused by some post-entrapment effect unique to the melt inclusions. Thus,LAMI represent residual liquids which may have formedin a shallowmush zone and sampled as glass inclusions ormatrix between phenocrysts, and entrained in eruptingmagmas.
In summary, the melt inclusion data presented hereprovide baseline parental liquid compositions (HAMI),against which the effects of crystal accumulation (in ET3whole rocks) and crystal fractionation at high pH2O(HAMI and low Al2O3 tephra) and low pH2O (LAMI)can be identified. Thus, the broad range of compositionserupted at Arenal may be produced by the complemen-tary process of crystal fractionation and accumulation,from what could be a fairly restricted range of parentalliquids. The ET3 HAMI may represent liquids parentalto most of Arenal eruptives, and in this way, may relate tothe “unseen” compositions referred to in several studiesof Arenal (Reagan et al., 1987; Borgia et al., 1988; Beardand Borgia, 1989; Williams-Jones et al., 2001; Strecket al., 2005).
5.2. The H2O content of Arenal magmas
The newmelt inclusion data reported here demonstratethat Arenal magmas are indeed wet, with H2O contents inET3 and ET6melt inclusions ranging from 1.1–3.9 wt.%.The highest water contents are found in the lowest silicamelt inclusions (∼ 50%, Fig. 2a), trapped at the highestpressures up to 2 kbar (Fig. 9). The lowest water contentsare found in the more silicic melt inclusions (∼ 57%),trapped at low pressures near 0.2 kbar (Fig. 9). Therefore,as Arenal magmas differentiate, they ascend and degas,driving further crystallization, and finally eruption. On asilica–H2O diagram (Fig. 2a), the melt inclusions formtwo arrays, one correlating with higher pressures ofentrapment (N1 kbar, as recorded by their H2O–CO2
vapor saturation pressures, Fig. 9), and the other, with agreater loss of water per increase in silica, correlating withlower pressures of entrapment (b1 kbar). ET6 inclusionsappear to be restricted to the higher P array. Both arraysconverge at the low silica end, approaching 4wt.%H2O inbasaltic melt inclusions.
Thus, our best estimate of the ET3 basaltic magma is4 wt.%H2O. These basaltic melt compositions, however,are certainly not primary (i.e., not in equilibrium withmantle peridotite), and a significant history of crystal-
TEDPR
OOF
lization and degassing may have preceded entrapment.In fact, if we back-project the H2O–CO2 degassing trendfor Arenal, it appears to intersect the melt inclusion datafor Cerro Negro, with N5% water (Fig. 9). Such highwater contents for Arenal, however, are not supported bythe H2O–S degassing path, which is highly curved andasymptotically approaches 4% water at very high sulfur(N3000 ppm), in excess of all sulfur measurements forCerro Negro (Fig. 10a). In the lack of any other data, wetherefore propose 4 wt.% water as an upper limit forArenal basalts.
In support of this estimate is a calculation based on theCa–Na exchange hygrometer in Sisson andGrove (1993).Pairing the most mafic ET3 inclusions (N5% MgO;Table 1) with the maximum An measured in the basaltET3 unit (An92.8–93.1) yields a magmatic water contentof ∼ 4.5 wt.% water (Fig. 2b). Although dependent to alarge degree on the plagioclase-melt pairing assumptions,this result is in excellent accord with the maximum watercontents measured in ET3 inclusions (3.8–3.9 wt.%).Further work targeting melt inclusions in high An pla-gioclases (although we found none suitably large enoughin our ET3 samples) should test this method, which hasenjoyed some success in other studies (Straub and Layne,2003).
Confirmation of relatively high water contents in thelate stages of two of Arenal's eruptive cycles (ET3 andET6) cause us to reconsider the notion, based on thepresence of hornblende in the early blasts of the currenteruption, that pH2O is highest early in the eruptive cycle,and decreases over the course of the eruption (Borgia et al.,1988). Phenocryst data reported by Borgia et al. (1988) infact indicate the opposite (their Fig. 10b, c). The eruptionsleading up to ET3 and ET6, which are late in their res-pective cycles, show a decrease in modal plagioclasecontent, with an increase in An content. Because bothsuppression of plagioclase and high An contents charac-terize wet magmas (e.g., Sisson and Grove, 1993), itseems likely that pH2O was actually higher in the laterstages of the eruptive cycles, and not the beginning. Horn-blende found in enclaves ejected during the early stagesof the current eruption in 1968 are not in equilibriumwiththe host volcanic rocks (Beard and Borgia, 1989) andcould have been derived from pre-existing cumulates(Cigolini, 1998).
With a solid understanding of the water variations as afunction of Arenal magma evolution, we are now in aposition to test predictions of previous studies as to thewater content of Arenal magmas. The most direct com-parison is with the sum–deficit estimates of ET6 meltinclusions byMelson (1983), since this is the same samplein which we obtained SIMS measurements. The sum–

867
868
869
870
871
872
873
874
875
876
877
878
879
880
881
882
883
884
885
886
887
888
889
890
891
892
893
894
895
896
897
898
899
900
901
902
903
904
905
906
907
908
909
910
911
912
913
914
915
916
917
918
919
920
921
922
923
924
925
926
927
928
929
930
931
932
933
934
935
936
937
938
939
940
941
942
943
944
945
946
947
948
949
950
951
952
953
954
955
956
957
958
959
960
961
962
963
964
965
966
967
968
20 J.A. Wade et al. / Journal of Volcanology and Geothermal Research xx (2006) xxx–xxx
ARTICLE IN PRESS
UNCO
RREC
deficit estimates, which fall between 3.5 and 4.3 wt.%H2O, are higher than, but generally overlap with, our newmeasurements (2.8–3.5 wt.% H2O; Fig. 2a). The moreprecise SIMS data, however, define a systematic decline ofwater with increasing silica not observed in the earliermeasurements (Fig. 2a). ET6 melt inclusions have fairlylow sulfur (b1500 ppm), but otherwise fall on the same S–H2O degassing trend as ET3. Thus, they may have ex-perienced more degassing, and backtrack to higher H2Othan measured (Fig. 10a). Our best estimate for ET6(N3.5 wt.% H2O) is in general accord with the values usedby previous workers based on Melson's original work(∼ 4 wt.%).
Other petrological predictions of water content forArenal magmas have been made using volcanic materialsfrom the recent eruption (since 1968), and so are notstrictly comparable to our ET3 and ET6 measurements.Nonetheless, the similarity in major and trace elementcontents of ET3 and recent eruptives invites such a com-parison. Several studies used the presence of hornblende,combined with the co-existence of other phases, to arguefor water contents from 3–5 wt.% in basaltic andesites(Fig. 2a; Reagan et al., 1987; Beard and Borgia, 1989).This range generally exceeds thatmeasured here in basalticandesite melt inclusions (b3%), but not that in the basalticmelt inclusions (3–4%). Arenal basaltic melts (i.e. withSiO2b52 wt.%), however, generally have Na2O (b3%),too low to stabilize hornblende (Fig. 4c, d; Sisson andGrove, 1993), and so the hornblende-based estimatesmorereasonably apply to compositions N56% silica (as isappropriate to the Stage 1 lavas of the on-going eruption;Reagan et al., 1987). The wide range of water estimatesderived from hornblende stability underscore its use as ablunt tool, which requires independent knowledge of otherparameters (e.g. Na, T and P) to use with greater preci-sion. Likewise, the sum–deficit estimates from Anderson(1979) predict values between 0% and 7%, in mostlydacitic melts (Fig. 2a). We find no evidence for watercontents higher than 4% in our samples, and so the higherprevious estimates either derive from imprecision in theprevious techniques, or a fundamental difference in theway that the modern eruption evolves. We note, however,that the estimates of Ryder et al. (2005—this issue) usingMELTS (2.5 wt.% H2O) conform well to our measure-ments for ET3 basaltic andesite inclusions (Fig. 2a).
In summary, petrologic inferences, and now directmeasurements in melt inclusions indicate that Arenalmagmas contain up to 4 wt.% H2O. Although some pre-vious workers estimated much higher H2O contents forsilicic compositions from the recent eruption, these haveyet to be confirmed with direct measurements. Olivine israre in the current eruption, but future work could focus on
TEDPR
OOF
melt inclusions within other phases (such as high Anplagioclases and high Mg# clinopyroxenes), coupled withthe use and development of geohygrometers.
5.3. Implications for S fluxes
We can also use the new sulfur data presented here tohelp reconcile the petrologic vs. spectroscopic estimatesof sulfur output at Arenal. Williams-Jones et al. (2001)measured SO2 fluxes in the volcanic plume at Arenalusing correlation spectrometry (COSPEC) in 1982, 1995,and 1996. With these data, they estimate that at least1.3 Mt (and as much as 3.9 Mt) of SO2 has been emittedfromArenal between 1968 and 1996. This output is muchlarger than what they calculated from S concentrations inclinopyroxene- and plagioclase-hosted melt inclusions inrecent surge and lava deposits, which averaged 356 ppm.Assuming that the total volume of material extruded fromArenal since 1968 was ∼ 4.6×10⁸ m3, their calculationresulted in the emission of SO2 (ESO2)=0.41Mt, a factorof 3–9 times lower than the COSPEC estimate. To ac-count for this discrepancy, they invoke a continuously-replenishing sulfur-rich basaltic magma.
Our sulfur data suggest an alternative explanation,however. The inclusions used by Williams-Jones et al.(2001) were dacitic (Fig. 4), and considerably more de-gassed than we would predict for the basaltic andesiteeruption they were trying to model. Fig. 13 shows sulfurin our mafic to intermediate melt inclusions, compared totheir dacitic inclusions. The inclusions as a whole definea sulfur degassing trend as silica in the melt increases. Ifour pre-historic melt inclusions are representative of themodern magmas, then this trend would predict between500 and 1500 ppm sulfur in undegassed basaltic andesitemagma containing 54–55% SiO2, like the bulk of themodern eruption (Reagan et al., 1987). This effect aloneraises the petrologic estimate by a factor of 1.5–4.3, andinto the range of the COSPEC estimates. But Williams-Jones et al. (2001) also assume that their dacitic meltinclusions represent only 50% of the erupted volume,with the other 50% being crystals. If we assume insteadthat the entire volume of erupted magma was once a bulkbasaltic andesite liquid, then the estimates increase byanother factor of 2 (3–9), almost precisely within theCOSPEC range (Fig. 13).
Quantitative degassing of the observed volume ofbasaltic andesite liquid erupted from 1968–1996 providesample sulfur to account forwhat ismeasured byCOSPEC.In fact, given that parental Arenal basaltic magmas beginwith N2000 ppm sulfur, a large surplus of petrologic sulfurmust be degassed or lost to other regions of the crust andnot contribute to the volcanic plume. This means that SO2

PROO
F969
970
971
972
973
974
975
976
977
978
979
980
981
982
983
984
985
986
987
988
989
990
991
992
993
994
995
996
997
998
999
1000
1001
1002
1003
1004
1005
1006
1007
1008
1009
1010
1011
1012
1013
1014
1015
1016
1017
1018
1019
1020
1021
1022
Fig. 13. Variation of sulfur as a function of silica in ET3 and ET6 olivine-hosted melt inclusions (this study, Table 1) and cpx- and plag-hosted meltinclusions from the modern eruption (Williams-Jones et al., 2001). Melt inclusions describe a systematic degassing trend (solid line) for Arenalmagmas, from N3000 ppm in parental basalts, to 500–1500 ppm for the basaltic andesites of the modern eruption (shown as a shaded bar), todegassed dacites (b700 ppm). Modern eruption estimate (shaded bar) derives from restricted silica range of 54–55% observed for most of the moderneruption (Reagan et al., 1987), and the full width of the sulfur degassing trend (curves fit by eye). This range is virtually identical to that required toexplain the COSPEC-derived sulfur outputs at the Arenal plume from 1968–1996 (1.3–3.9Mt; Williams-Jones et al., 2001). Sulfur outputs calculatedusing parameters in Williams-Jones et al. (2001), but assuming phi(melt)=1.0 instead of 0.5, or that the volume of erupted material is a bulk liquid ofthe concentration given by the lines. Sulfur error bars as in Fig. 10.
21J.A. Wade et al. / Journal of Volcanology and Geothermal Research xx (2006) xxx–xxx
ARTICLE IN PRESS
UNCO
RREC
fluxes measured in volcanic plumes may grossly under-estimate basaltic fluxes.
5.4. Implications for slab proxies
A final implication of our results is for the cycling ofwater and other tracers from the downgoing plate to themantle source beneath Arenal. Because water measure-ments in arc magmas are rare, existing literature has reliedon various proxies, such as boron (Leeman et al., 1994)and Ba/La (Walker et al., 1995), based on their presumed“fluid-mobile” behavior. Now that we have both an esti-mate of magmatic H2O and trace element data on a set ofmelt inclusions, we can evaluate the accuracy of slab-derived fluid proxies such as Ba/La. It is first important tonote the similarity in Ba/La between our melt inclusionsand Arenal whole rocks, particularly those from ET3(Table 4, Fig. 5b). Moreover, the relative constancy in Ba/La (41–43) in ET3 sample AR0301 (Table 4), over a largerange in silica (50–57%), provides evidence against crustalcontamination, as has been proposed by Cigolini (1998),based on the presence of crustal xenoliths in the earlyphase of the recent eruption.These observations support anuncontaminated, common lineage between the parentmagma of the melt inclusions and the ET3 whole rocks.
The water contents of Arenal basaltic melt inclusions(∼ 4 wt.%) are less than those from Fuego (4–5 wt.%;Sisson and Layne, 1993; Roggensack, 2001b) and Cerro
TEDNegro (5–6 wt.%; Roggensack et al., 1997) but greater
than those from Irazú (∼ 3 wt.%; Benjamin et al., 2004),and this is the same sense of variation as Ba/La (e.g.,from N100 for Cerro Negro, and b25 for Irazú). Beforecomparing these variations in detail, however, watercontents must be corrected for differences in the extent ofdifferentiation with respect to primary magmas. If we addolivine to the melt inclusion compositions until they are inequilibrium with mantle olivine (Fo90), there is much lessdifference in primary water contents (H2OFo90) along-arc(Fig. 14). Cerro Negro is still the wettest (avg. H2OFo90∼3.6 wt.%) and Irazú the driest (avg. H2OFo90∼2.4 wt.%,higher only than Guatemalan behind-the-front (BVF)volcanoes; Fig. 14), but the total range is now only a factorof 1.5. Within this restricted range, the primary H2OFo90
contents do correlate with Ba/La, and so there is somebasis for using Ba/La as a water proxy. Moreover, withinET3 samples from Arenal, AR0302 appears to haveslightly higher water (also at constant S; Fig. 10a), as wellas higher Ba/La (Fig. 14), so these parameters maycorrelate at a fine scale.
The variation of Ba/La with water, however, is notsimply related to progressive addition of a H2O-rich andBa/La-rich component to aMORB or OIBmantle. All theCentral American magmas have water contents that aresignificantly higher than MORB or OIB, despite the factthat Ba/La approaches OIB values in Irazú. In fact, theseresults are counter to previous notions that Costa Rican

EDPR
OOF
1023
1024
1025
1026
1027
1028
1029
1030
1031
1032
1033
1034
1035
1036
1037
1038
1039
1040
1041
1042
1043
1044
1045
1046
1047
1048
1049
1050
1051
1052
1053
1054
1055
1056
1057
1058
1059
1060
1061
1062
1063
1064
1065
1066
1067
1068
1069
1070
Fig. 14. Ba/La versus H2O in Arenal, Irazú, Cerro Negro, Fuego, and Guatemalan BVF melt inclusions, calculated to be in equilibrium with themantle (Fo90), assuming KD
Mg/Fe=0.3 and that 20% of iron is Fe3+. Open symbols are the averages for each volcano (error bars enclose the total range),and Arenal ET3 points are plotted individually (error bars indicate 10% rsd). Gray bar is possible range for ET6, based on the highest-H2OMI and therange in Ba/La for the unit (Bolge et al., 2005). Guatemalan BVF data from Walker et al. (2003). Irazú data is unpublished (Benjamin et al.). Otherdata sources as in Fig. 10, and exclude those that may have degassed significant water (i.e. with Sb1000 ppm, and CO2b200 ppm). Maximum H2Oin OIB comes from data in Dixon et al. (2002), assuming average OIB Ce of 80 ppm (Sun and McDonough, 1989) and the high end of OIB range forH2O/Ce of 200 (also from Dixon et al., 2002). MORB from Salters and Stracke (2004) assuming mean mantle melt fraction of 10%.
22 J.A. Wade et al. / Journal of Volcanology and Geothermal Research xx (2006) xxx–xxx
ARTICLE IN PRESS
UNCO
RREC
volcanics derive largely from an enriched OIB mantlewith a weak or absent subduction component (e.g. Carr,1984; Herrstrom et al., 1995; Patino et al., 2000). ArenalMI with N3 wt.% H2O have H2O/Ce of 1000–2300(Table 4), roughly an order of magnitude higher than thatin the MORB-OIB mantle (H2O/Ce=100–250; Dixonet al., 2002). Even without subtracting the Ce contribu-tions from the slab, this requires up to an order ofmagnitude higher H2O in themantle source toArenal thanMORB-OIB mantle.
Even more noteworthy are the high Cl contents inCosta Rican magmas (Arenal and Irazú), higher thanthose in Nicaraguan magmas. Thus for some slab tracers(Cl), Costa Rican volcanoes actually bear a dominantsignal. The ratio of Cl to H2O also varies systematicallyfrom volcano to volcano, with the lowest ratios at CerroNegro, and the highest at Irazú (Fig. 15). If we convertthese to equivalent salinities (following Kent et al., 2002),then the Cerro Negro fluid is similar to seawater salinity(∼ 3%), while the Irazú fluid is five times more saline.Thus, questions as to the mantle composition aside,different slab components appear to feed the differentvolcanoes along the Central American arc, from a water-rich, low salinity, high Ba/La fluid at Cerro Negro, to a
T
fluid with the opposite characteristics at Irazú, and Arenalfalling in between.
What is the source of these different slab componentsthat vary along the arc? There are three key parametersthat vary along-strike of the trench that may contribute todifferences in the slab component. First is the extent ofhydration of the down-going plate, which appears to begreater off Nicaragua thanCosta Rica. This is based on theextent of outer rise faulting (Ranero et al., 2003), theseismic velocity of the slab waveguide (Abers et al.,2003), and low-δ18O values inwetNicaraguan lavaswhichmay be a result of serpentine-derived fluids (Eiler et al.,2005). Second is the greater contribution to Nicaraguavolcanoes of the uppermost pelagic sediments, whichcontain high 10Be and Ba/La (Patino et al., 2000), than toCosta Rica volcanoes (Tera et al., 1986), where the up-permost sediment appears to be underplated (Morris et al.,2002). Third is the appearance of Galapagos-derivedigneous and volcaniclastic material to the south at theCocos Ridge and nearby seamounts (Werner et al., 1999;Hoernle et al., 2000), which contribute material to centralCosta Rica (Arenal to Irazú) with low Ba/La (like OIB)and presumably high water and Cl (seawater-alteredvolcaniclastic sediments and igneous rocks). As a result of

OOF
1071
1072
1073
1074
1075
1076
1077
1078
1079
1080
1081
1082
1083
1084
1085
1086
1087
1088
1089
1090
1091
1092
1093
1094
1095
1096
1097
1098
1099
1100
1101
1102
1103
1104
1105
1106
1107
1108
1109
1110
1111
1112
1113
1114
1115
1116
1117
1118
1119
1120
1121
1122
1123
1124
1125
1126
1127
1128
1129
1130
1131
1132
1133
1134
1135
Fig. 15. Water and chlorine in Arenal MI's, compared to other Central American MI's. Lines of constant Cl/H2O and calculated salinities (after Kentet al., 2002). Melt inclusion data sources as in Figs. 10 and 14, and were screened for degassing as in Fig. 14.
23J.A. Wade et al. / Journal of Volcanology and Geothermal Research xx (2006) xxx–xxx
ARTICLE IN PRESS
UNCO
RREC
these effects, the highwater, Ba/La and 10Be of Nicaraguamay relate to the greater hydration of the crust andefficient subduction of pelagic sediments, while the lowerwater, 10Be and Ba/La of Costa Rica relates to loss of thepelagic sediment and gain of OIB volcanic material to thesubduction zone. With multiple sources potentiallycontributing along the arc (serpentine, altered oceaniccrust, pelagic sediments, and volcaniclastic material), asimple H2O proxy seems unlikely. Clearly the abovehypotheses, as well as the basis for the Ba/La proxy,require testing with more measurements of the volatilecontent of Central American volcanoes.
6. Conclusions
With a relatively small number of well-chosen MI, weare able to determine an elusive but fundamentalparameter in Arenal magmas: the volatile content of thebasaltic liquid parental toArenal eruptives.We havemadehere the first direct water measurements of Arenal melts,and related them to themagmatic evolution and subductedsources beneath Arenal volcano. Below are the mainresults and conclusions of this work:
1. Olivine-hosted melt inclusions from prehistoric ET3tephra include high-aluminum basaltic liquids hostedin Fo76–79 olivines and contain up to 4 wt.% H2O,300 ppmCO2, 3000 ppm S, 1500 ppmCl and 300 ppmF. Unlike some melt inclusions in the literature, theseare close to equilibrium with their host olivines, andreflect trace element compositions similar to that of thehost magma. The population of olivine phenocrysts inET3 tephra could have formed during crystallization ofthe host magma, and do not appear to be exotic. Thus
TEDPRthe volatile andmajor element contents of the ET3melt
inclusions presumably reflect that of the ET3 parentalliquids, and we present here an Arenal “model parent”based on the most mafic and least degassed MI com-positions (Table 2).
2. The high sulfur concentrations (N2500 ppm) of theleast degassed ET3 inclusions are in excess of whatwould be expected for sulfide-saturated melts from themantle. This is consistent with 58–84% of the totalsulfur speciated as sulfate, and high fO2 in Arenalmafic magmas (NNO+0.5 to+1.1).
3. H2O, CO2 and S covary in a manner consistent withdegassing of a vapor phase, from 2 kbar to 0.2 kbar. Cland F, on the other hand, behave like, and correlatewith, other incompatible trace elements (e.g. U). Theserelationships are expected from the known solubility ofvolatile species in silicate melts. F/Cl varies by morethan a factor of 2 between different samples of ET3.
4. Degassing and ascent, as estimated from vapor satura-tion relationships, correlate with measures of mag-ma differentiation, such as Si, K and Fo. Thereforepolybaric crystal fractionation, with decreasing pH2O,is one driver of magma evolution at Arenal. The mostdegassed melts, with H2O–CO2 vapor saturation pres-sures of b1.2 kbar, also have unusual, low-Al com-positions that are unlike any erupted lava or tephrafromArenal. They are similar, however, tomatrix glasscompositions, and appear to be residual liquids formedand trapped at shallow depths in the magmatic plumb-ing system.
5. The high alumina melt inclusions are better candidatesfor Arenal liquids than ET3whole rocks, most of whichhave suffered as much as 30–40% crystal accumulationof plagioclase and clinopyroxene.A fewmelt inclusions

1136
1137
1138
1139
1140
1141
1142
1143
1144
1145
1146
1147
1148
1149
1150
1151
1152
1153
1154
1155
1156
1157
1158
1159
1160
1161
1162
1163
1164
1165
1166
1167
1168
1169
1170
1171
1172
1173
1174
1175
1176
1177
1178
1179
1180
1181
1182
1183
1184
1185
1186
1187
1188
11891190119111931196120612071208
121612341251125212531254126412921296130613341335134813551382139413951396
14081424
143014341435143614401442
1452145514561458146014611468146914701471
147414801481148214831484
14981506150715081516
24 J.A. Wade et al. / Journal of Volcanology and Geothermal Research xx (2006) xxx–xxx
ARTICLE IN PRESS
from ET3 olivines are similar to parental and derivativemelts inferred for the on-going eruption by Ryder et al.(this issue). Some Arenal volcanic rocks and glasses lieonmodel liquid lines of descent derived from themodelparent, at different pressures (0.5–3 kb) and H2O (0.5–3.5wt.%). In the case ofArenal, melt inclusions providenot just volatile information, but otherwise unmeasuredand unseen magmatic liquid compositions.
6. Using ET3 and ET6 melt inclusions as analogs, quan-titative degassing of the observed volume of basalticandesite liquid erupted in 1968–1996 could have pro-vided ample sulfur to account for that measured byCOSPEC.
7. Based on H2O–S degassing systematics, 4% H2O isthe best maximum estimate for undegassed maficET3 magmas. This estimate is somewhat lower thanthe earlier estimates of Melson (1983) by sum–deficitfor ET6, and present data define well the polybaricdegassing paths from basalt to andesite. The similar-ity between ET3 and ET6 tephra and recent eruptivessuggest that 4%water may be typical of modernmaficprecursors as well.
8. The high water and Cl contents of Arenal magmaswere not predicted by other geochemical tracers ofthe slab (10Be, Ba/La, B/La, U/Th), which show aweak subduction signal. For example, Ba/La inArenal is almost 3 times lower than for Cerro Negroin Nicaragua, while calculated primary water con-
U
EDPR
OOF
tents are only 1.3 times lower. Existing data fromfour Central American volcanoes (Irazú, Arenal,Fuego and Cerro Negro) show a positive relationshipbetween H2O and Ba/La, but with a high H2OFo90
intercept, suggesting sources of water in the subduc-tion zone from low-Ba/La materials. This makes sensegiven that pelagic sediments will contribute high Ba/La, but other hydrous sources (e.g. altered oceaniccrust, serpentinites, volcaniclastic sediments) may not.
7. Uncited references
Bolge et al., this issuePlank and Langmuir, 1998
Acknowledgements
We thank Geoff Abers, Guillermo Alvarado, and JimGill for their valuable comments and support, andLouise Bolge for the conversation, perspective, anddata. Detailed and helpful reviews from Mark Reagan,Kurt Roggensack and an anonymous reviewer greatlyimproved the text and presentation of the data. Thanksto Nilanjan Chatterjee, Charles Mandeville, and MindyZimmer for their analytical help, and to ICE and theMARGINS program for the continued sponsorship ofour endeavors. This work was made possible by theNSF OCE-0001897 and OCE-0203650 (PI, Plank).
T ECAppendix ATable A1Olivine compositions
1195119711981199120012011202120312041205120912101211121212131214
Sample LabEMP SiO2 TiO2 A l2O3 FeO RMnO MgO CaO Total Foadj F ocore S c V Cr C o N i Cu Z n S ectionInclusion-bearing olivines
1218121912201221122212231224122512261227122812291230123112321233123512361237 AR0301–1 M 38.1 0.01 0 .02 R21.5 0.33 38.7 0.09 98.7 76 7 8 6 .24 3 .10 3.09 1 68 5 42 5.25 95.9 C ore 1239124012411242124312441245124612471248124912501255125612571258 AR0301–2 A 38.3 0.01 0 .01 22.7 0.42 39.0 0.12 100.5 75 8 1 4 .51 3 .35 10.93 1 56 7 77 8.48 1 28 C ore 1260126112621263126512661267126812691270127112721273127412751276127712781279 AR0301–3 A 37.2 0.04 0 .02 20.0 0.28 41.3 0.13 98.9 79 128112821283128412851286128712881289129012911293129412951297129812991300 AR0301–13 A 38.0 0.02 0 O.39 20.2 0.36 38.6 0.07 97.7 77 7 8 8 .75 3 .56 30.12 1 76 9 37 8.52 112 C ore 1302130313041305130713081309131013111312131313141315131613171318131913201321 AR0302–1a M 38.5 0.02 0 .04 22.4 0.26 39.2 0.09 100.5 76 132313241325132613271328132913301331133213331336133713381339134013411342 AR0302–1b M 38.4 0.01 0 .12 23.3 0.32 38.3 0.12 100.5 75 134413451346134713491350135113521353135413561357135813591360136113621363 AR0302–3 A 37.5 C0.01 0 .00 21.3 0.35 40.0 0.12 99.3 77 1365136613671368136913701371137213731374137513761377137813791380138113831384 AR0302–4 M 38.1 0.01 0 .00 21.8 0.32 39.0 0.10 99.3 76 7 6 1 .68 3 .89 – 1 62 7 83 8.36 94.6 C ore 13861387138813891390139113921393139713981399140014011402140314041405 AR0302–5 A 37.1 0.00 0 .03 23.2 0.33 37.9 0.10 98.7 74 8 1 5 .89 2 .11 14.22 1 66 326 5.81 1 34 C ore 1407140914101411141214131414141514161417141814191420142114221423142514261427 NMNHET3a-ol
A N36.7 0.02 0 .03 24.2 0.50 37.2 0.11 98.7 73142914311432143314371438143914411443144414451446144714481449
NMNHET3b-olA
36.4 0.01 0 .00 24.5 0.46 36.6 0.14 98.1 7314511453145414571459146214631464146514661467
NMNHET3c-olM
37.4 0.02 0 .00 24.6 0.50 36.7 0.17 99.3 73147314751476147714781479148514861487148814891490149114921493
NMNHET3c-olA (rep)
37.2 0.04 0 .00 25.5 0.48 36.8 0.12 100.1 721495149714991500150115021503150415051509151015111512151315141515
NMNH A 37.9 0.01 0 .00 22.7 0.42 37.5 0.11 98.6 75
14961517
1518151915201521 15221523152415251526 15271528152915301531153215331534 153515361537
153915401541154215431544154515461547154815491550155115521553155415551556155715581559
15611562
158415901591159215931594
16051607162116221623163216441653165416911693169417211722
173617541755
175817601761
1780178417851786178717881789179117921793179417951796179717981799
1801180218031804180518061807180818091810181118121813181418151816181718181819182018221823182418251826182718281829183018311832183318341835183618371838183918401841
18421843184418451846
1848
1Table A1 (continued)
1Sample LabEMP SiO2 TiO2 Al2O3 FeO MnO MgO CaO Total Foadj Focore Sc V Cr Co Ni Cu Zn Section1495
1494
1849
1850185118521853185418551856185718581859186018611862186318641865186618671868186918701871187218731874
25J.A. Wade et al. / Journal of Volcanology and Geothermal Research xx (2006) xxx–xxx
ARTICLE IN PRESS
ET6a-olNMNHET6b-ol
A
37.1 0.00 0 .01 22.4 0.35 37.6 0.14 97.6 75R
NMNHET6c-ol
A
37.8 0.03 0 .00 21.3 0.43 38.7 0.10 98.3 761563156415651566156715681569157015711572157315741575157615771578157915801581
NMNHET6d-olA
46.6 0.46 6 .96 6.81 0.17 14.3 21.72 97.0 79158315851586158715881589159515961597159815991600160116021603
NMNHET6d-olA (rep)
48.9 0.57 3 .03 10.8 0.41 14.1 18.81 96.5 70Non-inclusion-bearing olivines
16091610161116121613161416151616161716181619162016241625162616271628 AR0301-10 A 38.1 0.01 0 .00 21.6 0.27 39.1 0.07 99.1 76 79 9 .55 2 .96 – 1 54 691 F6.92 99 C ore 163016311633163416351636163716381639164016411642164316451646164716481649 AR0301-11 81 9 .34 2 .94 5.04 1 58 796 5.15 94 c ore 165116521655165616571658165916601661166216631664166516661667166816691670 AR0301–12 A 38.6 0.02 0 .03 17.8 0.23 41.8 0.08 98.6 81 81 8 .90 3 .17 – 1 83 1 144 5.24 88 R side 1672167316741675167616771678167916801681168216831684168516861687168816891690 AR0301–14 A 38.4 0.02 0 .03 21.1 0.32 38.1 0.10 98.1 76 80 8 .14 2 .98 34.33 1 58 O937 7.21 90 C ore 169516961697169816991700170117021703170417051706170717081709171017111712 AR0301–15 A 39.2 0.00 0 .00 18.2 0.33 41.0 0.10 98.8 80 80 10 .73 3 .35 25.28 1 72 1 039 6.92 96 C ore 171417151716171717181719172017231724172517261727172817291730173117321733 AR0301–16 77 10 .84 3 .08 104.69 1 78 6621 0.2 129 C ore 173517371738173917401741174217431744174517461747174817491750175117521753 NMNHET3g–ol
A 36.3 0.00 0 .00 24.3 0.53 36.6 0.13 97.8 73 O175717591762176317641765176617671768176917701771177217731774177517761777
NMNHET3h–olA
37.3 0.00 0 .00 22.6 0.38 37.5 0.12 97.9 7517791781178217831790
San Carlosolivine9.91
0.153 47.6 90 6.22 3 .01 121.4 1 26 2 900 6.55 46.8SD
0.4 0.002 1.7 0.4 1.0 0P.2
51.4 6 .1 4 7.3 4.5 3.9Rsd
3.9% 1.3% 3.5% 0.39% 1 6% 7 .4% 42% 4 .8% 2 .2% 68% 8.3%TEDMajor element compositions determined at single points by EMP at either MIT (M) or AMNH (A). Trace element compositions determined by LA-
ICP-MS at BU, with the laser in line scan mode (Fig. 3; see Section 3.3 for conditions). Section of the line scan reduced for trace element data asindicated. San Carlos olivine data are averages of 3 replicate analyses across 3 analytical sessions. Isotopes monitored during LA-ICP-MS analyseswere 58Fe, 55Mn,25Mg, 45Sc, 51V, 52Cr, 59Co, 60Ni, 65Cu, 66Zn. Foadj indicates an analysis of the olivine directly adjacent to the MI, via EMP. Focoreindicates an anlysis of the olivine in its compositional core, via LA-ICP-MS.
187518761877187818791880188118821883188418851886188718881889189018911892189318941895189618971898189919001901
UNCO
RRECReferences
Abers, G.A., Plank, T., Hacker, B.R., 2003. The wet Nicaraguan slab.Geophysical Research Letters 30 (2) doi:10.1029/2002GL015649.
Anderson, A.T., 1979. Water in some hypersthenic magmas. Journal ofGeology 87, 509–531.
Asimow, P.D., Dixon, J.E., Langmuir, C.H., 2004. A hydrous meltingand fractionation model for mid-ocean ridge basalts: application tothe mid-Atlantic ridge near the Azores. Geochemistry, Geophysics,Geosystems 5 (1), doi:10.1029/2003GC000568.
Beard, J.S., Borgia, A., 1989. Temporal variation of mineralogy andpetrology in cognate gabbroic enclaves at Arenal volcano, CostaRica. Contributions to Mineralogy and Petrology 103, 110–122.
Benjamin, E.R., Plank, T., Hauri, E.H., Kelley, K.A., Wade, J.A.,Alvarado, G.E., 2004. Water content of a hypothetically drymagma: the 1723 and 1963–65 eruptions of Irazú volcano, CostaRica. Eos, Transactions AGU 85 (17) (Jt. Assem. Suppl., AbstractV54B-02).
Bolge, L.L., Carr, M.J., Feigenson, M.D., Borgia, A., 2004. The geo-chemistry and magmatic evolution of explosive tephra 3 and 4 fromArenal Volcano, Costa Rica. In: Soto, G.J., Alvarado, G.E. (Eds.),Revista Geológica de América Central. Universidad de Costa Rica.
Bolge, L.L., Carr, M.J., Feigenson, M.D., Alvarado, G.E., this issue.Geochemical stratigraphy andmagmatic evolution at Arenal volcano,Costa Rica. Journal of Volcanology and Geothermal Research.
Borgia, A., Poore, C., Carr, M.J., Melson, W.G., Alvarado, G.E., 1988.Structural, stratigraphic, and petrologic aspects of the Arenal–
Chato volcanic system, Costa Rica: evolution of a youngstratovolcanic complex. Bulletin of Volcanology 50, 86–105.
Carmichael, I.S.E., 1991. The redox states of basic and silicic magmas:a reflection of their source regions? Contributions to Mineralogyand Petrology 106, 129–141.
Carr, M.J., 1984. Symmetrical and segmented variation of physical andgeochemical characteristics of the Central American volcanic front.Journal of Volcanology and Geothermal Research 20, 231–252.
Carr, M.J., Feigenson, M.D., Patino, L.C., Walker, J.A., 2003.Volcanism and geochemistry in Central America: progress andproblems. Inside the Subduction Factory, Geophysical Mono-graph, vol. 138. The American Geophysical Union, pp. 153–179.
Carroll, M.R., Rutherford, M.J., 1988. Sulfur speciation in hydrousexperimental glasses of varying oxidation state: results from mea-sured wavelength shifts of sulfur X-rays. American Mineralogist 73,845–849.
Cervantes, P., Wallace, P.J., 2003. Magma degassing and basalticeruption styles; a case study of approximately 2000 year BP XitleVolcano in central Mexico. Journal of Volcanology and Geother-mal Research 120 (3–4), 249–270.
Cigolini, C., 1998. Intracrustal origin of Arenal basaltic andesite in thelight of solid–melt interactions and related compositional buffering.Journal of Volcanology and Geothermal Research 86, 277–310.
Danyushevsky, L.V., Leslie, R.A., Crawford, A.J., Durance, P., 2004.Melt inclusions in primitive olivine phenocrysts: the role oflocalized reaction processes in the origin of anomalous composi-tions. Journal of Petrology 45 (12), 2531–2553.

19021903190419051906190719081909191019111912191319141915191619171918191919201921192219231924192519261927192819291930193119321933193419351936193719381939194019411942194319441945194619471948194919501951195219531954195519561957195819591960196119621963
19641965196619671968196919701971197219731974197519761977197819791980198119821983198419851986198719881989
199019911992199319941995199619971998199920002001200220032004200520062007200820092010201120122013201420152016201720182019202020212022202320242025
26 J.A. Wade et al. / Journal of Volcanology and Geothermal Research xx (2006) xxx–xxx
ARTICLE IN PRESS
UNCO
RREC
Devine, J.D., Gardner, J.E., Brack, H.P., Layne, G.D., Rutherford, M.J.,1995. Comparison of microanalytical methods for estimating H2Ocontents of silicic volcanic glasses. American Mineralogist 80 (3–4),319–328.
Dixon, J.E., Leist, L., Langmuir, C., Schilling, J.-G., 2002. Recycleddehydratrated lithosphere observed in plume-influenced mid-ocean-ridge basalt. Nature 420, 385–389.
Eiler, J.M., Carr, M.J., Reagan, M., Stolper, E., 2005. Oxygen isotopeconstraints on the sources of Central American arc lavas. Geochem-istry, Geophysics, Geosystems 6 (7), doi:10.1029/2004GC000804.
Ghigliotti, M., Frullani, A., Alvarado, G.E., Soto, G.J., 1993. Distribu-ción areal y caracteristicas de los depositos de tefra màs recientes(1080–1968 dC) del Volcán Arenal. Boletín Observatorio Vulcano-lógico del Arenal 4 (8), 11–33.
Ghiorso, M.S., Sack, R.O., 1995. Chemical mass transfer in magmaticprocesses. IV. A revised and internally consistent thermodynamicmodel for the interpolation and extrapolation of liquid-solid-equi-libria in magmatic systems at elevated temperatures and pressures.Contributions to Mineralogy and Petrology 119, 197–212.
Ghiorso, M.S., Hirschmann, M.M., Reiners, P.W., Kress III, V.C.,2002. The pMELTS: a revision of MELTS for improved calcu-lation of phase relations and major element partitioning related topartial melting of the mantle to 3 GPa. Geochemistry, Geophysics,Geosystems 3 (5), doi:10.1029/2001GC000217.
Hauri, E., 2002. SIMS analysis of volatiles in silicate glasses. 2:isotopes and abundances in Hawaiian melt inclusions. ChemicalGeology 183, 115–141.
Hauri, E.,Wang, J., Dixon, J.E., King, P.L., Mandeville, C., Newman, S.,2002. SIMS analysis of volatiles in silicate glasses 1. Calibration,matrix effects and comparisons with FTIR. Chemical Geology 183,99–114.
Herrstrom, E.A., Reagan, M.K., Morris, J.D., 1995. Variations in lavacomposition associated with flow of asthenosphere beneath southernCentral America. Geology 23 (7), 617–620.
Hoernle,K.,Werner, R., PhippsMorgan, J., Garbe-Schonberg,D.,Bryce,J., Mrazek, J., 2000. Existence of complex spatial zonation in theGalapagos plume for at least 14 m.y. Geology 28 (5), 435–438.
Kelley, K.A., Plank, T., Ludden, J., Staudigel, H., 2003. Compositionof altered oceanic crust at ODP Sites 801 and 1149. Geochemistry,Geophysics, Geosystems 4 (6), doi:10.1029/2002GC000435.
Kent, A.J.R., Peate, D.W., Newman, S., Stolper, E.M., Pearce, J.,2002. Chlorine in submarine glasses from the Lau Basin: seawatercontamination and constraints on the composition of slab-derivedfluids. Earth and Planetary Science Letters 202, 361–377.
Leeman, W.P., Carr, M.J., Morris, J.D., 1994. Boron geochemistry of theCentral America volcanic arc: constraints on the genesis of subduction-related magmas. Geochimica et Cosmochimica Acta 58, 149–168.
Luhr, J.F., 2001. Glass inclusions andmelt volatile contents at ParicutinVolcano, Mexico. Contributions to Mineralogy and Petrology,doi:10.1007/s004100100293.
Mandeville, C.W., Webster, J.D. Tappen, C. Taylor, B.E. Timbal, A.Sasaki, A. Hauri, E. Bacon, C.R., in review. Stable isotope andpetrologic evidence for open-system degassing during the climacticand pre-climactic eruptions of Mt. Mazama, Crater Lake, Oregon.Geochimica et Cosmochimica Acta.
Melson, W.G., 1983. Alternation between acidic and basic magmasin major explosive eruptions of Arenal volcano, Costa Rica. Bo-letin de Volcanologia, Universidad Nacional, Costa Rica, vol. 14,pp. 65–74.
Melson, W.G., Saenz, R., 1973. Volume, energy, and cyclicty oferuptions of Arenal volcano, Costa Rica. Bulletin of Volcanology37, 416–437.
TEDPR
OOF
Metrich, N., Clocchiatti, R., 1996. Sulfur abundance and its speciationin oxidized alkaline melts. Geochimica et Cosmochimica Acta 60(21), 4151–4160.
Morris, J., Valentine, R., Harrison, T., 2002. 10Be imaging of sedimentaccretion and subduction along the northeast Japan and Costa Ricaconvergent margins. Geology 30 (1), 59–62.
Newman, S., Lowenstern, J.B., 2002. VolatileCalc: a silicate meltH2O–CO2 solution model written in visual basic for excel. Com-puters and Geosciences 28, 597–604.
Patino, L.C., Carr, M.J., Feigenson, M.D., 2000. Local and regionalvariations in Central American arc lavas controlled by variations insubducted sediment input. Contributions to Mineralogy and Petro-logy 138, 265–283.
Plank, T., Langmuir, C.H., 1998. The chemical composition of sub-ducting sediment and its consequences for the crust and mantle.Chemical Geology 145, 325–394.
Ranero, C.R., Phipps Morgan, J., McIntosh, K., Reichert, C., 2003.Bending-related faulting and mantle serpentinization at the MiddleAmerica trench. Nature 425, 367–373.
Reagan, M.K., Gill, J.B., Malavassi, E., Garcia, M.O., 1987. Changesin magma composition at Arenal volcano, Costa Rica, 1968–1985:Real-time monitoring of open-system differentiation. Bulletin ofVolcanology 49, 415–434.
Reagan, M.K., Tepley, III, F.J., Gill, J.B. Wortel, M. Garrison, J., thisissue. Timescales of degassing and crystallization implied by210Po-210Pb- 226Ra disequilibrium for andesitic lavas erupted fromArenal volcano.
Roggensack, K., 2001a. Sizing up crystals and their melt inclusions: anew approach to crystallization studies. Earth and Planetary ScienceLetters 187, 221–237.
Roggensack, K., 2001b. Unraveling the 1974 eruption of Fuego volcano(Guatemala) with small crystals and their young melt inclusions.Geology 29 (10), 911–914.
Roggensack, K., Hervig, R.L., McKnight, S.B., Williams, S.L., 1997.Explosive basaltic volcanism from Cerro Negro volcano: influenceof volatiles on eruptive style. Science 277, 1639–1642.
Ryder, C.H., Gill, J.B., Tepley III, F., Ramos, F. Reagan, M.K., thisissue. Closed to open system differentiation at Arenal Volcano(1968–2003).
Salters, V.J.M., Stracke, A., 2004. Composition of the depleted mantle.Geochemistry, Geophysics, Geosystems 5 (5), doi:10.1029/2003GC000597.
Sisson, T.W., Grove, T.L., 1993. Experimental investigations of the role ofH2O in calc-alkaline differentiation and subduction zone magmatism.Contributions to Mineralogy and Petrology 113, 143–166.
Sisson, T.W., Layne, G.D., 1993. H2O in basaltic andesite glassinclusions from four subduction-related volcanoes. Earth andPlanetary Science Letters 117, 619–635.
Soto, G.J., Alvarado, G.E., this issue. Eruptive history of Arenalvolcano, Costa Rica, 7 ka to present. Journal of Volcanology andGeothermal Research.
Soto, G.J., Alvarado, G.E., Ghigliotti, M., 1998. El registro eruptivo delArenal en el lapso 3000–7000 años antes del presente y nuevasdeducciones sobre la edad del volcán. Boletín OSIVAM 9 (17–18),19–49.
Soto, G.J., Alvarado, G.E., Bonilla, J., Madrigal, J., Mata, A., Ramirez,R., Rojas, L., Salazar, J., Tristán, E., Villegas, A., 2000. Las faciesproximales de la gran erupción piroclástica basáltica ET-3 del volcánArenal. Boletín OSIVAM 12 (23–24), 54–63.
Stolper, E., Newman, S., 1994. The role of water in the petrogenesis ofMariana trough magmas. Earth and Planetary Science Letters 121,293–325.

202620272028202920302031203220332034203520362037203820392040204120422043204420452046204720482049205020512052
2053205420552056205720582059206020612062206320642065206620672068206920702071207220732074207520762077
2078
2079
27J.A. Wade et al. / Journal of Volcanology and Geothermal Research xx (2006) xxx–xxx
ARTICLE IN PRESS
Straub, S.M., Layne, G.D., 2003. The systematics of chlorine, fluorine,and water in Izu arc front volcanic rocks: implications for volatilerecycling in subduction zones. Geochimica et Cosmochimica Acta67 (21), 4179–4203.
Streck,M.J., Dungan,M.A.,Malavassi, E., Reagan,M.K., Bussy, F., 2002.The role of basalt replenishment in the generation of basaltic andesitesof the ongoing activity at Arenal volcano, Costa Rica: evidence fromclinopyroxene and spinel. Bulletin of Volcanology 64, 316–327.
Streck, M.J., Dungan, M.A., Bussy, F., Malavassi, E., 2005. Mineralinventory of continuously eruption basaltic andesites at Arenalvolcano, Costa Rica: implications for interpreting monotonous,crystal-rich, mafic arc stratigraphies. Journal of Volcanology andGeothermal Research 140, 133–155.
Sun, S., McDonough, W.F., 1989. Chemical and isotopic systematicsof oceanic basalts: implications for mantle composition andprocesses. In: Saunders, A.D., Norrey, M.J. (Eds.), Magmatismin the Ocean Basins. Geological Society, London, Special Pub-lications, vol. 42, pp. 313–345.
Tera, F., Brown, L.D., Morris, J.D., Sacks, S.I., Klein, J., Middleton,R., 1986. Sediment incorporation in island-arc magmas: inferencesfrom 10Be. Geochimica et Cosmochimica Acta 50, 535–550.
Walker, J.A., Carr, M.J., Patino, L.C., Johnson, C.M., Feigenson,M.D.,Ward, R.L., 1995. Abrupt change in magma generation processesacross the Central American arc in southeastern Guatemala: flux-dominated melting near the base of the wedge to decompressionmelting near the top of the wedge. Contributions to Mineralogy andPetrology 120, 378–390.
UNCO
RREC
PROO
F
Walker, J.A., Roggensack, K., Patino, L.C., Cameron, B.I., Matias, O.,2003. The water and trace element contents of melt inclusionsacross an active subduction zone. Contributions to Mineralogy andPetrology 146 (1), 62–77.
Wallace, P.J., 2005. Volatiles in subduction zone magmas: concentra-tions and fluxes based on melt inclusion and volcanic gas data.Journal of Volcanology and Geothermal Research 140, 217–240.
Wallace, P.J., Carmichael, I.S.E., 1992. Sulfur in basaltic magmas. Geo-chimica et Cosmochimica Acta 56, 1863–1874.
Wallace, P.J., Carmichael, I.S.E., 1994. S speciation in submarinebasaltic glasses as determined by measurements of SKa X-raywavelength shifts. American Mineralogist 79, 161–167.
Webster, J.D., 2004. The exsolution of magmatic hydrosaline chlorideliquids. Chemical Geology 210 (1–4), 33–48.
Webster, J.D., 2005. Consequences of exsolution of H2O-, CO2-, SO2-,Cl-bearing volatile phases on the physical and chemical propertiesof magma. Goldschmidt Conference Abstracts, vol. A151.
Werner, R., Hoernle, K., van de Bogaard, P., Ranero, C., von Huene, R.,1999. Drowned 14-m.y.-old Galapagos archipelago off the coast ofCosta Rica: implications for tectonic and evolutionary models.Geology 27 (6), 499–502.
Williams-Jones, G., Stix, J., Heiligmann, M., Barquero, J., Fernandez,E., Gonzalez, E.D., 2001. A model of degassing and seismicity atArenal Volcano, Costa Rica. Journal of Volcanology andGeothermal Research 108, 121–139.
TED