article - pdfs.semanticscholar.org · biology textbooks for these three audiences present a topic...
TRANSCRIPT

CBE—Life Sciences EducationVol. 12, 429–440, Fall 2013
Article
Correlation between MCAT Biology Content Specificationsand Topic Scope and Sequence of General EducationCollege Biology TextbooksSteven W. Rissing
Department of Evolution, Ecology, and Organismal Biology, Ohio State University, Columbus, OH 43210
Submitted February 2, 2013; Revised May 12, 2013; Accepted June 5, 2013Monitoring Editor: Diane Ebert-May
Most American colleges and universities offer gateway biology courses to meet the needs of threeundergraduate audiences: biology and related science majors, many of whom will become biomedicalresearchers; premedical students meeting medical school requirements and preparing for the MedicalCollege Admissions Test (MCAT); and students completing general education (GE) graduationrequirements. Biology textbooks for these three audiences present a topic scope and sequence thatcorrelates with the topic scope and importance ratings of the biology content specifications forthe MCAT regardless of the intended audience. Texts for “nonmajors,” GE courses appear deriveddirectly from their publisher’s majors text. Topic scope and sequence of GE texts reflect those of“their” majors text and, indirectly, the MCAT. MCAT term density of GE texts equals or exceeds thatof their corresponding majors text. Most American universities require a GE curriculum to promotea core level of academic understanding among their graduates. This includes civic scientific literacy,recognized as an essential competence for the development of public policies in an increasinglyscientific and technological world. Deriving GE biology and related science texts from majors textsdesigned to meet very different learning objectives may defeat the scientific literacy goals of mostschools’ GE curricula.
INTRODUCTION
Effective science education requires an instructor to bal-ance explanations of scientific processes with presentationsof factual content (Alberts, 2009). The balance and extent ofthese learning goals in any course should reflect the educa-tional needs of the student audience targeted. College biol-ogy courses, especially gateway ones, target three rather dis-tinct audiences: students preparing for the Medical CollegeAdmission Test (MCAT) and applying to medical schools;students starting undergraduate degree programs in biologyand related science, technology, engineering, and mathemat-
DOI: 10.1187/cbe.13-02-0017Address correspondence to: Steven W. Rissing ([email protected]).
c© 2013 S. W. Rissing. CBE—Life Sciences Education c© 2013 TheAmerican Society for Cell Biology. This article is distributed byThe American Society for Cell Biology under license from theauthor(s). It is available to the public under an Attribution–Noncommercial–Share Alike 3.0 Unported Creative Commons Li-cense (http://creativecommons.org/licenses/by-nc-sa/3.0).“ASCB R©” and “The American Society for Cell Biology R©” are regis-tered trademarks of The American Society for Cell Biology.
ics (STEM) fields; and students fulfilling their institution’sgeneral education (GE) graduation requirements. Tension canexist among the above learning goals and the extent to whichgateway courses balance them for these different audiences(Alberts, 2009). For example, the National Research Council’s(NRC, 2003, p. 112) report, BIO2010, voices concern about theunintended impact of meeting the perceived needs of pre-medical students on the preparation of future biomedicalresearchers enrolled in courses taken by both. While scien-tists and science educators have justifiably focused on theneeds and curricula of these two student audiences (NRC,2003; American Association of Medical Colleges and HowardHughes Medical Institute [AAMC-HHMI], 2009), they haveless direct control over and have focused less attention on theneeds of the much larger, third student audience of “nonma-jor” students as they meet their GE graduation requirements.
In 2009, students receiving bachelor’s degrees from Amer-ican colleges and universities numbered 1,601,368 (NationalCenter for Education Statistics, 2009). We can estimate theportion of that cohort that formed the GE science stu-dent audience by first recognizing that in that same year,AAMC medical schools received first-time applications from31,063 students (AAMC, 2011a), approximately half of whom
429

S. W. Rissing
subsequently matriculated at those schools (AAMC, 2009a).Estimate that most of these applicants and matriculants tookthe MCAT the year before they applied (as recommended bythe AAMC, 2009b) and assume that the number of studentsdelaying medical school applications equals those applyingwho delayed applying previously. In 2008, the AAMC admin-istered 75,809 MCATs (AAMC, 2008) to ∼65,954 individuals,given a retake rate of 13% (AAMC, 2009b). Even allowing fora high level of attrition of students intending to apply to med-ical school between when they began college and decided notto take the MCAT, the vast majority of U.S. college studentslikely take GE courses in biology or related natural sciencesas opposed to introductory majors courses taken by biologyand other STEM majors and premedical students. The typeand extent of factual content, the insights into the strengthsand weaknesses of processes of scientific inquiry, and the bal-ance of these learning goals should differ for this GE audiencecompared with the STEM major and premedical audiences.
Post-Sputnik initiatives to educate more STEM profession-als (Gallagher, 2000) led eventually to the recognition thatsound public policy in a modern democracy also requires“civic scientific literacy” (CSL), that is, the ability of citizens“to understand important policy disputes involving scienceor technology . . . to discharge their (civic) responsibility inthe context of an increasingly scientific society” (Miller, 2007,p. 2; see also Snow, 1959; American Association for the Ad-vancement of Science [AAAS], 1990; Miller, 1998). For thissame reason, the National Science Foundation (1996, p. ii)has stated, “America’s undergraduates—all of them—mustattain a higher level of competence in (STEM)” (emphasis inoriginal) and recently reiterated this position (AAAS, 2009).The undergraduate advising Web pages of the 10 largest pub-lic universities in the United States list GE graduation re-quirements that include one or more courses in biology orother natural sciences and justify this requirement on the ba-sis of promoting CSL. Although these institutions compriseonly 1.5% of all public, bachelor’s degree–granting institu-tions, they awarded 8.4% of the bachelor’s degrees grantedby public institutions in the United States in 2009 (institu-tional data from http://nces.ed.gov/ipeds/datacenter). TheGE curriculum, unique to American higher education (Miller,2010), likely explains higher CSL scores among Americanscompared with Europeans (28% and 14%, respectively; Miller,2007).
If the perceived needs of premedical students impactcourses for STEM majors, as argued by the NRC (2003), thenthe perceived needs of both of those audiences may also im-pact biology and similar natural science courses for studentsin the much larger GE audience. To examine these sorts ofimpacts on different student audiences taking gateway bi-ology courses, I have compared the MCAT biology contentspecifications with the scope and sequence of topics in biol-ogy textbooks intended by their publishers for introductorymajors or GE courses.
I focus on introductory-level courses, because most AAMCmedical schools only require applicants to complete 1 yr ofcollege biology, almost always as a 1-yr, majors sequence(AAMC, 2011b). Further, only 51.2% of medical school ap-plicants and matriculants received bachelor’s degrees inbiology (AAMC, 2009c), confirming NRC’s (2003, p. 5) ob-servation that “departments of physics, chemistry, and math-ematics, as well as departments of biology, feel pressure to
cover the material tested on the MCAT in their introductorycourses (for biology and other STEM majors) to the exclu-sion of other potential topics.” I use textbooks as a conve-nient assay of the curricula for which they are developed andmarketed, because groups of gateway course instructors andother stakeholders tend to make textbook adoption decisionstogether with other decisions regarding learning objectivesof the course(s), curricula, and syllabi. Individual instructors,especially in large, GE biology courses taught increasingly byaffiliated faculty, often play no role in developing curricula,establishing learning objectives, or deciding on a syllabus,much less the choice of a textbook to support a consensuscourse syllabus.
The AAMC surveys medical school faculty and stu-dents extensively to determine relative importance ratingsof MCAT biology and other science content specifications;it then surveys instructors of introductory majors biologycourses, those required by AAMC medical schools, to es-tablish the extent to which those instructors include can-didate MCAT topics in their majors introductory biologycourses. The resulting, final MCAT importance ratings (MIR)fortuitously facilitate an analysis of MCAT impact on scope(number or percent of MCAT topics included in a text) andsequence (regression of a topic’s MIR with standardized start-ing page in a text) of introductory majors and GE biologycurricula as revealed in textbooks for these courses.
METHODS
Scope and Sequence of MCAT Biology ContentSpecificationsAs described in research reports posted on its website, theAAMC determines MCAT biology and other content specifi-cations and the relative importance of specific topics throughthe following process: 1) The AAMC staff develops “lists ofscience topics and sub-topics, compiled from a review of thetop-selling undergraduate introductory biology [and otherscience] . . . text books” (AAMC, 2001, p. 1). 2) They surveya stratified sample of medical school faculty members andstudents to rank those candidate topics by importance forentering medical students on a Likert scale (where 5 = mostimportant, 1 = least important). The mean of these responsesfor each topic constitutes its MIR (AAMC, 2001). 3) They es-tablish a tentative cutoff MIR ≥ 2.25 for inclusion in MCATcontent specifications (represented by a scissors icon inFigures 1 and 2 below). 4) They then survey “faculty teach-ing introductory science courses at a sample of undergradu-ate schools [to determine whether each topic is] . . . coveredsufficiently in undergraduate introductory science courses”(AAMC, 2002, p. 1) by asking a sample of those faculty mem-bers to rank topics on a Likert scale (4 = covered in greaterdepth, 1 = not covered at all), with a cutoff at which “at least70% of the institutions indicated coverage at a minimum orhigher level” required for inclusion in the MCAT contentspecifications (AAMC, 2002, p. 2). 5) They base final MCATcontent specifications on these responses, such that includedtopics exceed both cutoffs. 6) They post the final biology andother content specifications for the MCAT on the AAMC web-site (for current MCAT version, see AAMC, 2002, pp. 9–10; forthe 2014 MCAT, see AAMC, 2010). The AAMC (2009b) also
430 CBE—Life Sciences Education

MCAT Impact on College Biology Texts
Table 1. Texts surveyed for biology/STEM majors and GE courses from two publishersa
Publisher Author(s) c© Year Edition Title ISBN Text pagesb Text wordsc Audienced
Benjamin Cummings N. A. Campbell et al. 2008b 8the Biology 9780321543257 1393 486,107 MajorsBenjamin Cummings N. A. Campbell, J. B.
Reece, M. R. Taylor,E. J. Simon, and J. L.Dickey
2009 6th Biology Concepts &Connections
9780321489845 781 324,433 GE-Lg
Benjamin Cummings N. A. Campbell, J. B.Reece, and E. J. Simon
2007 3rd Essential Biologyf 0805368426 462 142,957 GE-Sml
Benjamin Cummings S. Freeman 2008 3rd Biological Science 9780132249850 1262 N/A MajorsMcGraw-Hill R. J. Brooker, E. P
Widmaier, L. E.Graham, and P. D.Stiling
2008 1st Biology 9780072956207 1300 N/A Majors
McGraw-Hill J. B. Losos, K. A. Mason,S. R. Singer, P. H.Raven, and G. B.Johnson
2008 8th Biology 9780072965810 1260 N/A Majors
McGraw-Hill S. S. Mader 2010a 10th Biology 9780073525433 907 282,450 “Majors” bypublisher
McGraw-Hill S. S. Mader 2009 1st Concepts of Biology 9780073403458 795 277,969 GE-LgMcGraw-Hill S. S. Mader 2010b 2nd Essentials of Biology 9780073403427 602 171,838 GE-Sml
aGE texts from both publishers exist in GE-Lg and GE-Sml versions.bDoes not include appendices, answers to questions, table of contents.cBased on word processor counts of digitized scans of text pages, exclusive of non-core text material embedded in each chapter, such asend-of-chapter questions, further reading lists, text boxes, and so on.dBased on publisher’s description.eThis edition acknowledges 772 faculty reviewers.fText excludes human physiology.
publishes the MCAT content specifications (without MIR val-ues) in its Official Guide to the MCAT Exam.
The AAMC groups its biology content specifications forthe current (2003) and future (2014) MCAT version into fourmajor divisions, each containing primary and nested sec-ondary, tertiary, and a few fourth-order subtopics (due totheir small number, I grouped fourth-order subtopics intotheir parent tertiary subtopics). For example, the biologycontent specifications include the following nested topics:“II. CELLULAR BIOLOGY [division] . . ., L. EUKARYOTICCELL: MITOSIS [primary topic] . . ., 1. Mitotic structures(secondary subtopic) . . ., b. chromatids, centromeres, kineto-chores [tertiary subtopic]” (AAMC, 2002, 2009b). In the 2003surveys, this primary topic (mitosis) and its nested subtopics(chromatids, centromeres, etc.) appeared on the final, postedMCAT content specifications. The AAMC determines MIRsonly for primary MCAT topics.
Generally, I could map the presence or absence of an MCATprimary topic directly to one section of the biology textbooks Ianalyzed; a few topics, however, required special attention inmy analysis of texts or in comparing the 2003 and 2014 MCATbiology content specifications. The 2003 and 2014 surveys in-cluded the primary topic of “Genetics—analytical methods”with a MIR of 2.08. This topic contained secondary topicsof “Hardy-Weinberg principle” and “Test cross: back cross;concepts of parental, F1, and F2 generations.” Because mosttextbooks treated these as separate topics, I treated these bothas separate primary topics, each with an MIR of 2.08. TheAAMC added the 2003 primary topic “Excretory system” tothe list of secondary topics under primary topic of “Digestivesystem” in the 2014 MCAT content survey and specifications.
The 2003 and 2014 AAMC surveys included a primary topicof “Cell theory,” which appeared in several surveyed texts butonly in introductory material and then in a cursory manner;I did not include this topic in my comparisons. The primarytopics, “Individual vertebrate behavior” (MIR = 2.17 in 2003)and “Behavioral relationships” (MIR = 1.96 in 2003) provedindistinguishable in most texts; therefore, I included only theformer topic in my comparisons. The 2014 survey includeda new division of “Integrative and Systems Biology” withtwo new primary topics that are not included here due tothe small number of primary topics and relatively low MIRvalues.
Scope and Sequence of Introductory and GE BiologyTextbooksI determined the scope and sequence for all primary topics,that is, those with calculated MIRs reported by AAMC andthose included in final MCAT biology content specifications,in five introductory majors biology textbooks. I determinedintended audience of all texts examined (Table 1) by consult-ing publishers’ descriptions of their texts on their websitesand/or from materials accompanying examination copies ofthe texts. The publisher of one text described its text as appro-priate for “mixed” audiences, that is, majors and nonmajors.For this analysis, I considered this text (Mader, 2010a) as anintroductory majors text, given its length relative to all othertexts. College text publishers do not disseminate informa-tion regarding the adoption rates or adopting courses of theirtexts; therefore, I chose to examine all current texts sent bypublishers for possible course adoption to the Center for Life
Vol. 12, Fall 2013 431

S. W. Rissing
Sciences Education, which teaches freshman-level, gatewaybiology courses to more than 9000 students per year at OhioState University.
For each text intended for adoption in an introductorymajors biology course, I recorded each MCAT primary andnested topic it presented and the starting page of that pre-sentation. If a text presented a primary MCAT topic in mul-tiple places, I selected the section with the largest number ofsubtopics included and recorded the first page of that sec-tion as the topic’s starting page in that text. For example,“mitosis” usually appears at several places in texts, but themajor discussion in each text could be determined on thebasis of the number of subtopic terms (inevitably in asso-ciation with richly labeled illustrations of the sequence). Topermit comparisons among texts of the presentation sequenceof MCAT topics, I transformed the above starting-page num-bers for MCAT topics by dividing each starting-page num-ber by the total number of text pages (excluding appendices,glossaries, photo credits, study questions and answers, in-dex, etc.), which resulted in a standardized percentile startpage for each topic included in each text. I could then regressthe percentile start pages of primary MCAT topics in a textagainst the MIRs for those topics and among texts. Transfor-mation of percentile starting-page values to achieve a normaldistribution of observations did not alter statistical interpre-tation of any results and is therefore not included here.
The publishers of two of the above introductory majorstexts also produce two separate GE biology textbooks each.The two GE texts of both publishers vary in length; wherenecessary, I differentiate between each of these publisher’sGE-large (GE-Lg) and GE-small (GE-Sml) texts. I expandedthe analysis of the sequence of primary MCAT topics to theseGE texts by recording the pages on which all primary MCATtopics occurred in them and calculating the percentile startpage for that topic as described for majors texts above. Thetwo sets of introductory majors, GE-Lg, and GE-Sml textshad identical (Mader, 2009, 2010b) or overlapping (Campbellet al., 2007, 2009) authors and shared production teams withintheir publishers. Data on the texts sampled appear in Table 1.One GE-Sml text (Campbell et al., 2007) explicitly excluded allhuman physiology topics, for which I corrected in calculatingscope and MCAT term density.
For the two sets of introductory majors, GE-Lg, and GE-Sml texts I determined scope of inclusion of MCAT topicsin each text by noting whether each of them discussed ev-ery primary MCAT topic and its nested, subtopics. Whenan MCAT subtopic included multiple terms (see exampleabove), I scored that topic only once if the text discussed anyof those multiple terms. To compare MCAT term density be-tween and among these two sets of texts, which varied in pagedimensions and non-text materials, I calculated primary–tertiary MCAT term density per standard number of textwords in each text. I divided the number of first-order–third-order MCAT terms determined above by the total number oftext terms of each text. To determine the number of words ineach text, I first optically scanned each (despined) text, us-ing the scan and double-sided original settings of an officephotocopy machine to produce a PDF file for each chapter. Ithen used the standard optical character recognition (OCR)function of Adobe Acrobat Pro 9 to render the PDF files read-able, and copied and pasted each chapter file into a MicrosoftWord file, in which I used the spell-check function to detect
and correct OCR errors and to exclude non-core text materialembedded in each chapter, such as end-of-chapter questions,further reading lists, text boxes, and so on. I then used theword count utility of the Microsoft Word spell-checker to de-termine the number of words in each chapter of each text.I summed the word count for each chapter in each text anddivided the number of MCAT terms in each text (determinedabove) by this word total to arrive at the MCAT term densityper 10,000 text words for each text. Because MCAT and totaltext term number values are exact counts and not estimates,I cannot report means and SDs.
RESULTS
Scope and Relative Importance Ratings of MCATBiology Content SpecificationsRespondents to AAMC’s surveys ranked topics in the Molec-ular biology and genetics and Cellular biology divisions asmost and equally important for entering medical studentsto know for the 2003 (current) MCAT version (Figure 1). Themean MIR calculated by AAMC for molecular biology and ge-netics exceeds the other three divisions for the 2014 (planned)MCAT. Respondents for the current MCAT include more top-ics in biology of body systems division than the other three.They rank topics in the Developmental, organismal, and pop-ulation biology division, which includes the primary topic“Evolution,” as the least important and least numerous forthe current and planned MCAT. The mean MIR of all fourbiology divisions increases between 2003 and 2014, as doesnumber of topics and subtopics, especially in the molecu-lar/cellular divisions (Figure 1).
Sequence of MCAT Content Terms in IntroductoryMajors and GE Biology TextbooksThe presentation sequence of topics in all introductory ma-jors and GE texts examined correlates significantly with theAAMC-determined MIR of those primary topics (Figure 2),even after Bonferroni correction of the significance levels,given the multiple comparisons made. Molecular and cel-lular topics with higher MIRs appear earlier in biology textsthan population, community, and evolution topics with lowerMIRs, such that all texts, no matter the intended audience,employ a small-to-large order of topic presentation. All textssampled include their main discussion of at least 50% of theprimary MCAT biology content specifications within the first30% of the text. The small number of MCAT terms betweenthe 50th and 70th percentile pages of all texts (Figure 2) coin-cides with the plant biology and organismal diversity parts ofthose texts, topics not included in the MCAT biology contentspecifications.
Scope of MCAT Content Terms in Introductory Majorsand GE Biology TextbooksAll five introductory majors texts sampled included all (n =51) or all but one of the primary MCAT content specifica-tions, that is, those with MIRs determined through AAMC’ssurveys of MCAT stakeholders. Within the two sets of majors,GE-Lg, and GE-Sml biology texts, standardized density of allMCAT terms (primary through tertiary) in the GE texts either
432 CBE—Life Sciences Education

MCAT Impact on College Biology Texts
Figure 1. The scope of coverage and relative importance rating of biological topics/subtopics as determined by the AAMC for the 2003and 2014 MCAT. Nested topics (1◦, 2◦, and 3◦) are arranged along an axis according to MIR of all primary topics within each of AAMC’sfour divisions of biology from “most important” ( = 5.0) to “least important” ( = 1.0). The scissors icon at MIR = 2.25 indicates the cutofffor inclusion in the MCAT content specifications for each individual primary topic. Histograms show frequency distribution of nested topicswithin each division.
equals or more often exceeds that of the corresponding ma-jors text by the same author(s) and publisher (Figure 3). Textsfor GE biology courses are more MCAT–term dense than aretexts for introductory biology majors courses, the only biol-ogy courses required by the AAMC for students applying toits medical schools.
I determined the correlation between AAMC’s MIR and thepercentile starting page of each primary MCAT topic in eachof the nine texts sampled (Table 1), which independently re-sulted in regression lines for all texts with similar slopes andintercepts (values in Figure 2). The similarity in sequence oftopic presentation among texts regardless of intended studentaudience, majors versus GE, becomes apparent when com-paring the topic sequence of texts for those different studentaudiences produced by the same author(s) and publisher.Using percentile starting page (defined above) for primaryMCAT topics included in each text to permit comparisonsamong texts, the order of topic presentation in both GE textsof both publishers correlates strongly with the topic presen-tation of the majors text of that same publisher (and the otherpublisher as well).
Not only do the GE texts present topics in nearly identicalsequence to their corresponding majors text (Figure 4), butthey employ similar, albeit abridged, wording (Table 2). Theabridging process seems to start with the majors text withbiological content and text terms deleted some to result in the
larger GE and deleted more to result in the smaller GE text. Iprovide one example of this process and its result on GE textsin the discussion of differences in cytokinesis in plants andanimals in three texts by Campbell and various other authors(Table 2). While some concepts and terms appear in the majorstext and the two GE texts (e.g., cytokinesis, cleavage, cleavagefurrow, and cell plate), others do not (the majors and GE-Lgtexts note that contracting microfilaments in cell division aremade of actin and associated with myosin, but the GE-Smltext discusses the microfilaments without mentioning actinand myosin).
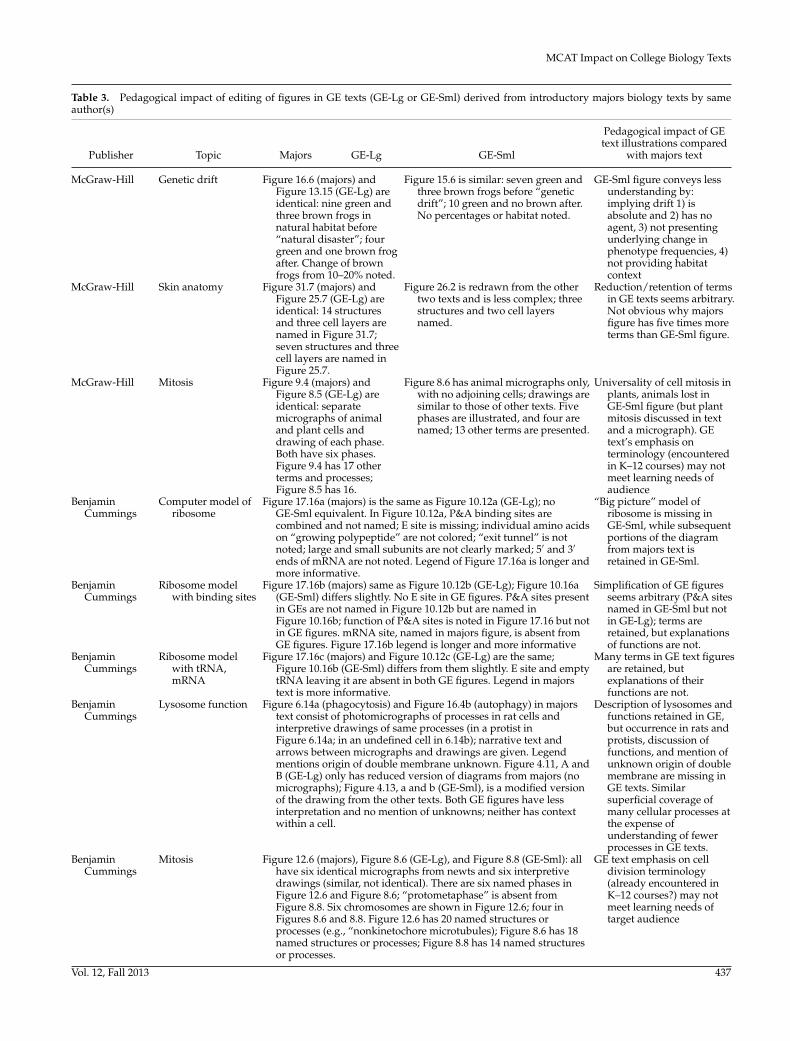
This tendency to abridge text from either publisher’s ma-jors text to derive the GE text extends to majors text fig-ures that appear in simplified format in derived GE texts bythe same author(s) and publisher (Table 3). This occurs eventhough the derived GE figures are usually the same size as theoriginal majors figure; that is, the reduced size of figures in GEtexts did not force reduction in terminology or explanation.These reductions in information content of majors textbooksto derive GE textbooks often seem arbitrary and counter-productive to the learning objectives of many GE biologycourses. For example, the illustrated time line accompanyingthe discussion of the evolution of humans in Campbell et al.’s(2008b) majors text has a sample size of 16 “selected hominidspecies” (Figure 5) while the “time line of human evolution”accompanying the same text discussion in Campbell et al.’s
Vol. 12, Fall 2013 433

S. W. Rissing
Figure 2. Standardized textbook page of appearance of MCAT primary topics against plotted MIR for a sample of college biology texts.Scissors icon at MIR = 2.25 indicates cutoff for inclusion in MCAT content specifications for primary topics. Left column, majors text (top) andtwo GE texts (large in middle row, small in bottom row) by Pearson Education. Middle column, same for texts from McGraw-Hill Education.Right column, same for three additional majors texts. Texts as in Table 1.
(2007) GE-Sml text only has a sample size of nine species (anadditional species is lost due to a one-million-year reductionin the time span of the latter figure.) The corresponding figurefor Campbell et al.’s (2009) GE-Lg text has a sample size of 14species (Figure 5).
DISCUSSION
Textbooks for GE biology courses are derived from texts forintroductory majors biology courses and their premedicaland STEM audiences. These majors texts align with the scopeand sequence (MIRs) of AAMC’s MCAT biology content spec-ifications, consistent with NRC’s concerns about the negativeimpact of MCAT preparation on majors curricula and interestin efforts to improve/reform the MCAT (NRC, 2003; AAMC-HHMI, 2009). When the NRC (2003, p. 112) concluded that “achange in the MCAT itself, or in the way it is used for med-ical school admissions, would allow the biology curriculumto develop in a way that is beneficial to all students insteadof allowing the content of the MCAT to dictate what stu-dents are taught,” “all students” referred to the preparationof future biomedical researchers. Their recommendation ex-
tends, however, to the preparation of all college graduateswho will shape STEM public policy. AAMC has respondedto such concerns about the impact of MCAT preparation onSTEM majors and premedical audiences with an extensive re-view and reform of the exam (AAMC-HHMI, 2009) intended
Figure 3. Density of terms included in MCAT biology content spec-ifications found in introductory majors and two GE texts from twopublishers (see Table 1).
434 CBE—Life Sciences Education

MCAT Impact on College Biology Texts
Figure 4. Correlations between topic sequences in GE texts andintroductory majors text of the same publisher for two sets of GEtexts from two publishers (see Table 1). Percentile start page indicatesthe percentile point in a text (observed page divided by total numberof text pages) in which the main discussion of a primary topic in theMCAT biology content specifications appears.
to place greater emphasis on critical analysis and reasoningskills.
Most American colleges and universities require studentsto complete GE science courses, including and especially bi-ology, to promote CSL. Textbooks for this GE audience, how-ever, do not appear designed for it. Deriving GE biology text-books from larger, majors books, as appears the case in thetwo sets of majors and GE texts examined here, assumes thatthose majors texts contain all content and employ appropriatepedagogy to accomplish the CSL goals of the GE curriculumand meet the science learning needs of GE students. Even ifthe concordance between scope and sequence of majors andGE texts and MCAT MIRs is only correlational, the reduction-ist approach to learning used in many STEM majors coursesmay not suite the learning styles or CSL educational needsof GE students. Publishers often soften this reductionist ap-proach by adding several human-interest essays in their GEtexts. The resulting GE texts nonetheless reveal the contentconstraints of their majors source texts.
Abridging a majors text while generating GE texts (Table 2)may unintentionally support common biological misconcep-tions among GE students. For example, presenting GE audi-ences with fewer observations on which current hypothesesof hominid evolution are based (Figure 5) might facilitatewidespread misconceptions about the observational supportfor evolution (Miller et al., 2006) among those students. Thesepractices may also fail to meet the CSL learning needs ofthe GE audience or an institution’s GE learning objectives.Current STEM policy issues confronting college graduatesinclude natural and social responses to climate change, recog-nition of biodiversity loss, and application of new genomicstechnologies in healthcare and agriculture. These issues pro-vide engaging, interdisciplinary cases for framing GE biologycourses and promoting CSL. These “big picture” topics, how-ever, receive MIR values below the cutoff for inclusion in theMCAT biology content specifications, or they are not evenincluded in AAMC’s surveys. As noted by Muller (1959),these topics appear at the back of majors texts—and theirsmaller GE versions—where instructors and students oftennever reach them. At the same time, texts designed for GE
courses include technical content more relevant for studentspreparing for the MCAT and graduate careers in specializedfields. For example, the apparently arbitrary reduction oftechnical terms in the comparison of cytokinesis in plantsand animals (Table 2, and see also Table 3) reveals not onlythe deletion of some terms but the retention of others thatlikely seem equally esoteric to a GE student concerned aboutclimate change.
College GE biology texts also appear designed for a firstcourse in science, reintroducing the scientific method, chem-ical structure of water, thermodynamics, and other basics.Within biology, such cursory coverage ignores recent K–12curriculum reform through efforts such as the Next Genera-tion Science Standards (NRC, 2012). The criticism of past K–12STEM curricula as “a mile wide and an inch deep” (Schmidtet al., 2002) applies to current GE biology textbooks and manycurricula in which they are used. Absent explicit linkage ofK–12 and college GE STEM curricula, relevancy and effec-tiveness of both suffer. Providing GE students opportunitiesto review, update, and apply STEM concepts learned in K–12years and to study with widely available digital resources de-signed for student-directed review and remediation of thoseconcepts can meet a core learning goal that students “learnhow to learn” inherent in most GE STEM curriculum justifi-cations.
While the MCAT may not emphasize content knowledge(Zheng et al., 2008), the published MCAT biology contentspecifications and college biology texts for majors and GEcourses do. The AAMC determined its MCAT biology con-tent specifications through surveys of faculty and studentsof medical schools and biology “faculty [members] teach-ing introductory courses at [each] . . . undergraduate school[n = 166] . . . that had supplied at least ten [recent] MCATexaminees” (AAMC, 2002, p. 1). The AAMC staff compilesthe topics for these surveys “from a review of the top-sellingundergraduate [majors] biology. . .text books” (AAMC, 2001,p. 1). This process may limit statistical independence. Topicsurveys that generate the MCAT content specifications arebased on popular textbooks used in courses taken by stu-dents “who want to score well on (the MCAT)” (NRC, 2003,p. 112). Instructors of introductory majors biology coursesthat generate many MCAT examinees particpate in AAMC’sundergraduate content survey, and they choose the majorstextbook for their students, including many preparing forthe MCAT. “Bundling” majors texts with cross-referenced,jointly authored MCAT preparation guides (e.g., Campbellet al., 2008a) may also limit statistical independence of thisprocess. Providing honoraria to majors biology instructors,including some likely to participate in AAMC’s surveys, toreview majors texts that they may adopt for their courses andrequire their students to purchase may further limit the in-dependence of AAMC’s topic surveys. For example, one ma-jors text acknowledges 772 faculty reviewers, increasing theprobability that text reviewers will also complete AAMC con-tent surveys. While the AAMC will introduce a competency-based MCAT in 2014 (AAMC-HHMI, 2009), the content spec-ifications for that exam depended on the same survey processand the same topic list used to develop the current and pastMCAT versions (AAMC, 2010). Indeed, the 2014 MCAT hasan almost identical and slightly larger list of biology top-ics with higher mean biology MIRs than the current one(Figure 1).
Vol. 12, Fall 2013 435

S. W. Rissing
Table 2. Concordance among three biology texts describing the process of cytokinesis in a textbook for students majoring in biology andrelated STEM fields (left) and two textbooks for GE biology courses (GE-Lg in middle and GE-Sml at right)a
Campbell et al., 2008b, Biology, 8th ed.,pp. 234–236 Majors
Campbell et al., 2009, Biology Concepts &Connections, 6th ed., pp. 132 GE-Lg
Campbell et al., 2007, Essential Biology, 3rded., pp. 127–128 GE-Sml
Cytokinesis differs for plant andanimal cells
Cytokinesis generally begins duringanaphase or telophase, and the spindleeventually disassembles.
Cytokinesis, or division of one cell into Cytokinesis, the actual division of thecytoplasm into two cells, typically occursduring telophase.
Cytokinesis: A Closer Look
In animal cells, cytokinesis occurs by aprocess known as cleavage.
In animal cells, cytokinesis occurs In animal cells, the cytokinesis process isknown as cleavage.
Thefirst sign of cleavage is the appearance of acleavage furrow, a shallow groove in thecell surface near the old metaphase plate(Figure 12.9a). On the cytoplasmic side ofthe furrow is a contractile ring of actinmicrofilaments associated with moleculesof the protein myosin. (Actin and myosinare also responsible for muscle contractionand many other kinds of cell movement.)
As shown in Figure 8.7 A, the first sign ofcleavage is the appearance of a cleavagefurrow, a shallow groove in the cellsurface.
Thefirst sign of cleavage is the appearance of acleavage furrow, an indentation at theequator of the cell.
At the site of the furrow, the cytoplasm has aring of microfilaments made of actin,associated with molecules of the proteinmyosin. (Actin and myosin are the sameproteins responsible for musclecontraction-see
A ring ofmicrofilaments in the cytoplasm justunder the plasma membrane
The actinmicrofilaments interact with the myosinmolecules, causing the ring contract. Thecontraction of the dividing cell’s ring ofmicrofilaments is like the pulling ofdrawstrings. The cleavage furrow deepensuntil the parent cell is pinched in two,producing two completely separated cells,each with its own nucleus and share ofcytosol, organelles, and other subcellularstructures.
Module 30.8.) When the actin microfilamentsinteract with the myosin, the ring contracts,
like the pullingof drawstrings. The cleavage furrow deepensand eventually pinches the parent cell in two,producing two completely separate cells,each with its own nucleus and share ofcytoplasm.
like the pullingof a drawstring, deepening the furrowand
pinching the parent cell in two (Figure 8.9a,see page 128).
Cytokinesis in plant cells, which have cellwalls, is markedly different. There is nocleavage furrow. Instead, during telophase,vesicles derived from the Golgi apparatusmove along microtubules to the middle ofthe cell, where they coalesce, producing acell plate (Figure 12.9b). Cell wall materialscarried in the vesicles collect in the cell plateas it grows. The cell plate enlarges until itssurrounding membrane fuses with theplasma membrane along the perimeter ofthe cell.
Cytokinesis is markedly different in plantcells, which possess cell walls.
Cytokinesis in a plant cell occurs differently.
Membrane-enclosed vesicles containing cellwall material collect at the middle ofthe cell.
During telophase,vesicles containing cell wall material (tan infigure) collect at the middle of the parent cell.The vesicles fuse, forming a membranouscell plate. The cell plate grows outward,accumulating more cell wall materials asmore vesicles fuse with it. Eventually, theouter edges of the cell plate fuse with theplasma membrane, and the cell plate’scontents join the parental cell wall.
The vesicles gradually fuse,forming a membranous disk called the cellplate. The cell plate grows outward,accumulating more cell wall material as morevesicles join it.
Two daughter cells result, each with its ownplasma membrane. Meanwhile, a new cellwall arising from the contents of the cellplate has formed between the daughter cells.
The result is two daughter cells, eachbounded by its own plasma membrane andcell wall.
Eventually, the membrane of the cell platefuses with the plasma membrane, and thecell plate’s contents join the parental cellwall,
resulting in two daughter cells (Figure 8.9b).
contracts,
by a process known as cleavage.
two, typically begins during telophase,although it may begin in late anaphase.
aAll three texts share some authors and are from the same publisher (Benjamin Cummings). Text is aligned vertically in columns to demonstratecontent similarity reading from left to right across columns. Gray arrows indicate gaps relative to the other texts. Boldfaced type is retainedfrom the original text.
436 CBE—Life Sciences Education
MCAT Impact on College Biology Texts
Table 3. Pedagogical impact of editing of figures in GE texts (GE-Lg or GE-Sml) derived from introductory majors biology texts by sameauthor(s)
Publisher Topic Majors GE-Lg GE-Sml
Pedagogical impact of GEtext illustrations compared
with majors text
McGraw-Hill Genetic drift Figure 16.6 (majors) andFigure 13.15 (GE-Lg) areidentical: nine green andthree brown frogs innatural habitat before“natural disaster”; fourgreen and one brown frogafter. Change of brownfrogs from 10–20% noted.
Figure 15.6 is similar: seven green andthree brown frogs before “geneticdrift”; 10 green and no brown after.No percentages or habitat noted.
GE-Sml figure conveys lessunderstanding by:implying drift 1) isabsolute and 2) has noagent, 3) not presentingunderlying change inphenotype frequencies, 4)not providing habitatcontext
McGraw-Hill Skin anatomy Figure 31.7 (majors) andFigure 25.7 (GE-Lg) areidentical: 14 structuresand three cell layers arenamed in Figure 31.7;seven structures and threecell layers are named inFigure 25.7.
Figure 26.2 is redrawn from the othertwo texts and is less complex; threestructures and two cell layersnamed.
Reduction/retention of termsin GE texts seems arbitrary.Not obvious why majorsfigure has five times moreterms than GE-Sml figure.
McGraw-Hill Mitosis Figure 9.4 (majors) andFigure 8.5 (GE-Lg) areidentical: separatemicrographs of animaland plant cells anddrawing of each phase.Both have six phases.Figure 9.4 has 17 otherterms and processes;Figure 8.5 has 16.
Figure 8.6 has animal micrographs only,with no adjoining cells; drawings aresimilar to those of other texts. Fivephases are illustrated, and four arenamed; 13 other terms are presented.
Universality of cell mitosis inplants, animals lost inGE-Sml figure (but plantmitosis discussed in textand a micrograph). GEtext’s emphasis onterminology (encounteredin K–12 courses) may notmeet learning needs ofaudience
BenjaminCummings
Computer model ofribosome
Figure 17.16a (majors) is the same as Figure 10.12a (GE-Lg); noGE-Sml equivalent. In Figure 10.12a, P&A binding sites arecombined and not named; E site is missing; individual amino acidson “growing polypeptide” are not colored; “exit tunnel” is notnoted; large and small subunits are not clearly marked; 5′ and 3′ends of mRNA are not noted. Legend of Figure 17.16a is longer andmore informative.
“Big picture” model ofribosome is missing inGE-Sml, while subsequentportions of the diagramfrom majors text isretained in GE-Sml.
BenjaminCummings
Ribosome modelwith binding sites
Figure 17.16b (majors) same as Figure 10.12b (GE-Lg); Figure 10.16a(GE-Sml) differs slightly. No E site in GE figures. P&A sites presentin GEs are not named in Figure 10.12b but are named inFigure 10.16b; function of P&A sites is noted in Figure 17.16 but notin GE figures. mRNA site, named in majors figure, is absent fromGE figures. Figure 17.16b legend is longer and more informative
Simplification of GE figuresseems arbitrary (P&A sitesnamed in GE-Sml but notin GE-Lg); terms areretained, but explanationsof functions are not.
BenjaminCummings
Ribosome modelwith tRNA,mRNA
Figure 17.16c (majors) and Figure 10.12c (GE-Lg) are the same;Figure 10.16b (GE-Sml) differs from them slightly. E site and emptytRNA leaving it are absent in both GE figures. Legend in majorstext is more informative.
Many terms in GE text figuresare retained, butexplanations of theirfunctions are not.
BenjaminCummings
Lysosome function Figure 6.14a (phagocytosis) and Figure 16.4b (autophagy) in majorstext consist of photomicrographs of processes in rat cells andinterpretive drawings of same processes (in a protist inFigure 6.14a; in an undefined cell in 6.14b); narrative text andarrows between micrographs and drawings are given. Legendmentions origin of double membrane unknown. Figure 4.11, A andB (GE-Lg) only has reduced version of diagrams from majors (nomicrographs); Figure 4.13, a and b (GE-Sml), is a modified versionof the drawing from the other texts. Both GE figures have lessinterpretation and no mention of unknowns; neither has contextwithin a cell.
Description of lysosomes andfunctions retained in GE,but occurrence in rats andprotists, discussion offunctions, and mention ofunknown origin of doublemembrane are missing inGE texts. Similarsuperficial coverage ofmany cellular processes atthe expense ofunderstanding of fewerprocesses in GE texts.
BenjaminCummings
Mitosis Figure 12.6 (majors), Figure 8.6 (GE-Lg), and Figure 8.8 (GE-Sml): allhave six identical micrographs from newts and six interpretivedrawings (similar, not identical). There are six named phases inFigure 12.6 and Figure 8.6; “protometaphase” is absent fromFigure 8.8. Six chromosomes are shown in Figure 12.6; four inFigures 8.6 and 8.8. Figure 12.6 has 20 named structures orprocesses (e.g., “nonkinetochore microtubules); Figure 8.6 has 18named structures or processes; Figure 8.8 has 14 named structuresor processes.
GE text emphasis on celldivision terminology(already encountered inK–12 courses?) may notmeet learning needs oftarget audience
Vol. 12, Fall 2013 437

S. W. Rissing
Figure 5. Figures displaying time line of recenthominid evolution from a text for students ma-joring in biology and related STEM areas (top,Campbell et al., 2008b, p. 729) and two texts forGE biology courses (middle, GE-Lg, Campbellet al. 2009, p. 403; bottom, GE-Sml, Campbellet al., 2007, p. 370). Reprinted by permission ofPearson Education, Inc., Upper Saddle River, NJ.
438 CBE—Life Sciences Education

MCAT Impact on College Biology Texts
As noted by the NRC (2003), many learning objectives forpremedical students in introductory biology courses differfrom those for students starting careers in the biomedical sci-ences (much less other biological areas) in those same courses.Even more so, the learning objectives for GE students differfrom those for both student audiences discussed above. TheAAMC’s MCAT biology content specifications provide clearlearning objectives for any introductory biology course in theUnited States required of premedical students by the AAMC(2011b) and offered for those students. No similar nationalstatement of learning objectives for other student audiencesenrolled in gateway biology courses, or their textbooks, exists.Individual academic departments establish separate learningobjectives for students starting degree programs in biomedi-cal sciences at each university. Similarly, individual collegesand universities establish the learning objectives for GE nat-ural science courses as part of their overall GE graduationrequirements.
In recognition of the different learning needs of these threestudent audiences, many institutions offer separate gatewaybiology courses for biology “majors” (which often includepremedical students pursuing other undergraduate majors;AAMC, 2009c) and GE (or the alienating descriptor “non-major”) students. To the extent that GE textbooks influenceand reveal the curricula of these GE courses, they may notmeet the CSL goals of the GE curriculum of which they area component. The increasingly common practice of employ-ing affiliated faculty to teach GE science courses (Kezar andSam, 2011) can exacerbate the mismatch between an adoptedtextbook, the curriculum it supports, and an institution’s GEgoals. Affiliated faculty members often play little or no role inplanning the curricula they teach, much less in choosing thetextbooks. They also have little opportunity to understand aninstitution’s GE goals.
Current economic constraints compel many American in-stitutions to increase graduation rates and reduce costs (Kel-derman, 2011). Schools encourage students to complete GEcourses with more economical alternatives (Glenn, 2011), re-duce GE requirements (Olson, 2010), and award GE credit forlower advanced placement test scores (Mendillo, 2012). Theremaining GE courses shoulder a growing portion of highereducation’s mission to develop CSL among all college grad-uates. GE STEM courses need texts and curricula designedspecifically to meet that mission. With renewed emphasisplaced on the preparation of future biomedical researchers(NRC, 2003), reform of the MCAT (AAMC-HHMI, 2009), andthe K–12 curriculum, especially in STEM (NRC, 2012), thetime seems auspicious to distinguish the CSL learning goalsof the undergraduate GE curriculum, especially in STEM, andcoordinate it in a mutually supportive manner with the K–12general STEM curricula and their current reform.
ACKNOWLEDGMENTS
R.E.J. Boerner, C. A. Breitenberger, L. E. Elfner, H. J. Graff, andtwo anonymous reviewers provided useful feedback and discussionon this project and earlier drafts of the manuscript; W. M. Frolik-long and S. L. Terry assisted in textbook scans. Pearson Education,Inc., graciously permitted use of their artwork, which is included inFigure 5.
REFERENCES
Alberts B (2009). Redefining science education. Science 323, 437.
American Association for the Advancement of Science (AAAS)(1990). Science for All Americans: A Project 2061 Report on LiteracyGoals in Science, Mathematics, and Technology, Washington, DC.
AAAS (2009). Vision and Change: A Call to Action, A Summaryof Recommendations, Vision and Change Conference, Washing-ton, DC. visionandchange.org/files/2011/03/Revised-Vision-and-Change-Final-Report.pdf.
American Association of Medical Colleges (AAMC) (2001). TheMCAT Science Content Review, Part I: Report on the MedicalSchool Survey of Science Content. www.aamc.org/students/linkableblob/85392-2/data/monograph6-data.pdf (accessed 16August 2011).
AAMC (2002). The MCAT Science Content Review, Part II: Re-port on the Surveys of Undergraduate Science Content. www.aamc.org/students/linkableblob/85394-2/data/monograph7-data.pdf (accessed 10 October 2009).
AAMC (2008). Percentages of MCAT Examinees Achieving ScaledScore Levels and Associated Percentile Rank Ranges by Area ofAssessment, Combined 2008 Administrations. www.aamc.org/students/download/85332/data/combined08.pdf (accessed 1March 2012).
AAMC (2009a). First-Year Enrollees and Applicants to U.S. MedicalSchools by Gender, 2009. www.aamc.org/download/68634/data/enrollmentdata2009.pdf (accessed 1 March 2012).
AAMC (2009b). The Official Guide to the MCAT Exam, 1st ed., Wash-ington, DC.
AAMC (2009c). MCAT and GPAs for Applicants and Matriculantsto U.S. Medical Schools by Primary Undergraduate Major, 2009.www.aamc.org/download/85996/data/table18facts09mcatgpabymaj1web.pdf (accessed 30 January 2012).
AAMC (2010). Ratings of the Importance of Natural Sci-ences, Research Methods, and Statistics Topics on the MR5Content Surveys (Draft). www.aamc.org/download/143506/data/summer_2010_science_report.pdf (accessed 12 February 2012).
AAMC (2011a). Applicants, First-Time Applicants, Acceptees,and Matriculants to U.S. Medical Schools by Sex, 2000–2011. www.aamc.org/download/159590/data/table7.pdf (accessed1 March 2012).
AAMC (2011b). Medical College Admission Requirements, 2012–2013, Washington, DC.
AAMC and Howard Hughes Medical Institute (2009). ScientificFoundations for Future Physicians, Washington, DC: AAMC.
Brooker RJ, Widmaier EP, Graham LE, Stiling PD (2008). Biology,Boston: McGraw Hill.
Campbell NA, Reece JB, Kaplan Testprep (2008a). MCAT/GRE Ka-plan Test Preparation Guide for Biology, 2nd ed., San Francisco, CA:Benjamin Cummings.
Campbell NA, Reece JB, Simon EJ (2007). Essential Biology, 3rd ed.,Upper Saddle River, NJ: Pearson Education.
Campbell NA, Reece JB, Taylor MR, Simon EJ, Dickey JL (2009).Biology: Concepts & Connections, 6th ed., Upper Saddle River, NJ:Pearson Education.
Campbell NA, Reece JB, Urry LA, Cain ML, Wasserman SA, Mi-norsky PV, Jackson RB (2008b). Biology, 8th ed., Upper Saddle River,NJ: Pearson Education.
Freeman S (2008). Biological Science, 3rd ed., Upper Saddle River,NJ: Pearson Education.
Gallagher MC (2000). Lessons from the Sputnik-era curriculum re-form movement: the institutions we need for educational reform.
Vol. 12, Fall 2013 439

S. W. Rissing
In: What’s at Stake in the K–12 Standards Wars: A Primer For Ed-ucational Policy Makers, ed. S Stotsky, New York: Peter Lang, 281–312.
Glenn D (2011). CUNY faculty fears course-transfer proposalcould jeopardize its say on curricula. Chronicle of Higher Edu-cation. April 20, 2011 http://chronicle.com/article/CUNY-Faculty-Fears/127217 (accessed 12 February 2012).
Kelderman E (2011). State officials say difficult changes are neededto help more students graduate. Chronicle of Higher EducationAugust 10, 2011. http://chronicle.com/article/State-Officials-Say-Difficult/128600 (accessed 1 March 2012).
Kezar AJ, Sam C (2011). Understanding the new majority of non-tenure-track faculty in higher education: demographics, experi-ences, and plans of action. ASHE Higher Educ Report 36, 1–129.
Losos JB, Mason KA, Singer SR, Raven PH, Johnson GB (2008). Biol-ogy, 8th ed., Boston: McGraw Hill.
Mader SS (2009). Concepts of Biology, Boston: McGraw Hil.
Mader SS (2010a). Biology, 10th ed., Boston: McGraw Hill.
Mader SS (2010b). Essentials of Biology, 2nd ed., Boston: McGrawHill.
Mendillo M (2012). Stop letting high-school courses count for col-lege credit. Chronicle of Higher Education January 1, 2012. http://chronicle.com/article/Stop-Letting-High-School/130183 (accessed12 February 2012).
Miller JD (1998). The measurement of civic scientific literacy. PublicUnderstand Sci 7, 203–223.
Miller JD (2007). Paper presented at the 2007 Annual Meeting ofthe American Association for the Advancement of Science, held 16February 2007, in San Francisco, CA.
Miller JD (2010). The conceptualization and measurement of civicscientific literacy for the twenty-first century. In: Science and theEducated American: A Core Component of Liberal Education, ed. J
Meinwald and JG Hildebrand, Cambridge, MA: American Academyof Arts and Sciences, 241–255.
Miller JD, Scott EC, Okamoto S (2006). Public acceptance of evolution.Science 313, 765–766.
Muller HJ (1959). One hundred years without Darwinism are enough.School Sci Math 59, 304–316.
National Center for Education Statistics (2009). Bachelor’s De-grees Conferred by Degree-granting Institutions, by Field ofStudy: Selected Years, 1970–71 through 2008–09. nces.ed.gov/programs/digest/d10/tables/dt10_282.asp (accessed 8 November2011).
National Research Council (NRC) (2003). BIO2010: Transforming Un-dergraduate Education for Future Research Biologists, Committee onUndergraduate Biology Education to Prepare Research Scientists forthe 21st Century, Washington, DC: National Academies Press.
NRC (2012). A Framework for K–12 Science Education: Practices,Crosscutting Concepts, and Core Ideas, Washington, DC: NationalAcademies Press.
National Science Foundation (1996). Shaping the Future: New Ex-pectations for Undergraduate Education in Science, Mathematics,Engineering, and Technology, Arlington, VA.
Olson GA (2010). Why universities are streamlining theircurricula. Chronicle of Higher Education, December 1, 2010.http://chronicle.com/article/Why-Universities-Are/125556 (ac-cessed 12 February 2012).
Schmidt W, McKnight C, Raizen S (2002). Splintered Vision: AnInvestigation of U.S. Science and Mathematics Education, Ipswich,MA: Springer Science & Business Media.
Snow CP (1959). The Two Cultures and the Scientific Revolution,New York: Cambridge University Press.
Zheng AY, Lawhorn JK, Lumley T, Freeman S (2008). Assessment-application of Bloom’s taxonomy debunks the “MCAT myth.” Sci-ence. 319, 414–415.
440 CBE—Life Sciences Education