artwork location - s2.q4cdn.coms2.q4cdn.com/648240483/files/doc_presentations/nc_investor...location...
TRANSCRIPT
ARTWORK LOCATION
Investor PresentationSeptember 2017

LOCATION
Safe Harbor Statement
The statements contained in this presentation that are not historical facts are "forward-
looking statements" within the meaning of Section 27 A of the Securities Act of 1933 and
Section 21 E of the Securities Exchange Act of 1934. These forward-looking statements are
made subject to certain risks and uncertainties, which could cause actual results to differ
materially from those presented in these forward-looking statements. Such risks and
uncertainties with respect to each subsidiary's operations are listed in the appendix of this
document. Readers are cautioned not to place undue reliance on these forward-looking
statements, which speak only as of the date hereof. The Company undertakes no obligation
to publicly revise these forward-looking statements to reflect events or circumstances that
arise after the date hereof.
1
Forward-Looking Statements

LOCATION
NACCO Industries Overview

LOCATION
Coal and Aggregate Mining and
Value-Added Services
100+ years of success in mining, delivering a strong foundation
for NACCO’s growth over the past 30 years
High-return, low-volatility business model supported by long-term
contracts structured to eliminate market fluctuations in coal prices
Largest producer of lignite coal in the U.S. and among the ten
largest coal producers in the U.S.
Attractive, high-quality customer base
Creating Two Industry-Focused Public Companies
3
Branded Housewares for Retail
and Commercial Markets
Leading designer, marketer and distributor of branded
housewares for retail and commercial markets
Iconic brands with leading market share, including rapidly growing
e-commerce channels
Demonstrated track record of successful new product
introductions and innovations
Flexibility to implement multi-layered growth strategy and pursue
opportunities in the premium, commercial and international
markets
NACCO (NYSE: NC) Hamilton Beach Brands Holding (NYSE: HBB)

LOCATION
Rationale for Spin-off
4
Two strong, focused operating
companies
Leaders in their respective
industries
Unique growth opportunities
positioned to drive value
Attractive returns on invested
capital
Equity incentives drive long-term
focus
Reinforce management’s focus on
market and customer needs
Independent CEOs and executive
management teams
Seasoned management teams
Improved management focus
Continued guidance by Alfred M.
Rankin, Non-Executive Chairman of
NACCO and Executive Chairman of
Hamilton Beach Brands Holding
Strong leadership teams focused on
value creation
Enhance Strategic Focus Implement CEO Succession
Flexibility to pursue growth and
M&A opportunities
Optimize capital structure and
enhance access to capital markets
at Hamilton Beach Brands Holding
Compelling investment
opportunities
Focused investment thesis
Capitalize on industry-specific
trends and core competencies
Attractive Financial Profiles
Spin-off is expected to enhance competitiveness of businesses and create shareholder value

LOCATION
Experienced Management Team
5
Alfred M. Rankin, Jr.
J.C. Butler, Jr.
Senior Vice President – Finance, Treasurer and
Chief Administrative Officer of NACCO
President and Chief Executive Officer of NACoal
President and Chief Executive
Officer of NACCO
Pre-Spin Post-Spin
Non-Executive Chairman of NACCO
President and Chief Executive Officer
of NACCO and NACoal
CEO Succession at NACCO
Supported by Seasoned Management Team
John NeumannVice President, General Counsel and Secretary of
NACCO and NACoal
Previously M&A lawyer at Jones Day
Joined NACCO in 2009
Elizabeth LovemanVice President and Controller of NACCO
Previously Director of Financial Reporting for
NACCO
Joined NACCO in 1999 to 2005 as a Senior
Financial Reporting Analyst and rejoined in 2012
Tom MaxwellVice President, Financial Planning and Analysis and
Treasurer of NACCO
Previously Director of Financial Planning and
Analysis and Assistant Treasurer
Joined NACCO in 2005
Carroll DewingVice President of Operations at NACoal
Previously President, The Coteau Properties
Company and The Falkirk Mining Company
Joined NACoal in 1979
Pat SullivanVice President and Chief Financial Officer of NACoal
Previously Controller, Luminant Generation,
Mining, Construction and Development of Energy-
Future Holdings Corporation
Joined NACoal in 2013

LOCATION
NACCO’s Priorities for Use of Cash
Support strategic initiatives focused on continued growth
of existing businesses
Pursue growth opportunities that leverage Company
skills and strengths
Ensure business is appropriately leveraged
Historically, consistent dividend plus opportunistic share
buyback programs
6
Return Cash to Stockholders
Maintain Conservative Leverage
Investments in NACoal’s Existing Strategic Growth Initiatives
Prudent Investments in Complementary Ventures

LOCATION
North American Coal Overview

LOCATION
North American Coal (“NACoal”) Overview
Surface mining of coal primarily for use in power generation and provider of value-added services to natural resource companies
Longstanding excellent record of employee safety and environmental responsibility
Unique “service business” coal-mining model with long-term, cost-plus contracts structured to eliminate exposure to coal price fluctuations
― Mine-mouth operations – mines are exclusive suppliers to customer facilities
― Contract structure provides steady income and cash flow with minimal capital investment
― The largest producer of lignite coal in the U.S. and among the ten largest coal producers in the U.S. in 2016
1.9 billion tons of lignite coal reserves with 1.0 billion tons committed to current customers
North American Mining
― Maintains and operates draglines for customer-owned limerock quarries
― Significant growth in recent years, leveraging cost-plus business model
Value-added services
― Coal drying, processing and handling services
― Ash-hauling services for power plants and other facilities
8

LOCATION
Attractive Mix of Operations
9
Surface Coal Mining North American Mining
Value-Added Services
LOCATION
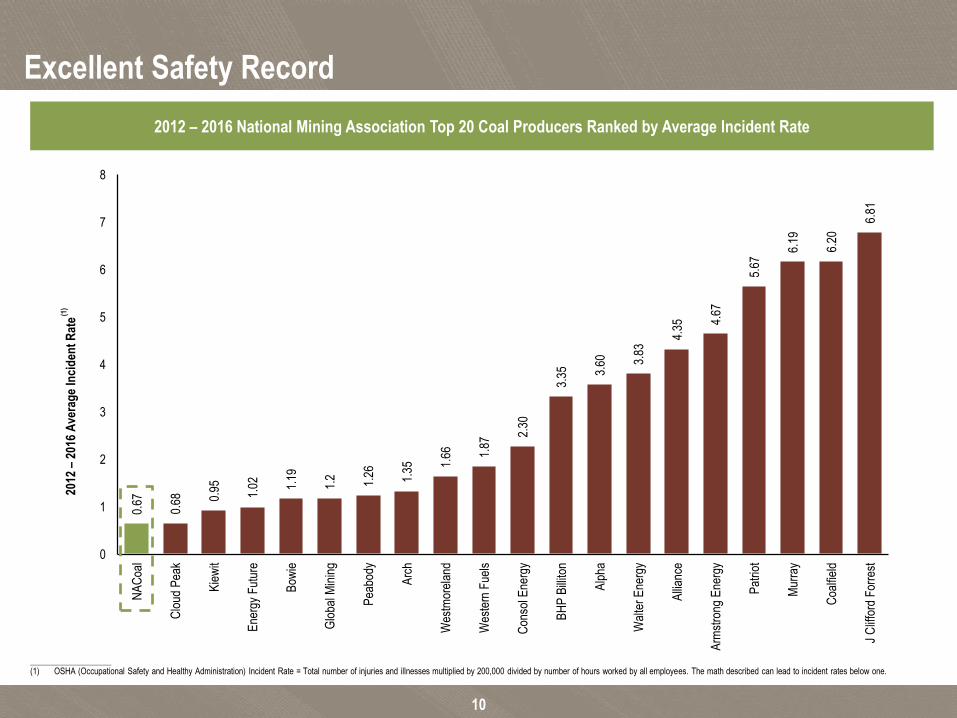
Excellent Safety Record
10
2012 – 2016 National Mining Association Top 20 Coal Producers Ranked by Average Incident Rate0.
67
0.68 0.
95 1.02 1.
19
1.2
1.26 1.35 1.
66 1.87
2.30
3.35 3.
60 3.83
4.35 4.
67
5.67
6.19
6.20
6.81
0
1
2
3
4
5
6
7
8
NA
Coa
l
Clo
ud P
eak
Kie
wit
Ene
rgy
Fut
ure
Bow
ie
Glo
bal M
inin
g
Pea
body
Arc
h
Wes
tmor
elan
d
Wes
tern
Fue
ls
Con
sol E
nerg
y
BH
P B
illito
n
Alp
ha
Wal
ter
Ene
rgy
Alli
ance
Arm
stro
ng E
nerg
y
Pat
riot
Mur
ray
Coa
lfiel
d
J C
liffo
rd F
orre
st
2012
–20
16 A
vera
ge
Inci
den
t R
ate
___________________(1) OSHA (Occupational Safety and Healthy Administration) Incident Rate = Total number of injuries and illnesses multiplied by 200,000 divided by number of hours worked by all employees. The math described can lead to incident rates below one.
(1)

LOCATION
Environmental Responsibility
Environmental Protection Agency
Environmental Excellence Award
The Department of Interior Office of Surface
Mining Best of the Best Award
The Department of Interior Office of Surface
Mining Director’s Award
The Department of Interior Office of Surface
Mining Good Neighbor Award
The Texas Parks & Wildlife Department Lone
Star Steward Award
The Department of Interior Office of Surface
Mining Excellence in Surface Coal Mining
and Reclamation Award
The North Dakota Public Service
Commission Excellence in Surface Coal
Mining & Reclamation Award
11
North American Coal has received 80 federal and state awards for successful and innovative
reclamation projects over the last 30 years

LOCATION
NACoal Operations
12
Mississippi Lignite Mining Company
The Coteau Properties Company
Coyote Creek Mining Company
The Falkirk Mining Company
NoDak Energy Services LLC
Bisti Fuels Company
Camino Real Fuels
Caddo Creek Resource Company
The Sabine Mining Company
Demery Resources Company
North American MiningCorporate OfficeNorth American Mining
Value-Added Services
_____________________
Note: Excludes Centennial Natural Resources.
New Operation Since 2010
Surface Coal Mining OperationsLiberty Fuels Company

LOCATION
Surface Coal Mining Operations
Exclusive supplier – Each mine’s production goes to its
respective customer’s power plants or coal processing facilities
All of NACoal’s mines operate under long-term cost-plus
contracts excluding one
― NACoal is responsible for all mine operations
― Customer pays 100% of the cost to operate the mine
― Customer provides, or provides support for, all of the capital
required – minimal or no NACoal investment to fund
working capital or capital expenditures
― NACoal is paid a modest agreed profit per ton of coal or
heating unit (btu) delivered
Each cost-plus contract specifies the indices and
mechanics by which agreed profits change over time,
generally in line with broad measures of U.S. inflation
― Contracts eliminate exposure to spot coal market price
fluctuations
Long-term contracts that run through 2018 – 2055
Under certain contracts, NACoal holds the mine permit and is
responsible for mine reclamation activities. Under NACoal’s cost-
plus contracts, the customers have the obligation to fund all
reclamation activities
13
Long-term contracts generate strong cash flow with minimal capital requirements

LOCATION
Surface Coal Mining Operations – Mississippi Lignite Mining Company
Mississippi Lignite Mining Company (“MLMC”) supplies coal
under a long-term contract that extends through 2032
― MLMC is the exclusive supplier of coal to its customer’s
power plant, adjacent to mine
― Contractually agreed-upon price adjusts monthly
primarily based on changes in the level of established
indices, which reflect general U.S. inflation rates,
including cost components such as labor and diesel
fuel
Coal sales price is not subject to spot coal market
fluctuations
― NACoal pays all operating costs and provides the
capital for this mine
― Periodic significant capital spending requirements to
replace major equipment and to secure land and coal
for future mining
14

LOCATION
Strong Earnings Driven by Long-Term Contracts with High-Quality Customers
15
Coal Mining Operations Overview
_____________________
(1) Certain reserves are owned and controlled by the customer and therefore not listed on the table.
(2) Although the term of the existing coal sales agreement terminates in 2022, the term may be extended for three additional periods of five years, or until 2037, at the option of Coteau and for two additional periods of five years, or until 2047, at the option of
the customer.
(3) Camino Real’s contract mining agreement will be automatically extended in the event Camino Real’s customer extends its existing coal supply contract.
(4) In 2010, Mississippi Power executed a 40-year contract with Liberty Fuels, to develop, construct and conduct mining operations through the end of mine reclamation. As the mining permit holder, Liberty Fuels has a legal obligation to perform mine
reclamation and Mississippi Power has a contractual obligation to fund all reclamation activities. The future of Liberty Fuels is uncertain as customer suspended activities on the gasifier portion of the Kemper County Energy Facility. Liberty Fuels is the sole
supplier of coal for the gasifier.
(5) Represents Otter Tail Power Company, Northern Mutual Municipal Power Agency, Montana-Dakota Utilities Company and Northwestern Corporation.
(6) PurEnergy has an operating and maintenance agreement with Southern Company.
(millions of tons)
(1)
(2)
(3)
(4)
2016
Mine Customer Type of Mine
Committed
Under Contract
Tons
Delivered
Contract
Expires
The Coteau Properties Company Dakota Coal Company, an affiliate of Basin Electric Power Cooperative Lignite 459.5 14.1 2022 /2037
The Falkirk Mining Company Great River Energy Lignite 381.0 7.2 2045
The Sabine Mining Company Southwestern Electric Power Company, an affiliate of AEP Lignite - 4.2 2035
Demery Resources Company Five Forks Mining, an affiliate of ADA Carbon Solutions Lignite - 0.2 2030
Caddo Creek Resources Company Marshall Mine, an affiliate of Cabot Norit Americas Lignite - 0.2 2044
Camino Real Fuels AHMSA, an affiliate of Dos Republicas Coal Partnership Sub-bituminous - 1.8 2018
Liberty Fuels Company Mississippi Power Company, an affiliate of Southern Company Lignite - 0.3 2055
Coyote Creek Mining Company Four Power Companies Lignite 77.3 1.5 2040
Bisti Fuels Company Navajo Transitional Energy Company Sub-bituminous - - 2031
Consolidated Mines
Mississippi Lignite Mining Company CGLP, an affiliate of PurEnergy(6) Lignite 113.5 3.0 2032
Total Developed 1,031.3 32.5
Unconsolidated Mines (wholly-owned subsidiaries of NACoal)
(5)

LOCATION
North American Mining
16
Maintains and operates draglines for extraction of limerock at
customer-owned limerock quarries
― Customers pay all operating costs plus an agreed profit
per cubic yard excavated or limerock yards delivered
― Operates 20 draglines for 5 customers at 14 quarries as
of August 31, 2017
― Operations viewed as growth platform with significant
expansion since 2015
― Extracts over 40% of all limerock currently produced in
Florida

LOCATION
Value-Added Services and Other Income Sources
Cost-plus contract with fee to operate a coal drying facility
within a power plant operated by a major coal customer
Ash handling and haulage services provided for some
customers as part of mining contract or for a separate fee
Ongoing royalty income from rights to coal, oil and gas
reserves
― Reserves located in Ohio, Pennsylvania, North Dakota,
Texas, Alabama, Mississippi and Louisiana
17

LOCATION
Increase the profitability of all existing mining operations & achieve income growth and sound
returns on capital from development of new mining and services ventures
NACoal Key Strategy Overview
Focus on core operations
― Continuous effort to drive down production costs, benefiting both customers and NACoal
― Work with customers to maximize efficiency and operating capacity of their facilities, benefiting both customers and NACoal
Strategies for growth
― Leverage strength of proven cost-plus business model
Expansion of established North American Coal business
– Build and operate new surface coal mines to serve existing or new customer relationships
o Five new coal mines since 2010
– Replace legacy miners at existing surface coal mines
o Bisti Fuels became operator of Navajo Mine on 1/1/17
Expand North American Mining, including into other aggregates and minerals and across new geographies
– Significant growth since 2015
Leverage core skills to facilitate additional expansion
– Mitigation banking and reclamation services
– Ash hauling, coal drying, processing and handling services
― Maintain moderate leverage and avoid commodity price exposure
18

LOCATION
NACoal Operational Highlights
19
(millions of tons)
(millions of cubic yards)
28.1 29.1 29.3 30.2 32.5
35.5
0.0
5.0
10.0
15.0
20.0
25.0
30.0
35.0
40.0
2012 2013 2014 2015 2016 LTM June 2017
18.8 22.1 21.0 20.9
26.1 27.9
0.0
5.0
10.0
15.0
20.0
25.0
30.0
2012 2013 2014 2015 2016 LTM June 2017
Tons of Coal Sold(1)
Cubic Yards of Limerock Delivered
___________________(1) The table above excludes Centennial as the Company ceased mining operations at this mine in 2015.

LOCATION
Annual Coal Production from Current Operations
20
___________________Note: The table above excludes Centennial as the Company ceased mining operations at this mine in 2015.
0
5
10
15
20
25
30
35
2011 2012 2013 2014 2015 2016 LTM June 2017
Coteau Falkirk Sabine MLMC Camino Coyote Creek Other
(in millions)

LOCATION
($2.3)
$0.0
$10.3 $10.6
$20.9
($5.0)
$0.0
$5.0
$10.0
$15.0
$20.0
$25.0
2015 2016 LTM June 2017 YTD June 2016 YTD June 2017
NACoal Financial Highlights
21
($ in millions)
($ in millions)
$32.6 $27.7
32.7
15.720.7
$0.0
$10.0
$20.0
$30.0
$40.0
$50.0
$60.0
2015 2016 LTM June 2017 YTD June 2016 YTD June 2017
___________________(1) Adjusted Income (Loss) Before Income Tax is a measure that differs from Income (Loss) Before Income Tax measured in accordance with U.S. GAAP. Adjusted Income (Loss) Before Income Tax is adjusted to exclude the results of Centennial. Management
believes that Adjusted Income (Loss) Before Income Tax assists the investor in understanding the results of operations of North American Coal and aids in understanding comparability of results. The discussion of non-GAAP items and the related reconciliations to GAAP measures starts on page 29.
Income (Loss) Before Income Tax
Adjusted Income (Loss) Before Income Tax(1)

LOCATION
NACoal Financial Highlights (cont.)
22
___________________(1) NACCO defines Adjusted EBITDA as income (loss) before asset impairment charges and income tax provision (benefit), plus net interest expense and depreciation, depletion and amortization expense. Adjusted EBITDA is not a measurement under U.S.
GAAP and is not necessarily comparable with similarly titled measures of other companies. The discussion of non-GAAP items and the related reconciliations to GAAP measures start on page 29.(2) Cash flow before financing activities is a non-GAAP measure and should not be considered in isolation or as a substitute for GAAP measures. It includes non-cash impairment charges of $17.4 million in 2016 related to NACoal’s Centennial mining operations
which ceased active mining operations at the end of 2015. The discussion of non-GAAP items and the related reconciliations to GAAP measures start on page 29.(3) During 2015, NACoal received approximately $53 million from Coyote Creek, an unconsolidated mine, as a result of Coyote Creek’s completion of third-party financing.
($ in millions)
$94.4
$31.0
$50.2
($5.5)
$13.7
($30.0)
$0.0
$30.0
$60.0
$90.0
$120.0
2015 2016 LTM June 2017 YTD June 2016 YTD June 2017
Cash Flow Before Financing(2)
($ in millions)
$19.3
$34.3
$44.4
$18.7
$28.85.8x
2.8x
1.6x
$0.0
$10.0
$20.0
$30.0
$40.0
$50.0
2015 2016 LTM June 2017 YTD June 2016 YTD June 2017
Adjusted EBITDA and Leverage(1)
$41.2
(3)
NACoal Total Debt / Adjusted EBITDA

LOCATION
Excluding Centennial, H2 2017 expected to be significantly lower
than H1 2017 due to a substantial decrease in MLMC results and
the non-recurrence of gains realized in H1 2017 at Centennial.
Excluding Centennial, expected increase in income before tax in H2
2017 compared to H2 2016 due to the start of production at Bisti
Fuels and lower lease / employee-related expenses, partly offset by
a substantial decrease in MLMC results. FY 2017 also expected to
increase.
Future of Liberty Fuels uncertain as customer suspended activities
on the gasifier portion of the Kemper County Energy Facility. Liberty
Fuels is the sole supplier of coal for the gasifier.
Continued focus on new growth opportunities.
Post Spin-off NACCO Industries
23
NACCO Financial Summary
Consolidated NACCO Outlook
NACoal Outlook
The proposed spin-off of the housewares-related business during Q3
2017 was announced on August 21, 2017 and is expected to result in
additional expenses in H2 2017.
Company’s ETR, excluding discrete items, such as additional income
tax expense of between $1.0M and $1.5M expected in Q3 2017, is
anticipated to be between 23% and 25%.
NACCO expects to receive a $35 million dividend from Hamilton Beach
Brands Holding Company prior to the spin-off.
($ in millions)
_____________________
(1) For the six months ended 6/30/17, the Company had 6.8 million weighted average shares outstanding, which would
equate to diluted earnings per share of $1.75/share.
(2) Consolidated Adjusted EBITDA is a non-GAAP measure and should not be considered in isolation or as a substitute for a
GAAP measure. The discussion of non-GAAP items and the related reconciliations to GAAP measures start on page 29.
(3) Consolidated Adjusted Income before Tax is a measure of income that differs from Consolidated Income before Tax
measured in accordance with U.S. GAAP. Adjusted Income before Tax is adjusted to exclude Centennial Natural
Resources (“Centennial”) which ceased mining operations in December 2015. Management believes that Adjusted
Income before Tax will assist the investor in understanding the results of operations of NACCO. In addition, management
evaluates results using these non-GAAP financial measures.
(2)
(1)
(2)
2016
LTM
June 2017
YTD
June 2017
Consolidated Income from Continuing
Operations, net of tax$3.4 $8.2 $11.9
Consolidated Adjusted EBITDA $27.9 $36.8 $24.4
Consolidated Operating Profit ($1.7) $4.7 $18.2
Operating Profit - North American Coal $5.6 $13.3 $22.2
Operating Loss - NACCO & Other ($7.3) ($8.6) ($4.0)
Consolidated Income before Tax ($6.7) $2.3 $16.3
Adjustments to Eliminate Centennial $27.7 $22.4 ($0.2)
Consolidated Adjusted Income before Tax(3) $21.0 $24.7 $16.1
Total Debt $96.0 - $69.1
Cash and Cash Equivalents $69.3 - $54.9

LOCATION
Strong in a Challenging Environment
24
NACoal is well positioned in light of challenges facing the coal mining and electric generation industries
Power plants served are younger, larger and more efficient than most that have closed in
recent years
Power plants served are competitive suppliers of electricity in their respective dispatch
areas
Customers continue to invest in efficiency and environmental upgrades to their facilities
NACoal does not have any direct exposure to coal market price volatility

LOCATION
Why Invest in NACCO?
25
NACoal has over 100 years of success in mining and provided the foundation for the growth
of the Company over the past 30 years
The spin-off will provide NACCO stockholders with a more focused investment option
NACoal is expected to continue to benefit from its high-return, low-volatility business model
supported by long-term contracts
― Core business model is built upon long-term cost-plus contracts at nearly all of its coal mining, limerock mining and value-
added services operations
― Exclusive supplier for each customer facility
― Requires minimal capital investment
― Long-term contracts provide the majority of earnings and strong annuity-like cash flows without cyclical swings
― Well suited to serve as a cost-plus contract miner in both coal and non-coal mining operations, such as aggregates or
other minerals. NACoal’s aggregate mining operations are operated as North American Mining
Key objectives:
1) Preserve and protect long-term contracts with existing customers
2) Expand the North American Mining aggregates business
3) Pursue other opportunities for growth by leveraging the Company’s core skills

LOCATION
Appendix

LOCATION
Risk Factors
27
The risks and uncertainties with respect to each subsidiary’s operations as referenced on page 1 of this document
include, without limitation:
North American Coal: (1) the potential closure of the Liberty Mine in Mississippi, (2) changes in tax laws or regulatory
requirements, including changes in mining or power plant emission regulations and health, safety or environmental
legislation, (3) changes in costs related to geological conditions, repairs and maintenance, new equipment and replacement
parts, fuel or other similar items, (4) regulatory actions, changes in mining permit requirements or delays in obtaining mining
permits that could affect deliveries to customers, (5) weather conditions, extended power plant outages or other events that
would change the level of customers' coal or limerock requirements, (6) weather or equipment problems that could affect
deliveries to customers, (7) changes in the power industry that would affect demand for North American Coal's reserves,
including dispatch of alternative fuel sources that could unfavorably affect the amount of electricity generation attributable to
coal-fired power plants over the longer term, (8) changes in the costs to reclaim North American Coal mining areas, (9)
costs to pursue and develop new mining opportunities, (10) changes to or termination of a long-term mining contract, or a
customer default under a contract, (11) the timing and pricing of transactions to dispose of assets at the Centennial
operations, (12) delays or reductions in coal deliveries at North American Coal's newer mines, and (13) increased
competition, including consolidation within the industry.
Hamilton Beach Brands Holding Company: (1) the failure to obtain New York Stock Exchange approval for the listing of
Hamilton Beach Brands Holding Company's Class A common stock.

LOCATION
Risk Factors (cont.)
28
The risks and uncertainties with respect to each subsidiary’s operations as referenced on page 1 of this document
include, without limitation:
Hamilton Beach Brands, Inc.: (1) changes in the sales prices, product mix or levels of consumer purchases of small
electric and specialty housewares appliances, (2) changes in consumer retail and credit markets, including the increasing
volume of transactions made through third-party internet sellers, (3) bankruptcy of or loss of major retail customers or
suppliers, (4) changes in costs, including transportation costs, of sourced products, (5) delays in delivery of sourced
products, (6) changes in or unavailability of quality or cost effective suppliers, (7) exchange rate fluctuations, changes in the
import tariffs and monetary policies and other changes in the regulatory climate in the countries in which Hamilton Beach
buys, operates and/or sells products, (8) product liability, regulatory actions or other litigation, warranty claims or returns of
products, (9) customer acceptance of, changes in costs of, or delays in the development of new products, (10) increased
competition, including consolidation within the industry and (11) changes mandated by federal, state and other regulation,
including tax, health, safety or environmental legislation.
Kitchen Collection: (1) increased competition, including through online channels, (2) shifts in consumer shopping patterns,
gasoline prices, weather conditions, the level of consumer confidence and disposable income as a result of economic
conditions, unemployment rates or other events or conditions that may adversely affect the number of customers visiting
Kitchen Collection® stores, (3) changes in the sales prices, product mix or levels of consumer purchases of kitchenware
and small electric appliances, (4) changes in costs, including transportation costs, of inventory, (5) delays in delivery or the
unavailability of inventory, (6) customer acceptance of new products, (7) the anticipated impact of the opening of new
stores, the ability to renegotiate existing leases and effectively and efficiently close under-performing stores and (8) changes
in the import tariffs and monetary policies and other changes in the regulatory climate in the countries in which Kitchen
Collection buys, operates and/or sells products.

LOCATION
Non-GAAP Disclosure
29
This presentation contains non-GAAP financial measures. Included in this presentation are reconciliations of these non-
GAAP financial measures to the most directly comparable financial measures calculated in accordance with U.S.
generally accepted accounting principles ("GAAP"). Adjusted income and Adjusted EBITDA are measures of net income
(loss) that differ from financial results measured in accordance with GAAP. The adjusted financial measures are U.S.
GAAP financial measures adjusted to exclude Centennial. Adjusted EBITDA, cash flow before financing, and the adjusted
financial measures in this presentation are provided solely as supplemental non-GAAP disclosures of operating results.
Management believes these non-GAAP financial measures assist investors in understanding the results of operations of
NACCO Industries, Inc. and its subsidiaries and aid in understanding comparability of results. In addition, management
evaluates results using these non-GAAP financial measures.
NACCO defines non-GAAP measures as follows:
Adjusted Income (Loss) Before Income Tax is adjusted to exclude the results of Centennial;
Adjusted EBITDA is defined as net income (loss) before asset impairment charges and tax provision
(benefit) plus net interest expense and depreciation, depletion and amortization expense;
Cash flow before financing is defined as net cash from operating activities plus net cash from investing
activities. It includes non-cash impairment charges related to NACoal’s Centennial mining operations
which ceased active mining operations at the end of 2015.
For reconciliations from GAAP measurements to non-GAAP measurements see pages 30 to 32.

LOCATION
Non-GAAP Reconciliations
30
NACoal Adjusted income (loss) before income tax reconciliation($ in millions)
_____________________
Note: Adjusted Income (Loss) Before Income Tax is a measure that differs from Income (Loss) Before Income Tax measured in accordance with U.S. GAAP. Adjusted Income (Loss) Before Income Tax is adjusted to exclude the results of Centennial. Management
believes that Adjusted Income (Loss) Before Income Tax assists the investor in understanding the results of operations of North American Coal and aids in understanding comparability of results.
Year Ended December 31, Six Months Ended June 30,
2015 2016 LTM June 2017 2016 2017
NACoal
Income (loss) before income tax ($2.3) $0.0 $10.3 $10.6 $20.9
Elimination of Centennial
Gross (profit) loss - Centennial 34.6 5.4 4.0 3.9 2.5
Other Centennial adjustments 0.3 22.3 18.4 1.2 (2.7)
Total Centennial adjustments 34.9 27.7 22.4 5.1 (0.2)
Adjusted income (loss) before income tax $32.6 $27.7 $32.7 $15.7 $20.7
LOCATION
Non-GAAP Reconciliations (cont.)
31
($ in millions)
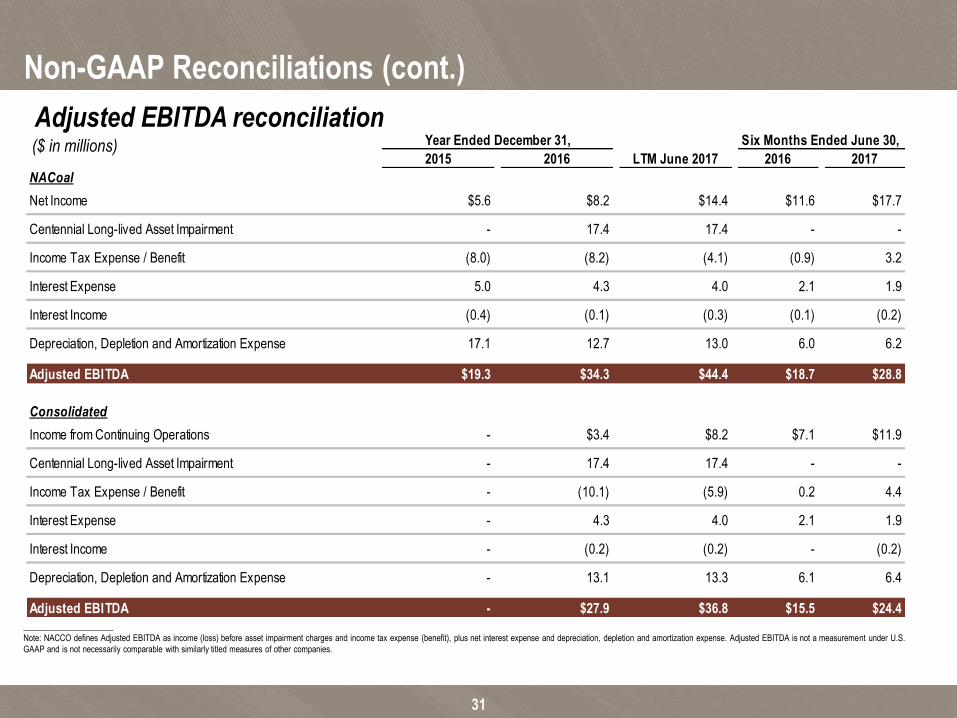
Adjusted EBITDA reconciliation
_____________________
Note: NACCO defines Adjusted EBITDA as income (loss) before asset impairment charges and income tax expense (benefit), plus net interest expense and depreciation, depletion and amortization expense. Adjusted EBITDA is not a measurement under U.S.
GAAP and is not necessarily comparable with similarly titled measures of other companies.
Year Ended December 31, Six Months Ended June 30,
2015 2016 LTM June 2017 2016 2017
NACoal
Net Income $5.6 $8.2 $14.4 $11.6 $17.7
Centennial Long-lived Asset Impairment - 17.4 17.4 - -
Income Tax Expense / Benefit (8.0) (8.2) (4.1) (0.9) 3.2
Interest Expense 5.0 4.3 4.0 2.1 1.9
Interest Income (0.4) (0.1) (0.3) (0.1) (0.2)
Depreciation, Depletion and Amortization Expense 17.1 12.7 13.0 6.0 6.2
Adjusted EBITDA $19.3 $34.3 $44.4 $18.7 $28.8
Consolidated
Income from Continuing Operations - $3.4 $8.2 $7.1 $11.9
Centennial Long-lived Asset Impairment - 17.4 17.4 - -
Income Tax Expense / Benefit - (10.1) (5.9) 0.2 4.4
Interest Expense - 4.3 4.0 2.1 1.9
Interest Income - (0.2) (0.2) - (0.2)
Depreciation, Depletion and Amortization Expense - 13.1 13.3 6.1 6.4
Adjusted EBITDA - $27.9 $36.8 $15.5 $24.4
LOCATION
Non-GAAP Reconciliations (cont.)
32
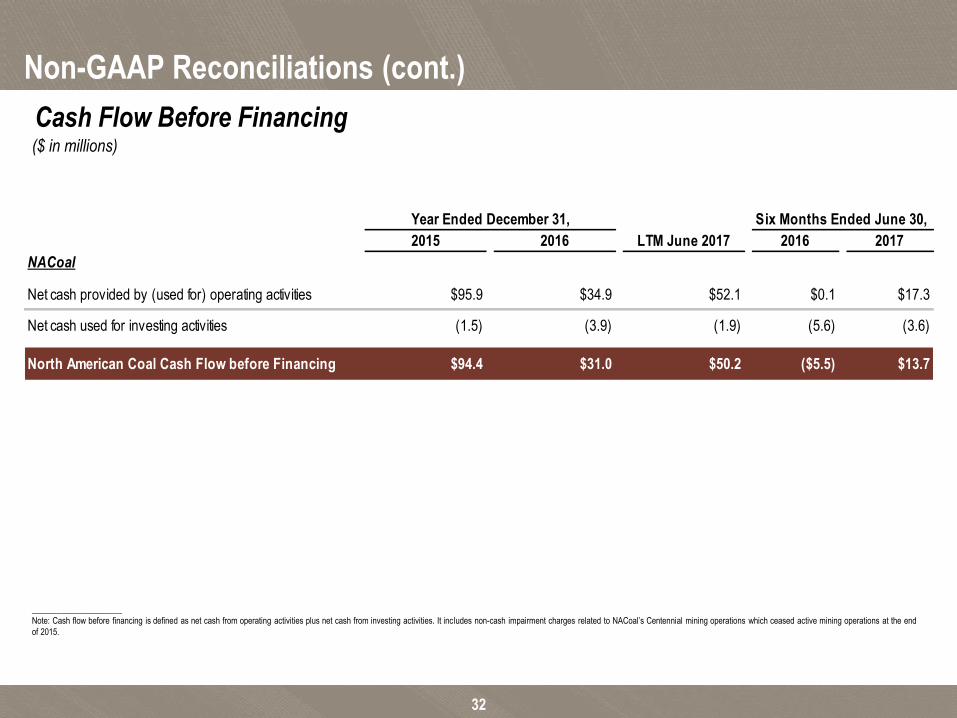
Cash Flow Before Financing($ in millions)
Year Ended December 31, Six Months Ended June 30,
2015 2016 LTM June 2017 2016 2017
NACoal
Net cash provided by (used for) operating activities $95.9 $34.9 $52.1 $0.1 $17.3
Net cash used for investing activities (1.5) (3.9) (1.9) (5.6) (3.6)
North American Coal Cash Flow before Financing $94.4 $31.0 $50.2 ($5.5) $13.7
_____________________
Note: Cash flow before financing is defined as net cash from operating activities plus net cash from investing activities. It includes non-cash impairment charges related to NACoal’s Centennial mining operations which ceased active mining operations at the end
of 2015.