as of 9/15/15 - s2.q4cdn.coms2.q4cdn.com/240130589/.../2015/lkq-11th-annual-north-american-e… ·...
TRANSCRIPT
as of 9/15/15

Statements and information included in this presentation that are not purely historical are forward-looking
statements within the meaning of the Private Securities Litigation Reform Act of 1995 and are made pursuant to the
“safe harbor” provisions of such Act .
Forward-looking statements include, but are not limited to statements regarding our expectations, intentions,
beliefs and strategies regarding the future, including statements regarding trends, cyclicality and changes in the
markets we sell into; strategic direction; changes to procurement processes; the cost of compliance with
environmental and other laws; expected tax rates; planned capital expenditures; liquidity positions; ability to
generate cash from continuing operations; the potential impact of adopting new accounting pronouncements;
Forward Looking Statement
generate cash from continuing operations; the potential impact of adopting new accounting pronouncements;
expected financial results, including revenue and profitability; obligations under our retirement plans; savings or
additional costs from business integrations and cost containment programs; and the adequacy of accruals.
All forward-looking statements we make are based on information available to us at the time the statements are
made, and we assume no obligation to update any forward-looking statements, except as may be required by law.
The potential risks and uncertainties that could cause actual results to differ from the results predicted or implied
by our forward-looking statements include, among others, changes in federal or state laws or regulations that affect
our business, changes in the types of replacement parts that insurance carriers will accept, fluctuations in the prices
of metals, as well as the risks and uncertainties included under the captions “Risk Factors” and “Management’s
Discussion and Analysis of Financial Condition and Results of Operations” in our Annual Report on Form 10-K for the
year ended December 31, 2014 and any of our subsequent Quarterly Reports on Form 10-Q. These reports are
available on our investor relations website at lkqcorp.com and on the SEC website at sec.gov.
2

Mission Statement
To be the leading global value-added distributor of vehicle parts and
accessories by offering our customers the most comprehensive, available and the most comprehensive, available and
cost effective selection of part solutions while building strong
partnerships with our employees and the communities in which we operate.
3

Company Overview

LKQ’s Evolution
July 1998Wholesale Salvage
February 2004Aftermarket Collision
February 2004Self Serve
January 2006Refurbished Wheels
October 2007Keystone / Paint
March 2008Heavy Duty
November 2010Reman
October 2011EUROPE-UK
January 2014Keystone Specialty
May 2013EUROPE-Benelux
August 2013Australia JV
18%
13%
8%
5
2003
Total Revenue
$328MM
2007
Total Revenue
$1.11B
2011
Total Revenue
$3.27B
* as of 6/30/2015
29%
2%2%
28%
2015*
Total Revenue
$7.02B

Operating Unit Overview
Operating Units*
� North America
� Sell more than 101,000 SKUs of aftermarket automotive products
� Purchased 290,000 vehicles for dismantling
� Includes aftermarket, recycled, refurbished, and remanufactured
� Purchased 482,000 vehicles at 73 self service facilities in NorthAmerica
Total Revenue
Parts & Services92%
Other8%
� Europe
� Sell more than 185,000 and 171,000 SKUs of primarily aftermarketmechanical parts in our Euro Car Parts and Sator operations,respectively
� Operations in the United Kingdom, the Netherlands, Belgium,France and Scandinavia
� Specialty
� Leading distributor and marketer of specialty aftermarketequipment and accessories products in North America sellingmore than 235,000 total SKUs
Parts & Services Revenue by Reportable Segment
North America55%
6* All financial data LTM as of 6/30/2015
Specialty 15%
Europe30%
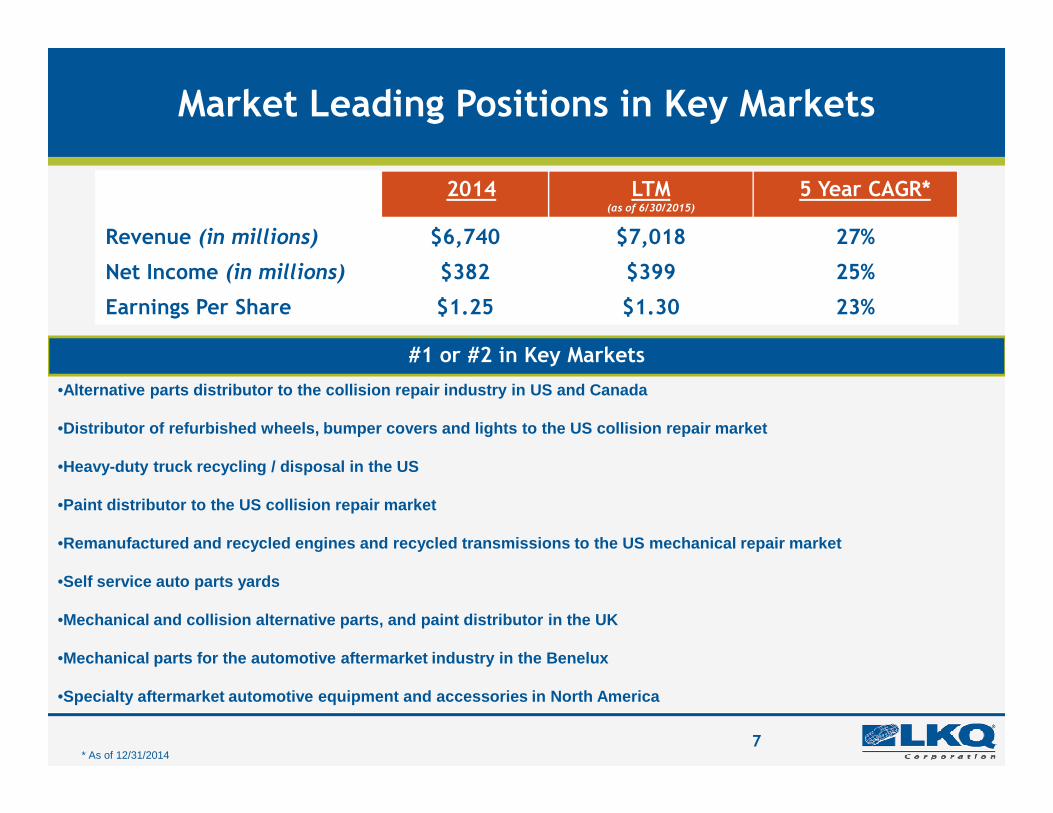
Market Leading Positions in Key Markets
•Alternative parts distributor to the collision repair indu stry in US and Canada
#1 or #2 in Key Markets
2014 LTM(as of 6/30/2015)
5 Year CAGR*
Revenue (in millions) $6,740 $7,018 27%
Net Income (in millions) $382 $399 25%
Earnings Per Share $1.25 $1.30 23%
7* As of 12/31/2014
•Distributor of refurbished wheels, bumper covers and light s to the US collision repair market
•Heavy-duty truck recycling / disposal in the US
•Paint distributor to the US collision repair market
•Remanufactured and recycled engines and recycled transmis sions to the US mechanical repair market
•Self service auto parts yards
•Mechanical and collision alternative parts, and paint dist ributor in the UK
•Mechanical parts for the automotive aftermarket industry i n the Benelux
•Specialty aftermarket automotive equipment and accessori es in North America

North America

Automotive Repair Market
$213 bn
Do It For Me (DIFM)
$165 bn
Collision
$40 bn
Mechanical
$125 bn
DIY*
$48 bn
Retail
Price
US Automotive Repair Industry
$40 bn
Collision Parts
$22 bn
Collision
(Wholesale)
$15 bn
Markup
$7 bn
Labor
$18 bn
$125 bn
Mechanical Parts
$68 bn
Mechanical
(Wholesale)
$46 bn
Markup
$22 bn
Labor
$57 bn
Source: AAIA Factbook, 24rd Edition 2014; 2014 data is estimated, excludes tires2014 Collision Trends
Price
Parts &
Labor
Market Opportunity – $61 billion
9
* Do It Yourself

Repair ShopNew OEM
Manufacturers
Insurance Companies (Indirect Customers)
64%
Collision Products, a $15 Billion Industry
Aftermarket
Recycled OEMRefurbished & Optional OE
Products
18%
Source: CCC Information Services –Crash Course 2015
Alternative parts = 36% of parts costs
12%6%
10

New OEM
Recycled OEM
Front Door
$1,376
$805
Engine
$3,458
$1,125
Rear Bumper
$531
$237
High quality products at lower cost than OEM replacement products
Clear Value Proposition
Recycled OEM
…and improved cycle time for repairs
Recycled OEM
Savings
$805
41%
$1,125
67%
$237
55%
New OEM
Aftermarket
Savings
Fender
$209
$163
22%
Door Mirror
$160
$92
43%
Hood
$446
$307
31%
11
Aftermarket
Parts price only-excludes labor

4 year timehorizon
Age & Size of US Car Parc Improving
112 114 115 117 119 118 117 113
107 102
97 95 94 94 98
105
67 68 68 67 67 67 66 63 63
66 25
30
35
40
45
50
80
100
120
140
Num
ber
of
Vehic
les
(millions)
12Sources: Sales & Production-Wards; Projections-Bank of America Merrill Lynch, 1/06/2015
Data assumes oldest vehicles are retired first in each year (not a precise assumption)
2003 2004 2005 2006 2007 2008 2009 2010 2011 2012 2013 2014 2015 2016 2017 2018
New 17 17 17 17 16 13 10 12 13 14 16 17 17 17 18 18
3-10 years 112 114 115 117 119 118 117 113 107 102 97 95 94 94 98 105
3-7 years 67 68 68 67 67 67 66 63 56 51 48 49 54 59 63 66
17 17 17 17 16
13
10 12
13 14
16 17 17 17 18 18
67 67 67 67 66 63
56 51
48 49 54
59 63
66
-
5
10
15
20
25
-
20
40
60
Num
ber
of
Vehic
les
(millions)

Average Parts Replaced Per Claim by Part Type
5.8
7.8
6.3
8.9
6.0
8.0
10.0 2009 2010 2011 2012 2013 2014
Over 19 million repairable claims
Source: CCC Information Services Inc. 13
5.8
2.02.6
0.0
2.0
4.0
6.0
OEM Alternative Parts Total
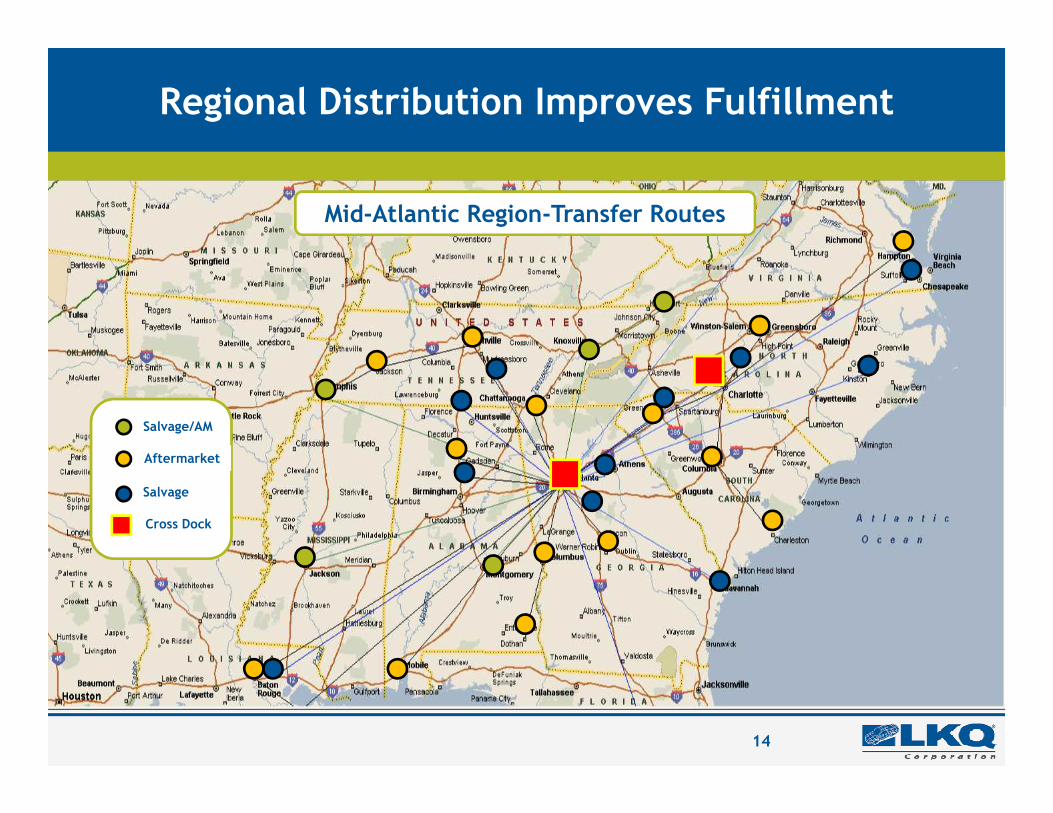
Regional Distribution Improves Fulfillment
Mid-Atlantic Region-Transfer Routes
14
Salvage/AM
Salvage
Aftermarket
Cross Dock
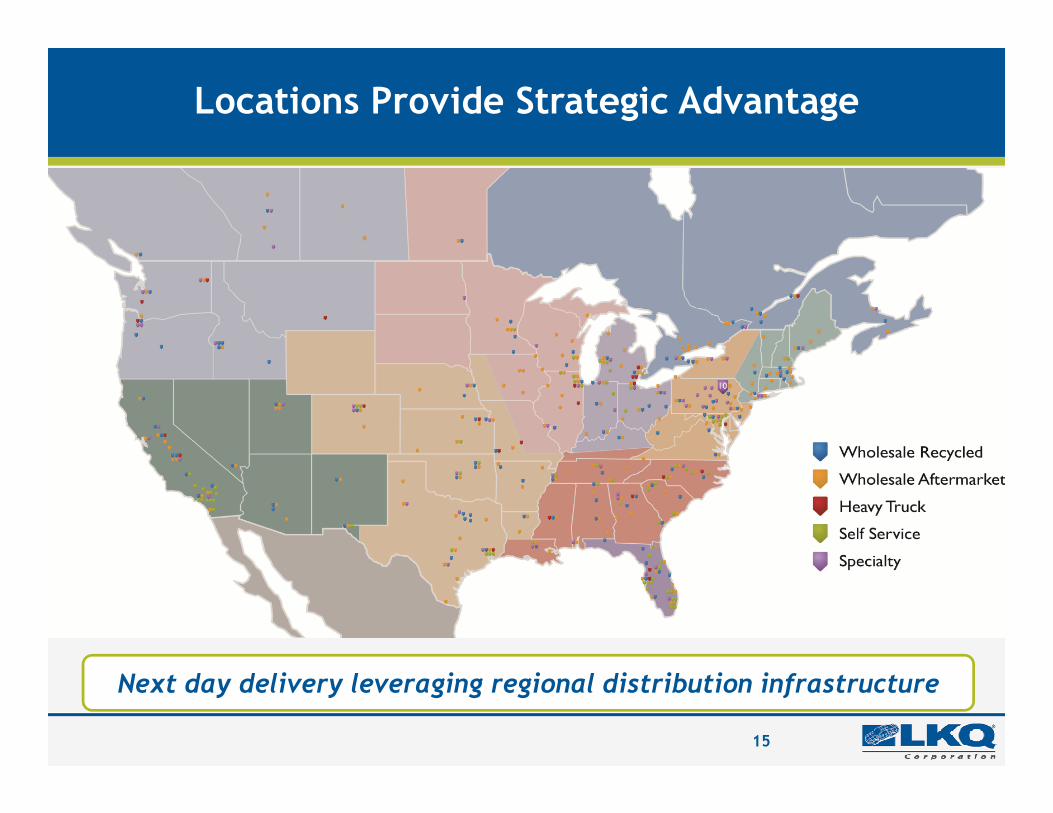
Locations Provide Strategic Advantage
15
Next day delivery leveraging regional distribution infrastructure
Europe

Europe - Market Observations
• Large car parc
• Fragmented industry
• Dominated by country champions
• In transition from 3 step to 2 stepdistributiondistribution
• Professional repairer focused
• Segmented by the suppliers
• Focused on mechanical parts
• Low penetration of alternative collisionparts with ~7% APU across Europe
17

Euro Car Parts
Leading distributor of automotive aftermarket parts in the UK
• Nearly 55,000 commercial customers
• 3 National Distribution Centers totaling 1.2MMsquare feet
• 13 regional hubs, 194 branches, 25 paint distributionlocations
18
locations
• Over 2,200 delivery routes
• Launched collision parts program in March 2012;now offering over 20,000 collision SKU’s
• Achieved total organic growth of 11.6% in Q2 2015;organic growth for branches open more than 12months was 7.1% for Q2 2015
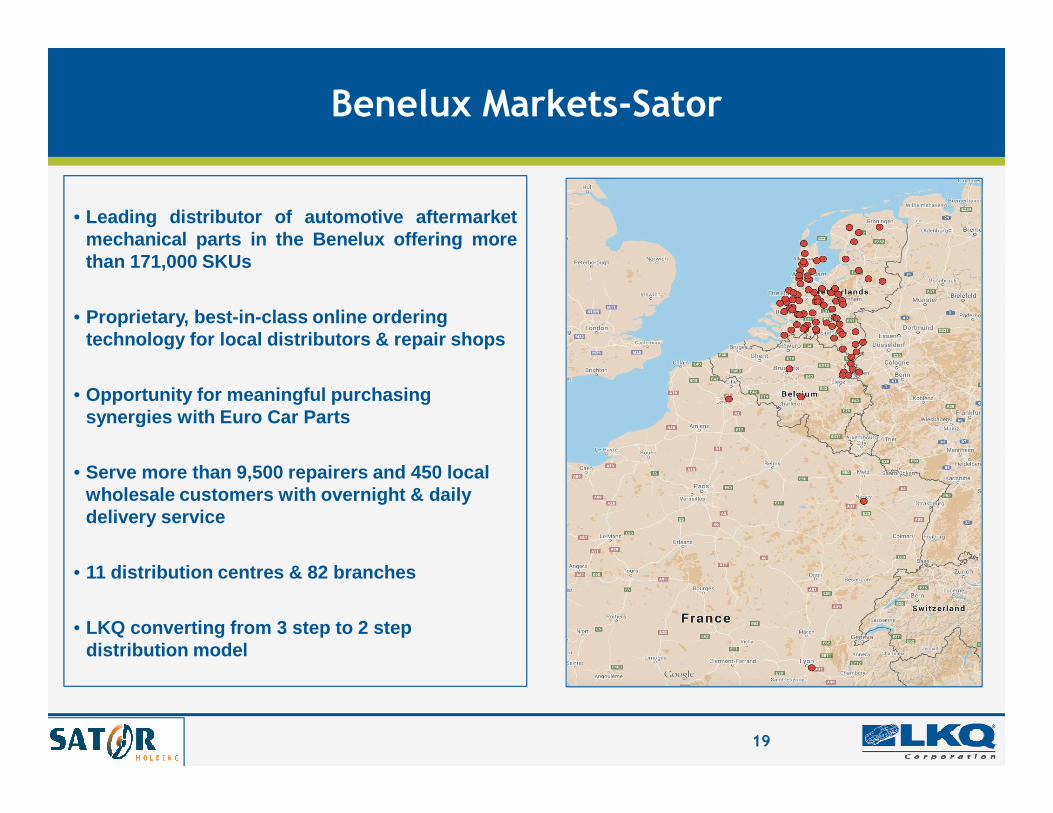
Benelux Markets-Sator
• Leading distributor of automotive aftermarketmechanical parts in the Benelux offering morethan 171,000 SKUs
• Proprietary, best-in-class online ordering technology for local distributors & repair shops
• Opportunity for meaningful purchasing synergies with Euro Car Parts
19
synergies with Euro Car Parts
• Serve more than 9,500 repairers and 450 local wholesale customers with overnight & daily delivery service
• 11 distribution centres & 82 branches
• LKQ converting from 3 step to 2 step distribution model

Specialty

Keystone Specialty
Keystone’s Directly Addressable Market * Keystone Overview
• Leading distributor and marketer of specialtyaftermarket equipment, accessories, and products inNorth America
• Critical link between 800+ suppliers and approximately17,000 customers selling over 235,000 total SKUssupported by a highly technical sales force
• Diverse product segments: truck and off-road; speedand performance ; recreational vehicle ; towing ; wheels,
Performance Products
$2.140%
RV ,Trailer &Other$1.121%
Wheels & Tires$0.58%
and performance ; recreational vehicle ; towing ; wheels,tires and performance handling; and miscellaneousaccessories
• Best-in-class logistics and distribution network withapproximately 800,000 annual deliveries and ability toserve over 99% of jobber customers next-day
• Management and infrastructure in place to aggressivelypursue growth organically and through strategicacquisitions
• Achieved Q2 2015 revenue of $283MM
21* Management estimates based on AAIA Factbook, SEMA and other industry research; data $ in billions
Accessory & Appearance Products$1.631%
North American Distribution Footprint

Financial Overview

Acquisition Strategy
• Seek markets where we can be #1or #2
• Keep discipline on return metrics
• Criteria in new markets• Among the leaders in the market
Strong Brands
• Well run companies• LKQ culture• Ability to achieve synergies• Attractive Returns of Capital• High fulfillment rates
• Criteria in existing markets• “Tuck in” companies• High synergies• Additional capacity• Examples: Cross Canada, Stag-Parkway
2323

Unique Combination of Strong Organic & Acquisition Revenue Growth
20%
25%
30%
21.3%
23.6%
27.8%
Acquisition Revenue Growth Rates*Organic Revenue Growth Rates*
* Parts and services only 24
0%
5%
10%
15%
2009 2010 2011 2012 2013 2014 Q2-'15
6.1%6.6%
7.9%6.0%
11.0%9.0%
7.5%
4.0%
8.3%
13.7%
7.4%

Historical Financials
Revenue Earnings Per Share($ in millions)
$0.87
$1.02
$1.25
$1.00
$1.20
$1.40
$5,063
$6,740
$5,000
$6,000
$7,000
25
$0.57
$0.71
$-
$0.20
$0.40
$0.60
$0.80
2010 2011 2012 2013 2014
$2,470
$3,270
$4,123
$-
$1,000
$2,000
$3,000
$4,000
2010 2011 2012 2013 2014

Second Quarter 2015 Overview
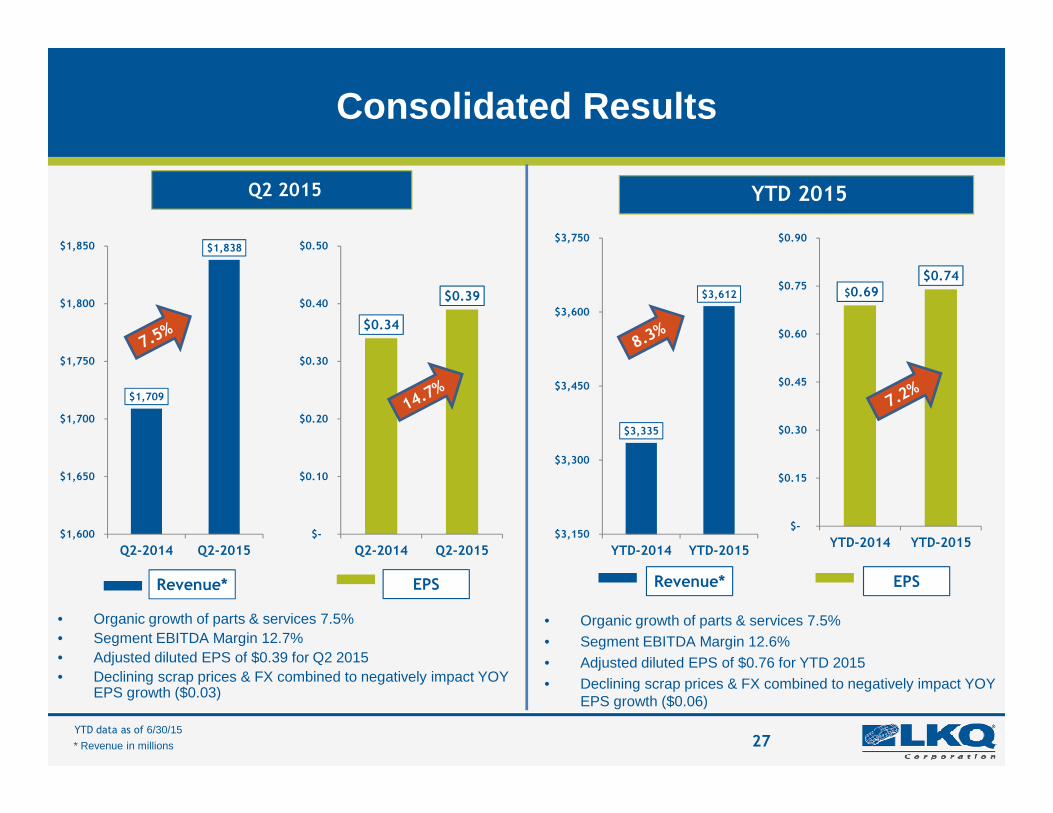
Consolidated Results
Q2 2015
$1,709
$1,838
$1,750
$1,800
$1,850
YTD 2015
$0.34
$0.39
$0.30
$0.40
$0.50
$3,612
$3,450
$3,600
$3,750
$0.69$0.74
$0.45
$0.60
$0.75
$0.90
27
• Organic growth of parts & services 7.5% • Segment EBITDA Margin 12.7%• Adjusted diluted EPS of $0.39 for Q2 2015• Declining scrap prices & FX combined to negatively impact YOY
EPS growth ($0.03)
• Organic growth of parts & services 7.5% • Segment EBITDA Margin 12.6%• Adjusted diluted EPS of $0.76 for YTD 2015• Declining scrap prices & FX combined to negatively impact YOY
EPS growth ($0.06)
$1,600
$1,650
$1,700
Q2-2014 Q2-2015
$-
$0.10
$0.20
Q2-2014 Q2-2015
$3,335
$3,150
$3,300
YTD-2014 YTD-2015
$-
$0.15
$0.30
YTD-2014 YTD-2015
Revenue* Revenue*EPS EPS
YTD data as of 6/30/15
* Revenue in millions

Q2 2015 Revenue Growth
Q2 revenue changes by source:
Organic Acquisition Total (1)
North America 6.3% 0.9% (0.9%) 6.3%Europe 10.1% 11.1% (11.7%) 9.5%Specialty 6.6% 25.3% (1.9%) 30.0%
Parts and services 7.5% 7.4% (4.3%) 10.6%Other Revenue (20.6%) 0.4% (0.4%) (20.5%)
Total 4.7% 6.7% (3.9%) 7.5%
Foreign Exchange
28
(1) The sum of the individual revenue change components may not equal the total percentage change due to rounding.
• North American growth equally weighted between volu me & price• ECP organic revenue growth for branches open more t han 12 months was 7.1%• ECP YOY collision parts revenue growth of 33% • Unfavorable F/X impact on European revenue of $54 m illion• European constant currency growth of 21.2%• Specialty acquisition growth reflects Q4 2014 acqui sition of Stag Parkway• Decrease in Other Revenue primarily attributable to decline in scrap prices. Scrap was 36%
lower YOY in Q2 2015

North America – Q2 2015 Results
North America Segment EBITDA Margin Bridge
% of Revenue
($ in millions) 2015 2014 Change 2015 2014
Revenue $1,045 $1,026 1.9%
Gross Margin $443 $431 2.8% 42.4% 42.0%
Operating Expenses $306 $296 3.4% 29.4% 28.9%
Segment EBITDA $139 $137 1.5% 13.3% 13.4%
39%
41%
43%
45%Gross Margin
11%12%13%14%15%
Q1'14 Q2'14 Q3'14 Q4'14 Q1'15 Q2 '15
Segment EBITDA Margin
29
North America Segment EBITDA Margin Bridge
13.4%
0.4%
(0.7%)
0.4%
(0.2%)
13.3%
10.0%
11.0%
12.0%
13.0%
14.0%
15.0%
Q2 2014 Gross margin Scrap prices Fuel Other Q2 2015

Europe – Q2 2015 Results
% of Revenue
($ in millions) 2015 2014 Change 2015 2014
Revenue $510 $465 9.7%
Gross Margin $193 $173 11.6% 37.9% 37.2%
Operating Expenses $138 $126 9.5% 27.1% 27.2%
Segment EBITDA $54 $46 17.4% 10.6% 9.9%
ECP Branches 194 165 29
Sator Branches 82 52 30
34%
36%
38%
40%Gross Margin
7%8%9%
10%11%
Q1'14 Q2'14 Q3'14 Q4'14 Q1'15 Q2 '15
Segment EBITDA Margin
30
Europe Segment EBITDA Margin Bridge
Sator Branches 82 52 30
9.9%
0.7%
0.7%
0.5%
(1.1%) (0.1%)
10.6%
8.0%
9.0%
10.0%
11.0%
12.0%
Q2 2014 Gross margin Distribution F&W personnel SG&A pe rsonnel expenses
Other Q2 2015

Specialty Segment EBITDA Margin Bridge
Specialty– Q2 2015 Results
% of Revenue
($ in millions) 2015 2014 Change 2015 2014
Revenue $284 $218 30.3%
Gross Margin $87 $67 29.9% 30.8% 30.9%
Operating Expenses $47 $39 20.5% 16.7% 17.9%
Segment EBITDA $40 $28 42.9% 14.1% 13.0%
28%
30%
32%
34%Gross Margin
6%8%
10%12%14%16%
Q1'14 Q2'14 Q3'14 Q4'14 Q1'15 Q2 '15
Segment EBITDA Margin
31
Specialty Segment EBITDA Margin Bridge
13.0%
(0.2%)
0.7%0.5% 0.1%
14.1%
10.0%
11.0%
12.0%
13.0%
14.0%
15.0%
Q2 2014 Gross margin (primarily Stag acquisition)
SG&A integration synergies
Distribution (incl. fuel) Other Q2 2015

Leverage & Liquidity
$115
$143
$1,200
$1,600
$2,000
$1,128$1,239
$1,600
$2,000
$2,400
Revolver Availability*
$1,865
$1,691 $2,380$2,370
($ in millions )
32* Revolver availability includes our term loans, revolving credit facilities, and our receivables securitization facility
Effective borrowing rate for Q2 2015 was 3.42%
$1,750
$1,548
$0
$400
$800
12/31/2014 06/30/2015
$1,192 $1,059
$60$72
$0
$400
$800
$1,200
12/31/2014 06/30/2015
Cash & equivalents Net Debt
2.4x
2.1x
Total Debt/TTM EBITDA Borrowings under credit facilities Letters of credit

Key Return Metrics
Return on Equity* Return on Invested Capital*
10%
12%
14%
8%
10%
12%
33*Amounts above represent TTM ROE & ROIC
13.10%13.70%
14.40% 14.50% 14.90% 14.50%
0%
2%
4%
6%
8%
2010 2011 2012 2013 2014 Q2-'15
10.60% 10.60%10.20%
10.60%10.20% 10.00%
0%
2%
4%
6%
2010 2011 2012 2013 2014 Q2-'15
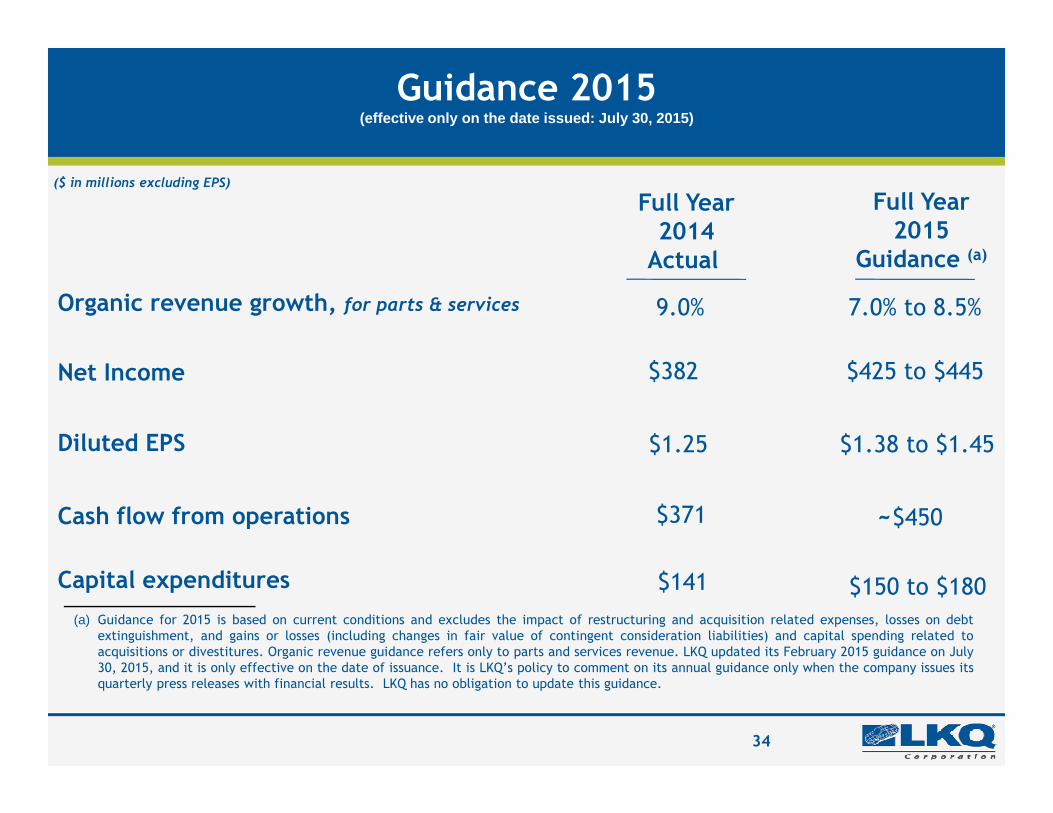
Guidance 2015 (effective only on the date issued: July 30, 2015)
Organic revenue growth, for parts & services
Net Income
Full Year2014
Actual
Full Year2015
Guidance (a)
$382
7.0% to 8.5%
$425 to $445
9.0%
($ in millions excluding EPS)
34
(a) Guidance for 2015 is based on current conditions and excludes the impact of restructuring and acquisition related expenses, losses on debtextinguishment, and gains or losses (including changes in fair value of contingent consideration liabilities) and capital spending related toacquisitions or divestitures. Organic revenue guidance refers only to parts and services revenue. LKQ updated its February 2015 guidance on July30, 2015, and it is only effective on the date of issuance. It is LKQ’s policy to comment on its annual guidance only when the company issues itsquarterly press releases with financial results. LKQ has no obligation to update this guidance.
Diluted EPS
Cash flow from operations
Capital expenditures
$1.25
$371
$141 $150 to $180
$1.38 to $1.45
~$450
