arv market report - clinton health access initiative market trends ... cold-chain independent lpv/r...
TRANSCRIPT

ARV Market Report:
The State of the Antiretroviral Drug Market in Low- and Middle-Income Countries, 2015-2020
Issue 7, October 2016
This report was made possible through the generous support of the UK Department for International Development
(DFID), UNITAID, and the Bill & Melinda Gates Foundation.
© 2016 Clinton Health Access Initiative, Inc. All rights reserved
Table of Contents
FOREWORD............................................................................................................................................................. 3
SUMMARY AT A GLANCE ............................................................................................................................................ 4
THE STATE OF HIV/AIDS TODAY ................................................................................................................................... 6
ARV MARKET OVERVIEW ............................................................................................................................................ 7
EXHIBIT 2.1: ARV MARKET SIZE (USD) IN GENERIC-ACCESSIBLE VS. GENERIC-INACCESSIBLE COUNTRIES ...................................................... 7
EXHIBIT 2.2: ARV MARKET SIZE (USD) IN GA COUNTRIES ........................................................................................................................ 7
EXHIBIT 2.3 WEIGHTED AVERAGE MARKET PRICE (USD) FOR REGIMENS IN GENERIC-ACCESSIBLE COUNTRIES ................................................ 8
EXHIBIT 2.4: ARV MARKET SHARE IN GA LMICS BY TOP MANUFACTURERS ................................................................................................ 8
ADULT MARKET TRENDS ............................................................................................................................................ 9
EXHIBIT 3.1 NUMBER OF ADULTS ON ART AND ADULT ART COVERAGE IN LMICS ......................................................................................... 9
EXHIBIT 3.2 PATIENT GROWTH AND SHARE OF FIRST-LINE ADULT REGIMENS IN GA LMICS............................................................................ 9
EXHIBIT 3.3 PATIENT GROWTH AND SHARE OF FIRST-LINE NNRTI/INSTI MARKET IN GA LMICS ...................................................................... 10
EXHIBIT 3.4 PATIENT GROWTH AND SHARE OF FIRST-LINE NRTI MARKET IN GA LMICS ............................................................................... 11
EXHIBIT 3.5 TOP FIVE ADULT FORMULATIONS BY PATIENT VOLUME IN GA LMICS, 2015 ............................................................................... 11
EXHIBIT 3.6 TOP ADULT FORMULATIONS BY REVENUE IN GA LMICS, 2015 ................................................................................................ 11
EXHIBIT 3.7 PATIENT GROWTH AND SHARE OF SECOND-LINE PI MARKET IN GA LMICS ............................................................................... 12
EXHIBIT 3.8 PATIENT GROWTH AND SHARE OF SECOND-LINE NRTI/INSTI MARKET IN GA LMICS10 .................................................................. 12
EXHIBIT 3.9 TENTATIVE TIMELINES FOR NEW PRODUCT SRA APPROVALS ............................................................................................... 12
PEDIATRIC MARKET TRENDS .................................................................................................................................... 13
EXHIBIT 4.1 NUMBER OF PEDIATRIC PATIENTS ON ART IN LMICS, AND PEDIATRIC ART COVERAGE IN LMICS ................................................... 13
EXHIBIT 4.2 FORMULATION BREAKDOWN OF PEDIATRIC REGIMENS IN GA LMICS (EXCLUDING RSA) BY IATT STANCE, 2015 ............................... 13
EXHIBIT 4.3 PEDIATRIC NRTI MARKET IN GA LMICS .............................................................................................................................. 14
EXHIBIT 4.4 PEDIATRIC NNRTI/PI MARKET IN GA LMICS ........................................................................................................................ 14
EXHIBIT 4.5 PROJECTED ANNUAL EID TESTING VOLUMES .................................................................................................................... 15
THE FUTURE OF HIV/AIDS ......................................................................................................................................... 16
EXHIBIT 5.1 HIV RDT FORECAST FOR SIX SUB-SAHARAN AFRICA COUNTRIES .......................................................................................... 16
EXHIBIT 5.2 AVERAGE COSTS OF TESTING ACROSS TWO SUB-SAHARAN AFRICA COUNTRIES ..................................................................... 16
APPENDIX A: PROJECTED API DEMAND IN GA LMICS ...................................................................................................... 18
APPENDIX B: REFERENCE PRICE LIST ......................................................................................................................... 20
APPENDIX C: IATT LIST OF OPTIMAL PEDIATRIC PRODUCTS (2016) ..................................................................................... 21
APPENDIX D: NOTES ON METHODOLOGY ..................................................................................................................... 22
REFERENCES ........................................................................................................................................................ 23

3
ARV Market Report | Clinton Health Access Initiative, Inc.
Foreword
Sixteen years ago, the 13th International AIDS Society Conference (IAS) convened in Durban, South Africa, to “break the silence” on the
millions of preventable AIDS-related deaths occurring around the world. The summit was notable as it laid out the clear case that HIV causes
AIDS, allowed people living with HIV/AIDS (PLWHA)’s voices to be heard, and paved the way for the dedication of global resources to end
the epidemic. In 2016, IAS returned to Durban and to a world that has made significant strides in fighting the HIV/AIDS epidemic.
Since 2000, HIV infections have fallen by 35 percent, AIDS-related deaths have decreased by 28 percent, and over 7.8 million lives have
been saved globally. In a remarkable sign of progress, a few low- and middle-income countries (LMICs) such as Botswana and Malaysia
have pediatric coverage rates exceeding 95 percent, while nations including Cambodia and Rwanda have adult coverage rates beyond 70
percent. Globally, however, further work remains before all LMICs successfully reach the UNAIDS Fast-Track targets to end the AIDS
epidemic by 2030.
As of 2015, 46 percent of the nearly 37 million people globally living with HIV were accessing antiretroviral therapy (ART), an increase of two
million from the year before. As the number of patients on ART expanded, so did the antiretroviral (ARV) market. Regimens were not only
more affordable in 2015, but more patients continued to access clinically-recommended formulations. More than 70 percent of adults on first-
line treatment were on WHO preferred TDF + (3TC or FTC) + EFV, while 70 percent of children who were on pediatric formulations were on
IATT optimal formulations.
The WHO guidelines continue to be a critical influence. Major changes were announced in 2015, including the “Test and Treat”
recommendation, which some LMICs such as Botswana, Cambodia, Kenya, Lesotho, South Africa, and Tanzania have already adopted.
Differentiated models of care like multi-month scripting and community ART groups are promising opportunities for countries to reduce the
burden of treatment on their patients. Additionally, LMICs continue to adopt combination prevention strategies, like TDF-containing oral pre-
exposure prophylaxis (PrEP), as a means to lower HIV transmission rates in high-risk populations.
Countries also continue to be eager to adopt new drugs in their national treatment guidelines. The first generic dolutegravir (DTG), a clinically-
superior alternative to efavirenz (EFV), has been tentatively approved by the FDA, and fixed-dose combinations of the same are eagerly
awaited. Botswana became one of the first countries to adopt the drug in its national guidelines, and several others are following suit. Low-
dose efavirenz (TLE400) should be available in 2017, and tenofovir alafenamide fumarate (TAF) is likely to also disrupt the ARV market in the
next two to three years. Focusing on children, cold-chain independent LPV/r oral pellets have been launched in a number of countries and
several countries are planning to soon procure the pill-burden-reducing ABC/3TC 120/60 mg dispersible tablets.
CHAI is excited and optimistic about the future opportunities in the ARV market. Working together with ministries of health, suppliers and
partners, CHAI will continue efforts to ensure patients have rapid access to the best products at affordable and sustainable prices.
4
ARV Market Report | Clinton Health Access Initiative, Inc.
Summary At A Glance

5
ARV Market Report | Clinton Health Access Initiative, Inc.

6
ARV Market Report | Clinton Health Access Initiative, Inc.
The State Of HIV/AIDS Today
The HIV community reflects as IAS returns to Durban
In 2000, 12,000 scientists, clinicians, public health experts, community
leaders, and people living with HIV/AIDS (PLWHA) gathered in Durban,
South Africa for the 13th International AIDS Society (IAS) Conference. The
theme of that summit was to “break the silence” on the millions of
preventable AIDS-related deaths occurring around the world, particularly in
low- and middle-income countries (LMICs).i By the end of 1999, 15 million
adults and nearly four million children had died since the start of the
epidemic.ii And with just 3 percent of the 34 million people living with HIV
globally on treatment, more losses of life were expected to continue without
significant interventions.iii
The Durban IAS conference in 2000 was notable, because it:
Laid out the clear case that HIV causes AIDS. In response to
many powerful skeptics, 5,000 clinicians and scientists published
“The Durban Declaration” as a means to clearly lay out the
scientific evidence that HIV does in fact cause AIDS.
Allowed PLWHA’s voices to be heard. Thousands of patients
diagnosed with HIV marched together to shed light on the
epidemic.iv
Paved the way for the dedication of global resources and
commitment to end the epidemic. The conference laid the
foundation for the 2001 United Nations General Assembly Special
Session on HIV/AIDS (UNGASS 2001) Declaration of
Commitment.i The Global Fund to Fight AIDS, Tuberculosis and
Malaria was soon established.v
Sixteen years later, IAS returned to Durban. HIV infections since then have
fallen by 35 percent, AIDS-related deaths have fallen by 28 percent and it
is estimated that over 7.8 million lives have been saved.vi With the theme
of “access equity rights now,” the 2016 conference set out to remind the
world that significant work remains to be done to “reach the people who still
lack access to comprehensive treatment, prevention, care, and support
services.” vii
The world continues toward UNAIDS Fast-Track targets
By the end of 2015, 17 million patients across the globe were on ART. The
growth of two million new patients from 2014 marks one of the largest
annual increases in PLWHA ever.viii
While the number of patients on ART
continues to increase, the number of new HIV infections has remained
unchanged since 2013, with roughly two million new infections annually. As
a result, prevention is becoming an ever-increasing area of focus as a way
to end the AIDS epidemic.
Focusing on LMICs, over 30 million people were living with HIV/AIDS in
2015, representing more than 80 percent of the global HIV population.
Adult ART coverage rates increased from 41 percent in 2014 to 46 percent
in 2015. Further, 50 percent of children living with HIV/AIDS in LMICs are
now on ART. Several countries are well on their way toward the
UNAIDS/WHO Fast Track 90-90-90 treatment targets.1 In an encouraging
sign of progress, countries like Botswana, Malaysia, Namibia, Thailand,
1 The UNAIDS/WHO fast-track 90-90-90 treatment targets aim for 90 percent of people infected with
HIV know their status, 90 percent of those diagnosed with HIV to receive effective treatment, and 90
percent of those treated to be virally suppressed by 2020.
and Vietnam already have pediatric ART coverage rates greater than 95
percent. Further, adult coverage rates are approaching the goal of 90
percent in Rwanda, Botswana, and Cambodia, with 79 percent, 78 percent,
and 73 percent coverage at the end of 2015, respectively.ix Nevertheless,
with average global ART coverage still only at 46 percent, much work
remains to be done.
2015 WHO Guidelines bring about significant changes
Two years after IAS 2000, the WHO published its first set of antiretroviral
treatment guidelines. Seen as the gold standard for the medical treatment
and prevention of HIV, the WHO Guidelines have been pivotal in shaping
the treatment of adults, adolescents, and children in LMICs. The 2015
guideline changes and subsequent country highlights include:
Treatment for all, regardless of age or CD4 count. The WHO
now recommends the initiation of ART for all adults and children
living with HIV regardless of WHO clinical stage and at any CD4
cell count. Lesotho became the first country in sub-Saharan Africa
to implement test and treat guidelines in April of 2016, followed
shortly after by South Africa and Tanzania.x,xi,xii
Option B+ as the only standard for prevention of mother-to-
child transmission of HIV. Option B+, where lifelong ARV
treatment is provided to all pregnant and breastfeeding women
(regardless of CD4 count or clinical stage), has been included in
the WHO treatment guidelines since 2013. Twenty-one of the 22
Global Plan priority countries have either fully implemented Option
B+ or in the process of scaling up treatment nationally.xiii
Strikingly,
in 2015, Cuba was declared the first country by the WHO as having
eliminated mother-to-child transmission of HIV. By June 2016, the
list expanded to Armenia, Belarus, and Thailand.
Innovative drugs and formulations are adopted. Dolutegravir
(DTG) and low-dose efavirenz (EFV400) were included as alternate
options in first-line, and darunavir (DRV) as an alternate second-
line (2L) option. These products are discussed in more detail in the
“Adult Market” section.
TDF-containing oral pre-exposure prophylaxis (PrEP)
recommended for high-risk populations. Initially, only Gilead’s
Truvada had the PrEP indication on label. Depending on various
country regulations, label revisions for TDF/FTC from generic
manufacturers may be required before use for PrEP, even if the
product is otherwise currently being procured for treatment. South
Africa was the first country to introduce oral PrEP through the
national program in mid-2016, and its national drug regulator has
already approved some generics for PrEP labeling. Several other
countries are expected to follow suit in 2017. Since this is a newer
area of focus for country programs, and as policies and roll-out
plans are still being developed, overall PrEP volumes in the near
future are expected to be small, especially relative to the treatment
market.

7
ARV Market Report | Clinton Health Access Initiative, Inc.
ARV Market Overview
ARV market in LMICs expanded to ~US$1.92 billion in 2015
with continued scale-up of ART
The LMIC market for ARVs expanded by ~9 percent from US$1.75 billion
in 2014 to US$1.92 billion in 2015. The market grew as countries scaled up
patients on treatment, despite declining prices for key formulations for
preferred regimens.
Exhibit 2.1: ARV MARKET SIZE (USD) IN GENERIC-ACCESSIBLE VS.
GENERIC-INACCESSIBLE COUNTRIES
The generic-accessible (GA)2 ARV market, which represents 93 percent of
patients in LMICs, grew by ~5 percent to US$1.6 billion in 2015, primarily
driven by growth in the adult first-line market. The adult first-line segment
represented the majority of patients on ART and as a result the total GA
market dollar value in 2015 (91 and 85 percent respectively).
As shown in exhibit 2.2, the overall adult market value growth in 2015 was
slower than that observed from 2013 to 2014, as growth from patient scale-
up was partially offset by decreasing prices for ARVs used in preferred
regimens. However, prices for key ARVs are presumed to have reached
their lowest point at which they could be sustainably produced (see inset).
As a result, price erosion among key adult products is expected to decline,
allowing patient scale-up to drive adult market size growth going forward.
The initiation of more children onto ART, coupled with greater regimen and
formulation optimization, drove the pediatric market to expand by ~17
percent to US$100 million in 2015. The hitherto widely used and low-cost
pediatric AZT/3TC/NVP has now been deemed “limited-use” by the Inter-
Agency Task Team (IATT). Going forward, its use is expected to decline,
so that the pediatric market value is expected to continue to grow as more
HIV-positive children are put on ART with optimized but more expensive
formulations.
The potential impact of viral load testing on second-line patients is
discussed in later sections. Conservatively, no major change in the
proportion of second-line patients is assumed for market sizing purposes,
albeit the number of second-line patients will undoubtedly grow.
Public data on ARV pricing in generic-inaccessible (GI) markets, such as
Brazil and China, continues to be limited, beyond standardized cost of
2 ‘Generic-accessible’ denotes countries where global generic manufacturers can
register and supply a large proportion of that country’s ARV volume needs. Largest ‘generic-inaccessible’ countries: Argentina, Brazil, China, Mexico
treatment provided in a 2013 report published by the Pan American Health
Organization (PAHO).xiv
Using those figures, CHAI estimates the GI market
in 2015 was US$316 million. Although more recent estimates for the cost
per patient per line of treatment are not available, the WHO has also
reported middle-income countries (mainly Brazil, China, and Eastern
European countries) paying higher prices relative to lower-income
countries because of the lack of access to cheaper generic ARVs.xv
Exhibit 2.2: ARV MARKET SIZE (USD) IN GA COUNTRIES
Cost of treatment generally fell while quality of treatment
improved in GA LMICs
Increased volumes from more countries transitioning to preferred regimens
and optimal formulations has enabled manufacturers to achieve efficiencies
and stimulated further price competition.
As shown in exhibit 2.3, the weighted average prices for first-line and
second-line adult regimens in 2015 have each fallen by ~6 percent from
2014. As countries continued to align with the WHO 2013 Treatment
Guidelines, demand for a consolidated set of products drove prices down
across first- and second-line treatment. Specifically, for first-line, the per
$1,300 $1,520 $1,600
$180
$230 $320
$0
$500
$1,000
$1,500
$2,000
2013 2014 2015
Mar
ket
size
(m
illio
ns)
Generic-inaccessible
Generic-accessible
$1,480M
$1,750M $1,920M
$1,070 $1,300 $1,360
$140
$130 $140
$90
$90 $100
$0
$250
$500
$750
$1,000
$1,250
$1,500
$1,750
2013 2014 2015
Mar
ket
size
(m
illio
ns)
Pediatrics
2L Adults
1L Adults
$1,300
$1,520 $1,600
ARV Prices Levelling Off
Reduced prices of key ARVs over time have lowered the overall cost of treatment. However, as indicated by Global Fund’s Pooled Procurement Mechanism (PPM) reference prices for key first-line adult products, prices for certain products appear to be reaching their lowest commercially sustainable levels. Effectively, it now costs less than US$100 per year to treat an adult first-line patient.
$10.03 $9.69
$9.50
$8.99 $8.45
$7.99 $7.99
$10.03 $9.69
$9.40 $8.99
$8.60
$7.99 $7.99 $8.35 $8.30 $8.30 $8.30 $8.30
$8.05 $8.05
$7.00
$7.50
$8.00
$8.50
$9.00
$9.50
$10.00
$10.50
Jan'15 May'15 Jul'15 Oct'15 Jan'16 Mar'16 Jul'16
Pri
ce/p
ack
(USD
)
TDF/3TC/EFV TDF/FTC/EFV AZT/3TC/NVP

8
ARV Market Report | Clinton Health Access Initiative, Inc.
patient per year (pppy) costs (GA LMIC weighted averages) of the gold-
standard triple FDCs of TDF/3TC/EFV and TDF/FTC/EFV have fallen by
~13 percent. For second-line products, the prices of lopinavir/ritonavir
(LPV/r) and atazanavir/ritonavir (ATV/r) have continued to decrease due to
price competition between the two products as countries increase ATV/r
uptake.
For pediatric treatment, the weighted average price in 2015 was US$124
pppy for first-line and US$206 pppy for second-line, representing a 13
percent increase and 10 percent decrease respectively from 2014. The
increase in first-line per patient per year costs was attributed to more
patients being on optimal formulations, which tend to be more expensive.
Excluding South Africa, the proportion of children on optimal pediatric
formulations increased from 83 percent in 2014 to 94 percent in 2015.
Exhibit 2.3 WEIGHTED AVERAGE MARKET PRICE (USD) FOR
REGIMENS IN GENERIC-ACCESSIBLE COUNTRIES3
Several new products are likely to be introduced in GA LMICs by 2019,
resulting in a range of clinical and cost advantages to current products.
Contingent on uptake, these ARVs, including tenofovir alafenamide
fumarate (TAF), low-dose EFV (EFV400), and dolutegravir (DTG), are
expected to lower the cost of treatment significantly. While these products
will enable programs to put more patients on treatment with lower per
capita spend, cheaper production costs will enable manufacturers to
remain profitable in a growing ARV market. CHAI’s forecast for these
products is discussed in the following sections.
Indian generic manufacturers continue to dominate the
ARV market
In 2015, three Indian generic manufacturers, Mylan4, Cipla, and Hetero
supplied ~70 percent of the GA LMIC ARV market by revenue and
volume.xvi
Other Indian manufacturers like Aurobindo accounted for a
further ~15 percent of revenue and ~19 percent of volume. Non-Indian
generic manufacturers, innovators, and distributors captured ~13 percent
of revenue and volume, primarily driven by Aspen, Sonke (Sun
Pharmaceuticals), and AbbVie. Among innovators, AbbVie continues to
hold the largest market share in terms of volume and revenue, primarily
driven by South Africa’s LPV/r 200/50mg procurements. This analysis
3 Pediatric pppy calculations exclude adult formulations that may be used in
older children 4 Albeit Mylan itself is not India-based, its ARV business was built off its
acquisition of Matrix Labs in 2007, and ARV manufacturing continues to be primarily in India
should be interpreted with caution due to varying levels of reporting of
procurement data from year to year, and because where distributors are
involved, most procurement data does not identify from which
manufacturers they ultimately source product.
Exhibit 2.4: ARV MARKET SHARE IN GA LMICs BY TOP
MANUFACTURERS5
Mylan continued to be among the top three manufacturers for each of the
three most used formulations in LMICs – TDF/3TC/EFV, TDF/FTC/EFV,
and AZT/3TC/NVP (all triple FDCs). Sales for the TDF/3TC/EFV triple FDC
market, used by nearly 5.5 million patients in GA LMICs in 2015, were
dominated by Mylan and Hetero with more than 70 percent of its sales.
However, that picture is likely to change with the USFDA’s delisting of
Hetero’s TDF/3TC/EFV in 2016, which makes the product ineligible for new
orders funded through PEPFAR or the Global Fund.xvii, xviii
Supplier shares
for the TDF/FTC/EFV triple FDC, mostly used in South Africa, were more
distributed, primarily due to South Africa’s practice of splitting key products
across suppliers, as seen in its most recent tender.
5 Analysis excludes procurements where manufacturer was not specified (about
five percent of overall procurement value and volume). Additionally, “Other” category also includes distributors who in turn procure from manufacturers that are not identified. Figures should therefore be interpreted with caution.
$113
$321
$110
$228
$106
$300
$124
$206
$0
$100
$200
$300
$400
1L Adults 2L Adults 1L Peds 2L Peds
Wei
ghte
d a
vera
ge p
pp
y (
USD
) 2014
2015
38% 35%
20% 17%
14% 16%
8% 9% 5% 6%
15% 17%
0%
20%
40%
60%
80%
100%
ARV Market Shareby Revenue
ARV Market Shareby Volume
Mar
ket
Shar
e (
%)
Other
AbbVie
Aurobindo
Cipla
Hetero
Mylan

9
ARV Market Report | Clinton Health Access Initiative, Inc.
Adult Market Trends
Continued growth of adult patients on ART in 2015
Approximately 14.4 million adults received ART in LMICs as of 2015,
reflecting a 13 percent growth from 2014.ix Treatment coverage for adults
living with HIV/AIDS in LMICs also increased from 41 percent at the end of
2014 to 46 percent at the end of 2015. Exhibit 3.1 shows the number of
adults on ART in LMICs through 2015, CHAI’s patient projections, and the
evolution of adult ART coverage in LMICs since 2010. CHAI’s patient
projections are relatively conservative, particularly compared to ambitious
targets like the UNAIDS Fast-Track Targets.xix
Exhibit 3.1 NUMBER OF ADULTS ON ART AND ADULT ART
COVERAGE IN LMICs 6
Within GA LMICs, there were 13.3 million adult patients on ART, a growth
of 1.5 million patients from 2014.Error! Bookmark not defined.
This incremental
growth was similar to the 1.6 million patient increase seen between 2013
and 2014, and was driven, in part, by further adoption of treatment
initiation at CD4 < 500 cells/mm3 with some countries moving toward Test
and Treat and the use of Option B+ for pregnant women with HIV. As of
September 2016, 21 of 22 Global Plan priority countries had adopted
Option B+.xiii
WHO’s guidance on HIV treatment has increasingly
consolidated regimens in LMICs from 2013 to 2015
In an effort to simplify antiretroviral therapy, the WHO’s 2013 Guidelines
reduced the preferred regimens to a single option, TDF + 3TC (or FTC) +
EFV, which could be used across a range of populations as a single-pill
once-daily regimen. In turn, LMICs have made great strides towards
simplifying their national treatment programs, phasing out non-
recommended drugs such as stavudine (d4T) in favor of tenofovir-based
regimens. This progress is reflected in the consolidation of adult first-line
regimens from 2013 to 2015 around the preferred first-line regimen, TDF +
3TC/FTC + EFV, which represented ~70 percent of the adult first-line
patients in GA LMICs in 2015, up ~30 percentage points from 2013.
6 ART coverage for adults calculated based on data available in UNAIDS
AIDSinfo database as of July, 2016 (only includes countries with both ART and PLWHA numbers reported)
Exhibit 3.2 PATIENT GROWTH AND SHARE OF FIRST-LINE ADULT
REGIMENS IN GA LMICs
EFV400 and DTG expected to significantly change current
adult first-line NNRTI market
With countries ramping up TDF use in first-line treatment, EFV uptake also
continues to increase, representing 79 percent of all first-line GA adult
patients (10.1 million patients) by the end of 2015. With EFV being the
preferred NNRTI since the 2013 WHO Guidelines, NVP use is expected to
continue to decline, making up only 9 percent of the NNRTI market in 2020.
As such, EFV600 is expected to be used among the majority of first-line
patients in 2017, after which the NNRTI market may shift towards new
products, such as lower-dose EFV (EFV400) and DTG. Both drugs are
expected to be more tolerable and more affordable than EFV600.
In 2015, continued momentum around accelerating the development and
market availability of EFV400 saw CHAI and the FDA collaborate to
develop a novel regulatory pathway for filing EFV400 as a FDC based on
the results of the Kirby Institute’s ENCORE1 study, which demonstrated
EFV’s non-inferiority at 400 mg (reduced dose) versus 600 mg (approved
dose). Following the FDA’s advice, CHAI’s Product Development Team
(PDT) worked with the Kirby Institute in filing ENCORE1 data as an
Investigational New Drug (IND) application on December 16, 2015. This
IND allows generic suppliers interested in developing the product access to
the clinical data via reference. Additionally, CHAI also worked with a
generic supplier on the first NDA filing for the FDC product,
TDF/3TC/EFV400 (TLE400), which was submitted in mid-2016 and is
currently under FDA review. Several other suppliers have also expressed
interest in filing an NDA. Availability of a SRA-approved TLE400 is
expected in mid- to late-2017.
Furthermore, the 2015 WHO Guidelines included EFV400 as an alternative
option in first-line. Pharmacokinetic (PK) studies in pregnant women and
TB co-infected patients for EFV400 are also underway. If the results show
an insignificant change in EFV levels in these patients, the WHO should be
able to suggest this option as a preferred regimen without restrictions in its
next guidelines release.
21% 26%
31% 36%
41% 46%
0%
10%
20%
30%
40%
50%
0.0
5.0
10.0
15.0
20.0
25.0
AR
T co
vera
ge f
or
adu
lts
PLW
HA
(%
)
Nu
mb
er o
f p
atie
nts
(m
illio
ns)
LMIC Total Adults on ART (actual/projected)
ART Coverage for Adult PLWHA (%)
19% 29%
43% 20%
32%
29%
27%
20%
16%
33%
19%
12% 10.0
11.6
12.9
0.0
2.0
4.0
6.0
8.0
10.0
12.0
14.0
2013 2014 2015
Nu
mb
er o
f P
atie
nts
(m
illio
ns)
Other
AZT + 3TC + NVP
TDF + FTC + EFV
TDF + 3TC + EFV

10
ARV Market Report | Clinton Health Access Initiative, Inc.
Exhibit 3.3 PATIENT GROWTH AND SHARE OF FIRST-LINE
NNRTI/INSTI MARKET IN GA LMICs7
Dolutegravir (DTG) is an integrase inhibitor (INSTI) that was approved by
the US FDA in 2013. It has shown non-inferiority or superiority, and better
tolerability than EFV and PIs.xx
Some advantages of the drug include a
shorter time to viral suppression, a higher genetic resistance barrier, long
half-life, low-cost, and low dosing requirements. DTG is recommended as
an alternate for first-line adults in the 2015 WHO Guidelines.
7 Shares may not sum exactly to 100 percent due to rounding
DTG was developed by ViiV as a single tablet (Tivicay) or as a FDC with
ABC and 3TC (Triumeq). Botswana recently signed an agreement with ViiV
to purchase DTG singles in the largest tender secured by the company in
sub-Saharan Africa.xxi
Botswana also included DTG in its official ART
guidelines.xxii
According to the US ambassador to Botswana, adoption of
DTG could prevent 120,000 new HIV infections and save 55,000 lives over
the next 15 years.xxiii
Several other countries like Cambodia, Kenya,
Nigeria, Tanzania, and Zimbabwe have included or plan to soon include
DTG in their national treatment guidelines.
Aurobindo Pharma received tentative FDA approval for the DTG singles on
September 22, 2016 and intends to launch the product in sub-Saharan
Africa in late 2016.xxiv
Initial adoption is likely to be as a replacement for
single NVP or EFV use amongst first-line among patients who already take
two pills a day (e.g., those on AZT/3TC + EFV or TDF/3TC + NVP). CHAI
estimates that there were ~1.2 million such patients in GA LMICs at the
end of 2015. Generic manufacturers are also working towards filing for a
one-pill, once-per-day FDC of TDF/3TC/DTG (TLD) with the FDA, with
availability expected as early as H2 2017.
As shown in Exhibit 3.3, DTG is expected to start surpassing EFV400
uptake in 2019, representing 35 percent of the adult first-line NNRTI/INSTI
market in 2020 (i.e. ~7 million patients). After 2020, it is expected that DTG
will be the third position drug of choice, and most remaining efavirenz use
will be in the form of TLE400. It should be noted that DTG uptake will be
contingent on the price of TLD relative to TLE400, and CHAI’s forecast
assumes TLD’s price will be at least 10 percent lower than TLE400.
Tenofovir-based ARVs expected to be the backbone of
choice for first-line regimens
TDF comprised 77 percent of the first-line NRTI market in GA LMICs, with
~9.9 million first-line adult patients on TDF-based regimens at the end of
2015. Continued use of AZT in first-line is attributed to stable patients who
were already initiated on AZT. However, with the increasing use of TDF in
first-line, AZT share is expected to decline.
Tenofovir alafenamide fumarate (TAF), a potential alternative to TDF, is a
tenofovir prodrug that offers high antiviral efficacy and an improved renal
and bone safety profile at much lower doses than TDF.xxv
As of August
2016, Gilead has received FDA approval on three TAF-containing FDCs,
i.e. the “Quad”8 in November 2015
xxvi, TAF/FTC/RPV in March 2016
xxvii, and
TAF/FTC in April 2016.xxviii
Additionally, Gilead filed an NDA for the TAF
25mg singles with the FDA, but only for the adult hepatitis B indication.xxix
The first generically-available TAF FDC is expected to launch in early- to
mid-2018. Assuming certain API production steps can be optimized by
generic companies, it is expected that TAF will be significantly less
expensive than TDF since the required dose is about 10-fold lower.
Additionally, the University of the Witwatersrand is about to embark on the
ADVANCE study to generate clinical data on the TAF/FTC/DTG
combination. Sub-studies will address issues such as the use of the new
drugs in rifampicin-containing TB regimens, pregnancy, and adolescents.
The trial should start enrolment by year end with results expected in mid-
2018, which will hopefully support inclusion of TAF/XTC/DTG as the
preferred regimen in the subsequent WHO Guidelines in 2019.
There will likely be some uptake in the latter half of 2019 when TAF may
first be included in the WHO Guidelines, and by the end of 2020 it is
8 The TAF “Quad” is an FDC of elvitegravir, cobicistat, FTC, and TAF (E/C/F/TAF)
69% 79%
82% 84% 71% 51%
33%
31% 21%
18% 15%
13%
11%
9%
6% 20%
35%
1% (EFV400) 11% 18% 23%
11.6 12.9
14.4 15.9
17.3 18.7
20.1
0.0
2.0
4.0
6.0
8.0
10.0
12.0
14.0
16.0
18.0
20.0
22.0
2014 2015 2016 2017 2018 2019 2020
Nu
mb
er o
f P
atie
nts
(m
illio
ns)
EFV400
DTG
NVP
EFV600
Note: Includes use as FDCs
11
ARV Market Report | Clinton Health Access Initiative, Inc.
projected to garner up to 10 percent of the first-line NRTI market in GA
LMICs, or two million patients. TDF is expected to remain the dominant
drug that year, maintaining 80 percent of the first-line market. However, in
subsequent years, TAF is expected to almost completely replace TDF due
to its price and clinical advantages.
Exhibit 3.4 PATIENT GROWTH AND SHARE OF FIRST-LINE NRTI
MARKET IN GA LMICs9
Use of FTC limited outside South Africa
As of 2015, use of FTC is almost entirely concentrated in South Africa.
Although both 3TC and FTC were advertised in South Africa’s current
tender valid through March 2018, FTC was favored for the lucrative first-
line TDF/XTC/EFV segment.xxx
South Africa represented the largest
proportion of adult patients on FTC in GA LMICs. Botswana is the next
largest user of FTC, with its treatment guidelines now recommending use
of DTG with TDF/FTC in first-line. Tanzania is the third largest user of FTC,
albeit with less than 10 percent of its adult first-line patients on FTC.
Zambia, which had the largest number of patients on FTC outside of South
Africa in 2014, and Nigeria, fully transitioned to 3TC in 2015. Although FTC
production costs have hitherto been higher than for 3TC, the net price to
procurers appears to have evened out for the triple FDCs (e.g. Global
Fund’s PPM price for TEE and TLE are both US$7.99/pack as of Q3 2016).
It is also important to note that Gilead’s filings with the FDA for the HIV
indication are for TAF FDCs rather than the single, all including FTC and
not 3TC. The filing for stand-alone TAF was only for the Hepatitis B
indication. Whether or not TAF/3TC formulations are developed and
approved, will significantly impact FTC usage after 2018, when TAF is
expected to be generically available and used widely.
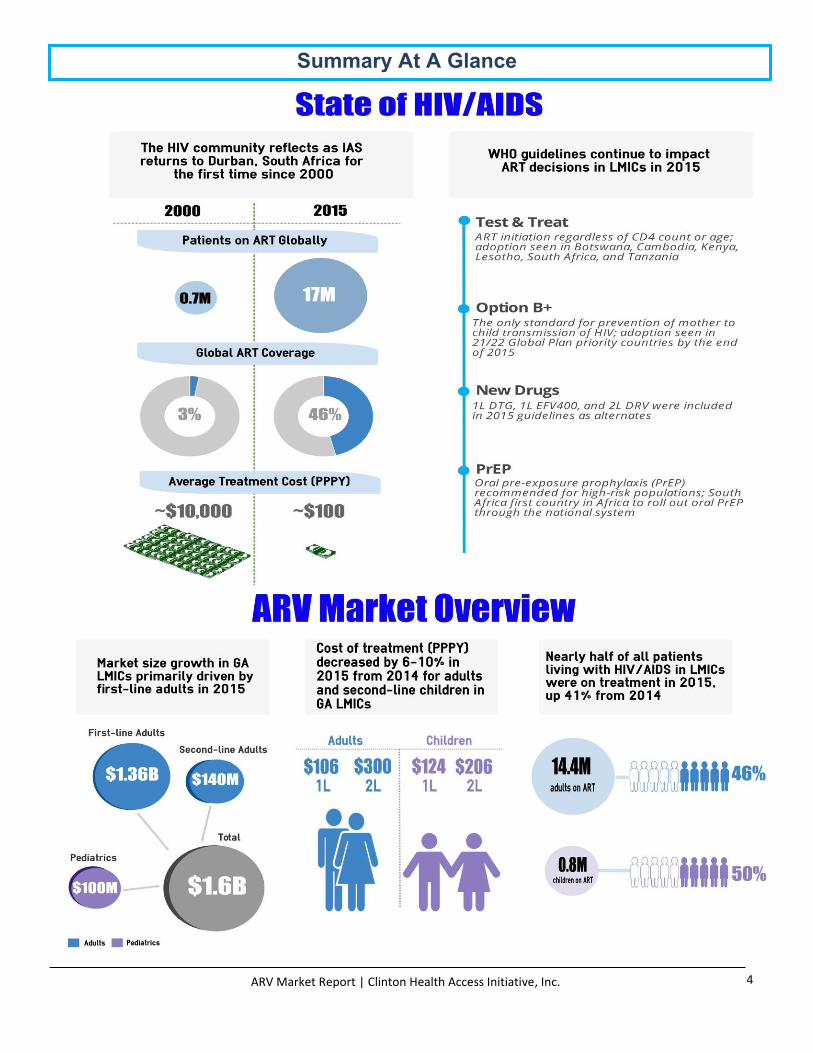
Use of triple FDCs in first-line continues to grow
In 2015, the top five adult formulations by volume were the triple FDCs of
TDF/3TC/EFV, TDF/FTC/EFV, and AZT/3TC/NVP, the AZT/3TC dual FDC,
and EFV 600mg singles. Based on CHAI estimates, over 90 percent of all
adults in GA LMICs were on at least one of these formulations at the end of
2015.
As shown in Exhibit 3.6, the TDF/3TC/EFV and TDF/FTC/EFV triple FDCs
represented the largest share of the market by revenue, representing
nearly two-thirds of the overall adult GA LMIC market value. Corresponding
to the sparse use of FTC outside of South Africa, it is the TDF/3TC/EFV
9 Shares may not sum exactly to 100 percent due to rounding
triple FDC that has the lion’s share. The LPV/r dual FDC does not appear
in the top five formulations by volume but does comprise 5 percent of the
market by revenue due to its relatively high price of US$219 pppy (GA
LMIC weighted average).
Exhibit 3.5 TOP FIVE ADULT FORMULATIONS BY PATIENT VOLUME
IN GA LMICs, 2015
Exhibit 3.6 TOP ADULT FORMULATIONS BY REVENUE IN GA LMICs,
2015
TDF+3TC+EFV, TDF+FTC+EFV, and AZT+3TC+NVP are the three main
adult regimens where a triple FDC is available for use in GA LMICs. In
countries where CHAI has access to aggregate patient data at the
formulation level, nearly all patients on these regimens are on the triple
FDC rather than dual + single or singles (triple FDCs are not available for
those on TDF+3TC+NVP or AZT+3TC+EFV regimens, so they are
necessarily on dual + singles). Although the data is not inclusive of all
usage in LMICs, this trend suggests significant progress towards reducing
the pill burden for patients.
ATV/r expected to continue growing vs. LPV/r; strong
potential of DRV/r dependent on price
In 2015, 22 percent of adult second-line patients were estimated to be on
ATV/r. India, Malawi, and Zimbabwe continued to have the highest
individual market shares for ATV/r with more than 80 percent of their
second-line adult patients at the end of 2015. Additionally, Kenya began
initiating new second-line patients on ATV/r in 2015. Despite these positive
developments, ATV/r uptake grew at a slower rate between 2014 and 2015
relative to the 10 percent jump observed from 2013 to 2014. Albeit previous
supply issues were resolved in late 2014, and no supply issue was
reported in 2015, it is possible that there are holdover concerns that slowed
uptake of ATV/r during the course of 2015.
72% 77%
81% 85%
87% 88% 80%
27% 22%
17% 14%
12% 11% 9%
1% (ABC)
1% (ABC)
1% (ABC)
1% (ABC)
1% (ABC)
1% (ABC) 1% (ABC)
1% (TAF) 10%
11.6 12.9
14.4 15.9
17.3 18.7
20.1
0.0
2.0
4.0
6.0
8.0
10.0
12.0
14.0
16.0
18.0
20.0
22.0
2014 2015 2016 2017 2018 2019 2020
Nu
mb
er o
f p
atie
nts
(m
illio
ns)
TAFd4TABCAZTTDF
5.5
3.7
2.1 0.9 0.8
0.0
1.0
2.0
3.0
4.0
5.0
6.0
TDF(300)/3TC(300)/EFV(600)
TDF(300)/FTC(200)/EFV(600)
AZT(300)/3TC(150)/NVP(200)
AZT(300)/3TC(150)
EFV(600)
Nu
mb
er o
f p
atie
nts
(m
illio
ns)
TDF(300)/ 3TC(300)/ EFV(600),
41%
TDF(300)/ FTC(200)/ EFV(600),
24%
AZT(300)/ 3TC(150)/ NVP(200),
14%
LPV/r(200/50), 5%
AZT(300)/ 3TC(150),
4%
Other, 11%

12
ARV Market Report | Clinton Health Access Initiative, Inc.
55%
68%
45%
32%
0% 20% 40% 60% 80% 100%
Mar. 2016
Nov. 2015LPV/r
ATV/r
ATV/r use for second-line patients is expected to grow and ultimately
surpass LPV/r use by 2020, reaching 54 percent market share by 2020,
especially as countries continue to adopt ATV/r as the preferred PI and
overcome uptake barriers. Swaziland and Vietnam have begun transitions
to ATV/r in 2016. South Africa may also potentially adopt ATV/r through its
next tender in 2018, in part due its experience with LPV/r supply
constraints in 2015 with reliance on a sole supplier. Other high-volume
countries that currently include only LPV/r as the preferred option in their
adult treatment guidelines include Zambia, Mozambique, and Botswana.
Exhibit 3.7 PATIENT GROWTH AND SHARE OF SECOND-LINE PI
MARKET IN GA LMICs10
Darunavir (DRV) is a PI that can be used in place of LPV or ATV. The
combination of darunavir and ritonavir (DRV/r) was formally recommended
in the 2015 WHO Guidelines as an alternative second-line regimen (it was
a footnote mention in 2013). However, it is currently not available as a
heat-stable FDC. In terms of safety and efficacy, DRV/r has shown
superiority or non-inferiority over other PIs in multiple clinical trials and has
a favorable resistance profile.xxxi
Contingent on availability of a FDC at a
competitive price, DRV/r has the potential to play an important role in
10
Shares may not sum exactly to 100 percent due to rounding
second-line treatment. In particular, it could serve as a long-needed
alternative to LPV/r for TB co-infected patients taking rifampicin (for whom
ATV/r is contraindicated). A generic FDC of DRV/r is expected to be
available in LMICs sometime in early 2018 as a 400/50mg formulation (two
pills for once daily dosing of 800/100mg). CHAI is working with several
partners in a multi-pronged approach to address the current high price of
DRV/r relative to LPV/r.
AZT expected to become the predominant NRTI in 2L as
TDF use in 1L increases
In 2015, TDF comprised 57 percent of the second-line NRTI market, while
AZT comprised 29 percent (Exhibit 3.8). There was a small proportion of
patients on ABC, but this is expected to decline over time. As tenofovir-
based backbones become predominant in first-line, their share of second-
line adult treatment is expected to decline in future years, with AZT’s
second-line share conversely increasing. This inversion of market shares is
unlikely to happen concurrently given that patients may be on first-line
treatment for several years before being switched to second-line, so TDF
share may appear to be high across both lines for a few more years.
Exhibit 3.8 PATIENT GROWTH AND SHARE OF SECOND-LINE
NRTI/INSTI MARKET IN GA LMICs10
In addition to use in first-line, DTG may also compete in the second-line
adult market in combination with PIs, replacing both the AZT+3TC and
TDF+XTC backbones. However, second-line use of DTG was not included
in the 2015 WHO Guidelines, and thus not included in CHAI’s forecast.
Several manufacturers are pursuing key new products
Many manufacturers are aggressively working toward SRA filings for key
pipeline products. Exhibit 3.9 below summarizes projected timelines for
each product per CHAI’s supplier intelligence at the time of publication.
Exhibit 3.9 TENTATIVE TIMELINES FOR NEW PRODUCT SRA
APPROVALS11
2016 2017 2018
H2 H1 H2 H1 H2
DTG
TLD
TLE400
TAFxD
DRV/r
11
Assumes SRA approval received 9-12 months after filing date. Based on best
available information of filing timelines as of October 2016.Subject to change
80% 78% 68% 60% 55% 50% 46%
20% 22%
33% 40%
45% 50%
54%
0.4 0.5
0.6
0.7
0.8
0.8 0.9
0.0
0.2
0.4
0.6
0.8
1.0
2014 2015 2016 2017 2018 2019 2020
Nu
mb
er o
f p
atie
nts
(m
illio
ns)
ATV/r
LPV/r
Note: DRV/r uptake highly dependent on pricing
57% 44% 35% 28% 24% 20%
29% 47%
59% 67%
73% 77%
14%
9%
6%
6%
4%
3%
0.5
0.6
0.7
0.8
0.8 0.9
0.0
0.2
0.4
0.6
0.8
1.0
2015 2016 2017 2018 2019 2020
Nu
mb
er o
f p
atie
nts
(m
illio
ns)
ABC
AZT
TDF
Expected SRA approval of distinct generic suppliers
13
ARV Market Report | Clinton Health Access Initiative, Inc.
Pediatric Market Trends
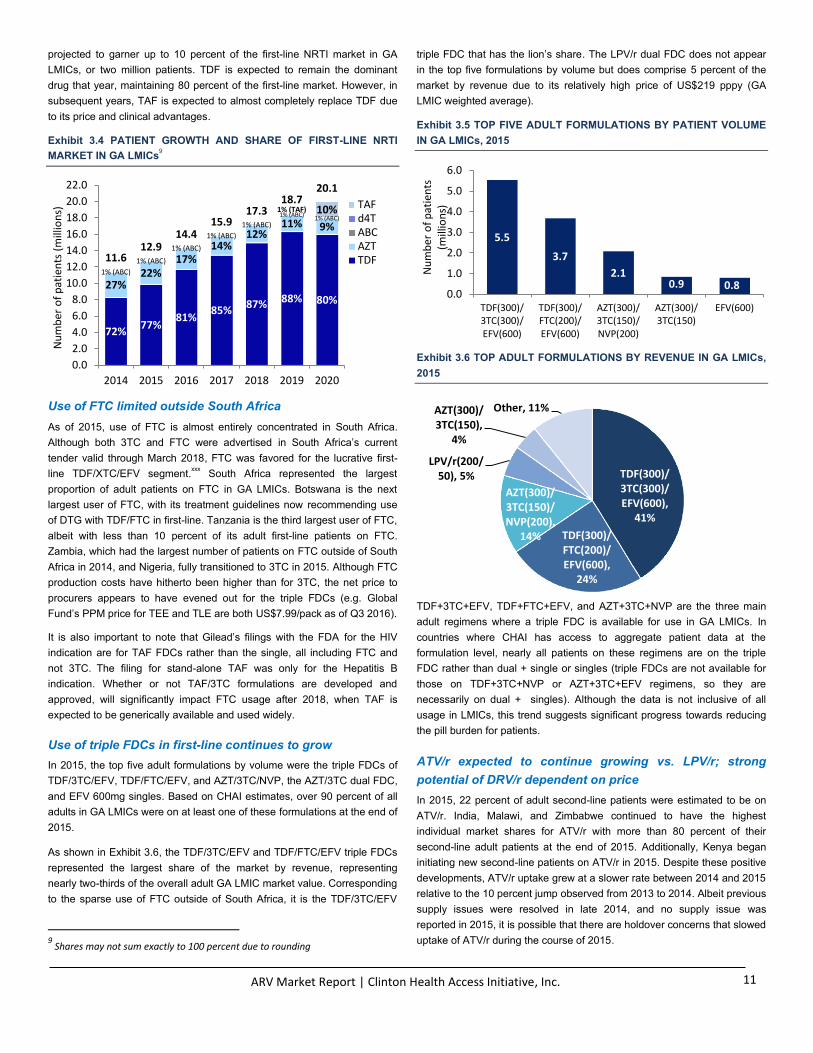
49 percent of children living with HIV globally
were on treatment as of 2015
By the end of 2015, 1.8 million children globally were living with HIV. New
infections decreased from 160,000 in 2014 to 150,000 in 2015. Overall,
thanks in large part to successful prevention of mother-to-child
transmission of HIV (PMTCT) efforts, the number of HIV infections has
decreased significantly since 2000, when 490,000 new HIV infections were
occurring annually. However, more work remains to be done to put an end
to the 400 new pediatric infections occurring daily, most of which are
occurring in sub-Saharan Africa.xxxii
Exhibit 4.1 NUMBER OF PEDIATRIC PATIENTS ON ART IN LMICs,
AND PEDIATRIC ART COVERAGE IN LMICs12
Worldwide, over 870,000 children living with HIV were on ART at the end of
2015, marking a 49 percent coverage rate. Coverage rates have steadily
increased over the years; only 21 percent of children living with HIV/AIDS
were on treatment in 2010.xxxiii
As shown in Exhibit 4.1, CHAI conservatively
expects a little over one million children on treatment in all LMICs by 2020.
Continued work from PEPFAR and CIFF’s Accelerating Children’s
HIV/AIDS Treatment (ACT) Initiative and other international programs will
likely shape the market growth as well. By September 2015, ACT helped
double the number of children who received testing and counseling from
2.1 million in 2014 to 4.3 million in 2015. In addition, ACT provided ARV
funds for 489,000 children in 2015.xxxiv
12
ART coverage calculated based on UNAIDS AIDSinfo database as of August,
2016 (only includes countries with both ART and PLWHA numbers reported). Country income classification per the World Bank, July 2016
The IATT optimal formulary was updated in 2016
The Interagency Task Team on Prevention and Treatment of HIV Infection
in Pregnant Women, Mothers, and their Children (IATT) developed a list of
preferred pediatric formulations in an effort to improve pediatric ARV supply
security by consolidating the market around a limited number of key
products that offer the highest standard of care for children of all weight
bands and ages. Using the 2015 IATT classifications, CHAI estimated the
proportion of pediatric patients who are on regimens comprised of all
optimal or other formulations. The analysis, shown in Exhibit 4.2, only
includes children who were on IATT-reviewed formulations and excludes
South Africa. Of the included children, 94 percent were on all optimal
formulations in 2015, up from 83 percent in 2014.
Exhibit 4.2 FORMULATION BREAKDOWN OF PEDIATRIC REGIMENS
IN GA LMICs (EXCLUDING RSA) BY IATT STANCE, 2015
A revised list was released in 2016 with several changes including only
classifying products as “optimal” if they constituted a preferred regimen per
2015 WHO Guidelines for first- and second-line treatment. Consequently,
AZT/3TC/NVP 60/30/50mg dispersible and scored tablets, the most widely
used pediatric formulation, were moved from the optimal list to the limited-
use list. Notable additions to the optimal list include LPV/r 40/10mg oral
pellets and RAL 100mg scored tablets. Products added to the limited-use
list are RTV 25mg tablets, RAL 25mg tablets, and 3TC 50mg/5mL oral
solution. The update also saw several formulations moved from the limited-
use to the non-essential list: TDF 200mg tablets, ATV 150mg tablets, ETR
25mg tablets, and ETR 100mg tablets. The 2016 IATT optimal list is in
Appendix C.
AZT and ABC will continue to dominate the
pediatric NRTI market
AZT and ABC were the most common NRTIs used to treat pediatric
patients in 2015. Conversely, TDF continued to be a small percentage of
the market in 2015. d4T has largely been phased-out, having been used to
treat less than 0.5 percent of pediatric patients in 2015, down from 19
percent in 2013 and 4 percent in 2014.
Per 2015 WHO Guidelines, AZT is only a preferred first-line option for
patients under the age of 3, and is an alternate recommendation for other
age groups, whereas ABC is preferred for all children 10 years and
younger. CHAI estimates that 51 percent of pediatric patients were on AZT
in 2015, down from 59 percent in 2014. The decrease in market share of
AZT is expected to continue in the coming years, with 41 percent of
patients forecasted to be on an AZT regimen by 2020. Countries like
Nigeria, Malawi, Vietnam, and Zimbabwe had more than 90 percent of their
patients on AZT regimens in 2015. By 2020, Lesotho, Swaziland,
21% 26%
32% 38%
44% 50%
0%
10%
20%
30%
40%
50%
60%
70%
0.0
0.2
0.4
0.6
0.8
1.0
1.2
AR
T co
vera
ge,
ped
. PLW
HA
(%
)
Nu
mb
er o
f p
atie
nts
(m
illio
ns)
LMIC Total Children on ART (actual/proj.)ART coverage for ped. PLWHA (%)
All Optimal, 94%
All Non-Essential,
3%
Mixed, 2%
All Pediatric Patients
UNAIDS updates its prevalence estimates
In 2016, UNAIDS revised its Spectrum epidemiology software model to account for recent study data. Changes included the addition of recent mother-to-child transmission probabilities and the use of new data from International Epidemiologic Databases to Evaluate AIDS (IeDEA) on age distribution of children initiating ART. The changes resulted in dramatically lower estimates for the number of children living with HIV across most countries. Effectively, pediatric ART coverage rates are significantly higher than previously thought.

14
ARV Market Report | Clinton Health Access Initiative, Inc.
Tanzania, Uganda, and Vietnam are expected to see the largest AZT
regimen market share drops of more than 30 percentage points each.
Nigeria and Zimbabwe are forecasted to see smaller changes, still retaining
over 75 percent of their patients on AZT by 2020.
The market share of ABC increased to 46 percent in 2015, with countries
like Kenya, South Africa, and Zambia having more than 60 percent of their
pediatric population on ABC-based regimens in 2015. ABC is projected to
represent a little more than half of the NRTI market by 2017.
TDF still retains a small percentage of the overall pediatric NRTI market in
GA LMICs, representing ~2 percent in 2015. TDF’s market share is
expected to hover at that level over the coming years. While TDF is
recommended for those patients greater than the age of 10 and weighing
more than 35kg, uptake is low due to a lack of appropriate generic
formulations or fixed-dose combinations. Zambia, at about 27 percent, was
the only country that had more than 10 percent of pediatric patients on TDF
in 2015, although this is expected a decline to 18 percent by 2020.
Exhibit 4.3 PEDIATRIC NRTI MARKET IN GA LMICS13
LPV/r expected to maintain market share as EFV
slowly takes share from NVP
Although no longer recommended by the WHO as part of a preferred
regimen, NVP use remains high due to the availability of AZT/3TC/NVP
triple dispersible FDC at a relatively low price. In 2015, NVP had an
estimated 49 percent share of the NNRTI/PI market. This is forecasted to
decrease to 38 percent by 2020. As mentioned before, the dispersible triple
FDC is no longer on the IATT’s optimal formulary. As such, several high-
volume countries are anticipated to see a decrease in their NVP market
share by more than 30 percentage points by 2020 including India, Ethiopia,
and Uganda. Further guideline changes from countries could mean even
greater shifts away from NVP toward EFV, which the WHO currently
recommends as the preferred 1L NNRTI for patients above the age of 3
years old. In 2015, 28 percent of patients were estimated to be on EFV and
this is forecasted to increase by a further 8 percentage points by 2020.
Ethiopia, India, and Uganda, the same countries forecasted to see a
decrease in the NVP regimen use, are anticipated to scale-up EFV.
The PI LPV/r, which is a recommended first-line drug for children younger
than 3, was estimated to have a market share of 23 percent in 2015, up
13
Shares may not sum exactly to 100 percent due to rounding
from 20 percent in 2014. CHAI forecasts LPV/r share to slowly increase
over the coming five years. Until recently, adoption of LPV/r had been
hampered by the cold-chain limitations for the oral solution formulation. As
more countries adopt heat-stable LPV/r oral pellets, however, there could
be an even greater increase in LPV/r’s share of the market. At the same
time, a decreasing overall population of patients aged 3 or less (due to
successful Option B+ roll-out) will likely cap the patient number growth.
Exhibit 4.4 PEDIATRIC NNRTI/PI MARKET IN GA LMICs14
14
Shares may not sum exactly to 100 percent due to rounding
59% 51% 48% 46% 44% 42% 41%
35% 46% 49% 51% 53% 54% 56% 4% 2%
2% 3%
4% 4% 3% 3%
737 766 830
894 945 1,002
1,040
0
200
400
600
800
1,000
1,200
1,400
2014 2015 2016 2017 2018 2019 2020
Nu
mb
er o
f p
atie
nts
(th
ou
san
ds)
TDF
d4T
ABC
AZT
20% 23% 24% 24% 25% 25% 26% 24%
28% 31% 32% 34% 35% 36% 56%
49% 46%
43% 41%
40% 38% 737 766 830
894 945
1,002 1,040
0
200
400
600
800
1,000
1,200
1,400
2014 2015 2016 2017 2018 2019 2020N
um
ber
of
pat
ien
ts (
tho
usa
nd
s)
NVP
EFV
LPV/r
15
ARV Market Report | Clinton Health Access Initiative, Inc.
Market shaping initiatives and partnerships
continue to support the pediatric market
Unlike the large scale of the adult ARV market, which is 94 percent of the
overall ARV market, the pediatric market is small and requires additional
support to ensure supply security and development of better products.
International collaborations directed at strengthening the pediatric market
include:
The APWG, which evolved from the Pediatric ARV Procurement
Working Group (PAPWG) in 2016. Since 2011, PAPWG, with the
support of UNITAID and CHAI, has played an important role in
coordinating the majority of pediatric ARV volumes and bringing
together many global partners together. Due to the success of the
group, the focus has been expanded to include low-volume adult
ARVs, and the name has been changed to the ARV Procurement
Working Group (APWG). More details can be found here.
PHTI, which continues to pursue the development of optimal
ARVs. The Paediatric HIV Treatment Initiative (PHTI) is a joint
collaboration of CHAI, the Drugs for Neglected Diseases Initiative
(DNDi), the Medicines Patent Pool (MPP), and UNITAID. PHTI seeks
to accelerate availability of optimal pediatric formulations by
addressing technical, patent, market, and other challenges. Current
products of focus include ABC/3TC/EFV triple FDC, ABC/3TC/LPV/r
(“4in1”), DRV/r, and DTG/XTC/TAF.xxxv
New WHO guidelines for EID testing will
significantly increase testing coverage, case
finding, and linkage to treatment
Despite a substantial increase in access to early infant diagnosis (EID)
testing in recent years, it is estimated that only 66 percent of the tests
needed for HIV-exposed infants born in developing countries were met in
2015. Even for those infants who receive EID testing, turnaround time
(TAT) for results can take up to several months. During this time, only 22-
38 percent of HIV-positive infants are initiated on treatment.xxxvi
Evidence
suggests that in some settings, loss-to-follow up (LTFU) of infants can be
as high as 34 percent at 3 months and 78 percent by the first year in a
population whose mortality for in-utero infections peaks at 2-3 months of
age.xxxvii
While continued system strengthening is required to improve EID
coverage, the 2016 Consolidated Guidelines on the Use of Antiretroviral
Drugs for Treating and Preventing HIV Infection make four key new
recommendations for EID testing, which when implemented will increase
testing coverage, case finding, and linkage to treatment. The new
recommendations are:
Addition of nucleic acid testing (NAT) at birth to existing EID testing
approaches can be considered to identify HIV infection in HIV-
exposed infants (conditional recommendation, low-quality
evidence).
NAT technologies that are developed and validated for use at or
near to the point of care can be used for early infant HIV testing
(conditional recommendation, low-quality evidence).
In generalized epidemic settings, infants and children with unknown
HIV status who are admitted for inpatient care or attending
malnutrition clinics should be routinely tested for HIV (strong
recommendation, low-quality evidence).
In generalized epidemic settings, infants and children with unknown
HIV status should be offered HIV testing in outpatient or
immunization clinics (conditional recommendation, low quality
evidence).
The first recommendation for testing at or near birth addresses two issues
that result in increased LTFU: 1) testing at birth or near birth will capture
mothers who might not otherwise return for a 6-week visit thereby
increasing coverage and 2) earlier testing, particularly given long TATs for
test results, will provide more time for infants to receive test results and be
initiated on treatment before the peak mortality at 2-3 months of age.xxxviii
Implementing universal testing at or near birth could double the need for
EID tests.
The second recommendation for point-of-care (POC) EID testing
represents the biggest opportunity to reduce TATs and increase linkage to
treatment. Pilot studies conducted in Malawi and Mozambique demonstrate
that POC, compared with the current standard of care using conventional
EID technology, reduces TATs and increase patient initiation.xxxix,xl
Implementing POC would not directly affect total testing volumes, although
it could have an indirect effect by facilitating testing at additional entry
points. However, POC has been shown to significantly improve linkage to
treatment, which could increase pediatric ART coverage.
The third recommendation for generalized screening at entry points outside
of the PMTCT cascade of infants whose exposure status is unknown,
represents an opportunity to test infants who would not otherwise be
identified and potentially reduce the cost per infant identified. Studies have
shown that the proportion of positive infants presenting at inpatient wards
and nutrition centers is four to six times more than the proportion of positive
infants in routine PMTCT screening.xli,xlii
These results suggest that with modest increases in EID testing volumes a large number of positive infants
could be identified and linked to treatment.
The fourth recommendation for screening children with unknown HIV status
at outpatient and immunization clinics represents an opportunity to reach
children earlier at very high volume entry points, however with a lower
proportion of positive infants. These strategies could somewhat increase
the EID volumes, but might actually have a larger impact on adult
screening with RDT if the infants accompanying parent is screened to
identify exposure prior to providing an EID test to the infant.
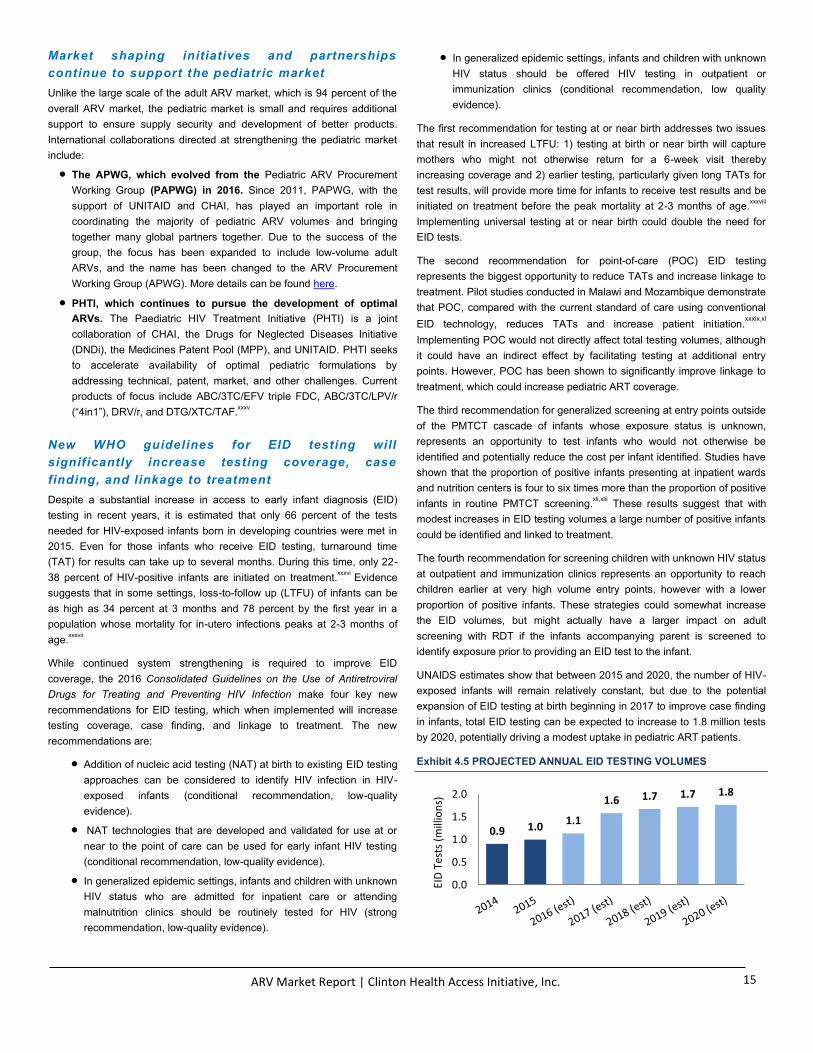
UNAIDS estimates show that between 2015 and 2020, the number of HIV-
exposed infants will remain relatively constant, but due to the potential
expansion of EID testing at birth beginning in 2017 to improve case finding
in infants, total EID testing can be expected to increase to 1.8 million tests
by 2020, potentially driving a modest uptake in pediatric ART patients.
Exhibit 4.5 PROJECTED ANNUAL EID TESTING VOLUMES
0.9 1.0 1.1
1.6 1.7 1.7 1.8
0.0
0.5
1.0
1.5
2.0
EID
Tes
ts (
mill
ion
s)

16
ARV Market Report | Clinton Health Access Initiative, Inc.
The Future of HIV/AIDS
Viral load implementation may increase second-line
patients; more data is needed
In the 2016 Consolidated Guidelines on the Use of Antiretroviral Drugs for
Treating and Preventing HIV Infection, the WHO made a recommendation
to use routine HIV viral load (VL) testing to monitor the effectiveness of
ART treatment in patients. Viral load testing measures the quantity of virus
in a patient’s blood, the results of which can be used by c linicians to
evaluate the effectiveness of treatment in conjunction with the patient’s
adherence. The guidelines also recommend dried blood spot (DBS) using
capillary whole blood to determine HIV VL at a threshold of 1,000 copies/µl.
Additionally, the WHO now recommends that CD4 monitoring can be
stopped in individuals who are stable on ART and virally suppressed. In
September 2014, Roche, South Africa, the Global Fund, PEPFAR, and
CHAI announced a US$9.40 Global Access Price for viral load reagents
and proprietary consumables, which supported efforts to accelerate scale-
up.xliii
In mid-2015, the Global Fund published the results of its viral load
tender, which quoted pricing from diverse suppliers such as Abbott,
BioMérieux, Cepheid, Hologic, Roche, and Qiagen, yielding further price
reductions and transparency around scale-up costs that can be accessed
by countries.
Several countries in sub-Saharan Africa, including Botswana, Kenya,
Malawi, Namibia, Rwanda, South Africa, and Uganda, already have public
sector viral load programs with high patient coverage. More recently,
Swaziland, Zambia, and Zimbabwe have made progress scaling up
national viral load testing programs. Other countries, including Ethiopia,
Nigeria, and Tanzania have launched HIV VL programs and are testing
specimens, but are still working to generate the higher volumes, including
strengthening sample transportation, supply chain, and demand generation
activities. Outside of sub-Saharan Africa, India is expected to launch a
major tender to support national scale-up this year, and Brazil already has
a well-established viral load testing program.
Routine viral load monitoring should provide a means of detecting cases of
treatment failure earlier and more accurately than clinical or immunological
monitoring alone, while providing opportunities to strengthen adherence to
first-line regimens.xliv
Still, there are very few studies on the impact of viral
load testing on the number of patients on second-line ART, particularly at a
national program level. However, it is expected that as access to HIV VL
increases more patients will be moved to second-line regimens.
Increasing investments in HIV diagnosis is a cost-efficient
way to achieve universal access to effective treatment
In July 2016, UNAIDS reported that less than 60 percent of people infected
with HIV currently know their status.xlv
This highlights a significant gap with
the Fast-Track 90-90-90 targets and the need for renewed efforts to identify
90 percent of PLHIV and link to treatment at least 90 percent of those
diagnosed by 2020. While HIV testing services have expanded
exponentially over the last decade, mainly at the facility level, a large
portion of PLHIV don’t have access to these services as they live in remote
or rural areas or don’t want to attend health care facilities. xlvi
In addition, as
more people are initiated on treatment and ART coverage rates increase, it
will become more difficult to find the remaining PLHIV, especially if they are
not seeking health services. This will require more targeted testing
approaches to maximize testing yields and minimize increases to testing
volumes.
A few countries have started revising their HIV testing services (HTS)
strategies to define testing targets across entry points both at health
facilities and in the community. This modeling shows that prioritizing higher
yielding testing strategies and targeting interventions may not prevent a
decline in testing yields as we reach 2020 targets, as more and more
PLHIV are initiated on ART. Therefore increased investments may be
necessary to fund the additional commodities needed to initiate at least 81
percent of clients on ART as well as to fund the testing strategies required
to expand the reach of HTS. These strategies, such as index testing or
other forms of targeted community based testing where support services to
ensure linkage to care will be important, are likely to be more expensive
than facility based testing on a cost-per-test basis.
A preliminary forecast across six countries in sub-Saharan Africa predicts
that testing volumes will have to double by 2020 if countries maintain
current levels of testing efficiency or increase by 68 percent with more
targeted testing strategies ensuring higher yields.xlvii
Exhibit 5.1 HIV RDT FORECAST FOR SIX SUB-SAHARAN AFRICA
COUNTRIES
Despite a need to increase resources allocated to HIV testing, it is
important to put HTS costs in perspective with overall HIV programming
costs. Preliminary evidence from select countries which have costed
revised HTS strategies suggest that all-inclusive costs per test vary
between US$4.20 and US$5.25 over 2016-2020, and all-inclusive costs per
identified PLHIV range between US$60 and US$148 over the same period.
Exhibit 5.2 AVERAGE COSTS OF TESTING ACROSS TWO SUB-
SAHARAN AFRICA COUNTRIES
34 38 41 46
52
71
30 33 37 42
57
5.9%
5.3% 4.7%
4.1%
3.4%
2.5%
6.7% 5.9%
5.1%
4.3%
3.1%
0.0%
2.0%
4.0%
6.0%
0
25
50
75
100
2015 2016 2017 2018 2019 2020
Test
ing
Yiel
ds
Test
s (
mill
ion
s)
Total tests needed
Total tests needed (accounting for more targeted testing)
Overall testing yields
Overall testing yields (targeted testing)
Projections Data
$4.27 $4.50 $4.63 $5.09 $5.25
$60.74 $69.90 $80.48
$109.89
$147.19
$0
$50
$100
$150
2016 2017 2018 2019 2020
Co
st (
USD
)
Total average cost per test
Total average cost per identified PLHIV
*Costs included relate to commodities, HR, supply chain, IEC materials and counseling, transport for community based testing strategies, support to linkage to care

17
ARV Market Report | Clinton Health Access Initiative, Inc.
The uptake of HIV self-testing (HIVST) might also impact the testing
landscape for professional-use tests, but uncertainty around the choice of
distribution channels, public or private, makes it difficult to forecast testing
volumes. Although HIVST is still not widely used in developing countries,
there is increasing evidence of its benefits to expand testing beyond the
reach of healthcare workers, and empower clients by addressing many of
the stigma concerns that prevent some people from being tested in health
facilities. Preliminary evidence suggests that acceptability and testing
uptake are high, social harms are rare, testing accuracy and linkage to care
are satisfactory with appropriate support materials and support services
available.xlviii,xlix,l,li,lii
The WHO is also planning to release normative guidance
on HIVST by the end of 2016. In the meantime, some countries have
started showing interest to move towards implementation pilots to inform
operational requirements for scale-up. On the product side, although more
HIV RDTs are becoming available for self-testing, lack of in country product
registration might continue slowing down uptake. However, the WHO has
initiated a new prequalification assessment process for HIV rapid
diagnostic assays that are intended for self-testing, which should lead to
new WHO-PQ accreditations over the next year and support product
approvals in countries.
Funding outlook for 90-90-90
International funding has come a long way since the days of Durban 2000,
when only US$4.8 billion was allocated for global HIV support. Current
investments for the HIV response are estimated at US$19 billion for 2015
for LMICs. However, this belies the fact that since 2012, the level of
funding for HIV in LMICs has been plateauing after years of steady
growth.xxxii
Funding from donor governments decreased by more than US$1
billion (13 percent) to US$7.53 billion, compared with 2014 figures of
US$8.62 billion, although some of this is due to timing and exchange rate
fluctuations, and the trend may look different for 2016. liii
During the same
period, funding from domestic public and private sources increased,
accounting for 57 percent of total funding at US$10.9 billion. Private sector
contributions made up the remaining investments of US$618 million (3
percent).
At current ARV costs, 90-90-90 targets in LMICs will require an estimated
US$3.2 billion in funding in 2020. ARVs typically represent 40-50 percent of
facility-level treatment costs in LMICs, implying resource needs of US$6.5-
8 billion in 2020. Making up only 34-42 percent of the available funding for
the response, these estimates indicate that scale-up should be affordable
within current funding levels with efficient resource allocations.
An important recent development was the 5th Global Fund Replenishment
Conference, which took place in Montreal in September and successfully
met its goal of raising nearly US$13 billion for the next three years.liv
Differentiated models of care seek to reduce health system
burden while improving patient convenience
As programs expand treatment to all HIV patients, careful thought needs to
be given to how health system resources will be utilized, particularly as
international donor funding plateaus. Virally suppressed and stable patients
do not require the same level of health care support as sicker patients with
lower CD4 counts, or those newly-initiated on ART. Differentiated models
of care strive to deliver the most cost-effective and time-efficient care, while
still meeting different patients’ needs with clinically successful outcomes.
Many differentiated models of care are being piloted and implemented in
countries, including:
Multi-month scripts as a way to decrease patients’ time spent at
health facilities. At some health clinics in LMICs, virally suppressed
patients are given the option to refill their ARVs in bi-monthly or
quarterly, or even semi-annual intervals as opposed to the traditional
monthly intervals. Not only do multi-month scripts save patients and
health workers time, they have also been shown to decrease costs.
One study in Uganda found that the average cost of a patient refill
appointment in 2012 was US$38.86, meaning a high potential net
savings is possible for health care facilities that adopt multi-month
scripting.lv Larger pill bottles (e.g. 100 count), which some suppliers
already have SRA approval for, could be useful in multi-month
scripting to reduce the number of bottles patients have to carry every
time. Additionally, even if rolled out in a staggered manner, programs
will need to carefully consider the initial bolus of drug volumes they
will need to order as buffer stock
Community groups as a way to boost retention on ART. For HIV
patients who live in rural villages or mountainous regions, a trip to the
health clinic can be laborious and time consuming. One solution,
community action groups (CAGs), enables healthy patients to take
turns at picking up medications for the group. One CAG study based
out of Mozambique found that patients in a community group were
more than four times less at risk to die or to be loss to follow-up than
those not in the groups. lvi
A Lesotho CAG study also showed that
community members not only spent less time and money collecting
ARVs, but virologic suppression rates were 79 percent after one
year.lvii
Treatment and prevention modalities will evolve
Novel drug deliveries methods that will put an end to daily
dosing. Trials are currently underway to look at the effectiveness of
long-acting injectables (LAIs) as an alternate to daily oral pills. A
phase II study of LAI cabotegravir, has found that the drug is well
tolerated and 74 percent of patients prefer the injectables over pills.lviii
Other research is looking into subdermal implants as a way for drugs
to be administered several months at a time. Lastly, two studies,
ASPIRE and The Ring Study, done in South Africa, Uganda, Malawi,
and Zimbabwe, tested the effects of vaginal rings loaded with
dapivirine as a way of prevention. While a significant protective effect
was seen overall, unfortunately there was little to no effect seen
amongst the important target of young women ages 18-21. This was
thought to be due to poor adherence and potentially biological factors;
follow-up studies and analyses are exploring how to ensure maximum
efficacy. lix
A HIV vaccine that will completely change the prevention
landscape. The 2009 RV144 trial out of Thailand found that while the
tested vaccine lowered the rate of HIV infection by 31 percent relative
to the placebo group, it did not meet the criteria for public use.lx A
new study, HVTN 702, is set to begin in November of 2016 and will
test the safety and efficacy of a new HIV vaccine that is based off of
the RV144 vaccine. The trial will be held in South Africa.lxi
Given that
the study is expected to span multiple years, it is unlikely that a
marketable vaccine will be available before 2020.
A deeper understanding on the impact of an increasingly large,
ageing, and virally suppressed HIV population. As more patients
are identified as HIV positive, put on ART, and become virally
suppressed, they are able to live much longer lives. More research
and work is needed to understand the needs of these patients as the
18
ARV Market Report | Clinton Health Access Initiative, Inc.
community adapts from an emergency response to one that focusses
on helping patients live full and productive lives. Some of the newer
drugs discussed in this report will undoubtedly be part of the
armamentarium to treat the disease while preserving quality of life.
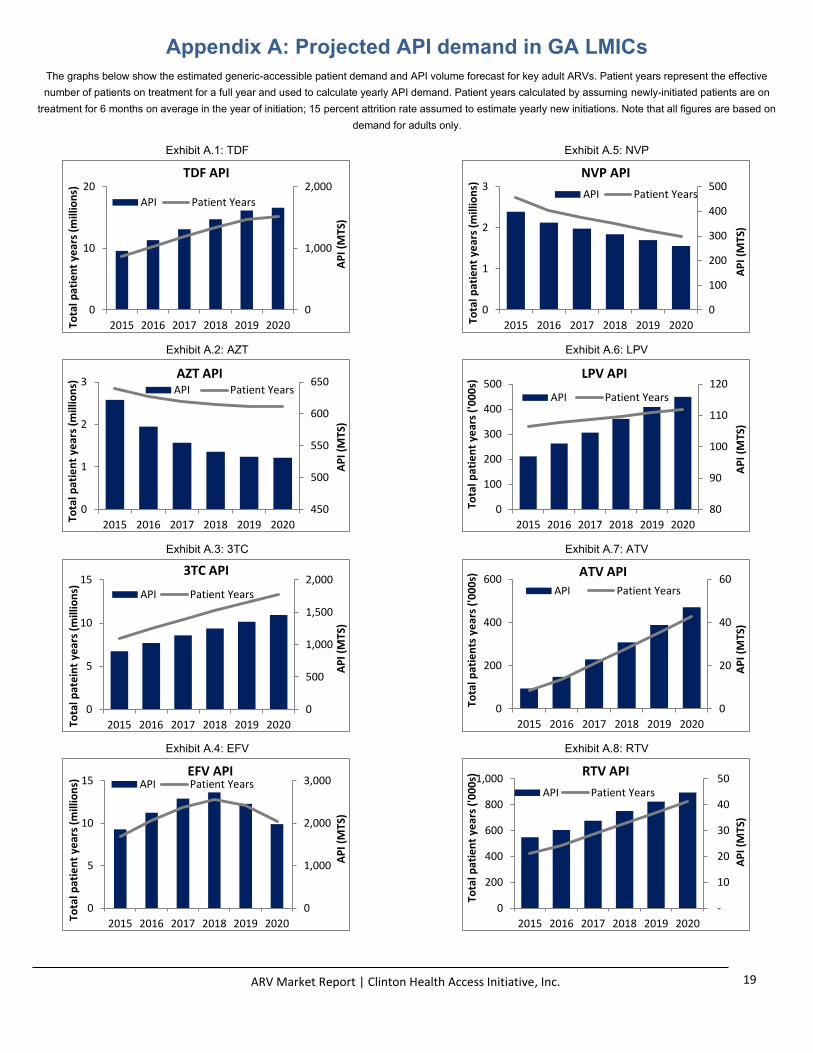
19
ARV Market Report | Clinton Health Access Initiative, Inc.
Appendix A: Projected API demand in GA LMICs
The graphs below show the estimated generic-accessible patient demand and API volume forecast for key adult ARVs. Patient years represent the effective
number of patients on treatment for a full year and used to calculate yearly API demand. Patient years calculated by assuming newly-initiated patients are on
treatment for 6 months on average in the year of initiation; 15 percent attrition rate assumed to estimate yearly new initiations. Note that all figures are based on
demand for adults only.
Exhibit A.1: TDF
Exhibit A.2: AZT
Exhibit A.3: 3TC
Exhibit A.4: EFV
Exhibit A.5: NVP
Exhibit A.6: LPV
Exhibit A.7: ATV
Exhibit A.8: RTV
0
10
20
2015 2016 2017 2018 2019 2020
0
1,000
2,000
AP
I (M
TS)
Tota
l pat
ien
t ye
ars
(mill
ion
s)
TDF API
API Patient Years
0
1
2
3
2015 2016 2017 2018 2019 2020
450
500
550
600
650
AP
I (M
TS)
Tota
l pat
ien
t ye
ars
(mill
ion
s) AZT API
API Patient Years
0
5
10
15
2015 2016 2017 2018 2019 2020
0
500
1,000
1,500
2,000
AP
I (M
TS)
Tota
l pat
ein
t ye
ars
(mill
ion
s)
3TC API
API Patient Years
0
5
10
15
2015 2016 2017 2018 2019 2020
0
1,000
2,000
3,000
AP
I (M
TS)
Tota
l pat
ien
t ye
ars
(mill
ion
s) EFV API
API Patient Years
0
1
2
3
2015 2016 2017 2018 2019 2020
0
100
200
300
400
500
AP
I (M
TS)
Tota
l pat
ien
t ye
ars
(mill
ion
s) NVP API
API Patient Years
0
100
200
300
400
500
2015 2016 2017 2018 2019 2020
80
90
100
110
120
AP
I (M
TS)
Tota
l pat
ien
t ye
ars
('0
00
s) LPV API
API Patient Years
0
200
400
600
2015 2016 2017 2018 2019 2020
0
20
40
60
AP
I (M
TS)
Tota
l pat
ien
ts y
ear
s ('
00
0s)
ATV API
API Patient Years
0
200
400
600
800
1,000
2015 2016 2017 2018 2019 2020
-
10
20
30
40
50
AP
I (M
TS)
Tota
l pat
ien
t ye
ars
('0
00
s) RTV API
API Patient Years

20
ARV Market Report | Clinton Health Access Initiative, Inc.
Appendix B: Reference Price List
The reference price list below provides per pack or bottle prices for key adults and pediatric ARVs included in CHAI’s most recent Reference Price List. Prices are EXW unless otherwise noted.
Product Packaging CHAI Reference
Price, 2016 (USD)
SCMS E-Catalog
Price (USD)lxii
MSF Price,
July 2016 (USD)lxiii
GF Pricing,
July 2016 (USD)lxiv
2015-2018 RSA
Tender Weighted
Average Price
(USD)xxx
Kenya Tender
Prices, awarded
2014 (USD)lxv
Adult Products*
3TC (150mg) HDPE bottle 60 tablets1 $2.25 $2.25 $1.86 $2.25 $1.66 $2.12
ABC (300mg) HDPE bottle 60 tablets1 $11.50 $9.80 n/a $11.00 $10.20 $11.14
ATV/r (300/100mg) HDPE bottle 30 tablets $16.00** $20.00 $17.49 $16.50 n/a $18.50
AZT (300mg) HDPE bottle 60 tablets1 $6.25 $5.21 $4.08 $5.60 $5.63 n/a
AZT/3TC (300/150mg) HDPE bottle 60 tablets1 $6.60 $5.97 $6.00 $6.40 $7.04 $6.65
AZT/3TC/NVP (300/150/200mg) HDPE bottle 60 tablets $8.20 $6.96 $7.74 $8.05 n/a $8.24
DTG (50mg) HDPE bottle 30 tablets n/a n/a n/a $4.00*** n/a n/a
EFV (600mg) HDPE bottle 30 tablets1 $3.40 $2.94 $1.65 $3.20 $3.37 $3.25
LPV/r (200/50mg) HDPE bottle 120 tablets1 $20.00 $19.10 $18.96 $18.41 $12.70 $18.73
NVP (200mg) HDPE bottle 60 tablets1 $2.50 $2.02 $1.98 $2.20 $2.35 $2.21
RTV (100mg) heat-stable HDPE bottle 30 tablets $7.50 n/a $3.42 n/a n/a n/a
TDF (300mg) HDPE bottle 30 tablets1 $3.00 $3.77 $3.21 $3.50 $2.45 n/a
TDF/3TC (300/300mg) HDPE bottle 30 tablets $4.50 $3.43 $3.75 $4.25 n/a $4.49
TDF/FTC (300/200mg) HDPE bottle 30 tablets1 $5.00 $5.74 $5.25 $5.25 $5.32 n/a
TDF/3TC/EFV (300/300/600mg) HDPE bottle 30 tablets $8.20 $7.96 $8.76 $7.99 n/a $10.50
TDF/FTC/EFV (300/200/600mg) HDPE bottle 30 tablets1 $8.50 $8.99 $8.19 $7.99 $8.91 n/a
Pediatric Products
ABC (60mg) disp. HDPE bottle 60 tablets1 n/a $6.20 $4.02 $3.80 $5.13 n/a
ABC/3TC (60/30mg) disp. scored HDPE bottle 60 tablets $3.50 $3.51 $4.50 $4.25 n/a $3.16
ABC/3TC (120/60mg) disp. scored HDPE bottle 30 tablets $3.50 n/a n/a $3.50 n/a n/a
AZT/3TC (60/30mg) disp. scored HDPE bottle 60 tablets $2.00 $1.86 $1.92 $1.90 n/a $2.032
AZT/3TC/NVP (60/30/50mg) disp. scored HDPE bottle 60 tablets $3.50 $3.25 $3.30 $3.36 n/a $3.60
EFV (200mg) scored HDPE bottle 90 tablets n/a $9.30 $9.27 $9.30 n/a n/a
LPV/r (40/10mg) oral pellets HDPE bottle 120 capsules $19.20 n/a $19.20 $19.20 n/a n/a
LPV/r (80+20mg/ml) HDPE bottle 5 x 60ml (300ml)3 n/a $30.82 $30.90 $30.82 $19.70 $32.15
LPV/r (100/25mg) HDPE bottle 120 tablets n/a $9.94 $11.88 $10.00 n/a n/a
RAL (100mg) chewable scored HDPE bottle 60 tablets n/a n/a $36.00 n/a n/a n/a
*Please refer to the following link for pricing on DTG and TLE400
**Lower prices may be offered for higher volume orders. Please contact Carolyn Amole at [email protected] for more details
***The Global Fund’s DTG pricing served as an indicative reference before any generic manufacturer received SRA approval; more refinement to the price is likely given Aurobindo’s tentative US FDA approval
1 RSA is 28 tablet bottle (vs. 30), 56 tablet bottle (vs. 60); 112 tablet bottle (vs. 120)
2 Assumes dispersible was procured based on indicated supplier, though not explicitly stated in tender document
3 RSA price provided for 60ml bottle. Multiplied by 5 to get 300ml estimate for comparability purposes
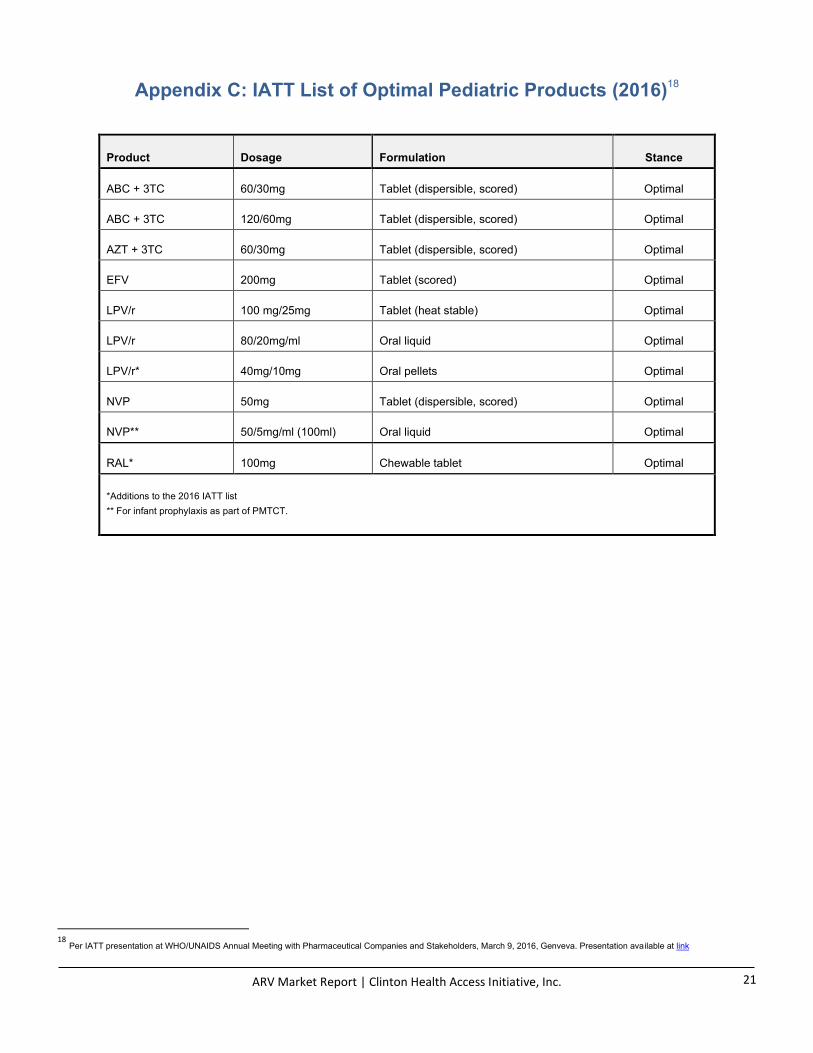
21
ARV Market Report | Clinton Health Access Initiative, Inc.
Appendix C: IATT List of Optimal Pediatric Products (2016)18
Product Dosage Formulation Stance
ABC + 3TC 60/30mg Tablet (dispersible, scored) Optimal
ABC + 3TC 120/60mg Tablet (dispersible, scored) Optimal
AZT + 3TC 60/30mg Tablet (dispersible, scored) Optimal
EFV 200mg Tablet (scored) Optimal
LPV/r 100 mg/25mg Tablet (heat stable) Optimal
LPV/r 80/20mg/ml Oral liquid Optimal
LPV/r* 40mg/10mg Oral pellets Optimal
NVP 50mg Tablet (dispersible, scored) Optimal
NVP** 50/5mg/ml (100ml) Oral liquid Optimal
RAL* 100mg Chewable tablet Optimal
*Additions to the 2016 IATT list
** For infant prophylaxis as part of PMTCT.
18
Per IATT presentation at WHO/UNAIDS Annual Meeting with Pharmaceutical Companies and Stakeholders, March 9, 2016, Genveva. Presentation available at link

22
ARV Market Report | Clinton Health Access Initiative, Inc.
Appendix D: Notes on Methodology
There are several CHAI analyses from which the majority of figures in this report are derived:
• ART patient forecast: Each year, CHAI develops a five-year forecast for the total number of patients on ART in LMICs. CHAI compiles historic
data on the number of patients on ART in 21 high ART patient burden countries (Botswana, Brazil, Cameroon, China, Côte d'Ivoire, Ethiopia,
India, Kenya, Lesotho, Malawi, Mozambique, Myanmar, Nigeria, Rwanda, South Africa, Swaziland, Tanzania, Uganda, Vietnam, Zambia, and
Zimbabwe) from progress reports issued and annual data published by the WHO, UNICEF and UNAIDS. For each country, CHAI assumes
that the number of people receiving treatment will increase linearly at the same rate as the linear trend observed in the last four years and will
plateau as universal access is approached, and then extrapolates to the rest of the world. Universal access (for the growth plateau) is defined
by PLWHA to reflect WHO Guideline changes and subsequent anticipated ART scale-up.
• ARV demand forecast: CHAI collects aggregate country data on patient regimens, formulations used, national guidelines, and anticipated
future trends from CHAI’s country teams and published literature each year. CHAI uses the data, an internally developed forecasting model,
and the ART patient forecast (above) to project ARV demand in LMICs over the next five years. This year, CHAI received information for 13
countries (i.e. Ethiopia, India, Kenya, Lesotho, Malawi, Nigeria, South Africa, Swaziland, Uganda, Tanzania, Vietnam, Zambia, and
Zimbabwe).The countries included represent 75 percent of the patients on ART in GA LMICs in 2015.
• ARV procurement database: CHAI aggregates procurement data from several sources, including Supply Chain Management System
(SCMS), The Global Fund, UNITAID, IDA, and national governments. The data is evaluated on an annual basis to understand pricing and
volume trends by country, region, and globally.
• Market sizing analysis: Each year, CHAI combines the ARV demand forecast with pricing data from the ARV procurement database to
calculate the current size of the ARV market in dollar terms, to estimate the market size over the next five years, and to calculate the average
cost of treatment for first- and second-line adult and pediatric patients.
• Pipeline drug forecast: CHAI updated its global pipeline drug forecast model, which estimated uptake at the molecule level, to a more
nuanced approach that accounts for country-specific uptake at the regimen level. The global forecast was divided into two segments, i.e.
eleven high-volume countries and the generic-accessible (GA) rest of world (RoW), which were both used to estimate global uptake for adult
pipeline products. New product uptake assumptions were based on three main factors: 1) anticipated price differential between new and
current products, 2) relative clinical improvement of new product relative to current, and 3) anticipated launch year (i.e. likely first availability of
product in country post-SRA and NDRA approval, inclusion in national guidelines and procurement plans), with the expectation that WHO
guideline inclusion would have already occurred. Based on these three variables, uptake curves were then selected for each of the twelve
focal countries based on CHAI’s country intelligence, and one set of global uptake assumptions for GA RoW, separately for existing and
newly initiating patients. These uptake curve choices for new products relative to current products estimated the total number of patients in a
given year in GA LMICs.
23
ARV Market Report | Clinton Health Access Initiative, Inc.
References
i Kallings, L., & McClure, C. (2008, July). 20 years of the International AIDS Society. Link ii UNAIDS. (2000, June). Report on the global HIV/AIDS epidemic. Link
iii WHO. Estimated numbers of people receiving antiretroviral therapy globally and by WHO region and percentage coverage globally, 2000-2015. Link
iv Waititu, E. (2016, July 19). Durban 2016: witnessing history. Link
v The Global Fund. History of the Global Fund. Link
vi WHO. HIV/AIDS fact sheet. (2016, July). Link
vii International AIDS Society (IAS). Themes and objectives: access equity rights now. Link
viii WHO. HIV/AIDS data and statistics. Link
ix UNAIDS. (2016, July). AIDSinfo Database. Link
x EGPAF. (2016, April 14). Lesotho leads the way to HIV treatment for all with early launch of “test and treat” guidelines. Link
xi UNAIDS. (2016, May 13). South Africa takes bold step to provide HIV treatment for all. Link
xii Tanzania Daily News. (2016, August 24). Tanzania: ARVs now for any CD4 count. Link
xiii IATT. (2016, September 21). Option B+ countries and PMTCT regimen. Link
xiv PAHO. (2013). Antiretroviral treatment in the spotlight: A public health analysis in Latin American and the Caribbean, 2013. Link
xv WHO. (2014, July). Technical report: access to antiretroviral drugs in low- and middle- income countries. Link
xvi CHAI, Procurement Database, 2016
xvii PEPFAR. (2016, June 7). Statement on FDA public notification that tenofovir disoproxil fumarate, lamivudine, efavirenz (TLE) produced by Hetero Labs Limited Unit III is no
longer eligible for procurement under PEPFAR. Link xviii
Global Fund. (2016, July 15). List of delisted products not eligible for procurement with the Global Fund resources. Link xix
UNAIDS. (2014). Fast-track: ending the AIDS epidemic by 2030. Link xx
SPRING-2, SINGLE, FLAMINGO clinical studies xxi
ViiV. (2016, June 3). ViiV Healthcare announces public tender agreement with Botswana Ministry of Health for dolutegravir. Link xxii
Botswana Ministry of Health. (2016). Handbook of the Botswana 2016 integrated HIV clinical care guidelines. Link xxiii
Hirschler, B. (2016, June 3). Botswana gets GSK's modern HIV drug in largest ever Africa deal. Link xxiv
Aurobindo. (2016, September 22). Aurobindo Pharma receives USFDA tentative approval for dolutegravir, allowing the product to be launched in the PEPFAR market. Link xxv
Gilead. (2014, November 6). Gilead submits new drug application to U.S. Food and Drug Administration for tenofovir alafenamide (TAF)-based single tablet regimen for
HIV. Link xxvi
Gilead. (2015, November 5). U.S. Food and Drug Administration approves Gilead’s single tablet regimen Genvoya® (elvitegravir, cobicistat, emtricitabine and tenofovir
alafenamide) for treatment of HIV-1 infection. Link xxvii
Gilead. (2016, March 1). U.S. Food and Drug Administration approves Gilead’s second TAF-based single tablet regimen Odefsey® (emtricitabine, rilpivirine, tenofovir
alafenamide) for the treatment of HIV-1 infection. Link xxviii
Gilead. (2016, April 4). U.S. Food and Drug Administration approves Descovy® (emtricitabine, tenofovir alafenamide), Gilead’s third TAF-based HIV therapy. Link xxix
Gilead. (2016, January 12). Gilead submits new drug application to U.S. Food and Drug Administration for tenofovir alafenamide (TAF) for the treatment of chronic Hepatitis
B. Link xxx
Republic of South Africa 2015-2018 Tender; exchange rate at time of tender award 1 USD = 11.7 ZAR; effective USD prices since fell as the Rand depreciated; prices are
on a delivered basis and inclusive of 14% VAT; average prices weighted by volumes allocated across suppliers xxxi
POWER1, POWER2, TITAN clinical studies xxxii
UNAIDS. (2016). AIDS by the numbers, 2016. Link xxxiii
UNAIDS. Fact sheet 2016. Link xxxiv
U.S. President's Emergency Plan For AIDS Relief (PEPFAR). Accelerating Children’s HIV/AIDS Treatment (ACT) initiative 2015 results. Link xxxv
PHTI. (2016, July). PHTI newsletter: accelerating development of pediatric ARV formulations to close the treatment gap, July 2016. Link xxxvi
Chatterjee A. et al. (2011). Implementing services for early infant diagnosis (EID) of HIV: a comparative descriptive analysis of national programs in four countries. BMC
Public Health. 11:553. xxxvii
Sibanda E. et al. (2013). The magnitude of loss to follow-up of HIV exposed infants along the prevention of mother-to-child HIV transmission continuum of care: a
systematic review and meta-analysis. AIDS. 27: 2787–2797; and Chatterjee A. et al. (2011). Implementing services for early infant diagnosis (EID) of HIV: a comparative
descriptive analysis of national programs in four countries. BMC Public Health 11:553 xxxviii
Ghardrshenas A. et al. (2013). Improved access to early infant diagnosis is a critical part of a child-centric prevention of mother-to-child transmission agenda. AIDS. 27
197-205. xxxix
Jani I.et al. (2016). Effect of point-of-care early infant diagnosis on retention of patients and rates of antiretroviral therapy initiation on primary health care cl inics: a cluster-
randomized trial in Mozambique. 21st International AIDS Conference. xl Mwenda, R. et al. (2016). Impact of point-of-care EID testing into the national EID program: pilot experiences from Malawi. 21st International AIDS Conference.
xli Cohn, J., et al. (2016). Paediatric HIV testing beyond the context of prevention of mother-to-child transmission: a systematic review and meta-analysis. The Lancet HIV.
xlii Kiyaga, C. et al. (2016). Where have all the children gone? High HIV prevalence in infants attending nutrition and inpatient entry points. 21st International AIDS Conference.
xliii Roche. (2014, September 26). Roche launches global access program for HIV viral load testing. Link
xliv Mermin J. et al. (2011). Utility of routine viral load, CD4 cell count, and clinical monitoring among adults with HIV receiving antiretroviral therapy in Uganda: randomized trial.
BMJ. 343; Phillips A. et al. (2008). Trends in HIV incidence in India from 2000 to 2007. Lancet. 371:1443-51. xlv
UNAIDS. (2016, July 11). Prevention gap report. 2016. Link xlvi
WHO. (2015, July). Consolidated guidelines on HIV testing services. Link
24
ARV Market Report | Clinton Health Access Initiative, Inc.
xlvii
Data from a larger set of countries was not available, however these six countries represent high burden and generalized epidemic settings where 2015 ART coverage
averaged 54 percent, making these trends relevant for other places of SSA. xlviii
Choko A. et al. (2011, October 8). The uptake and accuracy of oral kits for HIV self-testing in high HIV prevalence setting: a cross-sectional feasibility study in Blantyre,
Malawi. PLoS Medicine. xlix
Choko A. et al. (2015). Uptake, accuracy, safety, and linkage into care over two years of promoting annual self-testing for HIV in Blantyre, Malawi: a community-based
prospective study. PLoS Medicine. l Agot K, et al. (2016, July). Can women safely distribute HIV oral self-test kits to their sexual partners? Results from a pilot study in Kenya. 21
st International AIDS Conference.
li Sibanda E. et al. (2016, July). Community-based distribution of HIV self-test kits: results from a pilot of door-to-door distribution of HIV self-test kits in one rural Zimbabwean
community. 21st International AIDS Conference.
lii Mavedzenge S. et al. (2015). Supervised HIV self-testing to inform implementation and scale up of self-testing in Zimbabwe. Journal of the International Aids Society.
liii Kates, J. et al. (2016, July 20). Financing the response to HIV in low- and middle-Income countries: international assistance from donor governments in 2015. Link
liv Global Fund. (2016, September 17). Global Fund donors pledge nearly $13 billion to help end epidemics. Link
lv Karukoma S. et al. (2016). Potential cost savings in reducing antiretroviral refill schedules for stable patients on antiretroviral therapy at Taso, Uganda. 21st International
AIDS Conference. Link lvi Decroo T. et al. (2016). The effect on community action groups on retention-in-care among patients on ART in Tete Province, Mozambique. 21st International AIDS
Conference. Link lvii
Vandendyck M. et al. (2016). New heights for differentiated care: 3 years of community ART groups in the mountains of rural Lesotho. 21st International AIDS Conference.
Link lviii
Markowitz M. et al. (2016). ÉCLAIR: phase 2A safety and PK study of cabotegravir LA in HIV-uninfected men. Conference of Retroviruses and Opportunistic Infections. Link lix International Partnership For Microbicides. (2016, February 22). Two large studies show IPM’s monthly vaginal ring helps protect women against HIV. Link
lx NAM Aidsmap. The RV144 trial. Link
lxi IAS. (2016, July 19). New vigour in HIV vaccine research evident at AIDS 2016. Link
lxii SCMS. (2016, September 8). SCMS e-catalog. Link
lxiii Médecins Sans Frontières (MSF). (2016, July). Untangling the web of antiretroviral price reductions; prices shown converted to pack prices from unit prices
lxiv Global Fund Pricing, Ex-Works, July 2016
lxv Kenya Tender Prices, awarded 2014
© 2016 Clinton Health Access Initiative, Inc. All rights reserved
All photographs property of the Clinton Health Access Initiative, Inc. (CHAI), 2016.