as». /iÇalışmanın ikinci kısmında, hidrokinon, antrakinon ve antrasen pvc matrisine...
TRANSCRIPT

.as». /I

SPECTROSCOPIC INVESTIGATION OF POLYVINYL CHLORIDE
PHOTODEGRADATION IN BLENDS WITH BASIC TRAPS
A THESIS
SUBMITTED TO THE DEPARTMENT OF CHEMISTRY
AND THE INSTITUTE OF ENGINEERING AND SCIENCES
OF BILKENT UNIVERSITY
IN PARTIAL FULFILLMENT OF THE REQUIREMENTS
FOR THE DEGREE OF
MASTER IN SCIENCE
By
ÖZGÜR BİRER
December 1999

I certify that I have read this thesis and that in my opinion it is fully adequate,
in scope and in quality, as a thesis of the degree of Master of Science
Prof. Dr. Şefik Süzer (Principal Advisor)
I certify that I have read this thesis and that in my opinion it is fully adequate,
in scope and in quality, as a thesis of the degree of Master of Science
Prof. Dr. Hasan N. Erten
I certify that I have read this thesis and that in my opinion it is fully adequate,
in scope and in quality, as a thesis of the degree of Master of Science
Prof. Dr. Atılla Aydınlı

4^Н
I чУ

I certify that I have read this thesis and that in my opinion it is fully adequate,
in scope and in quality, as a thesis of the degree of Master of Science
Asst. Prof. Dr. Ulrike Saizner
I certify that I have read this thesis and that in my opinion it is fully adequate,
in scope and in quality, as a thesis of the degree of Master of Science
.....i·; lL<C
Prof. Dr.^Atilla Yıldız
Approved for the Institute of Engineering and Sciences
Director of Institute of Engineering and Scince
111


SPECTROSCOPIC INVESTIGATION OF POLYVINYL CHLORIDE
PHOTODEGRADATION IN BLENDS WITH BASIC TRAPS
ÖZGÜR BİRER
M.S. in Chemistry
Supervisor: Prof. Dr. Şefik Süzer
December 1999
Polyvinyl chloride degrades via loss of HCI when it is exposed to heat,
energetic particles or photons. The mechanism is known as the zip
mechanism and results in conjugated segments, polyenes. Degradation also
leads to loss of mechanical properties of PVC. However, from another point
of view, PVC is a Bronsted acid source, with controllable emission.
Furthermore, the polyenes are small segments of polyacetylene, which itself
is a very interesting one-dimensional system. Understanding the building
blocks clearly helps to envisage larger systems.
This study has two main goals. The first goal is benefiting from the
radiation induced in-situ created HCI by incorporating basic traps into the
polymer matrix and inducing optical or electrical conductivity changes. The
second goal is to tune the wavelength of photodegradation by introducing
sensitisers into the polymer matrix to affect the chain length of the polyenes.
ABSTRACT
IV

For the first part of the study, pH indicators, and basic forms of
conducting polymers were blended with PVC and the films were irradiated
with UV radiation. Optical changes were monitored with UV-Vis-NIR
Spectroscopy. Similar to several other dyes tried, Bromcresol Green, and
Methyl Violet changed their optical properties when they were exposed to UV
radiation in the PVC matrix. However, Methyl Violet, being resistant to UV
radiation, proved to be a suitable component for possible dosimetric and
lithographic applications.
Basic forms of polyaniline and poly-2-chloro aniline were blended with
PVC, and upon irradiation of the blend, they were converted to conducting
salt forms as a result of doping with in-situ created HCI. The structural
changes were monitored with UV-Vis-NIR spectrophotometry as well as FTIR
spectroscopy. PVC/2-CI PAN I blends gave better results compared to
PVC/PANI blends.
For the second part of the study, hydroquinone, anthraquinone, and
anthracene were introduced into the PVC matrix. The samples were
irradiated with monochromatic UV radiation at the absorption maxima of
these sensitisers. It was established that the nature of polyene formation is
dependent on the wavelength of irradiation as well as the amount of energy
transferred to the PVC chains.
Keywords: Polyvinyl chloride, polyene, polyaniline, poly-2-chloro-aniline, photodegradation, lithography, UV-Vis-NIR spectroscopy

BAZİK TUZAKLI KARIŞIMLAR İÇİNDE POLİVİNİL KLORÜRÜN
FOTO BOZUNMASININ SPEKTROSKOPİK İNCELENMESİ
ÖZGÜR BİRER
Kimya Bölümü Yüksek Lisans Tezi
Tez Yöneticisi: Prof. Dr. Şefik Süzer
Aralık 1999
Poli vinil klorür, ısıya, yüksek enerjili parçacıklara veya fotonlara
maruz kaldığında HCI salarak bozunun “Zip” olarak da bilinen bu mekanizma
sonucunda, polien adı verilen konjüge parçalar oluşur ve bozunma PVC nin
mekanik özelliklerini yitirmesine neden olur. Ancak, bir başka açıdan, PVC
salınımı kontrol edilebilen bir Bronsted asiti kaynağıdır. Polienler ise çok
ilginç tek boyutlu bir sistem olan poliasetilenin yapı taşlarıdır. Küçük yapı
taşlarının oluşum mekanizmasının anlaşılması daha büyük sistemlere ışık
tutabilir.
Bu çalışmanın iki temel amacı vardır. Birincisi, polimer matrisi içerisine
uygun bazik tuzaklar yerleştirerek, ışınlanma sonucu oluşan HCI den
yararlanmak ve karışımların optik veya elektriksel iletkenlik özelliklerini
ÖZET
VI

değiştirmektir. İkincisi ise foto bozunmanın gerçekleştiği ışık dalga boyunu
değiştirerek oluşan polienlerin zincir uzunluklarını etkilemektir.
Çalışmanın birinci bölümünde, PVC nin asit-baz belirteçleri ve iletken
polimerlerin bazik formları ile karışımları hazırlanmış, UV kaynakları ile
ışınlanmış ve optik değişiklikler morötesi ve görünür bölge spektroskopisi ile
incelenmiştir. İncelenen diğer boyalar gibi, Bromkresol Yeşili ve Metil Violet
katıldıkları PVC matrisinde ışınlanınca bazı optik özelliklerini
kaybetmektedirler. Metil Violet ise ışınlanmaya karşı direncini kanıtlayarak,
olası dozimetri ve litografi uygulamaları için uygun bir aday olarak tespit
edilmiştir.
Polianilin ve poli-2-kloro anilinin bazik formları PVC ile karıştırılmış ve
ışınlanma sonucu yerinde oluşan HCI tarafından iletken tuz formuna
çevrilmişlerdir. Yapısal değişiklikler morötesi-görünür-yakın kırmızı ötesi
spektroskopisi ve FT kızıl ötesi spektroskopisi ile takip edilmiştir. PVC/2-CI
PANI karışımları, PVC/PANI karışımlarına kıyasla daha iyi neticeler
vermiştir.
Çalışmanın ikinci kısmında, hidrokinon, antrakinon ve antrasen PVC
matrisine karıştırılmıştır. Örnekler, bu duyarlaştırıcıların soğurduğu dalga
boylarında tek renkli mor ötesi ışıkla ışınlanarak polien oluşumunun, dalga
boyuna olduğu kadar, PVC zincirlerine aktarılabilen enerji miktarına da bağlı
olduğu tespit edilmiştir.
vıı

Anahtar Kelimeler: PVC, polien, polianilin, poli-2-kloro-anilin, foto-bozunma,litografi, Mor ötesi - Görünür - Yakın kızılötesi Spektroskopisi
vnı

I would like to express my deep gratitude to Prof. Şefik Süzer for his
encouragement and supervision throughout my studies.
I wish to thank all present and former members of Bilkent University
Chemistry Department for their help.
I would like to thank my wife Özlem for her endless love and support.
ACKNOWLEDGEMENTS
IX

TABLE OF CONTENTS
1. INTRODUCTION......................................................................................... 1
1.1. Polyvinyl chloride....................................................................................1
1.2. Decomposition of PVC............................................................................ 3
1.2.1. Thermal Decomposition................................................................. 3
1.2.2. Photo-Decomposition.................................................................... 4
1.2.3. Chemical Decomposition............................................................... 6
1.2.4. Theoretical Calculations and Modelling.........................................6
1.2.5. Prevention of Degradation........................................................... 12
1.2.6. Utilisation of Degradation............................................................. 13
1.3. Conducting Polymers................................ ...........................................14
1.4. Conducting Polymer Blends................................................................16
1.5. pH Indicators.......................................................................................... 17
1.6. Electronic Spectroscopy..................................................................18
1.7. Infrared Spectroscopy........................................................................ 25
1.8. X-Ray Photoelectron Spectroscopy................................................ 27
2. EXPERIMENTAL...................................................................................... 29
2.1. Sample Preparation............................................................................... 29
2.2. Irradiation Studies................................................................................. 36
2.3. UV-Vis Spectroscopic Studies............................................................ 36
2.4. FTIR Spectroscopic Studies ................................................................39
2.5. XPS St u d y ................................................................................................39
3. RESULTS AND DISCUSSIONS...............................................................40
3.1. Photo-degradation of PVC ............................................. 40
3.2. Better Utilisation of Degradation.................................................... 42

3.2.1. Blends with pH Indicators............................................................42
3.2.2. Blends of PVC with Conducting Polymers.................................. 46
3.3. Wavelength Tuning of PVC Photodegradation...............................49
4. CONCLUSION...........................................................................................59
5. REFERENCES........................................................................................... 61
XI

LIST OF TABLES
1. Activation enthalpies dehydrochlorination o f 2,4,6-trichloroheptane
STEREOISOMERS [35]........................................................................................11
2. UV-VIS DATA OF POLYENES IN N-PENTANE [70]..................................................23
3. FTIR Band Assignments o f PVC [13].......................................................... 30
4. Assignment OF IR bands o f PANI [52].......................................................... 34
Xll

LIST OF FIGURES
1. The European use of PVC by market share................................................1
2. HCI elimination from PVC in the absence and presence of HCI................7
3. 1,4 elimination of HCI and 1,3 rearrangement of hydrogen atoms..............8
4. The optimum dihedral angle for HCI elimination..........................................8
5. Radical mechanism of PVC degradation.....................................................9
6. Intermolecular Diels-Alder Reaction in degraded PVC..............................10
7. The general form of polyaniline................................................................. 15
8. Internal redox reaction of Emeraldine Salt.................................................15
9. Structure of base and acid forms of Methyl violet......................................17
10. Structure of base and acid forms of Bromcresol green.......................... 18
11. The electronic transition with 0-0 vibrational (solid line), and 0-1
vibrational (dashed line) transition, (1 kK=1000 cm’^).............................19
12. Ground and excited state configurations of linear polyenes.................. 22
13. Electronic spectra of diphenylhexatriene vapor showing the first and
second transitions.................................................................................... 22
14. UV-Vis Spectrum of degraded PVC with polyene peak positions............ 24
15. Comparison of harmonic potential and Morse potential for HBr molecule
................................................................................................................ 26
16. Vibrational infrared frequencies of organic molecules............................ 27
17. The FTIR spectra of PVC powder............................................................29
18. XPS Spectra of powder PVC...................................................................30
Xlll

19. FTIR Spectra of hydroquinone (a), and THF residue (b)........................ 31
20. UV-Vis Spectra of THF, before (a) and after (b) distillation..................... 32
21. FTIR Spectra of PANI base (a), PANI salt (b), 2-CI PANI base (c), and 2-
Cl PANI salt (d)........................................................................................33
22. UV-Vis-NIR Spectra of PANI base (a), PANI salt (b), 2-CI PANI base (c),
and 2-CI PANI salt (d).............................................................................. 35
23. Intensity profiles of lamps used............................................................... 36
24. Optical schematics of Varian Cary 5E spectrophotometer...................... 38
25. Optical schematics of the UMSP 80 ........................................................38
26. Visible spectrum of irradiated PVC/MV blend......................................... 40
27. UV-Vis Spectra of PVC irradiated at 254 (top) and 312 (bottom) nm ....41
28. FTIR Spectra of PVC irradiated at 254 (top) and 312 (bottom) nm.........42
29. Irradiated PVC/dye blends....................................................................... 43
30. Visible specta of Bromcresol Green as solution, as film, and as blend with
PVC..........................................................................................................44
31. Visible Spectra of Methyl Violet, as solution, as film, and as blend with
PVC..........................................................................................................44
32. Lithographic application of PVC/MV blend in macro scale..................... 46
33. Micro scale lithographic pattern and its lateral absorbance change.......46
34. UV-Vis-NIR spectra of Irradiated PVC/PANI and PVC/2-CI PANI blends
containing equal amounts of conducting polymer................................... 47
35. FTIR Spectra of PVC/2-CI PANI Blend irradiated for 2 hours at 254 nm.
.................................................................................................................48
36. PVC/2-CI PANI blends exposed to consecutive UV/NH3 and HCI/NH3
cycles........................................................................................................48
XIV

37. Dehydrochlorination monitoring tools..................................................... 50
38. UV spectra of additives used.................................................................. 51
39. UV-Vis spectra of PVC/HQ/MV blend irradiated at 300 nm................... 52
40. Effect of wavelength on polyene chain length distribution..................... 53
41. Energy onset for PVC/HQ/MV blend...................................................... 54
42. UV-Vis spectra of PVC/AQ/MV blend irradiated at 330 nm ................... 55
43. Energy onset for PVC/AQ/MV blend....................................................... 55
44. UV-Vis spectra of PVC/AC/MV blend irradiated at 382 nm.................... 56
45. Energy onset for PVC/AC/MV blend....................................................... 57
XV

1. INTRODUCTION
1.1. Polyvinyl chloride
Polyvinyl chloride is one of the world’s most used plastics. It has been
used for production of water pipes, wall and floor covers, window and
doorframes, food packaging, blood transfusion sets and many more. The
reasons of its wide spread use are its resistance against corrosion, fire
retardant and insulating properties. It has been reported that PVC production
reached 6.60 million tons in US in 1998 [1], 5.60 million tons in Western
Europe in 1997 [2], and 224,650 tons in Japan in 1997 [3]. European Council
of Vinyl Manufacturers announced the European uses for PVC by market
share as shown in Figure 1 [4].
Furniture/Office Transport - , Equipment
Wire Cable and 1Electrical Leisure 1
Packaging
Clothing and Footware_ Domestic
Appliances
Other Uses
Building and Construction
Figure 1. The European use of PVC by market share
Vinyl chloride monomer (CH2=CHCI) was first produced by Régnault in
France in 1835 and its polymerisation was achieved for the first time in 1872
by Baumann who exposed the monomers to sunlight in a sealed tube. The
first PVC production plants were constructed in the USA in the early 1930’s.
In modern industry, vinyl chloride monomer is produced by reacting
ethene with chlorine (Eq.1), and decomposing the produced 1,2
dichloroethane at high temperature (Eq.2). The evolved HCI is further reacted
with ethene in the presence of oxygen and copper chloride catalyst to yield
1,2 dichloroethane (Eq.3), which is fed into the pyrolysis reaction (Eq.2) [5].
Polyvinyl chloride, {-(CH2-CHCI)n-}, is obtained by radical polymerisation of
the monomer.
CH2=CH2 + CI2 -> CH2CI-CH2CI
CH2CI-CH2CI ^ CH2=CHCI + HCICuCI·,
(Eq.1)(Eq-2)
CH2=CH2 + 2 HCI +/2 O2 ^ CH2CI-CH2CI + H2O (Eq.3)
PVC is a very cheap material and has many applications. Outdoor
PVC products have various kinds of stabilisers in their formulations to
increase their service life. However, pure PVC has a rather low stability
against heat and energetic photons. For this reason extensive research has
been carried to gain a better understanding of the mechanism(s) of
degradation, mainly for the purpose of preventing it.

1.2. Decomposition of PVC
PVC degradation has been studied by means of thermal
decomposition, photo and particle beam decomposition, and chemical
decomposition [6-34].
When PVC decomposes, HCI is eliminated from the chain, and
conjugated double bonds, polyenes, {-(CH=CH)n-}, form in the polymer
chain. Ionic, radical and molecular elimination mechanisms together with
autocatalytic effect of HCI have been proposed to explain the phenomena but
none of them could bring a complete explanation of the observed facts. As
the number of double bonds exceed 6, the polyenes start to absorb light in
the blue region of the visible spectrum and the material appears yellow. The
Yellowness index, established by the American Society for Testing and
Materials, has been used to gauge the extent of decomposition [6-8].
1.2.1. Thermal Decomposition
In the thermal decomposition studies, it has been shown that
impurities such as solvent and initiator residue [9], plasticisers [10], structural
irregularities such as carbon-carbon double bonds and carbonyl bonds [11],
reduce the stability of PVC and initiate the dehydrochlorination reaction.
Conjugated unsaturation ranging from short polyenes (n=2-4) up to long
polyenes (n=15) as a result of thermal decomposition was detected by UV-
Vis absorption spectroscopy [12] and FTIR spectroscopy [13]. Side reactions.
like photooxidation as detected by FTIR Spectroscopy [13], and cyclisation
as detected by Mass Spectroscopy [14] accompany polyene formation during
thermal degradation.
As a result of these studies, several stabiliser compounds such as
barium, calcium, lead, cadmium, zinc stearates, dibutyltin distearate,
dibutyltin maleate, and dioctyltin di(octylthioglycolate) [11,12,14,15] were
proposed to inhibit or retard dehydrochlorination of PVC.
1.2.2. Photo-Decomposition
Photo-decomposition of PVC has been widely studied in the spectral
range from long wavelength UV radiation up to gamma radiation. In the
studies where solar radiation was simulated with several different Xe
sources, exposure duration exceeding 1000 hours was necessary to create
polyenes with a wide range of n number in the polymer [16-19]. The
maximum rate of dehydrochlorination was reported to occur at 370 nm [19].
Formation of the carbonyl moiety (1720 cm'^), the hydroxide moiety (3200
cm'^), and the C-H moiety (1400 cm'^) as a result of weathering were
reported [18]. Photostabilisers such as dibutyltin bis(octylmaleate), dibutyltin
bis(octylthioglycolate), and dibutyltin bis(2-ethylhexylthioglycolate) [16],
benzylidene malonate [17], and rutile [19] were proposed.
Studies on the effects of more energetic UV radiation required
employment of low, medium and high pressure Hg sources. These sources

emit mainly at 254 nm, and a broad emission tail grows as the pressure
increases from low to high. PVC samples irradiated with medium to high
pressure mercury lamps degrade rather quickly, and considerable changes in
the UV-Vis spectra of the PVC samples occur in 1-3 hours. Surface
oxidation, photo-bleaching and deconjugation of the polyenic sequences
were reported in the presence of oxygen for irradiated samples [20,21]. Effect
of tacticity on degradation was investigated as well [22]. Low pressure Hg
lamps require more exposure, on the order of several hours, to create
polyenes in PVC. In these studies, low concentration of longer polyenes
compared to shorter ones, were reported [23]. Several oxidation products
were detected and assigned by deconvolution of the carbonyl region in FTIR
spectroscopy, and the quantum yield for n=3 polyene was calculated as 1.6 x
10" [24]. Although pure PVC is transparent in visible and UV region down to
200 nm, light absorbing impurities such as solvent residues, carbonyl bonds,
and internal double bonds are considered to be the initiation centres in photo-
dehydrochlorination of PVC [20-23].
Gamma ray irradiation creates polyenes in PVC in just minutes, and
ESR spectra of gamma irradiated PVC samples indicate the presence of the
polyenyl radical, an unpaired electron associated with a long sequence of
conjugation, with a symmetric singlet signal with no apparent fine structure
[25]. Effect of gamma ray irradiation on crosslinking and physical properties
of the polymer with and without stabilisers were studied extensively [26-28].

Particle induced effects on PVC were studied by means of beta [29],
proton [30], and neutron [31] irradiation, but these studies attracted less
interest.
1.2.3. Chemical Decomposition
It is also possible to employ chemical means for dehydrochlorination
of PVC. Use of strong bases such as potassium tertiobutylate [32] and 1,8-
diazabicyclo{5,4,0}undec-7-ene [33], and phase transfer catalysts such as
poly (ethylene glycol)s [34], in solution, led to polyacetylene like material by
almost complete dehydrochlorination.
1.2.4. Theoretical Calculations and Modelling
Quantum chemical calculations on PVC and model compounds such
as various chloroalkanes and chloroalkenes and mathematical modelling
were carried out for obtaining a better understanding of elimination
mechanisms by comparing activation enthalpies as well as kinetic data. In
these studies, activation, termination of the elimination and effect of HCI on
the kinetics of degradation, were discussed in the context of molecular, ionic
and radical mechanisms with defect free polymers [35-43].
According to these studies, in the initial stages of thermal degradation,
at low temperatures and in inert atmosphere, HCI is eliminated from a
monomeric unit by a 1,2 elimination. The transition state has four centers and

it requires a synperiplanar conformation and extensive polarisation of the
C-CI bond [35]. In the presence of HCI, 1,2 elimination through a six-centre
transition state is possible with lower activation energy and lower activation
entropy [35,36] as shown in Figure 2. In the presence of a double bond
elimination of HCI is much faster due to the allylic activation of a-chlorine.
Allylic activation arises, due to increase in total energy as a result of chlorine
and double bond repulsion, and stabilisation of the transition state as a result
of 7i-electron conjugation between transition state and carbon carbon double
bond [37]. Activation exists for p-chloro allylic fragments as well [38].
The polyene growth proceeds by 1,4 elimination of HCI through a six
centre transition state and 1,3 rearrangement of hydrogen atoms catalysed
by HCI, as presented in Figure 3. The reaction stops when a trans double
bond is formed and there is no HCI to catalyse trans-cis isomerisation. The
autocatalytic effect of HCI on PVC degradation is linked to the interaction of
HCI with the double bonds. The Ti-complex formed accelerates the reaction
and increases number of conjugation [39].

Figure 3. 1,4 elimination of HCI and 1,3 rearrangement of hydrogen atoms
The activation energy of decomposition of PVC remains almost
constant as the polyene chain grows and number of conjugated double
bonds increases. One of the proposed termination reasons is the loss of
optimum dihedral angle for activation as a result of torsional vibrations,
shown in Figure 4, as supported by formation of short polyenes with
increasing temperature [37,41].
Figure 4. The optimum dihedral angle for HCI elimination
The effect of tacticity of polymer on degradation is still uncertain. In
early experimental studies, isotactic [22], and syndiotactic [37] sequences
were reported to yield longer polyenes. However, in a recent theoretical

paper it was concluded that tacticity has no significant effect on thermal
degradation [40].
At elevated temperatures and in the presence of impurities, radical
mechanisms take place, as shown in Figure 5 [35,38]. The growth of polyene
sequence, in this case, is one directional and in the direction of allylic
chlorine since dissociation energy of the C-CI bond is about 90 kJ/mol less
than that of the C-H bond. The radical mechanism plays a significant role in
photo-degradation as well.
Recently, the energies for So-Si and So-Ti electronic transitions and of
energy barriers for rotation about double bonds in polyenes and polyenyl
carbocations have been calculated and reactivity of pólenes was discussed
[36]. It has been reported that polyenes having more than 8 conjugated

double bonds are highly reactive at 180-200 °C and that Friedel-Crafts
alkylations, inter and intramolecular Diels-Alder cyclisations occur as shown
in Figure 6 [35,36].
In a detailed study about the energetics of PVC degradation [35],
energies, geometries, charge and spin densities were calculated by semi-
empirical Modified Neglect of Diatomic Overlap (MNDO) with AMI
parametrisation. The authors reported that, for small test molecules, the
MNDO method with AMI parametrisation, gave better results than ab-initio
STO-3G, comparable results to 3-21G, and slightly worse results than 6-31G
methods, considering the enthalpies. For large molecules, AMI is expected
to perform even better, due to built-in corrections for electron correlation.
Activation enthalpies calculated for dehydrochlorination of 2,4,6-
trichloroheptane stereoisomers are given in Table 1. The overall enthalpy of
dehydrochlorination reaction is about 40-44 kJ/mol, while the activation
enthalpy is about 225 kJ/mol.
10

Table 1. Activation enthalpies dehydrochlorination of 2,4,6-trichloroheptane stereoisomers [35].
Reactant Product ReactionConfiguration AHf^ Configuration AHf AHr^ AHr''
C l C l C l C l C l
-282.0 -149.0 223.8 40.6
(2S, 4S, 6R) isotactic
trans (2S,6R)
C l C l C l C l
-287.9 -146.4 231.8 49.0(2S. 4S. 6R)
isotacticd i
CIS (2S,6R)
Cl C l Cl C l Cl
-286.6 -149.0 220.1 45.2
(2S,4R,6R)syndiotactic
trans (2S.6R)
Cl Cl Cl Cl
-282.0 -146.4 225.1 43.1
(2S,4R,6R)syndiotactic
d i
CIS (2S.6R)
Cl Cl Cl Cl Cl
-279.5 -148.5 219.2 38.5
(2S.6S)atactic
trans (2S,6S)
-273.2
C l
-145.2 228.0 35.6
(2S,6S)atactic
.
C l
CIS (2S,6S)
Calculated formation enthalpy for the conformer that generates the product Difference between the reagent and the product including HCI (AHf= -92.5 kJ/mol) Enthalpy values are in kJ/mol
11

1.2.5. Prevention of Degradation
Several stabilisers have been proposed to prevent the degradation.
These stabilisers added into the polymer, for thermal or photo-stabilisation
purposes must meet some basic requirements [44]. These requirements can
be summarised as;
a. Absorption and neutralisation of HCI evolved,
b. Displacement of active, labile substituent groups, such as the chlorine
atom attached to a tertiary carbon, or an allylic chlorine,
c. Neutralisation or inactivation or stabiliser degradation products,
d. Ability to disrupt progression of chain reactions,
e. Neutralisation or inactivation of resin impurities, contaminants, catalyst
residues, end groups etc.,
f. Provision of a shield, protective screen for UV radiation.
The most effective stabilisers are those which function by actively
attacking weakly held labile chlorine atoms on PVC and replacing these with
other groups of inherently greater stability. Heavy metal carboxylates and
mercaptides, such as soaps of cadmium and zinc, and the dialkyl tin
carboxylates and mercaptides stabilise PVC by exchanging their ligands with
the labile chlorines on PVC. However, the effectiveness of these
displacements is limited. Since carboxylates and mercaptides also react with
HCI, they are consumed over time. Furthermore, the formed heavy metal
chlorides are Lewis acids, which catalyse degradation reactions. Thus, co
stabilisers are required to remove heavy metal chlorides from the system.
The widely used chlorine acceptors are the alkaline earth metal carboxylates,
such as barium laurate, (-(CH2)ioCH3), soap. In the presence of the
12

co-stabiliser, the stabiliser is regenerated by transfer of ligands from the
co-stabiliser to the stabiliser, and alkaline earth metal chlorides form. Heat
stabilisers and co-stabilisers are generally used in mixtures of 1:2 or 2:1 ratio.
On the other hand, UV radiation screens, being transparent in the
visible region of the spectrum, should be able to absorb UV radiation and
dissipate the energy harmlessly. The photo-stabilisers, which are widely used
in suntan lotions as well, are the 2-hydroxybenzophenones, the
2-(2’-hydroxyphenyl)benzotriazoles, the salicylate esters, the aryl-substituted
acrylates, and the p-aminobenzoates.
1.2.6. Utilisation of Degradation
The simplest conducting polymer, polyacetylene, is composed of
alternating single and double bonds, and it is a model for infinite one
dimensional system [45]. It is actually composed of very long polyene chains
of different lengths. Exploring how the small building blocks behave under
certain stimuli may offer a better understanding on how the real system
works. For this reason, studying polyenes is important to have a better
understanding of non-linear optical and electrical properties of polyacetylene.
Several theoretical studies combined with experimental work have been
carried out to explore the electronic structure of polyenes with different
lengths [46-49]. Since one of the easiest methods for obtaining polyenes is
the dehydrochlorination of PVC, the current study can be summarised as;
13

i) Benefiting from photo-dehydrochlorination of PVC by capturing the
released HCI by basic molecular and/or polymeric traps, which change their
optical and/or electrical properties upon capture,
ii) Investigation of polyene formation in photo-dehydrochlorination of
PVC using different wavelengths of UV light and wavelength tuning agents as
sensitisers.
1.3. Conducting Polymers
Conducting polymers, with conductivities ranging from that of pure
silicon to that of copper, have delocalised 71-electrons along the conjugated
polymer backbone. Due to the overlap of tt orbitals of one monomeric unit
with that of its neighbours, valence and conduction bands form. These
extended orbitals give rise to high electron mobilities along the polymer
chain. In the undoped state, these polymers are wide-band-gap
semiconductors and are mainly insulating. However, when charge transfer
agents (dopants) are added to the polymer, they can oxidise or reduce the
polymer, dramatically changing the geometry and electronic structure. The
partially oxidised polymer backbones with associated counterions are
electron deficient or have excess of electrons on the chain producing defect
states in the gap and possibly a metallic like partially filled band and a high
conductivity [50].
Polyaniline is usually synthesised by oxidative polymerisation of
aniline with ammonium persulfate, (NH4)2S20e, in acidic medium [51].
14

Polyaniline is composed of reduced and oxidised repeat units as shown in
Figure 7. The relative amounts of oxidised and reduced units determine the
intrinsic oxidation state of the polymer. The oxidised and reduced units can
be monitored by FTIR spectroscopy with the N=Q=N stretching peak around
1600 cm' and N-B-N stretching peak around 1500 cm '\ where Q and B
designate the quinoid and benzoid forms, respectively [52].
The metallic form of polyaniline, known as the emeraldine salt, can be
obtained by either oxidation of neutral leucoemeraldine (y=0), or by
protonation of the emeraldine base (y=0.5). In the latter case, there is no
change in total number of n electrons, the metallic state results from the
internal redox reaction, proton induced spin unpairing as pictured in Figure 8
[50,53].
15

The conducting form of polyaniline, has a broad polaron band starting
from approximately 800 nm and extending to NIR region [54]. 2-CI PANI can
be thought of modified PANI and it has oxidised and reduced units as well.
The spectroscopic comparison of PANI and 2-CI PANI will be discussed in
the later chapters.
1.4. Conducting Polymer Blends
Conducting polymers have wide range of applications, which are
restricted by their poor processibility and poor mechanical properties. Many
researchers proposed blends of conducting polymers with insulating
polymers to improve their mechanical properties. Some of these studies
included polyvinyl chloride and polyaniline/polypyrrole blends [55-61].
Preparation and characterisation of electrically conductive PVC by
dehydrochlorination from PVC/PPy composite film was also reported [62]. In
this paper, authors without much of supporting data, claimed that the UV
radiation photodegraded PVC and the formed polyenes were doped by the
NO2 radical formed from photodecomposition of PPy, which had been
previously doped with the NO3· anion. The conductivity of the blend after
irradiation was attributed to doped polyenic sequences.
A recent study proposed incorporating basic forms of conducting
polymers into the PVC matrix by blending, and using the in-situ created HCI
during photodegradation of PVC as dopant to convert the nonconducting
16

form of the conjugated polymer to its conducting form [63]. In this way, the
easily processable basic form was converted to the conducting form within a
mechanically strong insulating matrix, only when the conversion was desired,
and this was achieved only with a light source.
1.5. pH Indicators
A pH indicator is a weak acid or base with a very intense color. The
chemical form of the indicator changes upon capture or release of a proton.
The colour of one form is markedly different from its other form [64]. The
structures of different forms of Methyl violet and Bromcresoi green are given
in Figure 9 and Figure 10 respectively. Methyl violet has a yellow colour
below pH 0.0 and a violet color above pH 1.6. Bromcresoi green has a yellow
colour below pH 3.8 and a blue color above pH 5.4 [65].
Figure 9. Structure of base and acid forms of Methyl violet
17
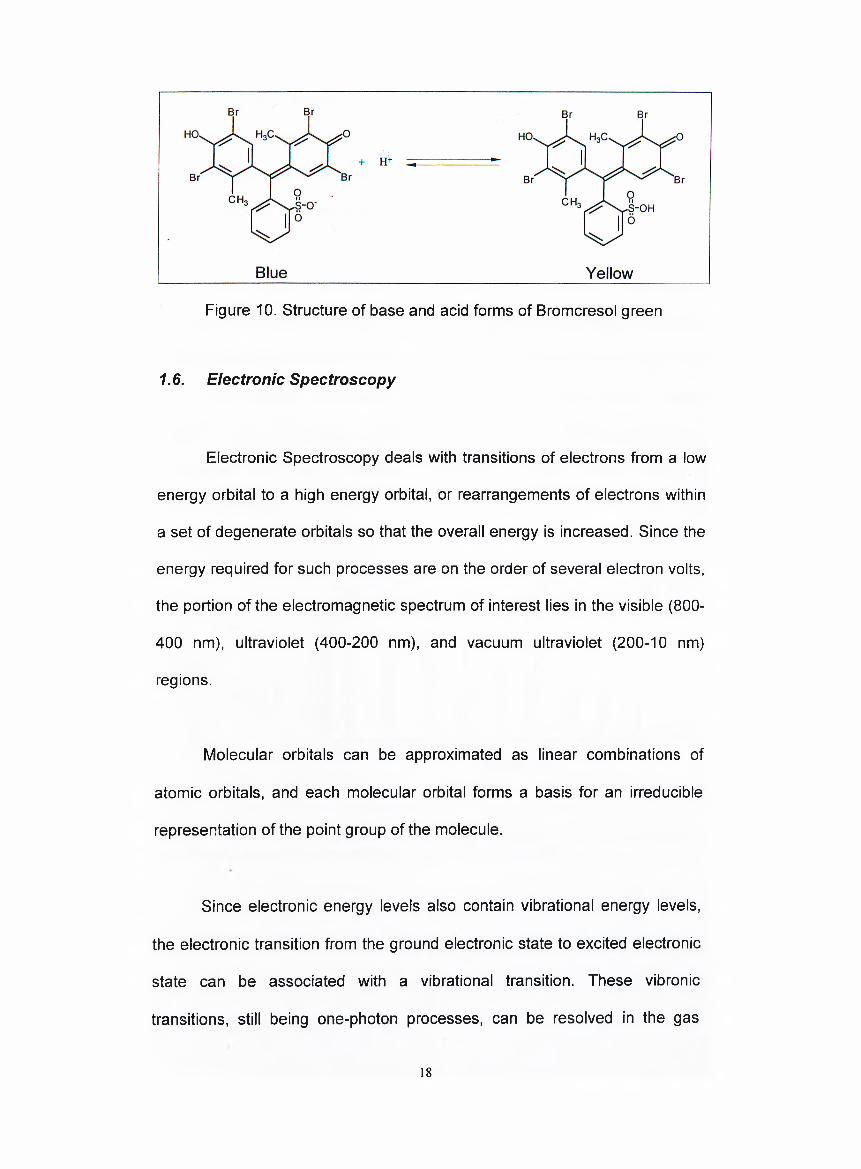
Figure 10. Structure of base and acid forms of Bromcresol green
1.6. Electronic Spectroscopy
Electronic Spectroscopy deals with transitions of electrons from a low
energy orbital to a high energy orbital, or rearrangements of electrons within
a set of degenerate orbitals so that the overall energy is increased. Since the
energy required for such processes are on the order of several electron volts,
the portion of the electromagnetic spectrum of interest lies in the visible (800-
400 nm), ultraviolet (400-200 nm), and vacuum ultraviolet (200-10 nm)
regions.
Molecular orbitals can be approximated as linear combinations of
atomic orbitals, and each molecular orbital forms a basis for an irreducible
representation of the point group of the molecule.
Since electronic energy levels also contain vibrational energy levels,
the electronic transition from the ground electronic state to excited electronic
state can be associated with a vibrational transition. These vibronic
transitions, still being one-photon processes, can be resolved in the gas
18

phase. Figure 11 shows the gas phase vibronic transitions of CO. However,
in condensed phase, they usually can not be resolved and the electronic
spectrum appears as a broad band. It is possible to sharpen the spectra by
using non-polar solvents and/or reducing the temperature.
The relative “allowedness” of electronic transitions depends on
selection rules, which arise from quantum mechanical considerations such as
antisymmetrisation of the total wavefunction, transition moment integral, and
the Franck-Condon principle [66-68]. The relative “allowedness” directly
reflects on the extinction coefficient, £, which is an intrinsic property of
molecules. For spin forbidden transitions, e lies in the range of
10’®-10° M‘ cm'V
Figure 11. The electronic transition with 0-0 vibrational (solid line), and 0-1 vibrational (dashed line) transition, (1 kK=1000 cm‘ ) [66]
For spin allowed, but orbitally forbidden transitions, the range for z is
10°-10^ M' cm‘\ For both spin and orbitally allowed transitions, z reaches
the range of 10°-10^ M" cm‘\ Since the geometries of a molecule in its
electronic ground state and its electronic exited state are not necessarily the
19

same, the 0-0 transition is not necessarily the most intense transition. The
Franck-Condon Factor, which is actually the overlap integral of vibrational
wavefunctions of ground and excited electronic states, determines the
intensities of vibronic transitions within the above given limits [66].
The selection rules can be summarised as follows;
The Spin Selection Rule: A transition is spin allowed if and only if the
multiplicities of the two states are identical. This follows from the
orthogonality of spin wavefunctions. Spin selection is the strictest selection
rule [67,68].
The Orbital Selection Rule: An electronic transition is orbitally allowed if and
only if the triple direct product r (\|/e) x F (pe) x F (vj/e) contains the totally
symmetric irreducible representation of the point group of the molecule. A
simpler expression is that orbital angular momentum should change by 0 or
±1 units, so that Z-E, FI-E, A-FI transitions are allowed. It is necessary to
mention that Z'-Z', Z·"-!!, Z’-FI transitions are allowed while Z -Z'
transition is forbidden. For centrosymmetric molecules g<^u transitions such
as rig- FIu, and ^Zu’ - Zg"’ transitions are allowed [67,68].
Electronic spectra of all trans linear polyenes can be well described
within the Born-Oppenheimer approximation, where the total wavefunction is
factorised into nuclear, electronic, and vibrational parts. The discussion can
be reduced to many electron states built from n orbitals only. Considering the
linear combinations of 2p atomic orbitals per one sp^ hybridised carbon atom,
and even number of electrons, the final states will have either Ag or Bu
symmetry of the C2/7 point group. The ground state of a linear polyene is 1 Ag
20

with lowest energy molecular orbitals doubly occupied. The next excited
state, 2 ^Ag is a correlated state, which is a combination of doubly excited Ag2
(promotion of two electrons from HOMO to LUMO), and Ag3 (promotion of
one electron from HOMO to LUMO+1 or from HOMO-1 to LUMO), as shown
in Figure 12. The first transition is dipole forbidden. The second excited state,
1 Bu, is generated by excitation of one electron from HOMO to LUMO without
change of spin and is the first allowed transition in the electronic spectrum of
linear polyenes.
Figure 13 shows the optical spectra of diphenylhexatriene in the gas
phase. The smooth curve from 3200 to 3600 A is the absorption of vapor at
90 °C. The highly structured spectrum is the flourescence excitation
spectrum for diphenylhexatriene vapor seeded into supersonic He expansion.
The first transition is the allowed I^Bu -^I^Ag transition (3200-3450 A), and
the second one is the forbidden 2 Ag *<—I^Ag transition (3450-3500 A) [69].
As the number of conjugated double bonds in linear polyenes
increases, the number of peaks in electronic spectra increases and shifts to
longer wavelength. Table 2 lists the allowed electronic transitions of some
polyenes, in n-pentane, together with the vibrational transitions and relative
extinction coefficients in parenthesis [70].
As seen in Table 2, peaks of different polyenic sequences overlap with
each other. Therefore, the electronic spectrum of dehydrochlorinated PVC is
the superposition of peaks contributing for each polyenic sequence present,
weighted by its concentration, as presented in Figure 14.
21
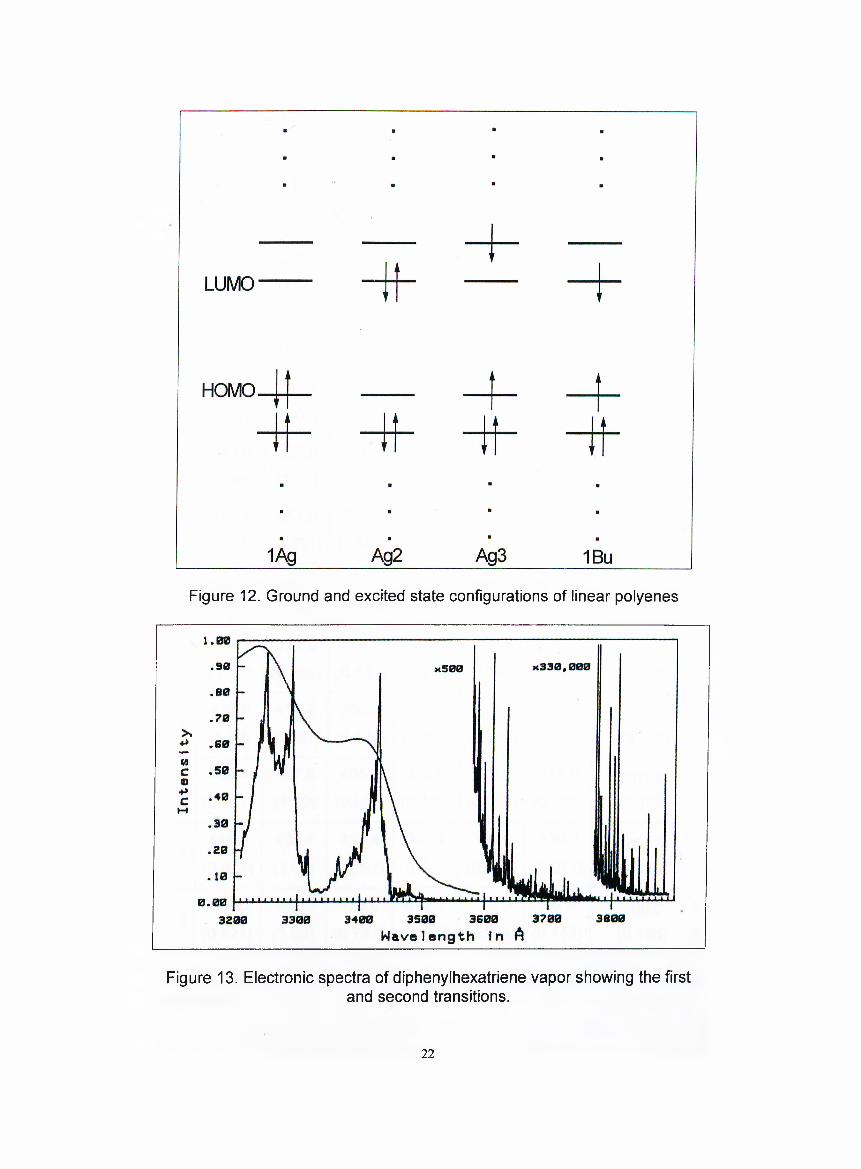
Figure 12. Ground and excited state configurations of linear polyenes
Figure 13. Electronic spectra of diphenylhexatriene vapor showing the firstand second transitions.
22

Table 2. UV-Vis data of polyenes in n-pentane [70].
I^Bu 2 'B u ^ l'A g
n 0-0 0-1 0-2 0-3 0-0 0-1 0-0
2237.2
(0.688)
227.8
(1.00)
219.8
(0.948)
3275.6
(0.766)
264.8
(1.00)
255.6
(0.779)
4311.4
(0.897)
297.4
(1.00)
284.8
(0.683)
274.6
(0.369)
5343.0
(0.991)
325.8
(1.00)
311.0
(0.615)
279.8
(0.294)
237.8
(0.062)
6371.2
(1.00)
351.0
(0.931)
334.2
(0.558)
319.0
(0.258)
258.2
(0.037)
250.0
(0.032)
7396.2
(1.00)
373.6
(0.906)
355.6
(0.520)
338.0
(0.239)
277.6
(0.035)
267.8
(0.026)
8418.8
(1.00)
394.0
(0.869)
374.0
(0.531)
354.2
(0.254)
296.4
(0.046)
285.6
(0.033)239.0
(0.123)
9438.8
(1.00)
411.2
(0.921)
390.2
(0.574)
371.8
(0.290)
313.6
(0.080)
301.8
(0.059)253.0
(0.179)
10456.4
(0.977)
427.8
(1.00)
405.2
(0.638)
382.6
(0.310)
330.8
(0.099)
317.6
(0.056)267.8
(0.165)
11468.8
(0.921)
439.4
(1.00)
414.4
(0.657)
393.4
(0.340)
346.0
(0.106)
330.0
(0.071)282.0
(0.159)
13494.0
(0.921)
462.0
(1.00)
438.0
(0.757)
412.0
(0.450)
370.0
(0.214)
352.0
(0.143)306.0
(0.186)
Numbers are in nanometers and relative extinction coefficients are in parenthesis.
23

24

A chemical bond between two atoms can be modelled as a harmonic
oscillator, a spring with two masses on each end. The restoring force is
written as, F = -kq, where k is the force constant, and q is the
displacement from equilibrium position (r-re). The potential energy, the
1 ,coordinate derivative of force, can be written as V = -k q . Quantum
2
mechanically, the molecule can have only discrete energy levels in the
harmonic oscillator potential well, and this is expressed as
1.7. Infrared Spectroscopy
E.. =O
D + - 2y f j -2k \ fx
r O I [ko + -h (v , where <» = - — , k is the oscillator 2J 2V/ i
strength and jj. is the reduced mass (// =IW, +/«2
m , / « 2 j
). The values of u can
only be positive integers, and when t>=0, the zero point energy of the
molecule is equal to It is clear that AE can only be integer
multiples of hco. In reality, the potential is not a perfect harmonic oscillator
potential, but it has the form, V = , which is called the Morse
potential as shown in Figure 15. is the depth of the potential well, and p
is a measure of the curvature at the bottom of the well.
Using this potential, vibrational energy levels are calculated as
E , = m ( o + - ) - m x ( v + - y , where m, is the oscillator strength, andU if ^ ' if if ^ ^ w
is a small anharmonic correction [66]. The oscillator strengths fall in the
25

electromagnetic spectrum has the right amount of energy to raise the energy
level of a bond. The frequencies of respective bonds in a molecule are
affected by the molecular environment, so they cover a range of frequencies
instead of a single frequency. Figure 16 shows the stretching and bending
vibration ranges of organic molecules [71]. For an IR absorption to take
place, the electronic charge distribution within the molecule must change
during vibration.
With the introduction of Fast Fourier Transform technique and
interferometry based instruments, FTIR spectroscopy provides quick and
reliable information about the chemical structure of a molecule. Chemical
changes such as bond breaking, or bond formation, during a process can
easily be monitored with FTIR spectroscopy.
region of 10 -10 cm’\ and infrared region (4000-200 cm' ) of
Figure 15. Comparison of harmonic potential and Morse potential for HBr molecule
26

Infrared
Gannrna ray X-Ray uv Visible Microwavewavelength (|i) 1(f 0.2 0.4.
Stretching Vibrations
Bending Vibrations
^ = # | · = · = ·
A
0.8^'^ ^^2C)0
C=C, C=N
C=0 · = = ·
C-C, C-0, C-N
- 1 ----- 1------ 1----1----1------ 1---- 1------1---- 1----- 1----1------ 1----1------1---- 1------1---- 1-----5000 4500 4000 3500 3000 2500 2000 1500 1000 500
____________________________ wavenumber (cm~ )_________________________
Figure 16. Vibrational infrared frequencies of organic molecules
■/,8. X-Ray Photoelectron Spectroscopy
XPS (X-Ray Photoelectron Spectroscopy) or ESCA (Electron
Spectroscopy for Chemical Analysis) is a technique for measuring binding
energies of the electrons. Under ultra high vacuum conditions (10'® Torr),
monoenergetic X-rays, usually Al K„ at 1486.6 eV or Mg Kaat 1253.6 eV, hit
the target, and core level as well as valence electrons from the surface atoms
are ejected. Kinetic energy of the ejected electrons is measured and the
binding energy of the electrons with respect to the Fermi level is computed.
Binding energy data, which carry information about the final states of the
atoms, are used for identifying the elements in the sample. Depending on the
27

chemical environment and the oxidation state, small shifts in binding energy,
on the order of few eV, are observed for elements. These shifts, known as
the chemical shifts, help to distinguish between different forms of the same
element. XPS data can be quantified when line intensities are corrected for
photo-ionisation cross sections of the elements [72].
28

2. EXPERIMENTAL
2.1. Sample Preparation
Polyvinyl chloride was purchased from Aldrich and was used without
further treatment. The FTIR spectrum of PVC as a KBr pellet is given in
Figure 17. The spectrum indicates the absence of any significant impurity
and UV absorbing chromophore groups such as carbonyls. The assignment
of the bands is given in Table 3 [13]. XPS spectrum of PVC powder,
indicating the presence of O, C, and Cl in the structure is shown in Figure 18.
Source of oxygen is mainly the adsorbed water [73].
Figure 17. The FTIR spectra of PVC powder
29

Table 3. FTIR Band Assignments of PVC [13]
Band Position (cm'^) Assignment2970 C-H Stretch ofCHCI2912 C-H Stretch of CH21900 C=C=C-H1718 C=0 (photooxidation)1595 Conjugated Double Bonds1435 CH2 Deformation1331 C-H Deformation of H-CCI1099 C-C Stretch966 CH2 Rocking
600-700 C-CI Stretch
Figure 18. XPS Spectra of powder PVC
Tetrahydrofuran (THF) was reagent grade from Carlo Erba. THF
contains 0.05 % hydroquinone to avoid peroxide formation. Hydroquinone
presence was proved by the FTIR spectrum of the residue left after
continuous evaporation of THF on a NaCI disk. The FTIR spectrum of the
30

residue and the reference spectrum of hydroquinone are given in Figure 19.
The most intense peak of THF at 1070 cm '\ and the most intense peak of
hydroquinone at 1240 cm'^ are used to monitor these species in polymer
blends. Hydroquinone in THF was removed by distillation over KOH prior to
use. The UV spectra of THF, before and after distillation, are given in Figure
20. The characteristic peaks of hydroquinone disappear after distillation.
Figure 19. FTIR Spectra of hydroquinone (a), and THF residue (b)
31

wavelength (nm)
Figure 20. UV-Vis Spectra of THF, before (a) and after (b) distillation
Methyl Violet (MV) and Bromcresol Green (BG) were obtained from
Fiuka, and used without further purification.
Aniline and 2-CI-aniline monomers were purchased from Aldrich and
used without further treatment. Polyaniline (PANI), and Poly-2-chloro aniline
(2-CI PANI) were synthesised by polymerisation of the corresponding
monomers in acidic aqueous medium in the presence of ammonium per
sulfate (NN4)28208 as the oxidising agent [51]. The basic forms of the
polymers were obtained by further basic treatment of the dried products. The
FTIR spectra of basic and salt forms of PANI and 2-CI PANI are given in
Figure 21. The change in the intensity of 1600 cm'^ and 1500 cm‘ peaks
indicate the protonation of the imine nitrogens [52], conversion to amine
32

nitrogens by the internal redox reaction [50,53], transforming the insulating
base form to the conducting salt form. Detailed assignment of the IR bands of
PANI is given in Table 4 [52].
The structural change can be monitored by UV-Vis-NIR spectroscopy.
The salt form has a large polaron band [54], whereas the base form does not
have any absorption in that region. The UV-Vis-NIR spectra of insulating and
conducting forms of PANI and 2-CI PANI are given in Figure 22.
2-CI PANI
1500Wavenumber (cm ’)
1000 500
Figure 21. FTIR Spectra of PANI base (a), PANI salt (b), 2-CI PANI base (c), and 2-CI PANI salt (d)
33

Table 4. Assignment of IR bands of PANI [52]
Band Position (cm''') Assignment
3460 NH2 Asymmetric Stretch
3380 NH2 Symmetric Stretch, NH Str.
3310 H-Bonded NH Stretch
3170 =N-H Stretch
1587 Stretch Of N=Q=N
1510 Stretch Of N-B-N
1450 Stretch Of Benzene Ring
1380 C-N Stretch in QBtQ
1315 C-N Stretch in QBcQ, QBB
1240 C-N Stretch in BBB
1105 C-H in plane Bending on 1,4-Ring
1060 C-H in plane Bending on 1,2,4-Ring
895 C-H out of plane Bending on 1,2,4-Ring
830 C-H out of plane Bending on 1,4-Ring
740 C-H Out Of Plane Bending on 1,2-Ring
Q: quinoid, B: benzoid, Bt: frans-benzoid, Be: c/s-benzoid
Hydroquinone (HQ), anthraquinone (AQ), and anthracene (AC) were
from Merck and used without further purification.
PVC, binary systems of PVC/MV, PVC/BG, PVC/HQ, PVC/AQ,
PVC/AC, PVC/PANI, PVC/2-CI PANI and tertiary systems of PVC/HQ/MV,
PVC/AQ/MV, PVC/AC/MV were prepared by dissolving the components in
distilled THF with 1 hour ultrasonic bath. Ratio for binary systems of
34
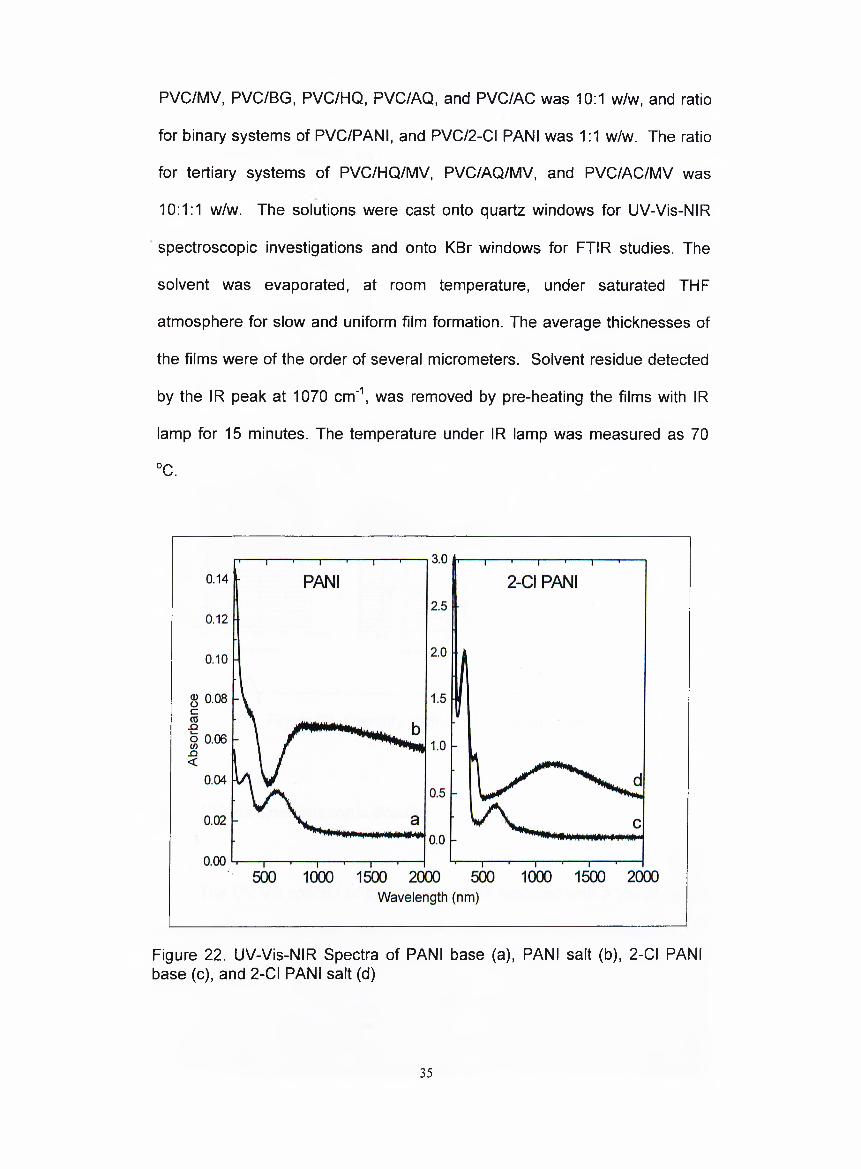
PVC/MV, PVC/BG, PVC/HQ, PVC/AQ, and PVC/AC was 10:1 w/w, and ratio
for binary systems of PVC/PANI, and PVC/2-CI PANI was 1:1 w/w. The ratio
for tertiary systems of PVC/HQ/MV, PVC/AQ/MV, and PVC/AC/MV was
10:1:1 w/w. The solutions were cast onto quartz windows for UV-Vis-NIR
spectroscopic investigations and onto KBr windows for FTIR studies. The
solvent was evaporated, at room temperature, under saturated THF
atmosphere for slow and uniform film formation. The average thicknesses of
the films were of the order of several micrometers. Solvent residue detected
by the IR peak at 1070 cm‘\ was removed by pre-heating the films with IR
lamp for 15 minutes. The temperature under IR lamp was measured as 70
°C.
Figure 22. UV-Vis-NIR Spectra of PANI base (a), PANI salt (b), 2-CI PANI base (c), and 2-CI PANI salt (d)
35

Irradiation studies were carried out with a low-pressure mercury lamp
(7 mW/cm^) emitting a single line at 254 nm, a low-pressure fluorescent filter
coated lamp (8 mW/cm^), which emits mostly at 312 nm, and with a 75 W Xe
source equipped with a monochromator. The intensity profiles of the lamps
are given in Figure 23.
2.2. Irradiation Studies
Figure 23. Intensity profiles of the lamps used
2.3. UV-Vis Spectroscopic Studies
The UV-Vis spectra of the samples were recorded with a Varian Cary
5 spectrophotometer, and a Zeiss UMSP 80 microscope spectrometer.
36

Сагу 5 is а double beam spectrophotometer with deuterium / tungsten
source, 1200 lines/mm diffraction grating and photomultiplier tube for
detection. The samples irradiated with 254 nm and 312 nm lamps were put in
the spectrometer following the irradiation and their spectra were recorded
with 300 nm/min speed and 2 nm spectral band width, through an aperture
with 5.0 mm diameter. The optical schematics of Varian Cary 5E is given in
Figure 24.
The UMSP 80, is a microscope spectrometer with a 75-Watt Xe
source, two monochromators and a photomultiplier tube. The samples were
placed on a x-y stage with micrometer resolution. The irradiation area was 30
pm X 30 pm, and the spectra were recorded from the interior circular area
with 10 |xm diameter with a speed of 600 nm/min. The irradiation line was a
Gaussian distribution with 25 nm FWHM. The optical schematics of the
UMSP 80 is given in Figure 25.
In the spectrometers, the detector response is converted to intensity
ratio of the transmitted light through the sample and the reference for every
wavelength. The ratio, known as the transmittance, can be converted to
percent transmittance by normalisation with respect to reference. The more
informative quantity, the absorbance, is the logarithm of reciprocal
transmittance. The absorbance is related to concentration by the famous
Beer-Lambert Law , (A=ebc), where e is the molar extinction coefficient, b is
the sample path length, and c is the concentration [74].
37

Figure 24. Optical schematics of Varian Cary 5E spectrophotometer
Figure 25. Optical schematics of the UMSP 80
38
The transmission IR spectra were recorded with a Bomem Hartman
MB-102 model FTIR spectrometer. A standard DTGS detector was used and
the total number of scans were 32 with a resolution of 4 cm \ The
spectrometer was not purged.
2.4. FTIR Spectroscopic Studies
2.5. XPS Study
A Kratos ES 300 electron spectrometer, equipped with a Mg Ka
source at 1253.6 eV, was used to record the XPS spectra of powder PVC.
During measurements the base pressure was kept below 10'® Torr. The
spectrometer, functioning in the fixed analyser retardation mode, had a pass
energy of 65 eV. The take-off angle was 90°.
39

3. RESULTS AND DISCUSSIONS
3.1. Photo-degradation of PVC
When solvent cast films of PVC are irradiated at 254 nm and 312 nm,
photo-degradation take places and HCI is evolved. The degradation can be
monitored with the addition of an acid-base indicator, for instance Methyl
Violet, into the polymer matrix. Figure 26 shows the UV-visible spectrum of
the irradiated PVC/MV blend. The gradual decrease in intensity of the Methyl
Violet peak, around 550 nm indicates photo-degradation.
PVC/MV Blend Irradiated at 300 nm
Figure 26. Visible spectrum of irradiated PVC/MV blend
40

However, the absence of any change in the spectral window of 300-
500 nm, shows that although some dehydrochlorination takes place, it is not
sufficient to lead to polyene formation during irradiation at 254 nm and 312
nm within a few hours. Figure 27 shows the UV-Vis spectra of solvent cast
PVC samples exposed to 254 nm and 312 nm irradiation for two hours. This
conclusion is supported with FTIR spectra of the same samples (Figure 28),
that shows no significant change in the intensities of the C-CI and the C-C
stretching, and the C-H bending vibrations.
Figure 27. UV-Vis Spectra of PVC irradiated at 254 (top) and 312 (bottom) nm
41

Solvent Cast PVC Irradiated at 254 nm
Solvent Cast PVC Irradiated at 312 nm
Figure 28. FTIR Spectra of PVC irradiated at 254 (top) and 312 (bottom) nm
3.2. Better Utilisation of Degradation
3.2.1. Blends with pH Indicators
For better utilisation of degradation, pH indicators were employed.
Many pH indicators were blended with PVC and solvent cast films were
42

exposed to UV radiation. Figure 29 shows the optical changes of PVC/dye
blends as a result of irradiation. The dyes used were; 1) Bromcresol Green;
2) Congo Red; 3) Briilant Yellow; 4) Methyl Orange; 5) Bromcresol Purple; 6)
Methyl Violet; 7) Malachit Green; 8) Fluoroscein. The top part of each sample
is exposed to 254 nm for 30 minute. The dyes, which changed color or
intensity in PVC matrix upon irradiation, were tested for UV resistivity. Most
of the dyes themselves were UV sensitive, and photo-degradation of PVC
clearly accelerated their color change. Visible spectra of Bromcresol Green,
as an example, are given in Figure 30. Bromcresol Green had a blue color in
solution and when the solution was acidified its color changed to yellow, as
seen in the right-most spectra of Figure 30. However, the solvent cast dye
had a yellow color, and the color changed to pink, vvtien it was exposed to
254 nm radiation, as seen in the second spectra. When the PVC/BG blend
was irradiated (left-most spectra), the optical change was clearly catalysed.
Figure 29. Irradiated PVC/dye blends

Figure 30. Visible specta of Bromcresol Green as solution, as film, and as blend with PVC
One of the indicators used. Methyl Violet, had a blue color in the basic
form and a yellow color in the acidic form, as shown in Figure 31.
Surprisingly, the dye is resistant to UV radiation, as shown in the second
spectra. The PVC/MV blend films, having originally a blue color, changed
their color to yellow upon irradiation, with the loss of the 550 nm peak, which
is exactly the same behaviour as in MV aqueous solution.
Figure 31. Visible Spectra of Methyl Violet, as solution, as film, and as blendwith PVC
44

With this spectroscopic evidence, it is clearly demonstrated that, UV
irradiation dehydrochlorinated PVC, and that an a c id -b a se r e a c tio n took
place in the blend of PVC with Methyl Violet.
There have been several studies for devising radiation sensing
systems. For this purpose, several pH indicators were blended with various
polymers including PVC. These blend films were exposed to different doses
of gamma irradiation and dosimetric calibration was established [75-79].
However, these films had to be stored in the dark before using to increase
reliability and lifetime. In addition, the possible damage of the indicator upon
irradiation was always underestimated. The MV/PVC system is quite stable
under daylight, and it is well established that the change is only due to
polymer degradation. This system is a good candidate for dosimetric and/or
lithographic purposes.
In Figure 32 and Figure 33, examples of lithographic utilisation are
presented. The first pattern was imprinted by irradiating the solvent cast
PVC/MV blend at 254 nm, through a 200 micron thick steel mask, which was
placed on the top of sample. The mask was cut with a laser beam to write the
script “BILKENT” on it. The second pattern was developed by irradiating the
solvent cast PVC/HQ/MV blend at 300 nm, through a quartz mask. The mask
had a previously printed pattern on it, and was placed right after the
monochromator. The shadow of the pattern was projected on the sample. As
seen from the scale bars, the first example has macroscopic dimensions,
while the second has microscopic dimensions. The latter figure can be
45

scanned in the x-direction recording the absorbance at 600 nm, and Figure
33 also shows the fidelity of the printed pattern in terms of absorbance
change in lateral direction.
•iLKENTi1 cm
Figure 32. Lithographic application of PVC/MV blend in macro scale
Figure 33. Micro scale lithographic pattern and its lateral absorbance change
3.2.2. Blends of PVC with Conducting Polymers
Conducting polymers were also used for better utilization of
degradation. Basic forms of PANI and 2-CI PAN! were blended with PVC,
and solvent cast films were exposed to UV radiation. Reversibility of the
systems was tested by further exposure to NH3 vapor.
2-CI PANI showed higher solubility in THF compared to PANI, as
expected due to the presence of Cl atom attached to the benzoid ring
46

structure. When the PVC/PANI and PVC/2-CI PANI blends containing the
same amount of the conjugated polymer were exposed to 254 nm UV
radiation, the latter blend showed a very intense polaron band in contrast to
the former as shown in Figure 34. This difference is also believed to reflect to
the measured conductivities. Photo-degradation of PVC at this wavelength
within the irradiation period of 2 hours does not yield polyenes, so the
conductivity of the blends is totally attributable to doped PANI or 2-CI PANI.
The FTIR spectra of the irradiated PVC/2-CI PANI blend are shown in
Figure 35. The change in intensity ratio of 1500 cm' to 1600 cm' bands is a
sign of change in conductivity.
Figure 34. UV-Vis-NIR spectra of Irradiated PVC/PANI and PVC/2-CI PANI blends containing equal amounts of conducting polymer
47

1800 1600 1400 1200 1000 800 600 400________________ V\feivenumber (cm' )____________
Figure 35. FTIR Spectra of PVC/2-CI PANI Blend Irradiated for 2 hours at 254 nm
Figure 36. PVC/2-CI PANI blends exposed to consecutive UV/NH3 and HCI/NH3 cycles
48

Figure 36 shows the PVC/2-CI PANI blends exposed to consecutive
UV/NH3 and HCI/NH3 cycles for comparison. Development of the polaron
band in UV exposed samples indicates doping of the conjugated polymer
with in-situ created HCI. The same is observed with the sample that is
exposed to HCI vapor and doped with an external HCI source. Both samples
return to the undoped state when they are exposed to NH3 vapors. The
system exposed to LIV/NH3 cycles can not maintain reversibility for a large
number of cycles, since more and more HCI is created and used up in time.
Nevertheless, this system is interesting for other applications.
3.3. Wavelength Tuning ofPVC Photodegradation
As shown in previous sections, the wavelength of the irradiation used
for photo-dehydrochlorination of PVC was either 254 nm (471 kJ/mol) or 312
nm (383 kJ/mol). However, the energy carried by the photons of these
wavelengths is much more than what is required for cleavage of a C-CI bond,
which is about 340 kJ/mol (350 nm). Theoretical activation enthalpy of gas
phase dehydrochlorination was calculated to be 225 kJ/mol (530 nm) [35].
The maximum rate of dehydrochlorination was reported to take place at 370
nm [16], which is also higher than the expected threshold. To understand the
energetic requirements of the process, a careful study on energetics and the
energy onset must be carried out.
As mentioned in previous sections, there are practical ways to monitor
dehydrochlorination of PVC, such as incorporation of pH indicators or basic
49

forms of conducting polymers into PVC matrix. In the former case, the
decrease in the dye peak, 550 nm for Methyl Violet, can be used to monitor
the extent of dehydrochlorination and in the latter case, formation of a
polaron band can be used to gauge dehydrochlorination, as shown in Figure
37. However, only PVC/MV systems, enable us to monitor polyenes, since
the spectral window of 320-460 nm is not obscured.
Figure 37. Dehydrochlorination monitoring tools
As concluded from HCI release, isolated double bonds are created in
PVC chain, but no polyenes form, as a result of UV radiation of short
duration. The result can be linked to very low quantum yield of the overall
process, since PVC has no absorption bands in the spectral region of
interest. This limitation could be overcome using a very intense radiation
source such as a laser, and long polyenic sequences could be obtained [80].
Another approach is to introduce sensitisers into the polymer matrix,
which absorb in the spectral region of interest, and irradiate the sample at the
peak position of these impurities. For this purpose, hydroquinone,
anthraquinone, and anthracene were blended with PVC, and the blends were
50

irradiated at their peak positions using monochromatic light. Figure 38 shows
the UV spectra of the additives used in THF. Methyl violet was also
introduced into the systems as the third component to monitor the extent of
dehydrochlorination.
Figure 38. UV spectra of additives used
UV-Vis spectra of the PVC/HQ/MV blend irradiated at the peak
position of hydroquinone, 300 nm, for 3 hours are given in Figure 39. The
decrease in the MV peak intensity is an indication of dehydrochlorination.
However, polyene formation (in 320-500 nm region), accompanied the first
process in contrast to the system without HQ (Figure 37). Moreover, the HQ
peak intensity did not change apart from the increasing background
51

absorption. This suggests that HQ simply acts as a sensitiser, and transfers
the energy it absorbs to the PVC matrix.
Figure 39. UV-Vis spectra of PVC/HQ/MV blend irradiated at 300 nm
When the PVC/HQ blends were irradiated for 90 minutes, at and
slightly off the peak position, 300, 280, and 320 nm, chain length distribution
of the polyenes varied as shown in Figure 40. The difference may arise from
the wavelength of irradiation, together with the amount of the transferred
energy, since the absorbance of HQ at 280 nm, 300 nm, and 320 nm are
different.
The energy onset for the PVC/HQ system is near the peak position of
HQ. Figure 41 shows the 20 minute irradiated PVC/HQ/MV blend with
52

wavelength starting from 600 nm down to 300 nm. The immediate decrease
of the MV peak intensity after irradiation with 600 nm can be attributed to
matrix relaxation and thickness change due to dissipated heat. After matrix
was stabilised, no significant change in MV peak took place with irradiation at
lower wavelength, until 320 nm irradiation. Irradiation at this wavelength,
caused dehydrochlorination and polyene formation.
PVC/HQ Blends Irradiated for 90 min
Figure 40. Effect of wavelength on polyene chain length distribution
53

Figure 41. Energy onset for PVC/HQ/MV blend
UV-Vis spectra of the PVC/AQ/MV blends irradiated at the peak
position of AQ, 330 nm, are presented in Figure 42. Irradiation caused HCI
release as detected by the decrease in MV peak intensity, and increased
background absorption in 350-500 nm region, which is attributable to polyene
formation. However, decrease in AQ peak intensity suggests that AQ is a
reacting species, in addition to sensitising the system.
UV-Vis spectra of the PVC/AQ/MV blend, irradiated at different
wavelengths starting from 450 nm down to 300 nm for 30 minutes are shown
in Figure 43. The AQ in the blend started to degrade at 400 nm, which
coincides with the formation of polyenes. However, HCI release started at
54

375 nm, as understood from the decrease in MV peak intensity. The
maximum decrease of MV peak intensity corresponds to 330 nm irradiation.
PVC/AQ/MV Irradiated at 330 nm
Figure 42. UV-Vis spectra of PVC/AQ/MV blend irradiated at 330 nm
Figure 43. Energy onset for PVC/AQ/MV blend
55

UV-Vis spectra of PVC/AC/MV blends irradiated at peak position of
AC, 382 nm, are shown in Figure 44. As the decrease in MV peak intensity
indicates, dehydrochlorination took place, which was accompanied by
polyene formation (400-480 nm), even within 30 minutes. Decrease in the AC
peak intensities suggest that AC is also consumed in the dehydrochlorination
reaction.
Figure 44. UV-Vis spectra of PVC/AC/MV blend irradiated at 382 nm
UV-Vis spectra of PVC/AC/MV blends irradiated with wavelengths
starting from 700 nm down to 350 nm are shown in Figure 45. Although
dehydrochlorination took place at almost every wavelength, polyene
formation could only be monitored after 400 nm radiation.
56
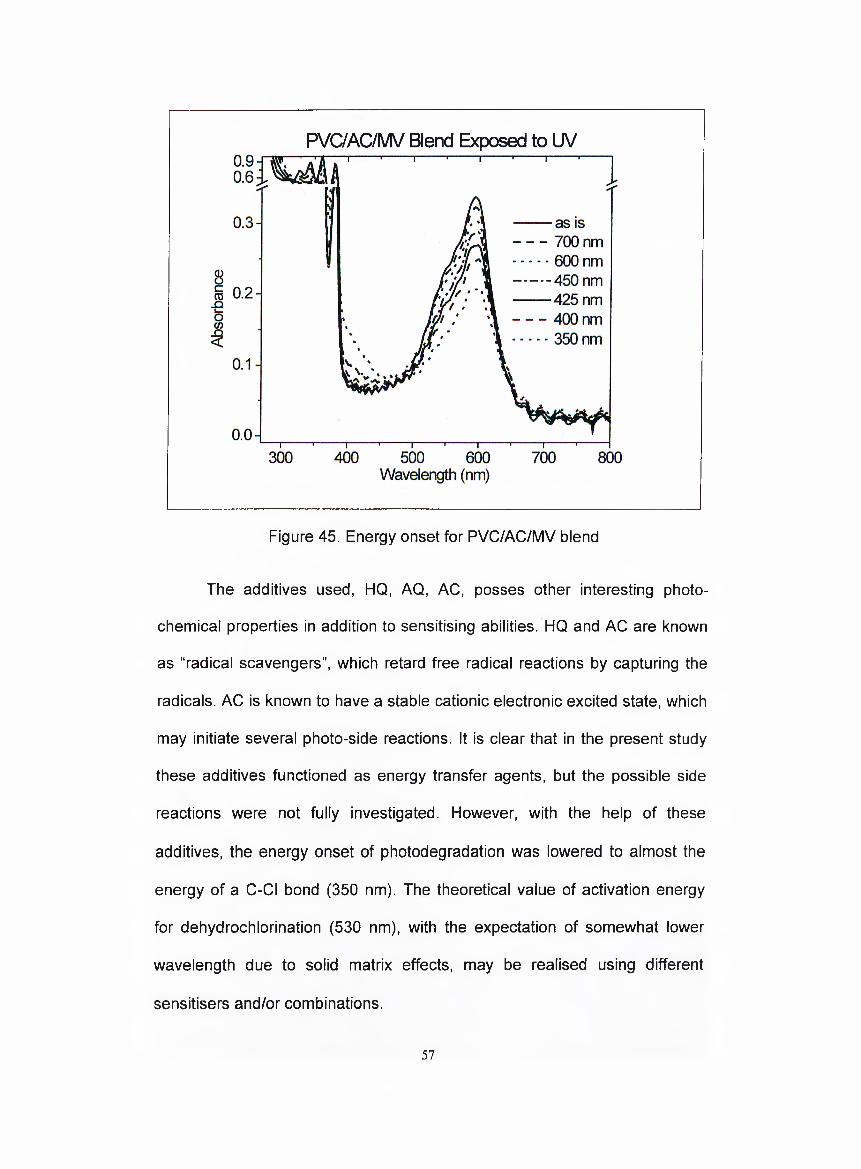
PVaAC/M V Blend Exposed to UV
Figure 45. Energy onset for PVC/AC/MV blend
The additives used, HQ, AQ, AC, posses other interesting photo
chemical properties in addition to sensitising abilities. HQ and AC are known
as “radical scavengers”, which retard free radical reactions by capturing the
radicals. AC is known to have a stable cationic electronic excited state, which
may initiate several photo-side reactions. It is clear that in the present study
these additives functioned as energy transfer agents, but the possible side
reactions were not fully investigated. However, with the help of these
additives, the energy onset of photodegradation was lowered to almost the
energy of a C-CI bond (350 nm). The theoretical value of activation energy
for dehydrochlorination (530 nm), with the expectation of somewhat lower
wavelength due to solid matrix effects, may be realised using different
sensitisers and/or combinations.
57

A suitable additive, which has an absorption in a different region that
AQ and HQ, could be added to the PVC/AQ and PVC/HQ systems to
understand the major function of AQ and HQ (either sensitiser or radical
scavenger, or both).
58
Photodegradation of PVC with short wavelength UV radiation and
monochromatic Xe radiation was investigated. Solvent cast PVC
dehydrochlorinated when exposed to short wavelength UV radiation.
However, polyene formation did not accompany this process, instead isolated
double bonds formed. HCI release was monitored with the acid-base
indicator. Methyl Violet, incorporated in the matrix.
The optical changes of Methyl Violet, incorporated into the PVC
matrix, were mainly due to the capture of the acid released by PVC. This
system, which involves a solvent free a c id -base c h e m is t r y , may be used for
lithographic or dosimetric purposes. Basic forms of conducting polymers
were blended with PVC, and electrical conductivity increases were induced
by irradiation with short wavelength UV radiation. This system may lead to
many novel applications.
In the last part of the study, sensitisers were added to the PVC matrix,
to enable the tuning of the wavelength of photodegradation. Strong polyene
formation accompanied dehydrochlorination as opposed to non-sensitised
systems. With the help of sensitisers, the energy onset of photodegradation
was reduced down to the theoretical C-CI bond cleavage energy. The exact
4. CONCLUSION
59

mechanism of photosensitisation or the photo-side reactions require further
studies with more sophisticated analytical systems and techniques.
60

5. REFERENCES
[1] “Facts and Figures from Chemical Industry,” Chem. Eng. News, vol. 77, pp. 32-73, 1999.
[2] “PVC Demand Reaches A Six-Year High," Plastics and Rubber Weekly, vol. August 1998.
[3] “Japanese PVC Resin Production Up To May,” News and Trends E&SEAsia, vol. 3, pp.19, 1997.
[4] European Council of Vinyl Manufacturers, PVC Centre, www.ramsay.co.uk.
[5] L.F. Albright, “Vinyl Chloride Production,” in Encyclopedia of PVC, L.l. Mass (Ed.), Marcel Dekker Inc., 1976.
[6] A.L. Andrady, A. Torikai and K. Fueki, “Photodegradation of Rigid PVC Formulations. I. Wavelength Sensitivity to Light-Induced Yellowing by Monochromatic Light,” J. Appl. Polym. ScL, vol. 37, pp. 935-946, 1989.
[7] A.L. Andrady and N.D. Searke, “Photodegradation of Rigid PVC Formulations. II. Spectral Sensitivity to Light-Induced Yellowing by Polychromatic Light,” J. Appl. Polym. Sci., vol. 37, pp. 2789-2802, 1989.
[8] A.L. Andrady, K. Fueki and A. Torikai, “Photodegradation of Rigid PVC Formulations. III. Sensitivity of the Photo-Yellowing Reaction in Processed PVC Formulations,” J. Appl. Polym. Sci., vol. 39, pp. 763- 766, 1990.
[9] M. Rogestedt, T. Jonsson and T. Hjertberg, “Effect of Polymerization Initiator on Early Colour of Poly(Vinyl Chloride),” J. Appl. Polym. Sci., vol. 49, pp. 1055-1063, 1993.
61

[10] M. Beltran and A. Marcilla, “PVC Plastisols Decomposition by FTIR Spectroscopy,” Eur. Polym. J., vol. 33, pp. 1271-1280, 1997.
[11] K.S. Misker, V.V. Lisitsky, S.V. Kolesov and G.E. Zaikov, “New Developments in Degradation and Stabilization of Polymers Based on Vinyl Chloride,” J. Macromol. Sci.-Rev. Macromol. Chem., vol. C20(2), pp. 243-308, 1981.
[12] B. Ivan, T. Kelen and F. Tudos, “The Main Elementary Events of Degradation and Stabilization of PVC,” Makromol. Chem., Macromol, Symp., vol. 29, pp. 59-72, 1989.
[13] M. Beltran and A. Marcilla, “Fourier Transform Infrared Spectroscopy Applied to the Study of PVC Decomposition,” Eur. Polym. J., vol. 33, pp. 1135-1142, 1997.
[14] G. Spiliopoulos, M. Statheropoulos and G. Parissakis, “Mass Spectrometric Study of the Stabilization of PVC with Ba/Cd Stearates and Dibasic Lead Phosphite,” Eur. Polym. J., vol. 23, pp. 129-132, 1987.
[15] M.W. Mackenzie, H.A. Willis, R.C. Owen and A. Michel, “An Infrared Spectroscopic Study of the Stabilization of Poly(Vinyl Chloride) by Zinc and Calcium Stearates,”, Eur. Polym. J., vol. 19, pp. 511-517, 1983.
[16] Z. Vymazal and Z. Vymazalova, “Photodegradation of PVC Stabilized by Organotin Compounds,” Eur. Polym. J., vol. 27, pp. 1265-1270, 1991.
[17] B.D. Gupta, L. Jirackova-Audouin and J. Verdu, “Spectrophotometric Study of the Photostabilization of PVC by a Benzylidene Malonate,” Eur. Polym. J., vol. 24, pp. 947-951, 1988.
[18] C.A.S. Hill, “Degradation Studies of Plasticized PVC. I. Multiple Internal Reflection Infrared Spectroscopy,” J. App. Polym. Sci., vol. 27, pp. 3313-3327, 1982.
[19] A.L. Andrady, “Photodegradation,” Adv. Polym. Sci., vol. 128, pp. 49- 92, 1997.
62

[20] J.L. Gardette, S. Gaumet and J.L. Philippart, “Influence of the Experimental Conditions on the Photooxidation of Poly(vinyl chloride),” J. Appl. Polym. Sei., vol. 48, pp. 1885-1895, 1993.
[21] C. Anton-Prinet, J. Dubois, G. Mur, M. Gay, L. Audouin and J. Verdu, “Photoaging of Rigid PVC-II. Degradation Thickness Profiles," Polym. Deg. Stab., vol. 60, pp. 275-281, 1998.
[22] F. Castillo, G. Martinez, R. Sastre and J.L. Millan, “The Effect of Tacticity on the Quantum Yield of Degradation,” Makromol. Chem., Rapid Commun., vol. 7, pp. 319-323, 1986.
[23] A. Kaminska and H. Kaezmarek, “Effect of Copolymers Modifying PVC on its Physical and Mechanical Properties and its UV-Radiation Resistance,” A/igeiv. Makromol. Chem., vol. 134, pp. 187-193, 1985.
[24] S. Deniziigil and W. Schnabel, “Photooxidation of poly(vinyl chloride) at 254 nm in the absence and presence of phthalate plasticizers,” Angew. Makromol. Chem., vol. 229, pp. 73-92, 1995.
[25] R. Salovey, J.P. Luongo and W.A. Yager, “Gamma Ray Induced Degradation of PVC,” Macromolecules, vol. 2, pp. 198-204, 1969.
[26] Z. Hell, Z. Junakovic, F. Ranogajec, I. Dvornik and M. Baric, “Application Problems of PVC Materials Irradiated with High Doses,” Makromol. Chem., Macromol. Symp., vol. 29, pp. 267-275, 1989.
[27] M. Carenza, N. Gligo, G. Palma and L. Busulini, “Contributions to Radiation Crosslinking and Degradation of PVC-Based Mixtures,” Eur. Polym. J., vol. 20, pp. 915-922, 1984.
[28] A. Saxena, V. Kalliyanakrishnan and S.N. Pal, “Studies on the Effects of Gamma Irradiation on Nontoxic PVC Formulations,” J. Appl. Polym. Sci., vol. 34, pp. 1727-1738, 1987.
[29] N. Yagoubi, A. Baillet, B. Legendre, A. Rabaron and D. Ferner, “ß- Radiation Effects on PVC Materials: Methodology for Studying Chemical Modifications,” J. Appl. Polym. Sci., vol. 54, pp. 1043-1048, 1994.
63

[30] J. Rickards, R. Trejo-Luna and E. Andrade, “PVC Film Behavior Under Proton Bombardment,” Radiat. Phys. Chem., vol. 45, pp. 629-636, 1995.
[31] S.J. Reddy, E. Mauerhofer, A. Wohr and H.O. Denschlag, “Chlorine Loss from Polyvinylchloride Under Neutron Irradiation,” J. Radioanal. Nuc. Chem., vol. 223, pp. 233-234, 1997.
[32] E. Simon, P. Fraysse and A. Perichaud, “The Chemical Dehydrochlorination of Polyvinyl Chloride. A New Method For Polyenic Sequences Evaluation,” J.M.S. Pure Appl. Chem., vol. A29(10), pp. 893-903, 1992.
[33] T. Danno, H. Kondoh, K. Furuhata and K. Miyasaka, “Synthesis, Sturucture, and Properties of Conjugated Polyene Films by Dehydrochlorination of PVC Films,” J. Appl. Polym. Sci., vol. 29, pp. 3171-3184, 1984.
[34] L. Guo, G. Shi and Y. Liang, “Polyene Films Prepared by Poly(ethylene glycol)s-catalyzed Dehydrochlorination of Poly(vinyl chloride); Chemical and Electrochemical Properties,” Synth. Metals, vol. 104, pp. 129-135, 1999.
[35] R. Bacaloglu and M. Fisch, “Degradation and Stabilization of Poly(vinyl chloride). V. Reaction Mechanism of Poly(vinyl chloride) Degradation,” Polym. Deg. Stab., vol. 47, pp. 33-57, 1995.
[36] B.B. Troitskii and L.S. Troitskaya, “Degenerated Branching of Chain in Poly(vinyl chloride) Thermal Degradation,” Eur. Polym. J., vol. 35, pp. 2215-2224, 1999.
[37] P. Simon, P. Cernay and L. Valko, “MINDO/3 Study of HCI Elimination from PVC Model Compounds,” Eur. Polym. J., vol. 25, pp. 245-249, 1989.
[38] P. Simon, P. Cernay and L. Valko, “On the Possibility of Both-Sided Polyene Sequences Growth in the Dehydrochlorination of PVC,” Eur. Polym. J., vol. 25, pp. 531-533, 1989.
64

[39] B.B. Troitskii and L.S. Troitskaya, “Mathematical Models of the Initial Stage of the Thermal Degradation of Poly(vinyl chloride)-3. The Thermal Degradation of Poly(vinyl chloride) in the Presence of HCI,” Eur. Polym. J., vol. 31, pp. 533-539, 1995.
[40] B.B. Troitskii, A.S. Yakhnov, M.A. Novikova, T.G. Ganyukhina and V.N. Denisova, “Effect of Tacticity on Thermal Degradation of Poly(vinyl chloride),” Eur. Polym. J., vol. 33, pp. 505-511, 1997.
[41] P. Simon, “Polymer Degradation by Elimination of Small Molecules,” Angew. Makromol. Chem., vol. 216, pp. 187-203, 1994.
[42] R. Bacaloglu and M. Fisch, “Degradation and Stabilization of Poly(vinyl chloride). IV. Molecular Orbital Calculations of Activation Enthalpies for Dehydrochlorination of Chloroalkanes and Chloroalkenes,” Polym. Deg. Stab., vol. 47, pp. 9-32, 1995.
[43] B.B. Troitskii and L.S. Troitskaya, “Mathematical Models of the Initial Stage of the Thermal Degradation of Poly(vinyl chloride)-IV. Influence of Stereoisometry,” Eur. Polym. J., vol. 33, pp. 1289-1294, 1997.
[44] L.l. Mass, “Theory of Degradation and Stabilisation Mechanisms and Actions and Characteristics of Stabilisers,” in Encylopedia ofPVC, L.l. Mass (Ed.), Marcel Dekker Inc., 1976.
[45] Y. Furukawa, “Electronic Absorption and Vibrational Spectroscopies of Conjugated Conducting Polymers,” J. Phys. Chem., vol. 100, pp. 15644-15653, 1996 (and the references therein).
[46] B.E. Kohler, “A Simple Model for Linear Polyene Electronic Structure,” J. Chem. Phys., vol. 93 , pp. 5838-5842, 1990.
[47] B.E. Kohler, L.l. Malysheva and A.I. Onipko, “Molecular Orbital Coefficients and Transition Dipoles of Real Polyenes,” J. Chem. Phys., vol. 103, pp. 6068-6075, 1995.
[48] B.E. Kohler and I.D.W. Samuel, “Experimental Determination of Conjugation Lengths in Long Polyene Chains,” J. Chem. Phys., vol. 103, pp. 6248-6252, 1995.
65

[49] B.E. Kohler and J.C. Woehl, “A Simple Model for Conjugation Lengths in Long Polyene Chains,” J. Chem. Phys., vol. 103, pp. 6253-6256, 1995.
[50] A.P. Monkman, D. Bloor, G.C. Stevens and J.C.H. Stevens, “Electronic Energy Levels of Polyaniline,” J. Phys. D.Appl. Phys., vol. 20, pp. 1337-1345, 1987.
[51] A.G. MacDiarmid, J.C. Chiang, A.F. Richter, N.L.D. Somasiri and A.J. Epstein, “Polyaniline; Synthesis and Characterisation of the Emeraldine Oxidation State by Elemental Analysis,” in Conducting Polymers, L. Alcacer (Ed), D. Reidel Publishing Company, 1987.
[52] J. Tang, X. Jing, B. Wang and F. Wang, “Infrared Spectra of Soluble Polyaniline,” Synth. Metals, vol. 24, pp. 231-238, 1988.
[53] N.S. Sariciftci, L. Smilowitz, Y. Cao and J. Heeger, “Absorption Spectroscopy of Nonlinear Excitations in Polyaniline,” J. Chem Phys., vol. 98, pp. 2664-2669, 1993.
[54] J.L. Bredas and G.B. Street, “Polarons, Bipolarons, and Solitons in Conducting Polymers,” Acc. Chem. Res., vol. 18, pp. 309-315, 1985.
[55] A. Pron, J. Laska, J.E. Osterholm and P. Smith, “Processable Conducting Polymers Obtained via Protonation of Polyaniline with Phosphoric Acid Esters,” Polymer, vol. 34, pp. 4235-4220, 1993.
[56] C.K. Subramaniam, A.B. Kaiser, P.W. Gilberd and B. Wessling, “Electronic Transport Properties of Polyaniline/PVC Blends,” J. Polym. Sci. B, Polym. Phys., vol. 31, pp. 1425-1430, 1993.
[57] M. Thangarathinavelu, A.K. Tripathi, T.C. Goel and I.K. Varma, “Preparation and Characterization of Polyaniline-PVC Polymer Composite Film,” J. Appl. Polym. Sci. , vol. 51, pp. 1347-1349, 1994.
[58] M. Wan, M. Li, J. Li and Z. Liu, “Transparent and Conducing Coatings of Polyaniline Composites,” Thin Solid Films, vol. 259, pp. 188-193, 1995.
[59] V. Mano, M.l. Felisberti, T. Matencio and M. Paoli, “Thermal, Mechanical and Electrochemical Behavior of Poly(vinyl
66

chloride)/polypyrrole Blends (PVC/Ppy),” Polymer, vol. 37, pp. 5165- SI 70, 1996.
[60] M. Ouyang and C.M. Chan, “Electrical and Mechanical Properties of Pre-Localized Polypyrrole/Poly(vinyl chloride) Conductive Composites,” Polym. Eng. Sci., vol. 36, pp. 2676-2682, 1996.
[61] J. Laska, K. Zak and A. Pron, “Conducting Blends of Polyaniline with Conventional Polymers,” Synt. Met, vol. 84, pp. 117-118, 1997.
[62] K. Ogura, J. Yano, K. Kisaka and H. Goto, “Novel Preparation of Electrically Conducting Poly(vinyl chloride) by Photo- dehydrochlorination from Poly(vinyl chloride)/Polypyrrole Composite Film,” J. Polym. Sci. A, Polym. them., vol. 32, pp. 33-38, 1994.
[63] U.A. Sevil, O. Guven, S. Suzer, “Spectroscopic Investigation of Onset and Enhancement of Electrical Conductivity in PVC/PANI Composites and Blends by Gamma Ray or UV Irradiation,” J. Phys. Chem. B., vol. 102, pp. 3902-3905, 1998.
[64] G.D. Christian, Analytical Chemistry, John Wiley and Sons Inc, 1994.
[65] D.R. Lide, Handbook of Chemitry and Physics, 75th edition, CRC Press, Boca Raton , 1995.
[66] D.C. Harris and M.D. Bertolucci, Symmetry and Spectroscopy, Dover Publication Inc, 1989.
[67] P.F. Bernath, Spectra of Atoms and Molecules, Oxford University Press, 1995.
[68] J.M. Hollas, Modern Spectroscopy, John Wiley and Sons Inc, 1996
[69] B.E. Kohler, “Electronic Properties of Linear Polyenes,” in Conjugated Polymers, J.L. Bredas and R. Silbey (Eds.), Kluwer Academic Publishers, 1991.
[70] Y. Geerts, G. Klarmer and K. Mullen, “Hydrocarbon Oligomers,” in Electronic materials: The Oligomer Approach, K. Mullen and G.
67

Wegner (Eds.), John Wiley and Sons Ltd, 1998 (and the references therein).
[71] K. Nakanishi and P.H. Solomon, Infrared Absorption Spectroscopy, Holden-Day Inc, 1977.
[72] D.P. Woodruff and T.A. Delchar, Modem Techniques of Surface Science, Cambridge University Press, 1986.
[73] D. Briggs and M.P. Seah (Eds.), Practical Surface Analysis, John Wiley and Sons Ltd., 1990
[75] D.A. Skoog and J.L. Leary, Principles of Instrumental Analysis, Saunder Collage Publishing, 1992.
[75] K.C. Humpherys and A.D. Kantz, “Radiachromic: A Radiation Monitoring System,” Radial Phys. Chem, vol. 9, pp. 737-747, 1977.
[76] F.A' Rahim, A. Miller and W.L. McLaughlin, “Response of Radiation Monitoring labels to Gamma Rays and Electrons,” Radial Phys. Chem, vol. 25, pp. 767-775, 1985.
[77] W.L. McLaughlin, J.C. Humphreys, D. Hochen and W.J. Chappas, “Radiochromic Dosimetry for Validation and Commissioning of Industrial Radiation Processes,” Radial Phys. Chem, vol. 31, pp. 505- 514, 1988.
[78] K. Ueno, “Development of a Plastic Dosimeter for Industrial Use with High Doses,” Radial Phys. Chem, vol. 31, pp. 467-472, 1988.
[79] L.N. Sidney, D.C. Lynch and P.S. Willet, “A New Radiochromic Dosimeter Film,” Radial Phys. Chem, vol. 35, pp. 779-782, 1990.
[80] C. Decker, “Photochemical Modifications of Poly (vinyl chloride),” in Chemical Reactions on Polymers, J.L. Benham and J.F. Kinstle (Eds.), ACS Publications, 1988.
68