asb disclosure statement and annual report · performance overview 4 annual report 6 corporate...
TRANSCRIPT

ASB Disclosure Statement and Annual ReportFor the year ended 30 June 2016


Consolidated Performance in Brief 3
Performance Overview 4
Annual Report 6
Corporate Governance 7
General Disclosures 10
Historical Summary of Financial Statements 12
Income Statement 13
Statement of Comprehensive Income 14
Statement of Changes in Equity 15
Balance Sheet 16
Cash Flow Statement 17
Notes to the Financial Statements
1 Statement of Accounting Policies 18
2 Interest Income 27
3 Interest Expense 27
4 Other Income 28
5 Operating Expense Disclosures 28
6 Auditor's Remuneration 28
7 Taxation 29
8 Dividends 29
9 Cash and Liquid Assets 30
10 Due from Financial Institutions 30
11 Trading Securities 30
12 Derivative Financial Instruments 31
13 Available-for-Sale Securities 32
14 Advances to Customers 32
15 Credit Risk Management Policies 33
16 Credit Quality Information for Advances to Customers 35
17 Provisions for Impairment Losses 37
18 Concentrations of Credit Exposures 38
19 Concentration of Credit Exposures to Individual Counterparties 40
20 Credit Exposures to Connected Persons and Non-bank Connected Persons 40
21 Maximum Exposure and Effect of Collateral and Other Credit Enhancements 41
22 Transferred Financial Assets 43
Contents

23 Imputation Credit Account 43
24 Controlled Entities and Associates 44
25 Other Assets 45
26 Goodwill 45
27 Deferred Taxation Asset 46
28 Deposits and Other Public Borrowings 46
29 Other Liabilities 47
30 Due to Financial Institutions 47
31 Other Liabilities at Fair Value through Income Statement 47
32 Debt Issues 48
33 Loan Capital 49
34 Contributed Capital 50
35 Reserves 51
36 Leasing and Other Commitments 52
37 Credit and Capital Commitments, and Contingent Liabilities 52
38 Related Party Transactions and Balances 53
39 Key Management Personnel 55
40 Fair Value of Financial Instruments 56
41 Offsetting Financial Assets and Financial Liabilities 58
42 Capital Adequacy 59
43 Securitisation, Funds Management, Other Fiduciary Activities 67 and the Marketing and Distribution of Insurance Products
44 Financial Reporting by Operating Segments 68
45 Risk Management Policies 70
46 Market Risk 71
47 Interest Rate Repricing Schedule 73
48 Liquidity and Funding Risk 75
49 Qualifying Liquid Assets 76
50 Maturity Analysis for Undiscounted Contractual Cash Flows 77
51 Concentrations of Funding 79
52 Events after the Reporting Period 79
Additional Disclosures 80
Directors' Statement 86
Independent Auditor's Report 87
Directory 89

Consolidated Performance in Brief
(1) Hedging and IFRS volatility includes unrealised fair value gains or losses on economic hedges that do not qualify for hedge accounting and also includes unrealised fair value gains or losses on the ineffective portion of economic hedges that do qualify for hedge accounting under IFRS.Fair value gains or losses on all of these economic hedges are excluded from Cash Profit since the asymmetric recognition of the gains or losses does not affect the Bank's performance over the life of the hedge.
(2) This represents the recognition of a notional cost of capital from the ultimate parent and other allocated costs which are not included in Statutory Profit.
(3) Results of certain business units are excluded from Cash Profit for management reporting purposes, but included in Statutory Profit.(4) These performance metrics are calculated on a Cash Profit basis.(5) Capital ratios were prepared in accordance with the Basel III framework.(6) Certain comparatives have been restated to ensure consistency with the current period’s presentation.
AASB Bank Limited 3
FFor the year ended 30 June 22016 2015 (6) 2014 (6)
IIncome Statement ($ millions)Interest income 44,048 4,106 3,628
Interest expense 22,286 2,439 2,091
NNet interest earnings 11,762 1,667 1,537
Other income 4464 419 435
TTotal operating income 22,226 2,086 1,972
Impairment losses on advances 1130 89 56
TTotal operating income after impairment losses 22,096 1,997 1,916
Total operating expenses 8826 805 767
NNet profit before taxation 11,270 1,192 1,149
Taxation 3357 333 343
NNet profit after taxation ("Statutory Profit") 9913 859 806
RReconciliation of statutory profit to cash profit ($ millions)NNet profit after taxation ("Statutory Profit") 9913 859 806
Reconciling items:
Hedging and IFRS volatility(1) 111 31 (5)
Notional inter-group charges(2) ((8) (14) (59)
Reporting structure differences(3) ((9) (10) (11)
Taxation on reconciling items and prior period adjustments 11 (2) 45
CCash net profit after taxation ("Cash Profit") 9908 864 776
AAs at 30 June 22016 2015 (6) 2014 (6)
BBalance Sheet ($ millions)Total assets 881,606 75,903 68,380
Advances to customers 772,075 65,383 60,664
Total liabilities 774,794 70,525 63,214
Deposits and other public borrowings (excludes repurchase agreements) 554,702 52,163 44,522
PPerformance(4)
Return on ordinary shareholder's equity 118.1% 19.1% 17.6%
Return on total average assets 11.2% 1.2% 1.1%
Net interest margin 22.32% 2.38% 2.24%
Total operating expenses as a percentage of total operating income 337.3% 38.4% 40.5%
CCapital ratios(5)
Common equity tier one capital as a percentage of total risk-weighted exposures 110.0% 8.8% 10.6%
Tier one capital as a percentage of total risk-weighted exposures 112.4% 10.8% 11.7%
Total capital as a percentage of total risk-weighted exposures 113.3% 11.8% 12.7%

Performance Overview
(1) Items include hedging and IFRS volatility, the notional cost of capital charged by the Commonwealth Bank of Australia (the ultimate parent of ASB Bank Limited) and other material non-recurring items. These items are calculated consistently period on period and do not discriminate between positive and negative adjustments. Refer to the Consolidated Performance in Brief for a reconciliation of the statutory and cash net profit after taxation, and for further information on these items.
(2) Fixed rate prepayment recoveries have been reclassified from other income to net interest earnings to align with market practice. This reclassification has no impact on net profit after taxation.
(3) Retail Market Monitor – June 2016.
44 ASB Bank Limited
CCustomer focus delivers solid annual result for ASB
ASB today reported statutory net profit after taxation (NPAT) of $913 million for the financial year ended 30 June 2016. This
represents a 6% increase on the prior financial year.
Cash NPAT was $908 million, an increase of 5% on the prior financial year. Cash NPAT is the preferred measure of financial
performance as it presents ASB’s underlying operating results and excludes items that introduce volatility and/or one-off
distortions, and are not considered representative of ASB’s on-going financial performance.(1)
The performance was a product of sustained growth in key market segments and a focus on providing exceptional experiences for
customers. It was a result achieved against the backdrop of a highly competitive market and some significant headwinds in the form
of global market volatility and fluctuating commodity prices. Despite this, ASB remained focused on executing its strategy and
pursuing initiatives to drive profitable growth across the business.
Customer advances are up 10% reflecting strong lending growth across all key portfolios including business, commercial, rural,
personal and home lending. At the same time, deposits have grown 5%.
Cash net interest margin decreased by 6 basis points to 2.32% reflecting a highly competitive environment and the continued
popularity of lower-margin fixed rate mortgages.(2)
ASB’s loan impairment expense was $130 million, up 46% from the prior financial year as a result of increased provisions,
particularly in the dairy sector. ASB has taken a conservative position and has increased provisions in the dairy sector accordingly.
The Bank remains confident in the asset quality of its rural book and sees its farming customers responding well and managing
their businesses in response to the conditions.
A key pillar of ASB’s strategy is around leveraging technology to improve the way the Bank serves its customers through offering
simple, seamless and secure mobile and digital experiences. More than three quarters of ASB’s personal customers are active on
the Bank’s digital channels and are accessing an increasing range of banking services through their mobile devices. As a result, ASB
has seen sales made through its digital channels more than double over the past two years. ASB’s success in offering the best
mobile experience has been acknowledged with the Bank being named as first in mobile app banking satisfaction against its
competitors.(3)
A prime example of the way ASB is focusing on its customers and building on its long history of innovation is the success of ASB
Card Control. ASB Card Control gives customers the ability to manage their ASB Visa cards anywhere, any time through the ASB
Mobile app, including the ability for customers to temporarily lock their card if they lose it, turn off ATM withdrawals, set spending
limits and more. Since its launch last year, more than 167,000 customers have used Card Control and the service has safeguarded
customers from more than $1 million of potential fraud.
A focus on innovation and technology also drives efficiency and ASB continues to transform its business, streamline how it operates
and digitise processes. Even with continued significant investments in technology and specialist frontline capability, disciplined cost
management and efficiency improvement saw a 110 basis points reduction in the Bank’s cost to income ratio to 37.3%.
ASB’s achievements over the past financial year would not have been possible without the ambition, passion and commitment of its
people nationwide. The Bank has worked hard to maintain a high-performance, supportive culture where different backgrounds and
perspectives are recognised and harnessed. The results of the Bank’s Kenexa employee engagement survey this year confirmed
once again that ASB has one of the most engaged workforces globally.

Performance Overview (continued)
AASB Bank Limited 5
ASB maintains a strong belief in the importance of making a positive impact on the communities in which it operates. Over the
course of the financial year, the Bank contributed more than $12 million in donations, community investments, and sponsorships.
Key successes have included the Bank’s ongoing partnership with the All Blacks and the completion of the first combined ASB
Classic Tennis tournament featuring both women’s and men’s fields. In addition, the ASB GetWise financial literacy programme for
schools passed another milestone recently with 600,000 children having been registered to receive an ASB GetWise session.
ASB’s Clever Kash digital moneybox also won a Gold Lion in June at the Cannes Lions International Festivity of Creativity in the
Financial Services category.
In addition, ASB was, in December 2015, named New Zealand’s Bank of the Year for the third year in a row, and the eleventh time in fourteen years, by London-based magazine The Banker.
G.R. Walker B.J. Chapman Chairman Managing Director
10 August 2016

Annual Report
66 ASB Bank Limited
The Directors are pleased to present the Annual Report for ASB Bank Limited for the year ended 30 June 2016.
The shareholders of the Bank have agreed to apply the reporting concessions available under section 211(3) of the Companies Act 1993. Accordingly, there is no information required to be included in the Annual Report other than the financial statements for the year ended 30 June 2016 and the Independent Auditor's Report on those financial statements, which are enclosed.
Subordinated Notes issued by the Bank are quoted on the NZX Debt Market (NZDX). NZX regulation has granted the Bank a waiver from NZDX Listing Rule 10.4 (which relates to Annual and Half Year Reports). The waiver is conditional upon:
• The Bank’s most recent Disclosure Statement (and any supplementary Disclosure Statement) being available on the Bank’s website and by contacting the Bank’s registered office; and
• A copy of the Bank’s most recent Disclosure Statement (and any supplementary Disclosure Statement) being sent to the NZX by way of the market announcement platform and on an ongoing basis no later than it is made publicly available elsewhere.
Despite the foregoing, the Directors are pleased to provide on the following pages an overview of the Bank’s corporate governance.
G.R. Walker B.J. Chapman Chairman Managing Director
10 August 2016

Corporate Governance
AASB Bank Limited 7
The Board places great importance on the governance of the Bank. Performance and compliance are both essential for good governance.
Reviews of the Board’s performance and its policies and practices are carried out regularly. These reviews identify where improvements can be made and assess the quality and effectiveness of the industry and company information made available to directors.
The principal features of the Bank’s corporate governance are as follows:
● The Board Audit and Risk Committee ("BARC") consists only of non-executive directors. The chairperson of the BARC must be an independent director other than the chairperson of the Board.
● The Managing Director does not participate in deliberations of either the Board or the Appointments and Remuneration Committee affecting her position, remuneration or performance.
● There are established criteria for the appointment of new directors and external consultants are engaged in the search for new independent directors.
● The Bank's Conditions of Registration require that:
– The Board must have at least five directors;
– The majority of the directors must be non-executive directors;
– At least half of the directors must be independent directors;
– At least half of the independent directors must be ordinarily resident in New Zealand;
– The chairperson of the Board must be independent; and
– The constitution must not include any provision permitting a director, when exercising powers or performing duties as a director, to act other than in what he or she believes to be the best interests of the Bank.
The Bank satisfies those requirements.
● The Bank's Conditions of Registration also require that:
– No appointment of the chairperson of the Board or of any director, chief executive officer, or executive who reports or is accountable directly to the chief executive officer shall be made unless the Reserve Bank of New Zealand ("RBNZ") has been supplied with the person's curriculum vitae and the RBNZ has advised that it has no objection to the appointment;
– A substantial proportion of the Bank's business must be conducted in and from New Zealand; and
– Exposures to connected persons cannot be on more favourable terms than corresponding exposures to non-connected persons.
The Bank complies with those requirements.
● New directors are invited to participate in an induction programme. All directors regularly consider issues, trends and challenges relevant to the Bank, the financial services industry and the economy.
● Non-executive directors do not participate in any of the Bank’s incentive plans.
The Board has adopted a charter and code of ethics for directors. The philosophy underlying the Board's approach to corporate governance is consistent with the ethical standards required of all employees of the Bank.
The corporate governance policies, practices and processes of the Bank do not materially differ from the Corporate Governance Best Practice Code in the NZX Debt Market Listing Rules, except as follows:
● Directors are not able to take a portion of their remuneration under a performance-based equity security compensation plan. This is because the Bank is a wholly owned subsidiary of CBA.
The current chairman of the Board is Mr G.R. Walker.
CCOMMITTEES OF THE BOARD
The Board has delegated specific powers and responsibilities to committees of the Board and to management. The decisions made by the Board committees are reported to the full Board. Management always recommends key decisions to the Board for approval.
There are two permanent Board committees – the BARC and the Appointments and Remuneration Committee. Other committees may be formed to carry out specific delegated tasks when required.
An independent director chairs each committee.
Corporate Governance (continued)
88 ASB Bank Limited
BBOARD AUDIT AND RISK COMMITTEE
The BARC assists the Board in carrying out its responsibilities concerning financial reporting and control, conformance with legal requirements, the identification and prudent management of risk and the good governance of the Bank in relation to those matters.
All non-executive directors are members of the BARC. The current chairman of the BARC is Mr J.P. Hartley.
The role of the BARC is to:
● Assist the Board in discharging its responsibility to exercise due care, diligence and skill in relation to financial reporting and control, conformance with legal requirements affecting members of the Banking Group, the identification and prudent management of the risks to which members of the Banking Group are or may become subject, and the good governance of the Banking Group in relation to those matters, including the oversight of:
– the integrity of external financial reporting;
– financial management;
– internal control systems;
– accounting policy and practice;
– the risk management framework and monitoring compliance with that framework;
– related party transactions;
– compliance with applicable laws and standards; and
– without limiting the generality of the foregoing, compliance with RBNZ standards relating to external financial reporting.
● Ensure the quality, credibility and objectivity of the accounting process, financial reporting and regulatory disclosure.
● Oversee and monitor the performance of the internal and external auditor. The Board has approved the application to the Banking Group of the CBA Group External Auditor Services Policy. That policy relates to the engagement of the external audit firm for non-audit work. The objective of the policy is to avoid prejudice to the independence of the auditor and to prevent undue reliance by the auditor on revenue from the Bank. The policy ensures that the auditor does not:
– assume the role of management;
– become an advocate for their own client; or
– audit work that comprises a direct output of their own professional expertise.
Under the policy the auditor will not provide the following services:
– bookkeeping or services relating to accounting records;
– appraisal or valuation and fairness opinions;
– advice on deal structuring and related documentation;
– tax planning and strategic advice;
– actuarial advisory services;
– executive recruitment or extensive human resource functions;
– acting as a broker-dealer, promoter or underwriter; or
– legal services.
● Provide a structured reporting line for Internal Audit and ensure the objectivity and independence of Internal Audit. The Chief Internal Auditor reports to the BARC through its chairperson.
● Consider any CBA group policy relevant to the role of the BARC and, if deemed appropriate, adopt or recommend that the Board adopt (as applicable) the policy as a policy of the Banking Group.
● Act as a formal forum for free and open communication between the Board, the internal and external auditors and management.
● Deal with any other matter which the Board may from time to time delegate to the BARC.
The Credit Approvals Committee (“CAC”) is a sub-committee of the BARC. The CAC has the power to approve, note or monitor (as the case requires) on behalf of the BARC, any matter that:
● concerns a current or proposed credit risk exposure of the Banking Group to an individual debtor or group of related debtors; and
● under the Banking Group’s Credit Policy or Credit Approval Authorities, either:
– requires the approval of the BARC (or the Board, where the BARC holds delegated authority to approve the matter on behalf of the Board); or
– must be noted or monitored by the BARC (or the Board, where the BARC holds delegated authority to note or monitor the matter on behalf of the Board).
For any act or decision, the CAC comprises the chairman of the Board, the chairman of the BARC and any one other member of the BARC who is an executive of CBA.

Corporate Governance (continued)
AASB Bank Limited 9
AAPPOINTMENTS AND REMUNERATION COMMITTEE
The role of the Appointments and Remuneration Committee is to assist the Board in discharging its responsibilities in relation to:
● the selection, remuneration, education and evaluation of directors;
● the selection, remuneration and evaluation of management; and
● policies relating to diversity for the Board and management.
The current members of the Appointments and Remuneration Committee are G.R. Walker (chairman), V.A.J Shortt and J.L. Freeman.
Remuneration for the Bank’s executives is determined after taking external advice to ensure competitive remuneration packages are in place to attract and retain competent and high-calibre people.
Incentive payments for executives are directly related to performance and depend on the extent to which strategic and operating targets set at the beginning of the financial year are achieved.
DIRECTORS' AND OFFICERS' LIABILITY INSURANCE
The Bank has effected liability insurance for the directors and officers of the Bank and its subsidiaries.
DIVERSITY AND INCLUSION
The Bank is committed to diversity and inclusion across its business. The Bank’s diversity and inclusion priorities are designed to ensure that:
● the Bank’s workforce and leadership is more reflective of both the communities in which the Bank operates and its customer base; and
● the Bank has a culture in which diversity is encouraged, understood, respected, valued and leveraged so that talented people can thrive and the Bank’s customers and reputation both benefit.
The Bank’s diversity and inclusion priorities are:
● Inclusive culture;
● Diversity in leadership;
● Valuing the individual;
● Reputation & recognition; and
● Flexible practices.
As at 30 June 2016, 27% of all senior leadership roles were held by women (30 June 2015 26%). The Bank has a target that 30% of all senior leadership roles will be held by women by 2017. Senior leadership comprises the Bank’s executive management and the next two levels of management.
Talent sourcing processes have been reviewed to ensure that support is given to the diversity and inclusion priorities.
General Disclosures(To be read in conjunction with the Financial Statements)
110 ASB Bank Limited
330 June 2016
This Disclosure Statement has been issued by ASB Bank Limited (the "Bank" or “ASB”) in accordance with the Registered Bank Disclosure Statements (New Zealand Incorporated Registered Banks) Order 2014 (as amended) (the “Order”).
Corporate Information
The Bank is a company incorporated under the Companies Act 1955 on 16 August 1988. The registered office of the Bank is Level 2, ASB North Wharf, 12 Jellicoe Street, Auckland Central, Auckland 1010, New Zealand. The Bank was re-registered under the Companies Act 1993 on 30 June 1995.
The "Banking Group" consists of the Bank and those controlled entities listed in note 24 to the financial statements.
Ultimate Parent Bank
The ultimate parent bank of the Bank is the Commonwealth Bank of Australia ("CBA"), its registered office being Ground Floor, Tower 1, 201 Sussex Street, Sydney, NSW 2000, Australia.
Persons Having a Significant Interest in the Registered Bank
The Bank's immediate parent, ASB Holdings Limited, holds 100% of the voting shares of the Bank and has the power of appointment of directors. The ultimate parent bank, CBA, has indirect power to appoint directors.
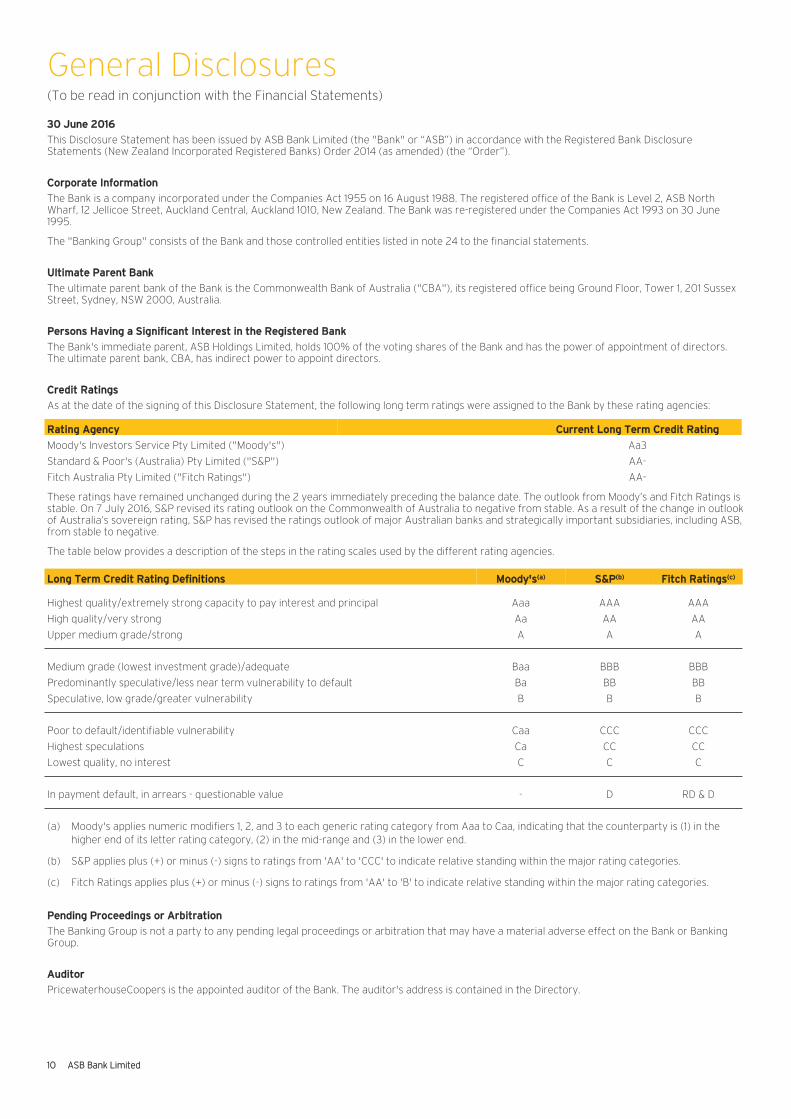
Credit Ratings
As at the date of the signing of this Disclosure Statement, the following long term ratings were assigned to the Bank by these rating agencies:
Rating Agency Current Long Term Credit Rating
Moody's Investors Service Pty Limited ("Moody's") Aa3
Standard & Poor's (Australia) Pty Limited ("S&P") AA-
Fitch Australia Pty Limited ("Fitch Ratings") AA-
These ratings have remained unchanged during the 2 years immediately preceding the balance date. The outlook from Moody’s and Fitch Ratings is stable. On 7 July 2016, S&P revised its rating outlook on the Commonwealth of Australia to negative from stable. As a result of the change in outlook of Australia’s sovereign rating, S&P has revised the ratings outlook of major Australian banks and strategically important subsidiaries, including ASB, from stable to negative.
The table below provides a description of the steps in the rating scales used by the different rating agencies.
Long Term Credit Rating Definitions Moody's(a) S&P(b) Fitch Ratings(c)
Highest quality/extremely strong capacity to pay interest and principal Aaa AAA AAA
High quality/very strong Aa AA AA
Upper medium grade/strong A A A
Medium grade (lowest investment grade)/adequate Baa BBB BBB
Predominantly speculative/less near term vulnerability to default Ba BB BB
Speculative, low grade/greater vulnerability B B B
Poor to default/identifiable vulnerability Caa CCC CCC
Highest speculations Ca CC CC
Lowest quality, no interest C C C
In payment default, in arrears - questionable value - D RD & D
(a) Moody's applies numeric modifiers 1, 2, and 3 to each generic rating category from Aaa to Caa, indicating that the counterparty is (1) in the higher end of its letter rating category, (2) in the mid-range and (3) in the lower end.
(b) S&P applies plus (+) or minus (-) signs to ratings from 'AA' to 'CCC' to indicate relative standing within the major rating categories.
(c) Fitch Ratings applies plus (+) or minus (-) signs to ratings from 'AA' to 'B' to indicate relative standing within the major rating categories.
Pending Proceedings or Arbitration
The Banking Group is not a party to any pending legal proceedings or arbitration that may have a material adverse effect on the Bank or Banking Group.
Auditor
PricewaterhouseCoopers is the appointed auditor of the Bank. The auditor's address is contained in the Directory.

General Disclosures (continued)(To be read in conjunction with the Financial Statements)
AASB Bank Limited 11
GGuarantee Arrangements
On 11 August 2011, the ASB Covered Bond Trust (the “Covered Bond Trust”) was established to acquire and hold certain residential mortgage loans (“Mortgage Loans”) originated by the Bank. ASB Covered Bond Trustee Limited (the "Covered Bond Guarantor"), solely in its capacity as trustee of the Covered Bond Trust provides guarantees over certain debt securities ("Covered Bonds") issued by the Bank or its subsidiary ASB Finance Limited, acting through its London Branch.
The Covered Bond Guarantor has guaranteed payments of interest and principal under the Covered Bonds pursuant to a guarantee which is secured over the Mortgage Loans, related security and other assets of the Covered Bond Trust. Covered bonds (including accrued interest) of $3.163 billion were guaranteed as at 30 June 2016. The amount of the guarantee is limited to the assets of the Covered Bond Trust. There are no material conditions applicable to the guarantee other than non-performance. There are no material legislative or regulatory restrictions in New Zealand which would have the effect of subordinating the claims under the guarantee of any creditors of the Bank on the assets of the Covered Bond Guarantor, to other claims on the Covered Bond Guarantor, in a winding up of the Covered Bond Guarantor.
The Covered Bond Guarantor's address for service is Level 9, 34 Shortland Street, Auckland 1010, New Zealand. The Covered Bond Guarantor is not a member of the Banking Group and has no credit ratings applicable to its long term senior unsecured obligations payable in New Zealand dollars. As at 30 June 2016, the Covered Bonds issued have been assigned a long term rating of 'AAA' by Fitch Ratings and 'Aaa' by Moody's.
As at the signing date of this Disclosure Statement, other material obligations of the Bank are not guaranteed.
Legally Enforceable Restrictions that may Materially Inhibit CBA's Legal Ability to Provide Material Financial Support to the Bank
CBA does not guarantee the obligations of the Bank or its subsidiaries.
Under the Banking Act 1959 (Commonwealth of Australia) ("Australian Banking Act"), the Australian Prudential Regulation Authority ("APRA"), may determine prudential standards which must be complied with by CBA. Further, regulations made under the Australian Banking Act may specify prudential requirements which must be observed by CBA. These prudential standards and requirements may affect the ability of CBA to provide material financial support to the Bank or its subsidiaries.
Unless APRA provides otherwise, CBA must comply with APRA’s prudential standard APS 222: Associations with Related Entities (“APS 222”). The effects of APS 222 include that:
• CBA’s exposure to the Bank must not exceed 50% of CBA’s level 1 capital base (as defined in APS 222) and its aggregate exposure to all related authorised deposit-taking institutions (including overseas based equivalents) cannot exceed 150% of that capital base;
• CBA must not enter into cross-default clauses whereby a default by the Bank on an obligation (whether financial or otherwise) is deemed to trigger a default by CBA in its obligations;
• CBA must not have unlimited exposures to the Bank (such as providing a general guarantee of the Bank’s obligations); • When determining limits on acceptable levels of exposure to the Bank, the board of CBA must have regard to the level of exposures that
would be approved to third parties of broadly equivalent credit status to the Bank, the impact on CBA’s stand-alone capital and liquidity positions, and its ability to continue operating in the event of a failure by the Bank or any other related entity to which it is exposed; and
• CBA also must comply with any other limits on CBA’s exposures to related entities, including the Bank, that may be set by APRA. On 25 November 2015, APRA informed CBA that it will be required to reduce its non-equity exposure to the Bank and its subsidiaries to below a limit of five percent of CBA’s Level 1 Tier 1 Capital over a five-year period commencing on 1 January 2016. For the purposes of this limit, exposures include all committed, non-intraday, non-equity exposures, including derivatives and off-balance sheet exposures. APRA has imposed two conditions over the transition period. Firstly, that the percentage excess above the five percent limit as at 30 June 2015 is to reduce by at least one fifth by the end of each calendar year over the transition period. Secondly, that the absolute amount of routine New Zealand non-equity exposure is not to increase from the 30 June 2015 level until CBA is, and expects to remain, below the five percent limit. For the purposes of assessing this exposure, the five percent limit excludes equity investments and holdings of capital instruments in the Bank and its subsidiaries.
APRA confirmed it will allow, on agreeable terms, the Australian parent banks to provide contingent funding support to their New Zealand banking subsidiaries in times of financial stress. At this time, only covered bonds meet the criteria for contingent funding arrangements.
CBA expect to be compliant with APRA’s requirements to reduce its non-equity exposures to the Bank and its subsidiaries within the transition period.
Under section 13A(3) of the Australian Banking Act, if an Authorised Deposit-taking Institution ("ADI") (which includes CBA) becomes unable to meet its obligations or suspends payment, the assets of the ADI in Australia are to be available to meet the ADI’s liabilities in the following order: (a) first, the ADI's liabilities to APRA, to the extent that APRA has made, or is required to make, payments to depositors under the Australian Government’s Financial Claims Scheme ("Scheme"); (b) second, the ADI's debts to APRA for costs incurred by APRA in the administration of the Scheme in respect of that ADI; (c) third, in payment of the ADI's liabilities in Australia in relation to protected accounts; (d) fourth, the ADI's debts to the Reserve Bank of Australia; (e) fifth, the ADI's liabilities under a certified industry support contract; and (f) sixth, the ADI's other liabilities in the order of their priority apart from section 13A(3) of the Australian Banking Act.
The assets of an ADI are taken for the purposes of section 13A(3) of the Australian Banking Act not to include any interest in an asset or part of an asset in a cover pool for which the ADI is the issuing ADI.
Dealings with Directors
There have been no dealings by any Director, or any immediate relative or close business associate of any Director, with any member of the Banking Group, that: (i) has been entered into on terms other than those which would, in the ordinary course of business of the Banking Group, be given to any other
person of like circumstances or means; or (ii) could otherwise be reasonably likely to influence materially the exercise of that Director's duties.
Refer to note 39 for outstanding balances with Directors.
All Directors are required to disclose to the Board of the Bank all actual or possible conflicts of interest and are expected to abstain from any vote on matters in which he or she has a material personal interest. The Bank maintains a register of Directors' interests.
Directors' details are contained in the Directory. Communications addressed to the Directors should be sent to the Registered Office (refer to the Directory for this address).

Historical Summary of Financial Statements
The amounts disclosed in this historical summary of financial statements have been taken from the audited financial statements of the Banking Group. Comparatives for interest income and other income have been reclassified to ensure consistency with presentation in the current year.
112 ASB Bank Limited
$ miIIions BBanking Group
FFor the year ended 30 June 22016 2015 2014 2013 2012
IIncome Statement
Interest income 44,048 4,106 3,628 3,487 3,563
Interest expense 22,286 2,439 2,091 2,071 2,243
NNet interest earnings 11,762 1,667 1,537 1,416 1,320
Other income 4464 419 435 390 404
TTotal operating income 22,226 2,086 1,972 1,806 1,724
Impairment losses on advances 1130 89 56 56 47
TTotal operating income after impairment losses 22,096 1,997 1,916 1,750 1,677
TotaI operating expenses 8826 805 767 738 730
NNet profit before taxation 11,270 1,192 1,149 1,012 947
Taxation 3357 333 343 307 262
NNet profit after taxation 9913 859 806 705 685
DDividends Paid
Ordinary dividends paid 2200 1,140 400 90 500
PerpetuaI preference dividends paid 449 26 15 14 16
TTotaI dividends paid 2249 1,166 415 104 516
$ miIIions BBanking Group
AAs at 30 June 22016 2015 2014 2013 2012
BBaIance Sheet
TotaI assets 881,606 75,903 68,380 66,570 63,537
IndividuaIIy impaired assets 3377 290 218 302 251
TotaI IiabiIities 774,794 70,525 63,214 61,545 59,350
TotaI sharehoIders' equity 66,812 5,378 5,166 5,025 4,187

Income Statement
These statements are to be read in conjunction with the notes on pages 18 to 79 and the Independent Auditor's Report on pages 87 to 88.
AASB Bank Limited 13
$ millions Banking Group
FFor the year ended 30 June Note 22016 2015
Interest income 2 44,048 4,106
Interest expense 3 22,286 2,439
NNet interest earnings 11,762 1,667
Other income 4 4464 419
TTotal operating income 22,226 2,086
Impairment losses on advances 17 1130 89
TTotal operating income after impairment losses 22,096 1,997
TTotal operating expenses 5 8826 805
Salaries and other staff expenses 4494 480
Building occupancy and equipment expenses 1122 125
Information technology expenses 996 86
Other expenses 1114 114
NNet profit before taxation 11,270 1,192
Taxation 7 3357 333
NNet profit after taxation 9913 859

Statement of Comprehensive Income
These statements are to be read in conjunction with the notes on pages 18 to 79 and the Independent Auditor's Report on pages 87 to 88.
114 ASB Bank Limited
$ millions Banking Group
FFor the year ended 30 June Note 22016 2015
NNet profit after taxation 9913 859
OOther comprehensive income/(expense), net of taxation
IItems that will not be reclassified to the Income Statement:
Net change in asset revaluation reserve 35 11 5
IItems that may be reclassified subsequently to the Income Statement:
Net change in available-for-sale reserve 35 ((15) (4)
Net change in cash flow hedge reserve 35 ((16) (82)
((31) (86)
TTotal other comprehensive expense, net of taxation ((30) (81)
TTotal comprehensive income 8883 778

Statement of Changes in Equity
These statements are to be read in conjunction with the notes on pages 18 to 79 and the Independent Auditor's Report on pages 87 to 88.
AASB Bank Limited 15
BBanking Group
$ millions NoteCContributed
Capital
AAsset Revaluation
Reserve
AAvailable-for-Sale Reserve
CCash Flow Hedge
Reserve
FForeign Currency
Translation Reserve
RRetained Earnings
TTotal Shareholders'
Equity
FFor the year ended 30 June 2016
Balance at beginning of year 33,423 227 88 ((87) 11 22,006 55,378
Net profit after taxation -- -- -- -- -- 9913 9913
Other comprehensive income/(expense) -- 11 ((15) ((16) -- -- ((30)
TTotal comprehensive income/(expense) -- 11 ((15) ((16) -- 9913 8883
Share capital issued 34 8800 -- -- -- -- -- 8800
Ordinary dividends paid 8 -- -- -- -- -- ((200) ((200)
Perpetual preference dividends paid 8 -- -- -- -- -- ((49) ((49)
BBalance as at 30 June 2016 44,223 228 ((7) ((103) 11 22,670 66,812
FFor the year ended 30 June 2015
Balance at beginning of year 2,823 25 12 (5) 1 2,310 5,166
Net profit after taxation - - - - - 859 859
Other comprehensive income/(expense) - 5 (4) (82) - - (81)
TTotal comprehensive income/(expense) - 5 (4) (82) - 859 778
Share capital issued 34 600 - - - - - 600 Transfer from asset revaluation reserve to retained earnings 35 - (3) - - - 3 -
Ordinary dividends paid 8 - - - - - (1,140) (1,140)
Perpetual preference dividends paid 8 - - - - - (26) (26)
BBalance as at 30 June 2015 3,423 27 8 (87) 1 2,006 5,378
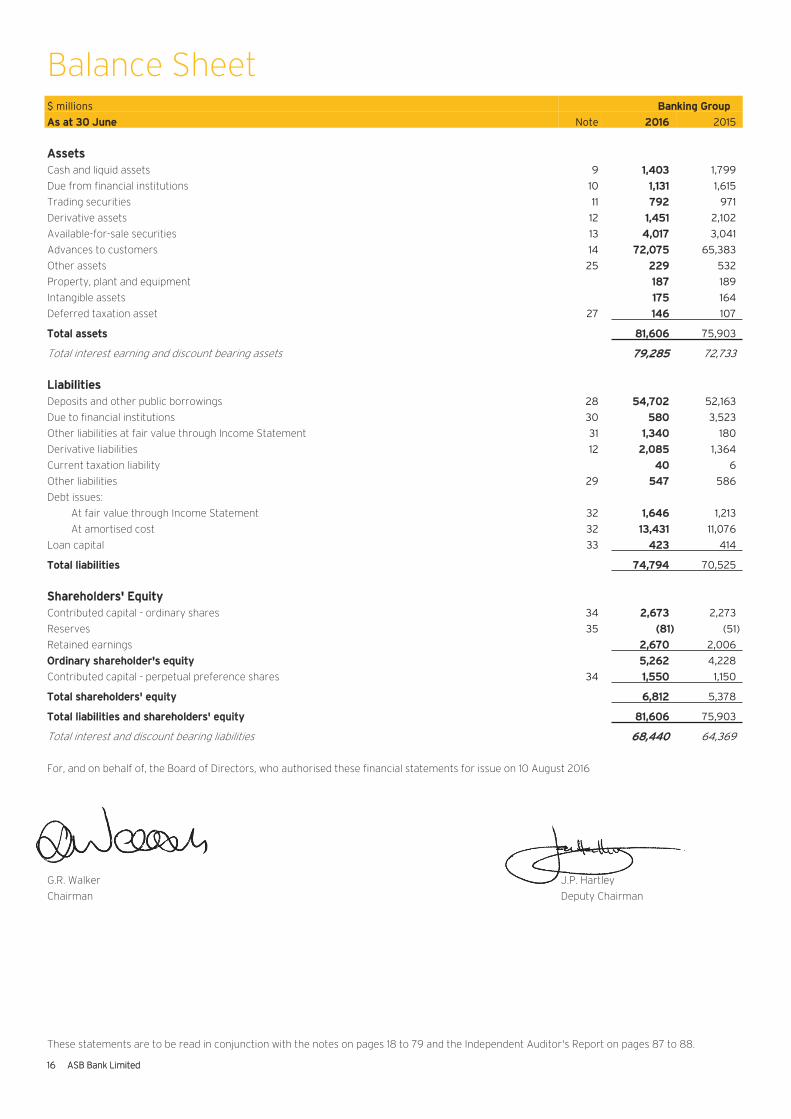
Balance Sheet
These statements are to be read in conjunction with the notes on pages 18 to 79 and the Independent Auditor's Report on pages 87 to 88.
116 ASB Bank Limited
$ millions Banking Group
AAs at 30 June Note 22016 2015
AAssetsCash and liquid assets 9 11,403 1,799
Due from financial institutions 10 11,131 1,615
Trading securities 11 7792 971
Derivative assets 12 11,451 2,102
Available-for-sale securities 13 44,017 3,041
Advances to customers 14 772,075 65,383
Other assets 25 2229 532
Property, plant and equipment 1187 189
Intangible assets 1175 164
Deferred taxation asset 27 1146 107
TTotal assets 881,606 75,903
Total interest earning and discount bearing assets 779,285 72,733
LLiabilitiesDeposits and other public borrowings 28 554,702 52,163
Due to financial institutions 30 5580 3,523
Other liabilities at fair value through Income Statement 31 11,340 180
Derivative liabilities 12 22,085 1,364
Current taxation liability 440 6
Other liabilities 29 5547 586
Debt issues:
At fair value through Income Statement 32 11,646 1,213
At amortised cost 32 113,431 11,076
Loan capital 33 4423 414
TTotal liabilities 774,794 70,525
SShareholders' EquityContributed capital - ordinary shares 34 22,673 2,273
Reserves 35 ((81) (51)
Retained earnings 22,670 2,006
OOrdinary shareholder's equity 55,262 4,228
Contributed capital - perpetual preference shares 34 11,550 1,150
TTotal shareholders' equity 66,812 5,378
TTotal liabilities and shareholders' equity 881,606 75,903
Total interest and discount bearing liabilities 668,440 64,369
For, and on behalf of, the Board of Directors, who authorised these financial statements for issue on 10 August 2016
G.R. Walker J.P. Hartley
Chairman Deputy Chairman
J.P. Hartley

Cash Flow Statement
These statements are to be read in conjunction with the notes on pages 18 to 79 and the Independent Auditor's Report on pages 87 to 88.
AASB Bank Limited 17
$ millions Banking Group
FFor the year ended 30 June 22016 2015
CCash flows from operating activitiesNet profit before taxation 11,270 1,192
RReconciliation of net profit before taxation to net cash flows from operating activitiesNon-cash items included in net profit before taxation: Depreciation of property, plant and equipment 336 36 Amortisation of intangible assets 441 38 Net change in provisions for impairment losses and bad debts written off 1144 101 Other movements 776 76 Net (increase)/decrease in operating assets: Net (increase)/decrease in reverse repurchase agreements ((69) 405
Net decrease/(increase) in due from financial institutions 4484 (1,304) Net decrease/(increase) in trading securities 1174 (11) Net increase in available-for-sale securities ((997) (342) Net increase in advances to customers ((6,911) (4,749) Net decrease in other assets 3318 457 Net increase/(decrease) in operating liabilities: Net increase in deposits and other public borrowings 22,629 7,231 Net decrease in due to financial institutions ((2,930) (924) Net increase/(decrease) in other liabilities at fair value through Income Statement 11,157 (1,038) Net (decrease)/increase in other liabilities ((50) 17 Net taxation paid ((350) (335)
NNet cash flows from operating activities ((4,978) 850
CCash flows from investing activitiesCash was applied to: Purchase of property, plant and equipment ((33) (26) Purchase of intangible assets ((42) (49)
NNet cash flows from investing activities ((75) (75)
CCash flows from financing activitiesCash was provided from: Issue of ordinary share capital 4400 -
Issue of perpetual preference share capital 4400 600 Issue of loan capital (net of issue costs) -- 4 Issue of debt securities (net of issue costs) 110,958 6,066
Total cash inflows provided from financing activities 111,758 6,670 Cash was applied to: Dividends paid ((249) (1,166)
Redemption of issued debt securities ((6,921) (5,852)Total cash outflows applied to financing activities ((7,170) (7,018)
NNet cash flows from financing activities 44,588 (348)
SSummary of movements in cash flowsNet (decrease)/increase in cash and cash equivalents ((465) 427 Add: cash and cash equivalents at beginning of year 11,413 986
CCash and cash equivalents at end of year 9948 1,413
CCash and cash equivalents comprise:Cash and liquid assets 11,403 1,799 Less: reverse repurchase agreements included in cash and liquid assets ((455) (386)
CCash and cash equivalents at end of year 9948 1,413
AAdditional operating cash flow informationInterest received as cash 44,108 4,148 Interest paid as cash ((2,298) (2,364)Other income received as cash 4473 425 Operating expenses paid as cash ((725) (729)
Notes to the Financial StatementsFor the year ended 30 June 2016
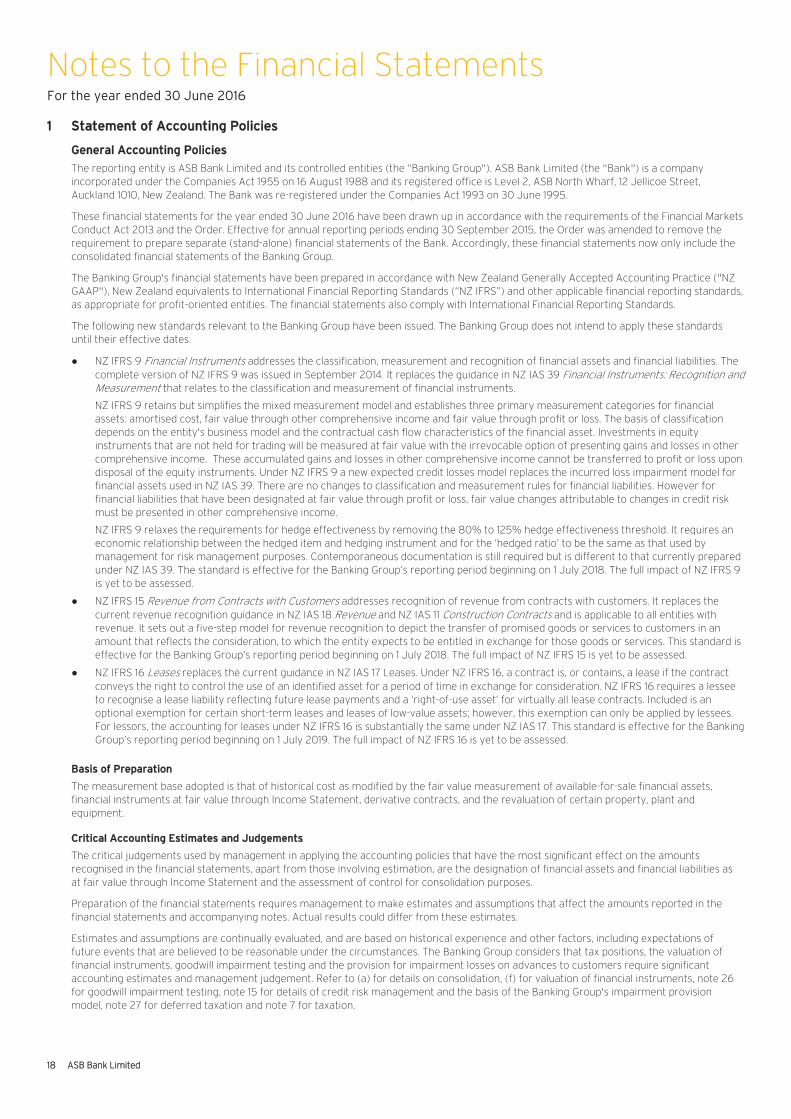
11 Statement of Accounting Policies
118 ASB Bank Limited
GGeneral Accounting Policies
The reporting entity is ASB Bank Limited and its controlled entities (the “Banking Group"). ASB Bank Limited (the "Bank") is a company incorporated under the Companies Act 1955 on 16 August 1988 and its registered office is Level 2, ASB North Wharf, 12 Jellicoe Street, Auckland 1010, New Zealand. The Bank was re-registered under the Companies Act 1993 on 30 June 1995.
These financial statements for the year ended 30 June 2016 have been drawn up in accordance with the requirements of the Financial Markets Conduct Act 2013 and the Order. Effective for annual reporting periods ending 30 September 2015, the Order was amended to remove the requirement to prepare separate (stand-alone) financial statements of the Bank. Accordingly, these financial statements now only include the consolidated financial statements of the Banking Group. The Banking Group's financial statements have been prepared in accordance with New Zealand Generally Accepted Accounting Practice ("NZ GAAP"), New Zealand equivalents to International Financial Reporting Standards (“NZ IFRS”) and other applicable financial reporting standards, as appropriate for profit-oriented entities. The financial statements also comply with International Financial Reporting Standards.
The following new standards relevant to the Banking Group have been issued. The Banking Group does not intend to apply these standards until their effective dates.
● NZ IFRS 9 Financial Instruments addresses the classification, measurement and recognition of financial assets and financial liabilities. The complete version of NZ IFRS 9 was issued in September 2014. It replaces the guidance in NZ IAS 39 Financial Instruments: Recognition and Measurement that relates to the classification and measurement of financial instruments.
NZ IFRS 9 retains but simplifies the mixed measurement model and establishes three primary measurement categories for financial assets: amortised cost, fair value through other comprehensive income and fair value through profit or loss. The basis of classification depends on the entity's business model and the contractual cash flow characteristics of the financial asset. Investments in equity instruments that are not held for trading will be measured at fair value with the irrevocable option of presenting gains and losses in other comprehensive income. These accumulated gains and losses in other comprehensive income cannot be transferred to profit or loss upon disposal of the equity instruments. Under NZ IFRS 9 a new expected credit losses model replaces the incurred loss impairment model for financial assets used in NZ IAS 39. There are no changes to classification and measurement rules for financial liabilities. However for financial liabilities that have been designated at fair value through profit or loss, fair value changes attributable to changes in credit risk must be presented in other comprehensive income. NZ IFRS 9 relaxes the requirements for hedge effectiveness by removing the 80% to 125% hedge effectiveness threshold. It requires an economic relationship between the hedged item and hedging instrument and for the ‘hedged ratio’ to be the same as that used by management for risk management purposes. Contemporaneous documentation is still required but is different to that currently prepared under NZ IAS 39. The standard is effective for the Banking Group’s reporting period beginning on 1 July 2018. The full impact of NZ IFRS 9 is yet to be assessed.
● NZ IFRS 15 Revenue from Contracts with Customers addresses recognition of revenue from contracts with customers. It replaces the current revenue recognition guidance in NZ IAS 18 Revenue and NZ IAS 11 Construction Contracts and is applicable to all entities with revenue. It sets out a five-step model for revenue recognition to depict the transfer of promised goods or services to customers in an amount that reflects the consideration, to which the entity expects to be entitled in exchange for those goods or services. This standard is effective for the Banking Group’s reporting period beginning on 1 July 2018. The full impact of NZ IFRS 15 is yet to be assessed.
● NZ IFRS 16 Leases replaces the current guidance in NZ IAS 17 Leases. Under NZ IFRS 16, a contract is, or contains, a lease if the contract conveys the right to control the use of an identified asset for a period of time in exchange for consideration. NZ IFRS 16 requires a lessee to recognise a lease liability reflecting future lease payments and a ‘right-of-use asset’ for virtually all lease contracts. Included is an optional exemption for certain short-term leases and leases of low-value assets; however, this exemption can only be applied by lessees. For lessors, the accounting for leases under NZ IFRS 16 is substantially the same under NZ IAS 17. This standard is effective for the Banking Group’s reporting period beginning on 1 July 2019. The full impact of NZ IFRS 16 is yet to be assessed.
Basis of Preparation
The measurement base adopted is that of historical cost as modified by the fair value measurement of available-for-sale financial assets, financial instruments at fair value through Income Statement, derivative contracts, and the revaluation of certain property, plant and equipment.
Critical Accounting Estimates and Judgements
The critical judgements used by management in applying the accounting policies that have the most significant effect on the amounts recognised in the financial statements, apart from those involving estimation, are the designation of financial assets and financial liabilities as at fair value through Income Statement and the assessment of control for consolidation purposes.
Preparation of the financial statements requires management to make estimates and assumptions that affect the amounts reported in the financial statements and accompanying notes. Actual results could differ from these estimates.
Estimates and assumptions are continually evaluated, and are based on historical experience and other factors, including expectations of future events that are believed to be reasonable under the circumstances. The Banking Group considers that tax positions, the valuation of financial instruments, goodwill impairment testing and the provision for impairment losses on advances to customers require significant accounting estimates and management judgement. Refer to (a) for details on consolidation, (f) for valuation of financial instruments, note 26 for goodwill impairment testing, note 15 for details of credit risk management and the basis of the Banking Group's impairment provision model, note 27 for deferred taxation and note 7 for taxation.

Notes to the Financial StatementsFor the year ended 30 June 2016
11 Statement of Accounting Policies (continued)
AASB Bank Limited 19
PPresentation Currency and Rounding
The functional and presentation currency of the Banking Group is New Zealand dollars. All amounts in this Disclosure Statement and the financial statements are presented in millions, unless otherwise stated.
Particular Accounting Policies
There have been no material changes to accounting policies during the year ended 30 June 2016 and the following particular accounting policies have been applied on a consistent basis.
(a) Basis of Consolidation
The consolidated financial statements of the Banking Group include the financial statements of the Bank and all entities where it is determined that there is capacity to control the entity. Control exists when the Banking Group is exposed, or has rights, to variable returns from its involvement with the investee and has the ability to affect those returns through its power over the investee. For purposes of assessing control, the Banking Group acts as a principal when there are no substantial removal rights and when its economic interest is substantial compared to the economic interest of other investors.
SubsidiariesSubsidiaries are those companies controlled by the Banking Group. The financial statements of subsidiaries are included in the Banking Group's financial statements from the date when the Banking Group obtains control until the date that it loses control.
Assets, liabilities and results of subsidiaries are consolidated in the Banking Group's financial statements. All intra-group balances and transactions have been fully eliminated on consolidation.
Other Controlled EntitiesThe Banking Group may invest in or establish a structured entity (“SE”) to enable it to undertake specific transactions. SEs include securitisation vehicles, a covered bond trust and other structured finance entities. Where the Banking Group has control of an SE, it is consolidated in the Banking Group's financial statements (refer to notes 22 and 24).
The Banking Group does not consolidate an SE that it does not control. As it can sometimes be difficult to determine whether the Banking Group has control, judgements are made about its exposure or right to variable returns and the ability to affect returns through its power over the SE.
AssociatesAssociates are those entities in which the Banking Group has significant influence, but not control, over financial and operating policies. The Banking Group has representation on the Boards of Directors of all companies classified as associates. Associates are accounted for under the equity method of accounting.
(b) Segment Reporting
Operating segments are reported based on the Banking Group's organisational and management structures (refer to note 44). Senior management review the Banking Group's internal reporting based around these segments in order to assess performance and allocate resources.
The Banking Group operates predominantly within New Zealand. On this basis geographical segment reporting is not applicable.
(c) Foreign Currency Translation
All foreign currency monetary assets and liabilities are converted at the rates of exchange ruling as at balance date. Foreign currency transactions are converted using the exchange rates prevailing at the dates of the transactions. For non-hedging instruments, unrealised gains and losses arising from these revaluations and gains and losses arising from foreign exchange dealings are recognised immediately in the Income Statement. For more information on the treatment of hedging gains and losses refer to (h).
The foreign currency translation reserve ("FCTR") includes historical exchange differences which arose from the translation of foreign currency assets, liabilities and Income Statements of overseas subsidiaries. Gains or losses accumulated in the FCTR are transferred to the Income Statement upon partial or full disposal of the overseas subsidiary.
(d) Revenue Recognition
Revenue is recognised to the extent that it is probable that economic benefits will flow to the Banking Group and that the revenue can be reliably measured. The principal sources of revenue are interest income, fees and commissions.
Interest Income and ExpenseFinancial instruments are classified in the manner described in (f). Some are measured by reference to amortised cost, others by reference to fair value.
For financial instruments measured at amortised cost, the effective interest method is used to measure the interest income or interest expense recognised in the Income Statement.
For financial instruments measured at fair value, interest income or interest expense is recognised under the effective interest method. Refer to (g) for the recognition of revenue relating to derivatives.
Lending FeesFees and direct costs relating to loan origination, financing and loan commitments are deferred and amortised to interest income over the life of the loan using the effective interest method. Lending fees not directly related to the origination of a loan are recognised over the period of service.
Notes to the Financial StatementsFor the year ended 30 June 2016
11 Statement of Accounting Policies (continued)
220 ASB Bank Limited
((d) Revenue Recognition (continued)
Commission and Other FeesWhen commissions or fees relate to specific transactions or events, they are recognised in the Income Statement when the service is provided to the customer. When they are charged for services provided over a period, they are taken to other income on an accruals basis as the service is provided.
Other IncomeDividend income is recorded in the Income Statement when the Banking Group's right to receive the dividend is established. Realised and unrealised gains and losses from re-measurement of financial instruments at fair value through Income Statement are included in other income.
(e) Expense Recognition
Operating lease payments are recognised in the Income Statement on a straight-line basis over the term of the lease, unless another systematic basis is more representative of the time pattern of the benefit received. All other expenses are recognised in the Income Statement on an accrual basis other than those disclosed specifically in other sections of note 1.
(f) Financial Instruments
BASIS OF RECOGNITION AND MEASUREMENTThe Banking Group offers an extensive range of financial instruments. Financial instruments are transacted on a commercial basis to derive an interest yield with terms and conditions having due regard to the nature of the transaction and the risks involved. All financial assets measured at fair value are accounted for on a trade date basis. Loans are recognised when cash is advanced to the borrowers. Financial liabilities are recognised when an obligation arises. Financial instruments are classified in one of the following categories at initial recognition: financial assets at fair value through Income Statement, available-for-sale financial assets, loans and receivables, held-to-maturity, financial liabilities at fair value through Income Statement and other financial liabilities.
The classification of financial instruments at initial recognition depends on the purpose and management's intention for which the financial instruments were acquired and their characteristics. All financial instruments are measured initially at their fair value plus transaction costs, except in the case of financial assets and financial liabilities recorded at fair value through Income Statement, where transaction costs are expensed as incurred.
Financial assets at fair value through Income Statement, available-for-sale financial assets and financial liabilities at fair value through Income Statement are measured at fair value. Where available, quoted market prices are used as a measure of fair value. Bid prices are used to estimate fair values of assets, whereas offer prices are applied to liabilities. Where quoted market prices do not exist, fair values are estimated using present value or other market accepted valuation techniques, using methods and assumptions that maximise the use of observable market inputs available as at balance date.
If changes in these assumptions to a reasonably possible alternative would result in a significantly different fair value, this has been disclosed.
FINANCIAL ASSETS AT FAIR VALUE THROUGH INCOME STATEMENTAssets in this category are either held for trading or designated on initial recognition and are accounted for and evaluated on a fair value basis. Fair value reporting of these assets reflects the Banking Group's risk management process, which includes utilising natural offsets where possible.
Financial assets in this category include:
Trading SecuritiesThis category includes short and long term public and other debt securities, which are held for trading. The fair value of securities is based on quoted market prices, where available, or calculated using discounted cash flow models based on current market rates.
Derivative AssetsDerivative assets are measured at fair value through Income Statement. Refer to (g) for more details on derivatives.
AVAILABLE-FOR-SALE FINANCIAL ASSETSAvailable-for-sale financial assets are debt and equity securities that are not classified as at fair value through Income Statement, or as loans and receivables and are intended to be held for an indefinite period of time, and which may be sold in response to needs for liquidity or changes in interest rates or exchange rates. These are measured at fair value, with changes in fair value recognised in the available-for-sale reserve, until the assets are sold or otherwise disposed of, or until they are impaired. When fair value hedge accounting is applied, only fair value changes relating to movements in credit spreads are included in the reserve. On disposal the accumulated change in fair value is transferred to the Income Statement and reported in other income. Interest, premiums and discounts are amortised through the Income Statement using the effective interest method.
Impairment charges on available-for-sale equity financial assets are recorded when there has been a significant or prolonged decline in the fair value below their cost. The determination of what is "significant" or "prolonged" requires judgement and the Banking Group evaluates, among other factors, historical price movements and the duration and extent to which the fair value of the investment is less than cost.

Notes to the Financial StatementsFor the year ended 30 June 2016
11 Statement of Accounting Policies (continued)
AASB Bank Limited 21
((f) Financial Instruments (continued)
LOANS AND RECEIVABLESThese are non-derivative financial assets with fixed or determinable payments that are not quoted on an active market. They are measured at amortised cost and interest income is recognised in the Income Statement using the effective interest method.
Amortised cost is the amount at which a financial instrument is measured at initial recognition minus principal repayments, plus or minus the cumulative amortisation using the effective interest method of any difference between that initial amount and the maturity amount, and minus any reduction (directly or through the use of an allowance account) for impairment or uncollectibility.
The effective interest method is a method of calculating the amortised cost of a financial instrument and of allocating the interest income or expense over the relevant period. The effective interest rate is the rate that exactly discounts estimated future cash payments or receipts through the expected life of the financial instrument or, when appropriate a shorter period, to the net carrying amount of the financial asset or financial liability.
Financial assets in the loans and receivable category include:
Cash and Liquid AssetsCash and liquid assets include cash and cash at bank, cash in transit, call deposits with the central bank, money at short call (deposit and settlement accounts with other financial institutions with an original maturity of three months or less), and reverse repurchase agreements.
Due from Financial InstitutionsDue from financial institutions is defined by the nature of the counterparty and includes loans, nostro balances and settlement account balances due from other financial institutions.
Advances to CustomersAdvances cover all forms of lending to customers, other than those classified as at fair value through Income Statement, and include mortgages, overdrafts, personal loans and credit card balances. They are recognised in the Balance Sheet when cash is advanced to the customer. When fair value hedge accounting is applied to advances to customers, the carrying value at amortised cost is adjusted for changes in fair value related to the hedged risk.
Advances are reported net of provisions for impairment to reflect the estimated recoverable amounts. Refer to (m).
Other AssetsOther assets include the accrual of interest coupons, fees receivable and receivables relating to unsettled transactions. For derivatives any accrued interest is recognised and measured as part of the derivative's fair value.
HELD-TO-MATURITY INVESTMENTSThese are non-derivative financial assets with fixed or determinable payments and a fixed maturity that the Banking Group has a positive intention and ability to hold to maturity. They are measured at amortised cost using the effective interest method. The Banking Group has not classified any financial assets as held-to-maturity.
FINANCIAL LIABILITIES AT FAIR VALUE THROUGH INCOME STATEMENTLiabilities in this category are either held for trading or designated on initial recognition and are accounted for and evaluated on a fair value basis. Fair value reporting of these liabilities reflects the Banking Group's risk management process, which includes utilising natural offsets where possible.
Liabilities in this category include:
Other Liabilities at Fair Value through Income StatementCertain liabilities are designated as at fair value through Income Statement on origination, where those liabilities are managed on a fair value basis, or where designation eliminates or significantly reduces an accounting mismatch. An accounting mismatch could arise from measuring assets or liabilities, or recognising their gains or losses on different bases. These amounts are managed with other assets and liabilities accounted for and evaluated on a fair value basis.
The fair value is calculated using discounted cash flow models. The discount rates applied in this calculation are based on current market rates.
Derivative LiabilitiesDerivative liabilities are measured at fair value through Income Statement. Refer to (g) for more details on derivatives.
Debt Issues: At Fair value through Income StatementThis category includes all debt issues that are designated as at fair value through Income Statement and primarily consists of issued paper. Debt issues have been designated as at fair value through Income Statement, where designation eliminates or significantly reduces an accounting mismatch. These amounts are managed with other assets and liabilities accounted for and evaluated on a fair value basis.
OTHER FINANCIAL LIABILITIESThis category includes all financial liabilities other than those designated as at fair value through Income Statement. Liabilities in this category are measured at amortised cost and interest expense is recognised in the Income Statement using the effective interest method.

Notes to the Financial StatementsFor the year ended 30 June 2016
11 Statement of Accounting Policies (continued)
222 ASB Bank Limited
((f) Financial Instruments (continued)
Financial liabilities in this category include:
Deposits and Other Public BorrowingsDeposits and other public borrowings cover all forms of funding that are not designated as at fair value through Income Statement or included in debt issues. This includes transactional and savings accounts, term deposits, certificates of deposit, credit balances on cards, foreign currency accounts and repurchase agreements.
Due to Financial InstitutionsDue to financial institutions is defined by the nature of the counterparty and includes deposits, vostro balances and settlement account balances due to other financial institutions.
Other LiabilitiesOther liabilities include the accrual of interest coupons and fees payable. For derivatives, any accrued interest is recognised and measured as part of the derivative's fair value.
Debt Issues: At Amortised CostThis category includes all debt issues that are not designated as at fair value through Income Statement and primarily consists of issued paper. When fair value hedge accounting is applied to issued paper, the carrying value at amortised cost is adjusted for changes in fair value related to the hedged risk.
Loan CapitalLoan capital is debt issued by the Banking Group with terms and conditions that qualify for inclusion as capital under RBNZ’s prudential standards. Refer to note 42 for further information on regulatory capital. When fair value hedge accounting is applied to fixed rate loan capital, the carrying value at amortised cost is adjusted for changes in fair value related to the hedged risk.
(g) Derivative Financial Instruments
Derivative instruments are contracts whose value is derived from one or more underlying variables such as a specified interest rate or an index as defined in the contract. The Banking Group enters into derivative transactions including foreign exchange contracts, forward rate agreements, futures, options, interest rate swaps, currency swaps and combinations of these instruments. The sale of derivatives to customers as risk management products and their use for trading purposes is integral to the Banking Group’s financial markets activities. Derivatives are also used to manage the Banking Group’s own exposure to market risk.
The Banking Group recognises derivatives in the Balance Sheet at their fair value. Fair values are obtained from market yields and discounted cash flow models or option pricing models as appropriate. Derivative assets are those contracts which have a positive fair value. Derivative liabilities are those contracts which have a negative fair value.
Derivatives are classified either as “Held for hedging” or “Held for trading”.
Held for trading derivatives are those entered into in order to meet customers’ needs, to undertake market making and positioning activities and for economic hedging without applying hedge accounting. Changes in the fair value of held for trading derivatives are included in other income. Interest income or expense relating to held for trading derivatives entered into for economic hedging are included in interest income or expense depending on the nature of the hedged transaction. Interest income or interest expense relating to held for trading derivatives for purposes other than economic hedging are included in other income.
Held for hedging derivatives are instruments held for risk management purposes, which meet the criteria for hedge accounting as described in (h).
(h) Hedge Accounting
The Banking Group uses derivatives as part of its asset and liability management activities to manage exposures to interest rate and foreign currency, including exposures arising from forecast transactions. The Banking Group applies either cash flow or fair value hedge accounting when transactions meet the specified criteria to obtain hedge accounting treatment.
A cash flow hedge is a hedge of the exposure to variability in cash flows that is attributable to a particular risk associated with a recognised asset or liability or a highly probable forecast transaction, and could affect profit or loss. A fair value hedge is a hedge of the exposure to changes in fair value of a recognised asset or liability or an unrecognised firm commitment, or an identified portion of such an asset, liability or firm commitment, that is attributable to a particular risk and could affect profit or loss.
The Banking Group discontinues hedge accounting when it is determined that a hedge has ceased to be highly effective; when the derivative expires, or is sold, terminated, or exercised; when the hedged item matures or is sold or repaid; when a forecast transaction is no longer deemed highly probable; or when the Banking Group elects to revoke the hedge designation.
Cash Flow Hedge AccountingA fair value gain or loss associated with the effective portion of a derivative designated as a cash flow hedge is recognised initially in the cash flow hedge reserve. The ineffective portion of changes in fair value are recognised immediately in other income. When the transaction or item that the derivative is hedging (including cash flows from transactions that were only forecast when the derivative hedge was effected) affects income or expense then the associated fair value change on the hedging derivative is simultaneously transferred from the cash flow hedge reserve to the corresponding income or expense line item in the Income Statement.

Notes to the Financial StatementsFor the year ended 30 June 2016
11 Statement of Accounting Policies (continued)
AASB Bank Limited 23
((h) Hedge Accounting (continued)
When a hedging derivative expires or is sold, the hedge no longer meets the criteria for hedge accounting, or the Banking Group elects to revoke the hedge designation, the cumulative gain or loss on the hedging derivative remains in the cash flow hedge reserve until the forecast transaction occurs and affects income, at which point it is transferred to the corresponding income or expense line. If a forecast transaction is no longer expected to occur, the cumulative gain or loss on the hedging derivative previously reported in cash flow hedge reserves is immediately transferred to other income.
Fair Value Hedge AccountingFor qualifying fair value hedges, the change in fair value of the hedging derivative is recognised within other income in the Income Statement. Changes in the fair value of the hedged item which are attributable to the risks hedged with the derivative instrument, are reflected in an adjustment to the carrying value of the hedged item, and are recognised in other income.
If the hedging instrument no longer meets the criteria for hedge accounting, or the Banking Group revokes the hedge designation, the difference between the carrying value of the hedged item at that point and the value at which it would have been carried had the hedge never existed (the "unamortised fair value adjustment"), is maintained as part of the carrying value of the hedged item and amortised to other income based on a recalculated effective interest rate. If the hedged item is sold or repaid, the unamortised fair value adjustment is recognised immediately in other income.
(i) Leasing
Leases under which the Banking Group transfers substantially all the risks and rewards of ownership of an asset to the lessee or a third party are classified as finance leases. Under a finance lease, the present value of the lease payments including any guaranteed residual value is recognised as a receivable and is reported within advances to customers. The difference between the gross receivable and the present value of the receivable is treated as unearned finance income. Lease income is recognised over the lease term so as to produce a constant periodic rate of return on the net investment in the finance lease.
Leases where the Banking Group retains substantially all the risks and rewards of ownership of an asset are classified as operating leases. Operating lease rental revenue and expense is recognised in the Income Statement on a straight-line basis over the term of the lease, unless another systematic basis is more representative of the time pattern of the benefit received. The Banking Group classifies assets leased out under operating leases as property, plant and equipment. The assets are depreciated over their useful lives on a basis consistent with similar assets.
(j) Repurchase and Reverse Repurchase Agreements
Under repurchase agreements, collateral in the form of securities is advanced to a third party and the Banking Group receives cash in exchange. The counterparty is allowed to sell or repledge the collateral advanced under repurchase agreements in the absence of default by the Banking Group, but has an obligation to return the collateral at the maturity of the contract. The Banking Group has determined that it retains substantially all the risks and rewards of these securities and therefore the securities advanced are not derecognised and are retained within the relevant security portfolio and accounted for accordingly. The obligation to repurchase is recorded as deposits and other public borrowings. The difference between the sale and repurchase price represents interest expense and is recognised in the Income Statement over the term of the repurchase agreement.
A reverse repurchase agreement is the same transaction as a repurchase agreement except the Banking Group is receiving the collateral in the form of securities and giving cash in exchange. The Banking Group may sell or re-pledge any collateral received, but has an obligation to return the collateral and the counterparty retains substantially all the risks and rewards of ownership. Consequently the collateral is not recognised by the Banking Group which instead records a separate asset for the cash given. The amount receivable is recorded as cash and liquid assets. The difference between the purchase and sale price represents interest income and is recognised in the Income Statement over the term of the agreement.
(k) Offsetting Financial Instruments
The Banking Group offsets financial assets and financial liabilities and reports the net balance in the Balance Sheet where there is currently a legally enforceable right to set off and there is an intention to settle on a net basis or to realise the asset and settle the liability simultaneously.
(l) Derecognition of Financial Instruments
Financial assets are derecognised when the rights to receive cash flows from the financial assets have expired. Derecognition also occurs when the rights to receive cash flows from financial assets have been transferred together with substantially all of their risks and rewards. For those transactions where substantially all the risk and rewards are neither retained nor transferred, the Banking Group derecognises assets when control is no longer retained. When control is retained, the assets are recognised to the extent of the Banking Group's continuing involvement.
Financial liabilities are derecognised when the obligation specified in the contract is discharged, cancelled or expired.

Notes to the Financial StatementsFor the year ended 30 June 2016
11 Statement of Accounting Policies (continued)
224 ASB Bank Limited
((m) Asset Quality
DEFINITIONSIndividually impaired assets are any credit exposures against which an individually assessed provision has been recorded in accordance with NZ IAS 39.
A past due asset is any credit exposure where a counterparty has failed to make a payment when contractually due, and which is not an impaired asset.
An asset under administration is any credit exposure which is not an impaired asset or a past due asset, but which is to a counterparty:
(a) who is in receivership, liquidation, bankruptcy, statutory management or any form of administration in New Zealand; or
(b) who is in any other equivalent form of voluntary or involuntary administration in an overseas jurisdiction.
PROVISION FOR IMPAIRMENTLoans and receivables are reviewed at each balance date to determine whether there is objective evidence of impairment. Individually significant assets are reviewed for impairment individually and other assets are reviewed individually or collectively. If there is objective evidence of impairment, the recoverable amount of the asset or group of assets is estimated and provision is made for the difference between the carrying amount and the recoverable amount. The recoverable amounts of advances to customers measured at amortised cost are calculated as the present value of the expected future cash flows. Short term balances are not discounted.
Objective evidence that a financial asset or portfolio of assets is impaired includes, but is not limited to, observable data that comes to the attention of the Banking Group about the following loss events:
(a) significant financial difficulty of the issuer or obligor; or
(b) a breach of contract, such as a default or delinquency in interest or principal payments; or
(c) the Banking Group, for economic or legal reasons relating to the borrower's financial difficulty, granting to the borrower a concession that it would not otherwise consider; or
(d) the disappearance of an active market for the financial asset because of financial difficulties.
Financial assets at fair value through Income Statement are not assessed for impairment as their fair value reflects the credit quality of the instrument, and changes in fair value are recognised in other income.
Allowances for credit losses on off balance sheet items such as commitments are reported in other liabilities.
Advances to CustomersAdvances to customers are presented net of individually assessed and collective provisions for impairment. Provisions are made against the carrying amount of advances that are identified as being impaired based on regular reviews of outstanding balances, to reduce these advances to their recoverable amounts. Collective provisions are maintained to reduce the carrying amount of portfolios of similar advances to their estimated recoverable amounts as at balance date. These provisions include incurred losses not yet specifically identified in the portfolio. The expected future cash flows for portfolios of similar assets are estimated based on previous experience and considering the credit rating of the underlying customers and late payments of interest or penalties. Increases in the individually assessed and collective provisions are recognised in the Income Statement. When a loan is known to be uncollectible, it is written off against the related provision for loan impairment. Such loans are written off after all the necessary procedures have been completed, and the amount of the loss has been determined.
If in a subsequent period the amount of an impairment loss decreases and the decrease can be linked objectively to an event occurring after the write off, the write-off or provision is reversed through the Income Statement.
(n) Property, Plant and Equipment
Property, plant and equipment other than land and buildings are recognised in the Balance Sheet at cost less accumulated depreciation and impairment losses.
Freehold land and buildings are stated at revalued amounts based on revaluations conducted every three years on a rolling basis. The rolling valuations are carried out by independent registered valuers in June. The valuers are all Associate Members of the New Zealand Institute of Valuers and the major valuation firms used are Jones Lang LaSalle Limited (Auckland), Thayer Todd Valuations Limited (Invercargill) and Telfer Young Waikato Limited (Hamilton).
Changes in valuations of freehold land and buildings are transferred directly to the asset revaluation reserve. Where such a transfer results in a debit balance in the asset revaluation reserve of any individual asset, the loss is recognised in the Income Statement, and any subsequent revaluation gains are written back through the Income Statement to the extent of past losses recognised. Upon sale of freehold land and buildings, any gains held in the asset revaluation reserve are transferred directly to retained earnings.
The cost or revalued amount of property, plant and equipment (excluding land) less the estimated residual value is depreciated over their useful lives on a straight-line basis. The range of useful lives of the major assets are:
● Buildings 10-100 years
● Furniture and fittings 5-10 years
● Computer and office equipment, and operating software 3-8 years
● Other property, plant and equipment 4-18 years
The assets' residual values, useful lives and depreciation methods are reviewed and adjusted if appropriate at each balance date.

Notes to the Financial StatementsFor the year ended 30 June 2016
11 Statement of Accounting Policies (continued)
AASB Bank Limited 25
((n) Property, Plant and Equipment (continued)
Assets are reviewed for impairment at least annually and whenever events or changes in circumstances indicate that the carrying amount may not be recoverable. An asset's carrying amount is written down immediately to its recoverable amount if the asset's carrying amount is greater than its estimated recoverable amount. For revalued assets, the write-down is treated in the same way as adjustments arising from revaluations described above. For other assets, the impairment loss is recognised as an expense. The recoverable amount is the higher of the asset's fair value less costs to sell and value in use.
Where the Banking Group expects the carrying amount of assets held within property, plant and equipment to be recovered principally through a sale transaction rather than through continuing use, these assets are classified as held for sale.
(o) Intangible Assets
Intangible assets comprise goodwill acquired in a business combination, and acquired computer software licences as well as certain acquired and internally generated application software.
GOODWILLGoodwill represents the excess of the purchase consideration over the fair value of the identifiable net assets of a controlled entity at the date of gaining control. It is capitalised and recognised in the Balance Sheet, and has an indefinite life.
The carrying value of goodwill is tested annually for impairment, or more frequently if events or changes in circumstances indicate that it might be impaired. If any such indication exists, the asset's recoverable amount is estimated, and an impairment loss is recognised under operating expenses in the Income Statement for the difference between the carrying amount and the recoverable amount. Impairment losses on goodwill are not reversed.
For the purposes of impairment testing, goodwill is allocated to cash-generating units or groups of units. A cash-generating unit is the smallest identifiable group of assets that generate independent cash flows. Goodwill is allocated by the Banking Group to cash-generating units or groups of units based on how goodwill is monitored by management. Gains or losses on the disposal of an entity include the carrying value of goodwill relating to the entity sold.
COMPUTER SOFTWAREAcquired computer software licences are capitalised on the basis of costs incurred to acquire and bring to use the specific software. These costs are amortised over their expected useful lives on a straight-line basis.
Certain internal and external costs directly incurred in acquiring and developing software are capitalised when specific criteria are met. These intangible assets are amortised over their expected useful lives on a straight-line basis. Computer software costs that do not meet the capitalisation criteria are expensed in the period incurred.
Computer software is subject to the same impairment review process as property, plant and equipment. Any impairment loss is recognised under operating expenses in the Income Statement.
(p) Taxation
Income tax on the net profit for the year comprises current and deferred tax. Income tax is recognised in the Income Statement except to the extent that it relates to items recognised in other comprehensive income, in which case it is recognised in other comprehensive income.
Current tax is the expected tax payable on the taxable income for the period, using tax rates enacted or substantively enacted as at balance date taking advantage of all allowable deductions under current taxation legislation. It also includes any adjustment to tax payable in respect of previous financial years.
Deferred tax is provided using the balance sheet liability method, providing for temporary differences between the carrying amounts of assets and liabilities for financial reporting purposes and the amounts used for taxation purposes. The amount of deferred tax provided is based on the expected manner of realisation or settlement of the carrying amount of assets and liabilities, using tax rates enacted or substantively enacted as at balance date.
In accordance with NZ IAS 12 Income Taxes, a deferred taxation asset is recognised only to the extent that it is probable (i.e. more likely than not) that a future taxable profit will be available against which the asset can be utilised. Deferred taxation assets are reduced to the extent that it is no longer probable that the related tax benefit will be realised.
Current or deferred tax related to fair value measurement of available-for-sale financial assets, cash flow hedges and the revaluation of non-current assets, which is charged or credited to other comprehensive income is subsequently recognised in the Income Statement if and when the deferred gain or loss on the related asset or liability affects the Income Statement.
(q) Securitisation, Funds under Management and Other Fiduciary Activities
ASB Group Investments Limited, a subsidiary of the Banking Group, acts as manager for a number of unit trusts and superannuation schemes.
The assets and liabilities of these trusts and schemes are not included in the financial statements of the Banking Group when the Banking Group does not have control of the trusts and schemes. Fund management income is included in other income.
Securitised assets are derecognised in accordance with the derecognition of financial instruments policy as set out in (l).

Notes to the Financial StatementsFor the year ended 30 June 2016
11 Statement of Accounting Policies (continued)
226 ASB Bank Limited
((r) Contingent Liabilities and Credit Commitments
Contingent liabilities are possible obligations, whose existence will be confirmed only by uncertain future events, or present obligations where the transfer of economic benefit is uncertain or cannot be reliably measured. Contingent liabilities are not recognised, but are disclosed, unless they are remote.
The Banking Group issues commitments to extend credit, letters of credit, guarantees and other credit facilities. These financial instruments attract fees in line with market prices for similar arrangements. They are not sold or traded. Letters of credit and guarantees generally do not involve cash payments other than in the event of default. The fee pricing is set as part of the broader customer credit process and reflects the probability of default. They are disclosed as contingent liabilities at their face value. The fair values of guarantees are not considered to be material.
(s) Provisions
A provision is recognised in the Balance Sheet when the Banking Group has a present legal or constructive obligation as a result of past events, it is probable that an outflow of resources will be required to settle the obligation, and a reliable estimate can be made of the amount of the obligation.
(t) Cash Flow Statement
The Cash Flow Statement has been prepared using the indirect method by which net profit before taxation is adjusted for non-cash transactions and movements in Balance Sheet accounts relating to operating activities.
Cash and cash equivalents include cash and cash at bank, cash in transit and call deposits with the central bank.
Changes in cash and cash equivalents related to operating activities reflect cash flows generated by the Banking Group's operations.
Changes in cash and cash equivalents related to investing activities reflect cash flows relating to investments in controlled entities and associates and other securities, as well as acquisitions and disposals of property, plant and equipment and intangible assets.
Changes in cash and cash equivalents related to financing activities reflect cash flows resulting from transactions with shareholders and cash flows relating to debt and loan capital issuances and repayments.
Fair Value Estimates
For financial instruments not presented in the Banking Group's Balance Sheet at their fair value, fair value is estimated as follows:
Cash and Liquid AssetsThese assets are short term in nature and the related carrying value is equivalent to their fair value.
Due from Financial InstitutionsFair value is calculated using discounted cash flow models applying discount rates based on current market interest rates for assets with similar credit, interest rate repricing and maturity profiles.
Advances to CustomersFor floating rate advances, the carrying amount in the Balance Sheet is considered a reasonable estimate of their fair value after making allowances for the fair value of impaired and potential problem loans. For fixed rate advances, fair value is estimated using discounted cash flow models applying discount rates based on current market interest rates for advances with similar credit, interest rate repricing and maturity profiles.
Other AssetsCarrying amounts in the Balance Sheet are a reasonable estimate of fair value for these assets.
Deposits and Other Public Borrowings, Due to Financial Institutions and Debt Issues: At Amortised CostFor non-interest bearing debt, call and variable rate deposits, the carrying amounts in the Balance Sheet are a reasonable estimate of their fair value. For other term deposits and fixed rate issued paper, fair value is estimated using discounted cash flow models applying discount rates based on current market interest rates for similar instruments with similar maturity profiles.
Other LiabilitiesCarrying amounts in the Balance Sheet are a reasonable estimate of fair value for these liabilities.
Loan CapitalThe estimated fair value of loan capital is based on quoted market rates of publicly traded securities of similar maturity, credit and yield characteristics.
Changes to Comparatives
Effective 1 July 2015, interest relating to certain derivatives transacted as economic hedges has been recorded in net interest earnings. In prior periods, these amounts were included in other income. Accordingly, certain comparatives have been restated to reclassify $36 million from other income to net interest earnings. This presentation more accurately reflects the economic purpose in transacting these derivatives.
In addition, fixed rate prepayment cost recoveries of $7 million have been reclassified from other income to interest income, to align with market practice.
These reclassifications have no impact on net profit after taxation.
Other comparative information has been reclassified or restated to ensure consistency with presentation in the current year. Significant changes have been footnoted throughout the financial statements.

Notes to the Financial StatementsFor the year ended 30 June 2016
AASB Bank Limited 27
22 IInterest Income
$ millions Banking Group
FFor the year ended 30 June 22016 2015
Cash and liquid assets 551 62
Due from financial institutions 99 5
Trading securities 225 53
Available-for-sale securities 1108 120
Advances to customers 33,855 3,866
TTotal interest income 44,048 4,106
Interest income on advances to customers for the year ended 30 June 2016 included interest earned of $23 million on individually impaired assets (30 June 2015 $20 million).
Total interest income for financial assets that are not at fair value through Income Statement is $4,023 million (30 June 2015 $4,053 million).
3 Interest Expense
$ millions Banking Group
For the year ended 30 June 2016 2015
Deposits and other public borrowings:
Certificates of deposit 76 36
Term deposits 1,023 1,048
On demand and short term deposits 623 646
Repurchase agreements 2 5
Due to financial institutions 37 125
Other liabilities at fair value through Income Statement 25 23
Derivatives - 3
Debt issues:
At fair value through Income Statement 43 54
At amortised cost 436 475
Loan capital 21 24
Total interest expense 2,286 2,439
Total interest expense for financial liabilities that are not at fair value through Income Statement is $2,218 million (30 June 2015 $2,359 million).

Notes to the Financial StatementsFor the year ended 30 June 2016
228 ASB Bank Limited
44 OOther Income
$ millions Banking Group
FFor the year ended 30 June 22016 2015
Lending fees 555 52
Commissions and other fees 2233 232
Funds management income 885 74
Trading income 995 88
IIneffective portion of hedges
Fair value hedge ineffectiveness:
Gain on hedged items 11 61
Loss on hedging instruments -- (64)
Cash flow hedge ineffectiveness ((11) (26)
TTotal ineffective portion of hedges ((10) (29)
OOther operating income
Net loss on disposal of property, plant and equipment ((6) (4)
Dividends received 22 3
Net fair value gain/(loss) on derivatives not qualifying for hedge accounting 22 (1)
Net fair value loss on financial instruments designated at fair value through Income Statement ((1) -
Other 99 4
TTotal other operating income 66 2
TTotal other income 4464 419
5 Operating Expense Disclosures
$ millions Banking Group
For the year ended 30 June 2016 2015
Depreciation
Buildings 12 12
Computer and office equipment, and operating software 24 24
Total depreciation 36 36
Operating lease rentals 62 62
Amortisation of intangible assets 41 38
6 Auditor's Remuneration
PricewaterhouseCoopers is the appointed auditor of the Bank.
Audit fees of $1,669,000 were paid to PricewaterhouseCoopers for the audit of the Banking Group during the year ended 30 June 2016 (30 June 2015 $1,632,000). In addition fees of $332,000 were paid during the year for the audit of funds managed by the Banking Group (30 June 2015 $287,000).
During the year ended 30 June 2016, PricewaterhouseCoopers was also paid fees of $292,000 for other services and $76,000 for advisory services (30 June 2015 $286,000 and nil). Other services included reviews of financial information, process and internal controls ($170,000) and reviews for regulatory purposes ($122,000) (30 June 2015 $195,000 and $91,000).

Notes to the Financial StatementsFor the year ended 30 June 2016
AASB Bank Limited 29
77 TTaxation
$ millions Banking Group
FFor the year ended 30 June 22016 2015
Current taxation 3384 344
Deferred taxation (refer to note 27) ((27) (11)
TTotal income tax charged to the Income Statement 3357 333
The taxation expense on the Banking Group's net profit before taxation differs from the theoretical amount that would arise using the domestic rate as follows:
Net profit before taxation 11,270 1,192
Tax at the domestic rate of 28% 3356 334
Tax effect of income not subject to taxation -- (1)
Tax effect of expenses not deductible for taxation purposes 11 1
Tax effect of imputation credit adjustments ((1) (1)
Tax effect of prior period adjustments 11 -
TTotal income tax charged to the Income Statement 3357 333
Weighted average effective tax rate 228.1% 28.0%
8 Dividends
$ millions Banking Group
For the year ended 30 June 2016 2015
Ordinary dividends paid 200 1,140
Perpetual preference dividends paid 49 26
Total dividends paid 249 1,166
Dividends on ordinary shares for the year ended 30 June 2016 were $200 million, 7.55 cents per share (30 June 2015 $1,140 million, 50.71 cents per share).
Dividends on perpetual preference shares for the year ended 30 June 2016 were:
• $7 million, being 3.25 cents per share on 200 million perpetual preference shares (30 June 2015 $7 million, 3.37 cents per share); • $11 million, being 3.12 cents per share on 350 million perpetual preference shares (30 June 2015 $11 million, 3.33 cents per share);• $27 million, being 456.46 cents per share on 6 million perpetual preference shares (30 June 2015 $8 million, 127.81 cents per share); and• $4 million, being 98.80 cents per share on 4 million perpetual preference shares (30 June 2015 nil).
On 4 August 2016, the Directors resolved to pay the following dividends, subject to certain conditions being satisfied:
• $1 million on 15 August 2016, being 0.72 cents per share on 200 million perpetual preference shares; • $2 million on 15 August 2016, being 0.58 cents per share on 350 million perpetual preference shares; • $6 million on 15 September 2016, being 105.98 cents per share on 6 million perpetual preference shares; • $5 million on 15 September 2016, being 119.59 cents per share on 4 million perpetual preference shares; and• $200 million on 15 September 2016, being 7.55 cents per share on 2,648 million ordinary shares.

Notes to the Financial StatementsFor the year ended 30 June 2016
330 ASB Bank Limited
99 CCash and Liquid Assets
$ millions Banking Group
AAs at 30 June 22016 2015
Cash, cash at bank and cash in transit 1199 129
Call deposits with the central bank 7736 1,259
Money at short call 113 25
Reverse repurchase agreements 4455 386
TTotal cash and liquid assets 11,403 1,799
10 Due from Financial Institutions
As at 30 June 2016 amounts due from financial institutions of $1,131 million are due for settlement within 12 months of balance date (30 June 2015 $1,615 million due within 12 months of balance date).
11 Trading Securities
$ millions Banking Group
As at 30 June 2016 2015
Local authority securities 49 46
New Zealand government securities 106 9
Treasury bills - 446
RBNZ bills 67 -
Bank bills 568 468
Kauri bonds 2 2
Total trading securities 792 971
Amounts due for settlement within 12 months 663 939
Amounts due for settlement over 12 months 129 32
Total trading securities 792 971

Notes to the Financial StatementsFor the year ended 30 June 2016
AASB Bank Limited 31
112 Derivative Financial Instruments
Derivative financial instruments are classified as either held for trading or held for hedging. Held for trading derivatives are those entered into in order to meet customers’ needs, to undertake market making and positioning activities and for economic hedging without applying hedge accounting. Held for hedging derivatives are instruments held for risk management purposes, which meet the criteria for hedge accounting. Refer to note 1(g) and (h) for an explanation of the Banking Group’s accounting policies for derivatives and hedge accounting.
The Banking Group has entered into credit support annexes ("CSAs") in respect of certain credit exposures relating to derivative transactions. These CSAs compel the Banking Group or the counterparty to collateralise the market value of outstanding derivative transactions. As at 30 June 2016 the Banking Group had advanced $1,035 million of cash collateral against derivative liabilities and received $331 million of cash collateral against derivative assets (30 June 2015 $361 million and $797 million respectively).
Hedge Accounting
Cash Flow Hedges
The Banking Group hedges the forecast interest cash flows from floating rate mortgage loans, floating rate deposits, term foreign currency funding and the roll-over of short term fixed rate funding arrangements using cross currency and interest rate swaps. As at 30 June 2016 there were no transactions where cash flow hedge accounting ceased during the year as a result of highly probable cash flows no longer expected to occur (30 June 2015 nil).
Fair value gains and losses deferred in the cash flow hedge reserve will be transferred to the Income Statement over the next one to ten years, as the cash flows under the hedged transactions occur.
Fair Value Hedges
The Banking Group uses interest rate swaps to hedge interest rate risk exposure of a portion of its portfolios of fixed rate mortgage loans and fixed rate bonds. Interest rate swaps and cross currency swaps have also been used to hedge certain fixed rate funding arrangements, included in debt issues held at amortised cost and loan capital.
$ millions Banking Group
As at 30 June 2016 2015Notional Fair Value Notional Fair ValueAmount Assets Liabilities Amount Assets Liabilities
Held for trading(1)
Exchange rate contracts
Forward contracts 6,021 61 (186) 6,843 215 (89)
Swaps - - - 90 16 -
Options 243 4 (4) 315 7 (7)
Total exchange rate contracts 6,264 65 (190) 7,248 238 (96)
Interest rate contracts
Forward contracts 4,450 1 - 18,274 2 (2)
Swaps 51,378 652 (619) 34,206 540 (506)
Futures 2,828 - - 1,250 - -
Options 499 - - 575 - -
Total interest rate contracts 59,155 653 (619) 54,305 542 (508)
Commodity contracts
Options purchased and sold 10 1 (1) 18 2 (2)
Total held for trading 65,429 719 (810) 61,571 782 (606)
Held for hedging
Designated as cash flow hedges
Exchange rate contracts
Swaps 4,620 63 (240) 4,945 594 (24)
Interest rate contracts
Swaps 42,353 234 (508) 44,129 173 (337)
Total designated as cash flow hedges 46,973 297 (748) 49,074 767 (361)
(1) Comparative information has been restated to ensure consistency with presentation in the current year.

Notes to the Financial StatementsFor the year ended 30 June 2016
332 ASB Bank Limited
112 DDerivative Financial Instruments (continued)
$ millions BBanking Group
AAs at 30 June 22016 2015NNotional FFair Value Notional Fair ValueAAmount AAssets LLiabilities Amount Assets Liabilities
DDesignated as fair value hedges
EExchange rate contracts
Swaps 66,392 3327 ((275) 4,919 498 (206)
IInterest rate contracts
Swaps 113,162 1108 ((252) 15,130 55 (191)
TTotal designated as fair value hedges 119,554 4435 ((527) 20,049 553 (397)
TTotal held for hedging 666,527 7732 ((1,275) 69,123 1,320 (758)
TTotal derivative assets/(liabilities) 1131,956 11,451 ((2,085) 130,694 2,102 (1,364)
Amounts due for settlement within 12 months 2230 ((655) 661 (244)
Amounts due for settlement over 12 months 11,221 ((1,430) 1,441 (1,120)
TTotal derivative assets/(liabilities) 11,451 ((2,085) 2,102 (1,364)
13 Available-for-Sale Securities
$ millions Banking Group
As at 30 June 2016 2015
Local authority securities 331 132
New Zealand government securities 978 107
Corporate bonds 493 578
Treasury bills - 81
Kauri bonds 1,687 1,484
Other securities 528 659
Total available-for-sale securities 4,017 3,041
Amounts due for settlement within 12 months 498 371
Amounts due for settlement over 12 months 3,519 2,670
Total available-for-sale securities 4,017 3,041
14 Advances to Customers
$ millions Banking Group
As at 30 June 2016 2015
Loans and other receivables 72,324 65,542
Fair value hedge adjustments 48 71
Provisions for impairment losses (297) (230)
Total advances to customers 72,075 65,383
Amounts due for settlement within 12 months 12,081 10,353
Amounts due for settlement over 12 months 59,994 55,030
Total advances to customers 72,075 65,383

Notes to the Financial StatementsFor the year ended 30 June 2016
AASB Bank Limited 33
115 Credit Risk Management Policies
Credit Risk Management
Credit risk is the potential risk of loss arising from the failure of a debtor or counterparty to meet their contractual obligations.
Credit risk principally arises within the Banking Group from its core business in providing lending facilities. Credit risk also arises from the Banking Group assuming contingent liabilities, participating in financial market transactions and assuming underwriting commitments. The Banking Group is selective in targeting credit risk exposures and avoids exposures to high risk areas.
The BARC operates under a charter by which it oversees the Banking Group’s credit risk framework, credit management policies and practices. The BARC ensures that the Banking Group has in place and maintains credit policies and portfolio standards designed to achieve portfolio outcomes consistent with the Banking Group’s risk/return expectations.
A system of industry limits and a large credit exposure policy assist in the diversification of the credit portfolio. These policies are an important part of portfolio management objectives to create a diversified portfolio avoiding significantly large concentrations of economically related credit risk exposures.
The Banking Group has comprehensive, clearly defined credit policies for the approval and management of all credit risk including risk from other banks and related counterparties. Lending standards and criteria are clearly defined across different business sectors for all Banking Group products and incorporate income/repayment capacity, acceptable terms and security and loan documentation tests.
While the Banking Group applies policies, standards and procedures in governing the credit process, the management of credit risk also relies on the application of judgement and the exercise of good faith and due care by relevant staff within their delegated authority.
Refer to notes 16 to 20 for additional credit risk disclosures.
Collateral
Refer to note 21 for information on the Banking Group's policies and procedures regarding collateral and credit enhancements to mitigate credit risk.
Credit Risk Measurement
The measurement of credit risk utilises analytical tools to calculate both expected and unexpected losses for the credit portfolio. This includes consideration of the probability of default ("PD"), the exposure at the time of default ("EAD") and the loss given default ("LGD") that would likely be experienced as a consequence.
The PD is the estimate of the probability that a client will default within the next 12 months. It reflects a client's ability to generate sufficient cash flows into the future to meet the terms of all its credit contracts with the Banking Group.
EAD is the proportion of a facility that may be outstanding in the event of default. It is calculated as a percentage of the facility limit and is expressed in dollars.
LGD is the proportion of a facility estimated to be lost in the event of default. It is expressed as a percentage. LGD is impacted by the type, level, liquidity and volatility of any collateral held, carrying costs and management expense. Long run LGDs are used for internal estimates of risk and downturn LGDs are used for regulatory capital. LGD is also affected by requirements for certain exposures that the RBNZ may prescribe. For retail mortgages, the Banking Group applies downturn LGDs and higher correlation for high loan-to-valuation ratio (“LVR”) lending. For farm lending exposures, the Banking Group applies a prescribed downturn LGD with a presumed maturity of 2.5 years without any firm size adjustment.
The expected loss ("EL") is the product of the PD, EAD and the LGD. An EL will be recorded for every facility including retail.
Asset Quality
Credit risk is divided into the Retail segment and the Corporate segment. A different approach is used in each to determine an overall credit grade based on EL. These ratings equate to each other as follows:
Overall Credit Grade Retail Grade Corporate Grade Banking Group Rating Classification
Low EL Pool 1 CRR* 1 - 3 Retail facilities with low expected loss. Corporate facilities demonstrating financial condition and capacity to repay that are good to exceptional.
Medium EL Pool 2 CRR 4 – 6 Retail facilities with moderate expected loss. Corporate facilities demonstrating financial condition and capacity to repay that are acceptable to good.
High EL Pool 3 CRR 7 – 9 Retail facilities operating outside of agreed arrangements. Corporate facilities that require varying degrees of special attention (not necessarily contractually past due).
*Credit risk rating ("CRR")
These ratings equate to the rating classifications of the RBNZ as follows:
RBNZ Classification Retail Grade Corporate Grade Banking Group Rating Classification
Pass grades Pool 1 - 2 CRR 1 - 6 Pass grades
Special mention Past due CRR 7 Troublesome
Substandard Past due CRR 8 Troublesome
Doubtful/non-accrual Default CRR 9 Impaired/loss
Notes to the Financial StatementsFor the year ended 30 June 2016
334 ASB Bank Limited
115 Credit Risk Management Policies (continued)
Retail
The Retail segment comprises housing loans, credit cards, other personal credit facilities and most business lending up to $1 million. These portfolios are managed using statistical origination and account management techniques.
Retail facilities are assigned to a PD, EAD and LGD pool based on observed and predicted outcomes for facilities with similar characteristics. The overall credit grading pool is based on the EL that results from the product of PD, EAD and LGD for each facility.
Facilities in the Retail segment become classified for remedial management by centralised units based on delinquency status.
Corporate
Corporate exposures comprise commercial exposures, including bank and government exposures. A CRR is recorded against every corporate facility. Credit risk rated exposures are reviewed at least annually and the CRR reassessed.
PD and LGD are determined using credit assessment tools. The CRR is determined by reference to a matrix where PD and LGD combine to produce a numeric CRR grade which represents a range of EL.
CRRs fall into two categories:
1. Pass – CRR of 1 - 6. These credit facilities qualify for approval of new or increased exposure on normal commercial terms.
2. Troublesome and impaired assets ("TIAs") – CRR of 7 - 9. These credit facilities are not eligible for increases in exposure unless it will protect or improve the Banking Group’s position by maximising recovery prospects or to facilitate rehabilitation.
Oversight
Both retail and corporate segments are subject to inspection. Credit processes are reviewed by the relevant Credit Quality Review unit, with an independent overview provided by Credit Portfolio Assessment (“CPA”), an internal unit within the Bank. CPA’s processes include a review of compliance with policy, portfolio standards, and application of risk ratings with reports on findings reported to the BARC.
Impairment and Provisioning of Financial Assets
Default occurs if either of the following takes place:
● The customer is unlikely to repay their credit obligations to the Banking Group in full, without recourse by the Banking Group to actions such as realising available security; or
● The customer is 90 days or more overdue on a scheduled credit obligation repayment.
In addition to the credit risk management processes used to manage exposures to credit risk in the credit portfolio, the internal ratings process also assists management in assessing the requirements of NZ IAS 39 relating to impairment and provisioning of financial assets.
Financial assets are assessed at least at each reporting date for impairment. Provisions for impairment are raised where there is objective evidence of impairment and at an amount adequate to cover estimated credit related losses. Credit losses arise primarily from loans, but also from other credit instruments such as bank acceptances, contingent liabilities, guarantees and other financial instruments and assets acquired through security enforcement.
Impairment losses are recognised to reduce the carrying amount of loans and advances to their estimated recoverable amounts. Individually assessed provisions are made against individual financial assets when there is objective evidence that the Banking Group will not be able to collect all amounts due. The amount of the impairment loss is the difference between the carrying amount and the recoverable amount, calculated as the present value of expected cash flows, including amounts recoverable from guarantees and collateral, discounted at the original effective interest rate. Interest continues to be accrued on impaired loans based on the revised carrying amounts and using appropriate effective interest rates.
The Banking Group recognises collective provisions for impairment where there is objective evidence that components of a loan portfolio with similar credit risk characteristics contain probable losses as at the balance date that will be individually identified in the future, or where insufficient data exists to reliably determine whether such losses exist. The estimated probable losses are based upon historical patterns of losses. The calculations are based on statistical methods of credit risk measurement.
The provisions for impairment take into account current cyclical developments as well as economic conditions in which the borrowers operate and are subject to management review, experienced judgement, and adjustment where necessary to reflect these and other relevant factors in individual portfolios.
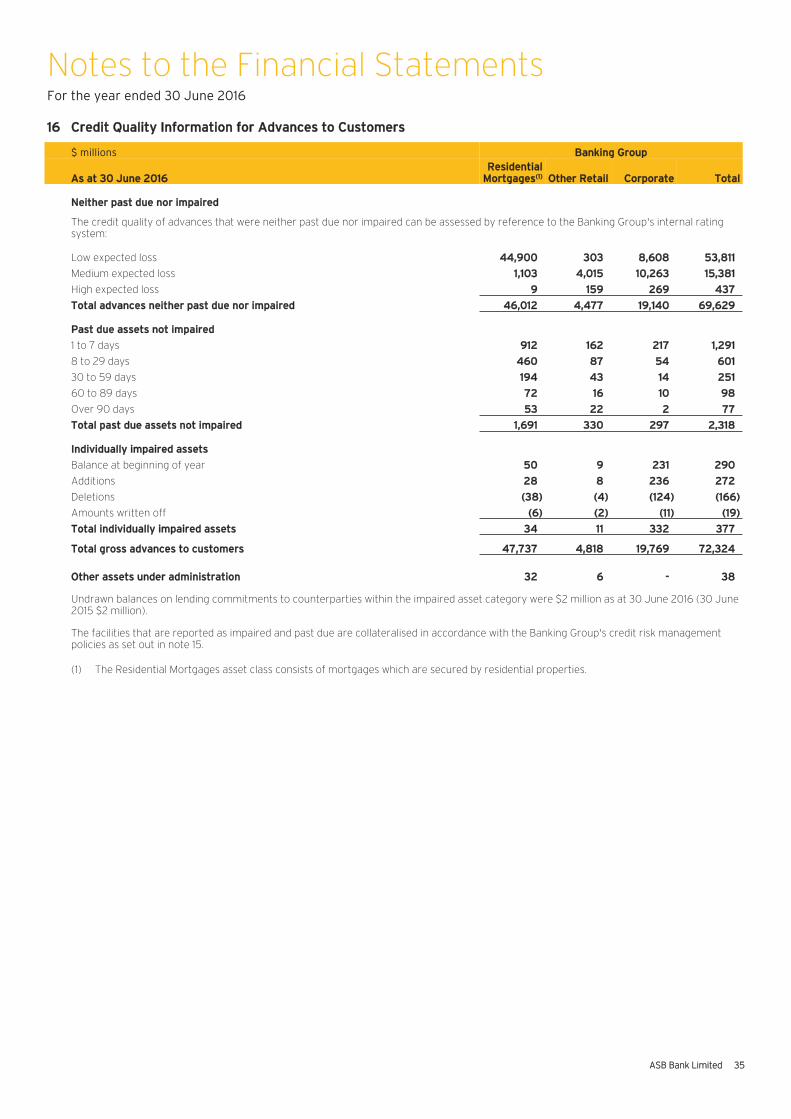
Notes to the Financial StatementsFor the year ended 30 June 2016
AASB Bank Limited 35
116 CCredit Quality Information for Advances to Customers
$ millions BBanking Group
AAs at 30 June 2016RResidential
Mortgages(1) OOther Retail CCorporate TTotal
NNeither past due nor impaired
The credit quality of advances that were neither past due nor impaired can be assessed by reference to the Banking Group's internal rating system:
Low expected loss 444,900 3303 88,608 553,811
Medium expected loss 11,103 44,015 110,263 115,381
High expected loss 99 1159 2269 4437
TTotal advances neither past due nor impaired 446,012 44,477 119,140 669,629
PPast due assets not impaired
1 to 7 days 9912 1162 2217 11,291
8 to 29 days 4460 887 554 6601
30 to 59 days 1194 443 114 2251
60 to 89 days 772 116 110 998
Over 90 days 553 222 22 777
TTotal past due assets not impaired 11,691 3330 2297 22,318
IIndividually impaired assets
Balance at beginning of year 550 99 2231 2290
Additions 228 88 2236 2272
Deletions ((38) ((4) ((124) ((166)
Amounts written off ((6) ((2) ((11) ((19)
TTotal individually impaired assets 334 111 3332 3377
TTotal gross advances to customers 447,737 44,818 119,769 772,324
OOther assets under administration 332 66 -- 338
Undrawn balances on lending commitments to counterparties within the impaired asset category were $2 million as at 30 June 2016 (30 June 2015 $2 million).
The facilities that are reported as impaired and past due are collateralised in accordance with the Banking Group's credit risk management policies as set out in note 15.
(1) The Residential Mortgages asset class consists of mortgages which are secured by residential properties.

Notes to the Financial StatementsFor the year ended 30 June 2016
336 ASB Bank Limited
116 CCredit Quality Information for Advances to Customers (continued)
$ millions BBanking Group
AAs at 30 June 2015Residential Mortgages Other Retail Corporate Total
NNeither past due nor impaired(1)
Low expected loss 40,482 284 8,697 49,463
Medium expected loss 1,195 3,882 7,799 12,876
High expected loss 11 119 163 293
TTotal advances neither past due nor impaired 41,688 4,285 16,659 62,632
PPast due assets not impaired
1 to 7 days 999 160 280 1,439
8 to 29 days 579 85 71 735
30 to 59 days 198 36 12 246
60 to 89 days 79 14 7 100
Over 90 days 73 20 7 100
TTotal past due assets not impaired 1,928 315 377 2,620
IIndividually impaired assets
Balance at beginning of year 51 10 157 218
Additions 44 6 162 212
Deletions (39) (4) (75) (118)
Amounts written off (6) (3) (13) (22)
TTotal individually impaired assets 50 9 231 290
TTotal gross advances to customers 43,666 4,609 17,267 65,542
OOther assets under administration 31 3 - 34
(1) Other Retail comparative information has been reclassified to ensure consistency with presentation in the current year.

Notes to the Financial StatementsFor the year ended 30 June 2016
AASB Bank Limited 37
117 PProvisions for Impairment Losses
$ millions BBanking Group
AAs at 30 June 2016RResidential Mortgages OOther Retail CCorporate TTotal
CCollective provision
Balance at beginning of year 339 775 880 1194
(Recovered from)/charged to Income Statement ((13) 117 661 665
BBalance at end of year 226 992 1141 2259
IIndividually assessed provisions
Balance at beginning of year 110 11 225 336
Add/(less):
Charged to Income Statement:
New and increased provisions 114 44 228 446
Write-back of provisions no longer required ((11) ((1) ((13) ((25)
Write-offs against individually assessed provisions ((6) ((2) ((11) ((19)
BBalance at end of year 77 22 229 338
TTotal provisions for impairment losses 333 994 1170 2297
IImpairment losses on advances
Movement in collective provision ((13) 117 661 665
New and increased individually assessed provisions net of write-backs 33 33 115 221
Bad debts written off directly to the Income Statement -- 558 -- 558
Recovery of amounts previously written off ((2) ((11) ((1) ((14)
TTotal impairment losses on advances ((12) 667 775 1130
$ millions BBanking Group
AAs at 30 June 2015Residential Mortgages Other Retail Corporate Total
CCollective provision
Balance at beginning of year 38 61 59 158
Charged to Income Statement 1 14 21 36
BBalance at end of year 39 75 80 194
IIndividually assessed provisions
Balance at beginning of year 11 2 27 40
Add/(less):
Charged to Income Statement:
New and increased provisions 19 3 18 40
Write-back of provisions no longer required (14) (1) (7) (22)
Write-offs against individually assessed provisions (6) (3) (13) (22)
BBalance at end of year 10 1 25 36
TTotal provisions for impairment losses 49 76 105 230
IImpairment losses on advances
Movement in collective provision 1 14 21 36
New and increased individually assessed provisions net of write-backs 5 2 11 18
Bad debts written off directly to the Income Statement 1 46 - 47
Recovery of amounts previously written off (2) (10) - (12)
TTotal impairment losses on advances 5 52 32 89
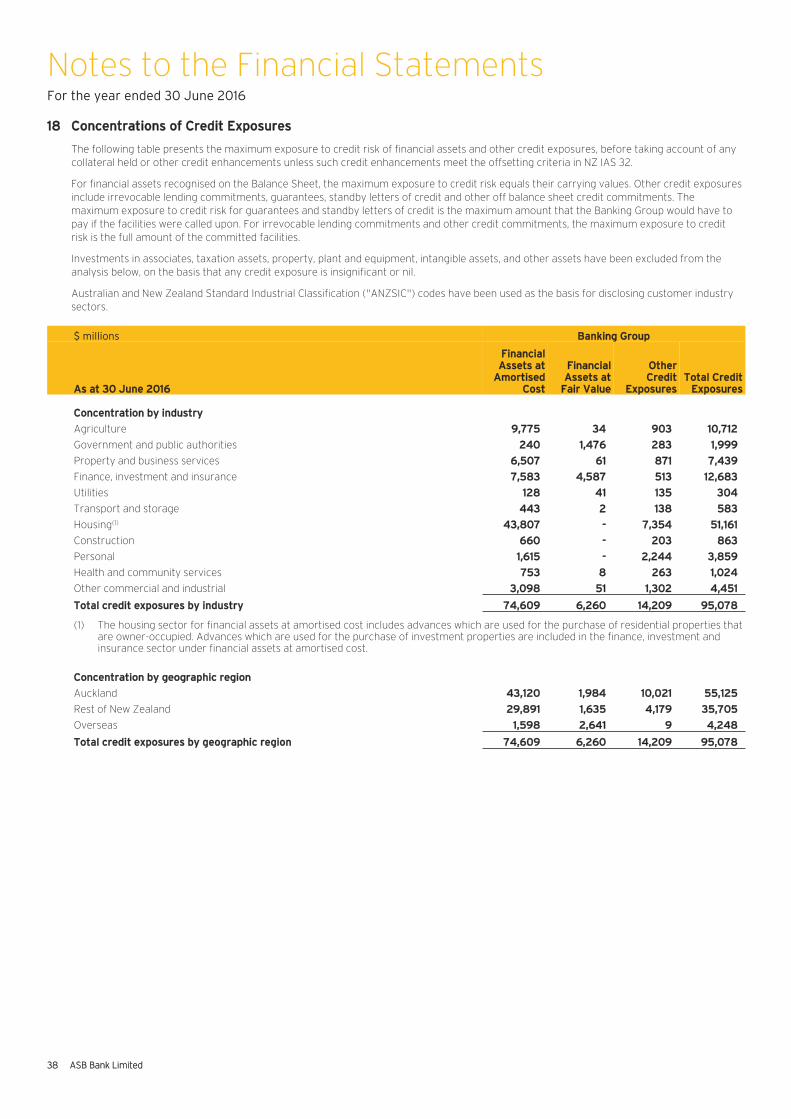
Notes to the Financial StatementsFor the year ended 30 June 2016
338 ASB Bank Limited
118 Concentrations of Credit Exposures
The following table presents the maximum exposure to credit risk of financial assets and other credit exposures, before taking account of any collateral held or other credit enhancements unless such credit enhancements meet the offsetting criteria in NZ IAS 32.
For financial assets recognised on the Balance Sheet, the maximum exposure to credit risk equals their carrying values. Other credit exposures include irrevocable lending commitments, guarantees, standby letters of credit and other off balance sheet credit commitments. The maximum exposure to credit risk for guarantees and standby letters of credit is the maximum amount that the Banking Group would have to pay if the facilities were called upon. For irrevocable lending commitments and other credit commitments, the maximum exposure to credit risk is the full amount of the committed facilities.
Investments in associates, taxation assets, property, plant and equipment, intangible assets, and other assets have been excluded from the analysis below, on the basis that any credit exposure is insignificant or nil.
Australian and New Zealand Standard Industrial Classification ("ANZSIC") codes have been used as the basis for disclosing customer industry sectors.
$ millions Banking Group
As at 30 June 2016
Financial Assets at
Amortised Cost
Financial Assets at
Fair Value
Other Credit
ExposuresTotal Credit
Exposures
Concentration by industry
Agriculture 9,775 34 903 10,712
Government and public authorities 240 1,476 283 1,999
Property and business services 6,507 61 871 7,439
Finance, investment and insurance 7,583 4,587 513 12,683
Utilities 128 41 135 304
Transport and storage 443 2 138 583
Housing(1) 43,807 - 7,354 51,161
Construction 660 - 203 863
Personal 1,615 - 2,244 3,859
Health and community services 753 8 263 1,024
Other commercial and industrial 3,098 51 1,302 4,451
Total credit exposures by industry 74,609 6,260 14,209 95,078
(1) The housing sector for financial assets at amortised cost includes advances which are used for the purchase of residential properties that are owner-occupied. Advances which are used for the purchase of investment properties are included in the finance, investment and insurance sector under financial assets at amortised cost.
Concentration by geographic region
Auckland 43,120 1,984 10,021 55,125
Rest of New Zealand 29,891 1,635 4,179 35,705
Overseas 1,598 2,641 9 4,248
Total credit exposures by geographic region 74,609 6,260 14,209 95,078
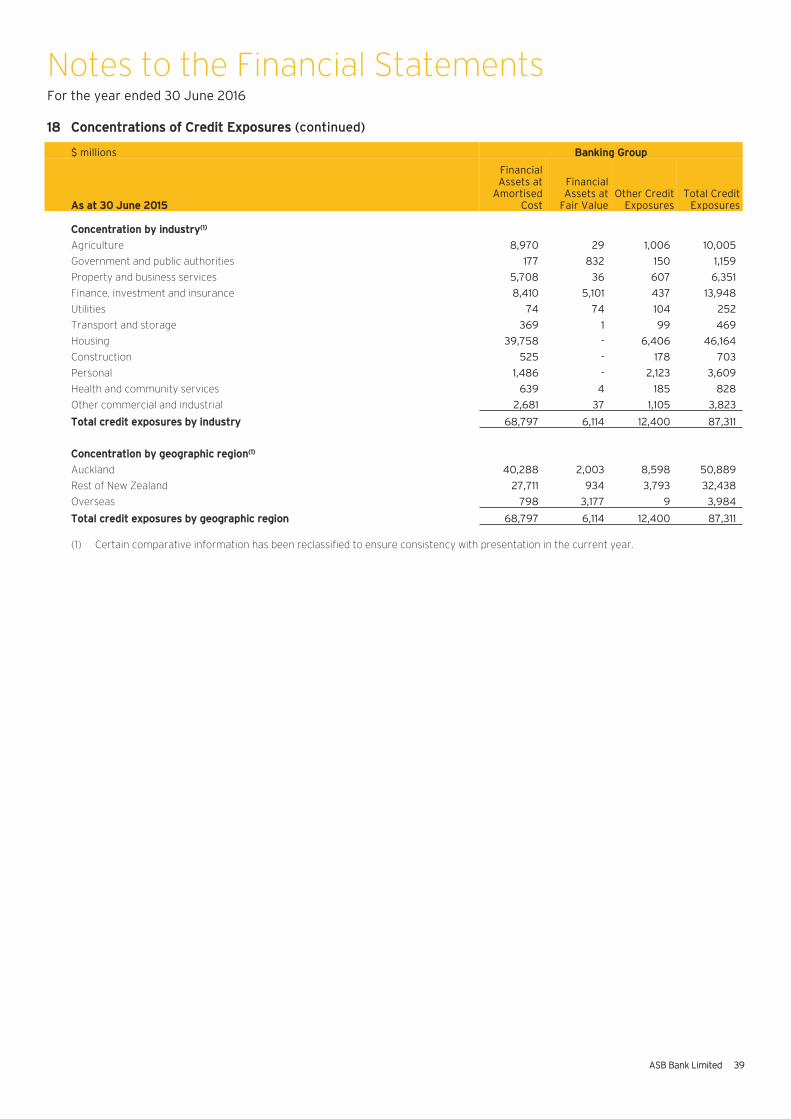
Notes to the Financial StatementsFor the year ended 30 June 2016
AASB Bank Limited 39
118 CConcentrations of Credit Exposures (continued)
$ millions BBanking Group
AAs at 30 June 2015
Financial Assets at
Amortised Cost
Financial Assets at
Fair ValueOther Credit
ExposuresTotal Credit
Exposures
CConcentration by industry(1)
Agriculture 8,970 29 1,006 10,005
Government and public authorities 177 832 150 1,159
Property and business services 5,708 36 607 6,351
Finance, investment and insurance 8,410 5,101 437 13,948
Utilities 74 74 104 252
Transport and storage 369 1 99 469
Housing 39,758 - 6,406 46,164
Construction 525 - 178 703
Personal 1,486 - 2,123 3,609
Health and community services 639 4 185 828
Other commercial and industrial 2,681 37 1,105 3,823
TTotal credit exposures by industry 68,797 6,114 12,400 87,311
CConcentration by geographic region(1)
Auckland 40,288 2,003 8,598 50,889
Rest of New Zealand 27,711 934 3,793 32,438
Overseas 798 3,177 9 3,984
TTotal credit exposures by geographic region 68,797 6,114 12,400 87,311
(1) Certain comparative information has been reclassified to ensure consistency with presentation in the current year.
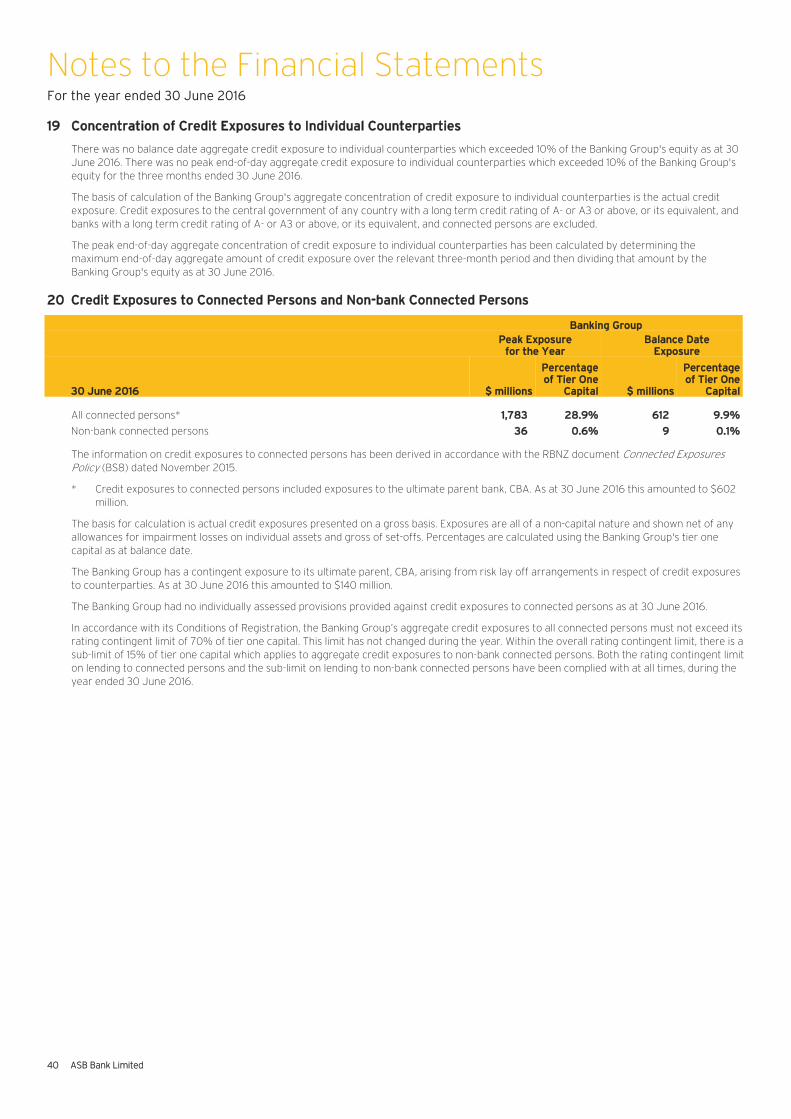
Notes to the Financial StatementsFor the year ended 30 June 2016
440 ASB Bank Limited
119 Concentration of Credit Exposures to Individual Counterparties
There was no balance date aggregate credit exposure to individual counterparties which exceeded 10% of the Banking Group's equity as at 30 June 2016. There was no peak end-of-day aggregate credit exposure to individual counterparties which exceeded 10% of the Banking Group's equity for the three months ended 30 June 2016.
The basis of calculation of the Banking Group's aggregate concentration of credit exposure to individual counterparties is the actual credit exposure. Credit exposures to the central government of any country with a long term credit rating of A- or A3 or above, or its equivalent, and banks with a long term credit rating of A- or A3 or above, or its equivalent, and connected persons are excluded.
The peak end-of-day aggregate concentration of credit exposure to individual counterparties has been calculated by determining the maximum end-of-day aggregate amount of credit exposure over the relevant three-month period and then dividing that amount by the Banking Group's equity as at 30 June 2016.
20 Credit Exposures to Connected Persons and Non-bank Connected Persons
Banking GroupPeak Exposure
for the YearBalance Date
Exposure
30 June 2016 $ millions
Percentage of Tier One
Capital $ millions
Percentage of Tier One
Capital
All connected persons* 1,783 28.9% 612 9.9%
Non-bank connected persons 36 0.6% 9 0.1%
The information on credit exposures to connected persons has been derived in accordance with the RBNZ document Connected Exposures Policy (BS8) dated November 2015.
* Credit exposures to connected persons included exposures to the ultimate parent bank, CBA. As at 30 June 2016 this amounted to $602 million.
The basis for calculation is actual credit exposures presented on a gross basis. Exposures are all of a non-capital nature and shown net of any allowances for impairment losses on individual assets and gross of set-offs. Percentages are calculated using the Banking Group's tier one capital as at balance date.
The Banking Group has a contingent exposure to its ultimate parent, CBA, arising from risk lay off arrangements in respect of credit exposures to counterparties. As at 30 June 2016 this amounted to $140 million.
The Banking Group had no individually assessed provisions provided against credit exposures to connected persons as at 30 June 2016.
In accordance with its Conditions of Registration, the Banking Group’s aggregate credit exposures to all connected persons must not exceed its rating contingent limit of 70% of tier one capital. This limit has not changed during the year. Within the overall rating contingent limit, there is a sub-limit of 15% of tier one capital which applies to aggregate credit exposures to non-bank connected persons. Both the rating contingent limit on lending to connected persons and the sub-limit on lending to non-bank connected persons have been complied with at all times, during the year ended 30 June 2016.

Notes to the Financial StatementsFor the year ended 30 June 2016
AASB Bank Limited 41
221 Maximum Exposure and Effect of Collateral and Other Credit Enhancements
Collateral and Credit Enhancements Held
The Banking Group has policies and procedures in place setting out the circumstances where acceptable and appropriate collateral is to be taken to mitigate credit risk, including valuation parameters.
The general nature and amount of collateral or other credit enhancements taken to mitigate the credit risk of each financial asset class are summarised below.
Cash and Liquid Assets
This Balance Sheet category includes reverse repurchase agreements which are fully collateralised by highly liquid debt securities which have been legally transferred to the Banking Group subject to an agreement to return them for a fixed price. As at 30 June 2016 the Banking Group had not sold securities accepted as collateral under reverse repurchase agreements (30 June 2015 $11m).
Cash and liquid assets include $736 million as at 30 June 2016 (30 June 2015 $1,259 million) deposited with the RBNZ.
Due from Financial Institutions
This balance is short term unsecured lending to other financial institutions. Collateral is not generally sought on these balances.
Trading Securities
These assets are measured at fair value which accounts for the credit risk. As at 30 June 2016 no collateral is held to mitigate the credit risk on these instruments (30 June 2015 nil) and none of these securities are backed by guarantees or other assets (30 June 2015 nil).
Derivative Assets
The Banking Group's use of derivative contracts is outlined in note 12. The Banking Group is exposed to credit risk on derivative contracts, which arises as a result of counterparty credit risk. The Banking Group’s exposure to counterparty credit risk is affected by the nature of the trades, the creditworthiness of the counterparty, netting, and collateral arrangements.
Credit risk from derivatives is mitigated where possible through master netting agreements whereby derivative assets and liabilities with the same counterparty can be offset. Banking Group policy requires all netting arrangements to be legally documented (e.g. International Swap and Derivatives Association ("ISDA") Master Agreement). A master netting agreement provides the contractual framework within which dealing activities across a range of over-the-counter products are conducted and contractually binds both parties to apply close-out netting across all outstanding transactions covered by an agreement if either party defaults or other predetermined events occur.
Depending on the creditworthiness of the counterparty and/or nature of the transaction collateral maybe obtained against derivative assets. Refer to note 12 for detail of collateral received.
Available-for-Sale Securities
These assets are measured at fair value which accounts for the credit risk. As at 30 June 2016 no collateral is held to mitigate the credit risk on these instruments (30 June 2015 nil) and $418 million of these securities are backed by guarantees (30 June 2015 $352 million).
Other Assets
This Balance Sheet category includes interest receivable accrued and other current assets. As at 30 June 2016 no collateral is held on these balances (30 June 2015 nil).
Advances to Customers
The Banking Group assesses the integrity and ability of debtors or counterparties to meet their contracted financial obligations for repayment.
Principal collateral types for advances to customers include:
● mortgages over residential and commercial real estate;
● charges over business assets such as premises, inventory and accounts receivables; and
● guarantees received from third parties.
Specifically, the collateral mitigating credit risk of the key lending portfolios is addressed in the notes and table below.
(i) Residential Mortgages
All home loans are secured by fixed charges over borrowers' residential properties.
(ii) Other Retail Lending
This category includes lending to small and medium sized enterprises where collateral is commonly held, generally in the form of residential property. In some instances other forms of collateral may be obtained, as listed under corporate lending below. Personal lending is considered unsecured for the purposes of this disclosure, although some personal lending may be secured by all obligations mortgages.

Notes to the Financial StatementsFor the year ended 30 June 2016
442 ASB Bank Limited
221 Maximum Exposure and Effect of Collateral and Other Credit Enhancements (continued)
Advances to Customers (continued)
(iii) Corporate Lending
The Banking Group’s main collateral types for corporate lending consists of secured rights over specified assets of the borrower in the form of: commercial property, land rights, cash (usually in the form of a charge over a deposit), guarantees by company directors supporting commercial lending, a charge over a company’s assets (including debtors, inventory and work in progress), or a charge over shares. In other instances, a client’s facilities may be secured by collateral with value less than carrying amount of credit exposure. These facilities are deemed secured, partially secured or unsecured.
$ millions Banking Group
Collateral Held on Advances to Customers - On Balance Sheet:Residential Mortgages Other Retail Corporate Total
As at 30 June 2016
Maximum Exposure 47,737 4,818 19,769 72,324
Collateral Classification
Secured(1) 99.9% 31.9% 63.3% 85.4%
Partially Secured(2) 0.1% 10.1% 26.8% 8.0%
Unsecured(3) - 58.0% 9.9% 6.6%
As at 30 June 2015
Maximum Exposure 43,666 4,609 17,267 65,542
Collateral Classification
Secured 99.9% 35.7% 65.6% 86.3%
Partially Secured 0.1% 10.3% 25.0% 7.4%
Unsecured - 54.0% 9.4% 6.3%
Credit Commitments and Contingent Liabilities
The Banking Group applies the same risk management policies for off balance sheet risks as it does for its on balance sheet risks. In the case of credit commitments, customers and other counterparties will be subject to the same credit management policies as loans and advances. Collateral may be sought depending on the strength of the counterparty and the nature of the transaction.
$ millions
Collateral Held on Credit Commitments - Off Balance Sheet: Banking Group
As at 30 June 2016
Maximum Exposure 14,209
Collateral Classification
Secured 64.1%
Partially Secured 4.3%
Unsecured 31.6%
As at 30 June 2015
Maximum Exposure 12,400
Collateral Classification
Secured 62.9%
Partially Secured 3.9%
Unsecured 33.2%
(1) Secured exposures are those that have ≥ 100% security cover after adjusting for collateral haircuts.(2) Partially secured exposures are those that have 40 - 99.9% security cover after adjusting for collateral haircuts.(3) Unsecured exposures are those that have < 40% security cover after adjusting for collateral haircuts.

Notes to the Financial StatementsFor the year ended 30 June 2016
AASB Bank Limited 43
222 Transferred Financial Assets
A financial asset is considered to be transferred if the contractual rights to receive the cash flows of the asset have been transferred, or there is an obligation to pay the cash flows to another party.
Transferred Financial Assets that are Not Derecognised in their Entirety
Residential Mortgage-Backed SecuritiesDuring the year ended 30 June 2009 the Banking Group established an in-house residential mortgage-backed securities ("RMBS") facility, which can issue securities that are acceptable as collateral for repurchase agreements with the RBNZ. As at 30 June 2016, Mortgage loans with a carrying value and fair value of $3.8 billion (30 June 2015 $3.8 billion), have been internally securitised through the Medallion NZ Series Trust 2009-1R. These mortgage loans (included within advances to customers), have not been derecognised from the Banking Group’s financial statements as the Banking Group retains substantially all the risks and rewards of ownership (funding, liquidity and credit risks remain with the Banking Group). As at 30 June 2016, the Medallion NZ Series Trust 2009-1R had other assets of $328 million representing cash from principal repayments (30 June 2015 $344 million).
Covered Bond ProgrammeAs noted in the General Disclosures, the Covered Bond Guarantor has guaranteed payments of interest and principal under the Covered Bonds pursuant to a guarantee which is secured over the mortgage loans, related security and other assets of the Covered Bond Trust. These mortgage loans (included within advances to customers) have not been derecognised from the Banking Group’s financial statements as the Banking Group retains substantially all the risks and rewards of ownership (funding, liquidity and credit risks remain with the Banking Group). As at 30 June 2016, the Covered Bond Trust held mortgage loans with a carrying value and fair value of $6.0 billion (30 June 2015 $3.6 billion), and other assets of $151 million representing cash from principal repayments (30 June 2015 $112 million).
Collateral Advanced Under repurchase agreements, collateral in the form of securities is advanced to a third party and the Banking Group receives cash in exchange. The counterparty is allowed to sell or repledge the collateral advanced under repurchase agreements in the absence of default by the Banking Group but has an obligation to return the collateral at the maturity of the contract. The Banking Group has determined that it retains substantially all the risks and rewards of these securities and therefore has not derecognised them (funding, liquidity and credit risks remain with the Banking Group). In addition, it recognises a financial liability for cash received which is included in deposits and other public borrowings.
As at 30 June 2016 the Banking Group had no collateral advanced under repurchase agreements (30 June 2015 nil).
Transferred Financial Assets that are Derecognised in their Entirety
As at 30 June 2016 the Banking Group has not derecognised in its entirety any financial assets where it has a continuing involvement (30 June 2015 nil).
23 Imputation Credit Account
Companies may attach imputation credits to dividends paid which represent the New Zealand tax already paid by the company or tax group on profits. New Zealand resident shareholders may claim a tax credit to the value of the imputation credit attached to dividends.
The Bank and some of its subsidiaries have formed an imputation group with other members of the Commonwealth Bank of Australia Group ("ICA Group"). The closing imputation credit account balances presented below represent the imputation credits available to all members of the ICA Group.
The amount of imputation credits available to all members of the ICA Group as at 30 June 2016 is $727 million (30 June 2015 $465 million). This amount includes imputation credits that will arise from the payment of the provision for income tax and from the receipt of dividends recognised as receivables as at the reporting date, and imputation debits that will arise from the payment of dividends recognised as payables as at the reporting date.

Notes to the Financial StatementsFor the year ended 30 June 2016
444 ASB Bank Limited
224 Controlled Entities and Associates
Summarised financial information for associates is not provided, as the amounts involved are immaterial.
Changes in Composition of the Banking Group
There were no changes to the composition of the Banking Group during the year.
Comparative Periods
ASB Smart Cards Limited and Kiwi Home Loans (NZ) Limited (both subsidiaries of the Bank) were removed from the New Zealand Companies Register on 20 October 2014 and 1 December 2014 respectively. These removals had no impact on the consolidated financial statements of the Banking Group.
Entity Name % Nature of Business Balance Date
Subsidiaries
Aegis Limited 100 Investment administration and custody 30 June
ASB Finance Limited 100 Finance 30 June
ASB Group Investments Limited 100 Investment administration and management 30 June
ASB Management Services Limited 100 Management, payment services and property investment 30 June
ASB Nominees Limited 100 Nominee company 30 June
ASB Securities Limited 100 Sharebroking 30 June
Bond Investments No 1 Limited 100 Finance 30 June
Bond Investments UK Limited 100 Finance 30 June
Investment Custodial Services Limited 100 Investment custodian 30 June
Mortgage Holding Trust Company Limited 100 Nominee company 30 June
Securitisation Management Services Limited 100 Securitisation management 30 June
All subsidiaries were incorporated in New Zealand.
Other Controlled Entities
ASB Cash Fund - Portfolio investment entity 30 June
ASB Term Fund - Portfolio investment entity 30 June
Medallion NZ Series Trust 2009-1R - Securitisation entity 30 June
ASB Covered Bond Trust - Guarantor 30 June
Associates
Cards NZ Limited 19 Financial services 30 September
Paymark Limited 25 EFTPOS settlements 31 March
Payments NZ Limited 19 Payment systems 31 March

Notes to the Financial StatementsFor the year ended 30 June 2016
AASB Bank Limited 45
225 OOther Assets
$ millions Banking Group
AAs at 30 June 22016 2015
Interest receivable accrued 1167 177
Other assets 662 355
TTotal other assets 2229 532
Amounts due for settlement within 12 months 2217 518
Amounts due for settlement over 12 months 112 14
TTotal other assets 2229 532
26 Goodwill
Goodwill of $48 million arose from the purchase of Aegis Limited and ASB Group Investments Limited from fellow subsidiaries of CBA on 1 July 2008. During the year ended 30 June 2016 the Banking Group did not identify any events or circumstances that would indicate that goodwill may be impaired (30 June 2015 none).
Impairment Tests for Goodwill
Goodwill was tested for impairment as at 30 June 2016. Goodwill of $38 million was allocated to Aegis Limited and $10 million was allocated to ASB Group Investments Limited. Both of these subsidiaries are considered to be cash-generating units for the purpose of impairment testing. The operations of the subsidiaries are included within the Wealth and Insurance segment for segment reporting. To assess whether goodwill is impaired, the carrying amount of each cash-generating unit is compared to the recoverable amount, determined based on its value in use.
No impairment losses were recognised against the carrying amount of goodwill for the year ended 30 June 2016 (30 June 2015 nil).
Key Assumptions used in Value in Use Calculations
As at 30 June 2016, value in use for each cash-generating unit was determined by discounting the future cash flows expected to be generated from the continuing use of the unit, based on the following assumptions:
● Cash flows were projected based on management's assessment of product profitability, and forecasted growth in revenues and expenses to support the business covering a three-year period. Cash flows beyond three years were extrapolated based on a view of inflation of 1% (30 June 2015 1%).
● A post-tax discount rate of 11% was applied in determining the recoverable amounts of the cash generating units, in line with the rate used internally by the Banking Group to assess business cases for new products or projects (30 June 2015 12%).
The key assumptions described above may change as economic and market conditions change. The Banking Group estimates that reasonably possible changes in these assumptions are not expected to cause the recoverable amount of either unit to decline significantly below the carrying amount of their allocated goodwill.

Notes to the Financial StatementsFor the year ended 30 June 2016
446 ASB Bank Limited
227 DDeferred Taxation Asset
$ millions Banking Group
AAs at 30 June 22016 2015
Balance at beginning of year 1107 61
Recognised in the Income Statement 227 11
Recognised in other comprehensive income 112 35
BBalance at end of year 1146 107
DDeferred taxation relates to:
Asset revaluation reserve ((5) (5)
Available-for-sale reserve 33 (3)
Cash flow hedge reserve 440 34
Holiday pay 111 10
Provision for impairment losses 883 64
Other temporary differences 114 7
TTotal deferred taxation asset 1146 107
DDeferred taxation recognised in the Income Statement:
Depreciation -- 4
Holiday pay 11 (1)
Provision for impairment losses 119 9
Other temporary differences 77 (1)
TTotal deferred taxation recognised in the Income Statement 227 11
DDeferred taxation recognised in other comprehensive income:
Asset revaluation reserve -- 1
Available-for-sale reserve 66 2
Cash flow hedge reserve 66 32
TTotal deferred taxation recognised in other comprehensive income 112 35
As at 30 June 2016 deferred taxation of $76 million is expected to crystallise after more than 12 months (30 June 2015 $56 million).
28 Deposits and Other Public Borrowings
$ millions Banking Group
As at 30 June 2016 2015
Certificates of deposit 2,910 2,101
Term deposits 23,122 24,253
On demand and short term deposits 25,167 22,885
Deposits not bearing interest 3,503 2,924
Total deposits and other public borrowings 54,702 52,163
Amounts due for settlement within 12 months 51,865 49,074
Amounts due for settlement over 12 months 2,837 3,089
Total deposits and other public borrowings 54,702 52,163
Deposits and other public borrowings are unsecured and rank equally with other unsecured liabilities of the Banking Group. In the unlikely event that the Bank was put into liquidation or ceased to trade, secured creditors and those creditors set out in the Seventh Schedule of the Companies Act 1993 would rank ahead of the claims of unsecured creditors.

Notes to the Financial StatementsFor the year ended 30 June 2016
AASB Bank Limited 47
229 OOther Liabilities
$ millions Banking Group
AAs at 30 June 22016 2015
Interest payable accrued 2265 330
Employee entitlements 1129 116
Trade accounts payable and other liabilities 1153 140
TTotal other liabilities 5547 586
Amounts due for settlement within 12 months 5541 576
Amounts due for settlement over 12 months 66 10
TTotal other liabilities 5547 586
30 Due to Financial Institutions
As at 30 June 2016 amounts due to financial institutions of $580 million are due for settlement within 12 months of balance date (30 June 2015 $3,523 million due within 12 months of balance date).
31 Other Liabilities at Fair Value through Income Statement
$ millions Banking Group
As at 30 June 2016 2015
Certificates of deposit 1,340 169
Trading liabilities - 11
Total other liabilities at fair value through Income Statement 1,340 180
As at 30 June 2016 other liabilities at fair value through Income Statement are due for settlement within 12 months of balance date (30 June 2015 within 12 months of balance date).
For the year ended 30 June 2016 no loss was attributable to changes in credit risk for other liabilities at fair value through Income Statement (30 June 2015 nil). All other changes in fair value are attributable to changes in the benchmark interest rate.

Notes to the Financial StatementsFor the year ended 30 June 2016
448 ASB Bank Limited
332 DDebt Issues
$ millions Banking Group
AAs at 30 June 22016 2015
DDebt issues by programme
Euro commercial paper 3308 113
USD commercial paper 33,356 2,456
Euro medium term notes 44,033 3,893
NZD domestic bonds 44,182 3,299
Covered bonds 33,198 2,528
TTotal debt issues 115,077 12,289
SShort term debt issues by currency
USD 33,455 2,456
GBP 1179 104
CAD -- 9
CHF 330 -
LLong term debt issues with less than one year to maturity
USD -- 15
AUD -- 6
GBP 5567 691
JPY -- 60
NZD 7787 191
HKD 1155 21
CHF 2217 158
TTotal short term debt issues (amounts due for settlement within 12 months) 55,390 3,711
LLong term debt issues by currency
USD 4486 -
GBP 6614 1,383
JPY 998 -
EUR 33,678 2,186
NZD 33,907 3,612
HKD -- 161
CHF 9904 1,236
TTotal long term debt issues (amounts due for settlement over 12 months) 99,687 8,578
TTotal debt issues 115,077 12,289
Debt issues at fair value through Income Statement 11,646 1,213
Debt issues at amortised cost 113,431 11,076
TTotal debt issues 115,077 12,289
Fair value hedge adjustments included in total debt issues 1149 138
Short Term Debt
The Banking Group's short term borrowings include a Euro Commercial Paper ("ECP") programme under which it may issue commercial paper ("CP") in multiple currencies up to an aggregate of USD7 billion, and a USD CP ("USCP") programme under which it may issue CP in USD up to an aggregate of USD7 billion. CP is issued under these programmes at both fixed and variable interest rates. Interest rate and foreign currency risks associated with the issuances are incorporated within the Banking Group's risk management framework.
The weighted average interest rate on balances outstanding as at 30 June 2016 was 0.61% for CP issued under the ECP programme (30 June 2015 0.56%) and 0.85% for CP issued under the USCP programme (30 June 2015 0.29%).

Notes to the Financial StatementsFor the year ended 30 June 2016
AASB Bank Limited 49
332 Debt Issues (continued)
Long Term Debt
The Banking Group's long term borrowings include notes issued under a joint Euro Medium Term Note ("EMTN") programme with CBA, the ultimate parent of the Bank. The joint programme limit is USD70 billion. These issuances occur in multiple currencies. Notes issued under this programme have both fixed and variable interest rates.
The Banking Group’s long term borrowings also include bonds issued under a Covered Bond programme. The Bank or its subsidiary ASB Finance Limited (acting through its London branch) may issue notes up to a programme limit of EUR7 billion, subject to the regulatory constraint that the assets of the Covered Bond Trust may not exceed 10% of the Banking Group’s total assets. The issuances may occur in multiple currencies. Covered Bonds issued under this programme may have both fixed and variable interest rates. These bonds are guaranteed by the Covered Bond Guarantor. Refer to the General Disclosures for further information.
The Banking Group's long term borrowings also include domestic bonds issued into the New Zealand market. The issuances occur in NZD and have both fixed and variable interest rates.
Interest rate and foreign currency risks associated with both short term and long term debt issuances are incorporated within the Banking Group's risk management framework.
The Banking Group has not had any defaults of principal, interest or other breaches with regard to all liabilities during the year ended 30 June 2016 (30 June 2015 nil).
33 Loan Capital
On 17 April 2014, the Bank issued subordinated and unsecured debt securities (“Notes”) with a face value of $400 million. The Notes meet the criteria for tier 2 capital designation under the Bank’s and CBA’s regulatory capital requirements and are classified as financial liabilities under NZ IAS 32. The Notes will mature on 15 June 2024 but subject to certain conditions, the Bank has the right to redeem all or some of the Notes on any interest payment date on or after 15 June 2019 (call option date). At any time, the Bank may redeem all the Notes for tax or regulatory reasons. The Notes bear an interest rate of 6.65% which is fixed for five years and will be reset if the Notes are not redeemed on or before the call option date. Payment of interest is quarterly in arrears and is subject to the Bank remaining solvent and the Banking Group being solvent immediately after such payment is made.
If a non-viability trigger event (“NVTE”) occurs, some or all of the Notes will automatically and immediately be exchanged for CBA ordinary shares. A NVTE occurs when, among other circumstances:
• the RBNZ has reasonable grounds to believe that the Bank is insolvent or likely to become insolvent and directs the Bank to convert or write down a class of capital instruments that includes Notes of a specified aggregate amount; or
• APRA notifies CBA that it believes an exchange of some or all Notes is necessary because without it CBA would become non-viable.
If the Notes are not able to be exchanged, or the exchange is not effective, within five business days, the rights of the holders will be terminated.
In conjunction with the issuance of the Notes, the Bank also entered into a related agreement with ASB Holdings Limited and CBA on 13 March 2014. This related agreement includes a requirement for the Bank to issue to ASB Holdings Limited, upon the occurrence of a NVTE, a variable number of shares, for a consideration equivalent to the Notes exchanged into CBA shares.

Notes to the Financial StatementsFor the year ended 30 June 2016
550 ASB Bank Limited
334 CContributed Capital
$ millions Banking Group
AAs at 30 June 22016 2015
IIssued and fully paid ordinary share capital
Balance at beginning of year 22,273 2,273
Share capital issued 4400 -
BBalance at end of year 22,673 2,273
IIssued and fully paid perpetual preference share capital
Balance at beginning of year 11,150 550
Share capital issued 4400 600
BBalance at end of year 11,550 1,150
TTotal contributed capital 44,223 3,423
All contributed capital is included in tier one capital for capital adequacy calculation purposes. Refer to note 42 for more information on regulatory capital.
Ordinary Shares
On 30 March 2016, the Bank issued 400,000,000 ordinary shares to ASB Holdings Limited and raised $400 million from the issuance. The ordinary shares qualify as common equity tier one capital under the RBNZ’s regulatory capital standards.
The total number of issued ordinary shares as at 30 June 2016 was 2,648,121,300 (30 June 2015 2,248,121,300). All ordinary shares have equal voting rights and share equally in dividends and any profit on winding up, after the obligations to holders of ASB perpetual preference shares ("PPS") are satisfied. Dividends are declared, subject in all cases, to the applicable directors' resolutions being passed.
Perpetual Preference Shares
a) On 16 March 2015, the Bank issued 6,000,000 PPS to ASB Holdings Limited and raised $600 million from the issuance. On 31 March 2016, the Bank issued a further 4,000,000 PPS to ASB Holdings Limited and raised $400 million from the issuance. Both PPS issuances qualify as additional tier one capital under the RBNZ’s regulatory capital standards.
The PPS are non-voting and pay discretionary quarterly floating rate dividends. Upon a winding-up, the PPS rank equally with the Bank’s other preference shares, above its ordinary shares and below its liabilities. At the option of the Bank, the 6,000,000 and 4,000,000 PPS are redeemable on the initial optional redemption dates of 16 March 2020 and 15 June 2021 respectively or on any subsequent scheduled distribution date, subject to RBNZ approval.
If a non-viability trigger event (“NVTE”) occurs, the PPS will be exchanged into a fixed number of ordinary shares of the Bank. A NVTE occurs at the direction of the RBNZ or a statutory manager of the Bank. A NVTE occurs when, among other circumstances, the RBNZ has reasonable grounds to believe that the Bank is insolvent or likely to become insolvent and directs the Bank to exchange the PPS for ordinary shares. If for any reason the exchange for ordinary shares cannot occur, the PPS will be immediately and irrevocably written down, in accordance with the PPS terms.
b) On 15 May 2006 the Bank issued 200,000,000 of 2006 Series 1 PPS and 350,000,000 of 2006 Series 2 PPS to ASB Holdings Limited. ASB Holdings Limited subsequently transferred the PPS by way of novation to its subsidiary ASB Funding Limited.
The 2006 Series 1 and Series 2 PPS were issued as part of transactions with ASB Capital Limited and ASB Capital No. 2 Limited, both of which are subsidiaries of CBA Funding (NZ) Limited, which is ultimately owned by CBA.
Under the transactions, ASB Capital Limited and ASB Capital No. 2 Limited have advanced proceeds received from a public issue of their own PPS to ASB Funding Limited. ASB Funding Limited in turn invested the proceeds in the 2006 Series 1 and Series 2 PPS issued by the Bank. ASB Funding Limited and The New Zealand Guardian Trust Company Limited (the "Trustee") together with ASB Capital Limited and ASB Capital No. 2 Limited respectively are party to Trust Deeds, whereby ASB Funding Limited provides covenants to the Trustee for the benefit of holders of the ASB Capital Limited and ASB Capital No. 2 Limited PPS and grants security over the Bank’s PPS in favour of the Trustee.
The 2006 Series 1 and Series 2 PPS are non-redeemable and carry limited voting rights. Dividends are payable quarterly in arrears, are non-cumulative and payable at the discretion of the Directors.
The dividend payable on the 2006 Series 1 PPS is based on the one year swap rate plus a margin of 1.3%. Rates are reset annually on 15 November or the succeeding business day. The rate was reset on 16 November 2015 to 4.00% per annum (the rate to 16 November 2015 was 5.04% per annum). The next dividend reset date is 15 November 2016.
The dividend payable on the 2006 Series 2 PPS is based on the one year swap rate plus a margin of 1.0%. Rates are reset annually on 15 May or the succeeding business day. The rate was reset on 16 May 2016 to 3.20% per annum (the rate to 16 May 2016 was 4.34% per annum). The next dividend reset date is 15 May 2017.
In the event of the liquidation of the Bank, payment of the issue price and cumulative dividends on the PPS ranks:● before all rights of ordinary shareholders;● after all rights of holders of shares of the Bank other than ordinary or preference shares; and● after all rights of creditors of the Bank.
The total number of issued PPS as at 30 June 2016 was 560,000,000 (30 June 2015 556,000,000).
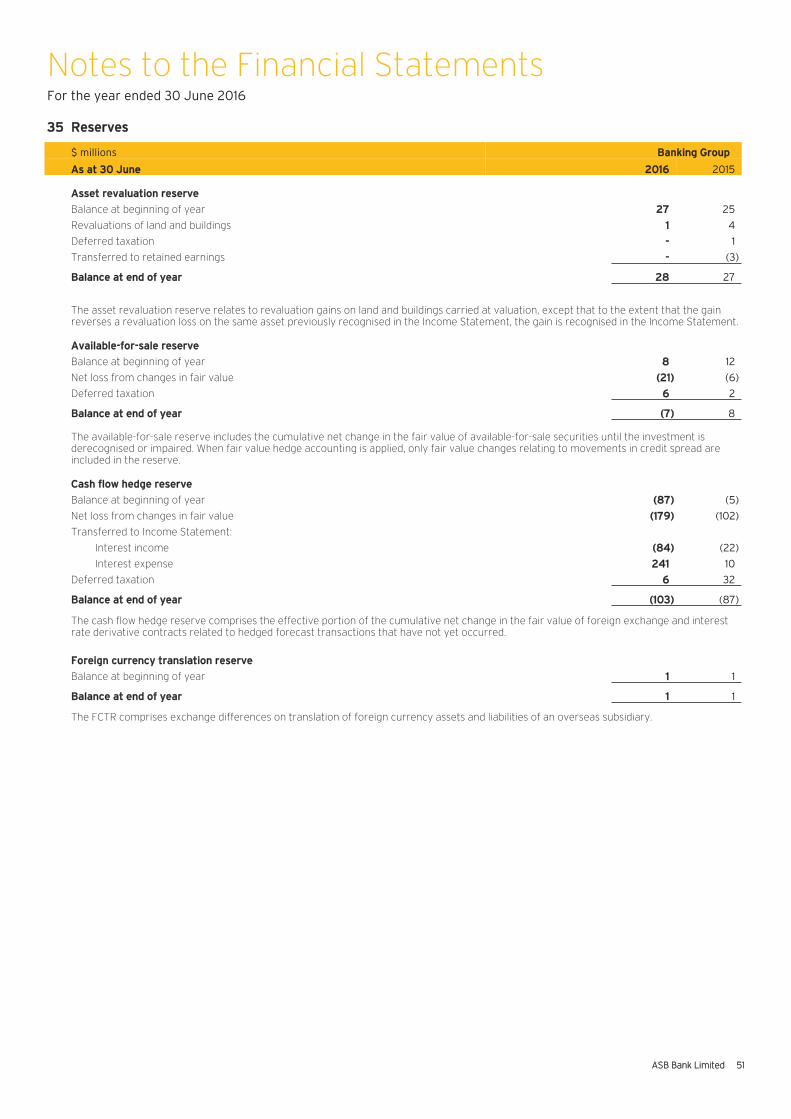
Notes to the Financial StatementsFor the year ended 30 June 2016
AASB Bank Limited 51
335 RReserves
$ millions Banking Group
AAs at 30 June 22016 2015
AAsset revaluation reserve
Balance at beginning of year 227 25
Revaluations of land and buildings 11 4
Deferred taxation -- 1
Transferred to retained earnings -- (3)
BBalance at end of year 228 27
The asset revaluation reserve relates to revaluation gains on land and buildings carried at valuation, except that to the extent that the gain reverses a revaluation loss on the same asset previously recognised in the Income Statement, the gain is recognised in the Income Statement.
AAvailable-for-sale reserve
Balance at beginning of year 88 12
Net loss from changes in fair value ((21) (6)
Deferred taxation 66 2
BBalance at end of year ((7) 8
The available-for-sale reserve includes the cumulative net change in the fair value of available-for-sale securities until the investment is derecognised or impaired. When fair value hedge accounting is applied, only fair value changes relating to movements in credit spread are included in the reserve.
CCash flow hedge reserve
Balance at beginning of year ((87) (5)
Net loss from changes in fair value ((179) (102)
Transferred to Income Statement:
Interest income ((84) (22)
Interest expense 2241 10
Deferred taxation 66 32
BBalance at end of year ((103) (87)
The cash flow hedge reserve comprises the effective portion of the cumulative net change in the fair value of foreign exchange and interest rate derivative contracts related to hedged forecast transactions that have not yet occurred.
FForeign currency translation reserve
Balance at beginning of year 11 1
BBalance at end of year 11 1
The FCTR comprises exchange differences on translation of foreign currency assets and liabilities of an overseas subsidiary.

Notes to the Financial StatementsFor the year ended 30 June 2016
552 ASB Bank Limited
336 LLeasing and Other Commitments
$ millions Banking Group
AAs at 30 June 22016 2015
LLeasing commitments
The following non-cancellable operating lease commitments existed as at the end of the financial year:
Within one year 553 54
Between one and two years 447 48
Between two and five years 1113 119
Over five years 2215 225
TTotal leasing commitments 4428 446
OOther commitments 119 14
The Banking Group leases various premises under non-cancellable operating lease agreements. The leases have varying terms and renewal rights. The Banking Group also leases motor vehicles and certain office equipment. Lease expenditure is charged to the Income Statement (refer to note 5).
In February 2010, the Bank entered into an agreement to lease new head office premises for a term of 18 years. The initial lease term is 18 years, commencing 1 July 2013, with a 2.5% fixed annual increase per annum. Subsequent to the initial lease term, the Bank has the right of renewal for two subsequent six year terms, subject to a market review of the lease rate for each renewal period.
The Banking Group has entered into certain sub-leasing arrangements. Sub-leasing income of $1 million for the year ended year ended 30 June 2016 (30 June 2015 $1 million) was included in the Banking Group’s Income Statement.
37 Credit and Capital Commitments, and Contingent Liabilities
$ millions Banking GroupNotional Amount
As at 30 June 2016 2015
Credit and capital commitments
Lending commitments approved but not yet advanced (1) 13,801 12,067
Capital expenditure commitments 7 5
Total credit and capital commitments 13,808 12,072
Contingent liabilities
Guarantees 146 124
Standby letters of credit 112 123
Other credit facilities 150 86
Total 408 333
(1) These amounts include irrevocable lending commitments determined in accordance with accounting standards.
The notional amount represents the maximum potential amount that could be lost if a counterparty fails to meet its financial obligations.
The Banking Group has other contingent liabilities in respect of actual and potential claims and proceedings. An assessment of the Banking Group's likely loss in respect of these matters has been made on a case-by-case basis and provision made in the financial statements where required by NZ GAAP. Information relating to any provision or contingent liability is not disclosed where it can be expected to prejudice seriously the position of the Banking Group.
In June 2013 a group comprising lawyers Andrew Hooker, Slater & Gordon and Litigation Lending Services (NZ) Limited announced that it had issued proceedings against ANZ Bank in relation to exception fees. The group has announced that similar proceedings have been or will be issued against other banks, including ASB. At the date of this Disclosure Statement, no such proceedings have been issued against ASB. If proceedings are issued against ASB, any impact will be assessed at that time.

Notes to the Financial StatementsFor the year ended 30 June 2016
AASB Bank Limited 53
338 Related Party Transactions and Balances
The Bank is wholly owned by ASB Holdings Limited, a company incorporated in New Zealand. The ultimate parent bank is CBA. The Commonwealth Bank Group refers to CBA and the various companies and other entities owned and controlled by CBA. The Commonwealth Bank of Australia New Zealand Life Insurance Group ("NZ Life Group") includes ASB Group (Life) Limited group of companies, First State Investments (NZ) Limited and up until 7 June 2016, Colonial First State Investments (NZ) Limited group of companies.
Certain superannuation schemes and unit trusts are managed by ASB Group Investments Limited, a wholly owned subsidiary of the Bank. The NZ Life Group similarly administers and manages certain superannuation schemes and unit trusts. Related party transactions and balances between these schemes and trusts, and the Banking Group are disclosed below.
During the year ended 30 June 2016 the Banking Group has entered into, or had in place various financial transactions with members of the Commonwealth Bank Group, and other related parties. The Bank provides administrative functions to certain subsidiaries and related companies for which no payments have been made. In all other cases, arrangements with related parties were conducted on an arm's length basis and on normal commercial terms, and within the Bank's approved policies. Loans to and borrowings from related parties are unsecured.
$ millions Banking Group
For the year ended 30 June 2016 2015
Related Party Transactions
Interest income
Received from Commonwealth Bank Group 9 6
9 6
Interest expense
Paid to Commonwealth Bank Group 98 158
Paid to NZ Life Group 7 9
Paid to ASB Holdings Limited - 2
Paid to superannuation schemes and unit trusts managed by ASB Group Investments Limited 15 15
120 184
Other income
Received from NZ Life Group for administrative services 12 11
Received from NZ Life Group for insurance commission 39 35 Management and administration fees received from superannuation schemes and unit trusts managed by ASB Group Investments Limited 61 53
112 99
Other expenses
Paid to NZ Life Group for the origination of mortgages 2 2
Paid to NZ Life Group for investment management services 1 2
3 4
Related Party Balances
Commonwealth Bank Group
Cash and liquid assets 194 79
Due from financial institutions 235 162
Derivative assets: Interest rate contracts 156 115
Exchange rate contracts 17 180
Other assets - 2
602 538
Deposits and other public borrowings 80 138
Due to financial institutions 128 2,519
Debt issues at amortised cost 800 800
Derivative liabilities: Interest rate contracts 173 121
Exchange rate contracts 143 48
Commodity contracts - 2
Other liabilities 1 13
1,325 3,641

Notes to the Financial StatementsFor the year ended 30 June 2016
554 ASB Bank Limited
338 RRelated Party Transactions and Balances (continued)
$ millions Banking Group
FFor the year ended 30 June 22016 2015
RRelated Party Balances (continued)
NNZ Life Group
Derivative assets: Exchange rate contracts 11 33
Other assets 66 9
77 42
Deposits and other public borrowings 2231 305
Derivative liabilities: Exchange rate contracts 229 1
Other liabilities 11 1
2261 307
SSuperannuation schemes and unit trusts managed by ASB Group Investments Limited
Derivative assets: Exchange rate contracts -- 13
Deposits and other public borrowings 5557 467
Debt issues at amortised cost 999 68
6656 535
SSuperannuation schemes and unit trusts managed or administered by NZ Life Group
Derivative assets: Exchange rate contracts -- 1
Deposits and other public borrowings 33 3
Derivative liabilities: Exchange rate contracts 11 -
44 3
AASB Holdings Limited
Other assets -- 3
Deposits and other public borrowings 330 12
TTotal related party assets 6609 597
TTotal related party liabilities 22,276 4,498
Other Transactions and Balances
Commonwealth Bank Group provides guarantees over certain lending offered by the Bank to the value of $140 million (30 June 2015 $151 million).
Net receipts of $49 million were received by the Banking Group from related parties, relating to the utilisation of tax-related items (30 June 2015: net receipts of $42 million).
No provisions for impairment loss have been recognised in respect of loans given to related parties (30 June 2015 nil).
Refer to note 8 for details of dividends paid to shareholders.
Refer to note 34 for details of shares issued to and repurchased from related parties.
Refer to note 43 for further information on funds managed by ASB Group Investments Limited.

Notes to the Financial StatementsFor the year ended 30 June 2016
AASB Bank Limited 55
339 KKey Management Personnel
The executive management and Directors of the Bank are considered to be key management personnel. Their details are set out in the Directory.
$ millions Banking Group
FFor the year ended 30 June 22016 2015
KKey management compensation
Short term employee benefits 114 13
Other long term benefits 11 2
TTotal key management compensation 115 15
$ millions Banking Group
AAs at 30 June 22016 2015
Loans to key management personnel 55 9
Deposits from key management personnel 113 6
Loans made to and deposits held by key management personnel were made in the ordinary course of business on normal commercial terms and conditions, no more favourable than those given to other employees of the Banking Group. Deposits consist of on call, savings, cheque, term investments and cash management balances.
No provisions have been recognised in respect of loans provided to key management personnel. There were no debts written off or forgiven during the year ended 30 June 2016 (30 June 2015 nil).
Interest is received on loans and paid on deposits at market rates. These amounts are not reported due to rounding to the nearest million (30 June 2015 nil).

Notes to the Financial StatementsFor the year ended 30 June 2016
556 ASB Bank Limited
440 Fair Value of Financial Instruments
The Banking Group’s financial assets and financial liabilities are measured on an on-going basis either at fair value or amortised cost.
The fair value of a financial instrument is the price that would be received to sell a financial asset, or paid to transfer a financial liability, in an orderly transaction between market participants at the measurement date.
A significant number of financial instruments are carried on the Balance Sheet at fair value. The best evidence of fair value is a quoted market price in an active market. Therefore, where possible, fair value is based on quoted market prices. Where a quoted market price for a financial instrument is not available, its fair value is based on present value estimates or other valuation techniques based on current market conditions. These valuation techniques rely on market observable inputs wherever possible, or in a limited number of instances, rely on inputs which are unobservable but are reasonable assumptions based on market conditions.
There are three levels in the hierarchy of fair value measurements which are based on the inputs used to measure fair values:
● Level 1: inputs are quoted prices (unadjusted) in active markets for identical financial assets or financial liabilities that the Banking Group can access.
● Level 2: where quoted market prices are not available, fair values have been estimated using present value or other valuation techniques using inputs that are observable for the financial asset or financial liability, either directly or indirectly.
● Level 3: fair values are estimated using inputs that are unobservable for the financial asset or financial liability.
The Banking Group considers transfers between levels, if any, to have occurred at the end of the reporting period for which the financial statements are prepared.
(a) Fair Value Hierarchy of Financial Instruments Measured at Fair Value
The following tables present an analysis by level in the fair value hierarchy of financial instruments that are recognised and measured at fair value on a recurring basis.
$ millions Banking Group
As at 30 June 2016 Level 1 Level 2 Level 3 Total
Financial assets
Trading securities 175 617 - 792
Derivative assets - 1,451 - 1,451
Available-for-sale securities 2,665 1,352 - 4,017
Total financial assets measured at fair value 2,840 3,420 - 6,260
Financial liabilities
Other liabilities at fair value through Income Statement - 1,340 - 1,340
Derivative liabilities - 2,085 - 2,085
Debt issues at fair value through Income Statement - 1,646 - 1,646
Total financial liabilities measured at fair value - 5,071 - 5,071
There were no transfers between levels for recurring fair value measurements on 30 June 2016.
$ millions Banking Group
As at 30 June 2015 Level 1 Level 2 Level 3 Total
Financial assets
Trading securities 456 515 - 971
Derivative assets - 2,102 - 2,102
Available-for-sale securities 1,672 1,369 - 3,041
Total financial assets measured at fair value 2,128 3,986 - 6,114
Financial liabilities
Other liabilities at fair value through Income Statement 11 169 - 180
Derivative liabilities - 1,364 - 1,364
Debt issues at fair value through Income Statement - 1,213 - 1,213
Total financial liabilities measured at fair value 11 2,746 - 2,757
On 30 June 2015, $1,486 million of Kauri bonds classified as trading securities and available-for-sale securities were transferred from level 2 to level 1 on the basis that their fair values were determined using quoted prices in an active market.

Notes to the Financial StatementsFor the year ended 30 June 2016
AASB Bank Limited 57
440 Fair Value of Financial Instruments (continued)
(b) Fair Value Hierarchy of Financial Instruments Not Measured at Fair Value
The following tables compare the carrying values of financial instruments not measured at fair value with their estimated fair values and analyses them by level in the fair value hierarchy.
$ millions Banking Group
Fair ValuesCarrying
Value
As at 30 June 2016 Level 1 Level 2 Level 3 Total Total
Financial assets
Cash and liquid assets 948 455 - 1,403 1,403
Due from financial institutions - 1,131 - 1,131 1,131
Advances to customers - - 72,098 72,098 72,075
Other assets - 210 - 210 210
Total 948 1,796 72,098 74,842 74,819
Financial liabilities
Deposits and other public borrowings - 54,826 - 54,826 54,702
Due to financial institutions - 580 - 580 580
Other liabilities - 547 - 547 547
Debt issues at amortised cost - 13,443 - 13,443 13,431
Loan capital - 420 - 420 423
Total - 69,816 - 69,816 69,683
$ millions Banking Group
Fair ValuesCarrying
Value
As at 30 June 2015 Level 1 Level 2 Level 3 Total Total
Financial assets
Cash and liquid assets 1,413 386 - 1,799 1,799
Due from financial institutions - 1,615 - 1,615 1,615
Advances to customers - - 65,357 65,357 65,383
Other assets - 513 - 513 513
Total 1,413 2,514 65,357 69,284 69,310
Financial liabilities
Deposits and other public borrowings - 52,292 - 52,292 52,163
Due to financial institutions - 3,522 - 3,522 3,523
Other liabilities - 586 - 586 586
Debt issues at amortised cost - 11,107 - 11,107 11,076
Loan capital - 424 - 424 414
Total - 67,931 - 67,931 67,762

Notes to the Financial StatementsFor the year ended 30 June 2016
558 ASB Bank Limited
441 Offsetting Financial Assets and Financial Liabilities
Under NZ IAS 32, financial assets and financial liabilities may be offset on the Balance Sheet only when there is a currently enforceable legal right to offset the respective recognised amounts and an intention to either settle on a net basis, or to realise the asset and settle the liability simultaneously. The right to offset is a legal right to settle or otherwise eliminate all or a portion of an amount due by applying an amount receivable, generally from the same counterparty, against it.
The Banking Group enters into netting agreements with counterparties to manage the credit risks associated primarily with over-the-counter derivatives, repurchase and reverse repurchase transactions, securities borrowing and lending transactions. These netting agreements and similar arrangements enable the counterparties to offset liabilities against assets if an event of default or other predetermined event occurs, however they generally do not result in net settlement in the ordinary course of business. Consequently, the Banking Group does not offset its financial assets and liabilities on the Balance Sheet, even if these amounts are subject to enforceable netting arrangements.
The following table identifies the amounts that are covered by enforceable netting and similar arrangements (offsetting arrangements and financial collateral).
Banking Group
Amounts Subject to Enforceable Master Netting Agreements
$ millionsGross
Amounts(1)
Financial Instruments
Not OffsetFinancial
CollateralNet
Amount
Amounts Not Subject to
Enforceable Master Netting
Agreements(1)Carrying
Value
Financial instruments as at 30 June 2016
Derivative assets 1,428 (981) (299) 148 23 1,451
Reverse repurchase agreements 455 - (455) - - 455
Total financial assets 1,883 (981) (754) 148 23 1,906
Derivative liabilities (2,083) 981 994 (108) (2) (2,085)
Total financial liabilities (2,083) 981 994 (108) (2) (2,085)
Financial instruments as at 30 June 2015
Derivative assets 2,087 (928) (789) 370 15 2,102
Reverse repurchase agreements 386 - (386) - - 386
Total financial assets 2,473 (928) (1,175) 370 15 2,488
Derivative liabilities (1,362) 928 353 (81) (2) (1,364)
Total financial liabilities (1,362) 928 353 (81) (2) (1,364)
(1) The sum of these amounts is equivalent to the carrying value of the corresponding financial instruments.
Effects of Master Netting Agreements on Financial Instruments
The ‘gross amounts’ column identifies financial assets and liabilities that are subject to enforceable master netting agreements such as ISDA Master Agreements, global master repurchase agreements and global master securities lending agreements. Under these agreements all outstanding transactions with the same counterparty can be offset and close-out netting applied across all outstanding transactions covered by the agreements if an event of default or other predetermined events occur. Financial collateral refers to cash and non-cash collateral obtained to cover the net exposure between counterparties by enabling the collateral to be realised in an event of default or if other predetermined events occur. The ‘net amount’ column shows the potential effects of the Banking Group’s right of offset from master netting agreements. The ‘amounts not subject to enforceable master netting agreements’ column represents those amounts covered by master netting agreements but have uncertainty on their enforceability under applicable New Zealand legislation.
The net amounts presented in the tables do not represent the Banking Group’s actual credit exposure.

Notes to the Financial StatementsFor the year ended 30 June 2016
AASB Bank Limited 59
442 Capital Adequacy(1)
Regulatory Requirements - Basel III
The Banking Group is subject to regulation by the RBNZ. The RBNZ has set minimum regulatory capital requirements for New Zealand registered banks that are consistent with the internationally agreed framework developed by the Basel Committee on banking supervision. These requirements define what is acceptable as capital and provide for methods of measuring the risks incurred by the Banking Group.
The Banking Group must comply with RBNZ minimum capital adequacy ratios under the Bank's conditions of registration. These conditions of registration require capital adequacy ratios for the Banking Group to be calculated in accordance with the RBNZ document Capital Adequacy Framework (Internal Models Based Approach) (BS2B) dated October 2014. The Banking Group is accredited by the RBNZ to adopt the internal ratings based ("IRB") approach for calculating regulatory capital requirements. The risk-weighted exposure calculation includes the use of IRB models and the credit models described in note 15 (using PD, EAD and LGD). In applying the IRB approach, the RBNZ accreditation and Conditions of Registration require the use of parameters which are more conservative than those calculated using the Bank's own methodologies.
The Banking Group is subject to Basel III capital requirements. The objective of the Basel III framework is to develop capital adequacy guidelines that are more accurately aligned with the individual risk profile of banks. Basel III consists of three pillars: Pillar One covers the capital requirements for banks for credit, operational, and market risks; Pillar Two covers all other material risks not already included in Pillar One; and Pillar Three relates to market disclosure.
Capital Management Policies
The Board of Directors (the “Board”) reviews and approves capital policy on an annual basis, with the next review due in May 2017.
The Banking Group’s objectives for the management of capital are to comply at all times with the regulatory capital requirements set by the RBNZ, to maintain a strong capital base to cover the inherent risks of the business in excess of that required by credit rating agencies to maintain a strong or very strong credit rating, and to support the future development and growth of the business.
Key attributes of the Banking Group's capital policy and processes relating to regulatory capital are set out below.
Regulatory capital is divided into tier one capital, which comprises common equity tier one capital and additional tier one capital; and tier two capital. Common equity and additional tier one capital primarily consist of shareholders' equity and other capital instruments acceptable to the RBNZ, less intangible and deferred taxation assets, and other prescribed deductions. Tier two capital comprises the asset revaluation reserve, FCTR and subordinated debt securities.
Regulatory capital adequacy ratios are calculated by expressing capital (common equity tier one, additional tier one, tier two or total regulatory capital) as a percentage of risk-weighted exposures. Risk-weighted exposures represent risks associated with the Banking Group's credit risk exposures, as well as operational risk and both traded and non-traded market risk, estimated in accordance with RBNZ banking supervision guidelines.
As a condition of registration, the Banking Group must comply with the following minimum requirements set by the RBNZ:
● Total regulatory capital must not be less than 8% of risk-weighted exposures.
● Tier one capital must not be less than 6% of risk-weighted exposures.
● Common equity tier one capital must not be less than 4.5% of risk-weighted exposures.
● Total regulatory capital must not be less than $30 million.
In addition, the Bank must maintain a minimum capital conservation buffer of 2.5% of risk-weighted exposures otherwise restrictions on the distribution of earnings will be imposed.
The Board has ultimate responsibility for capital adequacy, and minimum capital levels and limits are set at a higher level than required by the RBNZ. The Banking Group actively monitors its capital adequacy, including forecast capital requirements, as part of the Banking Group’s internal capital adequacy assessment process (refer to page 66) and reports this on a regular basis to senior management and the Board. The Banking Group uses a mix of capital instruments to reduce single source reliance and to optimise capital efficiency.
Note 34 sets out the capital initiatives that were undertaken to actively manage regulatory capital during the year. The material terms and conditions of loan capital and the ordinary and perpetual preference shares are disclosed in notes 33 and 34.
The capital adequacy tables set out on the following page summarise the composition of regulatory capital and the capital adequacy ratios for the Banking Group for the year ended 30 June 2016. During the current financial year and the comparative year shown, the Banking Group complied with all of the RBNZ capital requirements to which it is subject.
(1) Certain sections of note 42 are subject to review procedures which do not constitute an audit. These sections are clearly labelled as “Unaudited”. Refer to page 88 of the Independent Auditor's Report for further information.
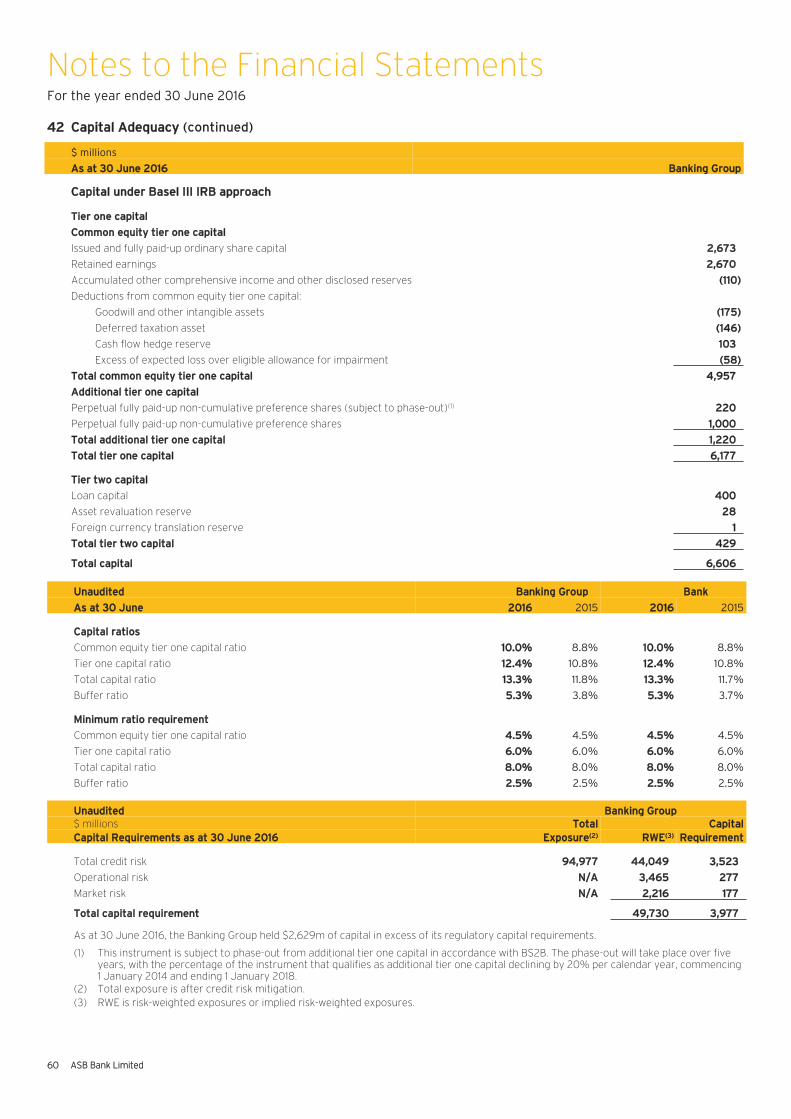
Notes to the Financial StatementsFor the year ended 30 June 2016
660 ASB Bank Limited
442 CCapital Adequacy (continued)
$ millions
AAs at 30 June 2016 BBanking Group
CCapital under Basel III IRB approach
TTier one capital
CCommon equity tier one capital
Issued and fully paid-up ordinary share capital 22,673
Retained earnings 22,670
Accumulated other comprehensive income and other disclosed reserves ((110)
Deductions from common equity tier one capital:
Goodwill and other intangible assets ((175)
Deferred taxation asset ((146)
Cash flow hedge reserve 1103
Excess of expected loss over eligible allowance for impairment ((58)
TTotal common equity tier one capital 44,957
AAdditional tier one capital
Perpetual fully paid-up non-cumulative preference shares (subject to phase-out)(1) 2220
Perpetual fully paid-up non-cumulative preference shares 11,000
TTotal additional tier one capital 11,220
TTotal tier one capital 66,177
TTier two capital
Loan capital 4400
Asset revaluation reserve 228
Foreign currency translation reserve 11
TTotal tier two capital 4429
TTotal capital 66,606
Unaudited Banking Group Bank
As at 30 June 2016 2015 2016 2015
Capital ratios
Common equity tier one capital ratio 10.0% 8.8% 10.0% 8.8%
Tier one capital ratio 12.4% 10.8% 12.4% 10.8%
Total capital ratio 13.3% 11.8% 13.3% 11.7%
Buffer ratio 5.3% 3.8% 5.3% 3.7%
Minimum ratio requirement
Common equity tier one capital ratio 4.5% 4.5% 4.5% 4.5%
Tier one capital ratio 6.0% 6.0% 6.0% 6.0%
Total capital ratio 8.0% 8.0% 8.0% 8.0%
Buffer ratio 2.5% 2.5% 2.5% 2.5%
Unaudited Banking Group$ millions Total CapitalCapital Requirements as at 30 June 2016 Exposure(2) RWE(3) Requirement
Total credit risk 94,977 44,049 3,523
Operational risk N/A 3,465 277
Market risk N/A 2,216 177
Total capital requirement 49,730 3,977
As at 30 June 2016, the Banking Group held $2,629m of capital in excess of its regulatory capital requirements.
(1) This instrument is subject to phase-out from additional tier one capital in accordance with BS2B. The phase-out will take place over five years, with the percentage of the instrument that qualifies as additional tier one capital declining by 20% per calendar year, commencing 1 January 2014 and ending 1 January 2018.
(2) Total exposure is after credit risk mitigation.(3) RWE is risk-weighted exposures or implied risk-weighted exposures.

Notes to the Financial StatementsFor the year ended 30 June 2016
AASB Bank Limited 61
442 CCapital Adequacy (continued)
UUnaudited BBanking GroupRRisk MMinimum
WWeighted EExposure EExposure EExposure WWeighted CCapitalAAs at 30 June 2016 AAverage AAmount WWeighted WWeighted EExposures(1) RRequirementPPD Grade PPD $$ millions LLGD RRisk Weight $$ millions $$ millions
CCredit risk exposures subject to the IRB approach by exposure class
SSovereign exposuresLess than and including 0.03% 00.02% 33,300 442% 88% 2296 224 Over 0.03% up to and including 0.05% -- -- -- -- -- -- Over 0.05% up to and including 0.07% -- -- -- -- -- -- Over 0.07% up to and including 0.26% -- -- -- -- -- -- Over 0.26% up to and including 99.99% -- -- -- -- -- -- Default PD grade 1100.00% -- -- -- -- --
TTotal sovereign exposures 00.02% 33,300 442% 88% 2296 224
BBank exposuresLess than and including 0.03% 00.03% 11,034 661% 116% 1176 114 Over 0.03% up to and including 0.05% 00.04% 22,476 556% 119% 5502 440 Over 0.05% up to and including 0.07% 00.07% 4406 558% 227% 1118 99 Over 0.07% up to and including 0.26% 00.17% 4409 223% 117% 774 66 Over 0.26% up to and including 99.99% 11.64% 11 333% 1100% 11 -- Default PD grade 1100.00% -- -- -- -- --
TTotal bank exposures 00.05% 44,326 554% 119% 8871 669
EExposures secured by residential mortgagesLess than and including 0.50% 00.29% 220,611 223% 114% 33,098 2248 Over 0.50% up to and including 0.85% 00.62% 222,468 224% 225% 66,047 4484 Over 0.85% up to and including 3.26% 11.37% 111,424 225% 445% 55,456 4436 Over 3.26% up to and including 7.76% 44.61% 2264 226% 998% 2274 222 Over 7.76% up to and including 99.99% 119.35% 6649 224% 1126% 8870 770 Default PD grade 1100.00% 1129 227% 2284% 3389 331
TTotal exposures secured by residential mortgages 11.12% 555,545 224% 227% 116,134 11,291
OOther retail exposuresLess than and including 0.50% -- -- -- -- -- -- Over 0.50% up to and including 0.85% 00.83% 5576 995% 889% 5541 443 Over 0.85% up to and including 3.26% 11.62% 11,953 995% 1112% 22,328 1186 Over 3.26% up to and including 7.76% 33.77% 2268 992% 1132% 3377 330 Over 7.76% up to and including 99.99% 226.95% 117 994% 2235% 442 33 Default PD grade 1100.00% 111 991% 7736% 886 77
TTotal other retail exposures 22.20% 22,825 994% 1113% 33,374 2269
CCorporate exposures - small and medium enterprisesLess than and including 0.20% 00.16% 3361 331% 221% 881 66 Over 0.20% up to and including 0.50% 00.34% 11,690 226% 229% 5512 441 Over 0.50% up to and including 1.00% 00.71% 55,919 330% 447% 22,932 2235 Over 1.00% up to and including 2.30% 11.56% 77,683 331% 667% 55,479 4438 Over 2.30% up to and including 99.99% 55.19% 44,824 334% 1106% 55,432 4435 Default PD grade 1100.00% 3345 339% 4412% 11,505 1120 TTotal corporate exposures - small and medium enterprises 33.66% 220,822 331% 772% 115,941 11,275
OOther corporate exposuresLess than and including 0.20% 00.11% 9975 558% 336% 3374 330 Over 0.20% up to and including 0.50% 00.31% 9945 555% 666% 6659 553 Over 0.50% up to and including 1.00% 00.68% 9914 445% 775% 7723 558 Over 1.00% up to and including 2.30% 11.35% 2209 443% 990% 2201 116 Over 2.30% up to and including 99.99% 33.41% 1114 447% 1125% 1152 112 Default PD grade 1100.00% 77 660% 886% 66 --
TTotal other corporate exposures 00.76% 33,164 552% 663% 22,115 1169
(1) Risk-weighted exposures include a scalar of 1.06 in accordance with the Bank's Conditions of Registration.
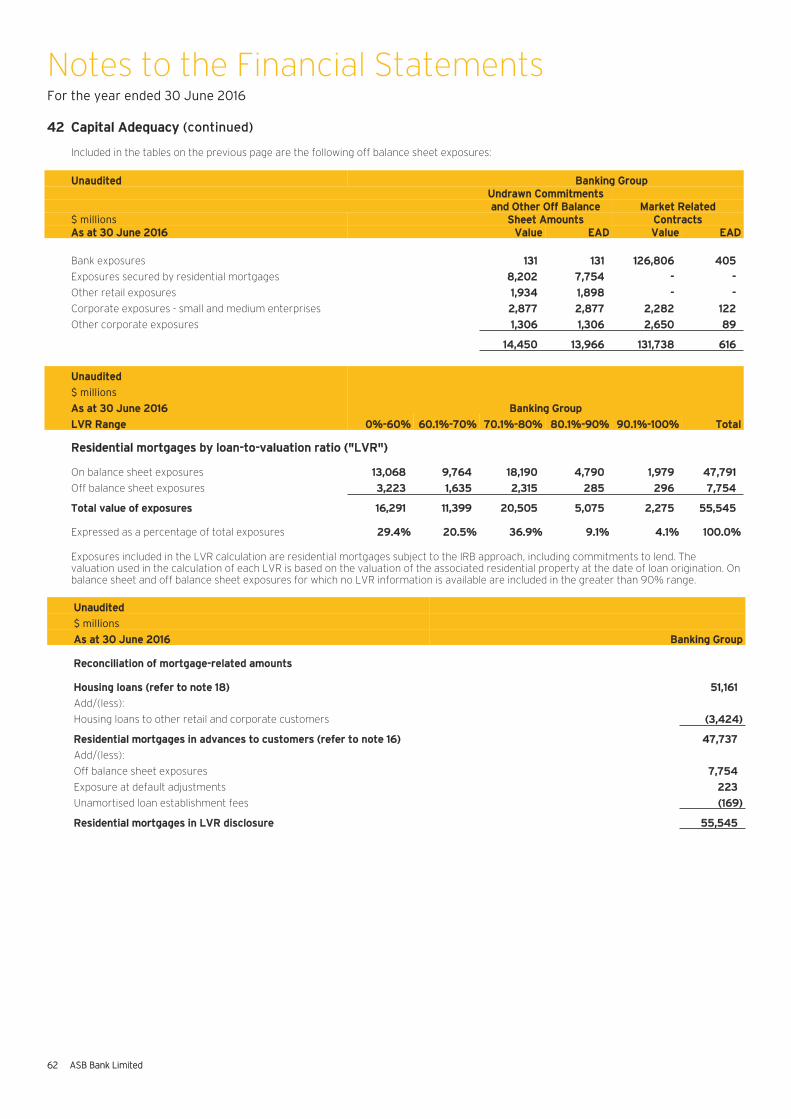
Notes to the Financial StatementsFor the year ended 30 June 2016
662 ASB Bank Limited
442 CCapital Adequacy (continued)
Included in the tables on the previous page are the following off balance sheet exposures:
UUnaudited BBanking GroupUUndrawn Commitmentsaand Other Off Balance MMarket Related
$ millions SSheet Amounts CContractsAAs at 30 June 2016 VValue EEAD VValue EEAD
Bank exposures 1131 1131 1126,806 4405
Exposures secured by residential mortgages 88,202 77,754 -- --
Other retail exposures 11,934 11,898 -- --
Corporate exposures - small and medium enterprises 22,877 22,877 22,282 1122
Other corporate exposures 11,306 11,306 22,650 889
114,450 113,966 1131,738 6616
UUnaudited
$ millions
AAs at 30 June 2016 BBanking Group
LLVR Range 00%-60% 660.1%-70% 770.1%-80% 880.1%-90% 990.1%-100% TTotal
RResidential mortgages by loan-to-valuation ratio ("LVR")
On balance sheet exposures 113,068 99,764 118,190 44,790 11,979 447,791
Off balance sheet exposures 33,223 11,635 22,315 2285 2296 77,754
TTotal value of exposures 116,291 111,399 220,505 55,075 22,275 555,545
Expressed as a percentage of total exposures 229.4% 220.5% 336.9% 99.1% 44.1% 1100.0%
Exposures included in the LVR calculation are residential mortgages subject to the IRB approach, including commitments to lend. The valuation used in the calculation of each LVR is based on the valuation of the associated residential property at the date of loan origination. On balance sheet and off balance sheet exposures for which no LVR information is available are included in the greater than 90% range.
Unaudited
$ millions
As at 30 June 2016 Banking Group
Reconciliation of mortgage-related amounts
Housing loans (refer to note 18) 51,161
Add/(less):
Housing loans to other retail and corporate customers (3,424)
Residential mortgages in advances to customers (refer to note 16) 47,737
Add/(less):
Off balance sheet exposures 7,754
Exposure at default adjustments 223
Unamortised loan establishment fees (169)
Residential mortgages in LVR disclosure 55,545

Notes to the Financial StatementsFor the year ended 30 June 2016
AASB Bank Limited 63
442 CCapital Adequacy (continued)
UUnaudited BBanking GroupTTotal MMinimum
EExposure after RRisk PPillar OneCCredit Risk WWeighted CCapital
BBalance Sheet Exposures Subject to the MMitigation RRisk EExposures(1) RRequirementSSlotting Approach as at 30 June 2016 $$ millions WWeight $$ millions $$ millions
SSpecialised lendingStrong 228 770% 221 22
Good 1154 990% 1147 112
Satisfactory 22 1115% 22 --
1184 1170 114
UUnaudited BBanking GroupMMinimum
RRisk PPillar OneAAverage WWeighted CCapital
OOff Balance Sheet Exposures Subject to the EEAD RRisk EExposures(1) RRequirementSSlotting Approach as at 30 June 2016 $$ millions WWeight $$ millions $$ millions
Undrawn commitments 442 999% 444 44
Other off balance sheet exposures 33 994% 33 --
445 447 44
UUnaudited BBanking GroupTTotal MMinimum
EExposure after RRisk PPillar OneCCredit Risk AAverage WWeighted CCapitalMMitigation RRisk EExposures(1) RRequirement
BBalance Sheet Exposures as at 30 June 2016 $$ millions WWeight $$ millions $$ millions
CCredit risk exposures subject to the standardised approach
Cash 991 -- -- --
Residential mortgages 116 550% 88 11
Other assets 44,307 1100% 44,565 3365
TTotal balance sheet exposures 44,414 44,573 3366
UUnaudited BBanking GroupTTotal MMinimum
EExposure AAverage CCredit RRisk PPillar Oneoor Principal CCredit EEquivalent AAverage WWeighted CCapital
OOff Balance Sheet Exposures Subject to the AAmount CConversion AAmount RRisk EExposures(1) RRequirementSStandardised Approach as at 30 June 2016 $$ millions FFactor $$ millions WWeight $$ millions $$ millions
Undrawn commitments 1168 1100% 1168 997% 1173 114
Other off balance sheet exposures 991 1100% 991 1101% 997 88
Market related contracts 66 1100% 66 1100% 66 --
TTotal off balance sheet exposures subject to the standardised approach 2265 2265 2276 222
(1) Risk-weighted exposures include a scalar of 1.06 in accordance with the Bank's Conditions of Registration.
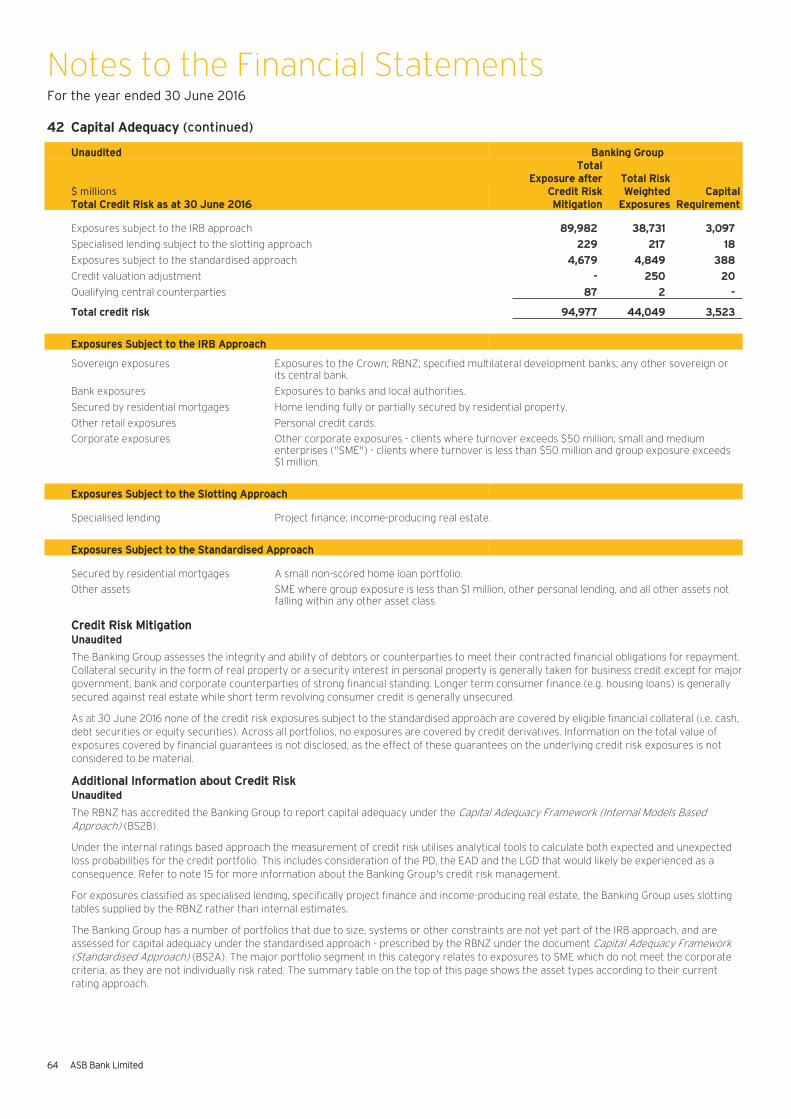
Notes to the Financial StatementsFor the year ended 30 June 2016
664 ASB Bank Limited
442 CCapital Adequacy (continued)
UUnaudited BBanking GroupTTotal
EExposure after TTotal Risk$ millions CCredit Risk WWeighted CCapitalTTotal Credit Risk as at 30 June 2016 MMitigation EExposures RRequirement
Exposures subject to the IRB approach 889,982 338,731 33,097
Specialised lending subject to the slotting approach 2229 2217 118
Exposures subject to the standardised approach 44,679 44,849 3388
Credit valuation adjustment -- 2250 220
Qualifying central counterparties 887 22 --
TTotal credit risk 994,977 444,049 33,523
EExposures Subject to the IRB Approach
Sovereign exposures Exposures to the Crown; RBNZ; specified multilateral development banks; any other sovereign or its central bank.
Bank exposures Exposures to banks and local authorities.
Secured by residential mortgages Home lending fully or partially secured by residential property.
Other retail exposures Personal credit cards.
Corporate exposures Other corporate exposures - clients where turnover exceeds $50 million; small and medium enterprises ("SME") - clients where turnover is less than $50 million and group exposure exceeds $1 million.
EExposures Subject to the Slotting Approach
Specialised lending Project finance; income-producing real estate.
EExposures Subject to the Standardised Approach
Secured by residential mortgages A small non-scored home loan portfolio.
Other assets SME where group exposure is less than $1 million, other personal lending, and all other assets not falling within any other asset class.
Credit Risk MitigationUnaudited
The Banking Group assesses the integrity and ability of debtors or counterparties to meet their contracted financial obligations for repayment. Collateral security in the form of real property or a security interest in personal property is generally taken for business credit except for major government, bank and corporate counterparties of strong financial standing. Longer term consumer finance (e.g. housing loans) is generally secured against real estate while short term revolving consumer credit is generally unsecured.
As at 30 June 2016 none of the credit risk exposures subject to the standardised approach are covered by eligible financial collateral (i.e. cash, debt securities or equity securities). Across all portfolios, no exposures are covered by credit derivatives. Information on the total value of exposures covered by financial guarantees is not disclosed, as the effect of these guarantees on the underlying credit risk exposures is not considered to be material.
Additional Information about Credit RiskUnaudited
The RBNZ has accredited the Banking Group to report capital adequacy under the Capital Adequacy Framework (Internal Models Based Approach) (BS2B).
Under the internal ratings based approach the measurement of credit risk utilises analytical tools to calculate both expected and unexpected loss probabilities for the credit portfolio. This includes consideration of the PD, the EAD and the LGD that would likely be experienced as a consequence. Refer to note 15 for more information about the Banking Group's credit risk management.
For exposures classified as specialised lending, specifically project finance and income-producing real estate, the Banking Group uses slotting tables supplied by the RBNZ rather than internal estimates.
The Banking Group has a number of portfolios that due to size, systems or other constraints are not yet part of the IRB approach, and are assessed for capital adequacy under the standardised approach - prescribed by the RBNZ under the document Capital Adequacy Framework (Standardised Approach) (BS2A). The major portfolio segment in this category relates to exposures to SME which do not meet the corporate criteria, as they are not individually risk rated. The summary table on the top of this page shows the asset types according to their current rating approach.

Notes to the Financial StatementsFor the year ended 30 June 2016
AASB Bank Limited 65
442 Capital Adequacy (continued)Unaudited
Additional Information about Credit Risk (continued)
Controls Surrounding Credit Risk Ratings Systems
Credit risk rating systems and policy cover all of the methods, processes, controls, data collection and technology that support the assessment of credit risk, the assignment of credit risk ratings and the quantification of associated default and loss estimates.
The Chief Risk Officer has ultimate responsibility for the on-going review and amendment of credit risk rating models. Risk Management actively participates in the development, selection, implementation and validation of rating models.
Internal Audit regularly reviews the Banking Group’s credit risk rating system and its operations, including the operations of the credit function and the estimation of PD, LGD and EAD.
All material aspects of rating and estimation processes must be approved by the BARC. Senior management are required to provide notice to the BARC of material changes or exceptions from established policies that will materially impact the operations of the credit risk rating system.
Senior management are required to have a good understanding of the design and operation of credit risk rating systems, and must approve material differences between established procedure and actual practice.
Refer to note 15 for more details of credit risk management controls.
Operational Risk
The advanced measurement approach has been implemented to determine capital requirements for operational risk.
The implied risk-weighted exposure for operational risk as at 30 June 2016 was $3,465 million (30 June 2015 $3,488 million).
The total operational risk capital requirement as at 30 June 2016 was $277 million (30 June 2015 $279 million).
Advanced Measurement Approach Overview
The Banking Group follows a mathematically determined loss distribution approach to measure operational risk. This involves separate modelling of the frequency and severity of risks at a component level and then aggregating simulated losses from these components into loss distributions for the Banking Group.
The Banking Group's modelling approach is very granular with multiple businesses ("Bu") each considered against the 20 Basel level 2 risk types ("RT"). This approach allows capital to link closely with where the businesses manage their risk, and also allows accurate modelling of both risk and tail event potential.
To capture the best business judgements, the Banking Group allows key risks to be assessed at the exposure level with separate frequency and severity judgements. These exposure level judgements are simulated to provide an annual loss distribution that is shown to the business subject matter experts to ensure their judgements are captured appropriately. These exposure annual loss distributions are aggregated to the business/risk type ("BuRT") level, resulting in an annual loss distribution for the BuRT.
The BuRT level frequency and severity distributions are aggregated using Monte Carlo simulation to produce capital results for the Bank and its businesses.
The operational risk measurement approach integrates the use of the following relevant factors:
Direct inputs:
● Scenario analysis to capture the business judgements (called “quantitative risk assessment”).
● Internal loss data (where sufficient data exists).
Indirect inputs:
● External loss data case studies (sourced from external providers) are used in the scenario analysis process.
● Risk indicators (developed and recorded) are used in the scenario analysis process.
Economic Capital Allocation
Outcomes of the operational risk measurement cycle are generated at BuRT level as outlined above. Outcomes include an economic capital requirement based on a 99.95% confidence interval which is calibrated to the Banking Group's overall target debt rating in the market. That data is used as a direct risk type input to the economic capital framework calculations alongside other risk type inputs (e.g. credit, traded and non-traded market, strategic business risk, fixed asset risk).
Insurance
An approach has been developed to model insurance for the purpose of mitigating operational risk. At this stage, insurance modelling and mitigation is not actively used in determining regulatory or economic capital requirements for operational risk.
Insurance modelling will be actively implemented once regulatory approval of the methodology and approach is received.

Notes to the Financial StatementsFor the year ended 30 June 2016
666 ASB Bank Limited
442 Capital Adequacy (continued)Unaudited
Market Risk Capital Charges
The Banking Group's aggregate market risk exposure is derived in accordance with the RBNZ documents Capital Adequacy Framework (Internal Models Based Approach) (BS2B) and Market Risk Guidance Notes (BS6). The peak end-of-day exposure is derived by taking the highest market exposure over the six months ended 30 June 2016.
Interest rate risk and foreign exchange risk are calculated on a daily basis. Equity risk is calculated on a monthly basis (on the last working day of the month). For each category, the peak end-of-day market risk exposure may not have occurred at the same time.
Unaudited Banking GroupInterest Foreign
$ millions Rate Currency EquityExposures as at 30 June 2016 Risk Risk Risk Total
Implied risk-weighted exposure 2,214 2 - 2,216
Aggregate capital charge 177 - - 177
Unaudited Banking GroupInterest Foreign
$ millions Rate Currency EquityPeak Exposures for the six months ended 30 June 2016 Risk Risk Risk Total
Implied risk-weighted exposure 2,696 26 - 2,722
Aggregate capital charge 216 2 - 218
Capital for Other Material Risks
The Banking Group has an internal capital adequacy assessment process (“ICAAP”) which complies with the requirements set out in the RBNZ document Guidelines on a Bank's Internal Capital Adequacy Assessment Process ("ICAAP") (BS12) in accordance with the Bank's Conditions of Registration. The Board is responsible for ensuring that the Banking Group has adequate overall capital in relation to its risk profile.
Under RBNZ rules, a bank that is a member of a wider banking group may base its approach on group wide-methodologies. The Banking Group, as a member of the wider CBA banking group, has based its ICAAP processes on that of CBA, after taking account of New Zealand and Bank conditions.
The Banking Group’s ICAAP is a documented process to ensure the Banking Group has adequate overall capital in relation to its risk profile. Component parts of the Banking Group's ICAAP are reviewed on a regular basis by senior management and the Board. The Banking Group’s ICAAP and ICAAP documents are reviewed annually. Revisions to significant ICAAP processes must be approved by the Board.
The Banking Group’s ICAAP includes an assessment of capital required to cover material risks not already captured in the measurement of regulatory capital. As at 30 June 2016 internal capital allocations of $278 million (30 June 2015 $311 million) had been made for other material risks including strategic risk and fixed asset risk.
Capital Adequacy of Ultimate Parent Bank and Ultimate Parent Banking Group
The ultimate parent bank of the Banking Group is CBA. The ultimate parent banking group is CBA and the various companies and other entities owned and controlled by CBA.
The ultimate parent banking group is accredited to use the advanced internal ratings based approach ("AIRB") for credit risk and the advanced measurement approach ("AMA") for operational risk, which have been adopted in the calculation of the ultimate parent banking group's risk-weighted exposures.
The ultimate parent banking group adopted the Basel III measurement of regulatory capital effective from 1 January 2013. The APRA prudential standards require a minimum CET1 ratio of 4.5% which was effective from 1 January 2013. An additional CET1 capital conservation buffer of 3.5%, inclusive of a domestic systemically important bank requirement of 1% and a countercyclical capital buffer of 0%, was effective from 1 January 2016, bringing the CET1 requirement to at least 8%.
The ultimate parent banking group is required to disclose capital adequacy information on a quarterly and a semi-annual basis. This information is made available to users via the ultimate parent bank's website (www.commbank.com.au).
The ultimate parent banking group is required by APRA to hold minimum capital specified under the Basel III (AIRB) approach. As at 30 June 2016 the minimum capital requirements were met (30 June 2015 minimum capital requirements under the Basel III (AIRB) approach were met).
Unaudited Ultimate Parent Ultimate ParentBank Banking Group
As at 30 June 2016 2015 2016 2015
Common equity tier one capital ratio 11.0% 9.6% 10.6% 9.1%
Tier one capital ratio 12.4% 11.5% 12.3% 11.2%
Total capital ratio 14.5% 13.1% 14.3% 12.7%

Notes to the Financial StatementsFor the year ended 30 June 2016
AASB Bank Limited 67
443 Securitisation, Funds Management, Other Fiduciary Activities and the Marketing and Distribution of Insurance Products
Securitisation, Funds Management and Other Fiduciary Activities
SecuritisationAs at 30 June 2016 the Banking Group had internally securitised $4.2 billion of RMBS through the Medallion NZ Series Trust 2009-1R, of which $4.0 billion of Class A floating rate notes issued by the Medallion NZ Series Trust 2009-1R have been assigned a credit rating of AAA by Fitch Ratings. Refer to note 22 for more information.
Funds ManagementThe Banking Group markets and distributes funds management products which are issued by a wholly owned subsidiary, ASB Group Investments Limited (refer to note 24). Funds under management distributed by the Banking Group totalled $8,917 million as at 30 June 2016 (30 June 2015 $7,523 million). The Banking Group provides banking services for trusts managed or administered by ASB Group Investments Limited. The Banking Group also sells derivative products to some of the trusts.
Fiduciary ActivitiesThe Banking Group provides limited custodial services relating to holding interest-bearing instruments and equity securities on behalf of clients.
The Banking Group has not provided funding to any entity established, marketed and/or sponsored to conduct trust, custodial, funds management and other fiduciary activities.
Insurance Business, Marketing and Distribution of Insurance Products
The Banking Group does not conduct any insurance business. However, general, travel and life insurance products are marketed by the Banking Group for the following entities: Sovereign Assurance Company Limited (a wholly owned subsidiary of ASB Group (Life) Limited), IAG New Zealand Limited and TOWER Insurance Limited.
The Banking Group has not provided funding to any affiliated insurance entity or group on whose behalf the Banking Group has marketed or distributed insurance products.
Risk Management
The Banking Group has in place policies and procedures to ensure that those activities are conducted in an appropriate manner. Should adverse conditions arise, it is considered that these policies and procedures will minimise the possibility that these conditions will adversely impact the Banking Group. The policies and procedures include comprehensive and prominent disclosure of information regarding products, and formal and regular review of operations and policies by management and auditors.
In addition, the following measures have been taken to manage any risk to the Banking Group in the marketing and distribution of insurance products:
● Brochures for insurance products include disclosures that the Banking Group does not guarantee the insurer, nor the insurer's subsidiaries, nor any of the products issued by the insurer or the insurer's subsidiaries.
● Where the insurance products are subject to the Securities Act 1978, brochures additionally include disclosures that:
– the policies do not represent deposits or other liabilities of the Banking Group;– the policies are subject to investment risk, including possible loss of income and principal; and– the Banking Group does not guarantee the capital value or performance of the policies.
● Application forms for insurance products contain acknowledgements to be signed by a purchaser which are consistent with the disclosures for insurance products noted above.
In addition, the following measures have been taken to manage any risk to the Banking Group in the marketing and distribution of funds management products:
● Prospectuses, investment statements and brochures for funds management products include disclosures that:
– the securities do not represent deposits or other liabilities of the Banking Group;– the securities are subject to investment risk including possible loss of income and principal invested; and– the Banking Group does not guarantee the capital value or performance of the securities.
● Application forms for funds management products contain acknowledgements to be signed by a purchaser which are consistent with the disclosures for funds management products noted above.
Provision of Financial Services
Financial services (including deposit taking and foreign exchange services) provided by the Banking Group to entities which are involved in trust, custodial, funds management and other fiduciary activities, and to affiliated insurance companies which conduct marketing or distribution of insurance products, or on whose behalf the marketing or distribution of insurance products are conducted, are provided on arm's length terms and conditions. The Banking Group has not purchased any assets from such entities during the year.

Notes to the Financial StatementsFor the year ended 30 June 2016
668 ASB Bank Limited
444 FFinancial Reporting by Operating Segments
BBanking Group
$ millions
RRetail and Business Banking
CCorporate, Commercial
and RuralWWealth and
Insurance OOther TTotal
IIncome Statement
FFor the year ended 30 June 2016
Net interest earnings 11,126 5545 113 778 11,762
Other income/(expense) 2242 1133 1164 ((75) 4464
Total operating income 11,368 6678 1177 33 22,226
Impairment losses on advances 554 776 -- -- 1130
Segment operating expenses (excluding impairment losses) 4477 2249 887 113 8826
Segment net profit/(loss) before taxation 8837 3353 990 ((10) 11,270
Taxation 2235 999 225 ((2) 3357
Segment net profit/(loss) after taxation 6602 2254 665 ((8) 9913
NNon-cash expenses(1)
Depreciation and amortisation expense 446 223 88 -- 777
BBalance Sheet
AAs at 30 June 2016
Total assets 448,396 225,821 1184 77,205 881,606
Total liabilities 336,299 114,451 3320 223,724 774,794
BBanking Group
$ millions
Retail and Business Banking
Corporate, Commercial
and RuralWealth and
Insurance Other Total
IIncome Statement(2)
FFor the year ended 30 June 2015
Net interest earnings 1,091 509 13 54 1,667
Other income/(expense) 230 128 149 (88) 419
Total operating income/(expense) 1,321 637 162 (34) 2,086
Impairment losses on advances 56 33 - - 89
Segment operating expenses (excluding impairment losses) 465 237 86 17 805
Segment net profit/(loss) before taxation 800 367 76 (51) 1,192
Taxation 223 103 21 (14) 333
Segment net profit/(loss) after taxation 577 264 55 (37) 859
NNon-cash expenses(1)
Depreciation and amortisation expense 45 21 8 - 74
BBalance Sheet
AAs at 30 June 2015
Total assets 44,420 24,526 185 6,772 75,903
Total liabilities 33,831 15,584 282 20,828 70,525
(1) Non-cash expenses are included in segment operating expenses (excluding impairment losses).
(2) Certain comparative information has been reclassified to ensure consistency with presentation in the current year.

Notes to the Financial StatementsFor the year ended 30 June 2016
AASB Bank Limited 69
444 Financial Reporting by Operating Segments (continued)
Retail and Business Banking: The Retail and Business Banking segment provides services to private individuals and small business customers. In addition, net income is attributed to this segment for the distribution of wealth management products through the retail distribution network.
Corporate, Commercial and Rural: The Corporate, Commercial and Rural segment provides services to corporate, commercial and rural customers. It also comprises the Bank’s financial markets activities, including financial instruments trading and sales of financial instruments to customers.
Wealth and Insurance: The Wealth and Insurance segment provides securities, investment and insurance services to customers.
Other primarily includes:
• business units that do not meet the definition of operating segments under NZ IFRS 8 Operating Segments, including the Bank’s Treasury function and other functions that supply support and services to the segments;
• elimination entries on consolidation of the results, assets and liabilities of the Banking Group’s controlled entities in the preparation of the consolidated financial statements of the Banking Group; and
• results of certain business units excluded for management reporting purposes, but included within the consolidated financial statements of the Banking Group for statutory reporting purposes. This includes a portion of the former Institutional Banking and Markets segment which was allocated to CBA during September 2013 as a consequence of disestablishing ASB Institutional (an unincorporated joint venture between the Bank and CBA). In September 2013, the remaining portion of the Institutional Banking and Markets segment was merged with the Commercial and Rural Banking segment to form the Corporate, Commercial and Rural segment.
Operating income in each segment includes transfer pricing adjustments to reflect inter-segment funding arrangements. Inter-segment pricing is determined on an arm's length basis. Inter-segment transactions are eliminated for the purposes of reporting the consolidated Banking Group's results and are included in the Other segment.
The Banking Group operates predominantly in the banking industry within New Zealand. The Banking Group has very limited exposure to risks associated with operating in different economic environments or political conditions in other countries. On this basis no geographical segment information is provided.

Notes to the Financial StatementsFor the year ended 30 June 2016
770 ASB Bank Limited
445 Risk Management Policies
Introduction
The Banking Group is committed to the management of risk to achieve sustainability of service, employment and profits, and therefore takes on controlled amounts of risk when considered appropriate. The risk management framework identifies, assesses, manages and reports risk and risk adjusted returns using an economic equity framework. This is targeted at ensuring that the Banking Group has sufficient capital to enable a strong credit rating relative to the overall market and its peers.
The primary risks are those of credit, market, liquidity/funding, operational, reputation and strategic business risk.
The Banking Group's risk and control functions are the responsibility of the Chief Risk Officer, who reports to the Chief Executive Officer. The Banking Group’s risk management strategy is set by the Board through the BARC. All non-executive Directors are members of the BARC (refer to the Directory for details). Formal executive committees are in place governing all primary risk types. The Chief Risk Officer is responsible for the implementation of risk management strategy and all executives have responsibility for the day-to-day management of risk across the Banking Group.
The Banking Group has management structures and information systems to manage individual risks. Risk initiation and monitoring tasks are separated where feasible, and all material information systems are subjected to regular internal audits.
The Banking Group’s external auditor also reviews parts of the Banking Group’s risk management framework that impact on significant aspects of financial systems, but only to the extent necessary to form their review opinion on the Banking Group’s half-year financial statements or audit opinion on the Banking Group’s annual financial statements.
The following notes contain information about the risk management framework: notes 15 to 21 (credit risk), notes 46 and 47 (market risk), and notes 48 to 51 (liquidity and funding risk). Operational and strategic business risk are discussed below.
Operational and Strategic Business Risk
Operational risk is defined as the risk of loss resulting from inadequate or failed internal processes and methodologies, people, systems or external events.
Strategic business risk is defined as the risk of economic gain or loss resulting from changes in the business environment caused by economic, competitive, social trend or regulatory factors.
Each business manager is responsible for the identification and assessment of these risks and for maintaining appropriate internal controls, and is supported by the Banking Group’s governance structures, operational risk framework and operational risk policies.
The Banking Group’s operational risk measurement methodology combines assessment of individual risk exposures with internal loss data to determine potential losses and calculate operational risk economic capital.
Business Continuity Management
Business continuity management ("BCM") within the Banking Group involves the development, maintenance and testing of action plans to respond to defined risk events. This ensures that business processes continue with minimal adverse impact on customers, staff, products, services and brands.
BCM constitutes an essential component of the Banking Group’s risk management process by providing a controlled response to potential operational risks that could have a significant impact on the Banking Group’s critical processes and revenue streams. It includes responses to mitigate the impact of risk events or disasters and crisis management plans to respond to crisis events.
A comprehensive BCM programme including plan development, testing and education has been implemented across all business units with critical processes and includes technology disaster recovery planning.
Internal Audit
The Banking Group maintains an independent internal audit function which is ultimately accountable to the Board through the BARC.
The internal audit function provides independent opinions on the effectiveness of risk management systems and the framework of controls and governance processes within the Banking Group’s operations. Audits of the Banking Group’s operations are undertaken based on an assessment of risk.
The BARC meets on a regular basis to consider the Banking Group’s financial reporting, internal control and corporate governance matters. In doing so, the BARC reviews internal audit findings and opinions, and the activities of the internal audit function.

Notes to the Financial StatementsFor the year ended 30 June 2016
AASB Bank Limited 71
446 Market Risk
Market risk is the potential of an adverse impact on the Banking Group’s earnings or capital from changes in interest rates, foreign exchange rates, equity and commodity prices.
The Banking Group distinguishes between two main types of market risk: • Traded market risk principally arises from the Banking Group’s trading book activities within Global Markets. • Non-traded market risk includes interest rate risk arising from the banking book.
Market Risk Measurement
The Banking Group uses Value-at-Risk (“VaR”) as one of the measures of Traded and Non-traded market risk. VaR is a statistical measure of potential loss using historically observed market movements.
VaR is modelled at a 97.5% confidence level. This means that there is a 97.5% probability that any potential loss will not exceed the VaR estimate on any given day.
The VaR measured for Traded market risk uses two years of daily movement in market rates. The VaR measure for Non-traded Banking Book market risk uses six years of daily movement in market rates.
A 1-day holding period is used for trading book positions. A 20-day holding period is used for Interest Rate Risk in the Banking Book.
VaR is driven by historical observations and is not an estimate of the maximum loss that the Banking Group could experience from an extreme market event. As a result of this limitation, management also uses additional controls to measure and manage market risk including stress testing, risk sensitivity and position limits.
Traded Market Risk
Traded Market Risk is generated through the Banking Group’s participation in financial markets to service its customers. The Banking Group trades and distributes interest rate, foreign exchange, debt, equity and commodity products, and provides treasury, capital markets and risk management services to its customers.
$ millions Banking Group
VaR at 97.5% Confidence Level Average VaR
As at 30 June 2016 2015
Interest rate risk 0.15 0.14
Foreign exchange risk 0.09 0.11
Diversification benefit (0.05) (0.05)
Total Traded Market Risk 0.19 0.20
Non-traded Market Risk - Interest Rate Risk in the Banking Book
Interest rate risk is the current and prospective impact to the Banking Group’s financial condition due to adverse changes in interest rates to which the Banking Group’s Balance Sheet is exposed. Activities of the Banking Group result in mismatched assets and liabilities positions which direct that the propensity, timing and quantum of interest rate movements have undesired outcomes over both the short term and long term. The Banking Group engages in maturity transformation activities to manage interest rate risk to achieve stable and sustainable net interest income in the long-term.
The Banking Group measures and manages the impact of interest rate risk in two ways:
(a) Next 12 months' earnings
Interest rate risk from an earnings perspective (earnings risk) is the risk to earnings from potential interest rate movements on net interest income over the next 12 months.
The risk to net interest income over the next 12 months from changes in interest rates is measured on a monthly basis.
Earnings risk is measured through sensitivity analysis, which applies an instantaneous 100 basis point parallel shock in interest rates across the yield curve.
The prospective change to net interest income is measured by using an Asset and Liability Management simulation model which incorporates both existing and anticipated new business in its assessment. Assets and liabilities that reprice directly from observable market rates are measured based on the full extent of the rate shock that is applied. Assets and liabilities that are priced based on Banking Group administered or discretionary interest rates, and that are impacted by customer behaviour, are measured by taking into consideration the historic repricing strategy of the Banking Group and customer behaviour.
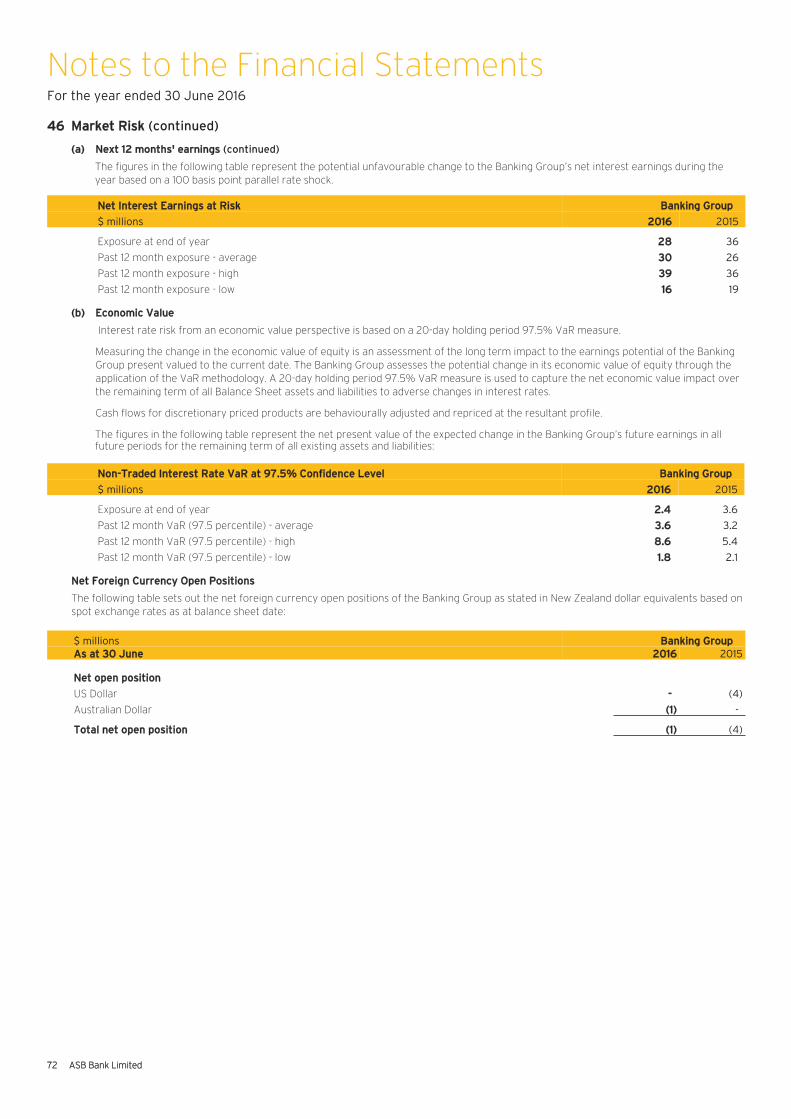
Notes to the Financial StatementsFor the year ended 30 June 2016
772 ASB Bank Limited
446 Market Risk (continued)
(a) Next 12 months' earnings (continued)
The figures in the following table represent the potential unfavourable change to the Banking Group’s net interest earnings during the year based on a 100 basis point parallel rate shock.
Net Interest Earnings at Risk Banking Group
$ millions 2016 2015
Exposure at end of year 28 36
Past 12 month exposure - average 30 26
Past 12 month exposure - high 39 36
Past 12 month exposure - low 16 19
(b) Economic Value
Interest rate risk from an economic value perspective is based on a 20-day holding period 97.5% VaR measure.
Measuring the change in the economic value of equity is an assessment of the long term impact to the earnings potential of the Banking Group present valued to the current date. The Banking Group assesses the potential change in its economic value of equity through the application of the VaR methodology. A 20-day holding period 97.5% VaR measure is used to capture the net economic value impact over the remaining term of all Balance Sheet assets and liabilities to adverse changes in interest rates.
Cash flows for discretionary priced products are behaviourally adjusted and repriced at the resultant profile.
The figures in the following table represent the net present value of the expected change in the Banking Group’s future earnings in all future periods for the remaining term of all existing assets and liabilities:
Non-Traded Interest Rate VaR at 97.5% Confidence Level Banking Group
$ millions 2016 2015
Exposure at end of year 2.4 3.6
Past 12 month VaR (97.5 percentile) - average 3.6 3.2
Past 12 month VaR (97.5 percentile) - high 8.6 5.4
Past 12 month VaR (97.5 percentile) - low 1.8 2.1
Net Foreign Currency Open Positions
The following table sets out the net foreign currency open positions of the Banking Group as stated in New Zealand dollar equivalents based on spot exchange rates as at balance sheet date:
$ millions Banking GroupAs at 30 June 2016 2015
Net open position
US Dollar - (4)
Australian Dollar (1) -
Total net open position (1) (4)

Notes to the Financial StatementsFor the year ended 30 June 2016
AASB Bank Limited 73
447 Interest Rate Repricing Schedule
The following tables include the Banking Group's assets and liabilities at their carrying amounts, categorised by the earlier of contractual repricing or maturity dates. The carrying amounts of derivative financial instruments, which are principally used to reduce the Banking Group's exposure to interest rate movements, are included under the heading "Non-interest Bearing".
$ millions Banking GroupOver Over Over
3 Months 6 Months 1 Year Non-Up to and up to and up to and up to Over interest
As at 30 June 2016 3 Months 6 Months 1 Year 2 Years 2 Years Bearing Total
Assets
Cash and liquid assets 1,191 - - - - 212 1,403
Due from financial institutions 1,130 - - - - 1 1,131
Trading securities 563 101 - 107 21 - 792
Derivative assets - - - - - 1,451 1,451
Available-for-sale securities 654 19 131 780 2,433 - 4,017
Advances to customers 33,320 5,503 12,123 14,143 7,066 (80) 72,075
Other assets - - - - - 737 737
Total assets 36,858 5,623 12,254 15,030 9,520 2,321 81,606
Liabilities
Deposits and other public borrowings 35,808 8,377 4,177 1,696 1,141 3,503 54,702
Due to financial institutions 566 - - - - 14 580
Other liabilities at fair value through Income Statement 1,340 - - - - - 1,340
Derivative liabilities - - - - - 2,085 2,085
Other liabilities - - - - - 587 587
Debt issues:
At fair value through Income Statement 1,049 352 245 - - - 1,646
At amortised cost 6,611 229 315 1,480 4,654 142 13,431
Loan capital - - - - 400 23 423
Total liabilities 45,374 8,958 4,737 3,176 6,195 6,354 74,794
Net derivative notionals 13,795 2,148 (7,507) (10,039) 1,603
Interest rate sensitivity gap 5,279 (1,187) 10 1,815 4,928 (4,033) 6,812

Notes to the Financial StatementsFor the year ended 30 June 2016
774 ASB Bank Limited
447 IInterest Rate Repricing Schedule (continued)
$ millions BBanking GroupOver Over Over
3 Months 6 Months 1 Year Non-Up to and up to and up to and up to Over interest
AAs at 30 June 2015 3 Months 6 Months 1 Year 2 Years 2 Years Bearing Total
AAssets
Cash and liquid assets 1,670 - - - - 129 1,799
Due from financial institutions 1,615 - - - - - 1,615
Trading securities 720 219 - - 32 - 971
Derivative assets - - - - - 2,102 2,102
Available-for-sale securities 852 - 127 202 1,860 - 3,041
Advances to customers 29,519 4,254 7,667 15,545 8,451 (53) 65,383
Other assets - - - - - 992 992
TTotal Assets 34,376 4,473 7,794 15,747 10,343 3,170 75,903
LLiabilities
Deposits and other public borrowings 33,158 7,470 5,522 1,781 1,308 2,924 52,163
Due to financial institutions 2,367 11 11 - - 1,134 3,523
Other liabilities at fair value through Income Statement 180 - - - - - 180
Derivative liabilities - - - - - 1,364 1,364
Other liabilities - - - - - 592 592
Debt issues:
At fair value through Income Statement 949 264 - - - - 1,213
At amortised cost 6,143 250 20 600 3,935 128 11,076
Loan capital - - - - 400 14 414
TTotal liabilities 42,797 7,995 5,553 2,381 5,643 6,156 70,525
NNet derivative notionals(1) 10,908 3,430 62 (12,633) (1,767)
IInterest rate sensitivity gap 2,487 (92) 2,303 733 2,933 (2,986) 5,378
(1) Comparative information has been restated to ensure consistency with presentation in the current year.

Notes to the Financial StatementsFor the year ended 30 June 2016
AASB Bank Limited 75
448 Liquidity and Funding Risk
Liquidity and Funding Risk Management Framework and Policies
Liquidity risk is the risk that the Bank will not be able to access funds to make payments when they are due. Funding risk is the risk that the funding mix of the Bank is such that it will have to pay higher than market rates for its funding or have difficulty raising funds.
The Banking Group has a liquidity and funding policy (the “policy”) in place to manage these risks which is approved by the BARC. Day-to-day management of liquidity and funding risks is performed and reported by the Bank’s Treasury function, with independent monitoring by the Bank’s Market Risk Management. Oversight is provided by ALCO. The policy also requires regular periodic review of liquidity management strategy and contingent funding plans by the Bank’s Directors.
The key objectives of the policy are:
● To ensure that cash flow commitments can be met as they fall due under both normal operating, crisis and stress conditions.
● To ensure that the Bank develops and protects a resilient and diversified funding base that is responsive to the Banking Group’s needs.
● To ensure that procedures and practices in relation to liquidity and funding risk management are clearly documented and communicated.
Regulatory Supervision
The Bank is subject to the conditions of the RBNZ's liquidity policy as set out in the RBNZ documents Liquidity Policy (BS13) and Liquidity Policy Annex: Liquid Assets (BS13A). The Bank has the appropriate internal framework and tools for liquidity risk management to ensure compliance with these regulatory requirements, as well as internal targets and limits.
Measuring and Monitoring Liquidity Risk
The Bank monitors liquidity risk primarily by forecasting future daily cash requirements. To provide for any unexpected patterns in cash movements the Bank holds a pool of readily realisable investment assets and deposits with high credit quality counterparties. It also seeks a diverse and stable funding base. Management limits are set to ensure that holdings of liquid assets do not fall below prudent levels. Limits are also set on the level of wholesale and offshore funding, as well as on the amount of wholesale funding that may mature in any period.
The policy also requires the Banking Group to manage liquidity and funding risk within a number of Board approved risk appetite limits. These require that the Bank maintains positive cash flow runoffs for one-week and one-month periods using stressed assumptions, and a strong and stable core funding ratio.
Stress Testing and Contingent Funding Plan
Under the policy, the one-week crisis net cash flow maturity runoff using ASB “name crisis” parameters must be less than qualifying liquid assets held. “Name crisis” is defined as a scenario where the Bank’s access to one or more of its funding or related markets is adversely affected by real or perceived issues with the Bank’s, or a Bank entity’s, name or viability. Qualifying liquid assets are of high credit quality and include short term cash held with the RBNZ or other banks, government securities and other securities that are readily acceptable in repurchase agreements with the RBNZ and other New Zealand banks, prime corporate bonds and short term paper and assets issued by offshore supranationals and highly rated banks. Runoff risk is calculated based on estimates of investor behaviour in a crisis scenario. Funding is weighted to reflect the sensitivity of different classes of investor during the first seven days of a run. In addition, management monitors other stress test scenarios when assessing appropriate liquidity levels.
The policy requires Treasury to develop, maintain and regularly test a Contingent Funding Plan (“CFP”). The CFP is reviewed and approved by the BARC. The plan establishes the policies, responsibilities and plans designed to return the Bank to a robust position within risk tolerance in the event of a liquidity crisis.
Residential Mortgage-Backed Securities ("RMBS") Facility
The Bank has an in-house RMBS facility, which has issued securities that can be used as collateral for borrowing from the RBNZ. As at 30 June 2016 the Bank had internally securitised $4.2 billion of RMBS through the Medallion NZ Series Trust 2009-1R, of which $4.0 billion of Class A floating rate notes have been assigned a credit rating of AAA by Fitch Ratings and are eligible for acceptance by the RBNZ (30 June 2015 $4.2 billion and $4.0 billion). Whilst not intended to be used for day-to-day liquidity management, the RMBS form part of the Bank's total qualifying liquid assets. The RBNZ has imposed a cap of 4% of total assets limiting the amount of RMBS that can be deemed as qualifying liquid assets available for repurchase agreements with the RBNZ (30 June 2015 4%). As at 30 June 2016 none of the RMBS had been used as collateral for repurchase agreements with the RBNZ (30 June 2015 nil). Refer to note 22 for additional information.

Notes to the Financial StatementsFor the year ended 30 June 2016
776 ASB Bank Limited
449 Qualifying Liquid Assets
The table below provides details of the qualifying liquid assets held by the Banking Group for the purpose of managing liquidity risk.
If the Bank enters into a repurchase agreement with the RBNZ, the qualifying liquid assets sold under the agreement are subject to a reduction in value (“haircut”) in accordance with the RBNZ’s Operating Rules. This haircut can range from 1 to 19 percent, depending on the qualifying asset, and reduces the value of the qualifying liquid assets available for liquidity purposes. Other than the residential mortgage-backed securities, the qualifying liquid assets in the table below are not adjusted for this haircut.
$ millions Banking Group
As at 30 June 2016
Cash and Liquid
Assets
Available-for-Sale
SecuritiesTrading
SecuritiesAdvances to
CustomersOther
Assets Total
Cash 212 - - - - 212
Call deposits with the central bank 736 - - - - 736
Local authority securities - 331 49 - 3 383
New Zealand government securities 455 978 106 - 7 1,546
Corporate bonds - 493 - - 4 497
RBNZ bills - - 67 - - 67
Bank bills - - 568 - - 568
Kauri bonds - 1,687 2 - 19 1,708
Other securities - 528 - - 1 529
Residential mortgage-backed securities - - - 3,240 - 3,240
Total qualifying liquid assets 1,403 4,017 792 3,240 34 9,486
$ millions Banking Group
As at 30 June 2015
Cash and Liquid Assets
Available-for-Sale
SecuritiesTrading
SecuritiesAdvances to
CustomersOther
Assets Total
Cash 154 - - - - 154
Call deposits with the central bank 1,259 - - - - 1,259
Local authority securities - 132 46 - 1 179
New Zealand government securities 375 107 9 - - 491
Corporate bonds - 578 - - 7 585
Treasury bills - 81 446 - - 527
Bank bills - - 468 - - 468
Kauri bonds - 1,484 2 - 19 1,505
Other securities - 659 - - 3 662
Residential mortgage-backed securities - - - 3,036 - 3,036
Total qualifying liquid assets 1,788 3,041 971 3,036 30 8,866

Notes to the Financial StatementsFor the year ended 30 June 2016
AASB Bank Limited 77
550 Maturity Analysis for Undiscounted Contractual Cash Flows
The tables on the following pages present the Banking Group’s cash flows by remaining contractual maturities as at balance date. The amounts disclosed in the tables are the contractual undiscounted cash flows and include principal and future interest cash flows, and therefore will not agree to the carrying values on the Balance Sheet.
Actual cash flows may differ significantly from the contractual cash flows presented below as a result of future actions of the Banking Group and its counterparties, such as early repayments or refinancing of term loans.
The majority of the longer term advances to customers are housing loans which are likely to be repaid earlier than their contractual terms. Deposits and other public borrowings include substantial customer savings deposits and cheque accounts, which are at call. History demonstrates that such accounts provide a stable source of long term funding for the Bank. It should be noted that the Banking Group does not manage its liquidity risk on the basis of the information below. The management of liquidity risk is set out in note 48.
$ millions Banking GroupWithin Between Between Between Over
On 6 6-12 1-2 2-5 5 CarryingAs at 30 June 2016 Demand Months Months Years Years Years Total Value
Non-derivative financial assets
Cash and liquid assets 948 457 - - - - 1,405 1,403
Due from financial institutions 1,044 87 - - - - 1,131 1,131
Trading securities - 672 2 104 21 - 799 792
Available-for-sale securities - 348 299 1,130 2,220 320 4,317 4,017
Advances to customers 1,078 9,927 4,511 8,651 17,344 62,054 103,565 72,075
Other assets - 210 - - - - 210 210
Total non-derivative financial assets 3,070 11,701 4,812 9,885 19,585 62,374 111,427 79,628
Derivative financial assets
Inflows from derivatives - 1,367 503 1,672 2,707 13 6,262
Outflows from derivatives - (587) (426) (1,546) (2,393) (13) (4,965)
- 780 77 126 314 - 1,297
Non-derivative financial liabilities
Deposits and other public borrowings 28,670 19,238 4,234 1,744 1,182 - 55,068 54,702
Due to financial institutions 500 80 - - - - 580 580
Other liabilities at fair value through Income Statement - 1,353 - - - - 1,353 1,340
Other liabilities 72 393 82 - - - 547 547
Debt issues:
At fair value through Income Statement - 1,405 247 - - - 1,652 1,646
At amortised cost - 2,587 1,382 3,037 6,068 866 13,940 13,431
Loan capital - 13 13 26 414 - 466 423
Total non-derivative financial liabilities 29,242 25,069 5,958 4,807 7,664 866 73,606 72,669
Derivative financial liabilities
Inflows from derivatives - 2,281 1,097 1,552 3,248 131 8,309
Outflows from derivatives - (3,475) (1,433) (1,929) (3,815) (144) (10,796)
- (1,194) (336) (377) (567) (13) (2,487)
Off balance sheet items
Lending commitments 12,451 1,350 - - - - 13,801
Guarantees - 146 - - - - 146
Other contingent liabilities - 262 - - - - 262
Total off balance sheet items 12,451 1,758 - - - - 14,209

Notes to the Financial StatementsFor the year ended 30 June 2016
778 ASB Bank Limited
550 MMaturity Analysis for Undiscounted Contractual Cash Flows (continued)
$ millions BBanking GroupWithin Between Between Between Over
On 6 6-12 1-2 2-5 5 CarryingAAs at 30 June 2015 Demand Months Months Years Years Years Total Value
NNon-derivative financial assets
Cash and liquid assets 1,413 389 - - - - 1,802 1,799
Due from financial institutions 430 1,190 - - - - 1,620 1,615
Trading securities - 927 26 1 23 8 985 971
Available-for-sale securities - 235 266 606 2,169 150 3,426 3,041
Advances to customers 1,199 8,919 3,651 8,300 16,868 61,546 100,483 65,383
Other assets - 513 - - - - 513 513
TTotal non-derivative financial assets 3,042 12,173 3,943 8,907 19,060 61,704 108,829 73,322
DDerivative financial assets
Inflows from derivatives - 3,287 326 1,472 4,998 - 10,083
Outflows from derivatives - (2,211) (321) (1,345) (4,462) - (8,339)
- 1,076 5 127 536 - 1,744
NNon-derivative financial liabilities
Deposits and other public borrowings 25,809 18,070 5,631 1,863 1,381 - 52,754 52,163
Due to financial institutions 2,102 45 1,392 - - - 3,539 3,523
Other liabilities at fair value through Income Statement - 181 - - - - 181 180
Other liabilities 19 553 4 10 - - 586 586
Debt issues:
At fair value through Income Statement - 1,214 - - - - 1,214 1,213
At amortised cost - 2,373 342 2,131 5,956 871 11,673 11,076
Loan capital - 13 13 26 440 - 492 414
TTotal non-derivative financial liabilities 27,930 22,449 7,382 4,030 7,777 871 70,439 69,155
DDerivative financial liabilities
Inflows from derivatives - 1,281 638 861 1,638 5 4,423
Outflows from derivatives - (2,013) (797) (1,094) (1,958) (5) (5,867)
- (732) (159) (233) (320) - (1,444)
OOff balance sheet items
Lending commitments 11,043 1,024 - - - - 12,067
Guarantees - 124 - - - - 124
Other contingent liabilities - 209 - - - - 209
TTotal off balance sheet items 11,043 1,357 - - - - 12,400

Notes to the Financial StatementsFor the year ended 30 June 2016
AASB Bank Limited 79
551 CConcentrations of Funding
The following tables present the Banking Group's concentrations of funding, which are reported by industry and geographic region.
ANZSIC codes have been used as the basis for disclosing industry sectors.
$ millions Banking Group
AAs at 30 June 22016 2015
TTotal funding comprises:
Deposits and other public borrowings 554,702 52,163
Due to financial institutions 5580 3,523
Other liabilities at fair value through Income Statement 11,340 180
Debt issues:
At fair value through Income Statement 11,646 1,213
At amortised cost 113,431 11,076
Loan capital 4423 414
TTotal funding 772,122 68,569
CConcentration by industry
Agricultural, forestry and fishing 7741 835
Government and public authorities 11,512 2,006
Property and business services 66,256 5,397
Finance and insurance 221,369 20,545
Utilities 2207 362
Transport and storage 9937 800
Personal 337,031 34,557
Other commercial and industrial 44,069 4,067
TTotal funding by industry 772,122 68,569
CConcentration by geographic region
New Zealand 557,224 54,052
Overseas 114,898 14,517
TTotal funding by geographic region 772,122 68,569
52 Events after the Reporting Period
Refer to note 8 for details of perpetual preference and ordinary dividends declared after the reporting period.
There were no other events subsequent to the reporting period which would materially affect the financial statements.

Additional Disclosures (To be read in conjunction with the Financial Statements)
880 ASB Bank Limited
CConditions of Registration for ASB Bank Limited, applicable on and after 1 November 2015.
The registration of ASB Bank Limited (the "Bank") as a registered bank is subject to the following conditions:
1. That:
(a) the Total capital ratio of the Banking Group is not less than 8%;
(b) the Tier One capital ratio of the Banking Group is not less than 6%;
(c) the Common Equity Tier One capital ratio of the Banking Group is not less than 4.5%;
(d) the Total capital of the Banking Group is not less than $30 million;
(e) the Bank must not include the amount of an Additional Tier One capital instrument or Tier Two capital instrument issued after 1 January 2013 in the calculation of its capital ratios unless it has received a notice of non-objection to the instrument from the Reserve Bank; and
(f) the Bank meets the requirements of Part 3 of the Reserve Bank of New Zealand document Application requirements for capital recognition or repayment and notification requirements in respect of capital (BS16) dated November 2015 in respect of regulatory capital instruments.
For the purposes of this condition of registration:
● the scalar referred to in the Reserve Bank of New Zealand document Capital Adequacy Framework (Internal Models Based Approach) (BS2B) dated November 2015 is 1.06;
● "Total capital ratio", "Tier One capital ratio", "Common Equity Tier One capital ratio", and "Total capital" must be calculated in accordance with the Reserve Bank of New Zealand document Capital Adequacy Framework (Internal Models Based Approach) (BS2B) dated November 2015;
● an Additional Tier One capital instrument is an instrument that meets the requirements of subsection 2.13(a) or (c) of the Reserve Bank of New Zealand document Capital Adequacy Framework (Internal Models Based Approach) (BS2B) dated November 2015; and
● a Tier Two capital instrument is an instrument that meets the requirements of subsection 2.16(a) or (c) of the Reserve Bank of New Zealand document Capital Adequacy Framework (Internal Models Based Approach) (BS2B) dated November 2015.
1A. That:
(a) the Bank has an internal capital adequacy assessment process ("ICAAP") that accords with the requirements set out in the document Guidelines on a Bank's Internal Capital Adequacy Assessment Process ("ICAAP") (BS12) dated December 2007;
(b) under its ICAAP the Bank identifies and measures its "other material risks" defined as all material risks of the Banking Group that are not explicitly captured in the calculation of Common Equity Tier One capital ratio, the Tier One capital ratio and the Total capital ratio under the requirements set out in the document Capital Adequacy Framework (Internal Models Based Approach) (BS2B) dated November 2015; and
(c) the Bank determines an internal capital allocation for each identified and measured "other material risk".
1B. That the Banking Group complies with all requirements set out in the Reserve Bank of New Zealand document Capital Adequacy Framework (Internal Models Based Approach) (BS2B) dated November 2015.
1C. That, if the buffer ratio of the Banking Group is 2.5% or less, the Bank must:
(a) according to the following table, limit the aggregate distributions of the Bank’s earnings to the percentage limit to distributions that corresponds to the Banking Group's buffer ratio:
Banking Group's buffer ratio Percentage limit to distributions of the Bank's earnings
0% - 0.625% 0%
>0.625% - 1.25% 20%
>1.25% - 1.875% 40%
>1.875% - 2.5% 60%
(b) prepare a capital plan to restore the Banking Group's buffer ratio to above 2.5% within any timeframe determined by the Reserve Bank for restoring the buffer ratio; and
(c) have the capital plan approved by the Reserve Bank.
For the purposes of this condition of registration:
● "buffer ratio", "distributions", and "earnings" have the same meaning as in Part 3 of the Reserve Bank of New Zealand document Capital Adequacy Framework (Internal Models Based Approach) (BS2B) dated November 2015; and
● the scalar referred to in the Reserve Bank of New Zealand document Capital Adequacy Framework (Internal Models Based Approach) (BS2B) dated November 2015 is 1.06.
2. That the Banking Group does not conduct any non-financial activities that in aggregate are material relative to its total activities.
In this condition of registration, the meaning of "material" is based on generally accepted accounting practice.

Additional Disclosures (To be read in conjunction with the Financial Statements)
(1) This table uses the rating scales of Standard & Poor's, Fitch Ratings and Moody's Investors Service. (Fitch Ratings' scale is identical to Standard & Poor's.)
AASB Bank Limited 81
CConditions of Registration for ASB Bank Limited, applicable on and after 1 November 2015 (continued)
3. That the Banking Group's insurance business is not greater than 1% of its total consolidated assets.
For the purposes of this condition of registration, the Banking Group's insurance business is the sum of the following amounts for entities in the Banking Group:
(a) if the business of an entity predominantly consists of insurance business and the entity is not a subsidiary of another entity in the Banking Group whose business predominantly consists of insurance business, the amount of the insurance business to sum is the total consolidated assets of the group headed by the entity; and
(b) if the entity conducts insurance business and its business does not predominantly consist of insurance business and the entity is not a subsidiary of another entity in the Banking Group whose business predominantly consists of insurance business, the amount of the insurance business to sum is the total liabilities relating to the entity's insurance business plus the equity retained by the entity to meet the solvency or financial soundness needs of its insurance business.
In determining the total amount of the Banking Group's insurance business:
(a) all amounts must relate to on balance sheet items only, and must comply with generally accepted accounting practice; and
(b) if products or assets of which an insurance business is comprised also contain a non-insurance component, the whole of such products or assets must be considered part of the insurance business.
For the purposes of this condition of registration:
● "insurance business" means the undertaking or assumption of liability as an insurer under a contract of insurance; and
● "insurer" and "contract of insurance" have the same meaning as provided in sections 6 and 7 of the Insurance (Prudential Supervision) Act 2010.
4. That the aggregate credit exposures (of a non-capital nature and net of any allowances for impairment) of the Banking Group to all connected persons do not exceed the rating contingent limit outlined in the following matrix:
Connected Exposure Limit
Credit Rating of the Bank(1) (Percentage of the Banking Group's Tier One Capital)
AA/Aa2 and above 75
AA-/Aa3 70
A+/A1 60
A/A2 40
A-/A3 30
BBB+/Baa1 and below 15
Within the rating-contingent limit, credit exposures (of a non-capital nature and net of any allowances for impairment) to non-bank connected persons shall not exceed 15% of the Banking Group's Tier One Capital.
For the purposes of this condition of registration, compliance with the rating-contingent connected exposure limit is determined in accordance with the Reserve Bank of New Zealand document entitled “Connected Exposures Policy” (BS8) dated November 2015.
5. That exposures to connected persons are not on more favourable terms (e.g. as relates to such matters as credit assessment, tenor, interest rates, amortisation schedules and requirement for collateral) than corresponding exposures to non-connected persons.
6. That the Bank complies with the following corporate governance requirements:
(a) the Board of the Bank must have at least five directors;
(b) the majority of the Board members must be non-executive directors;
(c) at least half of the Board members must be independent directors;
(d) an alternate director:
(i) for a non-executive director must be non-executive; and
(ii) for an independent director must be independent;
(e) at least half of the independent directors of the Bank must be ordinarily resident in New Zealand;
(f) the chairperson of the Board of the Bank must be independent; and
(g) the Bank's constitution must not include any provision permitting a director, when exercising powers or performing duties as a director, to act other than in what he or she believes is the best interests of the company (i.e. the Bank).
For the purposes of this condition of registration, "non-executive" and "independent" have the same meaning as in the Reserve Bank of New Zealand document entitled Corporate Governance (BS14) dated July 2014.

Additional Disclosures (To be read in conjunction with the Financial Statements)
882 ASB Bank Limited
CConditions of Registration for ASB Bank Limited, applicable on and after 1 November 2015 (continued)
7. That no appointment of any Director, Chief Executive Officer, or Executive who reports or is accountable directly to the Chief Executive Officer is made in respect of the Bank unless:
(a) the Reserve Bank has been supplied with a copy of the curriculum vitae of the proposed appointee; and
(b) the Reserve Bank has advised that it has no objection to that appointment.
8. That a person must not be appointed as chairperson of the Board of the Bank unless:
(a) the Reserve Bank has been supplied with a copy of the curriculum vitae of the proposed appointee; and
(b) the Reserve Bank has advised that it has no objection to that appointment.
9. That the Bank has a Board audit committee, or other separate Board committee covering audit matters, that meets the following requirements:
(a) the mandate of the committee must include: ensuring the integrity of the Bank's financial controls, reporting systems and internal audit standards;
(b) the committee must have at least three members;
(c) every member of the committee must be a non-executive director of the Bank;
(d) the majority of the members of the committee must be independent; and
(e) the chairperson of the committee must be independent and must not be the chairperson of the Bank.
For the purposes of this condition of registration, "non-executive" and "independent" have the same meaning as in the Reserve Bank of New Zealand document entitled Corporate Governance (BS14) dated July 2014.
10. That a substantial proportion of the Bank's business is conducted in and from New Zealand.
11. That the Bank has legal and practical ability to control and execute any business, and any functions relating to any business, of the Bank that are carried on by a person other than the Bank, sufficient to achieve, under normal business conditions and in the event of stress or failure of the Bank or of a service provider to the Bank, the following outcomes:
(a) that the Bank's clearing and settlement obligations due on a day can be met on that day;
(b) that the Bank's financial risk positions on a day can be identified on that day;
(c) that the Bank's financial risk positions can be monitored and managed on the day following any failure and on subsequent days; and
(d) that the Bank's existing customers can be given access to payments facilities on the day following any failure and on subsequent days.
For the purposes of this condition of registration, the term "legal and practical ability to control and execute" is explained in the Reserve Bank of New Zealand document entitled Outsourcing Policy (BS11) dated January 2006.
12. That:
(a) the business and affairs of the Bank are managed by, or under the direction or supervision of, the Board of the Bank;
(b) the employment contract of the Chief Executive Officer of the Bank or person in an equivalent position (together "CEO") is with the Bank, and the terms and conditions of the CEO's employment agreement are determined by, and any decisions relating to the employment or termination of employment of the CEO are made by, the Board of the Bank; and
(c) all staff employed by the Bank will have their remuneration determined by (or under the delegated authority of) the Board or the CEO of the Bank and be accountable (directly or indirectly) to the CEO of the Bank.
13. That the Banking Group complies with the following quantitative requirements for liquidity-risk management:
(a) the one-week mismatch ratio of the Banking Group is not less than 0% at the end of each business day;
(b) the one-month mismatch ratio of the Banking Group is not less than 0% at the end of each business day; and
(c) the one-year core funding ratio of the Banking Group is not less than 75% at the end of each business day.
For the purposes of this condition of registration, except to the extent modified by condition of registration 13A, the Bank must calculate the Banking Group's one-week mismatch ratio, one-month mismatch ratio and one-year core funding ratio in accordance with the Reserve Bank of New Zealand documents entitled Liquidity Policy (BS13) dated July 2014 and Liquidity Policy Annex: Liquid Assets (BS13A) dated December 2011.

Additional Disclosures (To be read in conjunction with the Financial Statements)
AASB Bank Limited 83
CConditions of Registration for ASB Bank Limited, applicable on and after 1 November 2015 (continued)
13A. That when calculating the Banking Group's one-year core funding ratio for the purposes of condition of registration 13, the Bank must use the following formula instead of the formula in paragraph 39 of the Reserve Bank of New Zealand document entitled Liquidity Policy (BS13) dated July 2014:
One year core funding dollar amount =
all funding with residual maturity longer than 1 year, including subordinated debt and related party funding;
+ 50% of any tradable debt securities issued by the Bank with original maturity of 2 years or more and with residual maturity at the reporting date of more than 6 months and not more than 1 year;
+ 50% of the amount of any term deposits placed with the Bank by Commonwealth Bank of Australia before 1 January 2010, having original maturity of 2 years or more, and having residual maturity at the reporting date of more than 6 months and not more than 1 year;
+ non-market funding that is withdrawable at sight or with residual maturity less than or equal to 1 year, applying the percentages in Table 2 to such funding falling with each size band;
+ Tier One capital.
14. That the Bank has an internal framework for liquidity risk management that is adequate in the Bank's view for managing the Bank's liquidity risk at a prudent level, and that, in particular:
(a) is clearly documented and communicated to all those in the organisation with responsibility for managing liquidity and liquidity risk;
(b) identifies responsibility for approval, oversight and implementation of the framework and policies for liquidity risk management;
(c) identifies the principal methods that the Bank will use for measuring, monitoring and controlling liquidity risk; and
(d) considers the material sources of stress that the Bank might face, and prepares the Bank to manage stress through a contingency funding plan.
15. That no more than 10% of total assets may be beneficially owned by a SPV.
For the purpose of this condition:
● "total assets" means all assets of the Banking Group plus any assets held by any SPV that are not included in the Banking Group's assets;
● "SPV" means a person:
(a) to whom any member of the Banking Group has sold, assigned, or otherwise transferred any asset;
(b) who has granted, or may grant, a security interest in its assets for the benefit of any holder of any covered bond; and
(c) who carries on no other business except for that necessary or incidental to guarantee the obligations of any member of the Banking Group under a covered bond:
● "covered bond" means a debt security issued by any member of the Banking Group, for which repayment to holders is guaranteed by a SPV, and investors retain an unsecured claim on the issuer.
16. That:
(a) no member of the Banking Group may give effect to a qualifying acquisition or business combination that meets the notification threshold, and does not meet the non-objection threshold, unless:
(i) the Bank has notified the Reserve Bank in writing of the intended acquisition or business combination and at least 10 working days have passed; and
(ii) at the time of notifying the Reserve Bank of the intended acquisition or business combination, the Bank provided the Reserve Bank with the information required under the Reserve Bank of New Zealand Banking Supervision Handbook document Significant Acquisitions Policy (BS15) dated December 2011; and
(b) no member of the Banking Group may give effect to a qualifying acquisition or business combination that meets the non-objection threshold unless:
(i) the Bank has notified the Reserve Bank in writing of the intended acquisition or business combination;
(ii) at the time of notifying the Reserve Bank of the intended acquisition or business combination, the Bank provided the Reserve Bank with the information required under the Reserve Bank of New Zealand Banking Supervision Handbook document Significant Acquisitions Policy (BS15) dated December 2011; and
(iii) the Reserve Bank has given the Bank a notice of non-objection to the significant acquisition or business combination.
For the purposes of this condition of registration, "qualifying acquisition or business combination", "notification threshold" and "non-objection threshold" have the same meaning as in the Reserve Bank of New Zealand Banking Supervision Handbook document Significant Acquisitions Policy (BS15) dated December 2011.
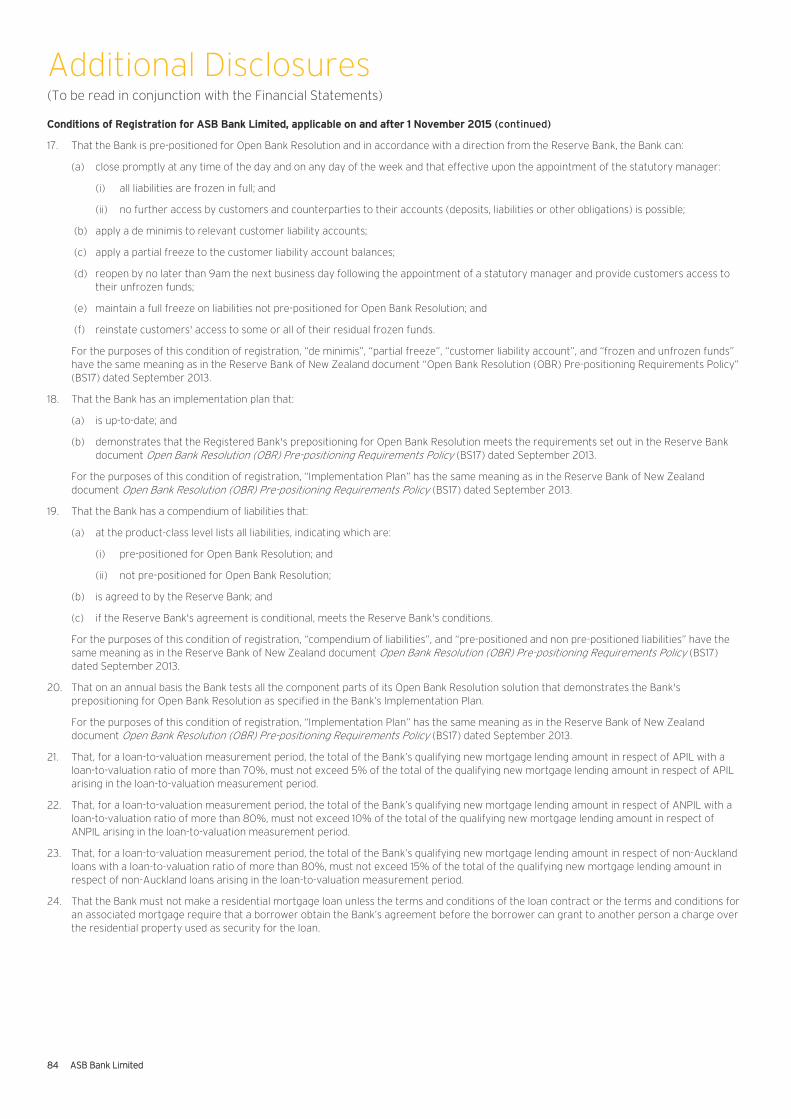
Additional Disclosures (To be read in conjunction with the Financial Statements)
884 ASB Bank Limited
CConditions of Registration for ASB Bank Limited, applicable on and after 1 November 2015 (continued)
17. That the Bank is pre-positioned for Open Bank Resolution and in accordance with a direction from the Reserve Bank, the Bank can:
(a) close promptly at any time of the day and on any day of the week and that effective upon the appointment of the statutory manager:
(i) all liabilities are frozen in full; and
(ii) no further access by customers and counterparties to their accounts (deposits, liabilities or other obligations) is possible;
(b) apply a de minimis to relevant customer liability accounts;
(c) apply a partial freeze to the customer liability account balances;
(d) reopen by no later than 9am the next business day following the appointment of a statutory manager and provide customers access to their unfrozen funds;
(e) maintain a full freeze on liabilities not pre-positioned for Open Bank Resolution; and
(f) reinstate customers' access to some or all of their residual frozen funds.
For the purposes of this condition of registration, “de minimis”, “partial freeze”, “customer liability account”, and “frozen and unfrozen funds” have the same meaning as in the Reserve Bank of New Zealand document “Open Bank Resolution (OBR) Pre-positioning Requirements Policy” (BS17) dated September 2013.
18. That the Bank has an implementation plan that:
(a) is up-to-date; and
(b) demonstrates that the Registered Bank's prepositioning for Open Bank Resolution meets the requirements set out in the Reserve Bank document Open Bank Resolution (OBR) Pre-positioning Requirements Policy (BS17) dated September 2013.
For the purposes of this condition of registration, “Implementation Plan” has the same meaning as in the Reserve Bank of New Zealand document Open Bank Resolution (OBR) Pre-positioning Requirements Policy (BS17) dated September 2013.
19. That the Bank has a compendium of liabilities that:
(a) at the product-class level lists all liabilities, indicating which are:
(i) pre-positioned for Open Bank Resolution; and
(ii) not pre-positioned for Open Bank Resolution;
(b) is agreed to by the Reserve Bank; and
(c) if the Reserve Bank's agreement is conditional, meets the Reserve Bank's conditions.
For the purposes of this condition of registration, “compendium of liabilities”, and “pre-positioned and non pre-positioned liabilities” have the same meaning as in the Reserve Bank of New Zealand document Open Bank Resolution (OBR) Pre-positioning Requirements Policy (BS17) dated September 2013.
20. That on an annual basis the Bank tests all the component parts of its Open Bank Resolution solution that demonstrates the Bank's prepositioning for Open Bank Resolution as specified in the Bank’s Implementation Plan.
For the purposes of this condition of registration, “Implementation Plan” has the same meaning as in the Reserve Bank of New Zealand document Open Bank Resolution (OBR) Pre-positioning Requirements Policy (BS17) dated September 2013.
21. That, for a loan-to-valuation measurement period, the total of the Bank’s qualifying new mortgage lending amount in respect of APIL with a loan-to-valuation ratio of more than 70%, must not exceed 5% of the total of the qualifying new mortgage lending amount in respect of APIL arising in the loan-to-valuation measurement period.
22. That, for a loan-to-valuation measurement period, the total of the Bank’s qualifying new mortgage lending amount in respect of ANPIL with a loan-to-valuation ratio of more than 80%, must not exceed 10% of the total of the qualifying new mortgage lending amount in respect of ANPIL arising in the loan-to-valuation measurement period.
23. That, for a loan-to-valuation measurement period, the total of the Bank’s qualifying new mortgage lending amount in respect of non-Auckland loans with a loan-to-valuation ratio of more than 80%, must not exceed 15% of the total of the qualifying new mortgage lending amount in respect of non-Auckland loans arising in the loan-to-valuation measurement period.
24. That the Bank must not make a residential mortgage loan unless the terms and conditions of the loan contract or the terms and conditions for an associated mortgage require that a borrower obtain the Bank’s agreement before the borrower can grant to another person a charge over the residential property used as security for the loan.
Additional Disclosures (To be read in conjunction with the Financial Statements)
AASB Bank Limited 85
CConditions of Registration for ASB Bank Limited, applicable on and after 1 November 2015 (continued)
In these Conditions of Registration:
“Bank” means ASB Bank Limited (as reporting entity).
"Banking Group" means ASB Bank Limited (as reporting entity) and all other entities included in the group as defined in section 6(1) of the Financial Markets Conduct Act 2013 for the purposes of part 7 of that Act.
“generally accepted accounting practice” has the same meaning as in section 8 of the Financial Reporting Act 2013.
In conditions of registration 21 to 24:
“ANPIL”, “APIL”, “loan-to-valuation ratio”, “non-Auckland loan”, “qualifying new mortgage lending amount in respect of […]” and “residential mortgage loan” have the same meaning as in the Reserve Bank of New Zealand document entitled Framework for Restrictions on High-LVR Residential Mortgage Lending (BS19) dated November 2015:
“Loan-to-valuation measurement period” means:
● the six calendar month period ending on the last day of April 2016; and
● thereafter a period of three calendar months ending on the last day of the third calendar month, the first of which ends on the last day of May 2016.
Changes to Conditions of Registration
Since 30 June 2015 the Conditions of Registration have been amended by the RBNZ with effect from 1 November 2015. Certain amendments were made to reflect changes to the high loan-to-valuation speed limits applying to lending secured by Auckland investment properties and lending secured by residential properties outside of Auckland. Other amendments included the requirement for a non-objection notice from the RBNZ in relation to certain capital instruments and updated references to revised versions of various RBNZ documents.
As at 30 June 2016, there have been no other changes to the Conditions of Registration.

Directors’ Statement
886 ASB Bank Limited
AAfter due enquiry by the Directors, it is each Director's opinion that for the year ended 30 June 2016:
● the Banking Group complied with the Conditions of Registration imposed by the Reserve Bank of New Zealand under section 74 of the Reserve Bank of New Zealand Act 1989;
● credit exposures to connected persons were not contrary to the interests of the Banking Group; and
● the Banking Group had systems in place to adequately monitor and control the Banking Group's credit risk, concentration of credit risk, interest rate risk, currency risk, equity risk, liquidity risk, operational risk and other material business risks and that those systems are being properly applied.
After due enquiry by the Directors, it is each Director's opinion that as at the date of this Disclosure Statement:
● the Disclosure Statement contains all the information required by the Registered Bank Disclosure Statements (New Zealand Incorporated Registered Banks) Order 2014 (as amended); and
● the Disclosure Statement is not false or misleading.
The Disclosure Statement is signed by or on behalf of all the Directors.
G.R. Walker S.R.S. Blair B.J. Chapman
M.B. Coomer J.L. Freeman J.P. Hartley
C.M. McDowell V.A.J. Shortt R.M. Spaans
A.L. Toevs T.M. Walsh
10 August 2016
S.R.S. Blair B.J. Chapman
M.B. Coomer J.J.LJ.L. Freeman J PJJ Hartley
C.M. MMMcDoc well
A.L. Toevs
V.A.J. Shortt R.M. Spaans
J.PJ.PJ.PJ.P. H. H. HHartartartleyleyley
T.M. Walsh

Independent Auditor’s Report
AASB Bank Limited 87
PricewaterhouseCoopers, 188 Quay Street, Private Bag 92162, Auckland 1142, New Zealand T: +64 (9) 355 8000, F: +64 (9) 355 8001, www.pwc.com/nz
Independent Auditor’s Report To the shareholder of ASB Bank Limited Report on the Financial Statements (excluding the Supplementary Information Relating to Capital Adequacy) We have audited pages 13 to 79 of the full year Disclosure Statement of ASB Bank Limited (the “Bank”), which includes the financial statements required by Clause 24 of the Registered Bank Disclosure Statements (New Zealand Incorporated Registered Banks) Order 2014 (as amended) (the “Order”) and the supplementary information required by Schedules 4, 7, 13, 14, 15 and 17 of the Order. The financial statements comprise the balance sheet as at 30 June 2016, the income statement, the statement of comprehensive income, the statement of changes in equity and the cash flow statement for the year then ended, and a summary of significant accounting policies and other explanatory information for the Banking Group. The Banking Group comprises the Bank and the entities it controlled at 30 June 2016 or from time to time during the financial year.
Directors’ Responsibility for the Financial Statements (excluding the Supplementary Information Relating to Capital Adequacy) The Directors of the Bank (the “Directors”) are responsible on behalf of the Bank, for the Disclosure Statement, which includes financial statements prepared in accordance with Clause 24 of the Order and generally accepted accounting practice in New Zealand and that give a true and fair view of the matters to which they relate. The Directors are also responsible, on behalf of the Bank, for such internal controls as the Directors determine are necessary to enable the preparation of financial statements that are free from material misstatement, whether due to fraud or error.
In addition, the Directors are responsible on behalf of the Bank, for including information in the Disclosure Statement which complies with Schedules 2, 4, 7, 13, 14, 15 and 17 of the Order.
Auditor’s Responsibility (excluding the Supplementary Information Relating to Capital Adequacy) Our responsibility is to express an opinion on the financial statements and the supplementary information disclosed in accordance with Clause 24 and Schedules 4, 7, 13, 14, 15 and 17 of the Order based on our audit. We conducted our audit in accordance with International Standards on Auditing (New Zealand) and International Standards on Auditing. These standards require that we comply with relevant ethical requirements and plan and perform the audit to obtain reasonable assurance about whether the financial statements are free from material misstatement.
An audit involves performing procedures to obtain audit evidence about the amounts and disclosures in the financial statements. The procedures selected depend on the auditor’s judgement, including the assessment of the risks of material misstatement of the financial statements, whether due to fraud or error. In making those risk assessments, the auditor considers the internal controls relevant to the Banking Group’s preparation of financial statements that give a true and fair view of the matters to which they relate, in order to design audit procedures that are appropriate in the circumstances, but not for the purpose of expressing an opinion on the effectiveness of the Banking Group’s internal control. An audit also includes evaluating the appropriateness of accounting policies used and the reasonableness of accounting estimates, as well as evaluating the overall presentation of the financial statements.
We believe that the audit evidence we have obtained is sufficient and appropriate to provide a basis for our audit opinion.
We are independent of the Bank and the Banking Group. We carry out other assignments on behalf of the Bank and the Banking Group for audit-related services relating to funds managed by the Banking Group and for other assurance and advisory services. In addition, certain partners and employees of our firm may deal with the Bank and the Banking Group on normal terms within the ordinary course of trading activities of the Bank and the Banking Group. These matters have not impaired our independence. We have no other interests in the Bank or the Banking Group.
Opinion In our opinion, the financial statements on pages 13 to 79 (excluding the supplementary information included in the balance sheet and Notes 15 to 20, 42, 43 and 45 to 51): (i) comply with generally accepted accounting practice in New Zealand; (ii) comply with International Financial Reporting Standards; and (iii) give a true and fair view of the financial position of the Banking Group as at 30 June 2016, and its financial
performance and cash flows for the year then ended. In our opinion, the supplementary information prescribed by Schedules 4, 7, 13, 14, 15 and 17 of the Order fairly states, in all material respects, the matters to which it relates in accordance with those Schedules.

Independent Auditor’s Report (continued)
888 ASB Bank Limited
Independent Auditor’s Report ASB Bank Limited Report on Other Legal and Regulatory Requirements (excluding the Supplementary Information Relating to Capital Adequacy) We also report in accordance with the requirements of Clauses 2(1)(d) and 2(1)(e) of Schedule 1 of the Order. In relation to our audit of the financial statements (excluding the supplementary information relating to capital adequacy disclosed in Note 42) for the year ended 30 June 2016: (i) we have obtained all the information and explanations that we have required; and (ii) in our opinion, proper accounting records have been kept by the Banking Group as far as appears from an
examination of those records.
Report on the Supplementary Information Relating to Capital Adequacy We have reviewed the supplementary information relating to capital adequacy required by Schedule 11 of the Order as disclosed in Note 42 of the financial statements of the Banking Group for the year ended 30 June 2016.
Directors’ Responsibility for the Supplementary Information Relating to Capital Adequacy The Directors are responsible on behalf of the Bank, for the preparation of the supplementary information relating to capital adequacy that is prepared in accordance with the Bank’s conditions of registration and the Bank’s internal models for credit risk and operational risk as accredited by the Reserve Bank of New Zealand and is disclosed in accordance with Schedule 11 of the Order.
Auditor’s Responsibility for the Supplementary Information Relating to Capital Adequacy Our responsibility is to express an opinion on the supplementary information relating to capital adequacy, disclosed in Note 42, based on our review.
We conducted our review in accordance with the New Zealand Standard on Review Engagements 2410 Review of Financial Statements Performed by the Independent Auditor of the Entity (“NZ SRE 2410”). NZ SRE 2410 requires us to conclude whether anything has come to our attention that causes us to believe that the supplementary information relating to capital adequacy, disclosed in Note 42, is not, in all material respects:
(i) prepared in accordance with the Bank’s conditions of registration; (ii) prepared in accordance with the Bank’s internal models for credit risk and operational risk as accredited by the Reserve
Bank of New Zealand; and (iii) disclosed in accordance with Schedule 11 of the Order.
As the auditor of the Banking Group, NZ SRE 2410 requires that we comply with the ethical requirements relevant to the audit of the annual financial statements.
A review of the supplementary information in accordance with NZ SRE 2410 is a limited assurance engagement. The auditor performs procedures, primarily consisting of making enquiries, primarily of persons responsible for financial and accounting matters, and applying analytical and other review procedures. The procedures performed in a review are substantially less than those performed in an audit conducted in accordance with International Standards on Auditing (New Zealand). Accordingly we do not express an audit opinion on the supplementary information relating to capital adequacy.
Opinion Based on our review procedures, which are not an audit, nothing has come to our attention that causes us to believe that the supplementary information relating to capital adequacy disclosed in Note 42, as required by Schedule 11 of the Order, is not in all material respects: (i) prepared in accordance with the Bank’s conditions of registration; (ii) prepared in accordance with the Bank’s internal models for credit risk and operational risk as accredited by the
Reserve Bank of New Zealand; and (iii) disclosed in accordance with Schedule 11 of the Order.
Restriction on Use of our Report This report is made solely to the Bank’s shareholder. Our work has been undertaken so that we might state to the Bank’s shareholder those matters which we are required to state to the Bank’s shareholder in an auditor’s report and for no other purpose. To the fullest extent permitted by law, we do not accept or assume responsibility to anyone other than the Bank and the Bank’s shareholder, for our audit work, for this report, or for the opinions we have formed.
Chartered Accountants Auckland 10 August 2016

Directory
AASB Bank Limited 89
IINDEPENDENT DIRECTORS SHAREHOLDER REPRESENTATIVES
G.R. (Gavin) Walker (Chairman) S.R.S. (Simon) Blair B.C.A. B.A. (Hons), GradDip.B.A., M.Sc.Director Bank ExecutiveAuckland, New Zealand London, United KingdomExternal Directorships: External Directorships:Australian Investment Exchange Limited, Commonwealth Bank of Hangzhou Co. Limited, BoCommlife Insurance Company Limited, Securities Limited, Great Northern Developments Limited, Sovereign Assurance Company Limited, Lion Pty Limited, Lion Nathan Nominees Limited, The British United Provident Association Limited Sovereign Assurance Company Limited,Walker Consulting Group Limited V.A.J. (Vittoria) Shortt
BMS, C.A.J.P. (Jon) Hartley (Deputy Chairman) Bank ExecutiveB.A. (Hons), F.C.A., A.C.A., F.A.I.C.D. Sydney, Australia Director External Directorships:Wellington, New Zealand NoneExternal Directorships: Chorus Limited, Mission Foods Limited, Mission Residential Care A.L. (Alden) ToevsLimited, Sovereign Assurance Company Limited, Ph.D.VisionFund International Limited, VisionFund Myanmar Limited Bank Executive Sydney, AustraliaM.B. (Michael) Coomer External Directorships:B.Eng. (Electrical) NoneDirector Singapore EXECUTIVE DIRECTORExternal Directorships: B.J. (Barbara) ChapmanDC123 Pty Limited, Volare Investment Pte Limited, (Managing Director and Chief Executive Officer)MyFuture Online Pte Limited B.Comm
Bank ExecutiveJ.L. (Jane) Freeman Auckland, New ZealandB.Com External Directorships:Director ASB Capital Limited, ASB Capital No. 2 Limited, ASB Funding Limited,Auckland, New Zealand ASB Holdings Limited, Sovereign Assurance Company Limited,External Directorships: Banking Ombudsman Scheme LimitedDelegat's Group Limited, Jane Freeman Consulting Limited,Foodstuffs North Island Limited, Kiwi Property Group Limited
C.M. (Catherine) McDowellB.A. (Hons), MDP, Dip. ManagementDirectorCambridge, New ZealandExternal Directorships: National Provident Fund, The Institute of Directors in New ZealandLimited, Annuitas Management Limited, Todd Family Office Limited, Courtenay Nominees Limited
R.M. (Michael) SpaansGradDip (Fin)Director, FarmerTe Aroha, New ZealandExternal Directorships: Fonterra Co-operative Group Limited, DairyNZ Limited, Shoof International Limited, Spaans Farms Limited,Spaans Advisory Services Limited, Dexcel Holdings Limited
T.M. (Therese) WalshB.C.A, F.C.ADirectorWellington, New ZealandExternal Directorships:Therese Walsh Consulting Limited, Air New Zealand Limited, NZX Limited, Television New Zealand Limited

Directory (continued)
990 ASB Bank Limited
AAUDIT AND RISK COMMITTEE J.P. (Jon) Hartley (Chairman)S.R.S. (Simon) BlairM.B. (Michael) CoomerJ.L. (Jane) FreemanC.M. (Catherine) McDowellV.A.J. (Vittoria) ShorttR.M. (Michael) SpaansA.L. (Alden) ToevsG.R. (Gavin) WalkerDame T.M. (Therese) Walsh
EXECUTIVE MANAGEMENT B.J. (Barbara) Chapman Chief Executive OfficerR.P. (Roger) Beaumont Executive General Manager Marketing and CommunicationsA.J.(Adam) Boyd Executive General Manager Wealth and InsuranceG.T. (Graeme) Edwards General Counsel and Company SecretaryR.D. (Russell) Jones Executive General Manager Technology and InnovationS.T. (Steipo) Jurkovich Executive General Manager Corporate, Commercial and RuralK.C. (Kevin) McDonald Chief Risk OfficerI. (Ian) Park Executive General Manager Retail and Business BankingJ.E. (Jon) Raby Chief Financial OfficerL.A. (Linley) Wood Executive General Manager Operations
INTERNAL AUDITOR C.M. (Christopher) de Wit Chief Internal Auditor
AUDITOR PricewaterhouseCoopersChartered AccountantsPwC Tower188 Quay StreetAuckland 1010New Zealandwww.pwc.com/nz
ULTIMATE SHAREHOLDER Commonwealth Bank of Australia(Ordinary Shares) Ground Floor, Tower 1
201 Sussex StreetSydney, NSWAustraliawww.commbank.com.au
REGISTERED OFFICE Level 2ASB North Wharf12 Jellicoe StreetAuckland 1010New Zealandwww.asb.co.nz


asb.co.nz ASB Bank Limited 6031 1302 0616