asean sustainable business leader - listed company · forecasted fy2017 capex & investments of...
TRANSCRIPT

Agenda:1. Key Drivers and Opportunities
2. Performance Summary and Key Indicators
3. Appendix
ASEAN Sustainable Business Leader
NDR in Canada & USA
June 5-9, 2017

P. 2
Information updated
Pages Details
5 Additional details on central Vietnam cement acquisition
6 Additional details on LSP project
7 - 8 SCG’s presence in Vietnam and Indonesia
14 - 18 Updated chemicals prices
23 Updated details on the ASEAN cement markets
P. 3
1. Key Drivers and Opportunities
P. 4
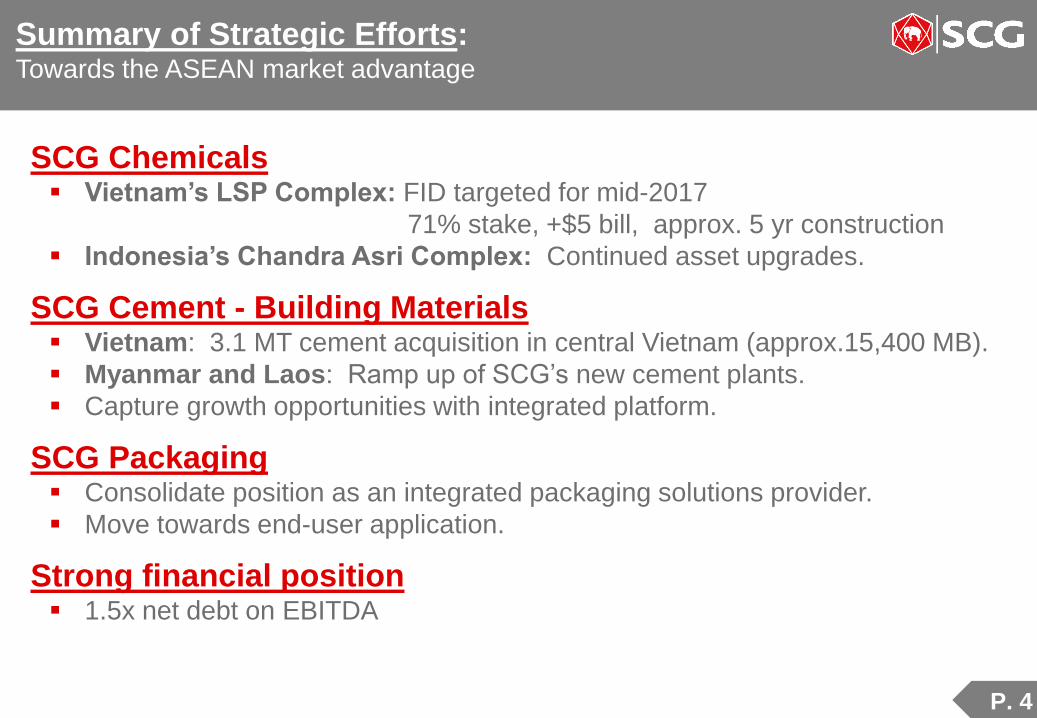
SCG Chemicals Vietnam’s LSP Complex: FID targeted for mid-2017
71% stake, +$5 bill, approx. 5 yr construction
Indonesia’s Chandra Asri Complex: Continued asset upgrades.
SCG Cement - Building Materials Vietnam: 3.1 MT cement acquisition in central Vietnam (approx.15,400 MB).
Myanmar and Laos: Ramp up of SCG’s new cement plants.
Capture growth opportunities with integrated platform.
SCG Packaging Consolidate position as an integrated packaging solutions provider.
Move towards end-user application.
Strong financial position 1.5x net debt on EBITDA
Summary of Strategic Efforts: Towards the ASEAN market advantage
P. 5
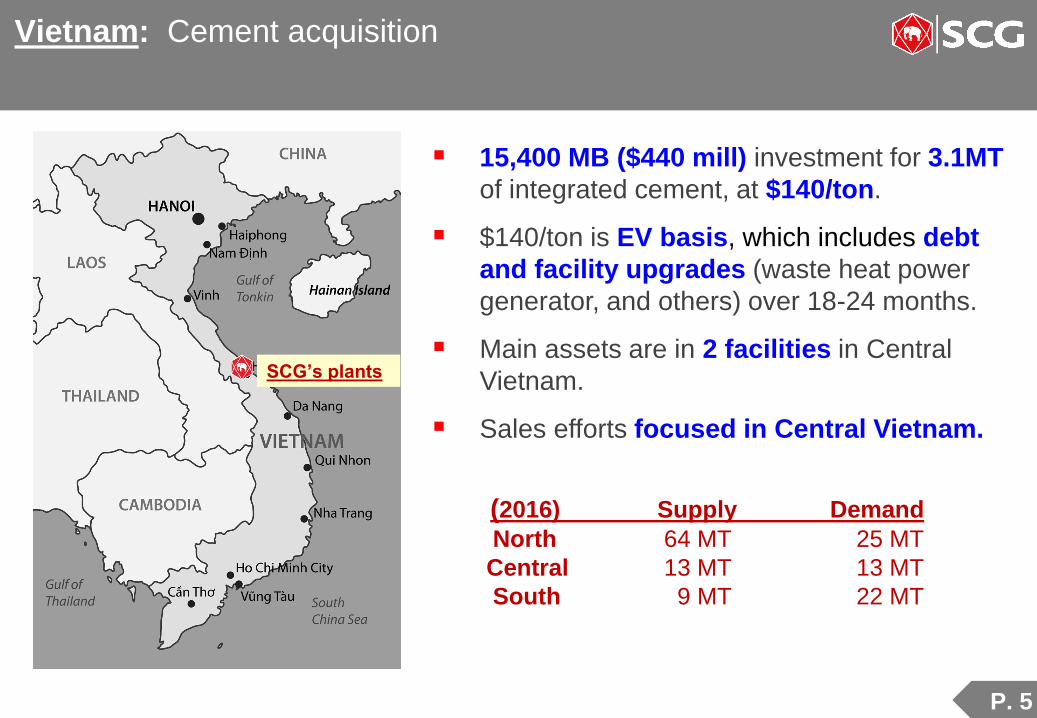
Vietnam: Cement acquisition
SCG’s plants
15,400 MB ($440 mill) investment for 3.1MT
of integrated cement, at $140/ton.
$140/ton is EV basis, which includes debt
and facility upgrades (waste heat power
generator, and others) over 18-24 months.
Main assets are in 2 facilities in Central
Vietnam.
Sales efforts focused in Central Vietnam.
(2016) Supply Demand
North 64 MT 25 MT
Central 13 MT 13 MT
South 9 MT 22 MT
P. 6
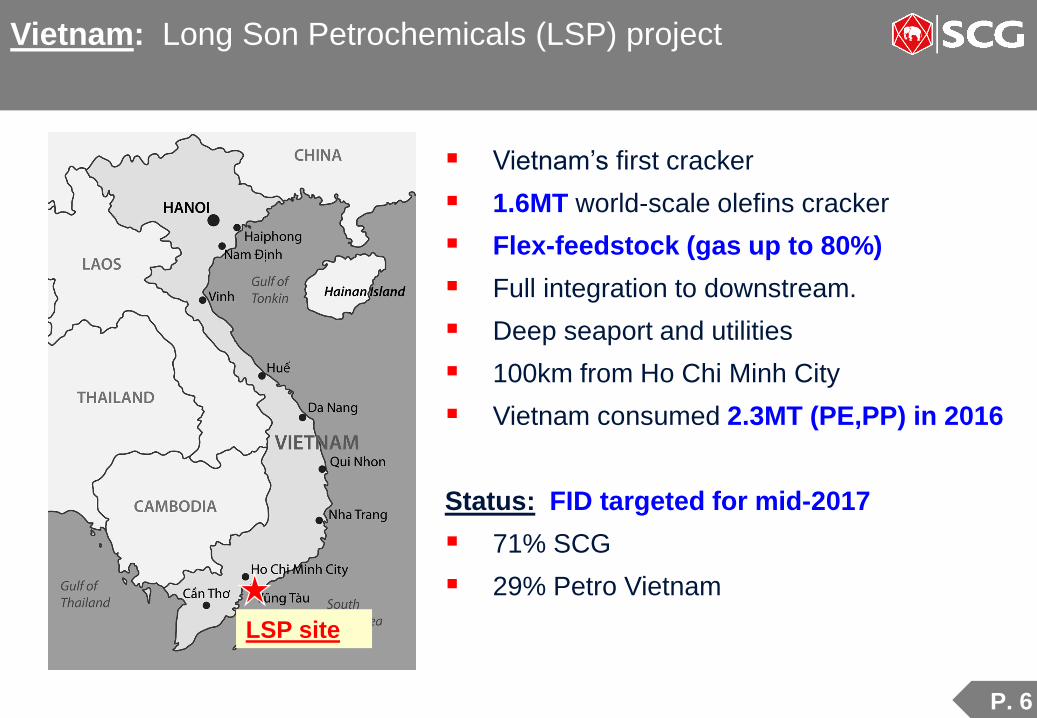
Vietnam: Long Son Petrochemicals (LSP) project
Vietnam’s first cracker
1.6MT world-scale olefins cracker
Flex-feedstock (gas up to 80%)
Full integration to downstream.
Deep seaport and utilities
100km from Ho Chi Minh City
Vietnam consumed 2.3MT (PE,PP) in 2016
Status: FID targeted for mid-2017
71% SCG
29% Petro Vietnam
LSP site
P. 7
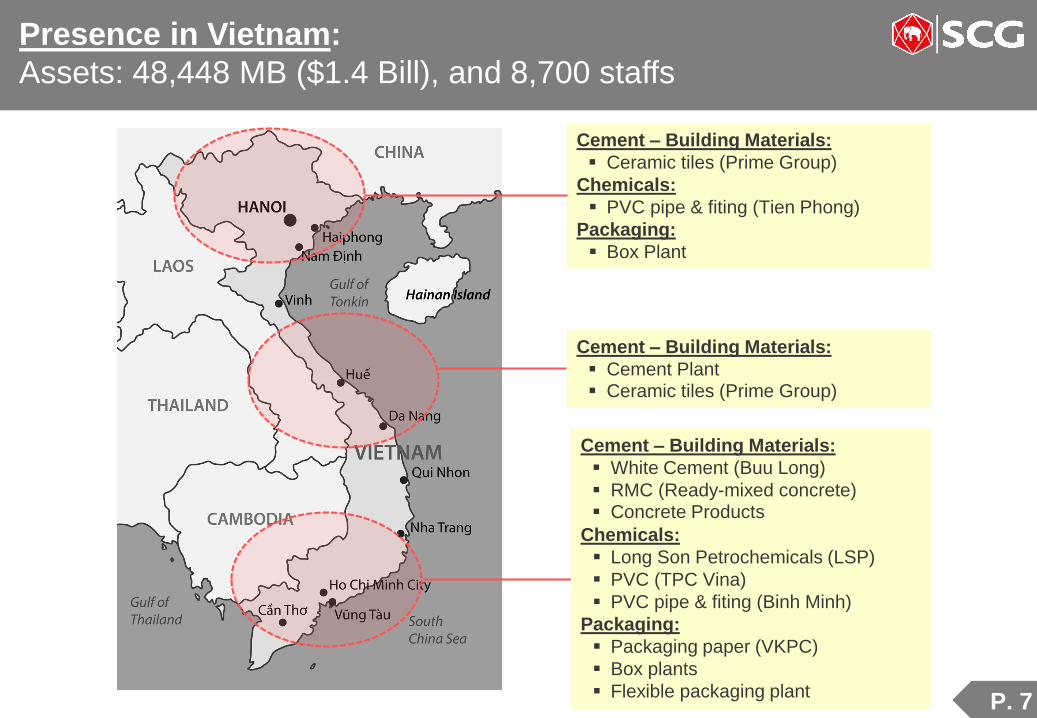
Cement – Building Materials:
Ceramic tiles (Prime Group)
Chemicals:
PVC pipe & fiting (Tien Phong)
Packaging:
Box Plant
Cement – Building Materials:
Cement Plant Ceramic tiles (Prime Group)
Presence in Vietnam:
Assets: 48,448 MB ($1.4 Bill), and 8,700 staffs
Cement – Building Materials:
White Cement (Buu Long)
RMC (Ready-mixed concrete) Concrete Products
Chemicals:
Long Son Petrochemicals (LSP)
PVC (TPC Vina)
PVC pipe & fiting (Binh Minh)
Packaging:
Packaging paper (VKPC)
Box plants
Flexible packaging plant
P. 8
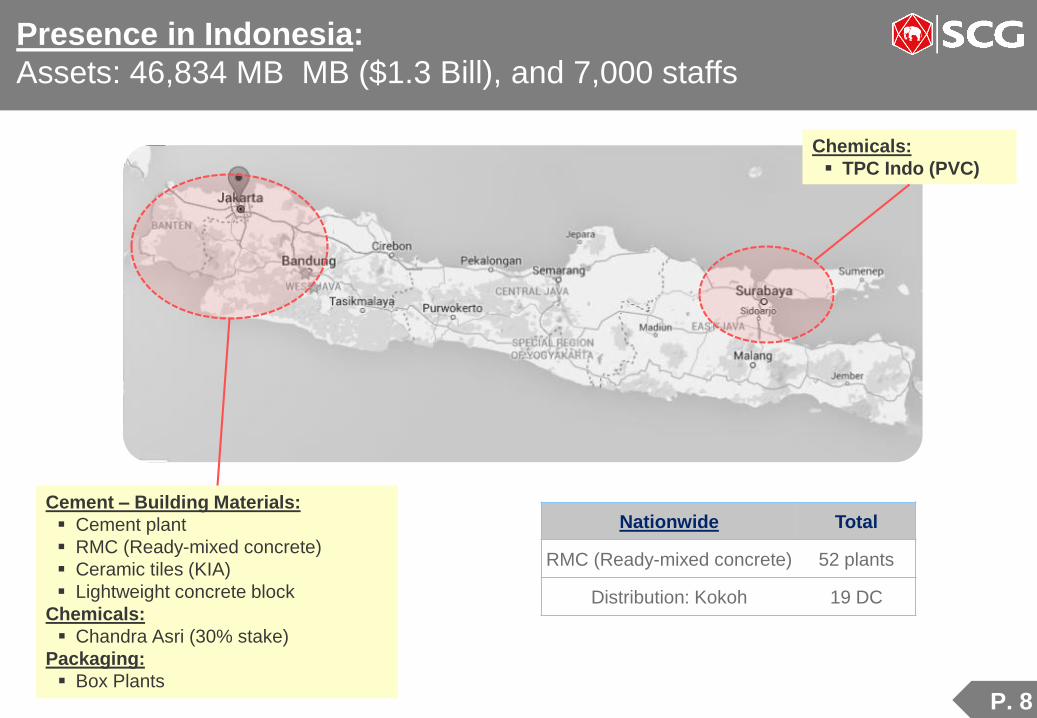
Cement – Building Materials:
Cement plant
RMC (Ready-mixed concrete)
Ceramic tiles (KIA)
Lightweight concrete block
Chemicals:
Chandra Asri (30% stake)
Packaging:
Box Plants
Chemicals:
TPC Indo (PVC)
Nationwide Total
RMC (Ready-mixed concrete) 52 plants
Distribution: Kokoh 19 DC
Presence in Indonesia:
Assets: 46,834 MB MB ($1.3 Bill), and 7,000 staffs
P. 9
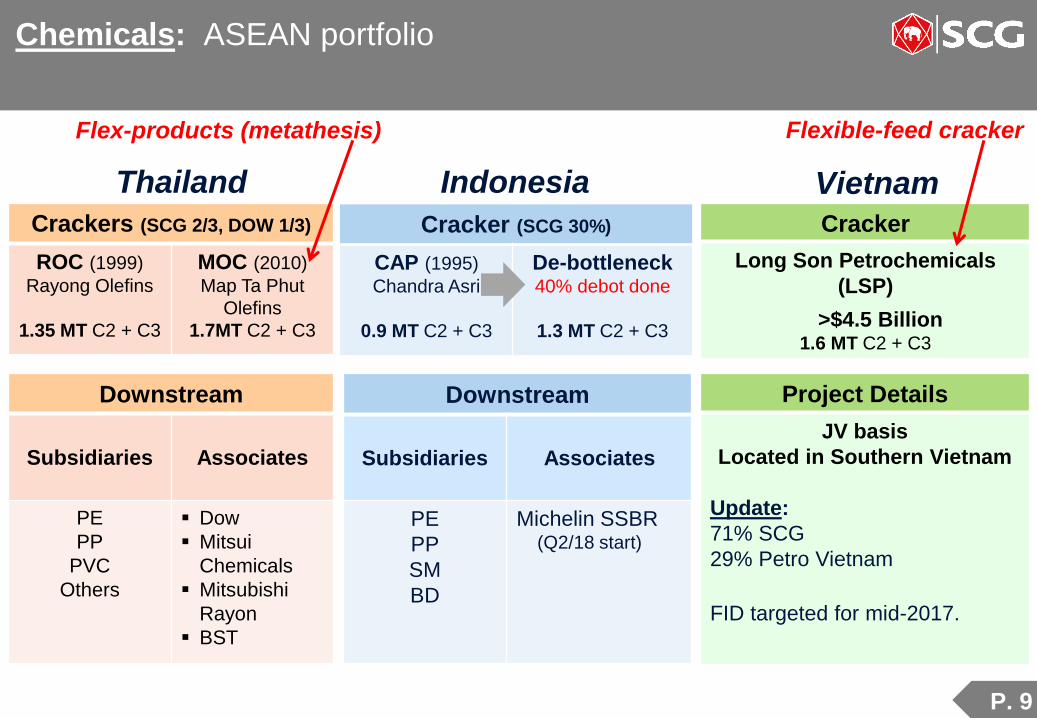
Chemicals: ASEAN portfolio
Flex-products (metathesis)
Thailand Vietnam
Crackers (SCG 2/3, DOW 1/3)
ROC (1999)
Rayong Olefins
1.35 MT C2 + C3
MOC (2010)
Map Ta Phut
Olefins
1.7MT C2 + C3
Downstream
Subsidiaries Associates
PE
PP
PVC
Others
Dow
Mitsui
Chemicals
Mitsubishi
Rayon
BST
Indonesia
Cracker (SCG 30%)
CAP (1995)
Chandra Asri
0.9 MT C2 + C3
De-bottleneck40% debot done
1.3 MT C2 + C3
Cracker
Long Son Petrochemicals
(LSP)
>$4.5 Billion1.6 MT C2 + C3
Downstream
Subsidiaries Associates
PE
PP
SM
BD
Michelin SSBR (Q2/18 start)
Project Details
JV basis
Located in Southern Vietnam
Update:
71% SCG
29% Petro Vietnam
FID targeted for mid-2017.
Flexible-feed cracker
P. 10
0
100
200
300
400
500
600
700
800
900
1,000
1994 1996 1998 2000 2002 2004 2006 2008 2010 2012 2014 2016 2018 2020
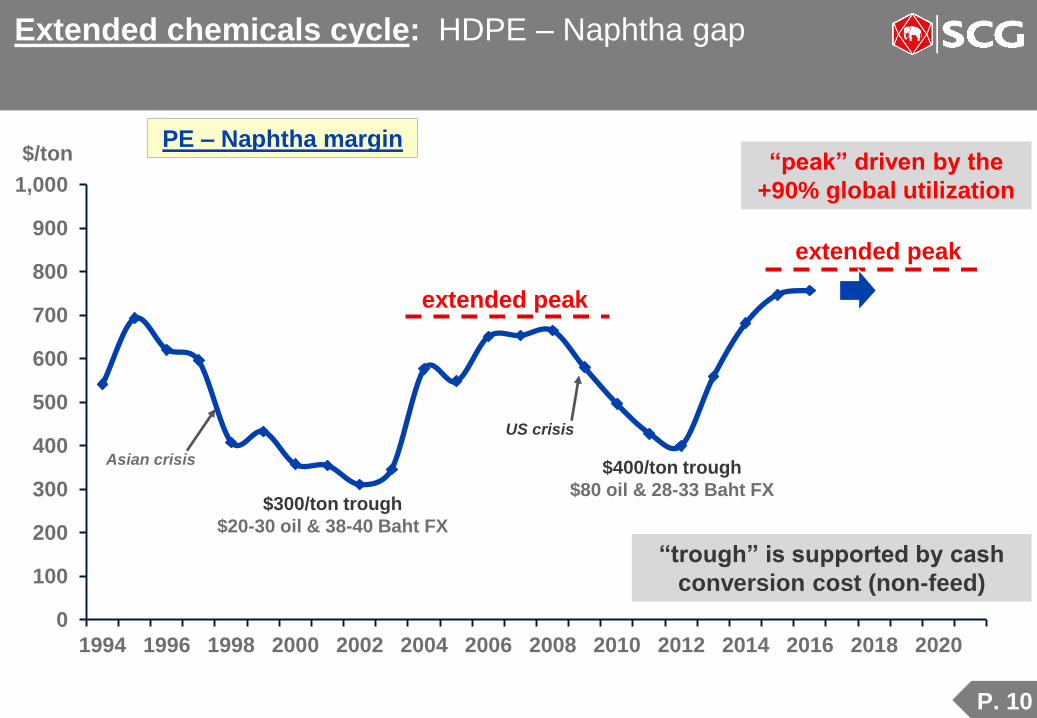
Extended chemicals cycle: HDPE – Naphtha gap
$/ton
$300/ton trough
$20-30 oil & 38-40 Baht FX
Asian crisis
US crisis
$400/ton trough
$80 oil & 28-33 Baht FX
“peak” driven by the
+90% global utilization
PE – Naphtha margin
“trough” is supported by cash
conversion cost (non-feed)
extended peak
extended peak

P. 11
Chemicals: Ethylene world supply growth
Note: as of Sept/16
0
1
2
3
4
5
6
7
8
9
10
2004 2005 2006 2007 2008 2009 2010 2011 2012 2013 2014 2015 2016 2017 2018 2019 2020 2021
supply growth = 4%
demand growth = 4%
maintaining +90% global utilization
Ethylene world supply growth
%
3%
8%
5%
1%
2%
2%
3%
Incremental supply growth (MT):
2.8 4.4 4.6 4.7 4.7 3.5 10.5 6.9 2.0 5.0 3.4 5.0 2.8 6-7 6-7 6-7 6-7 6-7
4% 4% 4% 4%
3%
3%
4% 4%4% 4%
Based on existing
construction
3-4%
3%
P. 12
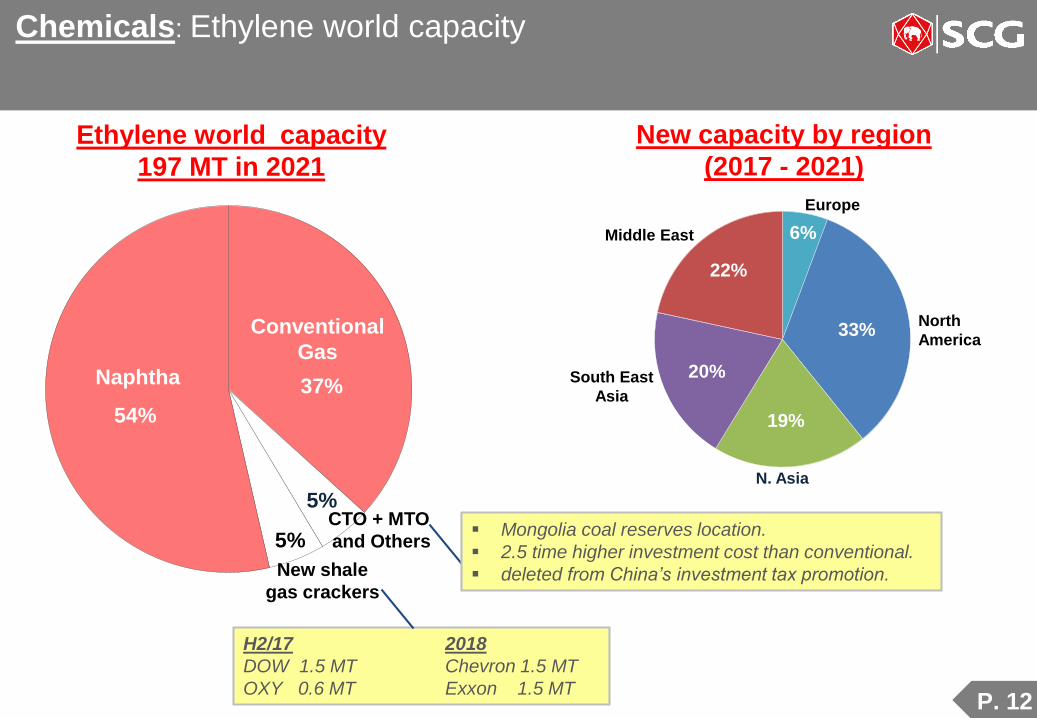
Chemicals: Ethylene world capacity
Ethylene world capacity
197 MT in 2021
New capacity by region
(2017 - 2021)
37%
5%
5%
54%
6%
33%
19%
20%
22%
Naphtha
Conventional
Gas
New shale
gas crackers
CTO + MTO
and Others
N. Asia
North
America
Europe
Middle East
South East
Asia
H2/17 2018
DOW 1.5 MT Chevron 1.5 MT
OXY 0.6 MT Exxon 1.5 MT
Mongolia coal reserves location.
2.5 time higher investment cost than conventional.
deleted from China’s investment tax promotion.

P. 13
%
Chemicals: Propylene world supply growth
Note: as of Sept/16
0
1
2
3
4
5
6
7
8
9
10
2004 2005 2006 2007 2008 2009 2010 2011 2012 2013 2014 2015 2016 2017 2018 2019 2020 2021
3%
7%
4%
2%
5%
4%
6%
3%
5%
6%
3%
4%
6%
PP spread < PE spreadPropylene world supply growth
5%
4%
3% 3%3-4%
Incremental supply growth (MT):
1.8 2.4 3.3 4.1 4.8 2.8 5.9 4.1 2.1 4.4 3.8 6.2 5.4 5-6 4-5 3-4 3-4 4-5

P. 14
Chemicals: Propylene world capacity Naphtha + refinery = 77% of capacity
29%
14%
9%
48%
Propylene world capacity
143 MT in 2021
Naphtha
CTO & MTO
& others
Refinery
PDH
New capacity by region
(2017 – 2021)
3%
20%
61%
12%
4%
North Asia
(mainly PDH)
EuropeMiddle
East
North
America
South East
Asia
P. 15
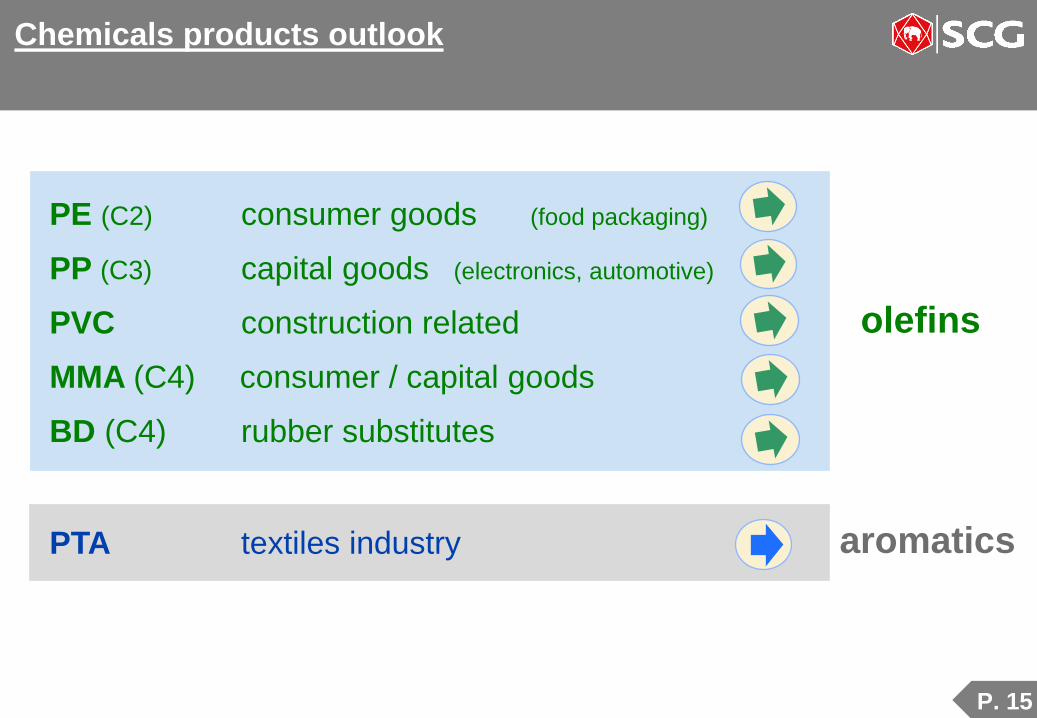
Chemicals products outlook
PE (C2) consumer goods (food packaging)
PP (C3) capital goods (electronics, automotive)
PVC construction related
MMA (C4) consumer / capital goods
BD (C4) rubber substitutes
PTA textiles industry
olefins
aromatics

P. 16
HDPE – Naphtha price gap
Note: Prices refer to SEA regional prices
P. 17
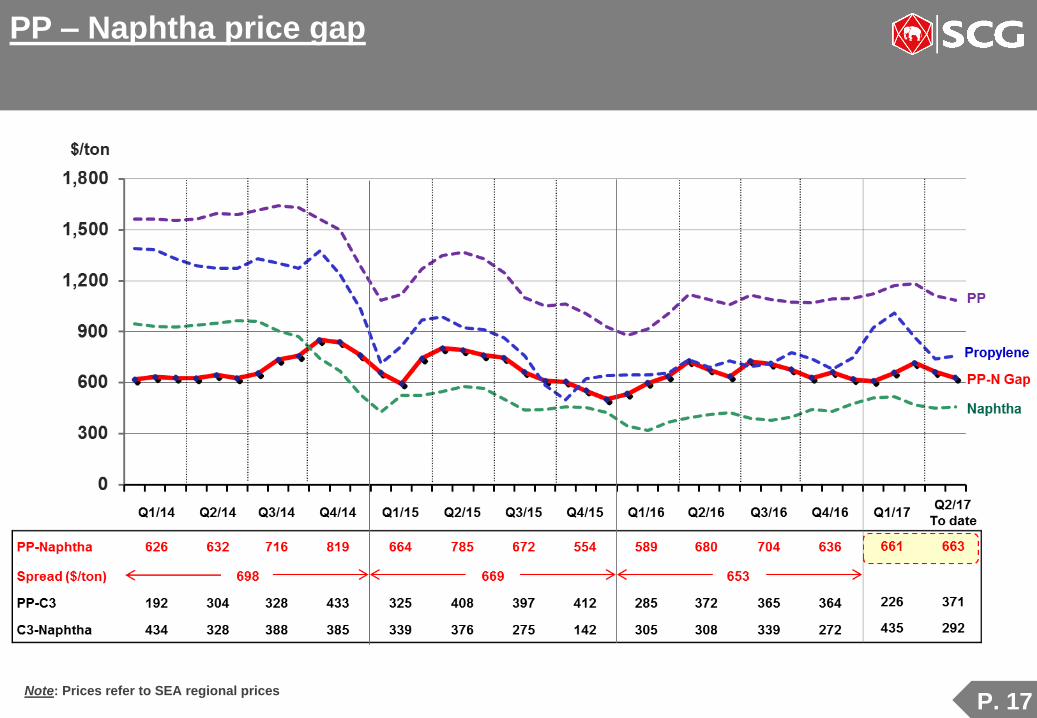
PP – Naphtha price gap
Note: Prices refer to SEA regional prices

P. 18
Benzene & Toluene
Note: Prices refer to SEA regional prices
P. 19
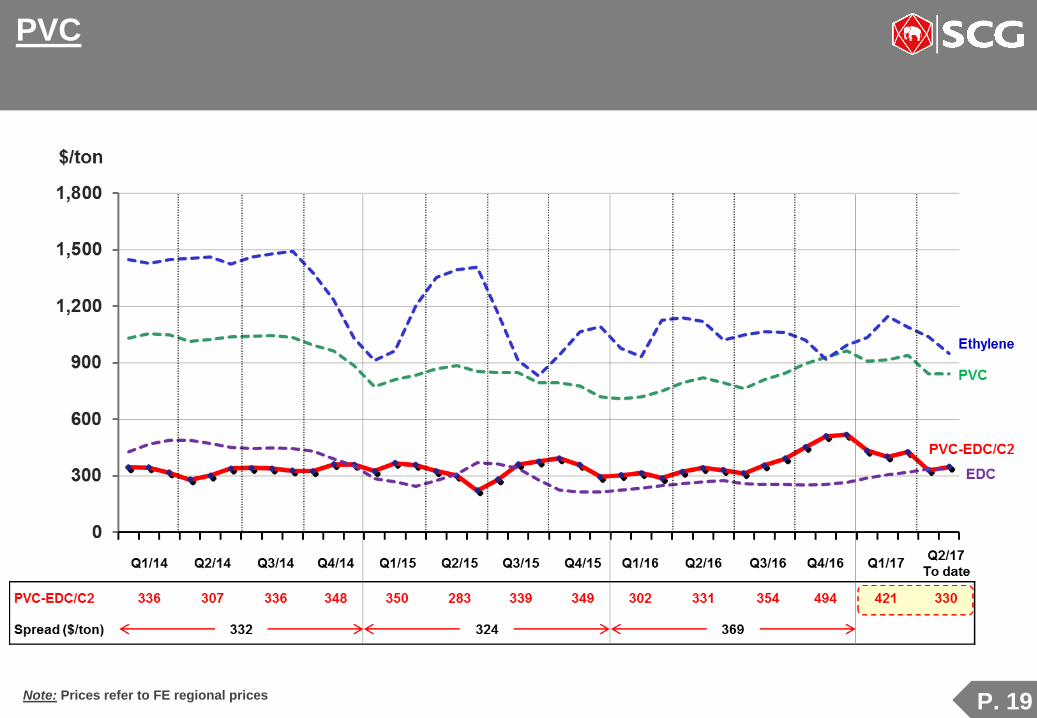
PVC
Note: Prices refer to FE regional prices
P. 20
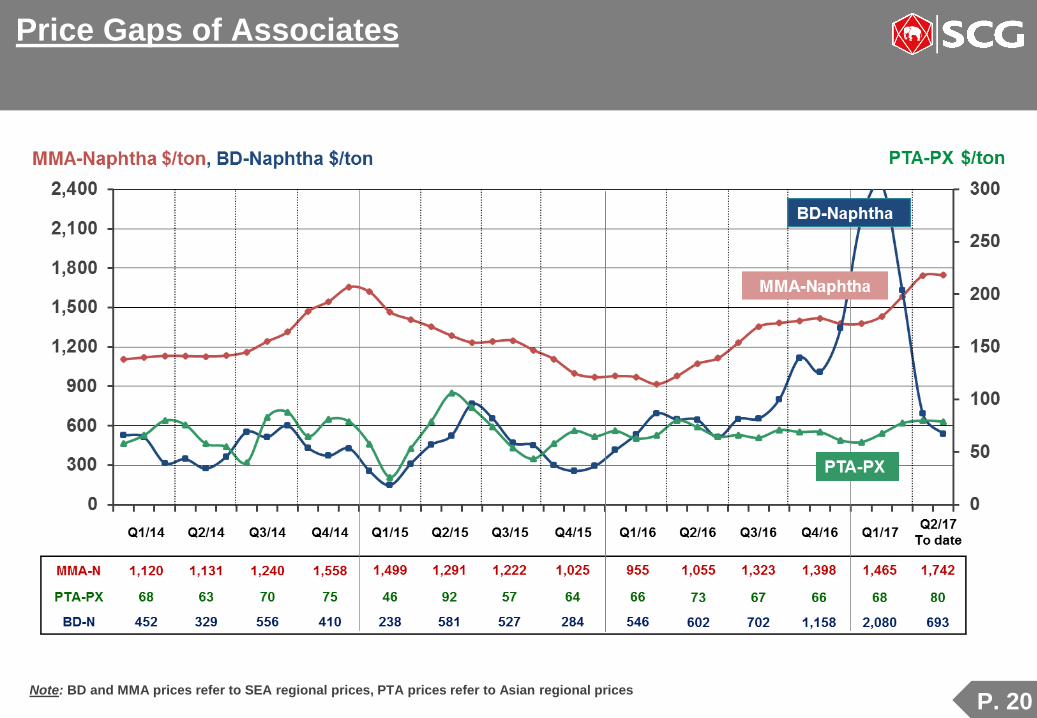
Price Gaps of Associates
Note: BD and MMA prices refer to SEA regional prices, PTA prices refer to Asian regional prices
P. 21
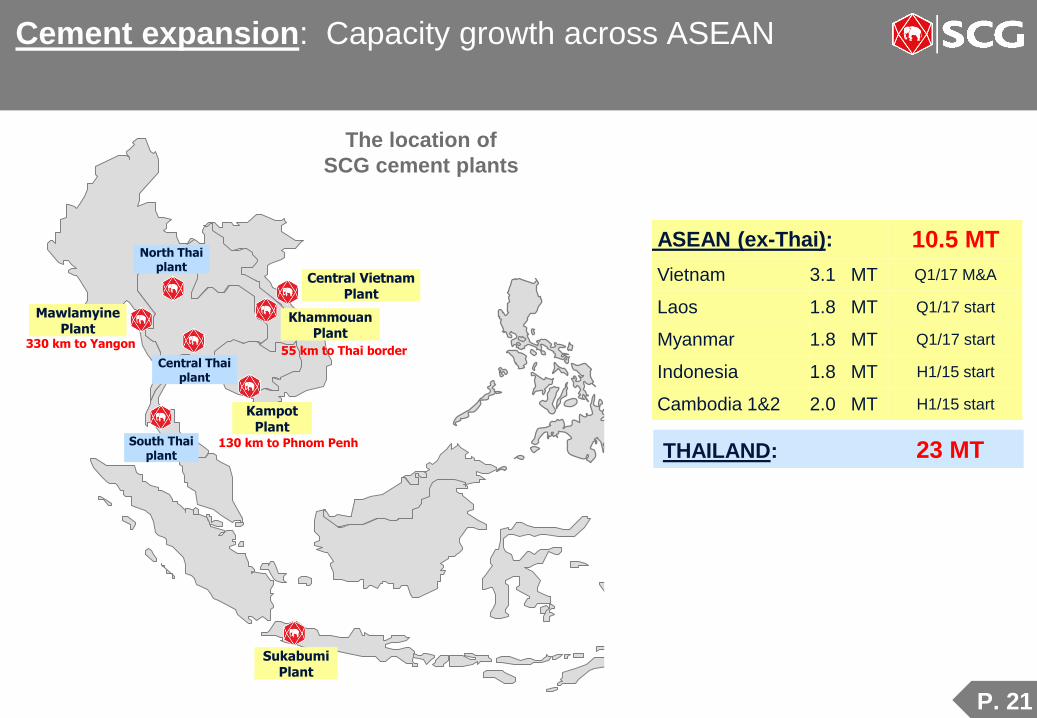
Cement expansion: Capacity growth across ASEAN
THAILAND: 23 MT
The location of
SCG cement plants
North Thai plant
Central Thai plant
South Thai plant
MawlamyinePlant
330 km to Yangon
KhammouanPlant
55 km to Thai border
KampotPlant
130 km to Phnom Penh
SukabumiPlant
Central Vietnam Plant
ASEAN (ex-Thai): 10.5 MT
Vietnam 3.1 MT Q1/17 M&A
Laos 1.8 MT Q1/17 start
Myanmar 1.8 MT Q1/17 start
Indonesia 1.8 MT H1/15 start
Cambodia 1&2 2.0 MT H1/15 start
P. 22
4 5 7
62
5 4
11
60
98
86
6 6
14
60
0
20
40
60
80
100
Laos Cambodia Myanmar Thailand Indonesia Vietnam
Export
51
39
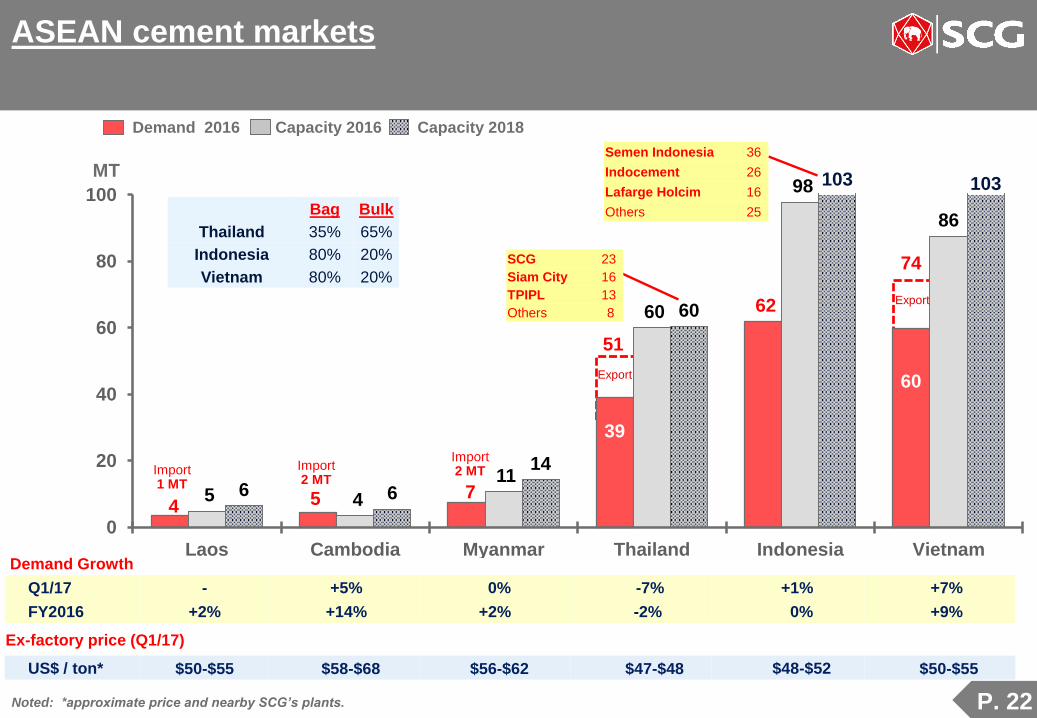
ASEAN cement markets
Noted: *approximate price and nearby SCG’s plants.
MT
Export
74
60
Import2 MT
Import1 MT
103 103
Demand 2016 Capacity 2016 Capacity 2018
Import2 MT
SCG 23
Siam City 16
TPIPL 13
Others 8
Semen Indonesia 36
Indocement 26
Lafarge Holcim 16
Others 25
Demand Growth
Q1/17 - +5% 0% -7% +1% +7%
FY2016 +2% +14% +2% -2% 0% +9%
Ex-factory price (Q1/17)
US$ / ton* $50-$55 $58-$68 $56-$62 $47-$48 $48-$52 $50-$55
Bag Bulk
Thailand 35% 65%
Indonesia 80% 20%
Vietnam 80% 20%
P. 23
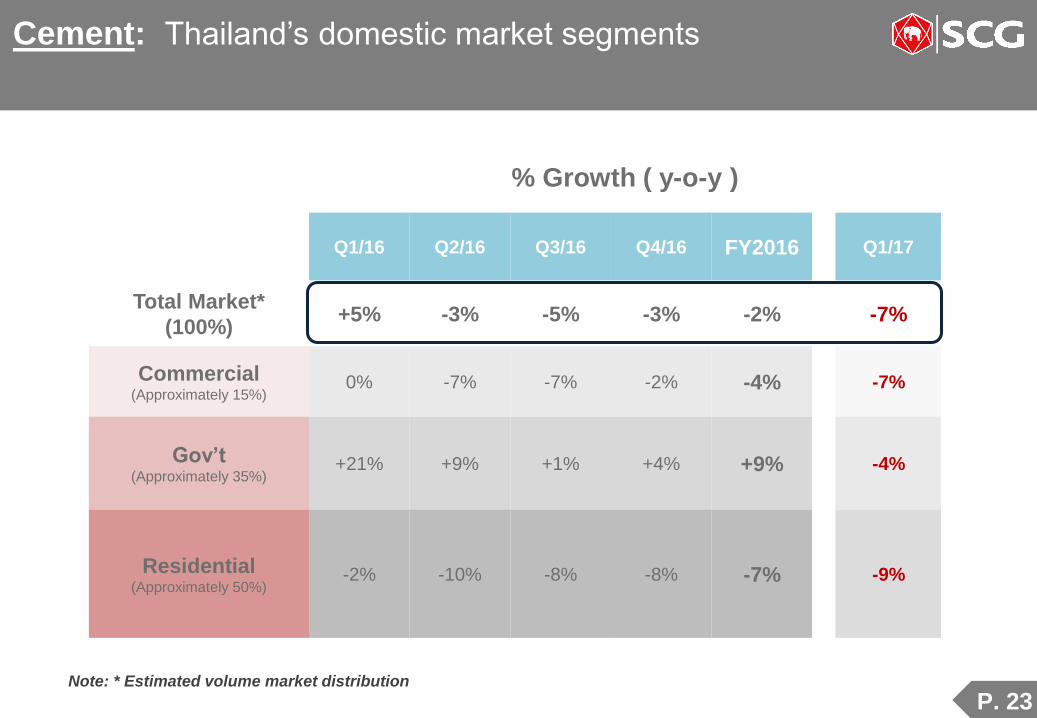
Cement: Thailand’s domestic market segments
Note: * Estimated volume market distribution
% Growth ( y-o-y )
Q1/16 Q2/16 Q3/16 Q4/16 FY2016 Q1/17
Total Market*
(100%)+5% -3% -5% -3% -2% -7%
Commercial(Approximately 15%)
0% -7% -7% -2% -4% -7%
Gov’t(Approximately 35%)
+21% +9% +1% +4% +9% -4%
Residential(Approximately 50%)
-2% -10% -8% -8% -7% -9%
P. 24
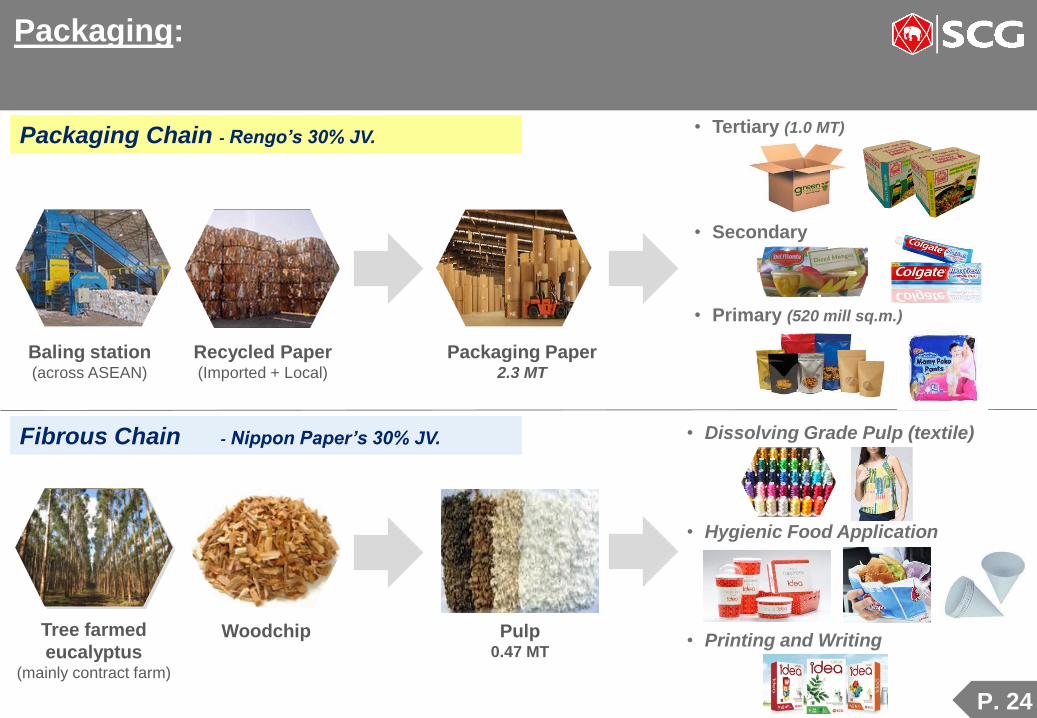
Packaging:
Packaging Chain - Rengo’s 30% JV.
Fibrous Chain - Nippon Paper’s 30% JV.
Recycled Paper(Imported + Local)
Packaging Paper2.3 MT
• Tertiary (1.0 MT)
• Secondary
• Primary (520 mill sq.m.)
Tree farmed
eucalyptus (mainly contract farm)
Woodchip Pulp0.47 MT
• Dissolving Grade Pulp (textile)
• Hygienic Food Application
• Printing and Writing
Baling station(across ASEAN)
P. 25
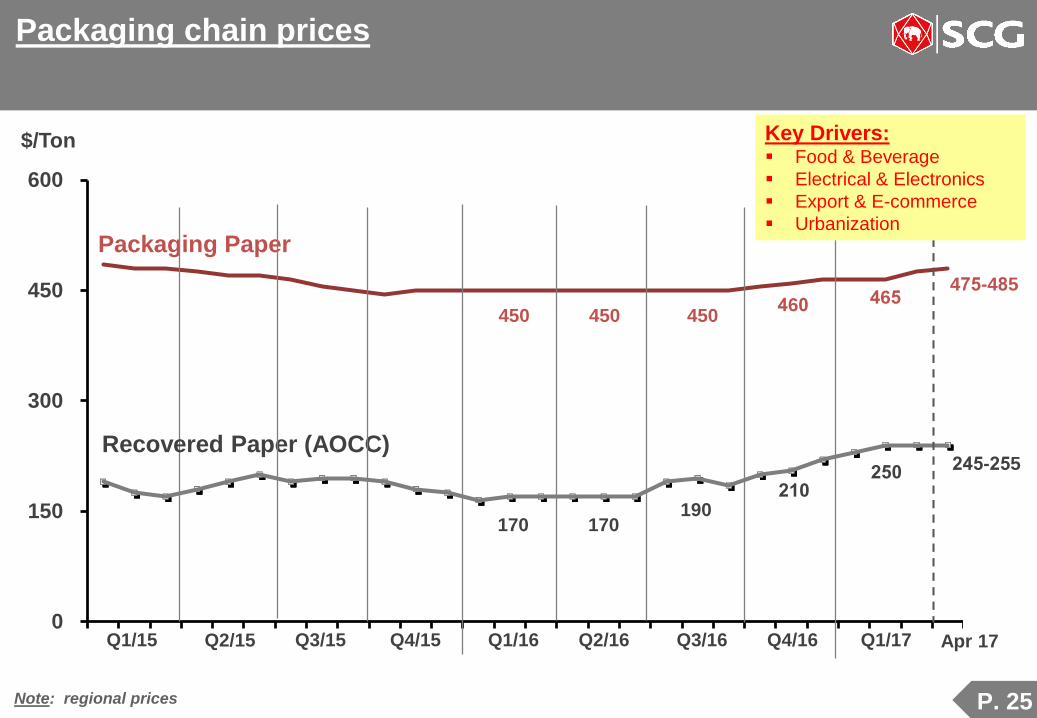
Packaging chain prices
Note: regional prices
0
150
300
450
600
$/Ton
Packaging Paper
Recovered Paper (AOCC)245-255
475-485
Q1/15 Q2/15 Q3/15 Q4/15 Q1/16
450
170
Q2/16
450
170
Q3/16
450
190
Q4/16
460
210
Q1/17
465
250
Apr 17
Key Drivers: Food & Beverage
Electrical & Electronics
Export & E-commerce
Urbanization
P. 26
2. Performance Summary
and Key Indicators

P. 27
99.9
120.5 122.0
83.6
112.1
137.6
157.8164.4 162.5
146.9 144.6
2.0
3.12.6
1.8
2.4
3.02.6 2.5
2.01.5 1.5
0.0
2.0
4.0
6.0
8.0
10.0
0
50
100
150
200
2007 2008 2009 2010 2011 2012 2013 2014 2015 2016 Q1/17
Billion Baht(Net Debt)
Times (x)(Leverage)
Net debt:
Internal leverage ceiling of 2.5 times (Net debt / EBITDA)
Net Debt on EBITDA
• 1.5x Net Debt / EBITDA
• 0.5x Net Debt / Equity
• 53,143 MB cash on hand
• 98% Thai Baht
• 90% fixed rate retail debenture
• 3.7% avg. interest cost
P. 28
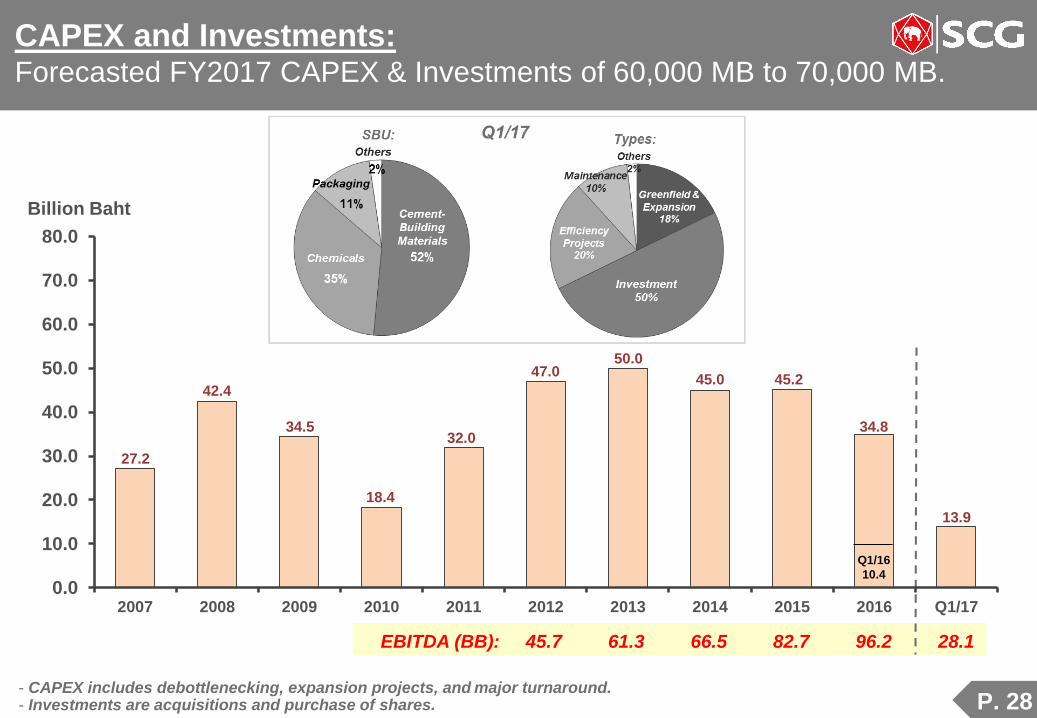
CAPEX and Investments:Forecasted FY2017 CAPEX & Investments of 60,000 MB to 70,000 MB.
- CAPEX includes debottlenecking, expansion projects, and major turnaround.- Investments are acquisitions and purchase of shares.
EBITDA (BB): 45.7 61.3 66.5 82.7 96.2 28.1
0.0
10.0
20.0
30.0
40.0
50.0
60.0
70.0
80.0
2007 2008 2009 2010 2011 2012 2013 2014 2015 2016 Q1/17
Billion Baht
27.2
42.4
34.5
18.4
32.0
47.050.0
45.0 45.2
34.8
13.9
Q1/16
10.4
P. 29
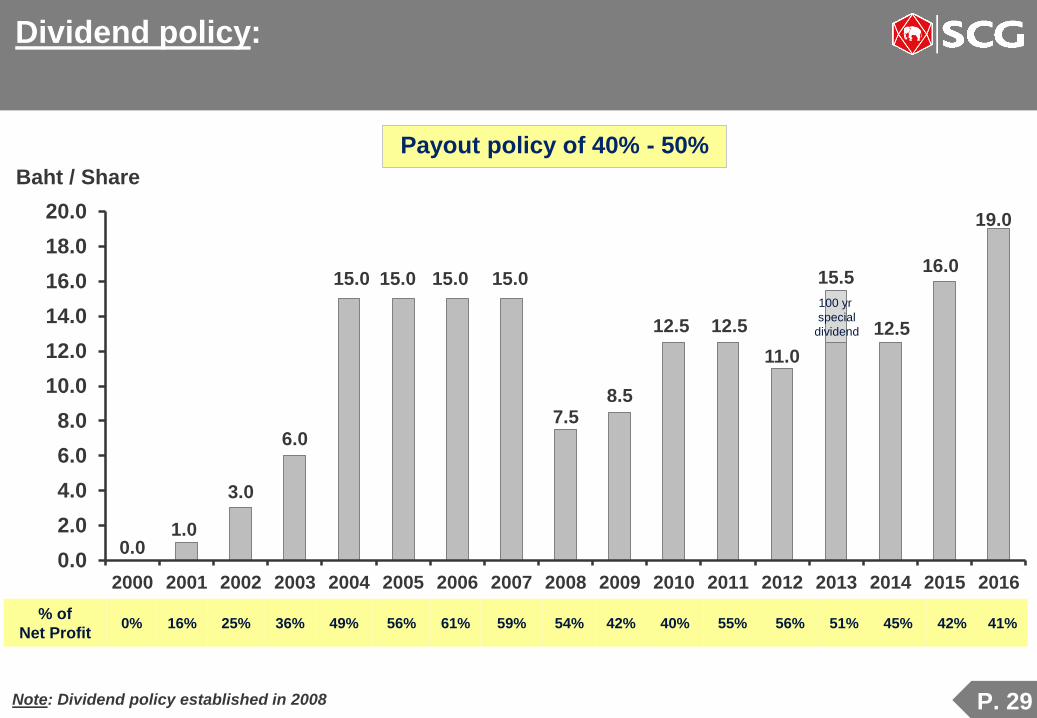
0.01.0
3.0
6.0
15.0 15.0 15.0 15.0
7.58.5
12.5 12.5
11.0
15.5
12.5
16.0
19.0
0.0
2.0
4.0
6.0
8.0
10.0
12.0
14.0
16.0
18.0
20.0
2000 2001 2002 2003 2004 2005 2006 2007 2008 2009 2010 2011 2012 2013 2014 2015 2016
Dividend policy:
Note: Dividend policy established in 2008
Payout policy of 40% - 50%
100 yr
special
dividend
Baht / Share
% of
Net Profit 0% 16% 25% 36% 49% 56% 61% 59% 54% 42% 40% 55% 56% 51% 45% 42% 41%
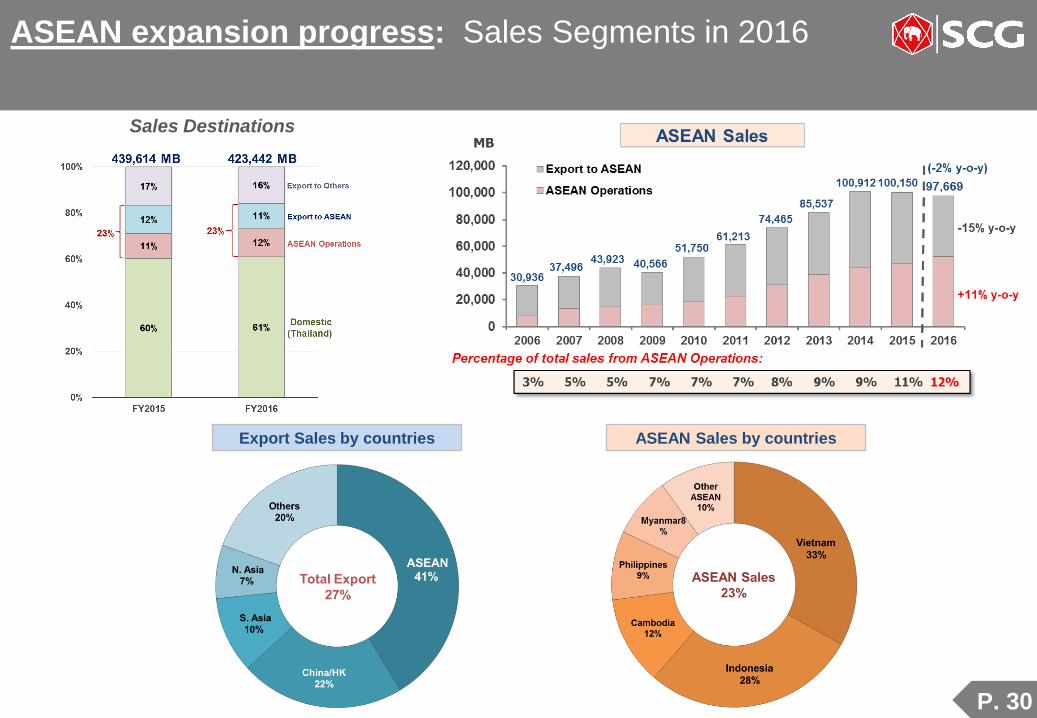
P. 30
ASEAN expansion progress: Sales Segments in 2016
Export Sales by countries ASEAN Sales by countries
Sales Destinations

P. 31
HVA progress: High value added products and services
HVA’s Revenue from Sales
HVA attributes: 5-10% higher margin Performance Solutions provider
Service & Design Branding
Business 2013 2014 2015 2016 Q1/17
Cement-Building Materials 41% 42% 41% 41% 44%
Chemicals 27% 27% 31% 31% 29%
Chemicals (Includes associates) 50% 50% 53% 54% 52%
Packaging 38% 39% 39% 43% 45%

P. 32
R&D: 2017 R&D budget is 1% of sales.
364 (Ph.D. = 9) 1,823 (Ph.D. = 108)
2007 Jan/17
Note: includes recent acquisition of
Norner Group (Norway)
50 R&D staffs (10 Ph.D.)
2. R&D and Product Design Team
1. R&D Spending Segments FY2016
P. 33
3. Appendix
P. 34
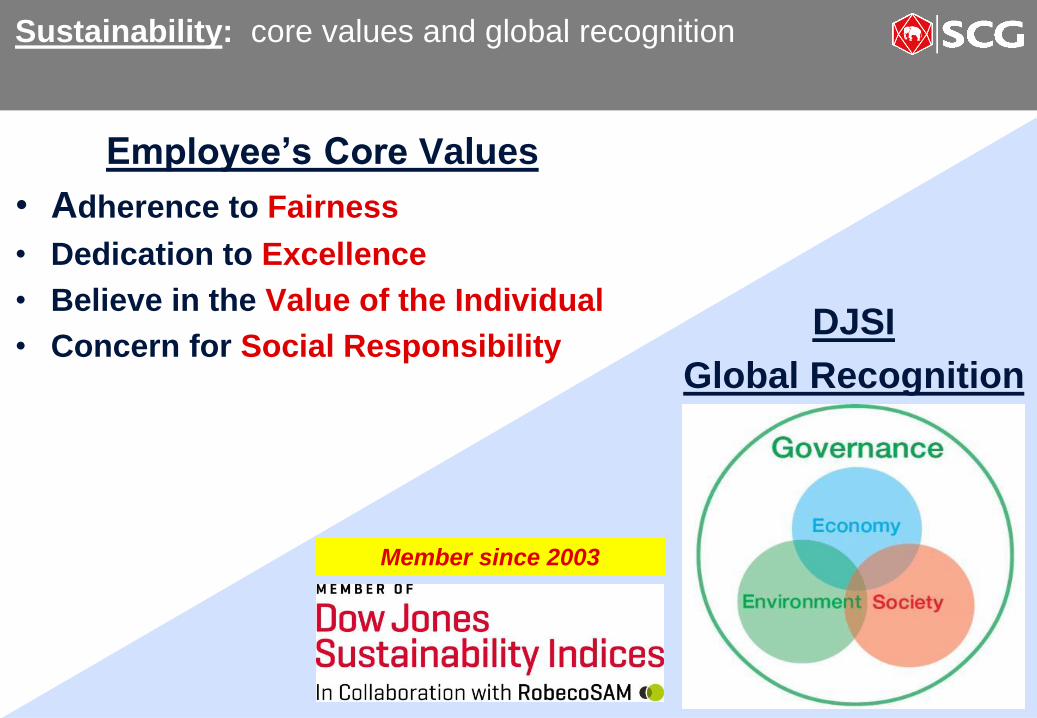
Member since 2003
Sustainability: core values and global recognition
Employee’s Core Values
• Adherence to Fairness
• Dedication to Excellence
• Believe in the Value of the Individual
• Concern for Social ResponsibilityDJSI
Global Recognition

P. 35
External Learning Programs
Programs Current Since ClassesSCG
Participants
AMP – Advanced Management Program
Harvard
Wharton
IMD
1982
2007
2015
33
7
1
89
14
1
EDP – Executive Development ProgramColumbia
IMD
2007
2014
4
1
177
45
MAP – Management Acceleration Program Duke CE 2015 3 136
MDP – Management Development ProgramWharton
Duke CE
1980
2011
36
5
1,531
276
Marketing Excellence Program Kellogg 2006 9 615
Note: as of Jan/17
P. 36
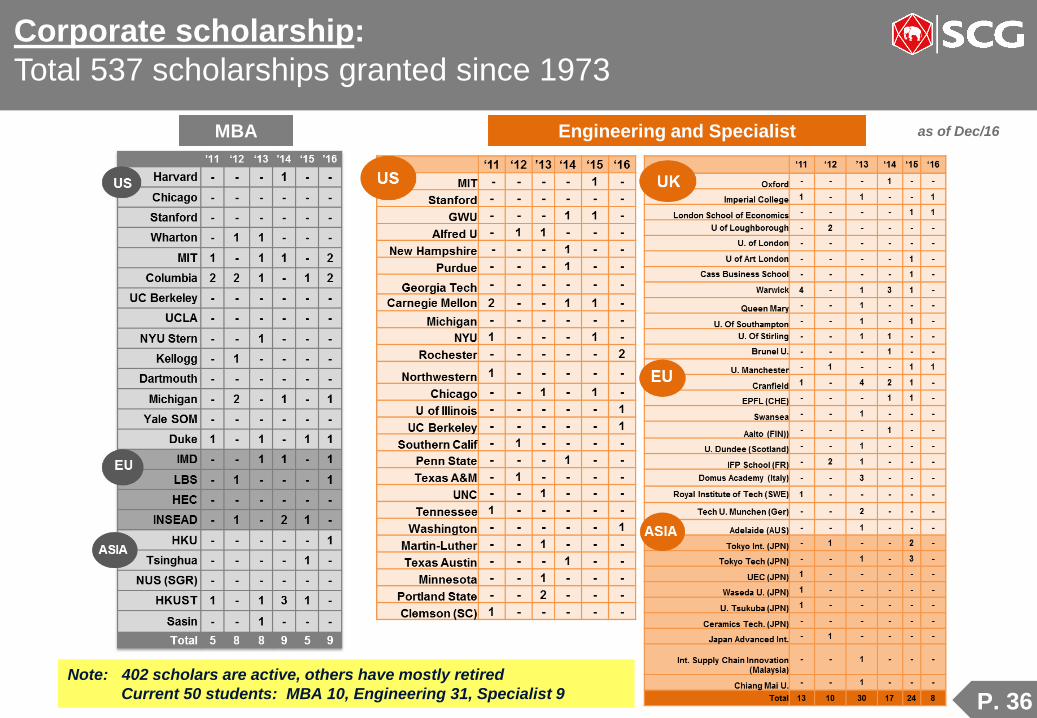
Corporate scholarship:
Total 537 scholarships granted since 1973
MBA Engineering and Specialist as of Dec/16
Note: 402 scholars are active, others have mostly retired
Current 50 students: MBA 10, Engineering 31, Specialist 9
P. 37
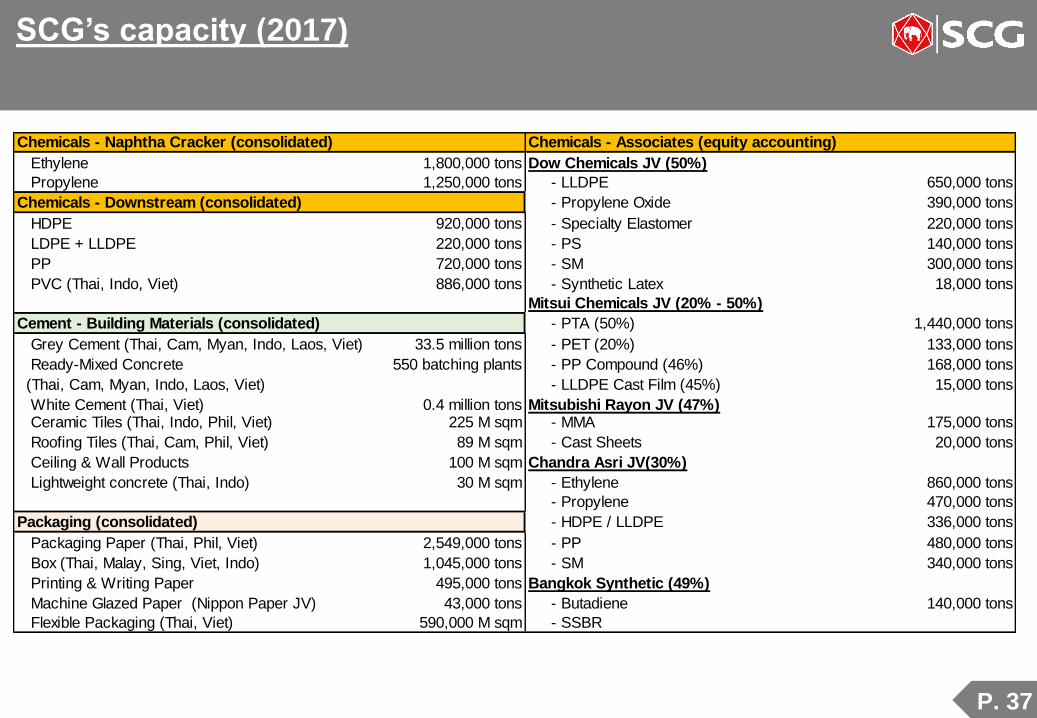
SCG’s capacity (2017)
Chemicals - Naphtha Cracker (consolidated) Chemicals - Associates (equity accounting)
Ethylene 1,800,000 tons Dow Chemicals JV (50%)
Propylene 1,250,000 tons - LLDPE 650,000 tons
Chemicals - Downstream (consolidated) - Propylene Oxide 390,000 tons
HDPE 920,000 tons - Specialty Elastomer 220,000 tons
LDPE + LLDPE 220,000 tons - PS 140,000 tons
PP 720,000 tons - SM 300,000 tons
PVC (Thai, Indo, Viet) 886,000 tons - Synthetic Latex 18,000 tons
Mitsui Chemicals JV (20% - 50%)
Cement - Building Materials (consolidated) - PTA (50%) 1,440,000 tons
Grey Cement (Thai, Cam, Myan, Indo, Laos, Viet) 33.5 million tons - PET (20%) 133,000 tons
Ready-Mixed Concrete 550 batching plants - PP Compound (46%) 168,000 tons
(Thai, Cam, Myan, Indo, Laos, Viet) - LLDPE Cast Film (45%) 15,000 tons
White Cement (Thai, Viet) 0.4 million tons Mitsubishi Rayon JV (47%) Ceramic Tiles (Thai, Indo, Phil, Viet) 225 M sqm - MMA 175,000 tons
Roofing Tiles (Thai, Cam, Phil, Viet) 89 M sqm - Cast Sheets 20,000 tons
Ceiling & Wall Products 100 M sqm Chandra Asri JV(30%)
Lightweight concrete (Thai, Indo) 30 M sqm - Ethylene 860,000 tons
- Propylene 470,000 tons
Packaging (consolidated) - HDPE / LLDPE 336,000 tons
Packaging Paper (Thai, Phil, Viet) 2,549,000 tons - PP 480,000 tons
Box (Thai, Malay, Sing, Viet, Indo) 1,045,000 tons - SM 340,000 tons
Printing & Writing Paper 495,000 tons Bangkok Synthetic (49%)
Machine Glazed Paper (Nippon Paper JV) 43,000 tons - Butadiene 140,000 tons
Flexible Packaging (Thai, Viet) 590,000 M sqm - SSBR

P. 38
Incremental capacity
-
2011 2012 2013 2014 2015 2016 2017 2011 2012 2013 2014 2015 2016 2017
Chemicals Upstream (Cracker) - ('000 tons) Packaging - ('000 tons)
Ethylene (subsidary) 1,700 1,700 1,700 1,700 1,700 1,700 1,800 Printing & Writing Paper 570 570 570 570 570 495 495
Propylene (subsidary) 1,200 1,200 1,200 1,200 1,200 1,200 1,250 Packaging Paper 1,880 1,880 1,956 2,306 2,306 2,306 2,549
Chandra Asri (30% stake) Box 795 855 1,013 1,013 1,013 1,013 1,045
Ethylene 600 600 600 600 600 860 860 - - - 43 43 43 43
Propylene 320 320 320 320 320 470 470
Flexible Packaging (Million sqm.) - - - 290 590 590 590
(Thai + Vietnam)
Chemicals Downstream - ('000 tons) Cement - (MT)
HDPE (subsidiary) 920 920 920 920 920 920 920 Grey Cement (TH, KH, MM, ID, LA, VN) 24 24 24 24 27 29 34
PP (subsidiary) 720 720 720 720 720 720 720 White Cement (TH, VN) 0.2 0.4 0.4 0.4 0.4 0.4 0.4
PVC (90% stake in TPC) 886 886 886 886 886 886 886 Mortar 2.1 2.1 2.1 3.2 4.1 6.6 6.6
Chemicals Downstream (JV) - ('000 tons) Building Products - (M sqm)
LLDPE (Dow JV) 650 650 650 650 650 650 650 Ceramic Tiles 149 149 225 225 225 225 225
Specialty Elastomers (Dow JV) 220 220 220 220 220 220 220 Ceiling & Wall product (TH) 60 68 86 99 99 100 100
Propylene Oxide (Dow JV) 390 390 390 390 390 390 390 Lightweight concrete (TH, ID) 15 15 21 27 27 30 30
SSBR (BST JV) - - 50 50 50 100 100 Modular Home (Sekisui Heim JV) 200 200 1,000 1,000 1,000 1,000 1,000
- - - 15 15 15 15
MMA (Mitsubishi Rayon JV) 175 175 175 175 175 175 175
20 20 20 20 20 20 20
HDPE / LLDPE (CAP JV) 336 336 336 336 336 336 336
PP (CAP JV) 480 480 480 480 480 480 480
SM (CAP JV) 340 340 340 340 340 340 340
Machine Glazed Paper
(Nippon Paper JV)
LLDPE cast sheet film
(Mitsui Tohcello JV)
Capacity at year endTotal Capacity
Capacity at year endTotal Capacity
Cast Sheets
(Mitsubishi Rayon JV)

P. 39
Consolidated Segments
Other = Mainly SCG Investment and Corporate
Revenue from Sales
Profit for the Period
Q1/16
109,998 MB
Q1/17
116,268 MB
Q1/16
13,488 MB
Q1/17
17,386 MB
P. 40
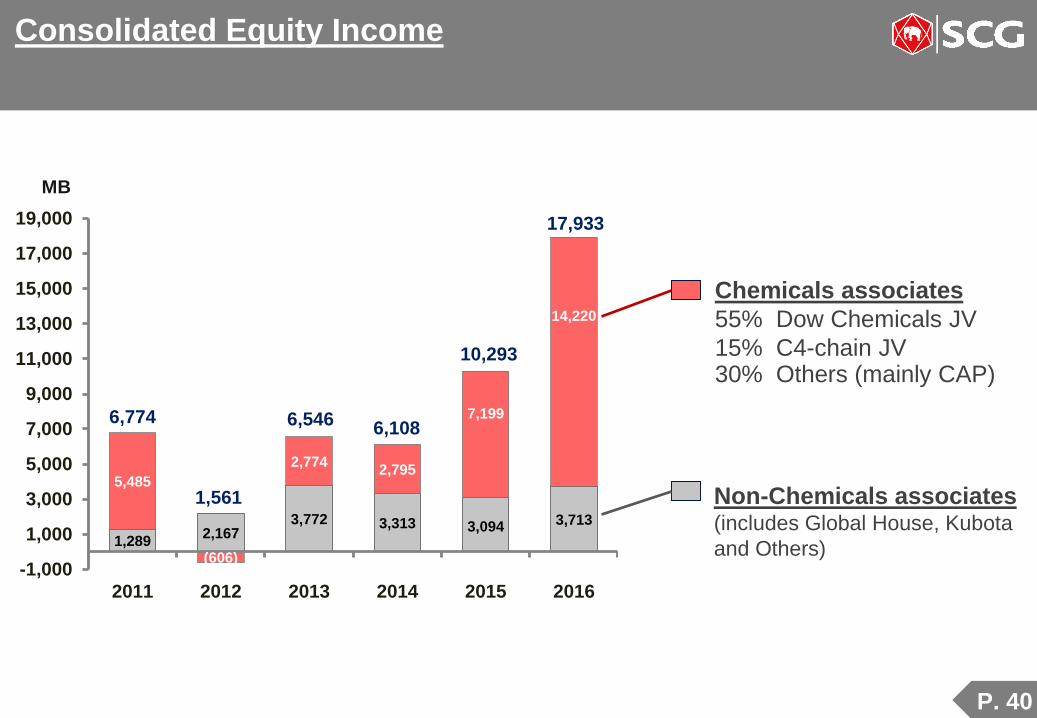
Consolidated Equity Income
1,2892,167
3,772 3,313 3,094 3,713
5,485
(606)
2,7742,795
7,199
14,220
-1,000
1,000
3,000
5,000
7,000
9,000
11,000
13,000
15,000
17,000
19,000
2011 2012 2013 2014 2015 2016
MB
6,774
1,561
6,5466,108
10,293
17,933
Non-Chemicals associates(includes Global House, Kubota
and Others)
Chemicals associates
55% Dow Chemicals JV
15% C4-chain JV30% Others (mainly CAP)
P. 41
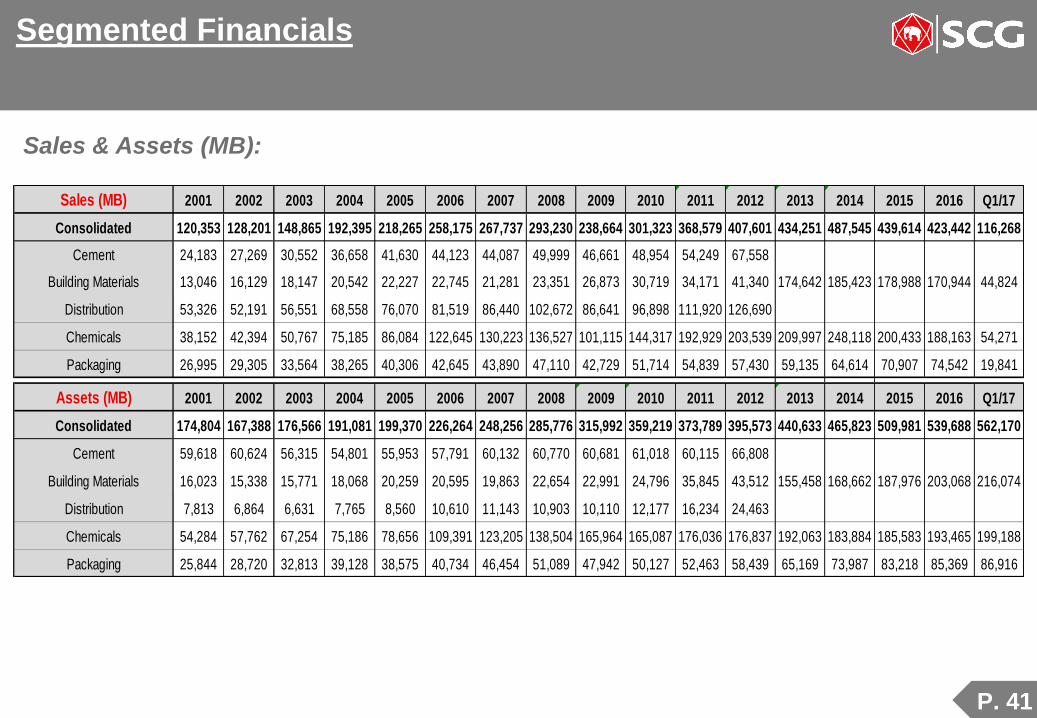
Segmented Financials
Sales & Assets (MB):
Sales (MB) 2001 2002 2003 2004 2005 2006 2007 2008 2009 2010 2011 2012 2013 2014 2015 2016 Q1/17
Consolidated 120,353 128,201 148,865 192,395 218,265 258,175 267,737 293,230 238,664 301,323 368,579 407,601 434,251 487,545 439,614 423,442 116,268
Cement 24,183 27,269 30,552 36,658 41,630 44,123 44,087 49,999 46,661 48,954 54,249 67,558
Building Materials 13,046 16,129 18,147 20,542 22,227 22,745 21,281 23,351 26,873 30,719 34,171 41,340 174,642 185,423 178,988 170,944 44,824
Distribution 53,326 52,191 56,551 68,558 76,070 81,519 86,440 102,672 86,641 96,898 111,920 126,690
Chemicals 38,152 42,394 50,767 75,185 86,084 122,645 130,223 136,527 101,115 144,317 192,929 203,539 209,997 248,118 200,433 188,163 54,271
Packaging 26,995 29,305 33,564 38,265 40,306 42,645 43,890 47,110 42,729 51,714 54,839 57,430 59,135 64,614 70,907 74,542 19,841
Assets (MB) 2001 2002 2003 2004 2005 2006 2007 2008 2009 2010 2011 2012 2013 2014 2015 2016 Q1/17
Consolidated 174,804 167,388 176,566 191,081 199,370 226,264 248,256 285,776 315,992 359,219 373,789 395,573 440,633 465,823 509,981 539,688 562,170
Cement 59,618 60,624 56,315 54,801 55,953 57,791 60,132 60,770 60,681 61,018 60,115 66,808
Building Materials 16,023 15,338 15,771 18,068 20,259 20,595 19,863 22,654 22,991 24,796 35,845 43,512 155,458 168,662 187,976 203,068 216,074
Distribution 7,813 6,864 6,631 7,765 8,560 10,610 11,143 10,903 10,110 12,177 16,234 24,463
Chemicals 54,284 57,762 67,254 75,186 78,656 109,391 123,205 138,504 165,964 165,087 176,036 176,837 192,063 183,884 185,583 193,465 199,188
Packaging 25,844 28,720 32,813 39,128 38,575 40,734 46,454 51,089 47,942 50,127 52,463 58,439 65,169 73,987 83,218 85,369 86,916
P. 42
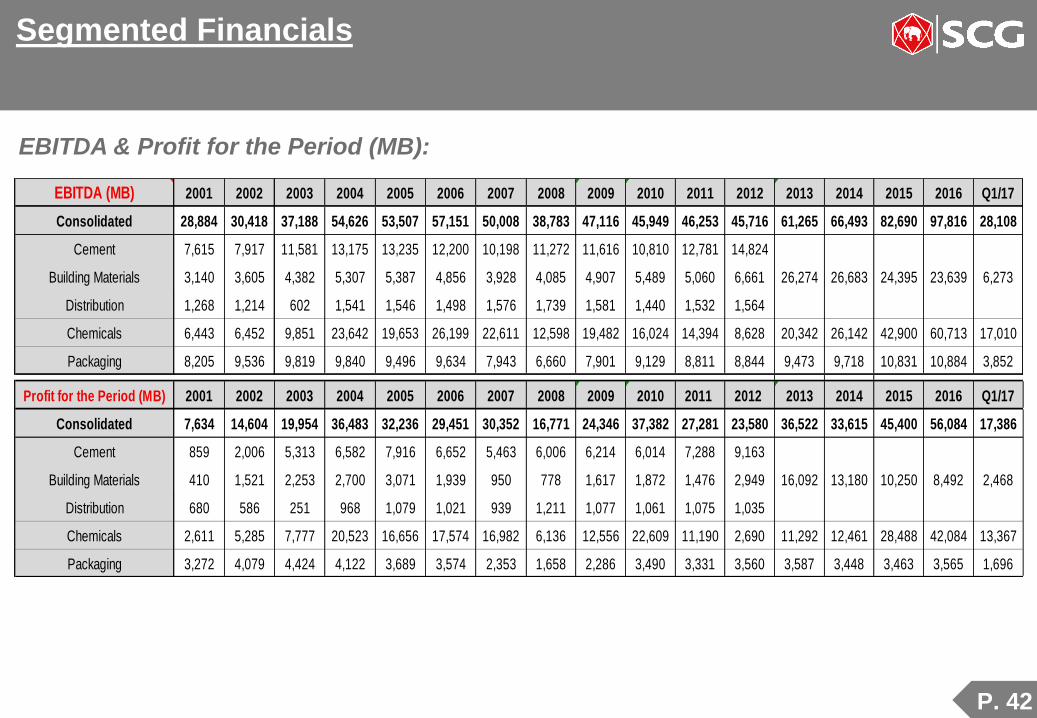
EBITDA & Profit for the Period (MB):
Segmented Financials
EBITDA (MB) 2001 2002 2003 2004 2005 2006 2007 2008 2009 2010 2011 2012 2013 2014 2015 2016 Q1/17
Consolidated 28,884 30,418 37,188 54,626 53,507 57,151 50,008 38,783 47,116 45,949 46,253 45,716 61,265 66,493 82,690 97,816 28,108
Cement 7,615 7,917 11,581 13,175 13,235 12,200 10,198 11,272 11,616 10,810 12,781 14,824
Building Materials 3,140 3,605 4,382 5,307 5,387 4,856 3,928 4,085 4,907 5,489 5,060 6,661 26,274 26,683 24,395 23,639 6,273
Distribution 1,268 1,214 602 1,541 1,546 1,498 1,576 1,739 1,581 1,440 1,532 1,564
Chemicals 6,443 6,452 9,851 23,642 19,653 26,199 22,611 12,598 19,482 16,024 14,394 8,628 20,342 26,142 42,900 60,713 17,010
Packaging 8,205 9,536 9,819 9,840 9,496 9,634 7,943 6,660 7,901 9,129 8,811 8,844 9,473 9,718 10,831 10,884 3,852
Profit for the Period (MB) 2001 2002 2003 2004 2005 2006 2007 2008 2009 2010 2011 2012 2013 2014 2015 2016 Q1/17
Consolidated 7,634 14,604 19,954 36,483 32,236 29,451 30,352 16,771 24,346 37,382 27,281 23,580 36,522 33,615 45,400 56,084 17,386
Cement 859 2,006 5,313 6,582 7,916 6,652 5,463 6,006 6,214 6,014 7,288 9,163
Building Materials 410 1,521 2,253 2,700 3,071 1,939 950 778 1,617 1,872 1,476 2,949 16,092 13,180 10,250 8,492 2,468
Distribution 680 586 251 968 1,079 1,021 939 1,211 1,077 1,061 1,075 1,035
Chemicals 2,611 5,285 7,777 20,523 16,656 17,574 16,982 6,136 12,556 22,609 11,190 2,690 11,292 12,461 28,488 42,084 13,367
Packaging 3,272 4,079 4,424 4,122 3,689 3,574 2,353 1,658 2,286 3,490 3,331 3,560 3,587 3,448 3,463 3,565 1,696
