ash reduction strategies to provide on-spec feedstocks for biofuelconversion processes ·...
TRANSCRIPT

ww
w.in
l.govAsh Reduction Strategies to Provide On-Spec Feedstocks for Biofuel Conversion Processes
David N. Thompson*, John E. Aston, Jeffrey A. Lacey, Vicki S. Thompson, Tyler L. Westover
Northwest Wood-Based Biofuels + Co-Products ConferenceApril 29, 2014

National Challenge
• Replacing the whole barrel– US spends $1billion/day on oil imports– Reducing dependence on oil requires
replacing the whole barrel– Climate change mitigation by replacing
fossil fuels • Feedstock costs represent up to one-third
current biofuel production costs
0
20
40
60
80
100
120
140
160
180
200
$/dr
y m
etric
ton
Feedstock Cost Challenge Feedstock Quality Challenge
Temporal changes in %Moisture
Gra
ss P
elle
ts –
Show
Me
Ener
gy
Woo
d Pe
llets
–Ro
tter
dam
Woo
d Ch
ips –
US
Stra
w B
ales
–Do
ng E
nerg
y
Stov
er B
ales
–IB
R
Feedstock Break Point to Achieve $3/gal Target
Feedstock Business Break point to Achieve Going Concern

Feedstock Quality Challenge
N=339
Sugars Moisture
• Conversion specs shown (vertical lines) represent DOE biochem (BC) and thermochem (TC) pathway quality assumptions
• Distributions represent variability in biomass properties relative to spec
• Distributions likely greater if broader range of resources are considered
• Illustrates challenge associated with diversity
AshTC: 1% BC: 5%
N=829
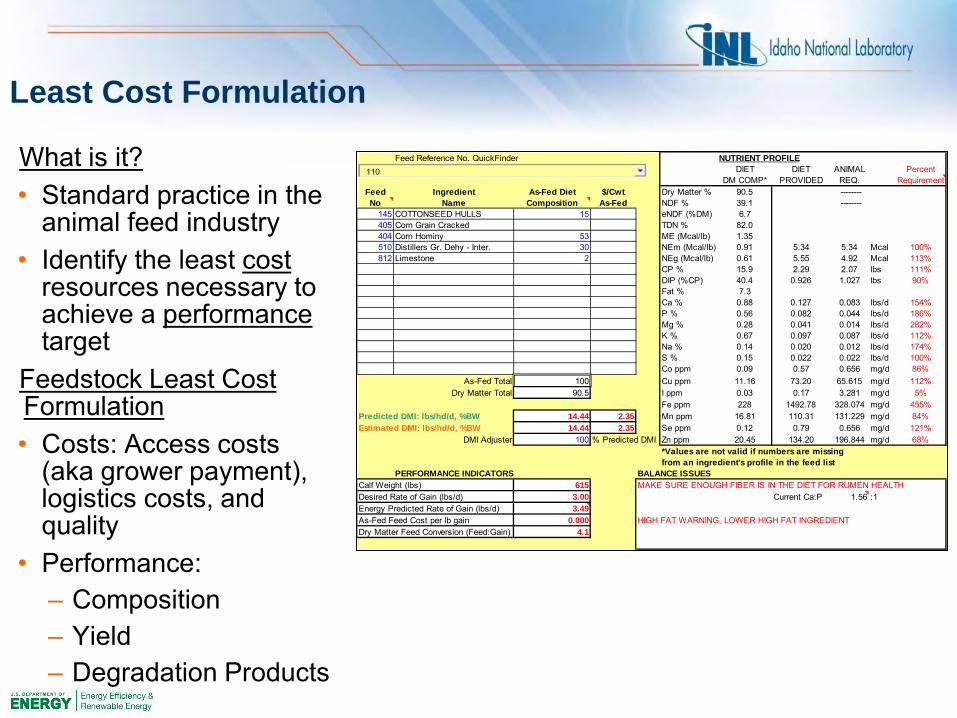
Least Cost Formulation
What is it?• Standard practice in the
animal feed industry• Identify the least cost
resources necessary to achieve a performancetarget
Feedstock Least Cost Formulation• Costs: Access costs
(aka grower payment), logistics costs, and quality
• Performance: – Composition– Yield– Degradation Products
Feed Reference No. QuickFinder NUTRIENT PROFILEDIET DIET ANIMAL Percent
DM COMP* PROVIDED REQ. RequirementFeed Ingredient As-Fed Diet $/Cwt Dry Matter % 90.5 --------No Name Composition As-Fed NDF % 39.1 --------
145 COTTONSEED HULLS 15 eNDF (%DM) 6.7 405 Corn Grain Cracked TDN % 82.0404 Corn Hominy 53 ME (Mcal/lb) 1.35510 Distillers Gr. Dehy - Inter. 30 NEm (Mcal/lb) 0.91 5.34 5.34 Mcal 100%812 Limestone 2 NEg (Mcal/lb) 0.61 5.55 4.92 Mcal 113%
CP % 15.9 2.29 2.07 lbs 111%DIP (%CP) 40.4 0.926 1.027 lbs 90%Fat % 7.3Ca % 0.88 0.127 0.083 lbs/d 154%P % 0.56 0.082 0.044 lbs/d 186%Mg % 0.28 0.041 0.014 lbs/d 282%K % 0.67 0.097 0.087 lbs/d 112%Na % 0.14 0.020 0.012 lbs/d 174%S % 0.15 0.022 0.022 lbs/d 100%Co ppm 0.09 0.57 0.656 mg/d 86%
As-Fed Total 100 Cu ppm 11.16 73.20 65.615 mg/d 112%Dry Matter Total 90.5 I ppm 0.03 0.17 3.281 mg/d 5%
Fe ppm 228 1492.78 328.074 mg/d 455%Predicted DMI: lbs/hd/d, %BW 14.44 2.35 Mn ppm 16.81 110.31 131.229 mg/d 84%Estimated DMI: lbs/hd/d, %BW 14.44 2.35 Se ppm 0.12 0.79 0.656 mg/d 121%
DMI Adjuster 100 % Predicted DMI Zn ppm 20.45 134.20 196.844 mg/d 68%*Values are not valid if numbers are missing from an ingredient's profile in the feed list
PERFORMANCE INDICATORS BALANCE ISSUESCalf Weight (lbs) 615 MAKE SURE ENOUGH FIBER IS IN THE DIET FOR RUMEN HEALTHDesired Rate of Gain (lbs/d) 3.00 Current Ca:P 1.56 :1Energy Predicted Rate of Gain (lbs/d) 3.49As-Fed Feed Cost per lb gain 0.000 HIGH FAT WARNING, LOWER HIGH FAT INGREDIENTDry Matter Feed Conversion (Feed:Gain) 4.1
110
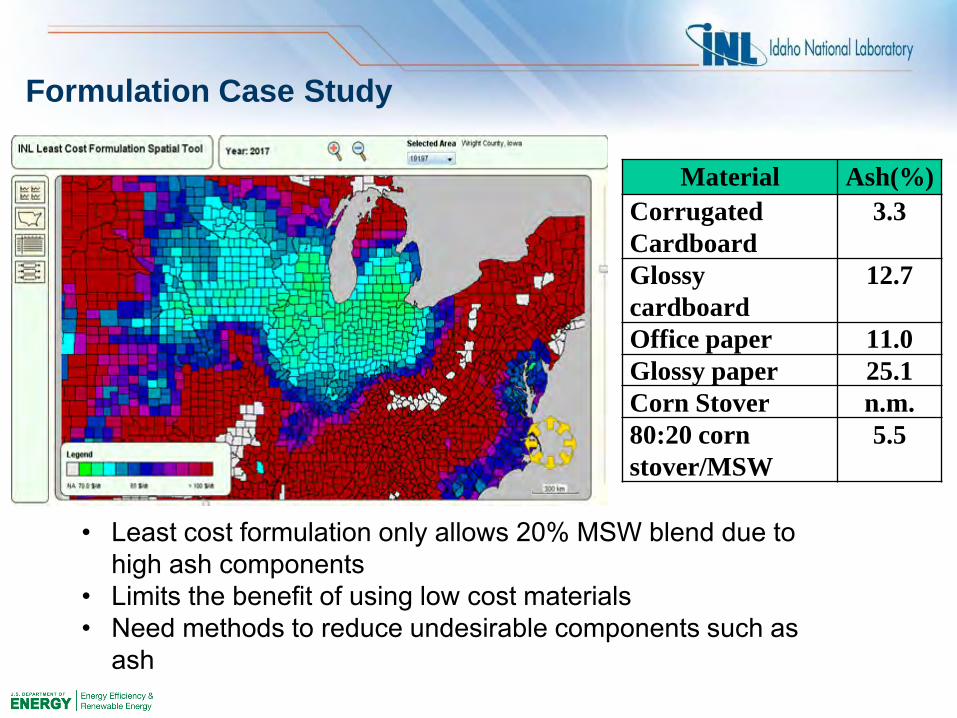
Formulation Case Study
Material Ash(%)Corrugated Cardboard
3.3
Glossy cardboard
12.7
Office paper 11.0Glossy paper 25.1Corn Stover n.m.80:20 corn stover/MSW
5.5
• Least cost formulation only allows 20% MSW blend due to high ash components
• Limits the benefit of using low cost materials• Need methods to reduce undesirable components such as
ash

Why Is Ash A Quality Issue?
• Biomass contains both introduced soil ash and endogenous ash• Endogenous ash is comprised of structural and non-structural
physiological ash• Ash is comprised of metals and heteroatoms that may be
– Inert… e.g., SiO2 in biochemical conversions– Destructive to conversion products… e.g., K, Na, Ca, Mg in pyrolysis– Fouling agents for conversion catalysts… e.g., N, S, P for several
processes– Sources of pollutants… e.g., N, S in combustion and gasification– Damaging to equipment… e.g., SiO2, K, Na in combustion and
gasification• This increases processing costs and/or reduces product yields• Knowing the chemical form, function and plant tissue location of specific
ash components aids in identifying effective reduction methods

• Mineral nutrients– Macronutrients – Ca, K, S, Mg, N, P– Micronutrients – Zn, Fe, Mn, Cu, Cl– Beneficial elements – Na, Si
• Physiological functions– Vascular transport – K+, Na+
– Counterions – Ca2+, Mg2+
– Heteroatoms - S2-, N, PO43-, SO4
2-
– Alleviating biotic and abiotic stresses –SiO2
• Tissue locations– Actively growing tissues
• K+, Na+, Ca2+, Mg2+, S2-, SO42-, N, P
– Structural or inactive tissues• SiO2, S2-, SO4
2-, N, P, Ca2+ (as oxalate crystals)
Ash – Form, Function and Distribution

Ash Reduction Methods• Mechanical methods
– Screening to separate rocks and soil from biomass
– Classification by density or color to separate plant tissue fractions
– Fractional milling to separate size fractions with higher ash
– Triboelectrostatic separation of finely ground biomass to reduce silica
• Chemical methods– Simple washing to remove soil– Leaching with water/acid to remove
alkali metals/alkaline earth metals– Limited structural disruption with hot
water or acid to remove cell-bound nitrogen and sulfur
– Dissolution of silica with alkali

Ash Content % of Plant MassLeaves 10.56% 20%Sheath 7.72% 10%Nodes 4.76% 10%Husk 3.45% 10%Internode 3.92% 30%Cob 1.62% 20%
To meet an ash spec of 5%, additional treatment only required on 30% of total biomass
Anatomical Fractionation of Corn Stover

Air Classification – Corn Stover
Fines
Light Fraction
Heavy Fraction
Leaves Cobs
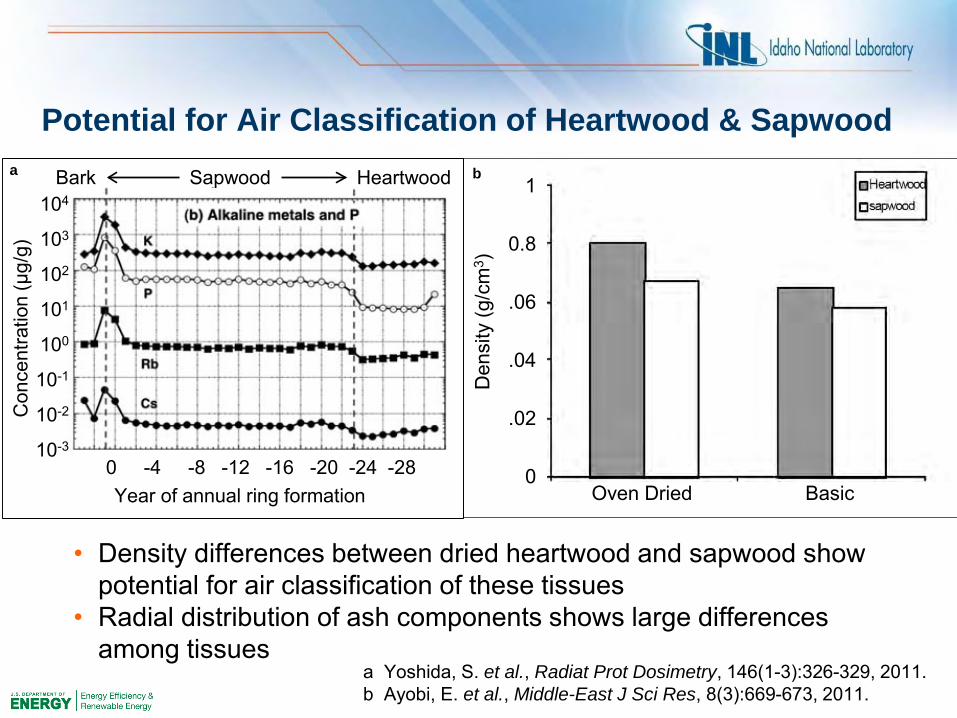
Potential for Air Classification of Heartwood & Sapwood
1
0.8
.06
.04
.02
0D
ensi
ty (g
/cm
3 )Oven Dried Basic
• Density differences between dried heartwood and sapwood show potential for air classification of these tissues
• Radial distribution of ash components shows large differences among tissues
104
103
102
101
100
10-1
10-2
10-3
Con
cent
ratio
n (µ
g/g)
Bark Sapwood Heartwood
0 -4 -8 -12 -16 -20 -24 -28Year of annual ring formation
b
a Yoshida, S. et al., Radiat Prot Dosimetry, 146(1-3):326-329, 2011.b Ayobi, E. et al., Middle-East J Sci Res, 8(3):669-673, 2011.
a

Air Separation of Needles from Chips
Air Classification used to separate needles in chipped loblolly pine
Element Order of increasing concentrations in spruce
K Needles > twigs > trunk wood > trunk bark ≥ branches ≥ shoots & leaves
Ca Trunk bark > needles ≥ branches ≥ trunk wood ≥ twigs > shoots & leaves
P Needles > twigs > shoots & leaves > trunk bark > branches > trunk wood
Si Needles > trunk wood > twigs > branches > trunk bark > shoots & leaves
Cl Trunk wood > needles > trunk bark > twigs > branches > shoots & leaves
S Trunk wood > needles > twigs > branches > trunk bark > shoots & leaves

Stover Leaching – Ash Removal• Power series fits to data• Equilibrium ash
reduction generally increased with temperature & acid concentration
• Similar patterns with alkali leaching
• Overall ash reduction is higher for alkali even at lower temperatures due to silica dissolution

• Losses of convertible material increase with temperature and catalyst concentration
• Approximately 25% of the material was solubilized at 1% sulfuric acid and 90°C
Stover Leaching – Recovery of Organics
• Alkali leaching results in greater losses of convertible material, especially at higher catalyst concentrations
• Considerable amounts of lignin solubilized
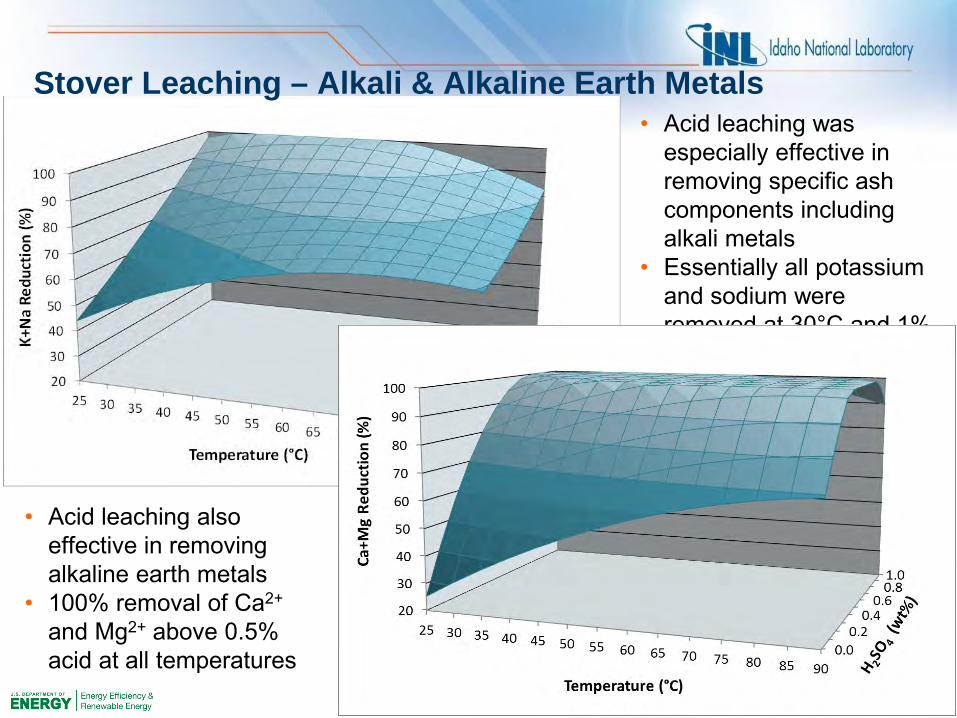
• Acid leaching was especially effective in removing specific ash components including alkali metals
• Essentially all potassium and sodium were removed at 30°C and 1% sulfuric acid
• Acid leaching also effective in removing alkaline earth metals
• 100% removal of Ca2+
and Mg2+ above 0.5% acid at all temperatures
Stover Leaching – Alkali & Alkaline Earth Metals

• Maximum achievable ash reduction as a function of T & pH
• Diffusion properties as a function of temperature, particle size and shape, and time
• Process and cost requirements to achieve a given ash reduction (total ash or ash components)
Data Support Kinetic Models for TEA
0.0
0.2
0.4
0.6
0.8
1.0
0 10 20 30 40 50 60
Nor
mal
ized
Conc
entr
atio
n of
Ash
Co
mpo
nent
Elapsed Time (Hours)
25 C
60 C
90 C
Unachievable fraction
Ash removal as a function of time
0.00.2
0.4 0.6 0.8 1.0
0%10%20%30%40%50%60%70%80%90%
2535
4555
6575
85
Ash
Rem
aini
ng (%
) 80%-90%70%-80%60%-70%50%-60%40%-50%30%-40%20%-30%10%-20%0%-10%

Summary
• A major barrier to replacing the entire barrel of oil is feedstock cost, which represents up to one-third of the final fuel cost
• The cost challenge cannot be solved independently of the feedstock quality challenge
• Least cost formulation together with mechanical and chemical separations can be used to address both challenges
• Air classification is a promising method to separate plant tissues that do not meet an ash specification
• Chemical leaching can improve the quality of low cost feedstocks as well as off-spec tissue fractions

Acknowledgements
This work is supported by the U.S. Department of Energy, Office of Energy Efficiency and
Renewable Energy, Bioenergy Technologies Office, under DOE Idaho Operations Office
Contract DE-AC07-05ID14517

The National Nuclear Laboratory
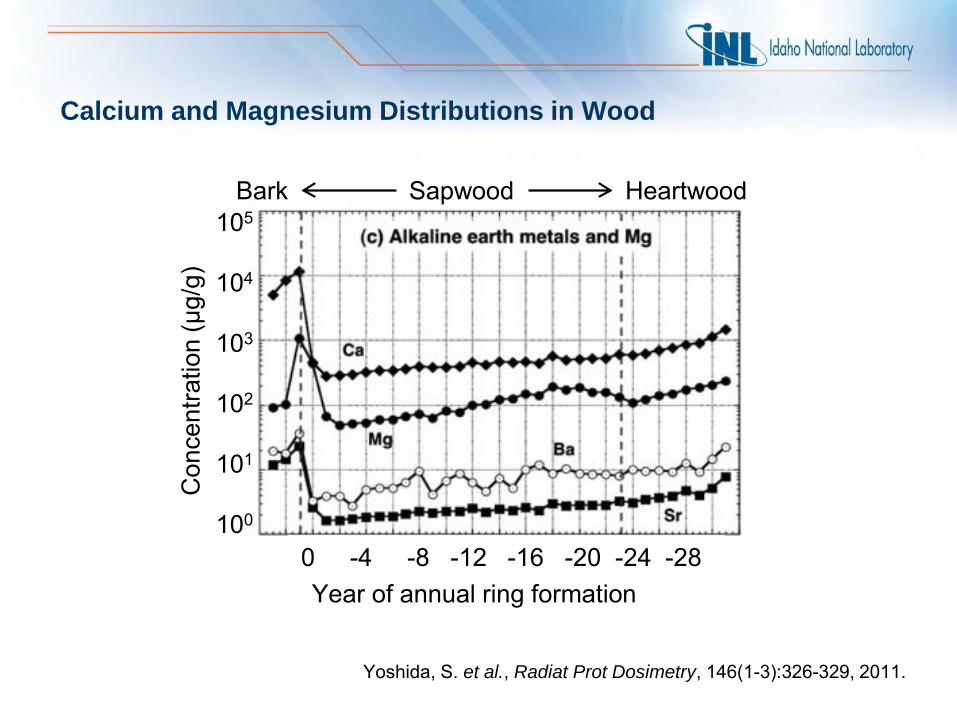
Calcium and Magnesium Distributions in Wood
105
104
103
102
101
100
Con
cent
ratio
n (µ
g/g)
Bark Sapwood Heartwood
0 -4 -8 -12 -16 -20 -24 -28Year of annual ring formation
Yoshida, S. et al., Radiat Prot Dosimetry, 146(1-3):326-329, 2011.