ashimiyu b. durojaiye
TRANSCRIPT

A NOVEL APPROACH FOR THE INVESTIGATION OF MULTIDISCIPLINARY
COLLABORATION USING SOCIAL NETWORK ANALYSIS ON ELECTRONIC
HEALTH RECORD DATA
By
Ashimiyu B. Durojaiye
A dissertation submitted to Johns Hopkins University
in conformity with the requirements for the
degree of Doctor of Philosophy
Baltimore, Maryland
August 2018
© Ashimiyu B. Durojaiye, 2018
All Rights Reserved

ii
Abstract
Social network analysis (SNA) is widely used to study multidisciplinary collaboration among
healthcare professionals. Most of the earlier works have however relied on survey and observational
data, which do not scale, and have been limited to only descriptive studies without providing insight
on how to improve patient outcomes. However, since the widespread adoption of electronic health
records (EHR) for care delivery, there has been progressively increasing interest in exploiting the
rich collection of activity data that are captured in EHR systems. Ability to exploit EHR data has the
potential to offer unprecedented capacity to study and improve multidisciplinary teams.
Unfortunately, the methodologic approaches used so far have had significant limitations, which have
hampered the realization of this promise.
In this dissertation, I describe a novel, process-mining based methodologic approach for applying
SNA to study multidisciplinary collaboration using metadata of clinical activities captured in EHR.
First, I described the process of linking the EHR activity metadata to trauma registry data, which is
rich in quality clinical and encounter data to produce a linked dataset that was used for the
dissertation. Second, I described and applied the methodology to identify collaborative EHR usage
patterns and correlated them to patient outcomes. I demonstrated that a more collaborative EHR
usage pattern were associated with shorter emergency department length of stay, in the process,
identifying meaningful insight that can be the focus of further research or intervention. And finally, I
described and applied a modification of the methodology to identify and compare diurnal variations
in collaborative care teams at various locations in the hospital. I demonstrated the presence of multi-
team systems and described how the composition and collaborative patterns of the multi-team
systems varied with the time of day.

iii
This dissertation provides a promising new direction for harnessing EHR data, and in doing so, sets
the stage for future studies.
Reader: Hadi Kharrazi
Advisor: Ayse P. Gurses
Dissertation Committee:
Ayse P. Gurses, Hadi Kharrazi, Harold Lehmann, Jerri Allen, Kitty Chan

iv
Acknowledgements
I would like to express utmost gratitude to my advisor, Ayse P Gurses, for the unrelenting support
of my doctoral research and other related research. I could not have wished for a better advisor and
a better project. I am thankful to members of the core project team: Nicolette McGeorge, for her
boundless energy and for laying the ground work; Kristen Webster for her “let’s get it done”
attitude; Gurmehar Singh Deol, for the stimulating discussions of opportunities, possibilities and
hacks; Patience Ossei, who was always there across the aisle to listen to me ramble about my
research; and Ephrem Abebe, for his advice and support on how to approach the dissertation.
To the members of my dissertation committee: Jeri Allen, Hadi Kharrazi, and Kitty Chan, I am
grateful for your foresight and constructive criticisms. Special thanks to Hadi Kharrazi for the time
and resources he committed, and for serving as the reader of my dissertation. And, many thanks to
the department for providing an enabling environment: Harold Lehmann, Kersti Winny, and
LaShawn Johnson-Thomas, I appreciate you all.
I would also like to thank collaborators within the institution that were instrumental to the research:
Scott Levin and Matthew Toerper, for guiding us through the entire institutional review board
process, data analysis, and for critical reviews of my manuscripts; Cathi Habertson and Laura
Fortman, for their invaluable help with data extraction; Lisa Puett for her immense support and for
always being there to answer my questions; and Dylan Stewart and James Fackler, for taking time off
their busy schedules to provide invaluable clinical insight. I am also thankful to collaborators outside
of the institution: Peter Hoonakker and Pascale Carayon, for their expert advice.

v
I would also like the thank people who I had the opportunity to work on other projects. I am
thankful to Amy Knight, Pamela Johnson, Paul Nagy, Gorkem Sevinc, Michael Cohen and Ed
Bunker. The opportunities they afforded me made my study and research experience robust.
To my colleagues and friends that were there to support me through the tough times: Seun
Ogunbona, Francis Fordjour, Aileme Omogbai, Jide Sowemimo, Gbadamosi Yusuf, Tolu Shada,
and Kemi Ibrahim, I say a big thank you. To the people who made personal sacrifices to ensure I
was able to pursue this doctoral study: Adebimpe Abudu, Abdulwariss Akinshipo and Abisoye
Oyeyemi, I am forever grateful. To my mother and siblings, for the various ways in which they
contributed to make this happen, I say a big thank you.
Lastly, I dedicated this dissertation to my wife, Remmie, and daughter, Zahra, who bore the
opportunity cost.

vi
Table of Contents
Abstract…………………………………………………………………………………………….ii
Acknowledgements………………………………………………………………………………...iv
List of tables…….………………………………………………………………………………...vii
List of figures…….……………………………………………………………………………….viii
Chapter 1: Introduction…………………………………………………………………………….1
Chapter 2: Literature review………………………………………………………………………...4
2.1: Multidisciplinary collaboration…………..……………………………………………...4
2.2: Social network analysis of healthcare professionals…...……….………………………..5
2.3: Limitations of prior studies…………………………………………………………….8
2.4: Contribution of this dissertation………………………………………...…………….10
Chapter 3: Dissertation overview…….……………………………………………………………11
3.1: Study context…………………………………………………………………………11
3.2: Methodologic overview……………………………………………………………….12
3.3: Overview of subsequent chapters……………………………………………………..17
Chapter 4: Linking electronic health record and trauma registry data: Assessing the value of
probabilistic linkage……………………………………………………………………………….18
Chapter 5: Evaluation of multidisciplinary collaboration in pediatric trauma care using electronic
health record data…………………………………………………………………………………42
Chapter 6: Evaluation of diurnal variation in collaborative care team structure at a pediatric trauma
center from EHR data…………………………………………………………………………….64
References.………………………………………………………………………………………..91

vii
List of tables
3.1 EHR metadata collected and the data fields collected for each metadata…………………..13
4.1 The nine variable combinations that were used for deterministic linkage………………….27
4.2 Comparison of characteristics of counters in the two datasets…………………………….32
4.3 Performance of the various combinations of variables attempted for deterministic linkage
listed in order of decreasing performance…………………………………………………33
4.4 Comparison of deterministically and probabilistically matched records……………………35
5.1 Demographic and encounter characteristics of the cohort………………………….............54
5.2 Comparison of the demography, encounter characteristics of the three usage patterns……58
6.1 Comparison of demographic and encounter characteristics of arrivals by shift……………77

viii
List of Figures
3.1 Determination of service information for healthcare professionals………………….…….15
4.1 Frequency distribution of match weights………………………………………………….35
5.1 Summary of the methodological approach to network representation…………………….52
5.2 Breakdown of the composition of the event log by event type……………………………55
5.3 The top 20 functional roles involved across all encounters………………………………..56
5.4 Determining optimal number of clusters in the similarity matrix…………………………..57
5.5 Iconic example of each usage pattern……………………………………………………...57
6.1 Comparison of the composition of various activity types by care location and shift type……..79
6.2. Determination of encounter threshold for each event log…………………………………80
6.3 Collaborative care team patterns in the emergency department……………………………..81
6.4 Collaborative care team patterns on the general care floor………………………………82
6.5 Collaborative care team patterns in the pediatric intensive care unit ..……………………..84

1
Chapter 1
Introduction
Multidisciplinary collaboration involving various healthcare professionals (HCP) (e.g. physicians,
nurses, physical therapists, social workers) is the mainstay of the delivery of modern healthcare as it
enables the provision of holistic, well-coordinated, safe, and quality care [1]. Compared to
management by independent care teams, management by collaborative multidisciplinary care teams
has been shown to improve symptoms in patients with depression and anxiety [2], glycemic control
in patients with diabetes [3], overall health in patients with multiple chronic conditions [4], and in
reducing mortality among severely injured trauma patients [5]. Effective multidisciplinary care teams
are however not commonplace [6-9], and identifying ways to improve the organization and function
of multidisciplinary care teams is a prominent research area.
Social network analysis (SNA) is widely used to study collaboration among healthcare professionals
[10-12]. SNA facilitates the understanding of the complex collaboration patterns that is typical in
healthcare settings by providing a way to represent the members of a multidisciplinary care team and
to explore the relationships among them. Previous studies that employed SNA to study
collaboration among healthcare professionals were typically accomplished using either survey or
observational data [13]. However, these data sources are limited in that they are labor-intensive to
collect and are not scalable [14], and have difficulty in capturing the intricate details of collaboration
within healthcare facilities [15].
In the past five years, with the pervasive adoption of electronic health record (EHR) systems for
care delivery, there has been efforts to exploit routinely captured EHR data [16]. The rationale

2
behind this is that the EHR is a longitudinal record of care that implicitly or explicitly captures
collaboration among HCPs [17-21], and the ability to harness this data offers a scalable approach to
evaluate multidisciplinary collaboration over larger populations and time periods than feasible
through surveys or direct observation. This includes efforts to identify collaborative care teams [15,
17-20], and quantify patterns of collaboration that are associated with positive outcomes [22-24].
The common goal of these efforts is to gain new insights that may enhance collaborative work and
consequently improve patient outcomes. Most of these efforts, however, have been mostly
descriptive, have important methodologic limitations (e.g. failure to address temporality, coarse
representation of healthcare professionals), and have not offered meaningful insight into how to
improve multidisciplinary collaboration in order to improve patient outcomes.
The aims of this dissertation are to describe a novel methodologic approach for applying SNA to
study multidisciplinary collaboration using EHR data, and to demonstrate that meaningful insights
can be obtained from EHR data to improve multidisciplinary collaboration.
This dissertation is divided into three research papers:
1. Linking electronic health record and trauma registry data: Assessing the value of
probabilistic linkage.
In this paper, I described the process of linking EHR and trauma registry data at the institutional
level to obtain the linked dataset that was used for subsequent work in this dissertation. Specific
questions addressed in the paper are:
I. What combination of available variables is best for linking EHR to registry data via
deterministic linkage?
II. Is there a value to performing probabilistic linkage beyond using the deterministic linkage?

3
2. Evaluating multidisciplinary collaboration in pediatric trauma care using EHR data.
In this paper, I identified collaborative EHR usage patterns among healthcare professionals and
determined how the identified patterns are related to patient outcomes adjusted for patient and
encounter characteristics. The specific question addressed in this paper is: “Are collaborative EHR usage
patterns related to patient outcomes?” The working hypothesis was that “collaborative EHR usage patterns data
are related to patient outcomes”.
3. Examining diurnal differences in collaborative care teams at a pediatric trauma center
using EHR data.
In this paper, I identified and described diurnal differences in composition and organization of
collaborative care teams at various care locations at a Level I pediatric trauma center. The specific
question addressed was: “What are the diurnal differences in the composition and patterns of collaboration
among collaborative care teams?”
Relevance of this dissertation
This dissertation introduces a new methodologic approach for applying SNA to study
multidisciplinary collaboration using EHR data. This new methodology addresses several of the
limitations of prior approaches. This research effort also demonstrates that meaningful insights that
can be used to identify opportunities for improving multidisciplinary collaboration or to direct and
focus future research efforts can be obtained from EHR data. Overall, this dissertation provides a
promising new direction for harnessing EHR data to study and improve multidisciplinary care teams,
and in doing so, sets the stage for future studies.

4
Chapter 2
Literature review
2.1 Multidisciplinary collaboration
Due to the rapid explosion of medical knowledge and the proliferation of specialties, the delivery of
healthcare has transitioned from an era in which a single doctor could provide comprehensive care
to an era in which HCPs from different disciplines are required to collaborate to provide holistic,
safe and quality care to patients [25]. Also called interdisciplinary collaboration [26], the term
multidisciplinary collaboration can be explained by its constituent words: multidisciplinary means
that healthcare professionals from two or more disciplines are involved in care delivery [27, 28],
while collaboration refer to the “planned or spontaneous engagements that take place between
individuals or teams of individuals, whether in-person or mediated by technology, where
information is exchanged in some way (either explicitly, i.e. verbally or written, or implicitly, i.e.
through shared understanding of gestures, emotions, etc.), and often occur across different roles (i.e.
physician and nurse) to deliver patient care” [29]. There are two aspects to multidisciplinary
collaboration: the composition of the multidisciplinary care team (i.e. team structure) and the nature
of the relationships among constituent members (i.e. team dynamics) [30, 31].
The outcomes of patients managed by multidisciplinary care teams have been shown to be superior
to the outcomes of patients managed otherwise for various health conditions [2-5]. Management by
multidisciplinary care teams provided better control of symptoms in patients with depression and
anxiety [2], resulted in better glycemic control in patients with diabetes [3], improved overall health
in patients with multiple chronic conditions [4], and reduced mortality among severely injured

5
trauma patients [5]. Nevertheless, effective multidisciplinary care teams are not commonplace [32].
There is the tendency for HCPs to function in silos, focusing solely on their unique aspect of care,
giving rise to in fragmented and un-coordinated care, and collaboration breakdown, which is a threat
to patient safety and quality care [33, 34]. Consequently, finding ways to assess and subsequently
improve collaboration among members of the multidisciplinary care team members is crucial.
2.2 Social network analysis of healthcare professionals
Social network analysis (SNA) is a quantitative methodology that is widely used to study collaboration
among healthcare professionals [10-13]. SNA provides a way to represent and understand the complex
interactions among members of a multidisciplinary care team. The intricacies of SNA are described in
details by Knoke and Yang [35] and Wasserman and Faust [36]. The application of SNA to study
collaboration among healthcare professionals has had two important limitations. First, most of the
studies have been descriptive, describing network structures. These studies have mostly did not
explore the relationship of network structures to patient outcomes and failed to offer insight into how
network structures can be improved or can be leveraged to improve patient outcomes [10, 12, 13].
Chambers and colleagues [13], in their systematic review, concluded that there is “an absence of
evidence to demonstrate that using SNA can enable intelligent targeting of key relationships and
collaborations to facilitate better uptake and utilization of knowledge”. Recently, Bae and colleagues
[10], in another systematic review, also concluded that studies were descriptive and provided no
suggestions of interventions to improve network structures in order to improve patient outcomes [10].
Second, most of the studies employed survey or observational data, which are labor intensive to collect
and do not scale [14], and are limited in their ability to capture the intricate details of collaboration in
healthcare settings [13].
6
With the ubiquitous adoption of EHR for care delivery, there has been increasing interest in the
exploitation of routinely collected EHR data to study multidisciplinary collaboration [16]. This is partly
stemming from the fact that the EHR is a longitudinal record of care that either explicitly or implicitly
captures interactions among healthcare professionals caring for patients. In addition, ability to exploit
the EHR data offers an unprecedented and scalable opportunity to study multidisciplinary
collaboration among healthcare professionals over larger populations and time periods and to a greater
extent than feasible through surveys or direct observation. Consequently, there has been efforts to
identify collaborative care teams [15, 17-20], and quantify patterns of collaboration that are associated
with positive outcomes [22-24] using EHR data. The common goal of these efforts is to gain new
insight that may enhance collaborative work and consequently improve patient outcomes.
One of the earliest efforts to use EHR data for SNA was by Gray and colleagues [20], who
developed a platform called the “Digital Crumb Investigator” that employed EHR access logs to
characterize the structure of care teams in a bid to identify ways of improving patient outcomes. The
platform was used to study the structure of nursing handoffs in the neonatal intensive care unit at
their institution and their relationship to family satisfaction [19]. They were able to develop a novel
metric: Mean Repeat Caregiver Interval that provided a valid and valuable way of measuring care
continuity at their institution.
Another notable SNA effort was by Soulakis and colleagues [15], who visualized collaborative EHR
usage for hospitalized patients with congestive heart failure. They constructed a provider-patient
network by making the assumption that a time-stamped access and updates of a patient's EHR record
reflected a provider-patient interaction. The authors then created a second provider-provider network
by considering shared patient record access by different providers as provider-provider interaction.
By using these two networks, they were able to identify the providers that were involved in the care

7
of individual patients and obtained descriptive network statistics for the modularity of provider
interactions and provider cliques. They concluded that further research may lead to how record-access
can be used to strategically guide care coordination for patients with congestive heart failure. In a
follow-up study, Carson and colleagues [23], using EHR data from emergency department, and patient
satisfaction as an outcome variable, construct a social network and calculated a novel metric, the
Shared Positive Outcome Ratios (SPOR) that quantified the concentration of positive outcomes
between a "pair" of healthcare providers over a set of shared patient encounters [23].
In another study, Chen and colleagues investigated whether it was possible to identify patient care
teams from EHR data [17]. They developed a data-mining framework that employed latent topic-
modeling and social network analysis to infer patterns of collaborative care teams, which were
assessed for plausibility by clinicians. They identified 34 care teams across their institution out of
which 27 were considered plausible by clinicians. They concluded that collaborative care teams can
be mined from EHR data. In a follow-up study, Chen and colleagues employed spectral co-
clustering to infer patterns of interactions of healthcare professionals from EHR access log data and
correlated the identified interactions patterns to hospital length of stay of trauma patients adjusted
for patient and encounter characteristics [22]. They identified three distinct interaction patterns. The
pattern with the greater degree of collaboration was associated with shorter hospital stay suggesting
that greater collaboration resulted in shorter hospital stays. However, they did not identify causative
factors that could be the target of an intervention or provide insight on how to improve
collaboration among HCPs.
Lastly, Conca and colleagues conducted a study to understand patterns of collaboration between
physician, nurses and dietician that care for patients with diabetes mellitus [24]. They employed
process mining techniques on outpatient encounter data and identified seven distinct collaboration

8
patterns that differed in the care team composition and degree of participation by each team
member. The collaboration pattern in which physicians, nurses and dietitians participated in a
balanced manner correlated with higher proportions of patients with acceptable glycemic control
suggesting that effective multidisciplinary collaboration resulted in improved patient outcomes.
However, a major limitation of their study was that their assessment was limited to collaboration
among just three healthcare professionals involved in the care of diabetic patients. In addition, they
did not control for patient factors such as severity of the condition and the presence of co-
morbidities.
2.3 Limitations of prior studies
Four important limitations were identified from the review of prior studies:
1. Use of EHR access log data: Most of the previous studies have employed data from EHR
access logs, which all certified EHRs are required to maintain in order to be compliant with the
Health Insurance Portability and Accountability Act (HIPAA) [37, 38]. All accesses of patients’
records including time of access, data element accessed, identity of actor, and type action
performed are captured in EHR access logs with the aim of providing an immutable event trail
to facilitate security audits [39, 40]. However, a simple access of a patient’s record does not
necessarily imply being on the patient’s care team [41]. For example, inadvertent patient record
access. In addition, a single patient record access may spawn multiple records in the access log,
which makes analysis of EHR access logs difficult [17, 22]. Furthermore access logs are known
to have considerable data quality issues that sometimes limit their usefulness [42]. These factors
suggests that EHR access logs may not be the ideal EHR data to employ for SNA.

9
2. Limited representation of HCPs: Previous studies have represented HCPs in a coarse or
incomplete manner that is not reflective of reality, and this limits the ability to discern
interactions among HCPs. For example, Gray and colleagues [20] categorized HCPs into five
coarse groups: attending physicians, nursing professionals, medical trainees (e.g. fellows,
residents and medical students), other clinicians (e.g. physical therapist, respiratory therapist),
and administrative staff. Such coarse and arbitrary groupings implicitly equates the roles and
responsibilities of healthcare professionals within each group, hence the nature and manner of
their interactions, which is not in concordance with actual clinical practice. Conca and colleagues
[24], on the other hand, limited their evaluation to physicians, nurses and dietitians when many
more HCPs are typically involved in care of a patient with diabetes. Furthermore, they made no
attempt to distinguish the different types of physicians (e.g. nephrologists, cardiologists) that
were involved with the patients. Representation of HCPs in a fashion that is close to actual
clinical practice is likely to lead to increased ability to discern the way HCPs collaborate.
3. Failure to address temporality: EHRs are used to capture longitudinal record of care,
consequently, in order to appropriately utilize EHR data for assessing collaboration among
healthcare professionals, the temporal nature of the data must be considered. However, this has
not been the case with many of the previous studies. Past studies have not addressed temporality
and have assumed that all healthcare professionals were collaborating with one another,
regardless of time, which does not reflect actual clinical reality. For example, within a two-day
hospital stay, it is likely that different healthcare professionals will be involved at different stages
of care and at different locations in the hospital. Chen and colleagues [22] and Soulakis and
Colleagues [15] cited the lack of consideration of temporal relationships and the inability to take
length of stay into account as a limitation of their studies, respectively. Prior studies have shown
that addressing temporality can improve the ability to identify and interpret clinical associations
10
[43], and addressing temporality in network construction can lead to more reflective and
interpretable patterns.
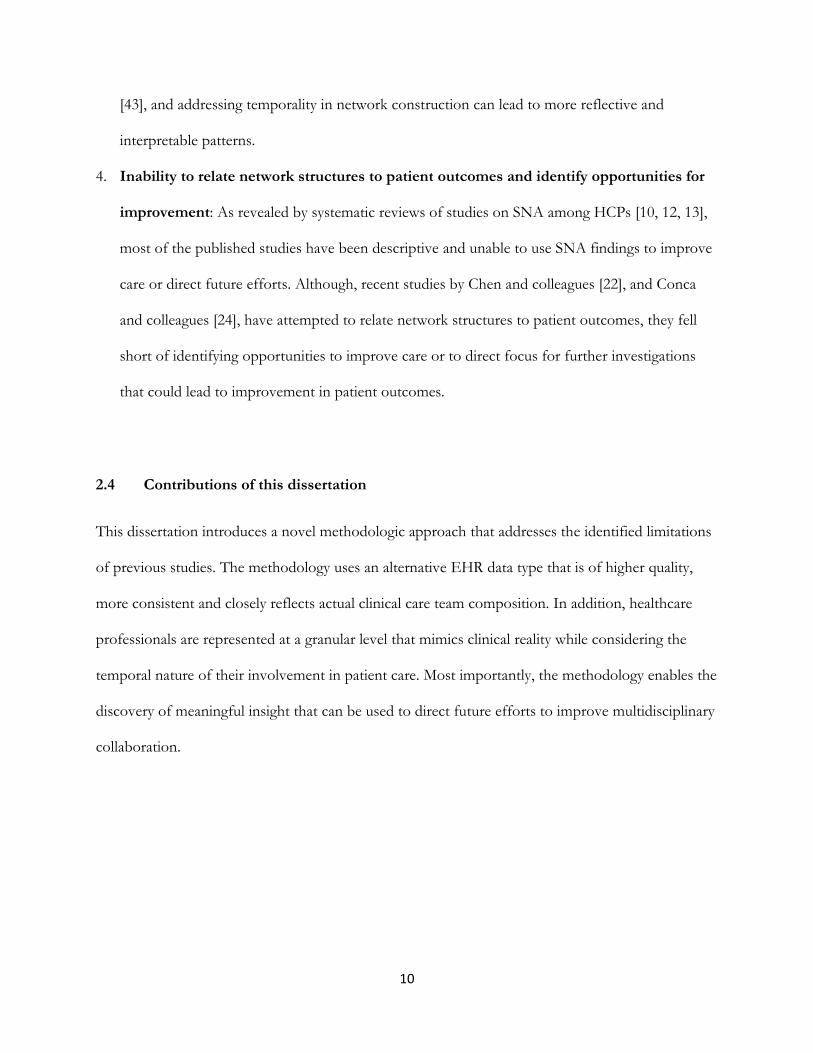
4. Inability to relate network structures to patient outcomes and identify opportunities for
improvement: As revealed by systematic reviews of studies on SNA among HCPs [10, 12, 13],
most of the published studies have been descriptive and unable to use SNA findings to improve
care or direct future efforts. Although, recent studies by Chen and colleagues [22], and Conca
and colleagues [24], have attempted to relate network structures to patient outcomes, they fell
short of identifying opportunities to improve care or to direct focus for further investigations
that could lead to improvement in patient outcomes.
2.4 Contributions of this dissertation
This dissertation introduces a novel methodologic approach that addresses the identified limitations
of previous studies. The methodology uses an alternative EHR data type that is of higher quality,
more consistent and closely reflects actual clinical care team composition. In addition, healthcare
professionals are represented at a granular level that mimics clinical reality while considering the
temporal nature of their involvement in patient care. Most importantly, the methodology enables the
discovery of meaningful insight that can be used to direct future efforts to improve multidisciplinary
collaboration.

11
Chapter 3
Dissertation overview
3.1 Study context
This dissertation was conducted as part of a larger project titled: “Care Transition and Teamwork in
Pediatric Trauma: Implications for Health Information Technology Design” [44]. The parent project
is an Agency of Healthcare Research and Quality (AHRQ) funded 5 year R01 study at three Level I
pediatric trauma centers in the United States: Johns Hopkins Children’s Center, Baltimore, Maryland;
University of Wisconsin-American Family Children’s Hospital, Madison, Wisconsin; and Johns
Hopkins All Children’s Hospital, St. Petersburg, Florida. The overall goal of the parent project is to
design the next generation health information technology (HIT) systems that would more effectively
support cognitive teamwork around care transitions of pediatric trauma patients to and from the
pediatric ICU (PICU). The specific aims of this project are: (1) Describe the cognitive teamwork
involved in care transitions of pediatric trauma patients; (2) Develop and test design requirements for
future health IT that supports cognitive teamwork for enhancing safety, quality, and family-
centeredness of care. The parent study employs both qualitative and quantitative methods and
provided a unique opportunity for this dissertation. This dissertation was conducted at the Johns
Hopkins Children's Center (JHCC), which is a Level I pediatric trauma center in the state of Maryland
that manages about a 1000 pediatric trauma patients every year.
Unintentional injury is the leading cause of morbidity and mortality in children in the United States
(US) [45, 46]. The Center for Disease Control (CDC) calls pediatric trauma one of "the most under-
recognized public health problems" facing the United States [47]. Every year, almost 9 million children

12
are evaluated and treated in emergency departments for traumatic injuries resulting in about 225,000
admissions and approximately 10,000 deaths [48]. Children who survive trauma face the lifelong
possibility of living with disability [49]. The economic costs of pediatric trauma is estimated to top
$200 billion annually [48]. Appropriate care of pediatric trauma patients is essential in order to achieve
good outcomes [49]. Pediatric trauma care is inherently multidisciplinary as pediatric trauma patients
typically sustain multiple injuries requiring specialized care by various health care professionals that
must coordinate care in order to achieve good outcomes [50, 51]. Consequently, it provides a suitable
population and context for this dissertation.
3.2 Methodologic overview
3.2.1 EHR data
This study employed the metadata reflecting actual clinical activities that were performed by
healthcare professionals and captured in the EHR. For example, when an order is placed, a
corresponding record containing details of the order is captured in the EHR. The collected metadata
include data fields such as the encounter ID, the timestamp when the order was placed, the ID and
generic role (e.g., attending, resident) of the HCP that placed the order, and the care location where
the order was placed. The metadata of five different clinical activities that constitute the majority of
direct patient care activities captured in the EHR were collected. These included notes (45 different
types), procedures orders, medication orders, medication administration records, and flowsheet
entries. The data fields obtained for each clinical activity type are listed in Table 3.1. Results data
generated in response to these orders, such as laboratory results, and imaging reports, were deemed
unnecessary to the SNA and were excluded from the study.
13
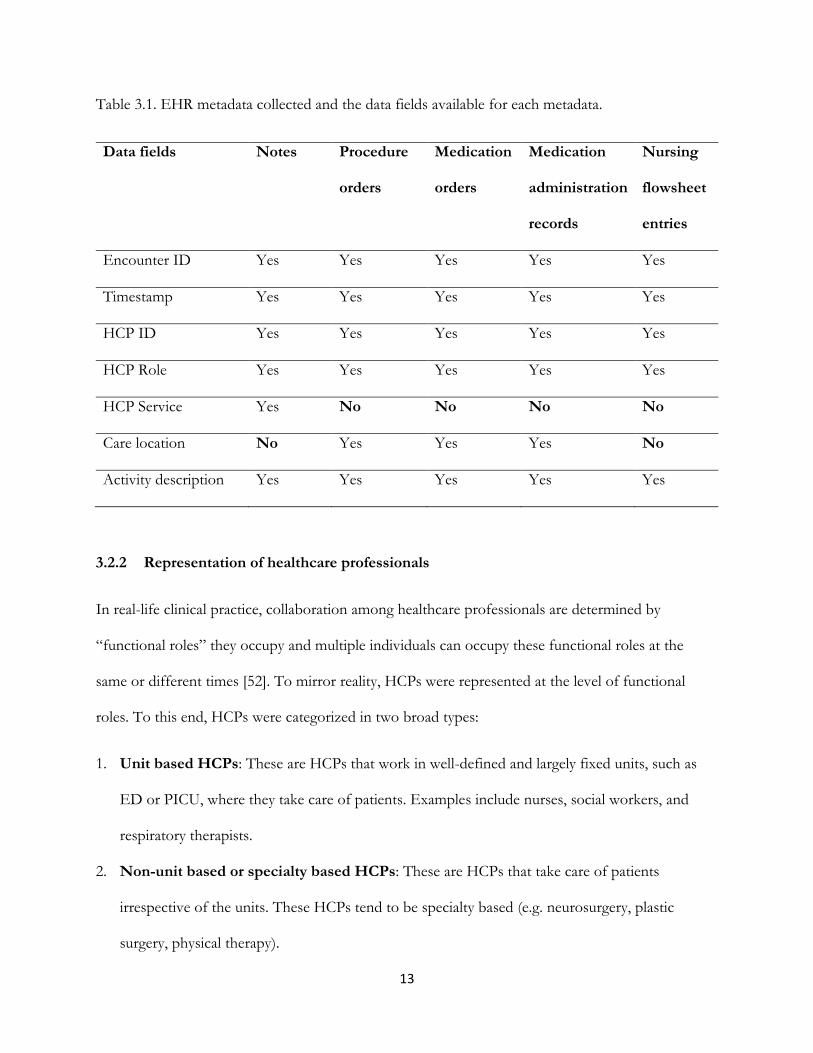
Table 3.1. EHR metadata collected and the data fields available for each metadata.
Data fields Notes Procedure
orders
Medication
orders
Medication
administration
records
Nursing
flowsheet
entries
Encounter ID Yes Yes Yes Yes Yes
Timestamp Yes Yes Yes Yes Yes
HCP ID Yes Yes Yes Yes Yes
HCP Role Yes Yes Yes Yes Yes
HCP Service Yes No No No No
Care location No Yes Yes Yes No
Activity description Yes Yes Yes Yes Yes
3.2.2 Representation of healthcare professionals
In real-life clinical practice, collaboration among healthcare professionals are determined by
“functional roles” they occupy and multiple individuals can occupy these functional roles at the
same or different times [52]. To mirror reality, HCPs were represented at the level of functional
roles. To this end, HCPs were categorized in two broad types:
1. Unit based HCPs: These are HCPs that work in well-defined and largely fixed units, such as
ED or PICU, where they take care of patients. Examples include nurses, social workers, and
respiratory therapists.
2. Non-unit based or specialty based HCPs: These are HCPs that take care of patients
irrespective of the units. These HCPs tend to be specialty based (e.g. neurosurgery, plastic
surgery, physical therapy).

14
The steps taken to identify functional roles for unit-based and specialty-based services are given in
Figure 3.1. For unit-based HCPs, a patient encounter timeline was obtained for each patient and the
frequency distribution of the care locations (unit) where each HCP performed activities across all
patient encounters were obtained. The mode (i.e., location where the HCP performed most of the
activities) of the frequency distribution was taken as the unit of the HCP. For specialty based
services, the service of each identified attendings was first identified by taking the mode of the
frequency distribution of the service information in the notes metadata. If the service could not be
identified due to missing service information in the notes, chart review and institution provider
directory lookup were conducted. Next, attendings' service information was used to obtain the
services of nurse practitioners and fellows by taking the mode of the frequency distribution of the
services of the attendings that co-signed the notes that nurse practitioners and fellows authored. As
residents frequently rotated though various services as part of their training, it was assumed that the
service was variable. Consequently, the service of residents was obtained on an encounter basis by
taking the service of the resident for that particular encounter as the service of the attending that co-
signed the notes that the resident authored during that encounter.

15
Figure 3.1. Determination of service information for healthcare professionals.
3.2.3 Addressing temporal nature of EHR data
Temporality was addressed by taking a process mining approach. Process mining is a field of data
science that “aims to discover knowledge from process logs in order to discover, monitor and improve
real processes” [53-56]. Process mining is an emerging research field that focuses on providing
evidence-based process analytic techniques and tools for effective process management [54]. Process
mining techniques make use of the data in event logs to carry out detailed analysis on the behavior of
operational processes [57]. It has been applied by many organizations across many various fields
including banking, insurance, government, education and transportation [54-56, 58, 59]. Process
mining is used for process discovery, conformance checking, and process enhancement [60]. Process
mining supports four analytical perspectives; control-flow, organization, time and case perspective
[56].
This dissertation focuses on the organizational perspective. The organizational perspective involves
analyzing organizational resources to better understand the roles that resources, human and non-

16
human, play in process enactment [61], and supports the derivation of social networks from event
logs [62]. An event log is the starting point of process mining [63]. An event log is a collection of
activities, with each activity representing a well-defined step in a particular process. Each activity is
also related to a case (i.e. an instance of the process), and is usually associated with a timestamp when
the activity occurred. All events belonging to a case are ordered chronologically and this sequence of
events represent as an instance of the process. Well-defined “metrics” that are based on the sequence
of events can be used to define relationships between actors associated with activities in an event log
to derive social networks [62].
3.2.4 Correlating with patient outcomes and deriving insight
The methodology employs two approaches to enable the correlation of network structures with
patient outcomes:
1. Use of clinical data from trauma registry: In addition to the EHR, data were obtained from
the Johns Hopkins pediatric trauma registry. Every trauma center is required to maintain a
trauma registry. Trauma registries are rich in clinical data that are well-defined, carefully
abstracted and validated, with stable semantics. Data fields obtained from the trauma registry
included key outcome variables such as ED, PICU and hospital LOS. Although LOS data can
obtained from admission, discharge, and transfer (ADT) data, LOS data was obtained from the
trauma registry because it is more accurately captured. ADT-based data may overestimate the
LOS because medical records are usually started for patients prior to arrival in order to facilitate
prompt care. Data fields such as age, gender, trauma activation, origin, mode of arrival, injury
type, injury severity score, Glasgow Coma Scale (GCS) were also obtained. These data fields are
important confounding variables that we used to adjust outcomes in Chapters 5 and 6.

17
2. Patient-centered approach: Multidisciplinary collaboration was evaluated in a patient-centered
fashion rather than a cohort-centric fashion. This allowed for the ability to classify collaboration
patterns associated with patient encounters and identify characteristics of collaboration patterns
and encounters that were correlated with positive patient outcomes.
3.3 Overview of subsequent chapters
The next three chapters are manuscripts authored and submitted to peer-reviewed journals as part of
this dissertation. Each manuscript builds on the preceding manuscript and details a specific aspect of
this dissertation. Chapter 4, describes the process of linking the EHR and trauma registry data to
obtain the linked/merged dataset that was used to enable subsequent chapters. The chapter
describes the context, challenges, and the approach taken to enable the linkage. Chapter 5 describes
the process of representing patient-centered multidisciplinary collaboration as network structures of
EHR utilizations patterns, correlated the network structures to patient outcomes, and generated
insights that can be the focus of further investigative efforts. Chapter 6 investigates the presence of
multi-team system structures by comparing collaborative care team composition and collaboration
patterns at different locations within the hospital during the day and at night.

18
Chapter 4
Linking Electronic Health Record and
Trauma Registry Data: Assessing the Value of
Probabilistic Linkage
19
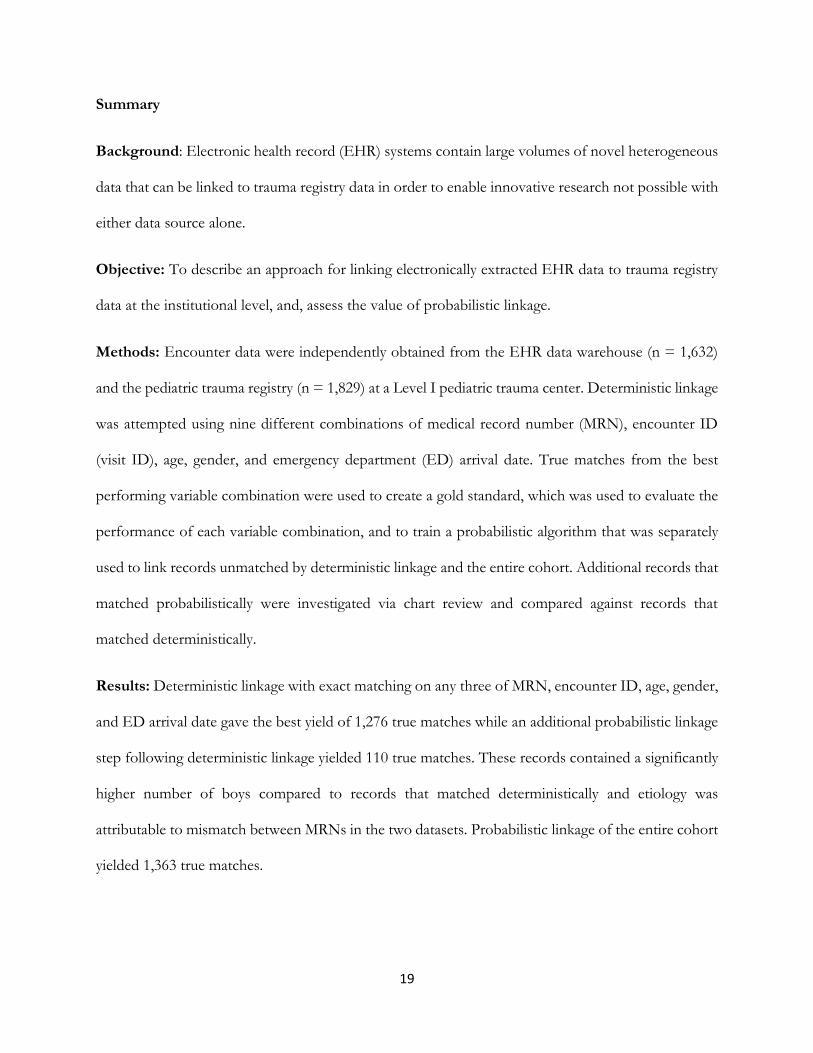
Summary
Background: Electronic health record (EHR) systems contain large volumes of novel heterogeneous
data that can be linked to trauma registry data in order to enable innovative research not possible with
either data source alone.
Objective: To describe an approach for linking electronically extracted EHR data to trauma registry
data at the institutional level, and, assess the value of probabilistic linkage.
Methods: Encounter data were independently obtained from the EHR data warehouse (n = 1,632)
and the pediatric trauma registry (n = 1,829) at a Level I pediatric trauma center. Deterministic linkage
was attempted using nine different combinations of medical record number (MRN), encounter ID
(visit ID), age, gender, and emergency department (ED) arrival date. True matches from the best
performing variable combination were used to create a gold standard, which was used to evaluate the
performance of each variable combination, and to train a probabilistic algorithm that was separately
used to link records unmatched by deterministic linkage and the entire cohort. Additional records that
matched probabilistically were investigated via chart review and compared against records that
matched deterministically.
Results: Deterministic linkage with exact matching on any three of MRN, encounter ID, age, gender,
and ED arrival date gave the best yield of 1,276 true matches while an additional probabilistic linkage
step following deterministic linkage yielded 110 true matches. These records contained a significantly
higher number of boys compared to records that matched deterministically and etiology was
attributable to mismatch between MRNs in the two datasets. Probabilistic linkage of the entire cohort
yielded 1,363 true matches.

20
Conclusion: The combination of deterministic and an additional probabilistic methods represents a
robust approach to linking EHR data to trauma registry data. This approach may be generalizable to
studies involving other registries and databases.
Keywords: record linkage, deterministic linkage, probabilistic linkage, trauma registry, electronic
health records

21
Introduction
The trauma registry has been a driving force behind trauma care improvement over the past decades
[64, 65]. The widespread adoption of electronic health record (EHR) systems however, has created
large volumes of heterogeneous clinical data, structured (e.g. problem list, care team) and unstructured
(e.g. radiology reports), that are not captured in trauma registries. These novel data types, when used
in combination with trauma registry data, can enable innovative research to improve trauma care.
Unfortunately, as with other registries, trauma registries are poorly interfaced with EHR systems,
which poses an obstacle to leveraging both data sources [66, 67].
Trauma researchers have often combined EHRs and trauma registry data via manual chart reviews
using unique identifiers obtained from the trauma registry. However, this approach is not feasible for
obtaining large volumes of heterogeneous data from EHRs. In addition, many institutions have
switched EHR vendors [68]; meaning some legacy EHR data may be unavailable in operational EHR
systems, or the legacy EHR systems may be unavailable for chart review [69, 70]. Alternatively, data
could be electronically extracted from EHR systems via structured queries and then computationally
linked to registry data. This approach is scalable, flexible, inexpensive [71, 72], and produces an EHR
extract that is, at a minimum, of equal quality to that obtained from chart review. Furthermore, the
latter approach can be superior to chart review in case ascertainment [71].
Records can be computationally linked using two common approaches: (1) Deterministically, which
usually involves exact or approximate matching on data such as medical record number (MRN) and
patient demographics [73, 74]; and, (2) Probabilistically, which involves comparing records over the
set of available and common data in order to determine the likelihood that any two records from the
compared datasets are for the same entity [73-75]. The accuracy of deterministic linkage depends on
the availability of high quality data. Thus, in the context of low quality data, its performance can be

22
less than desirable [76], which can result in linkage errors (i.e. missed matches or wrong matches) that
can bias studies based on the linked dataset [77]. Although the performance of probabilistic linkage
depends on the discriminative power of available data, it is often more reliable given the common low
quality data in healthcare [76], and is often used to supplement deterministic linkage, particularly in
the presence of limited patient identifiers [74].
To the extent of our knowledge, published studies [78, 79] on linking trauma registry to other
independent databases within the same institution have relied on deterministic linkage. Probabilistic
linkage has not been attempted, even when a significant number of records were unmatched.
Moreover, as most patient identifiers and demographic information that are often used for
deterministic linkage are protected health information (PHI) [37], and are increasingly not available to
researchers due to privacy concerns [80, 81], it is often unclear which combination of available
variables will perform best deterministically and if there is a role for probabilistic linkage.
Objectives
The primary objective of this study is to describe a process for linking electronically extracted EHR
data to trauma registry data at the institutional level. The secondary objective is to assess the value of
probabilistic linkage by determining (1) if it provides better performance over deterministic linkage
when used as the single linkage method; and (2) if it provides additional improvement in performance
when used as a complementary/secondary linkage method following deterministic linkage.

23
Methods
Setting
Johns Hopkins Children’s Center (JHCC) is a Level I pediatric trauma center in Baltimore, Maryland
that receives approximately 1,000 pediatric trauma patients in its emergency department (ED)
annually. Incoming patients are triaged to one of four trauma activation levels: Alpha, Bravo, Consult
and ED Response that determine the composition of the multidisciplinary trauma team assigned to
these patients. Alpha is triggered for severely injured patients with life-threatening injuries while Bravo
is initiated for moderate-to-severely injured patients without life-threatening injuries. Consult is
activated for three types of patients: inter-facility transfers of relatively unstable patients that require
a modified trauma team activation (i.e. Critical Trauma Transfers); inter-facility transfers of relatively
stable patients that do not require trauma team activation (i.e. Regular Trauma Transfer); and stable
patients received directly in the ED that require non-urgent trauma team review. ED Response is
activated for patients with minor injury that can be managed alone by ED providers.
Due to the nature of traumatic injuries and limitations of existing systems for pre-hospital notification,
incoming trauma patients frequently remain unidentified during the initial in-hospital trauma care
period. JHCC follows a common workflow for working with such patients. Following trauma
activation, a medical record is started using an alias name (e.g. John Doe, Jane Doe) in order to enable
pre-arrival preparation and facilitate prompt treatment on arrival. During in-hospital care, once patient
identity is verified, an attempt is made to determine if the patient has an existing medical record. If a
medical record is found, the index encounter record is merged into the existing medical record either
when the patient transitions between care locations or sometime after hospital discharge. Following
the record merger, the MRN associated with the alias record is retired but is mapped to the MRN of
24
the older record. If no previously existing medical record is found, the alias record is updated with
patient details and becomes the official record for the patient, along with the associated MRN.
Data sources
Electronic health record system
Prior to August 2014, the EHR in the ED was the Allscripts HealthMatics ED (HMED) and the EHR
in the inpatient settings was the Allscripts Sunrise Clinical Manager (SCM). In August 2014, the ED
transitioned to Epic and in July 2016, the inpatient settings transitioned to Epic as well. During and
post-EHR transition, MRNs, which uniquely identifies a patient, were kept backward-compatible
between the old and new EHR systems; however, encounter IDs (EID), also known as visit ID, which
uniquely identifies a patient encounter, were not. HMED and SCM are no longer available for chart
review due to operational reasons. All EHR data were extracted from Epic data warehouse (i.e. Epic
Clarity database), which is managed by a center within the institution that is also responsible for
providing access to the data for research purposes. Data is typically provided to researchers as “limited
datasets” that do not contain PHI. However, MRN and EID are sometimes provided to enable fixing
of data quality issues via chart review.
Pediatric trauma registry
The pediatric trauma registry has been in operation since 1992 and it is managed by the pediatric
trauma program. Currently, two full-time employees are responsible for concurrent data entry (i.e.
data collection and entry while patient is still admitted [82]) and data validation. The inclusion criteria
and data elements are defined in the Maryland Trauma Registry Data Dictionary for Pediatric Patients

25
[83]. All data are manually abstracted from various sources that include the institution’s paging system,
the state’s ambulance records system, the operational EHR, and a manually maintained spreadsheet
for tracking patients. Prior to August 2014, ED-related EHR data were abstracted from HMED while
inpatient-related EHR data were abstracted from SCM. During EHR transition (between August 2014
and June 2016), however, ED-related data were captured from Epic while inpatient-related EHR data
(including EID) were captured from SCM. Since July 2016, all EHR data are abstracted from Epic.
Study population and cohort selection
The linkage was conducted at the patient encounter level, thus independent encounters for the same
patient were treated as separate encounters. All encounters from September 1, 2014 through
December 31, 2017 that involved a true trauma team activation was our desired cohort. This translated
to encounters with a trauma activation of Alpha, Bravo or Critical Trauma Transfer. We collected
records of these trauma activations from the trauma registry. However, some unknown number of
encounters with trauma activation of Regular Trauma Transfer were included as they could not be
reliably distinguished from Critical Trauma Transfer encounters. To obtain EHR dataset, The data
warehouse was queried for encounters involving pediatric patients (0 – 18 years) that had a trauma
activation documented in their ED care timeline, a chief complaint containing case-insensitive
“trauma” or a trauma activation (e.g. Alpha), or had documentation of primary or secondary survey
of trauma resuscitation. From this master EHR dataset, records of the desired trauma activations were
selected. However, records with missing trauma activation were included to prevent premature
exclusions based on missing data. By restricting both the EHR and registry datasets to be as close as
possible to the desired cohort, we perform a form of blocking on trauma activation in order to increase
the ‘a priori’ probability of matching and, as a result, the chances of higher yield.

26
Linking variables
Three types of variables were available in both datasets:
1. Direct identifiers, which included MRN and EID. Since linkage was at the level of patient
encounter, MRNs did not necessarily uniquely identified patients due to possibility of multiple
encounters for the same patient and the possibility of mismatch between MRNs in the datasets
due to the workflow for working with unidentified patients. Although EIDs should uniquely
identify patients, however, due to EHR transition, EIDs are not consistent captured across
the study period. In addition, due to the data entry errors, multiple duplicated values were
noted in the trauma registry dataset on inspection.
2. Indirect identifiers: Patient age (in years) and gender (male or female).
3. Clinical data: Trauma activation, mode of arrival, ED attending name, ED disposition, hospital
disposition, and four timestamps (ED arrival, ED discharge, first operating room (OR)
admission (if any), and hospital discharge).
Deterministic linkage
Nine different combinations of MRN, EID, age, gender, and ED arrival date that were informed by
the literature, clinical context, and available data were tested and these combinations are listed in Table
4.1. Records from each dataset were classified as a match if they matched in a one-to-one fashion with
the other dataset. When MRN or EID was used in isolation during a step of the matching process,
de-duplication (removal of all duplicated values, which was done programmatically) of both the EHR
and registry datasets was performed prior to completing the linkage as the presence of duplicated
values for these identifiers did not meet the one-to-one matching criteria. However when MRN or
EIDs was used in combination with other variables, de-duplication was not performed due to the

27
additional requirement of matching on other variables that reduces the potential for false matches.
Exact matching was required on age and ED arrival date wherever they were used as trials of
approximate matching resulted in poorer performance.
Table 4.1. The nine variable combinations that were used for deterministic linkage.
No Variable combination Alias
1 De-duplicated MRN MRN
2 De-duplicated EID EID
3 Two-step linkage using de-duplicated MRN in the first step and
de-duplicated EID in the second step.
MRN-then-EID
4 Two-step linkage using de-duplicated EID in the first step and
de-duplicated EID in the second step.
EID-then-MRN
5 Single-step linkage using MRN and EID MRN-and-EID
6 Age, gender, and ED arrival date (match all) AGED
7 MRN, age, gender, and ED arrival date (match any 3) MRN-AGED
8 EID, age, gender, and ED arrival date (match any 3) EID-AGED
9 MRN, EID, age, gender, and ED arrival date
(match any 3)
MRN-EID-AGED
Preliminary manual review of the greatest number of matches generated by deterministic linkage was
conducted by AD and GSD via comparison of variables to identify discrepant values and flag records
for chart review, which was conducted by AD. False matches were identified and excluded to create
a gold standard containing only true matches. The nine deterministic linkage variable combinations

28
were subsequently evaluated against the gold standard records and the sensitivity (recall) and positive
predictive value (precision) of each variable combination were obtained.
Probabilistic linkage
Probabilistic linkage was first described by Newcombe [84, 85] and formalized by Fellegi and Sunter
[86]. It involves comparing records in one dataset against records in another dataset. For every pair of
records that are compared, a match weight, which is an estimation of the likelihood that the two
records belong to the same entity based on agreement or disagreement over the set of compared
variables, is calculated. The calculation of the match weight depends on the estimation of two
conditional probabilities for each linking variable:
1. m probability: The probability of agreement given that both records belong to the same
encounter. This probability depends on the quality of the data.
2. u probability: The probability of agreement given that both records do not belong to the
same encounter. This can be approximated by the probability of chance agreement or
calculated based on the frequency distribution of values.
Using the m and u conditional probabilities, the weight of agreement, given as log2 (m/u), and the weight
of disagreement, given as log2 ((1 – m)/ (1 – u)) is calculated for each linking variable. The match weight
is obtained as the sum of the weights of agreement and disagreement across all linking variables.
Records belonging to the same entity will agree on many variables and have large positive match
weights. Records for different encounters will disagree on many variables and have large negative
match weights. The distribution of the match weights gives a characteristic bimodal distribution with
a large peak consisting of non-matching comparison pairs and a smaller peak consisting of matching
pairs. Rather than the classical approach of selecting two-thresholds for classifying pairs into matches,

29
indeterminate for human review, and non-matches, a single threshold match weight can be determined
for this distribution above which comparison pairs are considered as matches and below which they
are considered as non-matches. This approach obviates the need for human review [87].
To determine a single threshold, an initial threshold match weight can be obtained by a method
elaborated by Cook et al. [88] that uses the Odds form of Bayes Theorem: Posterior Odds (initial threshold)
= Prior Odds x Likelihood Ratio. The prior odds can be estimated using: log2 (E / ((NA X NB) – E)) where
NA is the size of records in dataset A, NB is the size of records in dataset B, and E is the expected
(guessed or approximated) number of matches. The likelihood ratio of a match can be calculated as
log2 (P/ (1- P)), where P is the desired positive predictive value (PPV) of linkage quality. The
multiplication of the prior odds and likelihood ratio gives the initial threshold match weight that can
be calibrated as needed. A higher threshold match weight will maximize specificity and give fewer
number of total matches, fewer number of false matches, and more number of missed matches while
a lower threshold match weight will maximize sensitivity and give a larger number of true positive
matches but more false positives matches. The selection of an appropriate threshold is a decision that
is informed by the needs of the study [73].
Data preprocessing
The mode of arrival, ED disposition, and hospital disposition used a slightly different definition in the
EHR compared to the trauma registry. The values of these variables were mapped to the National
Trauma Data Standard (NTDS) [89] definitions for the variables. Mapping of registry values was
enabled using the definitions in the Maryland Trauma Registry Data Dictionary for Pediatric Patients
[83], while mapping of EHR values was decided by LP, who is the head of the trauma registry team,
as the data dictionary used by the EHR was not very informative.

30
Training the probabilistic linkage algorithm
The proportion of EHR records that matched deterministically, DP, was calculated and taken as the
estimate of the true proportion of matches in the entire cohort. False matches were generated in the
gold standard records by intentionally mismatching randomly selected matched records to create a
development dataset containing true matches and false matches in the estimated proportion DP. This
development dataset was randomly divided into a training dataset (70%) and validation dataset (30%).
The training dataset was used to obtain m and u probabilities; u probabilities were calculated based on
the frequency distribution of values for each variable. Twelve variables including initial trauma
activation, age, gender, ED admission date, mode of arrival, ED provider, ED length of stay (LOS),
ED disposition, hospital LOS, hospital disposition and time-to-first-OR admission were used for
linking. Agreement for time-based variables (e.g. ED LOS) was taken as approximate matching within
+/- 2 time units (minutes, hours or days) while agreement for all other variables was taken as exact
matching.
Threshold determination
We employ a single-threshold approach with maximization of specificity. The initial threshold match
weight was obtained using DP to estimate the prior odds of a match and using a PPV of 99% to
estimate the likelihood ratio. This initial threshold match weight was finely calibrated to a final
threshold match weight that gave a false positive match rate of 1 in 400. The training process was
repeated 100 times by randomly selecting 90% of the training dataset and the median final threshold
weight across all iterations was obtained as the threshold match weight. Using this threshold, the
algorithm was ran against the out-of-sample, novel, validation dataset to confirm reproducibility of
the calibrated performance. This approach aims to reduce, and potentially obviate the need for manual

31
review of matched records by guaranteeing the desired performance on test data. Blocking was not
employed by the algorithm at any stage.
Deploying the probabilistic algorithm
The probabilistic algorithm was ran against the unmatched records from deterministic linkage, and
against the entire cohort, separately. Chart review of additional records matched by probabilistic
linkage was conducted by AD. Registry review of EHR records unmatched after probabilistic linkage
was conducted by LP.
Statistical analysis
Descriptive analyses were performed for the demographic, injury, and encounter characteristics of the
records in both datasets. We compared EHR data to registry data, and records linked deterministically
to the records linked probabilistically following deterministic linakge, using Wilcoxon-Ranksum tests
and Pearson’s Chi-Square tests to examine differences between interval and categorical variables,
respectively. An alpha of <0.05 determined to be statistical significance. Analyses were performed in
Stata 13 [90].
Ethical Considerations
The use of both EHR and registry data for research was approved by the institution review board of
Johns Hopkins Mecine. The study received a waiver of need for informed consent.
32
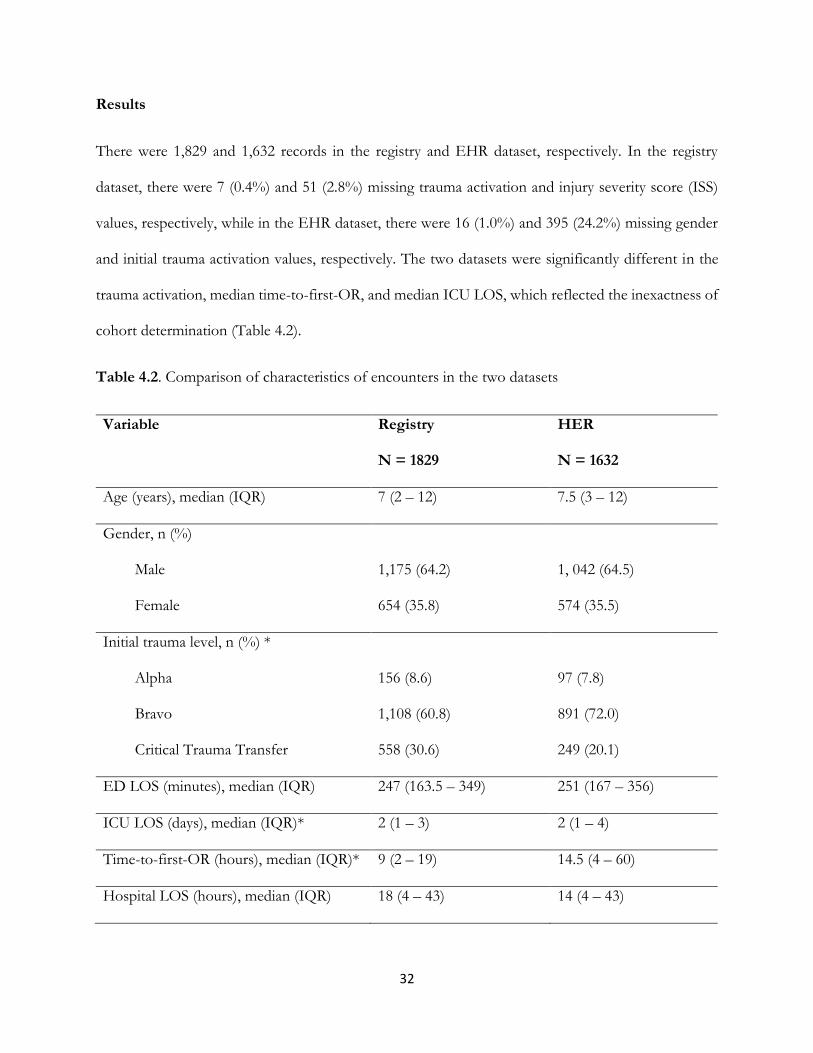
Results
There were 1,829 and 1,632 records in the registry and EHR dataset, respectively. In the registry
dataset, there were 7 (0.4%) and 51 (2.8%) missing trauma activation and injury severity score (ISS)
values, respectively, while in the EHR dataset, there were 16 (1.0%) and 395 (24.2%) missing gender
and initial trauma activation values, respectively. The two datasets were significantly different in the
trauma activation, median time-to-first-OR, and median ICU LOS, which reflected the inexactness of
cohort determination (Table 4.2).
Table 4.2. Comparison of characteristics of encounters in the two datasets
Variable Registry
N = 1829
HER
N = 1632
Age (years), median (IQR) 7 (2 – 12) 7.5 (3 – 12)
Gender, n (%)
Male
Female
1,175 (64.2)
654 (35.8)
1, 042 (64.5)
574 (35.5)
Initial trauma level, n (%) *
Alpha
Bravo
Critical Trauma Transfer
156 (8.6)
1,108 (60.8)
558 (30.6)
97 (7.8)
891 (72.0)
249 (20.1)
ED LOS (minutes), median (IQR) 247 (163.5 – 349) 251 (167 – 356)
ICU LOS (days), median (IQR)* 2 (1 – 3) 2 (1 – 4)
Time-to-first-OR (hours), median (IQR)* 9 (2 – 19) 14.5 (4 – 60)
Hospital LOS (hours), median (IQR) 18 (4 – 43) 14 (4 – 43)

33
ED: Emergency Department; LOS: Length of stay; ICU: Intensive Care Unit; OR: Operating room.
* Statistically significant at 0.05.
Deterministic matching
As shown in Table 4.3, the greatest performance was offered by linking on any 3 of MRN, EID, age,
gender and ED arrival date, which matched 1,279 records. Chart review of these matches revealed
three false matches, which were excluded to create a gold standard containing 1,276 true matches.
Against the gold standard, all variable combinations had 100% PPV but different sensitivities, which
are given in Table 4.3.
Table 4.3. Performance of the various combinations of variables attempted for deterministic linkage
listed in order of decreasing performance.
S/N Variable
combination
Trauma
registry
records
matched
N (%)
EHR
records
unmatched
N (%)
Gold
standard
records
matched
N
Sensitivity
%
1 MRN-EID-
AGED
1279 (70.0) 352 (21.5) 1,276 100.0
2 MRN-AGED 1278 (69.9) 353 (21.6) 1,275 99.9
3 MRN-then-EID 1245 (68.1) 387 (23.7) 1,149 90.0
4 AGED 1234 (67.5) 398 (24.4) 1,229 96.3
5 EID-AGED 1234 (67.5) 398 (24.4) 1,149 90.0

34
6 EID-then-MRN 1231 (67.3) 401 (24.6) 1,140 89.3
7 MRN 1090 (59.6) 542 (33.2) 1,007 78.9
8 EID 630 (34.4) 1002 (61.4) 586 45.9
9 MRN-and-EID 474 (25.9) 1158 (71.0) 444 35.1
Probabilistic linkage
The median final threshold match weight on the training dataset was 19.1 (probability = 0.95). At this
threshold, the probabilistic algorithm had a sensitivity of 99.0%, specificity of 98.7%, PPV of 99.7%
and negative predictive value of 96.4% against the validation dataset, and matched an additional 120
records left over from deterministic linkage. The distribution of match weights on the left over records
from deterministic linkage is given in Figure 4.1. Chart review of the matched records revealed 10
false positive matches, which puts the production PPV of the algorithm at 91.7%. The true positive
matches included encounters involving patients that had a previously existing medical record (with a
different MRN) prior to the trauma encounter. Compared to records that matched deterministically,
the probabilistically matched records contained a statistically significant higher proportions of boys (p
= 0.005) (Table 4.4). Against the entire cohort, the algorithm matched 1,375 records out of which 12
were false positives, giving a PPV of 99.1%.

35
Figure 4.1. Frequency distribution of match weights showing the characteristics bimodal distribution
and cutoff threshold at 19.1.
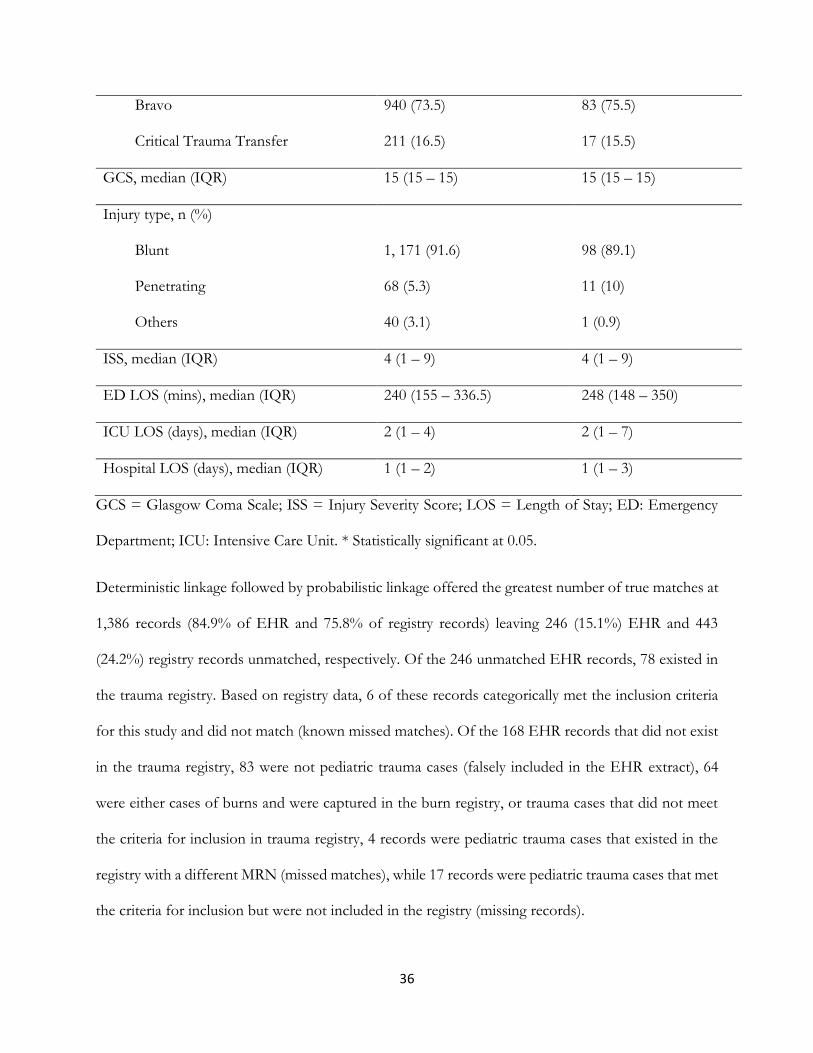
Table 4.4. Comparison of deterministically and probabilistically matched records.
Variable Deterministically linked
N = 1276
Probabilistically
linked
N = 110
Age (years), median (IQR) 7 (3 – 12) 9 (2 – 13)
Sex, n (%) *
Male
Female
817 (64.0)
459 (36.0)
85 (77.3)
25 (22.7)
Trauma activation, n (%)
Alpha
128 (10.0)
10 (9.1)
36
Bravo
Critical Trauma Transfer
940 (73.5)
211 (16.5)
83 (75.5)
17 (15.5)
GCS, median (IQR) 15 (15 – 15) 15 (15 – 15)
Injury type, n (%)
Blunt
Penetrating
Others
1, 171 (91.6)
68 (5.3)
40 (3.1)
98 (89.1)
11 (10)
1 (0.9)
ISS, median (IQR) 4 (1 – 9) 4 (1 – 9)
ED LOS (mins), median (IQR) 240 (155 – 336.5) 248 (148 – 350)
ICU LOS (days), median (IQR) 2 (1 – 4) 2 (1 – 7)
Hospital LOS (days), median (IQR) 1 (1 – 2) 1 (1 – 3)
GCS = Glasgow Coma Scale; ISS = Injury Severity Score; LOS = Length of Stay; ED: Emergency
Department; ICU: Intensive Care Unit. * Statistically significant at 0.05.
Deterministic linkage followed by probabilistic linkage offered the greatest number of true matches at
1,386 records (84.9% of EHR and 75.8% of registry records) leaving 246 (15.1%) EHR and 443
(24.2%) registry records unmatched, respectively. Of the 246 unmatched EHR records, 78 existed in
the trauma registry. Based on registry data, 6 of these records categorically met the inclusion criteria
for this study and did not match (known missed matches). Of the 168 EHR records that did not exist
in the trauma registry, 83 were not pediatric trauma cases (falsely included in the EHR extract), 64
were either cases of burns and were captured in the burn registry, or trauma cases that did not meet
the criteria for inclusion in trauma registry, 4 records were pediatric trauma cases that existed in the
registry with a different MRN (missed matches), while 17 records were pediatric trauma cases that met
the criteria for inclusion but were not included in the registry (missing records).

37
Discussion
EHR systems contain large volumes of data that exist mostly as narrative text, which are difficult to
accurately and reliably extract [91]. In addition, the semantics of the captured data changes when
EHR systems changes [92]. In contrast, registries contain well-defined structured data with fairly
stable semantics that have been carefully abstracted, collected and validated. Utilizing data from both
sources can enable innovative research that is either not previously possible or difficult to conduct
appropriately using either data source alone [66]. To this end, we linked electronically extracted EHR
data to trauma registry data of the same cohort at a Level I pediatric trauma center and created a
linked dataset that will enable further studies that will take advantage of the collective data from
both data sources.
The findings of this study are applicable to other projects using registries and EHR systems as these
data sources lack interoperable interfaces thus requiring record linkage whenever data from both
data sources is needed. In trauma care, such endeavor is frequently undertaken to assess data quality
in trauma registries [93], and linkage to EHR system data is often desired by trauma registrars [94].
This study provides insight into possible problems researchers at other institutions may face when
trying to computationally link electronically extracted EHR data to registry data and approaches to
consider.
In this study, most of the matched records matched deterministically due to availability of unique
identifiers and identifying information. Exact matching on any three of MRN, EID, age, gender and
ED arrival date provided the best performance matching with 1,276 (92.1%) records, and was only
better than any three of MRN, age, gender and ED arrival date by one record, which is a suitable
alternative. The combination of age, gender and ED arrival date matched 45 fewer records than the
best performing combination, which suggested that, in the absence of unique identifiers, a

38
reasonable performance of deterministic linkage is possible. Deterministic linkage using unique
identifiers performed poorly. The poor performance of EID is explainable by the presence of
discrepant EIDs in the two datasets due to the EHR transition. However, MRNs, which were
maintained across EHR transition, matched only 1090 (78.5%) records. Linking using both EID and
MRN, which should ideally be the gold standard, matched just 474 (34.1%) records, the fewest of
any combinations. This reflected the potentiation of the limitations of using either MRN or EID
alone. However, using these identifiers sequentially (i.e. one after another separately; not as a
combination), in any order, gave decent performances that were only different by 14 records.
Probabilistic linkage following deterministic linkage yielded an additional 110 (7.9%) true matches.
This additional yield of matches is important in obtaining a desired sample size and ensuring that
records are not unintentionally and systematically excluded, which may lead to bias. For example, in
this study, compared to the records that matched deterministically, probabilistically matched records
had a statistically significant higher number of boys. If only records that matched deterministically
were used for subsequent studies, it is possible the results may reflect an underestimation of the
male gender. Interestingly, the PPV of the probabilistic linkage algorithm on the unmatched records
from deterministic linkage was lower than calibrated. However, the PPV against the entire cohort
was close to desired. This suggested that the matched records from the left over from deterministic
linage were of lower data quality compared to other records in the cohort, which is one likely reason
why the records did not match deterministically. In addition, review of these records showed
mismatches of that they were often for encounters involving patients that had pre-existing medical
records but were initially managed as unidentified. This finding suggests that many retired MRNs
were captured in the registry, which explains the low performance of deterministic linkage using
MRN alone.

39
Up to 299 or 21.4% of MRNs in the matched dataset were mismatches (difference between total
records that matched and records that matched using MRN alone). This finding is an unintended
consequence of the workflow for enabling care of unidentified patients with concurrent registry data
capture. Alias-based workflows are the norm in trauma care, and ED-based care delivery in general.
Many trauma centers operate variants of the workflow we described [95-98]. Concurrent data entry
is the recommended approach for capturing trauma registry data [99] and the MRN is one of the
earliest data elements to be captured. As demonstrated in this study, the capture of retired MRNs
impacts the ability to easily link trauma registry data to the EHR records using deterministic linkage.
In addition, it may impact the ability to accurately determine or validate readmissions within the
trauma registry [100], or the ability to link the trauma registry to other databases maintained by
departments within the same institution. One way to address this is to notify trauma registrars to
update registry MRN with the older MRN whenever a record merger occurs, or to add MRNs to the
list of data elements trauma registrars routinely validate.
There are a number of limitations to this study. First, this was a single site study and some context at
other institutions may be different such that the findings in this paper may not hold at other
institutions. Nevertheless, the descriptions in this study will be useful. Second, we were liberal in
determining our cohorts in order to increase the yield of matches. It is possible that the results
obtained may be different with better defined cohorts. In addition, by blocking on the trauma
activation during cohort selection, it is possible we might have inadvertently omitted desired records
that, due to data entry errors, had undesired trauma activations. Third, the availability of demographic
data, such as patient name and date of birth, could have resulted in better deterministic linkage
performance. However, as institutional review boards continue to tighten rules regarding the release
of identifying information, the need for probabilistic linkage will likely increase. Finally, we were
unable to comprehensively explore the differences between records that matched deterministically and

40
those that matched probabilistically. It is possible that these two groups of patients may have other
clinically-important statistically significant differences.
Conclusion
Transitions from one EHR to another, the use of tentative identifiers and concurrent registry data
capture have the potential to create inconsistencies between identifying information in trauma
registries and EHR systems within the same institution. Linking electronically extracted EHR data to
trauma registry data is best accomplished using a combination of deterministic and probabilistic
linkages. A single probabilistic linkage of entire cohort is a preferable alternative over deterministic
linkage. Researchers should anticipate the need for probabilistic linkage when planning to use data
from an EHR and registry that lack interoperable interfaces and prepare their research design and
analysis accordingly.
Conflicts of Interest
There are no conflicts of interest.
Human Subjects Protections
The study was performed in compliance with the World Medical Association Declaration of Helsinki
on Ethical Principles for Medical Research Involving Human Subjects, and was reviewed by Johns
Hopkins Medicine Institutional Review Board.

41
Acknowledgement
This study was supported by the Agency for HealthCare Research and Quality (R01HS023837, PI:
Gurses). The study sponsors were not involved in the study design, the writing, and the decision to
submit the manuscript for publication.

42
Chapter 5
Evaluation of Multidisciplinary Collaboration
in Pediatric Trauma Care Using EHR Data

43
ABSTRACT
Objectives: To identify collaborative electronic health record (EHR) usage patterns for pediatric
trauma patients, determine how the usage patterns are related to patient outcomes, and identify
factors that are predictive of these usage patterns.
Materials and Methods: A process mining-based network analysis was applied to EHR metadata
and trauma registry data for a cohort of pediatric trauma patients with minor injuries at a Level I
pediatric trauma center. The EHR metadata were processed into an event log that was segmented
based on gaps in the temporal continuity of events. A usage pattern was constructed for each
encounter by creating edges among functional roles that were captured within the same event log
segment. These patterns were classified into groups using graph kernel and unsupervised spectral
clustering methods. Demographics, clinical and network characteristics, and emergency department
(ED) length of stay (LOS) of the groups were compared.
Results: Three distinct usage patterns that differed by network density were discovered; fully
connected (clique), partially connected, and disconnected (isolated). Compared to the fully
connected pattern, encounters with the partially connected pattern had an adjusted median ED LOS
that was significantly longer (242.6 vs 295.2 minutes), more frequently seen among day shift arrivals,
and involved otolaryngology and ophthalmology services, and child life specialists.
Discussion: The clique-like usage pattern was associated with decreased ED LOS for pediatric
trauma patients with minor injuries suggesting greater degree of collaboration resulted in shorter
stay.
Conclusion: Further investigation to understand and address causal factors can lead to
improvement in multidisciplinary collaboration.

44
Keywords: pediatric trauma, multidisciplinary collaboration, network analysis, electronic health
record, process mining.
45
BACKGROUND AND SIGNIFICANCE
Unintentional injury is the leading cause of morbidity and mortality among children in the United
States. In 2016, over 7.3 million cases of non-fatal injuries and over 11,000 fatal injuries were
recorded among children less than 18 years [45, 46]. The annual cost of these injuries to the U.S.
economy is estimated to be at least $50 billion in direct medical spending [101]. Delivery of optimal
pediatric trauma care is important in improving clinical outcomes and containing costs [102].
Pediatric trauma care is multidisciplinary involving various healthcare professionals (HCP) that
coordinate across time and care location [102]. Patients arriving at the emergency departments (ED)
of trauma centers are met by multidisciplinary trauma teams that provide life-saving resuscitation,
stabilization, and definitive treatment. The presence of a trauma team has been shown to reduce
time to diagnostic procedures (e.g. CT scanning), time to operating room (OR), ED length-of-stay
(LOS) and preventable deaths in severely injured children [103], and the incidence of delayed
diagnoses of injury [104], by improving the coordination of care [103]. Nevertheless, gaps in care
delivery are common, particularly for patients with multiple injuries requiring care from multiple
specialty services [105-107]. Individual specialties tend to operate in silos, and transitions between
care teams are often fraught with disruptions [108]. In addition, the unique needs of children, such
as access to allied HCPs (e.g. social worker, chaplain), are often not met [108, 109].
Improving multidisciplinary collaboration is contingent on ability to identify opportunities for
improvement. Social network analysis is widely used to evaluate collaboration among HCPs [10-13].
With the widespread adoption of electronic health record (EHR) systems in care delivery, there has
been efforts to assess collaboration by exploiting routinely captured EHR data [16], as it offers a
scalable approach to evaluate multidisciplinary collaboration over larger populations and time
periods than feasible through direct observation [15, 22]. This includes efforts to identify

46
collaborative care teams [15, 17-20], and quantify patterns of collaboration that are associated with
positive outcomes [22-24]. The common goal of these efforts is to gain new insight that may
enhance collaborative work and consequently improve patient outcomes. In this study, we extend
this area of research by employing social network analysis to investigate multidisciplinary
collaboration in pediatric trauma care. Specifically, we set out to characterize collaborative EHR
usage patterns [15], understand predictive factors, and to determine how these usage patterns relate
to ED LOS.

47
MATERIALS AND METHODS
Study setting
The Johns Hopkins Children’s Center (JHCC) is an accredited Level-I pediatric trauma center in
Maryland. JHCC receives approximately 1,000 pediatric trauma patients annually from Maryland and
surrounding region. Incoming patients are triaged to a trauma activation level that determines the
composition of the trauma team that receives patients in the pediatric ED (PED) trauma bay. Alpha
activation occurs for children with severe and potentially life-threatening injuries such as airway
problems. It mobilizes staff, from the pediatric intensive care unit (PICU), general pediatrics surgery
(GPS) service, and ancillary support staff (e.g. chaplain, social worker) to the ED. Bravo activation
occurs for children with less critical injuries mobilizing clinicians from the ED and the GPS service.
Relatively stable patients activate a “Consult” for GPS service, which includes patient transfers from
other facilities, while patients with very minor injuries that can be handled solely by ED staff prompt
an ED response. Specialty services such as neurosurgery and orthopedic surgery are consulted as
needed. Following resuscitation, patients not requiring inpatient care are moved from the trauma bay
to the main PED area where they are assigned a bed and a care team. The care team is responsible
for coordinating care among all managing services to ensure timely discharge.
Study population
The unit of analysis was the patient encounter; different encounters for the same patients were
treated as independent. Pediatric trauma encounters received in the ED from October 1, 2016
through December 31, 2017 that were triaged to either alpha or bravo, and ended in direct discharge
from the ED without any inpatient care (OR, floor or PICU admission), were included. This cohort
is typically comprised of patients with minor injuries [110, 111], and although specific injury and care

48
needs may differ, this cohort is bounded by a common care goal of discharge within four hours of
ED arrival [112], and can be considered as homogeneous.
Data sources
Data were independently obtained from the EHR data warehouse (i.e. the Epic Clarity database) and
the pediatric trauma registry. The pediatric trauma registry is maintained by the pediatric trauma
program and the inclusion criteria and data fields are defined in the Maryland State Trauma Registry
Dictionary Pediatric Trauma Patients [83]. From the trauma registry, we obtained demographic and
encounter data including age, gender, trauma activation level (alpha, or bravo), patient origin (scene
of injury or transfer), injury type (blunt, penetrating or others), Glasgow Coma Scale (GCS) score,
injury severity score (ISS), and ED LOS. From the EHR we collected the metadata of captured
clinical activities including notes (45 different types, except radiology reports), procedure orders,
medication orders, flowsheet entries, and medication administration entries. For each EHR metadata
type, we collected the encounter identifier, the activity timestamp, and the unique identifier, the
generic role(s) (e.g. attending, resident), and service (notes only) of the HCP that performed the
activity. The trauma registry and EHR data were linked by a record linkage process with high
sensitivity and specificity (Durojaiye et al., unpublished). The Johns Hopkins Medicine Institutional
Review Board approved the study (# IRB00076900).
Process mining
We employed a process mining approach – a data science approach that “aims to discover, monitor
and improve real processes by extracting knowledge from event logs” [113]. Process mining

49
supports the analyses of different perspectives of processes including organizational perspective,
which deals with understanding relationships among actors involved in the execution of processes
[61], and is the perspective on interest in this study. The starting point for process mining is an event
log, which contains a collection of events. Each event represents a discrete activity (e.g. note writing)
in a given process (e.g. clinical care), performed by an actor (e.g. ED resident), and relates to a case
(e.g. patient encounter). Each event is timestamped (e.g., medication administered at 10/16/2010
06:52) allowing all events for a patient encounter to be ordered chronologically [55]. Social networks
can be constructed from the event log by applying one of four “metrics” to define relationships
between actors [62].
Identification of functional roles
In clinical care, collaboration among individuals is determined by “functional roles” (e.g. ED nurse,
neurosurgery resident, PICU fellow). Multiple individuals may occupy these functional roles at the
same or different times but perform the duties of that functional role [52]. Consequently, we
considered collaboration at the level of functional roles rather than at the level of individuals. In
determining functional roles, we identified the service (e.g. orthopedic service, ophthalmology
service) to which each identified HCP belonged. This service could be unit-based (e.g. ED, PICU, or
general care floor) or a non-unit/specialty-based service that operates across various care locations
(e.g. GPS service, physical therapy). The service information was prepended to the HCPs’ generic
role (e.g. resident, attending) to obtain the functional role defined in our analyses.
The services of attendings, fellows, physician assistants, and specialty-based nurse practitioners,
which are largely fixed, were determined from their notes. When the service could not be identified
from patient notes, chart review and provider directory lookup were conducted. The services of

50
residents, which changes frequently as they rotate through various services as part of their training,
were determined on an encounter basis based on the service of the attending that co-signed the
patient notes they authored.
Generation of event log
We randomly assigned a case ID to each encounter and normalized all timestamps by replacing them
with time (in minutes) from ED arrival (time zero). The different EHR metadata were processed
into an event log consisting of the randomly-assigned case ID, the normalized time, the activity type,
the unique ID and functional role of the HCP. Simultaneous events were generated from notes,
procedure orders and medication orders that involved multiple HCPs. As notes were typically
signed-off late after they were started, we considered the note’s creation time as the note’s
completion time. Activities performed by student roles (e.g. nursing student, medical student) were
excluded as student roles are not directly responsible for patient care. Activities with missing data
and activities that were initiated by the EHR system or by individuals whose services could not be
determined were excluded. Activities that were registered before ED arrival were also excluded.
Network representation
We defined relationships (i.e. edges) between functional roles (i.e. nodes) based on the “working
together” metric [62]. The working together metric counts how frequently two actors (i.e. functional
roles) work together on same cases. We selected the working together metric because it has been
shown to be useful in understanding relationships among a large set of actors in unstructured
processes such as in healthcare [114]. However, the classic working together metric ignores the

51
temporal distance between actors. For example, Actor A could be involved with a patient in the ED
in the morning and Actor B could be involved the same patient in the evening without ever directly
working together (or having the opportunity) because of no temporal overlap between actors. The
classic working together metric credits both actors A and B as working together.
In this study, we distinguish this by defining the “working closely together” metric to account for
temporal distance between actors. In operationalizing this metric, we considered the shift rotation as
the unit of clinical work and collaboration. We assumed that functional roles that were involved in
the care of a patient during a shift had the opportunity of working together while functional roles
that were captured in the EHR within a similar time interval during the same shift were likely
“working closely together”. This translates to functional roles that were jointly involved in
completing the same tasks such as placing orders or functional roles that were completing disparate
tasks at the same time.
To implement “working closely together”, we obtained the normalized timeline from ED arrival to
ED discharge for each encounter, divided the timeline into shift rotations (morning: 7am – 7pm,
night: 7pm – 7am) numbered 0 (arrival shift) to N (discharge shift), and labeled the events in the
event log with the corresponding shift number. Events within each shift were further partitioned
into segments representing “collaborative sessions” based on “natural breaks” (significant time gaps
between consecutive events) in the temporal continuity of events. We assume a natural break to be a
minimum of 30 minutes between consecutive events in the event log in order to accommodate for
lag between occurrence of activities in real-life and registration in the EHR. The Jenks Natural Break
Optimization algorithm [115] was used to determine the optimal break interval for each shift from
between 30 to 120 minutes in 5 minutes increments. The Jenks optimization objective is to minimize
variation within groups thus maximizing variation across groups. An undirected edge was created for

52
all pairwise combinations of identified functional roles within each event log segment. Unique edges
across all event log segments and all shifts were obtained as the usage pattern. The overview of the
entire process is depicted in Figure 5.1.
Figure 5.1. Summary of the methodological approach to network representation. Each colored
circle represents a unique functional role.
Network visualization and analysis
We used the igraph 1.1.2 package [116] in R 3.4.0 [117] to create and visualize the usage patterns.
From each usage pattern, we obtained basic networks metrics including node count (total number of
functional roles involved), edge count (total number of relationships between functional roles),
network density (proportion of present relationships between functional roles relative to maximum
number of relationships possible) and average degree (the average number of relationship per
functional role). We also obtained the services of the present functional roles.

53
Usage pattern classification
We compared usage patterns using the connected graphlet algorithm described by Shervashidze et
al. [118] that is provided in the graphkernels 1.4 R package [119] and obtained a similarity matrix of
the usage patterns. The connected graphlet algorithm measures similarity between two graphs
(networks) by comparing the distribution of graphlets (sub-networks) within the two networks
rather than node and edge labels, and has been shown to give competitive performance on unlabeled
networks [118]. Using the kernlab 0.9.25 R package [120], we applied spectral clustering [121] on the
similarity matrix and classified the usage patterns into groups. Spectral clustering performs
dimensionality reduction on the eigenvalues of a similarity matrix before clustering using k-means
clustering. Spectral clustering was selected because it has been shown to generally out-perform older
clustering algorithms [121]. Spectral clustering requires the specification of the optimal number of
clusters and the Eigengap heuristic [121] and the elbow method [122] were used to determine the
optimal number of clusters.
Statistical analysis
We obtained descriptive statistics of the demographic, encounter, network and service composition
characteristics of each pattern group and examined for differences using Kruskal-Wallis test [123]
and Fisher’s exact tests for interval and categorical variables, respectively. Statistical significance was
set at <0.05. When a statistical significance test was obtained, post-hoc tests were conducted using
adjusted p-values to identify the specific groups/levels where the difference existed. The ED LOS
was log transformed and normality was confirmed with the Shapiro Wilk’s test. Multivariate linear
regression was used to obtain ED LOS adjusted for patient and encounter variables. Analysis was
conducted in Stata 13 [124].

54
RESULTS
There were 249 encounters in the cohort and the demographic and encounter characteristics of the
cohort is summarized in Table 5.1. The majority of the patients were boys (n = 164; 65.9%) and the
median age was 9 years. Almost all (n = 247; 99.2%) of the encounters were bravo traumas and
almost all (n = 238; 95.8%) suffered blunt injury. Both weekday (Monday – Friday) arrivals and day
shift (7:00Am – 6:59PM) arrivals accounted for 180 (72.3%) of encounters.
Table 5.1. Demographic and encounter characteristics of the cohort.
Variable Value (N = 249)
Age (years), median (IQR) 9 (4 – 12)
Male gender, n (%) 164 (65.9)
Weekday arrivals, n (%) 180 (72.3)
Day shift arrivals, n (%) 180 (72.3)
Bravo trauma activation, n (%) 247 (99.2)
Blunt injury, n (%) 238 (95.8)
ISS, median (IQR) 2 (2 – 5)
GCS, median (IQR) 15 (15 – 15)
ED LOS (mins), median (IQR) 265 (202 – 344)
ED: Emergency Department; ISS: Injury Severity Score; GCS: Glasgow Coma Scale; LOS: Length
of stay; IQR: Interquartile range.
The initial event log contained 67,889 events. Exclusions included 1,518 (2.2%) pre-ED arrival
events were excluded and 39 events because of inability to determine the HCP functional role. There
were 66,332 events in the final event log with flowsheet entries accounting for 59,077 (89.1%) as
seen in Figure 5.2. 494 unique individuals occupying 36 functional roles were identified. The most
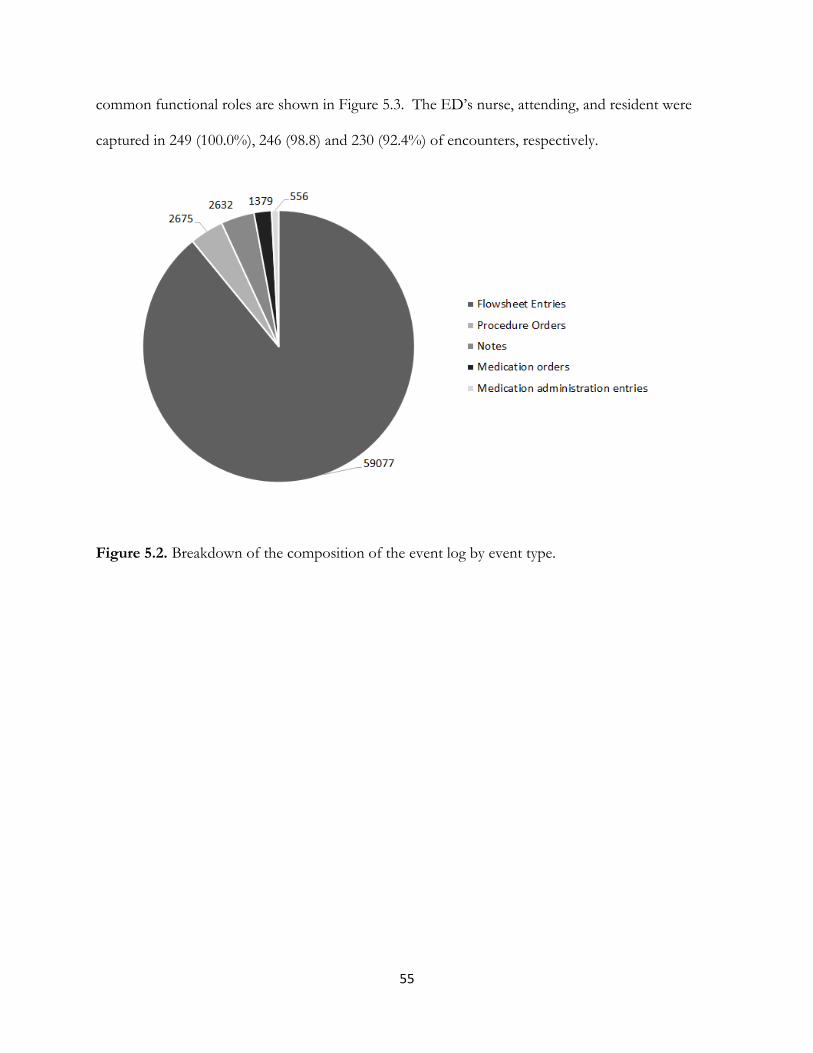
55
common functional roles are shown in Figure 5.3. The ED’s nurse, attending, and resident were
captured in 249 (100.0%), 246 (98.8) and 230 (92.4%) of encounters, respectively.
Figure 5.2. Breakdown of the composition of the event log by event type.

56
Figure 5.3. The top 20 functional roles involved across all encounters. ED: Emergency
Department; GPS: General Pediatric Surgery; RN: Registered Nurse; AT: Attending; R: Resident;
Rad_Tech: Radiology Technician; F:Fellow; NP: Nurse Practitioner; RN_Tech: Nurse Technician;
SW: Social Worker; Peds: Pediatrics; Ortho: Orthopedics; ENT: Ear, Nose, and Throat
(Otolaryngology); PA: Physician Assistant.
Usage patterns
Spectral clustering (Eigengap heuristics and elbow method) suggested the presence of three clusters
as seen in Figure 5.4. Consequently, three usage patterns were described according to their group
sizes and network density, and iconic examples are visualized in Figure 5.5 using the Large Graph
Layout [125]. The “fully connected” pattern where edges existed among all nodes, known as a
clique, comprised 137 encounters (55.0%). The “partially connected” pattern demonstrated varying

57
degree of edges among constituent nodes and accounted for 106 encounters (42.6%). Last, the
“disconnected pattern” that was a collection of isolated node pairs consisted of 6 encounters (2.4%).
Figure 5.4. Determining optimal number of clusters in the similarity matrix. Left: Plot of the 10
smallest eigenvalues showing an eigengap at 3. Right: Elbow method showing an elbow at 3.
Figure 5.5. Iconic example of each usage pattern. Left to right: Fully connected (clique-like);
Partially connected; Disconnected. ED: Emergency Department; GPS: General Pediatric Surgery;
RN: Registered Nurse; AT: Attending; F: Fellow; R: Resident; Rad_Tech: Radiology Technician.
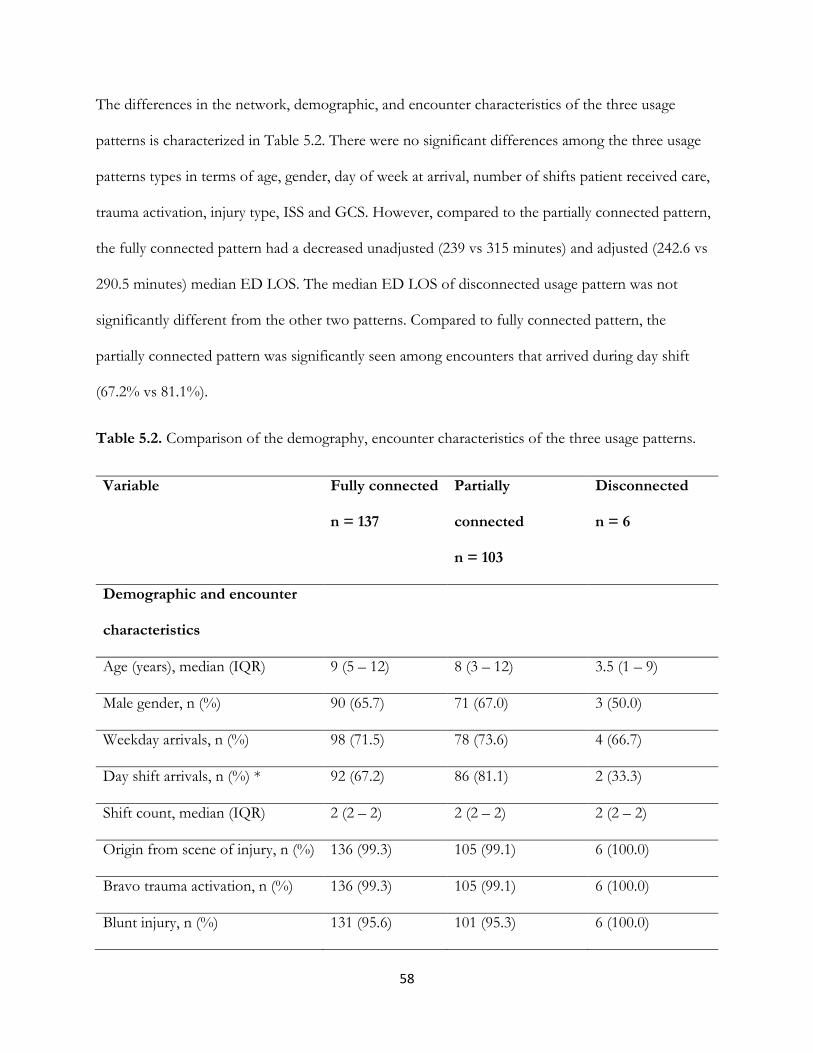
58
The differences in the network, demographic, and encounter characteristics of the three usage
patterns is characterized in Table 5.2. There were no significant differences among the three usage
patterns types in terms of age, gender, day of week at arrival, number of shifts patient received care,
trauma activation, injury type, ISS and GCS. However, compared to the partially connected pattern,
the fully connected pattern had a decreased unadjusted (239 vs 315 minutes) and adjusted (242.6 vs
290.5 minutes) median ED LOS. The median ED LOS of disconnected usage pattern was not
significantly different from the other two patterns. Compared to fully connected pattern, the
partially connected pattern was significantly seen among encounters that arrived during day shift
(67.2% vs 81.1%).
Table 5.2. Comparison of the demography, encounter characteristics of the three usage patterns.
Variable Fully connected
n = 137
Partially
connected
n = 103
Disconnected
n = 6
Demographic and encounter
characteristics
Age (years), median (IQR) 9 (5 – 12) 8 (3 – 12) 3.5 (1 – 9)
Male gender, n (%) 90 (65.7) 71 (67.0) 3 (50.0)
Weekday arrivals, n (%) 98 (71.5) 78 (73.6) 4 (66.7)
Day shift arrivals, n (%) * 92 (67.2) 86 (81.1) 2 (33.3)
Shift count, median (IQR) 2 (2 – 2) 2 (2 – 2) 2 (2 – 2)
Origin from scene of injury, n (%) 136 (99.3) 105 (99.1) 6 (100.0)
Bravo trauma activation, n (%) 136 (99.3) 105 (99.1) 6 (100.0)
Blunt injury, n (%) 131 (95.6) 101 (95.3) 6 (100.0)

59
ISS, median (IQR) 2 (1 – 5) 2 (1 – 5) 2 (2 – 5)
GCS, median (IQR) 15 (15 – 15) 15 (15 – 15) 15 (15 – 15)
Network characteristics
Node count, median (IQR) * 6 (6 – 8) 8 (6 – 9) 4.5 (4 – 5)
Edge count, median (IQR) * 15 (11 – 21) 17 (12 – 24) 3.5 (2 – 4)
Avg. degree, median (IQR) * 5 (4 – 6) 4 (3 – 5) 1 (1 – 1)
Density, median (IQR) * 1 (1 – 1) 0.73 (0.67 – 0.81) 0.40 (0.33 – 0.40)
Outcome characteristics
Unadjusted ED LOS (mins),
median (IQR) *
239
(187 – 306)
315
(252 – 401)
200.5
(153 – 285)
Adjusted ED LOS (mins),
median (IQR) *
242.6
(229.2 – 250.0)
290.5
(275.6 – 395.7)
186.9
(167.9 – 201.9)
* Statistically significant at <0.05. ISS: Injury Severity Score; GCS: Glasgow Coma Scale; IQR:
Interquartile range.
Care team composition of the pattern groups
Encounters with the partially connected usage pattern were significantly different from encounters
with the fully connected pattern in that they more frequently involved the otolaryngology service
(12.6% vs 1.4%), ophthalmology service (5.7% vs 0.7%), and child life specialists (42.5% vs 26.3%).
Physical therapists, occupational therapists, psychologists, case managers, home care coordinators,
dieticians, and the physical medicine and rehabilitation service were not involved in any of the
encounters.

60
DISCUSSION
We applied social network analysis to identify and correlate collaborative EHR usage patterns to ED
LOS at a Level I pediatric trauma center using a novel methodology that employed metadata of
clinical activities captured in the EHR. The methodology is unique in using metadata of clinical
activities in the EHR rather than the access logs that are limited to capturing individuals that
accessed patients’ records but did not necessarily work as part of the care team [41]. Metadata of
clinical activities captures HCPs that were intimately involved in providing care to patients. We
considered relationships at the level of functional roles rather than at the level of individuals. This
was aligned with prior research that asserts that networks represented at the level of functional roles
better reflect clinical practice and produces more tractable network structures [52]. Another
important contribution of this work was how temporality was treated. We addressed the temporal
nature of care and HCP involvement by employing a process mining approach and re-imagining the
working together metric to account for temporal distance among activities of HCPs. This led to the
use of patient-focused shift duty as the unit of collaboration rather than the entire patient encounter.
Prior research has shown that accommodating for temporality produces clearer and simpler
networks [43], and as shown in this study, allowed us to better triangulate collaboration and obtain
simpler and clearer networks. Last, unlike previous studies [22-24], we were able to identify simple
pattern groups, a pattern group that was associated with less desirable patient outcome, and
provided direction for further investigation and process improvement efforts. Our study thus
demonstrates that meaningful insight that can be used to improve multidisciplinary collaboration can
be obtained from EHR data.
We resolved 494 unique HCPs that provided care for pediatric trauma patients that were discharged
directly from the ED to 36 functional roles, and identified three types of EHR usage patterns among

61
the functional roles. Encounters that left behind a fully connected usage pattern accounted for over
half (55.0%) of the cohort and had an adjusted median ED LOS that approximately met the target
goal of 240 minutes, and was 47.9 minutes shorter than the median ED LOS of encounters that left
behind a partially connected usage pattern. This suggested that when functional roles functioned
essentially as a clique, they were faster in providing care to patients; better collaboration resulted in
shorter ED stays.
The partially connected usage pattern was more frequently seen among encounters that arrived
during the day shift, suggesting that a higher workload during the day may have negatively impacted
multidisciplinary collaboration. These encounters also significantly involved the child life specialists,
who are trained professionals responsible for providing emotional support to patients and their
family [126], particularly before and during potentially painful procedures that induce anxiety such as
laceration repair [127, 128] and orthopedic casting [126]. One possible explanation for this is that
multidisciplinary collaboration is adversely affected when patient and or family experience significant
psychological stress requiring the services of child life specialists, which typically leads to longer ED
stay. Encounters with the disconnected usage pattern, which suggested HCPs functioned in silos,
had the shortest ED LOS; but these were only six in number. This suggested that they are
exceptions rather than the norm and may benefit from further examination using a larger cohort.
Our findings are similar to a study conducted by Chen et al. [22] at a Level-I adult trauma center;
three “interaction patterns” were identified with the highly collaborative interaction pattern
associated with a shorter hospital stay. Our study also has several implications. We were able to
identify specific encounters that left behind the less desirable usage pattern that was associated with
longer ED LOS, and potential factors that were predictive of these encounters. These encounters
could be further investigated to identify causal factors that can be the focus of intervention. In

62
addition, usage patterns can be periodically audited as a proxy measure for multidisciplinary
collaboration to identify potential cases to be reviewed at process improvement meetings or aspects
of collaboration that needs improvement. However, additional work (such as implementation of
differential weighting of EHR activities, and introduction of edge weights and node sizes in network
construction) is needed to make these patterns robust, and to validate them as a proxy measure for
multidisciplinary collaboration. This will be important in representing and understanding more
complex collaboration patterns.
There are several limitations to this study. First, this was a single site study and replication at other
centers is needed, possibly with larger sample size. Second, we depended on care activities that were
captured in the EHR and did not take into account collaboration activities that were not captured in
the EHRs, such as face-to-face conversations and telephone calls. A recent study showed that
telephone conversations constitute a significant aspect of clinical workflows [129]. Ability to exploit
this data source may further enhance the ability to quantitatively discern multidisciplinary
collaboration in a robust manner. In addition, care activities captured in the EHR may not
necessarily reflect the time they occurred in real life. This depends on both the clinical and EHR
workflow and other contextual factors, such as workload and the importance of an entry [130]. This
is particularly critical when using timestamps of EHR-extracted clinical notes. However, timestamps
of other activities such as orders and medication administration are more likely to reflect actual times
that the events occurred as they are captured close to or in real-time. Furthermore, functional roles
that less frequently enter data in the EHR are less likely to be captured in our analysis, (e.g.
attendings versus residents). Third, each data clustering technique has strengths and limitations. We
used specific data clustering techniques, and other data clustering techniques may result in different
patterns.

63
CONCLUSION
We described a novel methodology to identify usage patterns from metadata of clinical activities
captured in EHR, correlate the patterns to ED LOS, and identified factors that can be focus of
future studies and interventions to improve multidisciplinary collaboration. We showed that a clique-
like usage pattern is associated with a decreased ED LOS suggesting that greater collaboration
resulted in more timely provision of care for pediatric trauma patients with minor injuries at our
institution. Additional research is however required to validate our approach at other institutions and
to improve the robustness of the methodology.
ACKNOWLEDGEMENTS
We wish to thank Nicolette McGeorge, Cathi Habertson, Laura Fortmann, and Gurmehar Singh
Deol for their role in this research.
COMPETING INTERESTS
The authors have no competing interests to declare.
FUNDING
This study was supported by the Agency for HealthCare Research and Quality (R01HS023837, PI:
Gurses). The study sponsors were not involved in the study design, the writing, and the decision to
submit the manuscript for publication.

64
Chapter 6
Examining Diurnal Differences in
Collaborative Care Team Patterns at a
Pediatric Trauma Center Using EHR Data

65
Abstract
Objectives: To identify and describe diurnal variation in multiple care teams’ composition and
collaborative patterns at a pediatric trauma center (PTC) using electronic health record (EHR) data.
Materials and Methods: Metadata of clinical activities were extracted from the EHR and processed
into an event log, which was divided into six different event logs based on shift-location
combinations: shift with two levels, day or night; and location with three levels, emergency
department (ED), pediatric intensive care unit (PICU), and floor. Networks were constructed from
each event log by creating an edge between functional roles captured within the same time interval
during a shift, from which overlapping communities were identified. Day and night network
structures for each care location were compared and validated via member checking interviews with
clinicians.
Results: There were 413 encounters in the one-year study period with 272 (65.9%) and 141 (34.1%)
beginning during day and night shifts, respectively. Compared to the day networks, allied healthcare
professionals were absent on the care teams at nights in the PICU and on the floor. A single
community was identified in all locations during the day, and only in the PICU at night, while
multiple communities corresponding to individual specialty services were identified in the ED and
on the floor at night. Members of the trauma service belonged to all the communities suggesting
they were responsible for care coordination. Clinicians found the networks to be largely accurate
representations of the composition of the care teams and the interactions among them.
Conclusion: EHR utilization was successfully employed to identify and describe differences in care
team composition and collaborative patterns a in a trauma care multi-team system.
Keywords: pediatric trauma, multidisciplinary teamwork, multi-team system, network analysis,
electronic health record, process mining

66
Introduction
Healthcare is increasingly being delivered by multiple care teams working towards the same
overarching goal, also known as a multi-team systems (MTS) [131, 132], [133]. MTSs are different
from traditional teams in that constituent teams are interdependent, work across boundaries, share
accountability, and function through a hierarchy of goals that determines how lower goals are
accomplished to realize the higher goal(s) [133]. MTS have three attributes: (1) compositional
attributes (e.g. number of teams, size of teams, changes in team composition) (2) linkage attributes
(e.g. interdependence, hierarchical structure, communication structure), and (3) developmental
attributes (e.g. changes in team membership over time) [134], which support the specialization and
flexibility that allows constituent teams to pursue lower goals while trying to achieve higher goals
[135].
MTS and are often seen in environments where tasks are ambiguous, multifaceted, dynamic, and
urgent [135]. In healthcare, one such system is found in the care of trauma patients. Care of trauma
patients is time-sensitive requiring multidisciplinary collaboration among healthcare professionals
(HCP) and teams of specialists [136]. Emergency department (ED) team, pediatric intensive care
unit (PICU) team, surgery team etc. can all be thought as ‘component’ teams, working towards the
overarching goal of providing the best possible care for the trauma patients, while each are
performing markedly different tasks simultaneously or sequentially.
In this paper, we argue that MTS are dynamic; depending on variations in situational factors (e.g.
changes in availability of resources and staffing), and that MTS self-organize themselves to get the
work done. To the best of the research team’s knowledge, no previous study has investigated how
the organization of a MTS change depending on situational factors. For example, staffing levels at
trauma centers vary with the time of day and the day of week, such that services of HCPs deemed

67
non-essential may not be available during “off hours” (e.g., nights and weekends) [137-140]. These
types of situational factors may necessitate changes and adaptation in MTS structure and
organization to be able to still get the work done, while the impact of these staffing decisions on
team processes may not be fully or formally recognized by organizations.
Assessment of MTS across various situational factors is important to gain a better understanding of
how the teams are actually functioning and self-organizing under different circumstances and to
identify potential improvement opportunities[131]. Social network analysis can enable the
understanding of MTS at the compositional and sub-team levels [131, 141]. Typically, such
assessment is done through observation and self-reported survey [135], which are limited in their
ability to provide rich details [133]. The ability to exploit “digital traces” [142], which may provide
opportunities over survey data [14, 143]. Electronic health record (EHR) systems offer the
opportunity to study the composition and organization of collaborative care teams [17]. In fact,
EHRs capture many clinical activities that are performed by HCPs in the process of care delivery
[17, 20], and previous studies have shown the feasibility of obtaining plausible information on
collaborative care teams from EHR data [17]. This study aims to demonstrate how the
compositional and organizational structures of multiple teams in an MTS change with varying
situational factors by describing diurnal differences in multiple care teams’ functioning at various
locations in a pediatric trauma center using EHR data.

68
METHODS
Study setting
This study was conducted at the Johns Hopkins Children Center (JHCC), which is a Level I
pediatric trauma center in Baltimore, Maryland. JHCC receives approximately 1,000 pediatric trauma
patients per year. JHHC triages incoming patients into one of four trauma activation levels: alpha,
bravo, consult (includes inter-facility transfer of “stable” but critically injured patients known as
critical trauma transfers) and ED response, which is exclusively handled by the ED staff. These
levels are ordered by decreasing acuity and need for multidisciplinary care.
The trauma activation levels determine the composition of the trauma team. The trauma team is
derived from the ED staff, the general pediatric surgery (GPS) service, the pediatric intensive care
unit (PICU), and includes ancillary support staff (e.g. child life specialist, chaplain, social worker). As
required by the state of Maryland [83], a GPS attending surgeon is on call during night shift and is
required to respond to alpha trauma activations within 30 minutes of notification.
Following resuscitation, if inpatient admission is required, patients with single-system injuries are
admitted under the appropriate specialty service. Patients with multi-system injuries are however
admitted under the GPS service, which is responsible for coordinating care among managing
specialty services (e.g. neurosurgery, orthopedic surgery).
The Johns Hopkins Medicine institutional Review Board approved the study.
Dataset
Data was extracted from the pediatric trauma registry and the EHR data warehouse (i.e. Epic’s
clarity database). We limited EHR’s data to encounters with trauma activation levels of alpha, bravo

69
and critical trauma transfers that were managed between January 1 and December 31, 2017.
Demographic and encounter data including age, gender, origin of patient, trauma activation level,
injury severity score (ISS), and Glasgow Coma Scale (GCS) score were collected from the registry.
Admission, Discharge and Transfer (ADT) data, and metadata of five clinical activities (i.e., notes,
procedure orders, medication orders, flowsheet entries, and medication administration entries)
captured in the EHR were collected from the EHR data warehouse. For each EHR activity type, we
obtained the encounter ID (visit ID), the activity timestamp, and the unique ID and generic clinical
role(s) (e.g. attending, resident), of the HCP that performed the activity. The note data included the
service of the author(s) while the procedure orders, medication orders, and medications
administration entries included the care location (e.g. ED, PICU) where the activity was performed.
Data preparation
Each encounter was assigned a randomly generated unique study ID. Timestamps of EHR’s meta-
data were normalized by replacing them with time (in minutes) from ED arrival, which ensured that
the temporal sequence of events was maintained for each encounter. Activities without the full
complement of data were excluded. Activities that were initiated by the EHR system, initiated by
student roles (e.g. nursing student, medical student) were also excluded as they bore no
accountability for patient care. As notes were typically signed-off much later from when they were
started, we considered the note creation time as the note completion time. As flowsheet and note
data lacked care location data, we inferred the care location for each activity from the ADT data. To
achieve adding location metadata, for each encounter, a timeline was generated from the ADT data
(i.e., sequence of admissions to various hospital locations from ED arrival to hospital discharge).
The normalized timestamps of each activity in the flowsheet and note metadata were subsequently

70
related to the encounter timeline and the corresponding care location was taken as the care location
where flowsheet and note activities were performed.
Identification of functional roles
We considered collaboration at the level of functional roles (e.g. ED nurse, neurosurgery resident,
PICU fellow, surgery attending) rather than individuals as past studies have shown the reality of
functional roles in clinical practice [52]. To determine functional roles, we identified the service (e.g.
orthopedic service, ophthalmology service) to which each identified HCP belonged and prepended it
to their generic role (e.g. resident, attending). This service could be a service that is bound to a care
location (e.g. ED, PICU, or general care floor) or a service that operates across care locations (e.g.
GPS service, physical therapy).
We assumed that the services of certain functional roles (e.g., attendings, fellows, physician
assistants, and nurse practitioners working on specialty services) were fixed as determined from their
notes. Chart review and directory lookup was conducted to identify the services of individuals whose
services could not be determined from extracted metadata. The services of medical residents, which
frequently change as they rotate through various services for their training, were determined on an
encounter-basis derived from the service of the attendings that co-signed the notes. The services of
registered nurses, unit-based nurse practitioners and allied healthcare professionals (excluding
radiology technicians) were determined by taking the mode of the frequency distribution of the
location of the activities they performed. The services of radiology technicians were determined in
an encounter-basis similar to residents.

71
Activities by individuals whose services could not be determined were excluded. Since the location
of flowsheet and note activities were inferred, the records were excluded if the inferred location did
not correspond to the base unit of HCPs.
Methodologic Approach
We employed a process mining approach, which is a field of data science that “aims to discover,
monitor and improve real processes by extracting knowledge from event logs” [113]. The starting
point for process mining is an event log, which contains a collection of events. Each event
represents a discrete activity (e.g., note writing) in a given process (e.g. clinical care), performed by
an actor (e.g. ED resident), and relates to a case (e.g. patient encounter). Each event is timestamped
(e.g. order placed on 01/22/2000 at 10:45:00) allowing all events for a patient encounter to be
ordered chronologically [55]. By applying various “metrics” to define relationships between actors in
an event log, social networks were obtained [62].
“Working together” is a commonly used metric for representing collaboration in unstructured
processes with frequent ad hoc behavior such as in healthcare[114]. The working together metric
counts how frequently two actors work together on same cases [62]. In its regular form, the working
together metric does not accommodate for temporal distance between actors, which is important in
healthcare where different HCPs are involved in patient care at different stages of care.
Consequently, we defined a variant of the working together metric, referred as “working closely
together”, to account for temporal distance among actors. The working closely together metrics
counts the number of times two actors worked closely together relative to the number of times the
two actors had the opportunity of working together. To operationalize this metric, we considered
the shift rotation as the unit of clinical work and collaboration, and assumed that functional roles

72
that were involved in the care of a patient during a shift had the opportunity of working together
while functional roles that were captured in the EHR within a similar time interval were “working
closely together”. Therefore, this metric translates to functional roles that were jointly involved in
completing the same tasks or were completing disparate tasks at the same time.
Generation of event logs
EHR metadata were processed into an event log consisting of the study ID, the normalized time,
EHR activity type, unique ID and functional role of the HCP, and care location. Multiple same-time
events were generated from notes, procedures and medication orders that involved multiple HCPs.
The encounter timeline was divided into shift rotations (morning: 7:00am – 6:59pm, night: 7:00pm –
6:59am) numbered 0 to N, and each event in the event log was labeled with the corresponding shift
number and shift type (day or night). Events within each shift were partitioned into segments based
on “natural breaks” in the continuity of events. We assume a natural break to be a minimum of 30
minutes between adjacent events in the event log in order to accommodate for lag between
occurrence of activities in real-life and registration in the EHR. The Jenks Natural Break
Optimization algorithm [115] was used to determine the optimal break interval from between 30 to
120 minutes in 5 minutes increments. The event log was divided based on shift type and care
location to obtain individual event logs for ED morning and ED night, floor morning and floor
night, and PICU morning and PICU night.

73
Network representation
For each individual event log, an undirected edge (relationship between nodes) was created for all
pairwise combinations of identified functional roles within each event segment. Unique edges across
all segments across all shifts across all encounters were obtained as the collaboration network. The
weight of the edges were obtained by dividing the number of shifts an edge was present between
two functional roles by the number of shifts the two functional roles were both involved. This
effectively normalized the weights and accommodated for variation in care team composition across
encounters.
Threshold selection
In order to prevent the capture of spurious edges (edges that do not really exist or edges with
spurious weights), a threshold number of shared encounters between nodes (functional roles) is
usually applied to constructed networks. Eventual network structure is sensitive to the selected
threshold. Various approaches that have been used to determine this threshold are subjective [16],
and include arbitrary selection [15], clinician-informed [23], and retaining only a fixed top percentage
of strongest edges [144]. In this study, we took a more objective approach to threshold
determination by introducing a heuristic method akin to the elbow-method [122], which is used for
determining the optimal number of clusters in k-means clustering. For each event log, we obtained
and plotted the rate of change of the total number of edges removed as the threshold value is
incrementally increased from 2 to 20 and obtained a LOWESS-smoothed curve of the plot. The
elbow point – the threshold value at which the rate of change becomes insignificant or constant –
was taken as the optimal threshold. The underlying assumption of this method is that as the
threshold of shared number of encounters is increased, trivial and spurious edges are removed and

74
network structure changes up to a point where further increases in threshold value result in minimal
removal of edges with little or no change in network structure. At this threshold point, it is assumed
that the network structure is relatively stable and only significant edges and nodes remain.
Network visualization and analysis
We used the igraph 1.1.1 package [116] in R 3.4.0 [117] to create and visualize the networks. From
each network, we obtained the node count (number of functional roles) and edge count (number of
relationships between functional roles). We used the linkcomm package 1.0.11 [145] to identify
overlapping communities in the networks. A community is a sub-network that contains a high
density of edges among members but fewer edges with members of the larger network, thus
represents a tightly knit sub-group [146]. The linkcomm package is an R implementation of the
algorithm by Ahn et al. [147] that – as opposed to other community detection algorithms that cluster
nodes – clusters edges assuming a node can belong to multiple communities hence enabling the
discovery of overlapping and nested communities. It is the most commonly used overlapping
community detection algorithm and tends to give superior performance if multiple ad-hoc behaviors
result in high degree of overlapping in derived networks (as commonly seen in healthcare settings)
[148, 149]. The algorithm uses anhierarchical clustering method to produce a dendrogram that, in
the default setting, is cut at a level that maximizes modularity [150]. We parameterized the algorithm
with the McQuitty hierarchical clustering method, also known as the Weighted Pair Group Method
with Arithmetic Mean (WPGMA) [151], so that edge weights can be considered in community
determination, and obtained community-depicted networks produced at maximum modularity. The
linkcomm package offers a unique visualization that uses different colors to depict edges and nodes
that belong to different communities. Nodes are sized to reflect the number of community the node

75
belongs with larger nodes belonging to more communities. Nodes belonging to more than one
community are also presented as pies with the pies divided and colored based on the proportion of
the edges for that node in various communities that the node belongs.
Statistical analysis
We obtained and compared descriptive statistics of encounters, demographics, and injury
characteristics of encounters that began during the day shift to encounters that began during night
shift. Differences between interval and categorical variables were examined using Wilcoxon-
Ranksum and Pearson’s Chi-Square tests, respectively. An alpha of <0.05 taken to be statistically
significant. Analysis was performed in Stata 13 [124].
Validation
Two forms of validation were conducted. In the first validation step, we compared the results of this
study with the results of a prior study [152] in which we developed a “role-location matrix” the
detailed functional roles and the inpatient locations in which they typically worked via semi-
structured interview with clinicians (n=21) and subject matter experts (n=22), and review of
institutional and trauma registry protocol. We compared the functional roles and the locations in
which the functional roles were found. In a second validation step, we validated the collaborative
care team patterns via member-checking interviews (n=6) with clinicians that were involved in
pediatric trauma care, including the pediatric trauma program director (n=3). The interviews were
conducted by AD, KW, and GSD, and AG as a group. During each session, the collaborative care
team patterns were individually presented to the clinician and the clinician was asked to comment

76
on: (1) The accuracy and completeness of the roles that were captured; (2) Whether the collaborative
patterns mirrored reality or not; (3) Whether the differences between day and night patterns were
suggestive of reality.
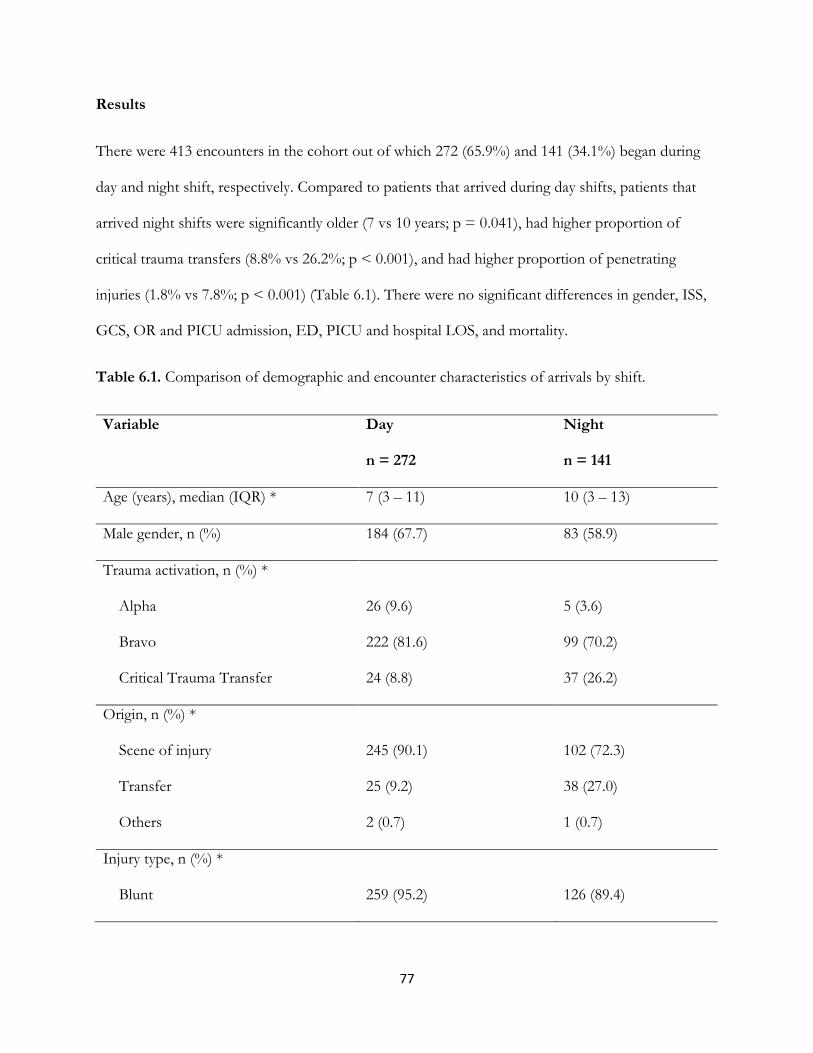
77
Results
There were 413 encounters in the cohort out of which 272 (65.9%) and 141 (34.1%) began during
day and night shift, respectively. Compared to patients that arrived during day shifts, patients that
arrived night shifts were significantly older (7 vs 10 years; p = 0.041), had higher proportion of
critical trauma transfers (8.8% vs 26.2%; p < 0.001), and had higher proportion of penetrating
injuries (1.8% vs 7.8%; p < 0.001) (Table 6.1). There were no significant differences in gender, ISS,
GCS, OR and PICU admission, ED, PICU and hospital LOS, and mortality.
Table 6.1. Comparison of demographic and encounter characteristics of arrivals by shift.
Variable Day
n = 272
Night
n = 141
Age (years), median (IQR) * 7 (3 – 11) 10 (3 – 13)
Male gender, n (%) 184 (67.7) 83 (58.9)
Trauma activation, n (%) *
Alpha
Bravo
Critical Trauma Transfer
26 (9.6)
222 (81.6)
24 (8.8)
5 (3.6)
99 (70.2)
37 (26.2)
Origin, n (%) *
Scene of injury
Transfer
Others
245 (90.1)
25 (9.2)
2 (0.7)
102 (72.3)
38 (27.0)
1 (0.7)
Injury type, n (%) *
Blunt
259 (95.2)
126 (89.4)

78
Penetrating
Others
5 (1.8)
8 (2.9)
11 (7.8)
4 (2.8)
ISS, median (IQR) 5 (2 – 10) 5 (2 – 9)
GCS, median (IQR) 15 (15 – 15) 15 (15 – 15)
ED LOS (mins), median (IQR) 253.5 (187 – 361) 254 (146 – 374)
OR admission, n (%) 41 (15.1) 22 (15.6)
PICU admission, n (%) 43 (15.8) 27 (19.2)
PICU LOS (days), median (IQR) 1 (1 – 3) 1 (1 – 2)
Hospital LOS (hours), median (IQR) 7 (4 – 32) 14 (4 – 41)
Mortality, n (%) 7 (2.6) 2 (1.4)
ISS: Injury Severity Score; GCS: Glasgow Coma Scale; OR: Operating room; PICU: Pediatric
Intensive Care Unit; LOS: Length of stay; IQR: Interquartile range. *Significant at alpha <0.05
Comparison of sub-logs obtained based in shift type and care location: Only 1,564 events were excluded due to
inability to resolve the functional role of the actor. There were 835,754 events in the initial event log
with flowsheet entries accounting for 89.5% of all events. The composition of the individual sub-
logs for each care location and shift duty is given in Figure 6.1. The proportions of various activities
in the day and night logs for each care location were largely similar with some notable differences.
The ED night log contained more medication administration orders than the ED day log, which
contained more flowsheet events. The floor day log contained more medication administration than
the floor night, which contained more procedure order events. The PICU day contained more notes
events that the PICU night, which contained more flowsheet events.

79
Figure 6.1. Comparison of the composition of various activity types by care location and shift type.
A total of 1,647 unique HCP occupying 110 functional roles were identified out of which 58
functional roles were recorded in at least 20 (5%) encounters. The ED registered nurse was recorded
in all 413 encounters while the ED attending, ED resident, and ED radiology technician were
recorded in 407 (98.5%), 385 (93.2%) and 333 (80.6%) encounters, respectively.
Threshold selection: Figure 6.2 shows the plots of rate of change of total edges removed against
increasing threshold values. For both ED day and ED night, the threshold was determined as 9. For
the floor, 11 and 10 were selected as the threshold for day and night, respectively, while for the
PICU, 15 and 9 was selected as the threshold for day and night, respectively.

80
Figure 6.2. Determination of encounter threshold for each event log. The gray line and point plot
shows the difference in edges removed as the threshold is increased while the smooth black line is
the LOWESS curve. Some LOWESS curve such as the ED morning and PICU night have sharply
defined elbows while others have gently defined elbows. The red vertical lines indicate the selected
threshold number of shared encounter by HCPs for each event log.
Collaboration patterns of care teams in the pediatric ED. Figure 6.3 shows the collaborative care teams
pattern in the ED during the day and at night visualized using the Kamada Kawai layout algorithm
[153], which is a force-directed algorithm. The day pattern contained 18 nodes and 87 edges while
the night pattern contained 28 nodes and 160 edges. The night pattern was distinctively star-shapped
and had five overlapping communities with the ED attending, resident, nurse, and radiology
technician, and the GPS attending and resident forming the core and belonging to all five

81
communities. The day pattern had a less distinctively defined star-pattern and had only one
community. Attending-resident pair from neurosurgery and orthopedic surgery services, and allied
HCPs including the social worker, chaplain, and child life specialist were at the periphery in both
patterns. Attending-resident pair from otolaryngology and plastic surgery were seen only in the night
pattern and belonged to separate communities, while only the resident from the ophthalmology
service was seen in the night pattern. The PICU nurse, resident and the Imaging Data Coordinator
(IDC) were also seen in the night pattern.
Figure 6.3. Collaborative care team patterns in the ED. Left: Day shift; Right: Night shift. A single
community is seen in the day shift pattern but five communities are seen in the night shift pattern
with functional roles from the ED and GPS belonging to all five communities. In the night pattern,
the neurosurgery resident and attending are part of the largest community that includes the ED
personnel and allied healthcare workers. Legend: ED: Emergency department; Neurosurg:
Neurosurgery; Ortho: Orthopedic surgery; GPS: General Pediatric Surgery; AT: Attending; F:
Fellow; R: Resident; RN: Registered Nurse; NP: Nurse Practitioner; RN_Tech: Nurse Technician;

82
Rad_Tech: Radiology Technician; SW: Social worker; CLS: Child Life Specialist; Peds: Pediatrics;
IDC: Imaging Data Coordinator; PICU: Pediatrics Intensive Care Unit.
Collaboration patterns of care teams in the floor. Figure 6.4 shows the collaboration pattern in the floor
during the day and at nights visualized using the Large Graph Layout [125]. The day pattern
contained 24 nodes and 135 edges while the night pattern contained 19 nodes and 55 edges. The
bedside nurse was at the center of both patterns. Functional roles present in the day pattern but
absent in the night pattern were the home care coordinator (HCC), case manager (CM), social
worker (SW), child life specialist (CLS), occupational therapy (OT) and dietitian (DT). The ED
resident was present in the night pattern but not in the day pattern. One community was identified
in the day pattern while five overlapping communites were identified in the night pattern with the
neurosurgery, orthopedic surgery, and pediatric service having separate communities and the GPS-
resident and GPS attending belonging to all five communities.
Figure 6.4. Collaborative care team pattern on the floor. Left: Day; Right: Night. Legend:
Neurosurg: Neurosurgery; Ortho: Orthopedic surgery; GPS: General Pediatric Surgery; AT:

83
Attending; F: Fellow; R: Resident; RN: Registered Nurse; NP: Nurse Practitioner; RN_Tech: Nurse
Technician; Rad_Tech: Radiology Technician; SW: Social worker; CLS: Child Life Specialist; CM:
Case manager; PPS: Pediatric Pain Service; HCC: Home Care Coordinator; Pharm: Pharmacist;
Peds: Pediatrics; DT: Dietitian; OT: Occupational Therapist; PT: Physical Therapist. Only one
community was identified in the day pattern while five communities (different colors) were
identified in the night pattern.
Collaboration patterns of care teams in the PICU. Figure 6.5 shows the day and night collaborative care
team pattern in the PICU visualized using the Frutchterman-Reingold layout algorithm [154]. The
day pattern contained 30 nodes and 283 edges while the night pattern contained 24 nodes and 175
edges. Both collaboration patterns had a large spherical core made up of functional roles from the
PICU, GPS, neurosurgery, and neurology services (day pattern only), and few “appendages” that
include functional roles from the orthopedic surgery, ophthalmology and pediatric pain servive. One
community was identified in both patterns. Functional roles present in the day pattern but absent in
the night pattern were me the unit case manager, social worker, and the occupational therapist and
dietitian. Functional roles present in the night pattern but absent in the day pattern include the ED
resident, ED nurse, orthopedic surgery team, and anesthesia attending.

84
Figure 6.5. Collaborative care team patterns in the PICU. Left: Day; Right: Night. Legend: ED:
Emergency department; PICU: Pediatric Intensive Care Unit; Neurosurg: Neurosurgery; Ortho:
Orthopedic surgery; GPS: General Pediatric Surgery; Oph: Ophthalmology; Anes: Anesthesia; PMR:
Physical Medicine and Rehabilitation; Neuro: Neurology; AT: Attending; F: Fellow; R: Resident;
RN: Registered Nurse; NP: Nurse Practitioner; RN_Tech: Nurse Technician; Rad_Tech: Radiology
Technician; SW: Social worker; CLS: Child Life Specialist; CM: Case manager; PA: Physician
Assistant; PPS: Pediatric Pain Service; HCC: Home Care Coordinator; Pharm: Pharmacist; Peds:
Pediatrics; DT: Dietitian; OT: Occupational Therapist; PT: Physical Therapist.
Validation
In the prior study [152], we identified 56 roles across all care locations. In this study, we identified a
total of 110 functional roles and 58 frequent functional roles across all locations. Eight functional
roles were identified in the prior study but not in this study included. These roles were: ED
documenting nurse, charge nurses, EMS personnel, security, family/caregiver, pediatric trauma

85
manager, perfusionist, and inhospital transport team. Fifty-four functional roles were identified in
this study but not in the prior study. Most of these roles belonged to specialty services roles that
were not frequently involved in patient care. Of the 58 frequent roles we identified in this study, 15
were not identified in the prior study. These includes the dietitian, imaging data coordinator (IDC),
home care coordinator, and roles from the ophthalmology, otolaryngology, neurology, pediatric
pain service and plastic surgery services.
The functional roles and locations where they were found mostly matched. Comparisons against the
prior study confirmed that the ED nurse and ED resident did go to the floor and the PICU, and the
PICU nurse also go to the floor. On the other hand, the PICU attending, fellow, and respiratory
therapist respond to alpha traumas in the ED both during the day and at nights and this was not
captured, and the ED technicians accompany patients to the PICU and floor. These presences were
not captured.
Clinicians found the composition of the derived care teams were deemed to be largely accurate. It
was unexpected for experts to understand why ophthalmology attendings were not identified as part
of the care team at night (Figure 6.3), as experts confirmed that the ophthalmology attendings did
not take night calls. However, some functional roles were not accurately captured. For example, the
PICU attending, PICU fellow, and respiratory therapists were not identified in the ED collaborative
care teams (Figure 6.3), although both the experts and prior study confirmed center confirms this as
inaccurate. Furthermore, the collaborative care team for the PICU night did not capture the ED
social worker, which usually covers the PICU at night by accompanying patients transitioning from
ED to PICU, while the floor care teams were missing functional roles from anesthesia.
Regarding interactions between roles and communities that were identified, in line with the
protocols, clinicians confirmed that the GPS coordinated care among specialist services, and
86
understood why they belonged to multiple communities. Clinicians could understand why only one
community was identified in the PICU because there has been concerted effort to improve
coordination of care between the PICU and surgical services, and the PICU characteristically
performed multidisciplinary rounds with other non-surgical services and allied HCPs. They however
acknowledge that there was room for improvement regarding collaboration with the orthopedic
service, particularly in the PICU. Clinicians confirmed that the neurosurgery service was well
integrated into the trauma team in the ED.

87
DISCUSSION
We compared diurnal differences in the composition and organization of collaborative care teams at
three care locations at a Level I pediatric trauma center using EHR data. Our study is unique in a
couple of ways. First, we introduced a heuristics for determining threshold number of shared patient
encounters for interaction between HCPs. This heuristics provide a more objective approach for
determining this critical value. Second, we employed an overlapping community detection algorithm
that allowed a functional role to be part of multiple communities in order to reflect ad-hoc clinical
collaborations that clinicians form to address unique needs of patients. Third, we confirmed the
presence of multi-team teams using EHR data. We also showed that the use of EHR data offered a
better opportunity for identifying functional roles than the interview data.
There were important differences between the observed collaborative care teams in the ED during
the day and at nights. Compared to the day pattern, the night pattern had a better defined core team
made up of ED and GPS personnel and involved more specialty services, which was reflective of
the nature and severity of injury of patients presenting at night. In addition, the neurosurgery team
was part of both day and night pattern. However, in the night pattern, the neurosurgery team was
part of the main community that included the core tam and allied HCPs. This suggested that the
neurosurgery team has close bonds with the trauma team in the ED and this was validated by
clinician. In addition, the collaborative care team in the ED at night included roles that were not in
the day pattern. These include the IDC, a role that is responsible for uploading imaging data from
transferring hospitals that do not use an interoperable EHR, which is explained by the significant
higher number of trauma transfers arriving at night, and the PICU resident and PICU nurse, which
suggested greater involvement at night, possibly to facilitate faster admission to the PICU. The

88
orthopedic surgery attending and resident, and the ED resident and ED nurse were captured by
night pattern in the PICU but not during the day, which suggested greater involvement at night.
Compared to the day pattern, multi-team structures were more pronounced at night. Constituent
teams consisted of at least attending-resident pair, except the ophthalmology service, which
consisted only the resident. Validation with clinicians confirmed that ophthalmology attendings do
not take night duty calls. Consequently, patients that are received at night that require
ophthalmology review are reviewed only by the residents or admitted overnight for additional review
by the attending the next day. This sometimes resulted in delay in diagnosing ophthalmological
problems or instituting appropriate care. Pronounced multi-team structures at night also suggested
specialty services tended to operate in silos with the GPS team (attending, fellow and resident), as
expected, coordinating care among the various services. In the ED, since ancillary support services
were present at night, this may be reflective of the greater needs of the patients received at night and
the difficulty in coordination care among the various services. On the floor, where ancillary support
services are not present at night, this suggested that ancillary support staff play important roles in
coordinating care and ensuring the various teams functioned as a unit. This was however not the
case at the PICU where the night collaboration pattern was essentially similar to the day pattern
despite the absence of ancillary support staff at night, save for differences in present functional
roles.
There are several implications of this study. The methodology can be used to identify and study
MTS structures in various settings in a more efficient manner than possible with observations and
survey data. The methodology can also be adapted to study how MTS evolve over the care timeline
of patients and identify areas in need of improvement. It can provide insight to support
management and operational decisions. For example, it can be used to derive insight into how HCPs

89
and care teams actually organize themselves, rather than how they are supposed to organize
according to protocols. Such insight can be used to inform staffing decisions, or complement or
inform further qualitative efforts to improve collaboration. In addition, by comparing temporal
patterns, it is possible to assess and evaluate changes in MTS structures following interventions to
improve collaboration.
There are several limitations to this study. First, by using only EHR data, we did not capture other
important teamwork-related activities such as face-to-face and telephone conversations, which are a
major part of clinical activities [129]. Furthermore, we were less likely to capture functional roles that
documented less frequently in the EHR. For example, we were unable to capture the PICU
attending and PICU fellow in the ED patterns for both day and night as these two roles rarely used
the EHR for documentation while in the ED. In addition, our method for determining functional
roles was based on heuristics. Consequently, it is possible that not all possible roles were identified
and that some of the assigned functional roles were inaccurate. Future EHR systems should be
designed to support functional roles, which is the appropriate unit of clinical collaboration, rather
than individuals. Such system has the potential to optimize collaborative work to deliver improved
care and enable robust research using EHR data.
Conclusion
We identified and described diurnal variations in collaborative care teams and multi-team structures
at various locations in a pediatric trauma center using EHR data, and showed that the derived
structures were similar to reality.

90
Acknowledgement
This study was supported by the Agency for HealthCare Research and Quality (R01HS023837, PI:
Gurses). The study sponsors were not involved in the study design, the writing, and the decision to
submit the manuscript for publication. We thank Nicolette McGeorge, Cathi Habertson, and Laura
Fortmann for their role in this research.

91
References
1. Epstein, N.E., Multidisciplinary in-hospital teams improve patient outcomes: A review. Surgical Neurology
International, 2014. 5(Suppl 7): p. S295-S303.
2. Archer, J., et al., Collaborative care for depression and anxiety problems. Cochrane Database Syst Rev, 2012.
10: p. Cd006525.
3. Chwastiak, L.A., et al., A collaborative care team to integrate behavioral health care and treatment of poorly-
controlled type 2 diabetes in an urban safety net primary care clinic. Gen Hosp Psychiatry, 2017. 44: p. 10-15.
4. Katon, W.J., et al., Collaborative care for patients with depression and chronic illnesses. N Engl J Med, 2010.
363(27): p. 2611-20.
5. Gerardo, C.J., et al., The rapid impact on mortality rates of a dedicated care team including trauma and emergency
physicians at an academic medical center. J Emerg Med, 2011. 40(5): p. 586-91.
6. Iliffe, S., Myths and realities in multidisciplinary team-working. London Journal of Primary Care, 2008. 1(2):
p. 100-102.
7. Madge, S. and K. Khair, Multidisciplinary teams in the United Kingdom: problems and solutions. J Pediatr
Nurs, 2000. 15(2): p. 131-4.
8. Firth-Cozens, J., Multidisciplinary teamwork: the good, bad, and everything in between. Qual Health Care, 2001.
10(2): p. 65-6.
9. Stokes, J., Problems in multidisciplinary teams: The unconscious at work. Journal of Social Work Practice,
1994. 8(2): p. 161-167.
10. Bae, S.H., et al., Health care provider social network analysis: A systematic review. Nurs Outlook, 2015. 63(5):
p. 566-84.
11. Tasselli, S., Social networks of professionals in health care organizations: a review. Med Care Res Rev, 2014.
71(6): p. 619-60.
12. Cunningham, F.C., et al., Health professional networks as a vector for improving healthcare quality and safety: a
systematic review. BMJ Qual Saf, 2012. 21(3): p. 239-49.
92
13. Chambers, D., et al., Social network analysis in healthcare settings: a systematic scoping review. PLoS One, 2012.
7(8): p. e41911.
14. Burke, C.S., A look into the challenging world of MTS data collection, in Pushing the Boundaries: Multiteam
Systems in Research and Practice. 2014, Emerald Group Publishing Limited. p. 17-32.
15. Soulakis, N.D., et al., Visualizing collaborative electronic health record usage for hospitalized patients with heart
failure. J Am Med Inform Assoc, 2015. 22(2): p. 299-311.
16. Brunson, J.C. and R.C. Laubenbacher, Applications of network analysis to routinely collected health care data: a
systematic review. J Am Med Inform Assoc, 2018. 25(2): p. 210-221.
17. Chen, Y., et al., Identifying collaborative care teams through electronic medical record utilization patterns. J Am
Med Inform Assoc, 2017. 24(e1): p. e111-e120.
18. He, S., et al., Characterizing the Structure of a Patient's Care Team through Electronic Encounter Data Analysis.
Stud Health Technol Inform, 2015. 216: p. 21-5.
19. Gray, J.E., et al., Network analysis of team structure in the neonatal intensive care unit. Pediatrics, 2010. 125(6):
p. e1460-7.
20. Gray, J.E., et al., Using Digital Crumbs from an Electronic Health Record to identify, study and improve health
care teams. AMIA Annu Symp Proc, 2011. 2011: p. 491-500.
21. Zhu X, et al. Identifying Health Care Teams Using Electronic Health Records Access Data and Social Network
Analysis [abstract]. 2016 [cited 2018 May 20]; Available from:
https://www.shmabstracts.com/abstract/identifying-health-care-teams-using-electronic-health-
records-access-data-and-social-network-analysis/.
22. Chen, Y., et al., Interaction patterns of trauma providers are associated with length of stay. J Am Med Inform
Assoc, 2018.
23. Carson, M.B., et al., An Outcome-Weighted Network Model for Characterizing Collaboration. PLoS One,
2016. 11(10): p. e0163861.
24. Conca, T., et al., Multidisciplinary Collaboration in the Treatment of Patients With Type 2 Diabetes in Primary
Care: Analysis Using Process Mining. J Med Internet Res, 2018. 20(4): p. e127.

93
25. Nancarrow, S.A., et al., Ten principles of good interdisciplinary team work. Human Resources for Health,
2013. 11: p. 19-19.
26. Lester, H., Interprofessional collaboration: from policy to practice in health and social care. Audrey Leathard (ed.).
(392 pages, £18.99.) Bruner-Routledge, 2003. ISBN 1583911766. Family Practice, 2004. 21(2): p. 226-227.
27. D'Amour, D., et al., The conceptual basis for interprofessional collaboration: core concepts and theoretical
frameworks. J Interprof Care, 2005. 19 Suppl 1: p. 116-31.
28. Thylefors, I., O. Persson, and D. Hellström, Team types, perceived efficiency and team climate in Swedish cross-
professional teamwork. Journal of interprofessional care, 2005. 19(2): p. 102-114.
29. Weir, C.R., et al., An exploration of the impact of computerized patient documentation on clinical collaboration. Int
J Med Inform, 2011. 80(8): p. e62-71.
30. Saint-Pierre, C., V. Herskovic, and M. Sepulveda, Multidisciplinary collaboration in primary care: a systematic
review. Fam Pract, 2018. 35(2): p. 132-141.
31. Xyrichis, A. and K. Lowton, What fosters or prevents interprofessional teamworking in primary and community
care? A literature review. Int J Nurs Stud, 2008. 45(1): p. 140-53.
32. Nancarrow, S., et al., The relationship between workforce flexibility and the costs and outcomes of older peoples
services. 2010.
33. Hall, P. and L. Weaver, Interdisciplinary education and teamwork: a long and winding road. Med Educ, 2001.
35(9): p. 867-75.
34. Petrie, H.G., Do you see what I see? The epistemology of interdisciplinary inquiry. Educational Researcher,
1976. 5(2): p. 9-15.
35. Knoke, D. and S. Yang, Social network analysis. Vol. 154. 2008: Sage.
36. Wasserman, S. and K. Faust, Social network analysis: Methods and applications. Vol. 8. 1994: Cambridge
university press.
37. U.S. Congress, Health Insurance Portability and Accountability Act of 1996, e. In: Rights OoC, Office of
Civil Rights., Editor. 1996: Washington, DC.

94
38. Edemekong, P.F. and M.J. Haydel, Health Insurance Portability and Accountability Act (HIPAA), in
StatPearls. 2018, StatPearls Publishing
StatPearls Publishing LLC.: Treasure Island (FL).
39. Nunn, S., Managing audit trails. J ahima, 2009. 80(9): p. 44-5; quiz 47-8.
40. Walsh, T. and W. Miaoulis, Privacy and security audits of electronic health information. J ahima, 2014. 85(3): p.
54-9.
41. Vawdrey, D., et al., Awareness of the Care Team in Electronic Health Records. Appl Clin Inform, 2011. 2(4):
p. 395-405.
42. Cruz-Correia, R., et al., Analysis of the quality of hospital information systems audit trails. BMC Medical
Informatics and Decision Making, 2013. 13: p. 84-84.
43. Hanauer, D.A. and N. Ramakrishnan, Modeling temporal relationships in large scale clinical associations.
Journal of the American Medical Informatics Association : JAMIA, 2013. 20(2): p. 332-341.
44. Agency for Healthcare Research and QUality. Care Transitions and Teamwork in Pediatric Trauma:
Implications for Health Information Technology Design. [cited 2016 06/06/2016]; Available from:
https://healthit.ahrq.gov/ahrq-funded-projects/care-transitions-and-teamwork-pediatric-trauma-
implications-health-information.
45. Centers for Disease Control and Prevention, National Center for Injury Prevention and Control.
Web-based Injury Statistics Query and Reporting System (WISQARS) Fatal Injury Data. [Internet] 2016
[cited 2018 March 1]; Available from: https://www.cdc.gov/injury/wisqars/fatal.html.
46. Centers for Disease Control and Prevention, National Center for Injury Prevention and Control.
Web-based Injury Statistics Query and Reporting System (WISQARS) Nonfatal Injury Data. [Internet] 2016
[cited 2018 March 1]; Available from: https://www.cdc.gov/injury/wisqars/nonfatal.html.
47. Borse NN, G.J., Dellinger AM, Rudd RA, Ballesteros MF, Sleet DA, CDC Childhood Injury Report:
Patterns of Unintentional Injuries among 0 -19 Year Olds in the United States, 2000-2006. 2008.
48. Centers for Disease Control and Prevention, National Center for Injury Prevention and Control. National Action
Plan for Child Injury Prevention. Atlanta (GA): CDC, NCIPC; 2012. 2012.

95
49. Datta, I., et al., Evaluation of a regional trauma registry. Can J Surg, 2007. 50(3): p. 210-3.
50. Sharar, S.R., The ongoing and worldwide challenge of pediatric trauma. Int J Crit Illn Inj Sci, 2012. 2(3): p.
111-3.
51. McFadyen, J.G., R. Ramaiah, and S.M. Bhananker, Initial assessment and management of pediatric trauma
patients. International Journal of Critical Illness and Injury Science, 2012. 2(3): p. 121-127.
52. Benham-Hutchins, M.M. and J.A. Effken, Multi-professional patterns and methods of communication during
patient handoffs. Int J Med Inform, 2010. 79(4): p. 252-67.
53. Lismont, J., et al., A guide for the application of analytics on healthcare processes: A dynamic view on patient
pathways. Comput Biol Med, 2016. 77: p. 125-34.
54. Partington, A., et al., Process mining for clinical processes: a comparative analysis of four Australian hospitals.
ACM Transactions on Management Information Systems (TMIS), 2015. 5(4): p. 19.
55. Rojas, E., et al., Process mining in healthcare: A literature review. J Biomed Inform, 2016. 61: p. 224-36.
56. Ronny S. Mans, W.M.P.v.d.A., Rob J. B. Vanwersch, Process Mining in Healthcare. SpringerBriefs in
Business Process Management. 2015: Springer International Publishing. 91.
57. Aalst, W.M.P.v.d., Process Mining. 2016: Springer-Verlag Berlin Heidelberg. XIX, 467.
58. Mans, R.S., et al., Process mining in healthcare: Data challenges when answering frequently posed questions, in
Process Support and Knowledge Representation in Health Care. 2013, Springer. p. 140-153.
59. Rebuge, Á. and D.R. Ferreira, Business process analysis in healthcare environments: A methodology based on
process mining. Information Systems, 2012. 37(2): p. 99-116.
60. van der Aalst, W., Process mining: The missing link, in Process mining. 2016, Springer. p. 25-52.
61. Song, M. and W.M. Van der Aalst, Towards comprehensive support for organizational mining. Decision
Support Systems, 2008. 46(1): p. 300-317.
62. Van Der Aalst, W.M., H.A. Reijers, and M. Song, Discovering social networks from event logs. Computer
Supported Cooperative Work (CSCW), 2005. 14(6): p. 549-593.
63. Van der Aalst, W. Discovering coordination patterns using process mining.
64. Moore, L. and D.E. Clark, The value of trauma registries. Injury, 2008. 39(6): p. 686-95.

96
65. Zehtabchi, S., et al., Trauma registries: history, logistics, limitations, and contributions to emergency medicine
research. Acad Emerg Med, 2011. 18(6): p. 637-43.
66. Gliklich, R., N. Dreyer, and M. Leavy, Linking Registry Data With Other Data Sources To Support New
Studies, in Registries for Evaluating Patient Outcomes: A User's Guide [Internet]. 3rd edition. 2014, Agency for
Healthcare Research and Quality (US): Rockville (MD).
67. Gliklich, R.E., N.A. Dreyer, and M.B. Leavy, Interfacing registries with electronic health records, in Registries
for Evaluating Patient Outcomes: A User's Guide [Internet]. 2014, Agency for Healthcare Research and
Quality (US): Rockville (MD).
68. Barnett, M.L., A. Mehrotra, and A.B. Jena, Adverse inpatient outcomes during the transition to a new electronic
health record system: observational study. Bmj, 2016. 354: p. i3835.
69. Gettinger, A. and A. Csatari, Transitioning from a Legacy EHR to a Commercial, Vendor-supplied, EHR: One
Academic Health System’s Experience. Applied Clinical Informatics, 2012. 3(4): p. 367-376.
70. Bornstein, S., An integrated EHR at Northern California Kaiser Permanente: pitfalls, challenges, and benefits
experienced in transitioning. Appl Clin Inform, 2012. 3(3): p. 318-25.
71. Newgard, C.D., et al., Electronic versus manual data processing: evaluating the use of electronic health records in
out-of-hospital clinical research. Acad Emerg Med, 2012. 19(2): p. 217-27.
72. Knake, L.A., et al., Quality of EHR data extractions for studies of preterm birth in a tertiary care center: guidelines
for obtaining reliable data. BMC Pediatr, 2016. 16: p. 59.
73. Dusetzina, S.B., et al., An Overview of Record Linkage Methods. 2014.
74. Clark, D.E., Practical introduction to record linkage for injury research. Inj Prev, 2004. 10(3): p. 186-91.
75. Sayers, A., et al., Probabilistic record linkage. International Journal of Epidemiology, 2016. 45(3): p. 954-
964.
76. Zhu, Y., et al., When to conduct probabilistic linkage vs. deterministic linkage? A simulation study. J Biomed
Inform, 2015. 56: p. 80-6.
77. Harron, K., et al., Evaluating bias due to data linkage error in electronic healthcare records. BMC Med Res
Methodol, 2014. 14: p. 36./

97
78. McKenzie, K., et al., Assessing the concordance of trauma registry data and hospital records. Him j, 2005. 34(1):
p. 3-7.
79. Wynn, A., et al., Accuracy of administrative and trauma registry databases. J Trauma, 2001. 51(3): p. 464-8.
80. Newgard, C.D., Validation of probabilistic linkage to match de-identified ambulance records to a state trauma
registry. Acad Emerg Med, 2006. 13(1): p. 69-75.
81. Schmidlin, K., K.M. Clough-Gorr, and A. Spoerri, Privacy preserving probabilistic record linkage (P3RL): a
novel method for linking existing health-related data and maintaining participant confidentiality. BMC Med Res
Methodol, 2015. 15: p. 46.
82. Spath, P., Debate: retrospective vs. concurrent data collection. Hosp Peer Rev, 1999. 24(5): p. 80-2.
83. Maryland Institute for Emergency Medical Services Systems. Maryland State Trauma Registry Data
Dictionary for Pediatric Patients. [Internet] 2014 [cited 2018 March 1]; Available from:
https://www.miemss.org/home/Portals/0/Docs/OtherPDFs/Web-registry-data-dictionary-
pediatric.pdf?ver=2016-03-10-140444-350.
84. Newcombe, H.B. and J.M. Kennedy, Record linkage: making maximum use of the discriminating power of
identifying information. Communications of the ACM, 1962. 5(11): p. 563-566.
85. Newcombe, H.B., et al., Automatic linkage of vital records. Science, 1959. 130(3381): p. 954-9.
86. Fellegi, I.P. and A.B. Sunter, A theory for record linkage. Journal of the American Statistical Association,
1969. 64(328): p. 1183-1210.
87. Grannis, S.J., et al., Analysis of a Probabilistic Record Linkage Technique without Human Review. AMIA
Annual Symposium Proceedings, 2003. 2003: p. 259-263.
88. Cook, L.J., L.M. Olson, and J.M. Dean, Probabilistic record linkage: relationships between file sizes, identifiers
and match weights. Methods Inf Med, 2001. 40(3): p. 196-203.
89. American College of Surgeons, National Trauma Data Standard Data Dictionary 2017 Admissions. 2017.
90. StataCorp. 2013. Stata Statistical Software: Release 13. College Station, T.S.L.
91. Hripcsak, G., et al., Unlocking clinical data from narrative reports: a study of natural language processing. Ann
Intern Med, 1995. 122(9): p. 681-8.

98
92. Sun, H., et al., Semantic processing of EHR data for clinical research. J Biomed Inform, 2015. 58: p. 247-259.
93. O'Reilly, G.M., et al., Classifying, measuring and improving the quality of data in trauma registries: A review of the
literature. Injury, 2016. 47(3): p. 559-67.
94. O'Reilly, G.M., et al., An interview of trauma registry custodians to determine lessons learnt. Injury, 2016. 47(1):
p. 116-24.
95. Brooks, A.J., C. Macnab, and K. Boffard, AKA unknown male Foxtrot 23/4: alias assignment for
unidentified emergency room patients. J Accid Emerg Med, 1999. 16(3): p. 171-3.
96. Robinson, G., et al., A system of alias assignment for unidentified patients requiring emergency hospital admission. J
Trauma, 1985. 25(4): p. 333-6.
97. Landman, A., et al., The Boston Marathon Bombings Mass Casualty Incident: One Emergency Department's
Information Systems Challenges and Opportunities. Ann Emerg Med, 2015. 66(1): p. 51-9.
98. Blank-Reid, C.A. and L.J. Kaplan, A system for working with unidentified trauma patients. Int J Trauma
Nurs, 1996. 2(4): p. 108-10.
99. American College of Surgeons Committee on Trauma, Trauma Registry, in Resources for optimal care of the
injured patient. 2014, Chicago: American College of Surgeons. p. 107-113.
100. Boufous, S. and A. Williamson, Reporting of the incidence of hospitalised injuries: numerator issues. Inj Prev,
2003. 9(4): p. 370-5.
101. Seifert, J., Incidence and economic burden of injuries in the United States. Journal of Epidemiology and
Community Health, 2007. 61(10): p. 926-926.
102. American Academy of Pediatrics Committee on Pediatric Emergency Medicine, Council on Injury,
Violence, and Poison Prevention, Section on Critical Care, Section on Orthopaedics, Section on
Surgery, Section on Transport Medicine, Pediatric Trauma Society, and Society of Trauma Nurses
Pediatric Committee, Management of Pediatric Trauma. Pediatrics, 2016.
103. Vernon, D.D., et al., Effect of a pediatric trauma response team on emergency department treatment time and
mortality of pediatric trauma victims. Pediatrics, 1999. 103(1): p. 20-24.

99
104. Perno, J.F., et al., Significant reduction in delayed diagnosis of injury with implementation of a pediatric trauma
service. Pediatr Emerg Care, 2005. 21(6): p. 367-71.
105. Bach, J.A., et al., The right team at the right time - Multidisciplinary approach to multi-trauma patient with
orthopedic injuries. Int J Crit Illn Inj Sci, 2017. 7(1): p. 32-37.
106. Stinner, D.J., et al., Caring for the polytrauma patient: is your system surviving or thriving? Am J Orthop (Belle
Mead NJ), 2013. 42(5): p. E33-4.
107. Suk, M., We need better care coordination for polytraumatized patients. Am J Orthop (Belle Mead NJ), 2013.
42(7): p. 302.
108. Curtis, K., et al., How is care provided for patients with paediatric trauma and their families in Australia? A
mixed-method study. J Paediatr Child Health, 2016. 52(8): p. 832-6.
109. Ameratunga, S., et al., Children admitted to hospital following unintentional injury: perspectives of health service
providers in Aotearoa/New Zealand. BMC Health Serv Res, 2010. 10: p. 333.
110. Avraham, J.B., et al., Epidemiology of paediatric trauma presenting to US emergency departments: 2006-2012. Inj
Prev, 2017.
111. Macy, M.L., et al., Patient- and Community-Level Sociodemographic Characteristics Associated with Emergency
Department Visits for Childhood Injury. J Pediatr, 2015. 167(3): p. 711-8.e1-4.
112. National Quality Forum, National Voluntary Consensus Standards for Emergency Care: A Consensus Report.
2009: Washington, DC.
113. Aalst, W.M.P.v.d., Process Mining: Discovery, Conformance and Enhancement of Business Processes. 2011:
Springer Publishing Company, Incorporated. 368.
114. Ferreira, D.R. and C. Alves. Discovering user communities in large event logs. in International Conference on
Business Process Management. 2011. Springer.
115. Jenks G. F., The data model concept in statistical mapping. International Yearbook of Cartography, 1967. 7:
p. 186–190. .
116. Csardi, G. and T. Nepusz, The igraph software package for complex network research. InterJournal, Complex
Systems, 2006. 1695(5): p. 1-9.

100
117. R Core Team (2003). R: A language and environment for statistical computing. [Internet]; Available from:
https://www.R-project.org/.
118. Shervashidze, N., et al. Efficient graphlet kernels for large graph comparison. in Artificial Intelligence and
Statistics. 2009.
119. Sugiyama, M., et al., graphkernels: R and Python packages for graph comparison. Bioinformatics, 2018. 34(3):
p. 530-532.
120. Karatzoglou, A., et al., kernlab-an S4 package for kernel methods in R. Journal of statistical software, 2004.
11(9): p. 1-20.
121. Von Luxburg, U., A tutorial on spectral clustering. Statistics and computing, 2007. 17(4): p. 395-416.
122. Bholowalia, P. and A. Kumar, EBK-means: A clustering technique based on elbow method and k-means in
WSN. International Journal of Computer Applications, 2014. 105(9).
123. Herve, M.C., KWALLIS2: Stata module to perform Kruskal-Wallis Test for equality of populations. 1999,
Boston College Department of Economics.
124. StataCorp. 2013. Stata Statistical Software: Release 13. College Station, TX: StataCorp LP.
125. Adai, A.T., et al., LGL: creating a map of protein function with an algorithm for visualizing very large biological
networks. J Mol Biol, 2004. 340(1): p. 179-90.
126. Schlechter, J.A., A.L. Avik, and S. DeMello, Is there a role for a child life specialist during orthopedic cast room
procedures? A prospective-randomized assessment. J Pediatr Orthop B, 2017. 26(6): p. 575-579.
127. Martin, H.A., The Power of Lidocaine, Epinephrine, and Tetracaine (LET) and a Child Life Specialist When
Suturing Lacerations in Children. J Emerg Nurs, 2017. 43(2): p. 169-170.
128. Gursky, B., L.P. Kestler, and M. Lewis, Psychosocial intervention on procedure-related distress in children being
treated for laceration repair. J Dev Behav Pediatr, 2010. 31(3): p. 217-22.
129. Rucker, D.W., Using telephony data to facilitate discovery of clinical workflows. Appl Clin Inform, 2017. 8(2):
p. 381-395.
130. Hribar, M.R., et al., Secondary Use of EHR Timestamp data: Validation and Application for Workflow
Optimization. AMIA Annu Symp Proc, 2015. 2015: p. 1909-17.

101
131. DiazGranados, D., et al., Understanding patient care as a multiteam system, in Pushing the boundaries:
Multiteam systems in research and practice. 2014, Emerald Group Publishing Limited. p. 95-113.
132. Agency for Healthcare Research and Quality. TeamSTEPPS 2.0. Content last reviewed May 2018.
[Internet]; Available from: http://www.ahrq.gov/teamstepps/instructor/index.html.
133. Mathieu, J.E., M.A. Marks, and S.J. Zaccaro, Handbook of Industrial, Work & Organizational
Psychology - Volume 2: Organizational Psychology. 2001, SAGE Publications Ltd: London.
134. Zaccaro, S.J., M.A. Marks, and L.A. DeChurch, Multiteam systems: An introduction, in Multiteam Systems.
2012, Routledge. p. 18-47.
135. Shuffler, M.L. and D.R. Carter, Teamwork situated in multiteam systems: Key lessons learned and future
opportunities. Am Psychol, 2018. 73(4): p. 390-406.
136. American College of Surgeons Committee on Trauma, Resources for Optimal Care of the Injured Patient.
2014, Chicago, IL: American College of surgeons.
137. Vaziri, K., et al., Optimizing physician staffing and resource allocation: sine-wave variation in hourly trauma
admission volume. J Trauma, 2007. 62(3): p. 610-4.
138. Parsch, W., et al., Trauma care inside and outside business hours: comparison of process quality and outcome
indicators in a German level-1 trauma center. Scandinavian Journal of Trauma, Resuscitation and
Emergency Medicine, 2014. 22: p. 62.
139. Di Bartolomeo, S., The 'off-hour' effect in trauma care: a possible quality indicator with appealing characteristics.
Scandinavian Journal of Trauma, Resuscitation and Emergency Medicine, 2011. 19(1): p. 33.
140. Laupland, K.B., C.G. Ball, and A.W. Kirkpatrick, Hospital mortality among major trauma victims admitted on
weekends and evenings: a cohort study. Journal of Trauma Management & Outcomes, 2009. 3: p. 8-8.
141. Crawford, E.R. and J.A. LePine, A configural theory of team processes: Accounting for the structure of taskwork
and teamwork. Academy of Management Review, 2013. 38(1): p. 32-48.
142. DeChurch, L.A. and S.J. Zaccaro. Innovation in scientific multiteam systems: Confluent and countervailing forces.
143. Luciano, M.M., et al., A fitting approach to construct and measurement alignment: The role of big data in
advancing dynamic theories. Organizational Research Methods, 2018. 21(3): p. 592-632.
102
144. Landon, B.E., et al., Variation in Patient-Sharing Networks of Physicians Across the United States. JAMA :
the journal of the American Medical Association, 2012. 308(3): p. 265-273.
145. Kalinka, A.T. and P. Tomancak, linkcomm: an R package for the generation, visualization, and analysis of link
communities in networks of arbitrary size and type. Bioinformatics, 2011. 27(14): p. 2011-2.
146. Radicchi, F., et al., Defining and identifying communities in networks. Proceedings of the National Academy
of Sciences of the United States of America, 2004. 101(9): p. 2658-2663.
147. Ahn, Y.Y., J.P. Bagrow, and S. Lehmann, Link communities reveal multiscale complexity in networks. Nature,
2010. 466(7307): p. 761-4.
148. Xie, J., S. Kelley, and B.K. Szymanski, Overlapping community detection in networks: The state-of-the-art and
comparative study. Acm computing surveys (csur), 2013. 45(4): p. 43.
149. Liu, W., et al., Discovering communities in complex networks by edge label propagation. Sci Rep, 2016. 6: p.
22470.
150. Newman, M.E., Modularity and community structure in networks. Proceedings of the national academy of
sciences, 2006. 103(23): p. 8577-8582.
151. McQuitty, L.L., Hierarchical linkage analysis for the isolation of types. Educational and Psychological
Measurement, 1960. 20(1): p. 55-67.
152. McGeorge, N.M., et al. Supporting Clinicians and Teamwork through Better HIT Design: Understanding the
Trauma Care System at a Level 1 Pediatric Trauma Center Using a Mixed Methods Approach. in Pediatric
Trauma Society. 2017. Charleston, SC.
153. Kamada, T. and S. Kawai, An algorithm for drawing general undirected graphs. Information processing
letters, 1989. 31(1): p. 7-15.
154. Fruchterman, T.M. and E.M. Reingold, Graph drawing by force‐directed placement. Software: Practice and
experience, 1991. 21(11): p. 1129-1164.

103
CURRICULUM VITAE
2 6 0 0 P A R K A V E N U E U N I T 5 E B R I D G E P O R T C T 0 6 6 0 4 U S A
4 4 3 - 9 3 8 - 5 6 4 0 D U R A S H O R C @ Y A H O O . C O M
A S H I M I Y U B A B A T U N D E D U R O J A I Y E
EDUCATION
Sept 2014 –Aug 2018 Johns Hopkins University, School of Medicine, Baltimore, MD, USA
PhD, Health Sciences Informatics
Sept 2013 - Aug 2014 Johns Hopkins University, School of Medicine, Baltimore, MD, USA
Master of Science, Applied Health Sciences Informatics
Mar 2003 – Aug 2009 University of Lagos, College of Medicine, Idi-Araba, Lagos, Nigeria
Bachelor of Medicine, Bachelor of Surgery
RESSEARCH EXPERIENCE
Nov 2015 – Aug 2018 PI: Ayse Gurses, MS, PhD, MPH; Armstrong Institute for Patient Safety and
Quality
Project: Care Transitions in Pediatric Trauma: Implications for HIT design. An
AHRQ funded 5-year research to develop design ideas for usable health information
technology (HIT) systems that would better support cognitive teamwork at care
transitions of pediatric trauma patients. Developed a novel methodology for
investigating multidisciplinary collaboration among healthcare professionals by
applying social network analysis techniques on electronic health record data
Sep 2015 – Nov2015 PI: AnpingXie, PhD; Armstrong Institute for Patient Safety and Quality.
Conducted an ethnographic human factors research to compare the ability of the configuration of the work system (environment, people, technology, processes, and tasks) in the Neurosciences Critical Care Unit and the Pediatric Intensive

104
Care Unit to support the provision of patient-and family-centered care.
Feb 2015 – Jul 2015 PI: Paul Nagy, PhD; Pamela Johnson, MD; Johns Hopkins Medicine Technology
Innovation Center.
Designed and developed a milestones-based dashboard, which integrated data from multiple sources and facilitated the comparison of various metrics related to the performance of residents in the Johns Hopkins Medicine radiology residency program.
May 2014 - Aug 2014 PI: Amy Knight, MD; Johns Hopkins Bayview Medical Center.
Evaluated the effectiveness of a new information technology-based medication reconciliation process in reducing medication discrepancies at the time of discharge.
PUBLICATIONS
Durojaiye A., Snyder E., Cohen M., Nagy P., Hong K., Johnson P. “Radiology Resident Assessment and
Feedback Dashboard". Accepted for publication in RadioGraphics.
Durojaiye A., McGeorge N., Puett L., Stewart D., Fackler J., Hoonakker P., Lehmann H., Gurses A.
“Mapping the Flow of Pediatric Trauma Patients Using Process Mining”. Accepted for publication in Applied
Clinical Informatics.
Durojaiye A., McGeorge N., Webster K., Oruc C., Gurses A. “Characterizing the Utilization of the Problem
List for Pediatric Trauma Care”. Accepted for presentation at the 2018 Annual Symposium of the American
Medical Informatics Association.
Durojaiye A., Puett L., Levin S., Toerper M., McGeorge N., Webster K., Deol G., Kharrazi H., Lehmann H.,
Gurses P. “Linking EHR data to trauma registry data: Assessing the Value of Probabilistic Linkage” Accepted
for publication in Methods of Information in Medicine.
POSTERS AND PRESENTATIONS
McGeorge N., Durojaiye A., Fackler J., Stewart D., Puett L., Gurses A. "Supporting Clinicians and
Teamwork through Better HIT Design: Understanding the Trauma Care System at a Level 1 Pediatric
Trauma Center Using a Mixed Methods Approach". Poster presentation at the 4th Annual Meeting of the
Pediatric Trauma Society, Charleston, SC, Nov 2 – 4, 2017.
105
Durojaiye A., Gispen F., Cohen M., Sevinc G., Nagy P., Johnson P., Abdollahian D. "Design and
Implementation of a Milestone-based Assessment and Feedback Radiology Resident Dashboard". Podium
presentation at the 102nd Scientific Assembly & Annual Meeting of the Radiological Society of North
America, Chicago, IL, Nov 27 – Dec 2, 2016.
McGeorge N., Durojaiye A., Fackler J., Xie A., Rosen M., Hunt E., Stewart D., et al. "Pediatric Trauma Care
Transitions: Understanding Teamwork for Health IT Design". Poster presentation at the 2016 Johns Hopkins
Inaugural Engineering in Healthcare Symposium, Baltimore, MD, Nov 21, 2016.
McGeorge N., Durojaiye A., J. Fackler,Xie A., Rosen M., Hunt E., Stewart D., et. al. "Pediatric Trauma Care
Transitions: Understanding Teamwork for Health IT Design". Poster presentation at the 2016 Johns Hopkins
Patient Safety Summit, Baltimore, MD, Oct 20, 2016.
Durojaiye A., Nyquist P., Fackler J., Gurses A., Pronovost P., Xie A. "Patient- and Family-Centered Care:
Bridging the Gap between Pediatric and Adult Critical Care". Podium presentation at the 2016 International
Symposium on Human Factors and Ergonomics in Health Care: Shaping the future, San Diego, CA, Apr 13 -
16, 2016.
SCHOLARSHIPS, HONOURS AND AWARDS
2016 Certificate of Merit in recognition of the excellence of education exhibit at the 102nd
Scientific Assembly & Annual Meeting of the Radiological Society of North America.
2017 Poster Award Winner, 4th Annual Meeting of the Pediatric Trauma Society
TEACHING EXPERIENCE
Sep 2017 - Oct 2017 Teaching Assistant; Introduction to Biomedical and Public Health Informatics
Johns Hopkins University School of Medicine
Sep 2016 - Oct 2016 Teaching Assistant; Introduction to Biomedical and Public Health Informatics
Johns Hopkins University School of Medicine

106
Nov 2015 – Jan 2016 Teaching assistant; Computational Biology and Bioinformatics
Johns Hopkins University School of Medicine
Sep 2014 - Oct 2014 Teaching Assistant; Introduction to Biomedical and Public Health Informatics
Johns Hopkins University School of Medicine
VOLUNTEER EXPERIENCE
Apr 11 – 14, 2017 Small group facilitator; Topics in Interdisciplinary Medicine – Digital Health and
Biomedical Informatics
Johns Hopkins University School of Medicine
Mar 23 – 25, 2016 Small group facilitator; Topics in Interdisciplinary Medicine – Digital Health and
Biomedical Informatics
Johns Hopkins University School of Medicine
PROFESSIONAL MEMBERSHIP
August 2017 Human Factors and Ergonomics Society (HFES)
July 2017 Healthcare Information and Management Systems Society (HIMMS)
January 2017 American Medical Informatics Association (AMIA)
LANGUAGE
Fluent in English