ashok gulati ifa-fai national seminar on sustainable ... · infosys chair professor for...
TRANSCRIPT
Ashok GulatiInfosys Chair Professor for Agriculture, ICRIER
IFA-FAI National Seminar onSustainable Fertilizer Management for Soil Health
March 16-17, 2015Hotel Grand, New Delhi

Has India’s Fertilizer Pricing and Subsidy (P&S) policy achieved its basic objectives?
What has been the cost to the exchequer?
Exploring options for change with a view to ‘Unshackling the Fertilizer Sector’ and promoting efficient use of fertilizers

1977: Retention Price Scheme (RPS) (Marathe Committee) (cost plus pricing subject to some efficiency norms))
1991/1992: Economic Reforms and Joint Parliamentary Committee (JPC)
2000: Expenditure Reforms Commission (Geethakrishnan)
2010: Nutrient Based Subsidy (NBS)
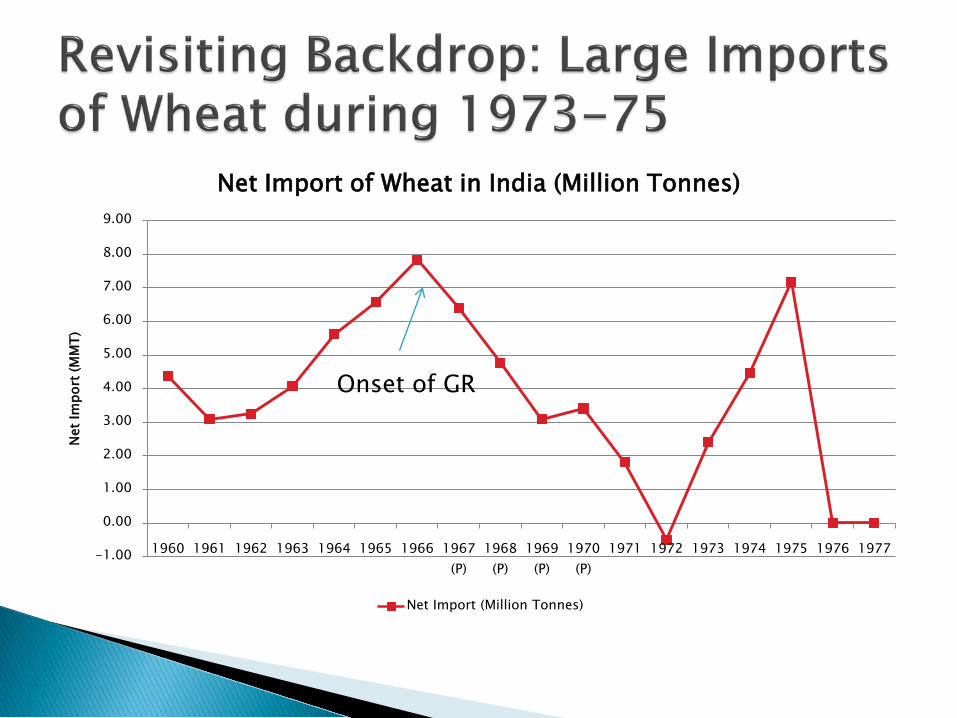
High imports of wheat during 1973-76 in the wake of global price eruption and weak monsoons at home
Acute scarcity of foreign exchange necessitating self-sufficiency in basic staples and fertilizers (urea)
-1.00
0.00
1.00
2.00
3.00
4.00
5.00
6.00
7.00
8.00
9.00
1960 1961 1962 1963 1964 1965 1966 1967 (P)
1968 (P)
1969 (P)
1970 (P)
1971 1972 1973 1974 1975 1976 1977
Net
Impo
rt (M
MT)
Net Import of Wheat in India (Million Tonnes)
Net Import (Million Tonnes)
Onset of GR

0.00
20.00
40.00
60.00
80.00
100.00
120.00
140.00
160.00
180.00
0
500
1000
1500
2000
2500
Wor
ld P
rice
of W
hear
, US
HRW
(USD
/MT)
Fore
x Re
serv
e (in
USD
Mill
ion)
Year
Forex Reserve in India vis-a vis world Price of Wheat1960-61 to 1975-76
Forex Reserve (USD Million) World Price of Wheat, US HRW (USD/MT)-RHS

2.4
5.0
8.8 8.1 8.0
5.4 5.5
9.7
6.55.0 5.7
12.0
22.120.4
0.0
2.0
4.0
6.0
8.0
10.0
12.0
0
5
10
15
20
25
2000
-01
2001
-02
2002
-03
2003
-04
2004
-05
2005
-06
2006
-07
2007
-08
2008
-09
2009
-10
2010
-11
2011
-12
2012
-13
2013
-14
(Est
)
Mill
ion
Tonn
es
Rice Wheat Maize Others Value of Exports (US$ Bn)

35.7
63.0
80.573.9
0
10
20
30
40
50
60
70
80
90
1992
-93
1993
-94
1994
-95
1995
-96
1996
-97
1997
-98
1998
-99
1999
-00
2000
-01
2001
-02
2002
-03
2003
-04
2004
-05
2005
-06
2006
-07
2007
-08
2008
-09
2009
-10
2010
-11
2011
-12
2012
-13
2013
-14
Mill
ion
tonn
es
Rice Wheat Norm
Stocks as on 1st July of the year
Source: DFPD

0.00
5.00
10.00
15.00
20.00
25.00
0
20000
40000
60000
80000
100000
12000019
80-8
119
81-8
219
82-8
319
83-8
419
84-8
519
85-8
619
86-8
719
87-8
819
88-8
919
89-9
019
90-9
119
91-9
219
92-9
319
93-9
419
94-9
519
95-9
619
96-9
719
97-9
819
98-9
919
99-0
020
00-0
120
01-0
220
02-0
320
03-0
420
04-0
520
05-0
620
06-0
720
07-0
820
08-0
920
09-1
020
10-1
120
11-1
220
12-1
3 20
13-1
4 R
E
Tota
l Sub
sidy
in U
SD B
illio
n
Tota
l Sub
sidy
in R
s. C
rore
s
Year
Total Subsidy in Rs. Crores Total Subsidy in USD Billion (RHS)

0.00
0.50
1.00
1.50
2.00
2.50
3.00
0%
10%
20%
30%
40%
50%
60%
70%
80%
90%
100%
Fert
ilize
r, Fo
od a
nd P
etro
leum
sub
sidy
as
a pe
rcen
tage
of G
DP
Perc
ent
Year
Changing composition of total subsidy
Food Subsidy Fertilizer SubsidyPetroleum Subsidy Other SubsidyFertilizer, Food and Petroleum subsidy as a percentage of GDP
Fertilizer subsidy

1.72
10.24
21.79
0
20000
40000
60000
80000
100000
120000
0.00
5.00
10.00
15.00
20.00
25.00
2000-01 2001-02 2002-03 2003-04 2004-05 2005-06 2006-07 2007-08 2008-09 2009-10 2010-11 2011-12 2012-13 2013-14
Fert
ilize
r Su
bsid
y (in
Rs.
Cro
re)
Perc
enta
ge
Year
Fertilizer Subsidy as a % of GDP Fertilizer Subsidy as a % of Agricultural GDP
Fertilizer Subsidy as a % of Tax Revenue Total Fertilizer Subsidy (in Rs. Crore)

14.7 16.4 16.1
2.1
13.06.7
0
5
10
15
20
25
30
35
Prod
uctio
n an
d im
port
of F
ertil
izer
s (M
illio
n M
T)
Year
Production Import

87.6
85.9
89.6
87.6 84.8
74.7 72.5
66.058.5
63.957.0
55.7
64.4
70.5
12.4
14.1
10.4
12.415.2
25.227.4
34.0
41.5
36.1
43.044.3
35.6
29.5
0.00
10.00
20.00
30.00
40.00
50.00
60.00
70.00
80.00
90.00
100.00
Perc
enta
ge
YearProduction as % of Availability Import as a % of Availability

Year
NPK ratio
All-India Haryana Punjab RajasthanAndhra Pradesh
1 2 3 4 5 6
2000-01 7.0:2.7:1 73.9:21.3:1 42.5:11.9:1 92.1:30.5:1 6.5:2.9:1
2007-08 5.5:2.1:1 39.8:10.9:1 34.3:9.0:1 33.7:12.5:1 3.8:1.7:1
2008-09 4.6:2.0:1 32.2:10.7:1 23.6:6.7:1 30.2:13.6:1 3.5:1.7:1
2010-11 4.7:2.3:1 20.5:7.1:1 19.1:5.9:1 24.9:11.8:1 3.9:2.1:1
2011-12 6.7:3.1:1 27.2:9.8:1 26.8:8.5:1 34.9:15.9:1 6.1:3.2:1
2012-13 9.9:3.3:1 61.4:18.7:1 61.7:19.2:1 44.9:16.5:1 7.1:2.8:1

53605360
26075 25184
20636
17972
0
5000
10000
15000
20000
25000
3000019
81-8
219
82-8
319
83-8
419
84-8
519
85-8
619
86-8
719
87-8
819
88-8
919
89-9
019
90-9
119
91-9
219
92-9
319
93-9
419
94-9
519
95-9
619
96-9
719
97-9
819
98-9
919
99-2
000
2000
-01
2001
-02
2002
-03
2003
-04
2004
-05
2005
-06
2006
-07
2007
-08
2008
-09
2009
-10
2010
-11
2011
-12
2012
-13
2013
-14
MR
P of
Ure
a, D
AP
and
MO
P (R
s./M
T)
Year
MRP of Urea MRP of DAP MRP of MOP

Need to see urea prices in relation to minimum support prices (MSPs) for major crops (wheat and rice)
Also see the weight of fertilizers (especially urea) in MSP

3.8:1
2.8:1
1.9:1 1.9:1
1.3:1 1.0:1
2.6:1
1.4:10.9:1
0.0
0.5
1.0
1.5
2.0
2.5
3.0
3.5
4.0
Ratio
of M
SP o
f Ric
e an
d W
heat
to P
rice
of U
rea
Ratio of MSP of Rice and Wheat to Urea in Selected Countries-2014
MSP Rice: Price of Urea MSP Wheat: Price of Urea

580.5505.0
408.3 388.1330.2
291.0384.6
320.0226.6
0.0
100.0
200.0
300.0
400.0
500.0
600.0
700.0
MSP
of R
ice
and
Whe
at-U
SD/M
T
MSP (USD/MT) Comparison Between Selected Countries-2014
MSP Rice MSP Wheat

Only 7-8 percent in Punjab
If urea prices go up by 200%, and MSP remains frozen, situation worsens for Indian farmer…politically not a viable option
But if MSP of say wheat raised to the level of MSP in Pakistan ($320/MT) or China ($385/MT), Indian farmer will be much better off (but food subsidy will balloon)

Rs 7000/ha (NSA 140 m ha), subject to Soil Health Cards
Deregulate fertilizer prices (including urea) with open imports at zero duty
Provide gas to urea plants at uniform price
Time to switch gears from price policy to income policy…

Politically feasible; Operationally possible to link with UID and Jan Dhan in 1-2 years (Issue of land records)
Expected gains: Diversion to non-agri uses and smuggling to neighboring countries will stop
Better NPK usage; better yield response
Subsidy bill may come down by 15-20%

0.00
100.00
200.00
300.00
400.00
500.00
600.00
700.00
800.00
900.00
0.00 10.00 20.00 30.00 40.00 50.00 60.00 70.00 80.00 90.00 100.00
Rate
of c
once
ssio
n an
d w
orld
Pric
e (U
SD/M
T)
Cumulative production (%)
Supply Curve of urea and world price
Rate of Concession World Price 2014
GX92
GP92GX92
GX92
GX92GP92
GP92 GP92GX92
GP92GP92
GX92GX92
GP92GX92
GX92GP92
GX92 GX92GX92
GX92GX92
GX92 GX9
2
GX92
GX92
NN
N
N