ashrae journal - reducing risks of surgery
TRANSCRIPT

2 8 A S H R A E J o u r n a l a s h r a e . o r g F e b r u a r y 2 0 0 3
REDUCING
RISKSSURGERY
OF
he risk of postoperative infection is present in all surgical proce-dures, but can be particularly serious in certain operations, for ex-
ample, joint replacement. The National Institutes of Health (NIH), Of-fice of Research Services, Division of Engineering Services, has con-ducted an extensive study on the issue of operating room ventilationsystems and their effect on the protection of the surgical site.
By Farhad Memarzadeh, Ph.D., P.E., and Andy Manning, Ph.D.
Several factors can affect postopera-tive infection, including patient factors(e.g., susceptibility to infection), surgi-cal field factors (e.g., the thermal plumefrom the site), room factors (e.g., cleanli-ness of the operating room), and HVACfactors (e.g., air change rate [ACH] anddirection of airflow). Figure 2 showssources, routes and interactions of manyof these factors.
The literature agrees that the primarysource of bacteria that causes infectionare squames, or skin scales or particles.1
These particles are about 10 microns indiameter, and are shed from exposed re-gions of skin, both from the surgical staffand by the patient. In this study, only thissource of contaminant is considered.
Suggested standards exist for air-con-ditioning systems for operating theatresin different countries. The standard foroperating room design in Germany forexample, is DIN 1946/4,2 which had itslatest revision in 1999. This standardcontains some specific details for thedesign of the operating room, such as thesupply air discharge, and defines a refer-ence supply airflow rate. The actualamount to be supplied to the room, how-ever, is defined using two factors, whichrequire experimental measurement to bedetermined.
The 1999 ASHRAE Handbook—Appli-cations3 suggests that “the delivery ofair from the ceiling, with a downwardmovement to several exhaust inlets lo-
cated on opposite walls, is probably themost effective air movement pattern formaintaining the concentration at an ac-ceptable level.” The handbook suggeststhat the temperature range should be be-tween 62°F (16.67°C) and 80°F(26.67°C), and that positive pressuriza-tion should be maintained.
It also suggests that the air should besupplied at the ceiling and exhausted orreturned from at least two locations nearthe floor. It suggests that supply diffus-ers should be of the unidirectional type,and that high-induction ceiling orsidewall diffusers should be avoided. Thesuggested ACH is 15 for systems that useall outdoor air, and 25 ACH for recircu-lating air systems.
Some studies have considered the rela-tive merits of different systems. However,studies such as Lidwell and Schmidt4,5
do not include specific system designdata for these systems, so it is difficult toestablish definitive recommendationsfor the actual design of the ventilationsystem. Further, conflicting data existsregarding the system that is generallyrecognized as the cleanest type of sys-tem. In particular, while laminar flow sys-
TTTTT
The following article was published in ASHRAE Journal, February 2003. © Copyright 2003 American Society of Heating, Refrigerating and Air-Conditioning Engineers, Inc. It is presented for educational purposes only. This article may not be copied and/or distributed electronically orin paper form without permission of ASHRAE.
F e b r u a r y 2 0 0 3 A S H R A E J o u r n a l 2 9
Ventilation
tems are recognized for providing lower general concentrationlevels in the room, they are sometimes blamed for higher in-fection rates than more conventional systems, for example,Salvati, et al.6 The theory put forward by Lewis7 is that laminarflow systems cause impingement on the wound site. However,this seems to be based on the use of high laminar flow veloci-ties at supply. Schmidt5 defines a laminar system as havingvelocities of at least 90 fpm (0.45 m/s).
The previously mentioned studies were experiment based.However, an alternative technique, computational fluid dy-namics, CFD, (sometimes known as airflow modeling) hasproven to be powerful and efficient in research projects in-volving parametric study on room airflow and contaminantdispersion.8,9 Lo10 was the only CFD study identified in thisliterature search that addressed contamination control in anoperating room.
However, this study made two assumptions that would makethe conclusions less useful. In particular, the study only con-sidered an isothermal operating room, and second, the con-taminant was considered as a concentration. In the former case,therefore, the effect of significant thermal plumes in the roomwas ignored. In the latter case, the assumption that the par-ticles in the room can be considered to follow Brownian mo-tion of the airflow is strictly applicable to particles that are 1micron or less in diameter.11
While bacteria and viruses do conform to this criteria, asnoted earlier, bacteria are usually transported in operatingrooms by squames, which are considerably bigger (in the rangeof 10 microns), and so do not necessarily follow Brownianmotion. For this reason, concentration sources were not usedin this study. Another reason was that the use of concentrationwould make the question of impact of the particles on the
surgical site more difficult to determine.In the study documented here, airflow modeling is used to
consider the dispersion of squames-sized particles in variousventilation system design operating rooms. To establish the rela-tive ranking of the different systems, two target areas of concernare considered: the surgical site and the top surface of the backtable. The reason for the latter target is squames that strike thissurface are likely to directly contaminate instruments.
The main purposes of the study are to:• Use advanced numerical modeling and empirical data to
evaluate the effects of some various room parameters on mini-mizing the risk of contamination of an operating room surgi-cal site and a back table from specific particulate sources.
• Evaluate the same parameters to determine which ventila-tion systems evacuate the room of particles most effectively.
• Provide an architectural/engineering tool for good designpractice that is generally applicable to conventional operat-ing room use.
MethodologyThe CFD code used in this study is a finite-volume code
that has been validated against experimental data.12 To ana-lyze the ventilation performance of different settings, numeri-cal methods based on computational fluid dynamics were usedto create computer simulations of more than 160 different roomconfigurations. The performance of this approach was suc-cessfully verified by comparison with an extensive set of ex-
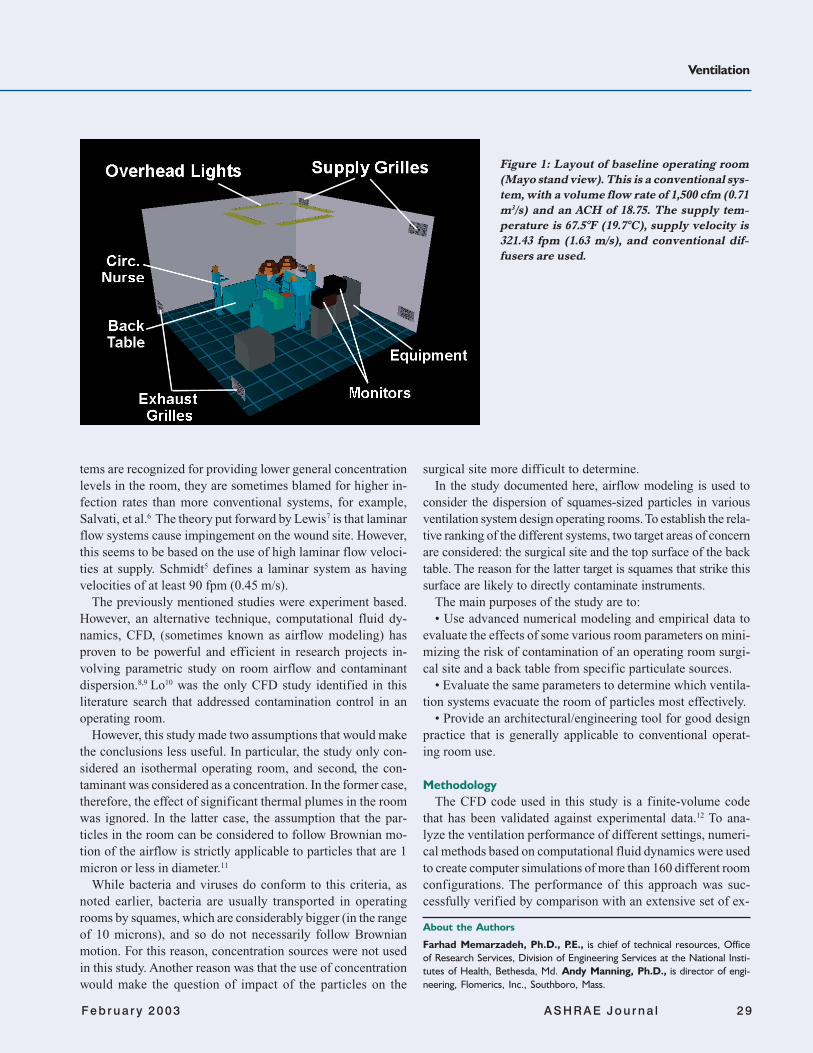
Figure 1: Layout of baseline operating room
(Mayo stand view). This is a conventional sys-
tem, with a volume flow rate of 1,500 cfm (0.71
m3/s) and an ACH of 18.75. The supply tem-
perature is 67.5°F (19.7°C), supply velocity is
321.43 fpm (1.63 m/s), and conventional dif-
fusers are used.
About the Authors
Farhad Memarzadeh, Ph.D., P.E., is chief of technical resources, Officeof Research Services, Division of Engineering Services at the National Insti-tutes of Health, Bethesda, Md. Andy Manning, Ph.D., is director of engi-neering, Flomerics, Inc., Southboro, Mass.
3 0 A S H R A E J o u r n a l a s h r a e . o r g F e b r u a r y 2 0 0 3
perimental measurements. A total of 12.9 million experimen-tal (empirical) data values were collected to confirm the meth-odology. The average error between the experimental andcomputational values was 14.36% for temperature and veloci-ties, while the equivalent value for concentrations was 14.5%.This study is available at http://des.od.nih.gov/eWeb/research/farhad/index.htm.
In the case of the representation of squames, a Lagrangianparticle-tracking algorithm was used to calculate their trajec-tories. Representative numbers of particles were released fromappropriate locations in the room, as discussed later. As in thecase of the CFD code, the particle-tracking algorithm was vali-dated against appropriate experimental data13 while turbulencewas incorporated into the Stochastic model via the k-ε turbu-lence model.14
The CFD and particle-tracking routine methodology aredescribed in detail in Memarzadeh and Manning.15
Outline of Baseline ModelA typical operating room layout in terms of number of surgi-
cal staff, lights, machinery, tables and patient was consideredfor the baseline model for the CFD simulations. The room’sdimensions are 20 × 20 × 12 ft (6.1 × 6.1 × 3.66 m). The generalfeatures of the baseline room (Case 1) are given in Figure 1.
A panel of physicians and engineers agreed upon the roomlayout during the initial stages of the study. Items such as gascolumns were not included with the belief that they obstruct thefree movement of large equipment in operating rooms, limit theplacement and position of the operating table and are difficultto keep clean. Also, the panel thinks operating rooms should bemoving toward connection of gas lines at the ceiling, since suchlines would not provide significant blockage to airflow.
Other significant items of equipment, for example, a C-arm,were not included in this study, as the panel thought that theydid not constitute “typical” equipment. It is recognized thatsuch items may influence the airflow and temperature distribu-
tion in the operating room, and that they should be consideredin future studies. The total heat dissipated in the room was2,166 W. Only constantly dissipating objects were included inthe heat load.
Model ConsiderationsModel ConsiderationsModel ConsiderationsModel ConsiderationsModel Considerations
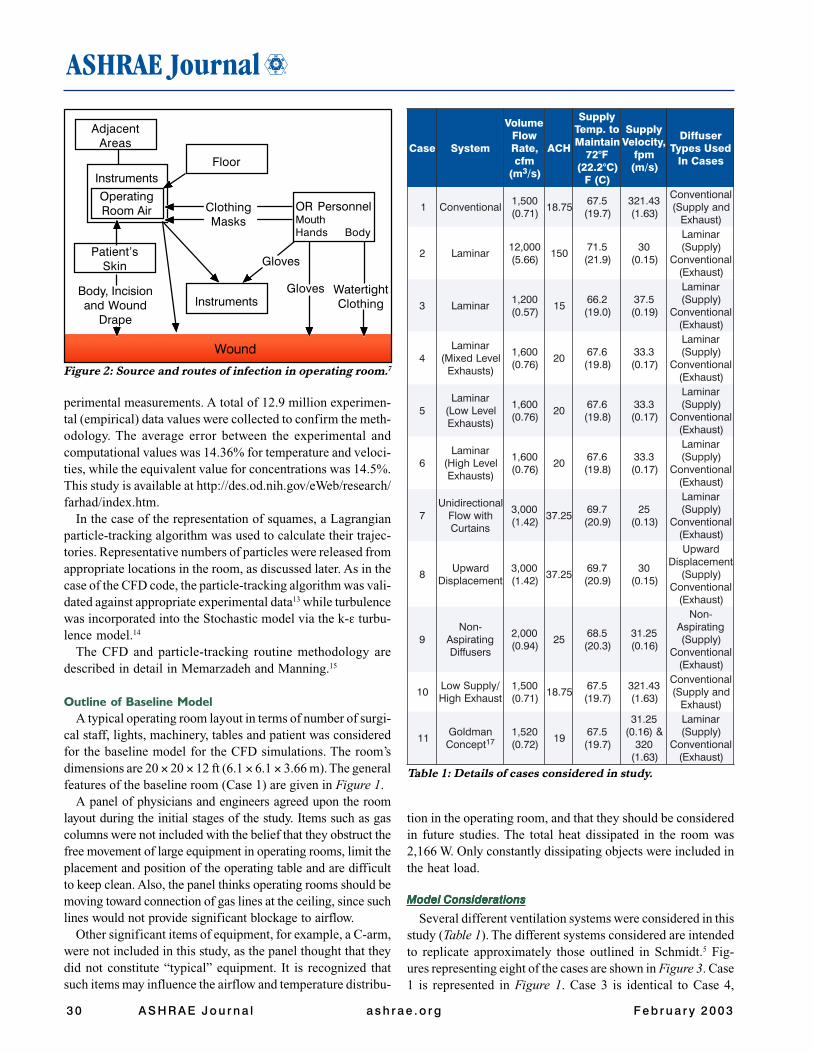
Several different ventilation systems were considered in thisstudy (Table 1). The different systems considered are intendedto replicate approximately those outlined in Schmidt.5 Fig-ures representing eight of the cases are shown in Figure 3. Case1 is represented in Figure 1. Case 3 is identical to Case 4,
Wound
AdjacentAreas
Instruments
OperatingRoom Air
Patient’sSkin
Body, Incisionand Wound
Drape
Floor
Instruments
Gloves
WatertightClothing
OR PersonnelMouthHands Body
ClothingMasks
Gloves
Figure 2: Source and routes of infection in operating room.7
esaC metsyS
emuloVwolF
,etaRmfc
m( 3 )s/
HCA
ylppuSot.pmeTniatniaM
F°27)C°2.22(
)C(F
ylppuS,yticoleV
mpf)s/m(
resuffiDdesUsepyT
sesaCnI
1 lanoitnevnoC005,1)17.0(
57.815.76
)7.91(34.123)36.1(
lanoitnevnoCdnaylppuS(
)tsuahxE
2 ranimaL000,21)66.5(
0515.17
)9.12(03
)51.0(
ranimaL)ylppuS(
lanoitnevnoC)tsuahxE(
3 ranimaL002,1)75.0(
512.66
)0.91(5.73
)91.0(
ranimaL)ylppuS(
lanoitnevnoC)tsuahxE(
4ranimaL
leveLdexiM()stsuahxE
006,1)67.0(
026.76
)8.91(3.33
)71.0(
ranimaL)ylppuS(
lanoitnevnoC)tsuahxE(
5ranimaL
leveLwoL()stsuahxE
006,1)67.0(
026.76
)8.91(3.33
)71.0(
ranimaL)ylppuS(
lanoitnevnoC)tsuahxE(
6ranimaL
leveLhgiH()stsuahxE
006,1)67.0(
026.76
)8.91(3.33
)71.0(
ranimaL)ylppuS(
lanoitnevnoC)tsuahxE(
7lanoitceridinU
htiwwolFsniatruC
000,3)24.1(
52.737.96
)9.02(52
)31.0(
ranimaL)ylppuS(
lanoitnevnoC)tsuahxE(
8drawpU
tnemecalpsiD000,3)24.1(
52.737.96
)9.02(03
)51.0(
drawpUtnemecalpsiD
)ylppuS(lanoitnevnoC
)tsuahxE(
9-noN
gnitaripsAsresuffiD
000,2)49.0(
525.86
)3.02(52.13)61.0(
-noNgnitaripsA)ylppuS(
lanoitnevnoC)tsuahxE(
01/ylppuSwoLtsuahxEhgiH
005,1)17.0(
57.815.76
)7.91(34.123)36.1(
lanoitnevnoCdnaylppuS(
)tsuahxE
11namdloG
tpecnoC 71025,1)27.0(
915.76
)7.91(
52.13&)61.0(
023)36.1(
ranimaL)ylppuS(
lanoitnevnoC)tsuahxE(
Table 1: Details of cases considered in study.

Ventilation
F e b r u a r y 2 0 0 3 A S H R A E J o u r n a l 3 1
Case 10 Case 11
Case 2 Case 3
Case 5 Case 7
Case 8 Case 9
Figure 3: Eight cases with different ventilation systems.
except that the laminar flow diffuser array is bigger. Case 5 isthe same as Case 6, except that the exhausts are located at ahigh level in the latter case.
The various diffuser types considered in this project weremodeled using a combination of several boundary conditions,which were validated prior to the room parametric study. Greatcare was taken with regards to the correct representation of thediffusers in the room, as well as the numerical grid used. Thenumerical diffuser models were validated against availablemanufacturers data to ensure that throw characteristics werematched accurately. This was performed for all the diffusertypes (conventional grille, laminar flow, non-aspirating, dis-placement), and for an appropriate range of flow rates.
The number of grid cells used in these cases was on the orderof 600,000 cells. Grid dependency tests were performed toensure that the results were appropriate and would not vary onincreasing the grid density.
Contamination ConsiderationContamination ConsiderationContamination ConsiderationContamination ConsiderationContamination Consideration
The source of contaminants considered in this study wassquames. Squames, are cells that are released from exposedregions of the surgery staff, for example, neck, face, etc., andare the primary transport mechanism for bacteria in the operat-ing room. They are approximately 25 microns (µm) by 3 to 5microns thick. Approximately 1.15 × 10⁶ to 0.9 to 108 are gen-erated during a typical (two to four hours) procedure.16 In thisstudy, the particles would be tracked to see how many hit theback table, shown in Figure 1, or the surgical site. For thepurposes of this study, the surgical site was considered as a 1 ×1 ft (0.3 × 0.3 m) square where the surface temperature was100°F (37.78°C), and is shown in Figure 4.
Obviously, to keep track of so many particles in the studywould not be feasible. Therefore, a representative number ofparticles were introduced from three arrays of sources. Thelocations and sizes of the sources, designated as Main, Nurseand Surgery (Table 2).
The Main source was intended to represent the general vol-ume that the squames could be released from as the surgicalstaff passed around the table. The Nurse source was intendedto represent the general volume that the squames could be
released from the circulating nurse. Finally, the Surgery sourcewas intended to represent the general volume that the squamescould be released from the surgical staff as they leaned overthe surgical site. Because the particles could readily pass tothe instruments at this point, the Surgery source/top surface ofback table target analysis was not performed in this study.
Tests were performed to determine how many particles werereleased from each point such that the analysis did not change.It was found necessary to release 500 particles from each of thesource locations to ensure that the results were consistent.
ResultsThere are three potential particle outcomes:• The particle vents from the room via exhaust grilles. In this
case, the particle-tracking analysis is stopped.• The particle strikes the surgical site or top surface of back
table. In this case, the particle-tracking analysis is stopped.
Table 2: Details of particle sources.
ecruoS eziSlacisyhP yarrAelcitraP noitisoP
niaM.ni45 × .ni85
× .ni42
3 × 3 × 3005,31(
)selcitraP
deBrevOderetneCaisehtsenAmorFsdnetxE
deBfodnEotneercSm22.1(tf4tasnigeB
)FFA
esruN.ni42 × .ni42
× .ni27
2 × 2 × 2000,4(
)selcitraP
OderetneC revesruNgnitalucriC
leveLroolFtasnigeB
yregruS.ni41 × .ni41× .ni6
3 × 3 × 3005,31(
)selcitraP
yregruSrevOderetneCetiS .ni5.0tasnigeB
yregruSevobA)m2e72.1(etiS

3 2 A S H R A E J o u r n a l a s h r a e . o r g F e b r u a r y 2 0 0 3
• The particle remains in the room at the time when particletracking is stopped.
The results are considered for two of the outcomes, namelythe particle is vented via ventilation and the particle strikes adesignated target, in terms of percentages of total particlesreleased. The other outcome is a trivial calculation, namely:
Percentage of particles remaining in room at end of particletracking analysis = 100 – [(Percentage of particles vented fromroom at end of particle tracking analysis) + (Percentage ofparticles that strike surgical site or top surface of back table)].
In terms of the particles that remain in the room, the analysisshows that the particles either become trapped in recirculationregions (which they may exit after a long time), or fall bygravity to the floor in low velocity flow regions.
PPPPPercentage of Vercentage of Vercentage of Vercentage of Vercentage of Vented Pented Pented Pented Pented Particlesarticlesarticlesarticlesarticles
The percentages of particles vented from the room via ven-tilation at the end of the tracking period are given in Table 3.
The table shows a wide range in the level of effectiveness inremoving the particles via ventilation. This is an expectedresult, but interesting points can be drawn from the results.First, cases that have the same ACH show marked differences interms of the percentage of particles removed via ventilation.For example, Case 10 demonstrates a more effective removalof particles than Case 1. The reason in this example is that theventilation system in Case 1 results in the formation of twolarge recirculations in the room where particles can becometrapped. In Case 10 the ventilation system works with the ther-mal plume in the center of the room in driving the particles upto the high level exhausts.
Second, taking Cases 3, 4, 5, 6 and 9 as a group that adoptsthe same general approach to ventilation, the percentagevented becomes more uniform in terms of particle release loca-tion, though not necessarily in terms of magnitude, as the ACHis increased and the size of the supply array increases. Thereason for this is that, for the smaller laminar arrays, the areasoutside the direct influence of the supply have very low veloc-ity flow fields. Here the particles tend to drop via gravity to thefloor level, and remain in the room when the particle time limitis reached.
PPPPPercentage of Percentage of Percentage of Percentage of Percentage of Particles Striking Tarticles Striking Tarticles Striking Tarticles Striking Tarticles Striking Targetsargetsargetsargetsargets
Table 4 shows the percentage of particles that strike the sur-gical site or back table targets from the Main, Nurse and Sur-gery sources. As with the consideration of the vented outparticles, several interesting points need to be made.
First, the percentages of particles that hit the surgical sitefrom the Main or Nurse sites are low (less than 1%). This isbecause of the relative dominance of the thermal plume causedby the surgical site. For example, Figure 5 shows such a plumefor Case 2. It is only when the particles are released close to thesite, in particular, the Surgery source that the percentage be-comes significant.
Second, ACH is not as significant in the surgery source/surgicalsite analysis as design of the ventilation system. In particular, alower percentage of particles hit the site in Case 4, which has anACH of 20, than Case 2, which has an ACH of 150.
Third, with the exception of Case 11, the percentage of par-ticles that hit the back table from the Main or Nurse sites arerelatively low. While there is no thermal plume preventing theparticles from hitting the table, the particles only strike thetarget if they enter a region of low velocity flow, where theparticles settle by gravity, or they are blown directly onto thetable, which is the case in the high Nurse source value of 9.8%.The results for Cases 4, 5 and 6 indicate that a mixture ofexhaust location levels is better than low or high only. Finally,the cases that can be placed together in a laminar flow typegroup, namely, Cases 2, 3, 4, 5, 6 and 9, do not show higherstrike rates than the other systems. In fact, Cases 4 and 9 repre-sent the lowest strike percentages of all the cases considered.
Conclusions and DiscussionFrom the previous results, the study showed:• Cases that have the same ACH show marked differences in
terms of the percentage of particles removed via ventilation.• The practice of increasing ACH to high levels results in
excellent removal of particles via ventilation, but does notnecessarily mean that the percentage of particles that strikesurfaces of concern continue to decrease.
• The percentages of particles that hit the surgical site fromthe Main or Nurse sites are low (less than 1%). This is because
Figure 5: Thermal plume from surgi-cal site in Case 2 (laminar design).
Figure 6: Flow field in Case 9.Figure 4: Surgical site and Mayo stand.

Ventilation
F e b r u a r y 2 0 0 3 A S H R A E J o u r n a l 3 3
of the relative dominance of the thermal plume caused by thesurgical site. Only when the particles are released close to thesite, in particular, the Surgery source, does the percentage be-come significant.
• ACH is not as significant in the surgery source/surgical siteanalysis as design of the ventilation system. In particular, alower percentage of particles hit the site in a case that has anACH of 20, than one that has an ACH of 150.
• In a system that provides a laminar flow regime, a mixtureof exhaust location levels works better than either low or highlevel locations only. However, the difference is not significantenough that the low- or high-level location systems are notviable options.
• Systems that provide laminar flow regimes represent thebest option for an operating room in terms of contaminationcontrol, as they result in the smallest percentage of particlesimpacting the surgical site. However, care needs to be taken inthe sizing of the laminar flow array. A face velocity of around30 to 35 fpm (0.15 to 0.18 m/s) is sufficient from the laminardiffuser array, provided that the array size itself is set correctly.
To expand on the issue of diffuser array size, it appears thatthe main factor in the design of the ventilation system is thecontrol of the central region of the operating room. In particu-lar, the operating lights and surgical staff represent a large heatdensity in the middle of the room. Particulates could becomecaught in buoyant plumes created by these heat-dissipatingobjects, at which point control of them is lost. However, if alaminar flow type system is employed, the particles are insteaddriven by the flow to be exhausted. Ideally then, the array sizeshould be large enough to cover the main heat dissipatingobjects. This is illustrated in Figure 6, which shows the flowfield for Case 9.
Further, another factor is the thermal plume created by thesurgical site, shown for Case 2 in Figure 5. A laminar flowregime that provides air at 30 to 35 fpm (0.15 to 0.18 m/s)ensures that particles are not impinged on the surgical site, adanger highlighted by Lewis,7 as the thermal plume should besufficient to protect the surgical site.
References1. Woods, J.E., et al. 1986. “Ventilation requirements in hospital
operating rooms – Part I: control of airborne particles.” ASHRAE Trans-actions 92 (2).
2. DIN 1946/4. Heating, Ventilation and Air Conditioning: HVACSystems in Hospitals. (Latest revision, 1999.)
3. 1999ASHRAE Handbook—Applications.4. Lidwell, O.M. 1988. “Air, antibiotics and sepsis in replacement
joints.” Journal of Hospital Infection 11 (Supplement C):18–40.5. Schmidt, P. 1987. “Air control in operating theatres.” Heizung
Luftung Haus Technik 38(3):145–153.6. Salvati, E.A., et al. 1982. “Infection rates after 3,175 total hip and
total knee replacements performed with and without a horizontal uni-directional filtered airflow system.” Journal of Bone and Joint Surgery64A(4)525–535.
7. Lewis, J.R. 1993. “Operating room air distribution effectiveness.”ASHRAE Transactions.
8. Jiang, Z., Q. Chen, F. Haghighat. 1995. “Airflow and air quality inlarge enclosures.” ASME Journal of Solar Energy Engineering 117:114–122.
9. Haghighat, F., Z. Jiang, Y. Zhang. 1994. “Impact of ventilation rateand partition layout on VOC emission rate: time-dependent contaminantremoval.” International Journal of Indoor Air Quality and Climate,4:276–283.
10. Lo, L-M. 1997. “Numerical studies of airflow movement andcontaminant transport in hospital operating rooms.” University of Min-nesota, M.Sc Thesis.
11. Crowe, C., M.Sommerfield, Y. Tsuji. 1998. Multiphase Flowswith Droplets and Particles. CRC Press.
12. Memarzadeh, F. 1998. Ventilation Design Handbook on AnimalResearch Facilities Using Static Microisolators. Bethesda, Md.: Na-tional Institutes of Health, Office of the Director.
13. Snyder, W.H. and J.L. Lumley. 1971. “Some measurement ofparticle velocity autocorrelation functions in turbulent flow.” J. FluidMechanics 48:41–7.
14. Alani A., D. Dixon-Hardy, M. Seymour. 1998. “Contaminantstransport modeling.” EngD in Environmental Technology Conference.
15. Memarzadeh, F., A. Manning. 2002. “Comparison of operatingroom ventilation systems in the protection of the surgical site.” ASHRAETransactions 108(2).
16. Snyder, O.P. 1996. A ‘Safe Hands’ Wash Program for RetailFood Operations. St. Paul, Minn.: Hospitality Institute of Technologyand Management.
17. Goldman, M. 2000. “Operating room airflow and distribution.”ASHRAE 2000 Winter Meeting, Dallas.
Table 4: Percentage of particles hitting surgical siteor back table.
esaC HCAselcitraPfoegatnecreP
etiSlacigruStiHtahT
foegatnecrePtiHtahTselcitraP
elbaTkcaBniaM esruN lacigruS niaM esruN
1 57.81 2.0 3.0 7.4 4.1 4.22 051 0.0 0.0 2.4 1.0 0.03 51 2.0 0.0 1.4 1.0 6.04 02 0.0 0.0 9.1 2.0 3.05 02 0.0 0.0 1.2 0.0 2.06 02 0.0 0.0 7.2 2.0 2.07 52.73 5.0 0.0 2.5 4.2 2.08 52.73 0.0 1.0 4.3 0.0 0.09 52 0.0 0.0 1.2 1.0 2.001 57.81 0.0 0.0 9.6 2.0 9.011 91 1.0 2.0 6.4 1.1 8.9
Table 3: Percentage of particles vented after one hour.
esaC HCAdetneVselcitraPfoegatnecreP
ruoHenOretfAmooRmorFniaM esruN lacigruS
1 57.81 9.14 7.94 0.642 051 4.99 4.89 8.493 51 3.77 7.94 3.374 02 4.08 2.45 7.685 02 9.58 8.06 0.686 02 8.38 1.27 1.087 52.73 5.36 0.56 9.468 52.73 3.47 4.77 3.449 52 4.27 1.47 7.0601 57.81 2.96 8.18 8.3711 91 2.25 2.84 7.44