strategy for reducing risks
TRANSCRIPT

Strategy for Reducing Risks From Hazards in Middletown, Rhode Island: A Multi-Hazard Mitigation Strategy, 2019 Update
Town of Middletown, RI

2
Strategy for Reducing Risks From Hazards in Middletown, Rhode Island: A Multi-Hazard Mitigation Strategy, 2019 Update
Acknowledgements Gina Raimondo Governor Rhode Island Emergency Management Agency Marc Pappas Director Authors Town of Middletown Local Hazard Mitigation Committee Town of Middletown Planning Board Adopted by Middletown Town Council November 18, 2019 Approved by FEMA January 23, 2020

3

4
Additional Acknowledgements Mitigation planning has been successfully initiated in Middletown with continuing support and resources provided by the Rhode Island Emergency Management Agency. The guidance and assistance provided by the Rhode Island State Hazard Mitigation Committee is essential for implementing the strategy presented in this plan. Middletown is also grateful for the efforts of the Town Planning Board, the Emergency Management Agency, and the Local Hazard Mitigation Committee in preparing this plan.
Middletown Town Administrator
Shawn Brown
Middletown Town Council
Robert Sylvia, President
Paul Rodrigues, Vice-President
Terri Flynn
Rick Lombardi
Theresa Santos
Dennis Turano
Barbara VonVillas
Middletown Planning Department
Ronald Wolanski, Director of Planning & Economic Development
Rita Lavoie, Principal Planner & GIS Manager
Kevin Proft, Principal Planner
Local Hazard Mitigation Committee
Ronald Wolanski, Planning
Rita Lavoie, Planning
Kevin Proft, Planning
Peter Faerber Jr., Fire Chief/EMA Director
Thomas O’Loughlin, Director of Public Works
Timothy Beck, Police/EMA Deputy Director
Will Cronin, Public Works
Warren Hall, Engineering
Jack Kane, Building & Zoning Official

5
State Interagency Hazard Mitigation Committee
The role of the Rhode Island State Interagency Hazard Mitigation Committee (SIHMC) is to review, grade and prioritize all hazard mitigation activities and grants that come through the Rhode Island Emergency Management Agency (RIEMA). This committee is also responsible for reviewing and approving revisions and updates to the state hazard mitigation plan (§409 Plan).
Chris Albert
Nicole Alexander-Scott
Ernie Allen
Peter Alviti
Dave Aucoin
Scott Avedisian
Jim Ball
Brian Balukonis
Susan Barker
Wayne Barnes
Nicole Belk
Mark Bennett
Gardner Bent
Benny Bergantino
Ellen Berggren
Veronica Berounsky
Kerry Bogdan
Greg Bonynge
Jim Boyd
Laura Bozzi
Karen Bradbury
Joseph Bucci
Edward Capone
Steven Cascione
Michael Casey
Janet Coit
Bob Cooper
Kathy Crawley
Teresa Crean
Ryan Curtis
Brian Daniels
Michael DiBiase
Warren Ducharme
Sue Earley
Jeffrey Emidy
Chris Fox
Edward Fratto
Janet Freedman
Grover Fugate
Randall Galpin
Peter Gaynor
Alan Gillespie
Peter Ginaitt
Russ Godin
Alicia Good
Carol Grant
Terry Gray
Caitlin Greeley
Chris Hatfield
Peter Healey
Melinda Hopkins
John Kennedy
John Kennelly
Stephen King
Anne Kirori
Seth Klaiman
Christopher Kearns
Thomas Kogut
Nicholas Larmore
Gary Lataille
Peter LePage
Dawn Lewis
John Leyden

6
Lawrence Macedo
Raymond Marshall
Mike McCallan
Tracy McCormick
Ernest McKenney
Timothy McLaughlin
Alysia Mihalakos
Kara Morris
Erin Norris
Shaun Orourke
Paula Pallozzi
Bill Patenaude
Spencer Peck
Jamie Pereira
Daniel Porter
Denise Poyer
Christine Quigley
Samantha Richer
Susan Roberts
Christopher Rolleston
Pam Rubinoff
Shannon Ruff
Peder Schaefer
John Shea
Philip Sheridan
Anthony Silva
Brett Smiley
Stephen Soito
Dinalyn Spears
Monica Staaf
Greg Stewart
Jonathan Stone
Laura Sullivan
Melissa Surette
Brian Tardiff
Erica Tefft
Michael Tondra
Erik Ulmen
Dave Vallee
Phou Vongkhamdy
Henry Walker
Michael Walker
Matt Walsh
Jen West

7
Table of Contents
1.0 INTRODUCTION .............................................................................................................................. 10
1.1 MIDDLETOWN’S GOAL AND OBJECTIVES ........................................................................... 11
1.2 A LOOK AT MIDDLETOWN ...................................................................................................... 11
1.3 PLANNING PROCESS .................................................................................................................. 16
2.0 HAZARD IDENTIFICATION & RISK ASSESMENT ................................................................... 23
2.1 HAZARD PROBABILITY ............................................................................................................. 24
2.2 MIDDLETOWN: HAZARDS AND HAZARD HISTORY ....................................................... 27
2.2.1 SEVERE WEATHER ............................................................................................................... 27
2.2.2 HURRICANES AND TROPICAL STORMS ........................................................................ 32
2.2.3 FLOODING .............................................................................................................................. 40
2.2.4 WILDFIRE AND CONFLAGRATION ................................................................................ 46
2.2.5 DROUGHT ............................................................................................................................... 48
2.2.6 GEOLOGIC HAZARDS- EARTHQUAKES ........................................................................ 50
2.2.7 HAZARDOUS MATERIALS ................................................................................................. 51
2.2.8 TERRORIST EVENTS ............................................................................................................. 54
2.2.9 CLIMATE CHANGE .............................................................................................................. 56
2.3 CAPABILITY ASSESSMENT........................................................................................................ 60
2.3.1 PLANNING EFFORTS ........................................................................................................... 60
2.3.2 EMERGENCY MANAGEMENT .......................................................................................... 61
2.3.3 GIS CAPABILITIES ................................................................................................................. 62
2.3.4 PUBLIC WORKS ..................................................................................................................... 63
2.3.5 NATIONAL GRID .................................................................................................................. 63
2.3.6 MODELING TOOLS ............................................................................................................... 64
3.0 ASSESSING VULNERABILITY ....................................................................................................... 64
3.1 SEVERE WEATHER .................................................................................................................. 65
3.2 HURRICANES AND TROPICAL STORMS ........................................................................... 65
3.3 FLOODING ................................................................................................................................. 67
3.4 WILDFIRE AND CONFLAGRATION ................................................................................... 70

8
3.5 DROUGHT .................................................................................................................................. 70
3.6 GEOLOGIC HAZARDS - EARTHQUAKES .......................................................................... 71
3.7 HAZARDOUS MATERIALS .................................................................................................... 71
3.8 TERRORIST EVENTS ................................................................................................................ 71
3.9 POPULATION AT RISK ........................................................................................................... 72
3.10 POTENTIAL LOSSES TO THE LOCAL ECONOMY ......................................................... 73
3.11 CLIMATE CHANGE ............................................................................................................... 74
3.1 RISK ASSESSMENT MATRIX – VULNERABLE AREAS ........................................................ 78
4.0 MITIGATION ACTIONS .................................................................................................................. 83
4.1 ACTION PLAN .............................................................................................................................. 84
4.2 ACTIONS CATEGORIZED BY HAZARD ADDRESSED ...................................................... 105
4.3 ACTION PLAN SUMMARY ...................................................................................................... 107
5.0 PLAN MAINTENANCE ................................................................................................................. 110
5.1 IMPLEMENTATION ................................................................................................................... 110
5.2 MONITORING ............................................................................................................................. 110
5.3 EVALUATION ............................................................................................................................. 111
5.4 REVISIONS ................................................................................................................................... 111
5.5 INCORPORATION INTO EXISTING PLANNING MECHANISMS .................................. 111
Bibliography ........................................................................................................................................... 112
Appendices ............................................................................................................................................. 116
Appendix A: Technical and Financial Assistance for Mitigation ................................................ 117
State Resources – Appendix A ..................................................................................................... 118
Federal Resources - Appendix A ................................................................................................. 119
Other Resources - Appendix A .................................................................................................... 120
Appendix B: Existing Protection Systems - State and Federal..................................................... 121
State- Appendix B .......................................................................................................................... 122
Federal- Appendix B ...................................................................................................................... 123
Appendix C: Public Information and Outreach ............................................................................ 125
Public Meeting Notice- Appendix C ........................................................................................... 126
Public Meeting Presentation- Appendix C ................................................................................. 129
Appendix D: Maps ............................................................................................................................. 136

9
Zoning Map- Appendix D ............................................................................................................ 137
Parcels Impacted by Flood Zones - Appendix D ....................................................................... 138
Hazard Areas and Vulnerable Populations - Appendix D ...................................................... 147
Dam Failure - Appendix D ........................................................................................................... 148
List of Figures: Figure 1: 100-year flood CRMC STORMTOOLS ............................................................................. 34 Figure 2: Atlantic Hurricane Frequencies ............................................................................................. 35 Figure 3: Empirical probability of a named storm .............................................................................. 39 Figure 4: Projected Changes in Atlantic Hurricane Frequency Over 21st Century ........................ 40 Figure 5: Map L-1 showing Urban Service Boundary ........................................................................ 48 Figure 6: Urban Service Boundary ......................................................................................................... 58 Figure 7: Sea-Level Change Curve Calculator ..................................................................................... 59 Figure 8: Image from Town's WEB-GIS ................................................................................................ 63 Figure 9: Worst-Case Hurricane Scenario ............................................................................................ 66 Figure 10: Wildfire - Areas of Concern ................................................................................................. 70 Figure 11: Coastal Inundation with Sea Level Rise (Coastal Resources Center, 2017)................... 75 Figure 12: 5-year Average Observed Hot Days, Rhode Island .......................................................... 76 Figure 13: Observed Annual Precipitation, Rhode Island.................................................................. 78 List of Tables: Table 1: Certificates of Occupancy Issued Since 2006 ......................................................................... 14 Table 2: Open Space by Type - protected and unprotected ............................................................... 16 Table 3: Planning Requirements of the disaster mitigation act ......................................................... 18 Table 4 : Modified 10-step process and planning requirements ....................................................... 21 Table 5: Risk Assessment Model ............................................................................................................ 25 Table 6: Hazards Affecting Middletown .............................................................................................. 26 Table 7: Major Rhode Island Tornados ................................................................................................. 31 Table 8: Saffir-Simpson hurricane Scale ................................................................................................ 33 Table 9: Major Rhode Island Hurricanes .............................................................................................. 36 Table 10: Expected Building Damage by Occupancy ......................................................................... 67 Table 11: Summary of National Flood Insurance Program Activity in Middletown ..................... 68 Table 12: Vulnerability to Mappable Hazards .................................................................................... 73 Table 13: Risk Assessment Matrix ......................................................................................................... 79 Table 14: Action plan summary ........................................................................................................... 108

10
1.0 INTRODUCTION The Town of Middletown Hazard Mitigation Plan was prepared pursuant to the requirements of the Disaster Mitigation Act of 2000. Middletown adopted its initial Hazard Mitigation Plan in 2006 and completed an update of the plan in 2014. The 2019 Hazard Mitigation Plan updates the plan with current information, progress achieved, and new mitigation actions.
As defined in 44 CFR 201.2, hazard mitigation means any sustained action taken to reduce or eliminate the long-term risk to human life and property from hazards.1
The Town of Middletown understands that investments made today in preventative measures can significantly reduce the cost of tomorrow’s post-disaster recovery. It is intended that this plan will serve as the foundation for policies and actions to be undertaken by the Town of Middletown in order to reduce the physical, social, and economic hardships that can result from a natural disaster. These hardships include loss of life, destruction of property, damage to critical infrastructure, loss or interruption of jobs, loss or damage to businesses, and loss or damage to historical resources.
In addition to reducing hardships, adoption and implementation of this plan will enable Middletown to access credits under the Federal Emergency Management Agency’s (FEMA) Community Rating System (CRS). Participation in the CRS results in discounts on National Flood Insurance Program (NFIP) premiums for property owners. Additionally, the approved plan will increase the town’s competitiveness when applying for FEMA’s hazard mitigation assistance (HMA) grant programs. The HMA grant programs provide funding opportunities for pre- and post-disaster mitigation with the common goal of reducing the risk of loss of life and property due to natural hazards. Brief descriptions of FEMA’s HMA grant programs can be found at http://www.fema.gov/hazard-mitigation-assistance. An approved mitigation plan expedites the application process for pre- and post- federal mitigation funding and assists in ensuring a funded project is eligible and technically feasible.
Hazardous events profiled in this plan include severe weather, hurricanes and tropical storms, flooding and dam failure, wildfire and conflagration, drought, geological hazards, hazardous materials, terrorist events, and climate change. To minimize hardships resulting from these hazardous events, the Town of Middletown has identified the following general actions and policies, among others:
• INCREASE PUBLIC EDUCATION AND OUTREACH • IMPROVE INFRASTRUCTURE TO REDUCE HAZARD IMPACTS AND ACCOMMODATE EVACUATION • INCORPORATE HAZARD MITIGATION INTO TOWN LAND-USE REGULATIONS AND PROCESSES • ENFORCE TOWN REGULATIONS • MANAGEMENT TREES, WATERSHEDS, AND OTHER NATURAL FEATURES TO REDUCE LIKELIHOOD OF
HAZARD IMPACTS • PROVIDE EXTRA SUPPORT TO VULNERABLE POPULATIONS BEFORE AND DURING HAZARD EVENTS
1 44 CFR 201. Accessed via: http://www.gpo.gov/fdsys/pkg/CFR-2011-title44-vol1/pdf/CFR-2011-title44-vol1-sec201-2.pdf 17 September 2012
11
1.1 MIDDLETOWN’S GOAL AND OBJECTIVES
Middletown’s goal in implementing this Hazard Mitigation Plan is to “preserve and enhance the quality of life, property, and resources by identifying areas at risk from natural hazards and implementing priority hazard mitigation strategies”. The objectives to achieve this goal are:
• PROTECT THE LIVES AND PROPERTY OF MIDDLETOWN’S RESIDENTS, VISITORS, AND BUSINESSES • SAFEGUARD MIDDLETOWN’S CRITICAL FACILITIES AND INFRASTRUCTURE • PRESERVE MIDDLETOWN’S CULTURAL, HISTORICAL, AND NATURAL ENVIRONMENT
This municipal strategy is consistent with the state’s objectives for natural hazard mitigation included in the state’s hazard mitigation plan (§409 Plan) and will be incorporated into that plan.
1.2 A LOOK AT MIDDLETOWN
Profile
Founded in 1731, the Town of Middletown is located in Newport County on historic Aquidneck Island between the City of Newport and the Town of Portsmouth. Middletown’s 14.7 square mile area is surrounded by the Rhode Island Sound to the south, Narragansett Bay to the west, and the Sakonnet River to the east. Middletown is approximately 30 miles from T.F. Green Airport, 35 miles from Providence, and approximately 69 miles to Boston, Massachusetts. As of July 1, 2017, the US Census Bureau estimated Middletown’s population to be 16,081 people, which is a 0.1% decrease in population from the 2010 US Census Bureau estimate. According to the US Census Bureau’s 2016 American Community Survey, 84.0% of the population is white, 6.2% is black, 3.3% is Asian, 0.3% is American Indian or Alaskan Native, 0.3% is Native Hawaiian of other Pacific Islander, and 3.3% of the population is
more than one race. 5.4% of the population is Hispanic or Latino. The median household income from 2012-2016 in 2016 dollars is $63,717. 9.2% of the population lives under the poverty line.
Geography
Most of Middletown was farmed from the late seventeenth through the mid-twentieth century, and therefore few wooded areas exist today. Several small hills, with summit elevations ranging from about 100 feet to about 250 feet above sea level, punctuate Middletown’s landscape. At the south end of Middletown, a more rugged and dramatic landscape is presented by an area of outcropping conglomerate rocks with bold faces and a series of parallel ridges. Along the south coast, the Atlantic shoreline offers dramatic contrasts ranging from a rugged and rocky coast to flat expanses of sandy beach. Most of Sachuest Point and the nearby Paradise Hills are part of federal and nonprofit wildlife sanctuaries. Middletown’s waterways are small seasonal brooks and rivers, but there are three large ponds at the south end of town,
12
Nelson Pond, Gardiner Pond and Green End Pond. Each of these ponds is dammed and managed by the City of Newport.
Notable Storms
Nor’easters are a common winter storm event in Middletown but much of the town’s at-risk population has been fortunate to have never experienced a major storm event. The following are a few notable storm events in Middletown’s history:
• The Hurricane of 1938 was the last Category 3 hurricane to hit Rhode Island. Another destructive hurricane struck Rhode Island in 1954.
• The Blizzard of 1978 dropped over two feet of snow on the region. • The heavy rain event of March 2010 resulted in 100-year floods in many RI communities. • In 2011, Tropical Storm Irene caused several days of power outages on Aquidneck Island. • In 2012, Hurricane Sandy caused significant storm surge damage, downed trees, and power
outages.
Land Use
The most dramatic land use change in the town’s history occurred with the onset of World War II when the Navy purchased over 300 acres of waterfront property. The infusion of Navy personnel, along with the associated development impacts increased the regional population by nearly 900% from 1940 to 1970 and created a new economic sector within the town and region.
Today, the western portion of Middletown is urbanized and densely populated; the eastern portion is a lower-density mix of single-family residential properties and agricultural and open space land, a large portion of which remains un-conserved and zoned for low-density residential development. Within the town there are two principal transportation corridors running north-south, East Main Road and West Main Road, each fronted by automobile-oriented commercial development.
Approximately 60% of land in Middletown is zoned residential, 18% is zoned open space, and 12 percent is zoned commercial. To protect the quality and supply of water, the Town established Watershed Protection Districts, which regulate the use and development of land adjoining watercourses and primary recharge areas. The regulations include two subdistricts designated Zone 1, generally areas within 200 feet from the centerline of a watercourse, and Zone 2, the watershed area which is contributory to surface water runoff to the waterbodies contained in Zone 1. The Watershed Protection District designated on the Town’s Zoning Map Appendix D: Maps Zoning Map is superimposed over the underlying zoning districts adding an additional layer of regulations for water protection purposes.
Local Economy
The United States Navy remains the most significant public-sector employer on Aquidneck Island and the largest federal activity in Rhode Island in terms of personnel and payroll. As of October 2017, The Naval Undersea Warfare Center (NUWC) employed 2,221 Rhode Islanders and 759 workers from neighboring

13
states. The funded program of NUWC was approximately $1.17 billion in 2017.2 Middletown also hosts a significant number of private companies that support NUWC and other naval activities. Many of these companies are located in the town’s two office parks known as Aquidneck Corporate Park and the Enterprise Center.
The town continues to share in a large portion of the retail business conducted on Aquidneck Island. It has become the commercial core of the Island. Presently, there are four large shopping centers and six other significant retail areas in the town. The services industries group has been the fastest growing private employment sector and wholesale and retail trade is the second largest.
The town is currently implementing its Atlantic Beach District Master Plan, drafted in 2007. Funding from the State Department of Transportation was leveraged to make intersection improvements in conjunction with a resurfacing project, and the town implemented a tax increment finance ordinance that will direct a portion of property taxes from the area into nearby infrastructure improvements including undergrounding utility wires. Because of these public-sector investments, the town anticipates more private-sector investment in this popular neighborhood for tourists and locals alike.
Defense Base Closure and Realignment (BRAC)
The U.S. Navy has declared 225 acres of Naval Station Newport land on Aquidneck Island surplus and available for reuse. Properties in Middletown include the former Navy Lodge parcel, Midway Pier and portions of Defense Highway (Burma Road). The Department of Defense has recognized the Aquidneck Island Reuse Planning Authority (AIRPA) as the local redevelopment authority with the responsibility to produce and submit a reuse plan for all surplus land. The three island communities individually worked to develop reuse plans for the parcels within their jurisdictions. These plans were provided to AIRPA which developed and submitted the single, unified reuse plan to U.S. Department of Housing and Urban Development (HUD) and the Navy for approval.
As envisioned in the Aquidneck Island Planning Commission’s (AIPC) 2005 West Side Master Plan, the town is excited about the possibility of a new park at the location of the former Midway Pier, near the intersection of Greene Lane and Burma Road. This proposal would provide Middletown with its only direct public access to Narragansett Bay. As of 2019, the land associated with this project had not yet been transferred to the Town.
In 2011, the Town of Middletown completed the West Main/Coddington Development Center Master Plan for the former Navy Lodge property, an approximately 3-acre parcel at the intersection of West Main Road and Coddington Highway, as well as 12 acres of abutting Town-owned land. The plan was based on market opportunities and site-specific constraints. The planning process resulted in a preferred reuse scenario for the study area and a recommended disposition mechanism for the former Navy Lodge property for inclusion in the AIRPA reuse plan. Now in possession of the land, the town is revisiting the 2011 plan and preparing to take the next steps.
When ownership of Defense Highway (Burma Road) is potentially transferred to the State of Rhode Island, it could serve as an additional north south road corridor for the island and assist in alleviating traffic
2 U.S. Navy – Naval Undersea Warfare Center – Division Newport, RI, “2017 Impact on Southern New England,“ March 9, 2018

14
congestion on West Main and East Main Roads. The improved corridor could also serve as an important evacuation route for navy personnel and island residents.
Changes in Development Since the Adoption of the Hazard Mitigation Plan
Since the adoption of the 2006 Hazard Mitigation Plan, Middletown has seen development of new single-family homes, multi-family homes/condos, and commercial property. Table 1 details the issuance of certificates of occupancy since 2006.
TABLE 1: CERTIFICATES OF OCCUPANCY ISSUED SINCE 2006
Year Single-Family
Multi-Family/Condo Commercial Total
2006 34 10 2 46 2007 19 17 10 46 2008 22 5 5 32 2009 12 5 1 18 2010 11 5 2 18 2011 6 4 4 14 2012 16 7 4 27 2013 8 32 1 41 2014 20 7 2 29 2015 15 0 5 20 2016 19 2 6 27 2017 18 1 8 27 2018 39 3 2 44 Total 200 95 50 345
Average 16.7 7.9 4.2 28.8 Residential development has continued town-wide. In the western part of the town, multifamily projects have been constructed on West Main Rd. and Maple Ave., while the eastern portion of the town has seen single-family land development projects. On the retail front, the town has mostly seen the reuse of existing, vacant structures rather than new construction.
The town has continued to see interest from developers in the Atlantic Beach District. A 13-room hotel has been approved at 38 Purgatory Rd. and a 3-story mixed use building was constructed on Wave Ave. Other proposals within the district are currently going through the Development Plan Review process. Many of the parcels in the district are located within the flood zone and are required to accommodate flooding.
In 2012, zoning ordinance amendments were adopted which allow for the installation of ground-mounted solar arrays as a principal use in most zoning districts by special use permit, subject to certain restrictions. No such development has occurred since the zoning change, but there has been some interest, including a one-megawatt project in a General Business zoning district that received Development Plan Review approval in early 2019. Residential rooftop solar received a boost thanks to the Rhode Island Office of Energy Resource’s Solarize RI program. The program resulted in 41 new installations totaling 264 kW of

15
generating capacity. Rooftop arrays were also installed on multiple commercial buildings in Middletown, mostly with the assistance of State incentive programs. Embrace Home Loans, for example, took advantage of the Commercial Property Assessed Clean Energy (CPACE) Program to install a 351-kW array atop their Middletown headquarters.
Future Development Trends
The Atlantic Beach District, due to its proximity to Easton’s Beach and reputation as a tourist destination, has attracted the attention of developers in recent years. Public improvements, including pedestrian safety projects are likely to make the area even more attractive for redevelopment. Unfortunately, many of the district’s parcels lie within the 100-year flood zone and are susceptible to storm surge.
Middletown’s zoning ordinance places restrictions on development in flood zones. In the Atlantic Beach District, there are several hotels located within FEMA’s AE flood zone. Three hotels are newer construction and are elevated and flood proofed. Another, constructed in 1940, is not flood proofed.
Looking forward, structures built in the flood zone will be required to accommodate flooding. A 13-room hotel was recently approved in the Atlantic Beach District, and, on a nearby parcel, another 23-room hotel is undergoing the Development Plan Review process. Both are in the flood zone and will be elevated in order to accommodate flooding. Each project maximizes space by placing its parking lot at-grade, under the first story of the building. A recently constructed three-story mixed-use building on Wave Ave that sits in the flood zone elected to use floodproofing techniques to accommodate flooding. The structure allows floodwaters to infiltrate the first floor of the building and then drain out as the floodwaters recede, causing only insignificant damage.
As discussed above, the Town completed the West Main/Coddington Development Center Master Plan in 2011. The study area consists of four publicly owned parcels located along the west side of West Main Road that are targeted for potential redevelopment. They include the former Navy Lodge, the Town’s Recreation Complex, Middletown Public Library, and the former JFK Elementary School. The town envisions a transformation of the area into a “vibrant, attractive, mixed use area, capitalizing on its relatively dense development pattern, available land under public ownership, good transportation access, and available utilities.”3 The well-planned redevelopment of the Navy parcel and abutting town land will reshape this highly visible area of Middletown, and promote investments in the redevelopment and enhancement of other properties in the surrounding area.
Middletown actively pursues open space acquisition and has an Open Space Committee whose purpose it is to recommend open space purchases to the Town. The Town has a history of using open space acquisition to protect water quality, especially in watersheds that drain into reservoirs. In 2004, Middletown, together with the Aquidneck Land Trust, Rhode Island Department of Environmental Management (RIDEM) and the City of Newport, purchased 46 acres of agricultural land around Bailey Brook, including several acres of floodplain, to form a watershed protection area. In 2006, 2009, and 2012, Middletown, Newport, and The Aquidneck Land Trust added to this watershed protection area by purchasing three additional parcels totaling 26.3 acres. The Aquidneck Land Trust is also active in other areas. For example, in 2017 the organization acquired a five-acre parcel off Paradise Avenue in Middletown that protects 360 feet of the Maidford River. The town has the following total acreages of open space:
3 West Main/Coddington Development Center Master Plan, 2011

16
• TOTAL PASSIVE RECREATION – 780 ACRES • TOTAL ACTIVE RECREATION– 551 ACRES • TOTAL CONSERVATION – 1,241 ACRES • TOTAL RECREATION AND CONSERVATION – 2571 ACRES
In 2012, the Aquidneck Island Planning Commission completed the Aquidneck Island Open Space Mapping Project. The mapping project identified all open space, protected and unprotected, for each of the Island’s municipalities. The results in Table 2 provide a useful snapshot of the types of open space remaining in Middletown. The mapping project’s final report warned that 54 percent of the town’s remaining open space is zoned for residential development, including much of the town’s farmland.
TABLE 2: OPEN SPACE BY TYPE - PROTECTED AND UNPROTECTED4
Open Space Type Count Area (acres) Average Size Percentage
Agricultural 256 1,859 7.26 39.3%
Cemetery 7 103 14.7 2.2%
Historic 13 30 2.3 0.6%
Limited Development 104 423 4.1 9.0%
Natural Area 59 729 12.4 15.4%
Recreation 32 311 9.7 6.6%
School 24 233 9.7 4.9%
Special 12 468 39.0 9.9%
Utility 17 87 5.1 1.8%
Vacant 258 236 0.9 5.0%
Water 4 252 63.1 5.0%
TOTALS 786 4,732 6.0
1.3 PLANNING PROCESS The Disaster Mitigation Act of 2000 stresses that each local government seeking FEMA mitigation funding must first have a FEMA approved multi-hazard mitigation plan. Federal planning regulations require the following planning tasks be completed and documented:
1.A Determine the planning area and resources
4 Aquidneck Island Open Space Mapping Project Final Report, January 2012

17
2.A Create a planning team—the Local Hazard Mitigation Committee (LHMC)—to carry out the next 6 tasks
1. Create an outreach strategy 2. Review community capabilities 3. Conduct or review existing risk assessment 4. Develop or review the local mitigation activities 5. Update the hazard mitigation plan 6. Review and adoption of the plan by the governing body.
Middletown’s Hazard Mitigation Planning Process (1999-2006)
Middletown initiated hazard mitigation planning in December of 1999 at the recommendation of the Rhode Island Emergency Management Agency (RIEMA). The LHMC was organized under the authorization of the Town Administrator to create Middletown’s Hazard Mitigation Plan. The LHMC members at that time were the Police Captain, Deputy Fire Chief, Director of Public Works, Deputy Director of Public Works, Town Engineer, the Deputy EMA Director, Assistant Deputy EMA Director, and two Salve Regina University interns. Two additional members, the Town Planner and another EMA representative, were added in March of 2000.
The LHMC met regularly to discuss the plan and identify mitigation projects specific to Middletown, but progress stalled due to committee members leaving their positions. The committee was re-formed in early 2004 with the new department heads. The 2004 committee consisted of the EMA Director/Fire Chief, Deputy EMA Director/Police Captain, Public Works Director and Deputy Director, Town Engineer, and Town Planner. Each committee member was encouraged to identify and develop relevant actions based on town hazard history and current town needs as they relate to their functional responsibilities. The LHMC discussed the most vulnerable areas in town and prioritized projects. The EMA Director met with committee members on an individual basis and reviewed relevant sections of the plan. Group committee meetings were held every six months. URI Coastal Resources provided GIS maps and Integrated Management Solutions, Inc. provided support for structuring and writing the plan.
The plan was discussed and initially approved at separate public hearings with the Planning Board and Town Council. The LHMC encouraged the public to participate by advertising the public hearings in the Newport Daily News and on the Town’s website and soliciting input during the sessions. After initial approval by the Town Council on March 20, 2006, the plan was submitted to RIEMA for state review and FEMA Region 1 for conditional approval. Following FEMA conditional approval, the plan was formally adopted by the Town Council on October 24, 2006, presented to the Town Administrator for implementation, and delivered to RIEMA and FEMA Region I.
Planning Process for the 2014 Five-Year Update
In November of 2010, the Town applied for a Pre-Disaster Mitigation Grant through FEMA to assist with the required five-year plan update. After receiving the grant in October 2011, the Town began preparing the request for proposals and conducting a competitive bidding process. The Town contracted with CDR Maguire to draft the plan documents and facilitate the planning meetings and public participation process.

18
The LHMC reconvened in April 2012 to begin reviewing and revising the 2006 plan. The 2014 LHMC was comprised of Ron Doire, Fire Chief & EMA Director, Ron Wolanski, Planning & Economic Development Director, Alison Ring, Principal Planner & GIS Manager, Tom O’Loughlin, Public Works Director, Warren Hall, Town Engineer, Jack Kane, Building & Zoning Official, Tim Beck, Police Sergeant & Deputy EMA Director, and Tim Shaw, Recreation Director. Participation in the LHMC entailed attending and participating in LHMC meetings, providing available data requested of the LHMC, reviewing lessons learned since the previous update, examining other community planning efforts for integration into the plan, reviewing and providing comments on the plan drafts, advertising, coordinating, and participating in the public input process, and coordinating the formal adoption of the plan by the governing boards.
The LHMC used FEMA’s 10-step planning process integrating recommendations from FEMA’s Local Multi-Hazard Mitigation Planning Guidance (2008), FEMA’s Local Mitigation Plan Review Guide (2011), the Local Mitigation Planning How-To Guides, and the 10-step planning process used for FEMA’s Community Rating System (CRS) and Flood Mitigation Assistance programs. Table 3 shows how the modified 10-step process corresponds with the planning requirements of the Disaster Mitigation Act.
TABLE 3: PLANNING REQUIREMENTS OF THE DISASTER MITIGATION ACT
5 FEMA Local Multi-Hazard Mitigation Planning Guidance, 2008
Disaster Mitigation Act Requirements 44CFR 201.65
Modified CRS Planning Steps
1 Organize Resources
201.6(c)(1) 1 Organize the Planning Effort
201.6(b)(1) 2 Involve the Public
201.6(b)(2) and (3) 3 Coordinate with Other Departments and Agencies
2 Assess Risks
201.6(c)(2)(i) 4 Identify the Hazards
201.6(c)(2)(ii) 5 Assess the Risks
3 Develop the Mitigation Plan
201.6(c)(3)(i) 6 Set Goals
201.6(c)(3)(ii) 7 Review Possible Activities
201.6(c)(3)(iii) 8 Draft an Action Plan
4 Implement the Plan and Monitor Progress

19
The Middletown LHMC reviewed and updated each section of the previously approved plan. The committee added substantially more community specific information, updated the status of existing action items, and added several new action items and vulnerable areas. The committee also improved the organization and format of the document.
The LHMC held meetings on April 10, May 30, and June 21, 2012. At the meetings the LHMC discussed its strategy for updating the plan, conducted a hazard risk assessment and ranked the hazards that impact the town, discussed the impacts that could be expected based on a worst-case hurricane scenario aided by FEMA’s HAZUS software, reviewed the goals, objectives, and action items included in the 2006 plan, and proposed new action items.
A Public Meeting was held on July 18, 2012. Few people attended. Except for offers of assistance during emergencies and exercises, there were no hazard mitigation comments to add into the plan.
The revised document was distributed for departmental review between August 1 and August 27, 2012. The plan was then made available for public comment from September 19 to October 3, 2012. Notification of the draft plan was announced via the Town’s Twitter page, Town website, and email. Hard copies were available for viewing at the Middletown Town Hall and a digital copy was available for download from the Town website. The Town did not receive any comments from members of the public, but comments were received and incorporated from Town employees. Following these revisions, the document underwent a final plan review between October 3 and October 24, 2012.
Between October 30, 2012 and June 7, 2013, the Rhode Island Emergency Management Agency reviewed the plan twice. The LHMC made slight adjustments to the plan after each review. The plan was submitted to FEMA for review on June 18, 2013. Following FEMA conditional approval on July 25, 2014, the plan was adopted by the Town Council on August 18, 2014. After adoption, the plan was delivered to RIEMA and FEMA Region 1.
Public Participation for the 2014 Five-Year Update
The intent of the public process was to gauge household and business preparedness and awareness of personal mitigation techniques, identify areas where people were particularly vulnerable, and get feedback on potential mitigation strategies. Public input was solicited during two phases of the document’s development.
The first opportunity for involvement was at the public meeting held in the evening at Town Hall on July 18, 2012. Notice of the meeting appeared on July 13, 2012 in the Newport Daily News, as well as on the Town’s website and Twitter page. The LHMC compiled a list of individuals to invite. The Town sent personal invitations to the Town of Portsmouth, City of Newport, Newport Water Department, Newport Chamber of Commerce, Salve Regina University, the Norman Bird Sanctuary, National Grid, Naval Station Newport,
201.6(c)(5) 9 Adopt the Plan
201.6(c)(4) 10 Implement, Evaluate, and Revise the Plan
Source: FEMA Local Multi-Hazard Mitigation Planning Guidance, 2008
20
RIEMA, Rhode Island Department of Environmental Management (RIDEM), Aquidneck Island Planning Commission, Save the Bay, Discover Newport, U.S. Fish & Wildlife, and Rhode Island National Wildlife Refuge Complex.
The public meeting was sparsely attended. One invited representative from National Grid and another from the Newport Navy Base attended, as did a Boy Scout and his mother. Town staff and the consultants presented a thorough analysis of hazards, a review of vulnerable areas, and proposed mitigation activities. Town staff incorporated feedback.
The draft plan was made available for public comment from September 19, 2012 through October 3, 2012. The document was posted on the Town’s website and hard copies were made available at Town Hall. A link to the draft plan was sent to officials in the neighboring communities of Portsmouth and Newport. Input from all phases of the plan development was incorporated into the final document.
During the implementation phase of the plan, the public was engaged as hazard mitigation action items were pursued and special use permits were adjudicated. For example:
1. Road projects: a public meeting is held prior to the project’s design to solicit input and concerns from the public. Another meeting follows the design to explain the project as it will be built. E.g. Buck Road, Forest Road, Campground Connector Road.
2. Wave Ave. pump station: After designing the project to reduce inflow and infiltration at the Wave Ave pump station, a public meeting was held to explain the project to the public.
3. Watershed Protection District: Most developments within Zone 1 of the Watershed Protection District require a special use permit. Developments relating to fuel storage and waste management, among others, require a special use permit in Zone 2 of the watershed protection district. The process of obtaining a special use permit requires applicants to go through a public hearing before the Zoning Board, where the public can voice concerns regarding the project.
Planning Process for the 2019 Five-Year Update The planning process for the 2019 five-year update of the Hazard Mitigation Plan was based heavily on the process used to complete the 2014 update. The LHMC was reconvened on January 15, 2019 to begin revising the previously adopted plan. The 2019 LHMC was comprised of Peter Faerber Jr., Fire Chief & EMA Director, Ron Wolanski, Planning & Economic Development Director, Kevin Proft, Principal Planner, Rita Lavoie, Principal Planner & GIS Manager, Tom O’Loughlin, Public Works Director, Warren Hall, Town Engineer, Jack Kane, Building & Zoning Official, and Tim Beck, Police Lieutenant & Deputy EMA Director. Will Cronin, Department of Public Works, also provided input during the process. Participation in the LHMC entailed attending and participating in LHMC meetings, providing available data requested of the LHMC, reviewing and providing comments on the plan drafts, advertising, coordinating, and participating in the public input process, and coordinating the formal adoption of the plan by the governing boards.
The LHMC followed the 10-step planning process used for FEMA’s Community Rating System (CRS) and Flood Mitigation Assistance programs. The public was involved after the LMHC reviewed the existing plan and made an initial round of updates. Table 4 demonstrates how the modified 10-step process corresponds with the planning requirements of the Disaster Mitigation Act.

21
TABLE 4 : MODIFIED 10-STEP PROCESS AND PLANNING REQUIREMENTS
The LHMC reviewed and updated each section of the previously approved plan. The committee added recent hazard events, updated the status of existing action items, added several new vulnerable areas and action items, and added a profile on climate change.
The committee incorporated recommendations offered by FEMA’s plan reader from the 2014 review. Vulnerable populations and vulnerable business districts were added to the Risk Assessment Matrix and new actions were added to the Action Plan to address these areas of vulnerability. New actions were added to the Action Plan to address hazards that had not been adequately addressed previously, including drought, hazardous materials, terrorist events, and climate change. Dam failure was incorporated into the flooding section of the report rather than as a separate type of disaster. Additionally, the committee decided
6 FEMA Local Multi-Hazard Mitigation Planning Guidance, 2008
Disaster Mitigation Act Requirements 44CFR 201.66
Modified CRS Planning Steps
1 Organize Resources
201.6(c)(1) 1 Organize the Planning Effort
201.6(b)(2) and (3) 2 Coordinate with Other Departments and Agencies
2 Assess Risks
201.6(c)(2)(i) 3 Review the Hazards
201.6(c)(2)(ii) 4 Review the Risk Assessment
3 Develop the Mitigation Plan
201.6(c)(3)(i) 5 Review Goals
201.6(c)(3)(ii) 6 Develop Possible Activities
201.6(c)(3)(iii) 7 Update the Action Plan
201.6(b)(1) 8 Involve the Public and Incorporate Feedback
4 Implement the Plan and Monitor Progress
201.6(c)(5) 9 Adopt the Plan
201.6(c)(4) 10 Implement, Evaluate, and Revise the Plan
Source: FEMA Local Multi-Hazard Mitigation Planning Guidance, 2008

22
to extend the public comment period from two to four weeks and expanded the list of stakeholders to be notified of the draft document.
The LHMC held meetings on January 15, February 7, March 3, and April 4. At the meetings the LHMC discussed its strategy for updating the plan, updated the body of the report, added three items to the risk assessment matrix (vulnerable populations, vulnerable business districts, and hazardous material evacuation zones), reviewed and updated the existing action items, and proposed new action items. The committee elected not to repeat the worst-case hurricane scenario; the scenario used in 2014 is still consistent with what might be expected in 2019 as no transformational development has occurred. Similarly, except for the three additions made to the risk assessment matrix, the committee determined the 2014 matrix is still adequate, however items were re-prioritized.
A Public Meeting was held on July 24, 2019. The presentation is included in Appendix C: Public Information and Outreach.
Three members of the public attended the meeting. After a presentation by the Town Planner and the Principal Planner, the Planning Board provided feedback and invited members of the public to speak. Topics included evacuation zones, National Grid transmission line updates, testing of hazard communications, shelter space, hurricane impacts on the Atlantic Beach District, coordination with Newport, RI and flood proofing incentives. Minor changes to the text and figures were recommended.
The plan was made available for public comment from June 21, 2019 to July 24, 2019. Notification of the draft plan was announced via the Town’s Twitter page, Town website, and email. Hard copies were available for viewing at the Middletown Town Hall, Planning Department and a digital copy was available for viewing or download from the Town website. Outside of the public hearing, the town received no comments from members of the public. Comments from the Planning Board and the public received during the public hearing were incorporated into the plan. Following these revisions, the document underwent a final plan review between July 25, 2019 and August 30, 2019, with an advertisement in the Newport Daily News (see copy of advertisement Appendix C: Public Information and Outreach) during which time no new comments were received.
The plan was reviewed by the Rhode Island Emergency Management Agency between September 3, 2019 and October 1, 2019. After minor changes were made, the plan was submitted to FEMA for review on October 1, 2019. Following FEMA conditional approval on October 24, 2019, the plan was updated with minor changes suggested by FEMA and adopted by the Middletown Town Council on November 18, 2019. After adoption, the plan was delivered to RIEMA and FEMA Region 1.
Public Participation for the 2019 Five-Year Update The intent of the public process was to gauge household and business preparedness and awareness of personal mitigation techniques, identify areas where people were particularly vulnerable, and get feedback on potential mitigation strategies. Public input was solicited during two phases of the document development.
The first opportunity for involvement was at the public meeting held July 24, 2019 at 6PM at Town Hall. Notice of the meeting appeared on the Rhode Island Secretary of State’s site, as well as on the town’s website and Twitter page, advertised in the Newport Daily news (see copy of advertisement Appendix C:

23
Public Information and Outreach), and in a mailing to stakeholders identified by the LHMC. The Town sent notice of the public meeting to: the Town of Portsmouth; City of Newport; Newport Water Department; Newport Chamber of Commerce; Salve Regina University; the Norman Bird Sanctuary; National Grid; National Grid’s On-Island Project; Naval Station Newport; RIEMA; Rhode Island Department of Environmental Management (RIDEM) Dams Program; the Potter League for Animals; American Red Cross; Aquidneck Island Planning Commission; Save the Bay; Discover Newport; U.S. Fish & Wildlife; Rhode Island Department of Transportation Stormwater Division; the Aquidneck Land Trust; and property owners in the Atlantic Beach TIF District.
The public meeting was attended by 3 people. Town staff presented a thorough analysis of hazards, a review of vulnerable areas, and proposed mitigation activities. This presentation is included in Appendix C: Public Information and Outreach. Following the public meeting, town staff incorporated feedback including minor revisions to the text, tables, and title of the plan as well as adding an action item regarding identifying additional evacuation shelter space in town. The final draft was made available on the Town’s website for 30 days and an advertisement in the Newport Daily News was published alerting the public to the final plan prior to submission to the Rhode Island Emergency Management Agency (Appendix C: Public Information and Outreach),. During that time, no additional comments were received.
The public will continue to be engaged in the ongoing planning process and plan implementation upon receiving approval of the plan. The Town will invite public input as the mitigation actions outlined are implemented. Announcements of public meetings and planning sessions will be advertised via Town of Middletown’s website and Twitter page.
2.0 HAZARD IDENTIFICATION & RISK ASSESMENT Risk includes the characteristics of the hazard and takes into account the magnitude, duration, distribution, area affected, frequency and probability of an event. This section focuses on assessing the community’s risk to natural hazards by identifying which natural hazards affect Middletown, and, reviewing Middletown’s and the State of Rhode Island’s hazard history. The section also assesses the vulnerability of people, structures, and critical facilities to these hazards and examines the capabilities in place to mitigate them. This section also includes the mitigation efforts that the Town currently has in place.
For the 2014 five-year update, the Local Hazard Mitigation Committee (LHMC) conducted a risk assessment to update the hazards identified and profiled in the 2006 Hazard Mitigation Plan. During this assessment, the LHMC also reviewed studies, recent town experiences and the State Hazard Mitigation Plan 7 to help inform its decision making. For the 2019 five-year update, the LHMC determined that conditions have not changed enough to merit conducting a new risk assessment, but the committee did review the 2014 Risk Assessment in light of information that has been published or become available since the adoption of the 2014 plan. The LHMC also went further in depth into the various hazards that affect the town especially concerning the impact climate change will have on some hazards.
7 State of Rhode Island Hazard Mitigation Plan, 2011, pg. 30-129

24
The hazards profiled in this plan include:
• SEVERE WEATHER • HURRICANES AND TROPICAL STORMS • FLOODING AND DAM FAILURE • WILDFIRE AND CONFLAGRATION • DROUGHT • GEOLOGICAL HAZARDS- EARTHQUAKES • HAZARDOUS MATERIALS • TERRORIST EVENTS • CLIMATE CHANGE
2.1 HAZARD PROBABILITY In order to comprehensively assess the relative risk posed by hazards, the LHMC utilized a model that considers both the frequency and vulnerability to the hazards. The LHMC found this model as a best practice utilized by other municipalities in their plan development. The objective of the rating system is to identify which hazards pose the greatest risk to Middletown. The model deals with hazards and risk in a relative manner and the risk rankings are to be considered within this context. Frequency and vulnerability were given equal weighting. Specifically, the model uses the following simplified equation:
Risk = Frequency x Vulnerability Factor
Frequency
The hazard frequency was determined for each hazard using a 1-4 scale:
1) Unlikely: Hazard is unlikely to ever occur in Middletown. Less than 1% probability of yearly occurrence
2) Occasional: Hazard may occur every -11-100 years. 1-10% probability of yearly occurrence 3) Likely: Hazard may occur between 1-10years. 10-90% probability of yearly occurrence 4) Highly Likely: Hazard will occur with some regularity. 90-100% probability of yearly occurrence
Vulnerability Factor
A vulnerability factor was used to address the various vulnerabilities and the severity of a hazard. The built environment, systems (transportation, utilities, economy, etc.), natural systems, the human population and severity were each assigned a value of zero to three. In order to equally weight frequency and vulnerability, the average of the vulnerabilities provided a “vulnerability factor.” The vulnerability ratings used the following equation:
Vulnerability Factor = (Human + Built + Natural + Systems + Severity)/5
The vulnerability factor was then classified on a 1-4 scale:
1) The vulnerable population or system will not be affected

25
2) Event causes some mild disturbances to some systems, buildings, natural environment or populations
3) Event causes some mild disturbances to all systems, buildings, natural environment or populations OR event causes severe disturbance to some systems, buildings, natural environment or populations
4) The entire town is significantly affected by the event
Based on the information provided about each of the hazards, the assessment used the following equation to complete the Hazard Rating Chart:
Risk = Frequency x (Human + Built + Natural + Systems + Severity)/5)
Due to the variability inherent in each of the hazards and the rating system, the risks were divided into categories of low, moderate and high-risk hazards outlined in Table 5. The relative ranking established by this model provided a framework for the risks and strategies addressed in the Hazards Mitigation Plan.
TABLE 5: RISK ASSESSMENT MODEL
Event Frequency Vulnerability Vulnerability
Factor Risk
Rating Risk level Built Natural Systems Populations Severity
Possible Rankings
1-4 1-4 1-4 1-4 1-4 1-4
Severe Weather 4 2 2 3 3 2 2.4 9.6 High
Hurricane and Tropical Storms
3 2 2 3 3 3 2.6 7.8 High
Flooding 4 1 2 3 1 1 1.6 6.4 High
Hazardous Materials
3 2 2 2 2 2 2 6 High
Terrorist Events 1 2 1 2 2 3 2 2 Med
Dam Failure 1 1 2 1 1 3 1.6 1.6 Low
Wildfire and Conflagration
1 2 2 1 1 2 1.6 1.6 Low
Earthquake 1 2 1 2 1 2 1.6 1.6 Low
Drought 1 1 2 1 2 1 1.4 1.4 Low
26
The LHMC discussed manmade hazards and decided that hazardous materials and terrorist events were substantial enough and of high enough risks to be included in the hazard mitigation plan. The Town has decided to profile all of the hazards listed in Table 5 , both natural and manmade.
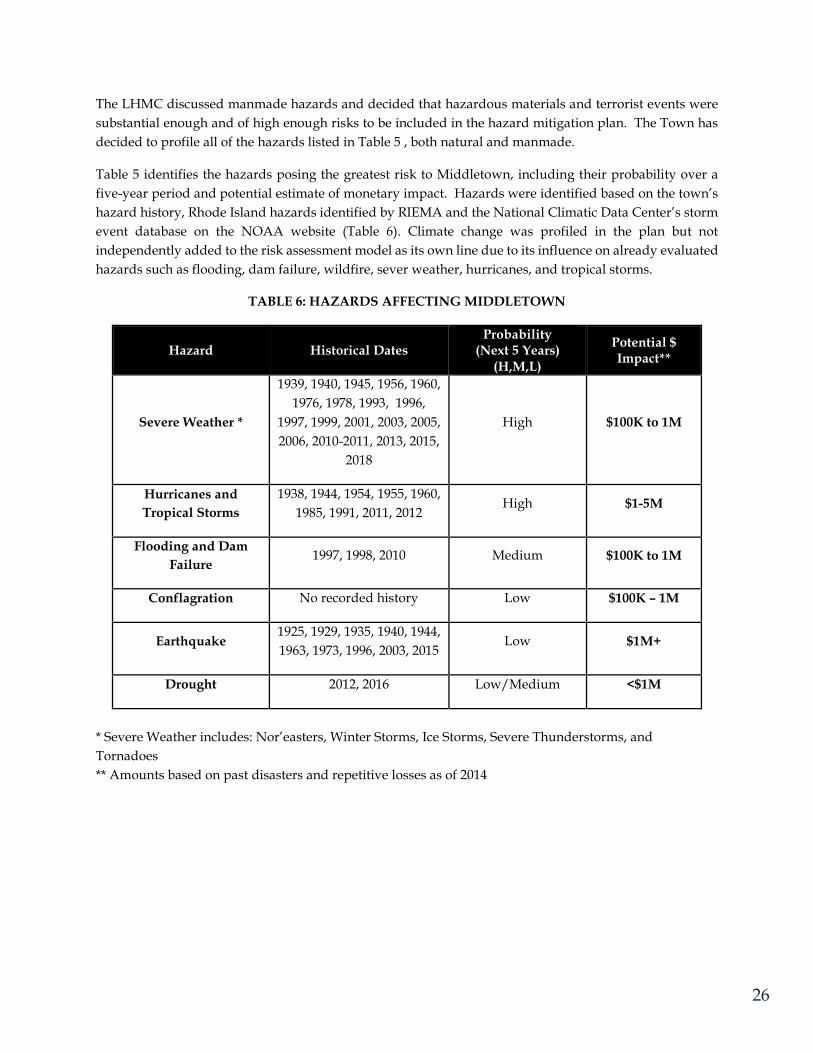
Table 5 identifies the hazards posing the greatest risk to Middletown, including their probability over a five-year period and potential estimate of monetary impact. Hazards were identified based on the town’s hazard history, Rhode Island hazards identified by RIEMA and the National Climatic Data Center’s storm event database on the NOAA website (Table 6). Climate change was profiled in the plan but not independently added to the risk assessment model as its own line due to its influence on already evaluated hazards such as flooding, dam failure, wildfire, sever weather, hurricanes, and tropical storms.
TABLE 6: HAZARDS AFFECTING MIDDLETOWN
Hazard Historical Dates Probability
(Next 5 Years) (H,M,L)
Potential $ Impact**
Severe Weather *
1939, 1940, 1945, 1956, 1960, 1976, 1978, 1993, 1996,
1997, 1999, 2001, 2003, 2005, 2006, 2010-2011, 2013, 2015,
2018
High $100K to 1M
Hurricanes and Tropical Storms
1938, 1944, 1954, 1955, 1960, 1985, 1991, 2011, 2012
High $1-5M
Flooding and Dam Failure
1997, 1998, 2010 Medium $100K to 1M
Conflagration No recorded history Low $100K – 1M
Earthquake 1925, 1929, 1935, 1940, 1944, 1963, 1973, 1996, 2003, 2015
Low $1M+
Drought 2012, 2016 Low/Medium <$1M
* Severe Weather includes: Nor’easters, Winter Storms, Ice Storms, Severe Thunderstorms, and Tornadoes ** Amounts based on past disasters and repetitive losses as of 2014

27
2.2 MIDDLETOWN: HAZARDS AND HAZARD HISTORY
2.2.1 SEVERE WEATHER Severe Weather Profile
Severe weather and hurricanes are the primary hazards affecting Rhode Island. Severe weather includes nor’easters, winter storms, ice storms, severe thunderstorms, and tornadoes. These hazards can result in flooding and high winds causing damage to residential homes, businesses, historical buildings, dams, bridges and other critical infrastructure. Severe weather can result in injury, death, severe damage, and severe disruption within the community.
The trajectory of these systems determines the local effect. Storms with a southern origin bring heavy rain. Storms coming from the north bring cold air and the potential for snow and ice. Any winter storm, regardless of its trajectory, can be accompanied by high winds. Storms with sustained winds above 30 mph generally cause low impact, widespread damage, while winds above 50 mph are powerful enough to cause significant damage.
The National Weather Service defines a tornado as a “violently rotating column of air extending from a thunderstorm to the ground.”8 Tornadoes typically are triggered by thunder storms. Tornadoes are the most violent of all atmospheric storms and are capable of tremendous destruction. Wind speeds can exceed 250 miles per hour, and damage paths can be more than one mile wide and 50 miles long.
Prior to February 1, 2007, tornado intensity was measured by the Fujita (F) Scale. An updated and revised version of the Fujita scale is the Enhanced Fujita Scale. Both scales are sets of wind estimates (not measurements) based on damage. The new scale provides more damage indicators (28) and associated degrees of damage, allowing for more detailed analysis and better correlation between damage and wind speed. It is also more precise because it considers the materials affected and the construction of structures damaged by a tornado.
Location
The entire Town of Middletown may be affected by a severe storm; however, microclimates within the town may increase the vulnerability in specific areas. Narrow culverts are vulnerable to ice jams and hilltops are subject to lightning. Snowdrifts may impact open expanses such as Sachuest Point Road. Winds and wind-related-storm-surge have the greatest impact on the coastal low-lying portions of town near the beaches and the Atlantic Beach Business District. Tornados may be more likely to touch down near the coast where wind speeds are generally greater.
Timing and Duration
Most severe storms in Middletown occur between November and April when the jet stream moves over the East Coast and low-pressure systems are more frequent. Storms can last anywhere from a few hours
8 National Weather Service. http://www.spc.noaa.gov/faq/tornado/
28
to several days. Weather forecasting abilities will provide Middletown, at minimum, a few hours warning prior to an extreme weather event.
Tornadoes can form any time during the year, but most form in May. Peak tornado season tends to be later in the year in the northern half of the country however; areas outside of “Tornado Alley” do not have a typical tornado season. Tornadoes can be spawned by hurricanes. The duration of a tornado event may be limited to a few seconds or a few minutes.
Severity
Storms in Middletown are likely to have a severity of moderate to high. Historically, storms have been relatively short in duration but may have strong, localized impacts. The main concern relating to severe storms in Middletown is the potential to isolate citizens and businesses if roads are blocked by snow, ice, wind, and flooding in low-lying areas or if bridges are closed due to wind speeds. This may cause some financial hardships for the Town and limit the ability of citizens to evacuate. It is important to note that windstorms are also associated with storm surges of one to three feet. Middletown is located in the 130 mph 100-year wind load zone. Wind zones are referenced in the state building code; higher wind zones face greater regulation.9
Tornados can injure and kill people and livestock and destroy structures, infrastructure, and crops. The severity of a tornado is based on wind speed and the amount of property damage incurred. Due to their quick development and their unpredictable movement, tornados are difficult to respond to and protect lives.
Frequency
Severe storms, including snow and ice storms, rain and thunderstorms, and high winds are relatively common in Middletown compared to other hazards. Newport County has reportedly experienced at least one serious windstorm per calendar year, and at least eight snowstorms with more than eight inches of accumulation since 2013.
9 State of Rhode Island Hazard Mitigation Plan, 2011

29
Severe Weather History
The majority of Rhode Island lies outside the heavy snow and ice regions of the northeast. Due to its maritime climate, Rhode Island generally experiences cooler summers and warmer winters than inland areas. However, snow and ice do occur and can result in significant damage. The three major threats from these hazards are loss of power due to ice on electrical lines, snow loading on rooftops, and transportation impairments including bridge closures. One of the most memorable winter storms was the “Blizzard of ’78” which stalled over Lincoln, RI. The stormed delivered 24 to 38 inches of snow. Motorists abandoned their cars on Interstate Highways and local roads. The governor declared a state of emergency, closing highways and businesses for the week required to remove snow.
Middletown has experienced many winter storms and a few blizzards over the past century. In February of 1940 a blizzard with winds of 60 mph and gusts up to 75 mph hit the town. This storm caused major transportation problems. In February of 1945 a sleet and snow storm hit Aquidneck Island and caused power outages that lasted less than 20 hours. In March of 1956 the island experienced two blizzards in three days. Twenty-six inches of snow fell over the three-day period. Schools were closed and there were six reported deaths due to the storm. In March of 1960, Aquidneck Island set a new record for the most snow in a single storm with fifteen inches falling. Businesses were shut for days and all schools were closed. In January of 1976, ten inches of snow fell with drifts up to three feet. All schools were closed.
One of the worst winter seasons for Middletown was the winter of 1978. In a span of about a month the area saw three major storms culminating in the Blizzard of ’78. The first storm caused severe flooding to some small businesses and minor electrical outages. Winds reached 50 mph and there were 3-4 foot waves. The second storm brought two inches of rain to the area causing many accidents, flooding and a power outage that covered the island. The bridges were closed. The third storm was the Blizzard of ’78 which was the worst in the state’s recorded history. The snowfall high for the island was recorded at 27 inches.
More recent blizzards hit the area on April Fool’s Day in 1997 and in January of 2005 bringing around a half a foot and just under two feet of snow respectively. Road conditions were treacherous, and many businesses and schools were closed due to both storms. The Governor declared a State of Emergency during the 2005 storm. On October 15, 2005, a nor’easter struck the area after a week of heavy rains causing Bailey Brook to overflow which in turn caused the Wave Avenue pump station to overflow into Easton’s Bay. The Blizzard of ’06 brought approximately 24 inches of snow to Middletown. This severe storm disrupted transportation systems, closed schools/businesses, and damaged commercial and residential property throughout the town. During the following week, several commercial and residential roofs collapsed. No serious structural damage was reported in Middletown. The Governor declared a State of Emergency closing all Town and State facilities. Roads remained open for emergency vehicles. Businesses and public
After Christmas Snowstorm, December 2010 – Middletown Patch

30
services returned to normal operations within 48 hours. The snowfall high for Aquidneck Island was recorded at 27 inches. The town also experienced several snowstorms during the winter of 2010-2011. In December 2010, the town had 9.1 inches with the December average only 7 inches, and in January 2011, the town saw 24.4 inches of snow with a monthly average of 8.4 inches.10
On February 8 - 9 2013, Middletown was impacted by a significant winter snowstorm, named Nemo by the Weather Channel. Nemo dumped up to two feet of heavy wet snow and caused power outages. A significant amount of vegetative debris was also generated as a result of this storm’s heavy snow and high winds, which gusted between 50 and 60 mph. A Federal Disaster was declared due to the significant impact of the storm. On January 27 -28, 2015, Middletown was impacted by a blizzard. The storm caused near white out conditions dropping more than 16 inches of snow on Middletown. Wind gusts reached 53 mph in Newport and toppled the Tall Ship Providence from its cradle at the Newport Ship Yard. The governor declared a State of Emergency and a travel ban during the event. FEMA declared the event a federal disaster on April 3, 2015. Newport County experienced more than eight inches of snow twice more within roughly a month of the blizzard with heavy snow events happening on February 14-15 and March 5.11 In January 7 and February 9, 2017 snowstorms of greater than 8 inches hit Newport County. In 2018 the area was struck by a storm that dropped 12-15 inches of snow on January 4 . The Town prepared to open Gaudet School as a warming station on this occasion, but due to the limited number of power outages, such a measure was not deemed necessary. On March 13 a blizzard dropped 9-14 inches and brought wind gusts of 64 miles per hour.12 The storm was one of a string of four nor’easters to hit the area during March 2018. The storm caused power outages affecting Grand Islander, John Clarke, and Blenheim nursing homes and the Middletown Police Department for approximately three hours. Each facility ran on generator power without issue. Power fluctuations caused an increase in alarm related calls. Wind events are quite normal in Southern New England and happen regularly each year. In the winter months the area is susceptible to high winds from nor’easters and winter storms. Spring and summer seasons usually bring a number of severe thunderstorms to the region. During the late summer and fall seasons the area is at risk from hurricane winds.
On April 4, 1995 a fast-moving squall line preceding an arctic cold front produced strong to severe thunderstorms with wind gusts of 40 to 60 mph. Middletown residents reported downed power lines. The October 18, 2005 nor’easter knocked down some tree branches but did not cause any power outages. Middletown experienced strong winds on several occasions in recent years, often causing tree damage and bringing down utility wires. On November 2, 2014 wind gusts reached more than 46 mph, downed wires, and closed a road in Middletown. Wind gusts reached 59 mph on February 16, 2016 but caused no significant damage. On September 5, 2016 wind gusts reached 50 mph due to a tropical depression, downing trees on Indian Avenue and Goldenrod Drive in Middletown. On October 23, 2016 wind gusts reached 48 mph and brought down a tree and wires in Middletown.
10 NewportRIWeather.com, http://www.newportriweather.com/mwd/years.html. 11 “Storm Events Database,” NOAA, accessed December 2018 12 “Storm Events Database,” NOAA, accessed December 2018
31
On March 2, 2018, wind gusts reached 67 mph; a falling tree struck and killed a property owner in Newport during this event. 13 Unofficially dubbed “Winter Storm Riley,” the storm toppled entire trees due to soil saturation and resulted in an increase in calls to the Town’s emergency service departments due to falling limbs and arching wires. The storm compromised a culvert under Sachuest Point Road and damaged the North Easton’s Pond Dam. Newport Water Department addressed the damages in the days following the storm. Tornadoes
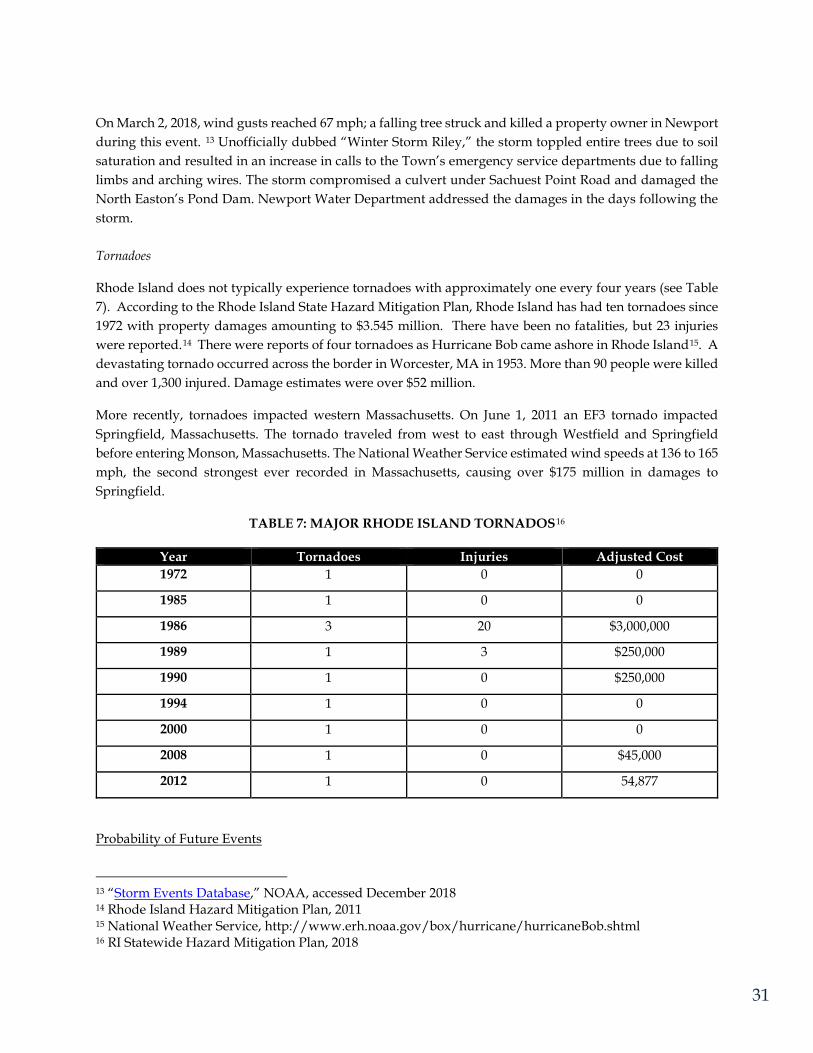
Rhode Island does not typically experience tornadoes with approximately one every four years (see Table 7). According to the Rhode Island State Hazard Mitigation Plan, Rhode Island has had ten tornadoes since 1972 with property damages amounting to $3.545 million. There have been no fatalities, but 23 injuries were reported.14 There were reports of four tornadoes as Hurricane Bob came ashore in Rhode Island15. A devastating tornado occurred across the border in Worcester, MA in 1953. More than 90 people were killed and over 1,300 injured. Damage estimates were over $52 million.
More recently, tornadoes impacted western Massachusetts. On June 1, 2011 an EF3 tornado impacted Springfield, Massachusetts. The tornado traveled from west to east through Westfield and Springfield before entering Monson, Massachusetts. The National Weather Service estimated wind speeds at 136 to 165 mph, the second strongest ever recorded in Massachusetts, causing over $175 million in damages to Springfield.
TABLE 7: MAJOR RHODE ISLAND TORNADOS16
Year Tornadoes Injuries Adjusted Cost 1972 1 0 0
1985 1 0 0
1986 3 20 $3,000,000
1989 1 3 $250,000
1990 1 0 $250,000
1994 1 0 0
2000 1 0 0
2008 1 0 $45,000
2012 1 0 54,877
Probability of Future Events
13 “Storm Events Database,” NOAA, accessed December 2018 14 Rhode Island Hazard Mitigation Plan, 2011 15 National Weather Service, http://www.erh.noaa.gov/box/hurricane/hurricaneBob.shtml 16 RI Statewide Hazard Mitigation Plan, 2018

32
The Town of Middletown is likely to experience an increase in both the frequency and intensity of storms due to climate change. Further, climate change is expected to result in more frequent heavy rains and an increase in annual precipitation, which will contribute to an increase in flooding risks.17
The Town of Middletown does not anticipate an increase in probability of future events for tornadoes.
2.2.2 HURRICANES AND TROPICAL STORMS Hurricane and Tropical Storm Profile
“A ‘tropical cyclone’ is the scientific term for a closed meteorological circulation that develops over tropical waters. These large-scale non-frontal low-pressure systems occur throughout the world over zones referred to as ‘tropical cyclone basins’”18. Hurricanes are a severe tropical cyclone having winds greater than 74 mph originating in the equatorial regions of the Atlantic Ocean or Caribbean Sea or eastern regions of the Pacific Ocean, traveling north, northwest, or northeast from its point of origin, and usually involving heavy rains.
Hurricanes begin as tropical depressions. If the sustained velocity of the winds exceeds 39 mph it becomes a tropical storm. Once the tropical depression becomes a tropical storm it is considered a threat and is given a name. Most tropical depressions begin off of the coast of Africa near the Cape Verde islands or near the Caribbean as the sea surface temperature is above 81 degrees Fahrenheit in the summer months which assists in system formation. Tropical storms and hurricanes often travel a path that takes them up the east coast toward Rhode Island and Middletown.
There is a high probability that the town will be significantly impacted by a hurricane in the next five years, and one direct hit on the State of Rhode Island could be catastrophic for all of the cities and towns. The town has been impacted by hurricanes several times throughout the past century as outlined in Table 9: Major Rhode Island Hurricanes.
The Saffir-Simpson Scale (see Table 8) was “developed in the early 1970s by Herbert Saffir, a consulting engineer in Coral Gables, Florida, and Dr. Robert Simpson, then director of the National Hurricane Center. The scale is based primarily on wind speeds and includes estimates of barometric pressure and storm surge associated with each of the five categories. It is used to give an estimate of the potential property damage and flooding expected along the coast from a hurricane landfall.”19
17 RI Executive Climate Change Coordinating Council – Science and Technical Advisory Board, “Current State of Climate Science in Rhode Island,” May 1, 2016
18 Neumann, C.J., et al. Tropical Cyclones of the North Atlantic Ocean, 1871-1986 (Washington, D.C.: U.S. Department of Commerce, NOAA, 1987). 19 “Hurricanes and Tropical Storms: Saffir-Simpson Hurricane Scale" Weather.com. The Weather Channel, 1995-2001.

33
TABLE 8: SAFFIR-SIMPSON HURRICANE SCALE20
Category Central Pressure Winds Damage
Millibars Inches (mph)
1 >980 >28.9 74-95 Minimal
2 965-979 28.5 - 28.9 96-110 Moderate
3 945-964 27.9 - 28.5 111-130 Extensive
4 920-944 27.2 - 27.9 131-155 Extreme
5 <920 <27.2 155+ Catastrophic
Wind damage is a concern with hurricanes and tropical storms. Wind pressure, not wind speed, causes wind damage.21 There are three types of wind pressure: positive, negative, and internal.
• Positive wind pressure is what one feels when the wind is blowing in one’s face. It is the direct pressure from the force of the wind that pushes inward against walls, doors and windows. • Negative wind pressure occurs on the sides and roof of buildings. It is the same pressure that causes an airplane wing to rise. This negative pressure is also known as lift. Negative pressure causes buildings to lose all or a portion of their roofs and side walls and pulls storm shutters off the leeward side of a building. • Interior pressure increases dramatically when a building loses a door or window on its windward side. The roof feels tremendous internal pressures pushing up from inside of the building together with the negative wind pressure lifting the roof from the outside.
20 Saffir-Simpson Hurricane Wind Scale. The National Weather Service. http://www.nhc.noaa.gov/aboutsshws.php. 21 The Insurance Institute for Property Loss Reduction, 1994.

34
Location
The entire town is vulnerable to the impacts of hurricanes and tropical storms, but some areas face more risk than others. Low-lying areas, especially those within FEMA’s 100-year flood zone, are at risk of flooding due to storm surge or rivers overtopping their banks (see Figure 1 22). Area’s located within FEMA’s velocity zone during a 100-year storm face additional risk from wave action. Town facilities, such as beaches and pump stations, and private structures, including many in the Atlantic Beach District are at risk. The capped landfill at Sachuest, located adjacent to Second Beach, and Nelson and Gardiner Ponds are each completely or partially surrounded by the 100-year flood zone.
Timing and Duration
Hurricane season is between June 1 and November 30 each year. Hurricanes typically affect the northeast from August through October when the waters are the warmest. Statistically the peak of the season is September 10 as shown in Figure 2.
22 Coastal Resources Management Council, STORMTOOLS, http://www.beachsamp.org/stormtools/
Figure 1: 100-year flood CRMC STORMTOOLS

35
National Hurricane Center
The amount of time a hurricane or tropical storm will affect the town depends on its diameter and forward speed. The duration of a storm is calculated by dividing the forward speed of the storm into its diameter, the total is the amount of time that the town will be impacted by the storm. Historically these storms increase their forward speed as they approach northern latitudes. Typically, weather forecasting allows a few days advanced warning of the onset of a hurricane but is often plagued with uncertainty regarding the exact track of the storm.
Severity
Hurricanes in Middletown are likely to have a severity of moderate to high depending on the location of the eye of the storm. The hurricane’s severity will be higher if the eye passes to the west of the town because storm surge will be more intense causing more extensive damage. Rain and winds could cause severe damage depending on their volume and speed respectively. Heavy rain can cause flash and riverine flooding placing lives, property, and transportation systems at risk. During storms with very little rain and more winds, salt spray can cause widespread power outages by infiltrating electrical infrastructure. High winds also result in localized power outages due to downed trees and tree limbs falling on wires. Downed trees and power lines could isolate people from emergency response personnel. Debris would likely be the biggest issue if the town experienced a hurricane.
Frequency
FEMA considers hurricanes in New England a low-frequency, high-impact event. Though they do not occur often, when they do, they leave their mark.
FIGURE 2: ATLANTIC HURRICANE FREQUENCIES

36
Hurricane History
Between 1990 and 2014, Southern New England was affected by 40 tropical weather systems, 26 hurricanes and 15 tropical storms, major hurricanes are outlined in Table 9. In 1954, New England endured three hurricanes; Carol, Edna, and Hazel. Over the last seventy-five years, Rhode Island was directly affected by seven storms which had hurricane force winds at landfall. These included four Category 3 hurricanes directly impacting Rhode Island and causing millions of dollars in damage and hundreds of deaths. The most recent hurricane to directly impact Rhode Island was Hurricane Bob in 1991, a Category 2 hurricane.
Although Rhode Island has not been hit by intense hurricanes (Category 4 or 5) as seen in other parts of the East Coast, we have had our share of major hurricanes that have caused extensive damage to the state.
In the sixteen-year period from 1938 to 1954, Rhode Island experienced four major hurricanes that caused a tremendous amount of damage and resulted in almost 300 deaths across the state. The great un-named hurricane of 1938 devastated Rhode Island and caused $100 million (in 1938 dollars) in property damage and took 262 lives. Damage included flood losses for harbor structures, commercial, and residential property.
Often nicknamed the “forgotten hurricane,” the Great Atlantic Hurricane of 1944 received limited media attention due to its landfall occurring during the height of World War 2. Five ships, including a U. S. Navy destroyer and minesweeper, two U. S. Coast Guard cutters, and a light vessel, sank due to the storm causing 344 deaths. On land, it brought in a storm surge of 10-12 feet resulting in an estimated $100 million in damage.23,24
TABLE 9: MAJOR RHODE ISLAND HURRICANES
Hurricane Category Wind Speed at Landfall Damage to Rhode Island
Hurricane of 1938 3 Sustained to 91 MPH, gusts to 121 MPH
Extensive – roofs, trees, crops; storm surge 12 to 15 feet destroyed coastal buildings
Great Atlantic Hurricane, 1944
3 Sustained to 86MPH, Gusts to 109 MPH
Caused 46 deaths on land, 701 homes and businesses destroyed, 12,000 structures damaged
Carol, 1954 3 Sustained to 100 MPH, gusts to > 125 MPH
Westerly to Middletown coast communities were wiped out; downtown Providence under 12 feet of water; 14 foot storm surge in upper bay
Edna, 1954 2 Sustained to 95 MPH, gusts to 110 MPH
Inland flooding; rivers rose several feet above flood stage; knocked out electrical power
23 “Hurricanes in History,” The National Hurricane Center, NOAA. https://www.nhc.noaa.gov/outreach/history/#great. Accessed July 25, 2019. 24 NOAA Technical Memorandum NWS ER-86. “RHODE ISLAND HURRICANES AND TROPICAL STORMS A FIFTY -SIX YEAR SUMMARY.” David Vallee, 1993.

37
Donna, 1960 3 Sustained to 95 MPH, gusts to 130 MPH
Moderate storm surge; extensive beach erosion; wind damage to trees and utility poles causing major power outages
Gloria, 1985 2 Sustained to 81 MPH, gusts to 100 MPH
Minor coastal flooding and erosion; scattered power outages
Bob, 1991 2 Sustained to 100 MPH, gusts to > 105 MPH
Storm surge of 5-8 feet; extensive beach erosion; wind damage to trees and utility poles; 60% of southeast Rhode Island lost power
Hurricanes Carol and Edna in August of 1954, just two weeks apart, had remarkably similar formations and tracks, causing similar levels of damage including 19 fatalities and 8-10 feet of storm surge in downtown Providence, RI.25
Hurricane Bob, in 1991, was one of the costliest hurricanes to hit New England with damage reported in the millions. The major damage was caused by wind; flooding was minimal. Debris blocked roads and caused extensive structural damage. The hurricane force winds caused power outages that lasted for a period of about 72 hours.
Tropical Storm Irene
Tropical Storm Irene impacted the Town of Middletown on August 28-29, 2011. The town experienced storm surge, debris, and minimal flooding. There were no fatalities caused by the storm and the town did not suffer major physical damage; however, there were many downed trees and power outages. Middletown, and Aquidneck Island as a whole, experienced two days of complete power outage, with smaller outages extending for several more days. Due to the power outages, traffic lights were not operational causing significant risk to drivers and pedestrians. The other risk resulting from Irene was debris in roadways.
25 “Hurricanes in History,” The National Hurricane Center, NOAA. https://www.nhc.noaa.gov/outreach/history/#great. Accessed July 25, 2019.

38
Superstorm Sandy
Superstorm Sandy impacted the Town of Middletown on October 29, 2012 with tropical storm force impacts. The town experienced significant storm surge, power outages, and damage to public and private property. There were no fatalities caused by the storm. The most significant impacts were the great volumes of beach sand washed onto Second Beach, Third Beach and Surfers End Roadways and parking lots.
The storm surge and intense high wave action also caused extensive damage to Sachuest Point Road between the Second Beach Campground and the U.S. Sachuest Point Wildlife Refuge. Much of the RIDOT owned roadway in this area was covered with heavy debris that made the road impassable. Some areas of the road suffered severe buckling and/or were undermined causing the officials to close the road for safety reasons until permanent repairs could be made.
There is concern that a more direct hit from this storm may have caused much more significant destruction with erosion possibly reaching the capped landfill, maintained by USFWS, located just north of Sachuest Point Road. While RIDOT repaired the road following the storm, mitigation measures to help prevent damage to the road from future events has not been conducted.
In Spring 2017, the pathways that cross the dunes at Second Beach were raised to 12 feet above sea level and angled to mitigate damage from storm surge to the beach building, parking lot, and campground and the retaining walls and dams at Gardiner Pond and Nelson Pond.
A mechanical failure of the Wave Avenue pumping station’s elevated generator also caused sewerage overflow to occur. The generator was repaired following the storm and has since been replace with a new unit. Many public and private properties suffered property and tree damage caused by high winds. Downed trees, limbs and power lines blocked many roads. Some rivers and streams ran at high levels during the storm’s duration, but there was no overflowing identified. All area dams appeared to be unaffected by high winds and any elevated water levels caused by Hurricane Sandy.
Storms Since Sandy
Since Hurricane Sandy, Middletown has experienced only the remnants of a few tropical systems. On August 6, 2014 high surf caused by tropical storm Bertha off the coast of North Carolina swept away and killed a fisherman at Beavertail State Park in Jamestown. On September 5, 2016, the remnants of Hurricane Hermine cause wind gusts of more than 46 mph in Newport County and downed trees and wires in Newport, Tiverton, and Middletown. On October 29, 2017, tropical storm Phillipe merged with a mid-
Sachuest Point Road after Hurricane Sandy, October 2012

39
latitude system causing wind gusts of 55 mph, dropping 3-5 inches of rain, and causing a tree and wires to be downed at Prospect Court in Portsmouth.26
Probability of Future Events
According to a forecaster at the National Weather Service, there is less than a 10-15% chance of a hurricane impacting the State of Rhode Island and the Town of Middletown in any given year (see Figure 3). The empirical probability of a named storm – a hurricane or a tropical storm – impacting Rhode Island in any given year is approximately 24%, as shown in the map below. Hurricanes and tropical storms are frequent in the Atlantic, however if they begin a northerly track up the east coast, they tend to curve eastward back out to sea.
Atlantic basin modeling studies predict climate change will result in “a substantial reduction in the number of tropical storms and hurricanes, [but] the frequency of intense storms (Category 4 and 5) is likely to increase and possibly double by the end of the 21st century.”27 Overall, the number of topical events is expected to decrease, projections for the 21st Century are shown in Figure 4.
26 “Storm Events Database,” NOAA, accessed December 2018 The Atlantic Oceanographic and Meteorological Laboratory, 2007 27 RI Executive Climate Change Coordinating Council – Science and Technical Advisory Board, “Current State of Climate Science in Rhode Island,” May 1, 2016
FIGURE 3: EMPIRICAL PROBABILITY OF A NAMED STORM

40
FIGURE 4: PROJECTED CHANGES IN ATLANTIC HURRICANE FREQUENCY OVER 21ST CENTURY28
2.2.3 FLOODING Flooding Profile
Flooding is “a general and temporary condition of partial or complete inundation of normally dry land areas from: (1) the overflow of inland or tidal waters; (2) the unusual and rapid accumulation of runoff of surface water from any source.”29 Flooding can be caused by a variety of sources including extreme high tides, storm surges, tsunamis, extreme weather, rapid snow melt and dam failure. This plan will examine the three categories of flooding Middletown is most vulnerable to: storm surge flooding, riverine flooding due to precipitation and impervious surface, and flooding due to dam failure. Storm Surge According to the National Hurricane Center, storm surge is an abnormal rise of coastal water generated by a storm, over and above the predicted astronomical tides. The rise in water level occurs primarily due to winds pushing water toward the shore. The rise in water level due to storm surge can cause extreme flooding in coastal areas particularly when storm surge coincides with normal high tide, resulting in storm tides reaching up to 20 feet or more in some cases. Besides the inundation of normally dry areas, battering waves associated with storm surge pose additional risk to structures. Strong currents associated with storm surge can severely erode beaches and coastal roads and undermine the foundations of structures. 30 Riverine Flooding Riverine Flooding occurs when surface water runoff introduced into streams and rivers exceeds the capacity of the natural or constructed channels to accommodate the flow, resulting in water overflowing
28 RI Executive Climate Change Coordinating Council – Science and Technical Advisory Board, “Current State of Climate Science in Rhode Island,” May 1, 2016 29 Rhode Island State Hazard Mitigation Plan, 2011. 30 National Oceanic and Atmospheric Administration, “Storm Surge Overview,” accessed December 2018.

41
the stream banks and spilling out into adjacent low-lying areas. Riverine flooding can occur due to heavy rain events or rapid snow melts. In small watersheds, flooding can be difficult to predict to provide useful warning time. The amount of impervious surface within the watershed and the presence of older drainage systems designed to rush water away from development as quickly as possible are directly related to the magnitude of downstream riverine flooding.31 Dam Failure As defined by NOAA, a dam is “any artificial barrier that diverts or impounds water.” NOAA defines dam failure as a “catastrophic event characterized by the sudden, rapid, and uncontrolled release of impounded water.”32 Dam failures can result from any one, or a combination, of the following causes:
• PROLONGED PERIODS OF RAINFALL AND FLOODING, WHICH CAUSE MOST FAILURES; • INADEQUATE SPILLWAY CAPACITY, RESULTING IN EXCESS OVERTOPPING OF THE EMBANKMENT; • INTERNAL EROSION CAUSED BY EMBANKMENT, FOUNDATION, OR PIPING LEAKAGE; • IMPROPER MAINTENANCE, INCLUDING FAILURE TO REMOVE TREES, REPAIR INTERNAL SEEPAGE
PROBLEMS, OR MAINTAIN GATES, VALVES, AND OTHER OPERATIONAL COMPONENTS; • IMPROPER DESIGN OR USE OF IMPROPER CONSTRUCTION MATERIALS; • FAILURE OF UPSTREAM DAMS IN THE SAME DRAINAGE BASIN; • HIGH WINDS, WHICH CAN CAUSE SIGNIFICANT WAVE ACTION AND RESULT IN SUBSTANTIAL
EROSION; • DESTRUCTIVE ACTS OF TERRORISTS; AND, • EARTHQUAKES, WHICH TYPICALLY CAUSE LONGITUDINAL CRACKS AT THE TOPS OF THE
EMBANKMENTS, LEADING TO STRUCTURAL FAILURE33
Two factors influence the potential severity of a full or partial dam failure: the amount of water impounded, and the density, type, and value of development and infrastructure located downstream. Disastrous floods caused by dam failures may cause great loss of life and property damage, primarily due to their unexpected nature and release of a high velocity wall of debris-laden water rushing downstream destroying everything in its path. See Parcels Impacted by Flood Zones - Appendix D for a map describing the location of potential dam related flooding. Location Storm Surge and Riverine Flooding Floodplains are the low, flat, periodically flooded lands adjacent to rivers, lakes and oceans.34 During and after major flood events the connections between a river and its floodplain becomes most apparent. Floodplains form a complex physical and biological system that support a variety of natural resources and habitats and provide natural flood and erosion control. In addition, the floodplain is a natural filtering system, with water percolating back into the ground and replenishing groundwater. When a river or coast is divorced from its floodplain with levees and other flood control structures or by the encroachment of development, natural benefits are lost, altered, or significantly reduced.35
31 Federal Emergency Management Agency “Chapter 2, Types of Floods and Floodplains,” accessed December 2018. 32 NOAA - National Weather Service, "Glossary: Dam" 25 June 2009. 33 FEMA, “Multi Hazards Risk Assessment,” 1997. 34 Rhode Island State Hazard Mitigation Plan, 2011. 35 Rhode Island State Hazard Mitigation Plan, 2011.

42
As defined by FEMA, floodplains in Middletown include A, V and X zones. The A and V zones encompass the area inundated by a 100-year flood. In addition to inundation, the V zone experience breaking waves greater than three feet. X zones are areas inundated by the 500-year flood. In Middletown, the area that would be most impacted by a 100-year riverine flood is located along Paradise Brook directly northwest of the intersection of Wapping Road and Berkley Ave (see Parcels Impacted by Flood Zones - Appendix D). That said, a number of other properties within the Bailey Brook, Maidford River, and Paradise Brook basins are also at severe risk from riverine flooding. The area most impacted by a 100-year storm surge is the Atlantic Beach District. FEMA’s maps do not account for sea level rise or the increase in precipitation projected to occur due to climate change, so should be considered a conservative assessment of a property’s long-term vulnerability to flooding. In order to mitigate the impacts of flooding, Middletown participates in the National Flood Insurance Program, the Community Rating System, and has adopted the state building code which includes freeboard allowances among other flood-mitigation strategies. Participation in these programs is described more fully in a later section. The Town understands that continued development in and around the floodplain could have adverse impacts to its citizens as well as its CRS rating. Dam Failure The area downstream of a dam will be impacted by a dam failure. Gardiner Pond and Nelson Pond each have dams owned by the City of Newport. Both reservoirs are located across from Second Beach on Sachuest Road. There is an eight-foot-high earthen retaining wall around each reservoir totaling approximately two miles in length. Each reservoir has a high-hazard dam, meaning that failure or improper operation of the dam will result in a probable loss of human life. 36 This is especially likely if the Gardiner Pond dam failed while the Second Beach parking lot and campground were occupied. A retaining wall or dam failure at either reservoir would result in the flooding of roads, sensitive marshland, the Second Beach area and the contamination and loss of valuable drinking water for Aquidneck Island. The Easton’s Pond North Dam is another high-hazard dam located in Middletown. The City of Newport owns this dam, which abuts a business and residential area. If there was a breach, there would be a probable loss of human life and Middletown businesses and residents would be significantly affected. There are three other low hazards dams in Middletown (Wanumetonomy Pond Dam, Prescott Farm Dam, and Newport Memorial Cemetery Dam). Failure of these dams would result in no probable loss of human life and low economic losses. 37, 38
36 RIDEM Office of Compliance and Inspection, “2017 Annual Report to the Governor on the Activities of the Dam Safety Program,” April 6, 2018 37 RIDEM Office of Compliance and Inspection, “2017 Annual Report to the Governor on the Activities of the Dam Safety Program,” April 6, 2018 38 RIDEM Office of Compliance and Inspection, “2016 Dam Safety Annual Report Attachment,” accessed January 18, 2019

43
Timing and Duration Storm Surge Warnings of coastal storms usually occur several days before impact allowing areas vulnerable to storm surge to prepare and evacuate if necessary. Storm surge flooding is most likely to occur during the hightide cycle of a strong tropical storm or nor’easter. Storm surge during tropical storms is likely to last only one or two tide cycles and may be very high impact, while storm surge from a nor’easter can grind away at the shore for days but is less likely to be as far reaching. Riverine Flooding Weather forecasts and the close monitoring of local water systems normally provide substantial warning prior to riverine flooding. Riverine flooding may occur due to a single very heavy rain or snow melt event, or as the result of multiple smaller events saturating the ground over the course of weeks leading to a tipping point where no more water can be absorbed by the system. Seventy-five percent of Middletown’s annual precipitation typically occurs in the six-month period from October through March, making this the most likely time of the year to experience riverine flooding. During the 2010 flood, a 100-year event and the most significant flood in recent memory, surface flooding lasted for 3-5 days following the event with some areas experienced localized flooding for longer periods. The rain event itself lasted for three days. Dam failure While a dam failure happens suddenly, the conditions that lead to the failure can develop over several years. Heavy rain events can stress a dam. With proper inspection and maintenance, a dam will be less likely to fail.
Severity
Storm Surge and Riverine Flooding
While uncommon, Middletown is susceptible to large-scale severe flooding. 22 properties in Middletown could be more than 75% inundated by a 100-year riverine flood, while 43 would be similarly impacted by a 100-year storm surge.
Flood damage costs in Middletown are typically low. Though frequent, flood events in Middletown tend not to be severe, usually resulting in the flooding of low-lying, underdeveloped lands and roads. However, water on roadways can cause significant road damage and limit access to important transportation routes and services. The Town has been mitigating the effects of these flood events by constructing culverts under repetitive flood roads, raising the roads, and building guiderails near water sources that tend to flood.
Flooding as a result of clogged storm-water drains is also a concern. When storm-water drains overflow into permeable areas, such as low impact development practices or lawns and landscaped areas, there is risk of groundwater contamination. The presence of hazardous materials within flooded areas increases the potential risk to groundwater during flood events.
Dam Failure
The severity of a dam failure is based upon the amount of water that the dam is holding back and the uses of the downstream locations that would be flooded. A dam failure may not cause any problems

44
downstream, or it could cause catastrophic issues. A retaining wall or dam failure at either Gardiner Pond and Nelson Pond would result in the flooding of roads, sensitive marshland, the Second Beach area and the loss of valuable drinking water. Dam failure at the North Easton’s Pond Dam could flood a significant portion of the Atlantic Beach District. All three of these dams are considered high-hazard dams by DEM’s Dam Safety Program, meaning that failure or improper operation of the dam will result in a probable loss of human life.
Frequency
Major flooding in Middletown is infrequent. In recent years, the town has experienced minor flooding almost annually during rain events of 1-2 inches. Groundwater seepage and storm water drainage can be a consistent problem causing minor flooding in rainy months.
The Town of Middletown has no history of dam failure.
Flooding History
Historically, torrential rainfall, severe thunderstorms, large snowmelts, and hurricanes (rainfall and/or storm surge) are the primary causes of flooding in Rhode Island. These hazards can result in urban street, basement, and riverine flooding. Between 1993 and 2014, the National Climate Data Center has reported over 50 floods in Rhode Island.
A winter storm in January of 1978 brought two inches of rain to an already snow-covered Middletown, causing heavy flooding in areas near sea level. Most of Middletown’s beach area was underwater and all access roads were barricaded due to an impending high tide.
On August 29, 1997 a developing ocean storm caused a cold front to slowly move across Rhode Island. An area of showers and thunderstorms produced rainfall amounts of three to nearly five and one-half inches in one to three hours in parts of Newport County. In Middletown, Bailey Brook rose high enough to flood a section of Forest Ave.
On February 18, 1998 a strong low-pressure system brought heavy rainfall, isolated flash floods, and thunderstorms to mainly central and southern Rhode Island. In Middletown, the Maidford River rose out of its banks, flooding part of a nearby neighborhood. There were also reports of minor street flooding.
Flooding occurred in October 2005 when Rhode Island experienced 9 days of heavy rains causing major flooding, sewer plant failures and coastal damage. Two days after the rain ended, a nor’easter bringing moisture from Hurricane Wilma, brought more rain and strong winds to the area. Providence recorded a total of 15.07 inches of rain, making it the wettest month on record for the city.
The most recent major flooding event in Rhode Island, the March 2010 Floods, was a federally declared disaster and is highlighted below.
March 2010 Floods
The State of Rhode Island experienced torrential rainfall that affected the entire state between March 12, 2010 and March 31, 2010. During the floods, Middletown experienced above normal flooding in all areas

45
adversely affected by heavy rainfall in the past. Significant flooding occurred in the Wave Avenue area. The Third Beach and Peabody Beach area also suffered significant erosion due to flooding.
The severe weather event in March 2010 also required the Middletown emergency management team to conduct operations related to public safety and prevention of environmental damage. Public Works, Police and Fire Departments operated with extra manpower and equipment in response to this storm. Two hotels in the Wave Avenue area had to be evacuated due to flooding of parking lots, elevators shafts and mechanical rooms. Hundreds of homes suffered from basement flooding. Clean-up operations lasted several days in some residential areas of town as well as the two beach areas affected by the storm damage. Many hotels in Middletown reduced their prices for residents of nearby towns who were experiencing more severe flooding.
Probability of Future Events
Storm Surge and Riverine Flooding
Current trends related to climate change and development are expected to increase the frequency and severity of flooding events in Middletown. Climate change is causing sea level to rise and storms to intensify. As a result, flooding from storm surge is expected to be more frequent and to reach further inland as time passes. Climate change is also resulting in greater annual precipitation and more heavy rain events. This additional precipitation, coupled with impervious surface and stream-constricting bridges and culverts related to development, is expected to result in more frequent localized and riverine flooding. Over the past 80 years, Rhode Island has experienced a doubling of the frequency of flooding and an increase in the magnitude of flood events.39
Extreme High Tide Flooding
Middletown currently experiences flooding during extreme high tides in two areas – the CRMC right-of-way between Aquidneck Ave and the shore at Dunlap Wheeler Park and Hanging Rocks Road near Surfers End/Second Beach. The Town has successfully mitigated the flooding on Hanging Rocks Road but has not yet secure funding to construct a revetment to mitigate flooding of the CRMC right-of-way. The Town will continue to apply for grants as they become available. With sea level rising, flooding in both locations should be monitored, as well as other low-lying coastal areas.
Dam Failure
It is not possible to predict the probability of dam failure. The Town can only work with dam owners to maintain the structures to reduce the probability.
39 RI Executive Climate Change Coordinating Council – Science and Technical Advisory Board, “Current State of Climate Science in Rhode Island,” May 1, 2016.

46
2.2.4 WILDFIRE AND CONFLAGRATION Wildfire and Conflagration Profile
A wildfire is a natural or human caused uncontrolled burning of vegetative fuel such as grasslands, trees, or woodland. There are many causes of wildfire, from naturally-caused lightning fires to human-caused fires linked to activities such as smoking, campfires, equipment use, and arson. There are three major factors that sustain wildfires and predict a given area’s potential to burn. These factors are fuel, topography and weather. The following conditions, particularly when combined, can increase the potential for wildfire to occur:
• HIGH TEMPERATURES • LOW HUMIDITY • HIGH WINDS • DROUGHT • LIGHTNING
Wind is the most treacherous weather factor. The greater the wind, the faster a fire will spread and the more intense it will be. In addition to wind speed, wind shifts can occur suddenly due to temperature changes or the interaction of wind with topographical features such as slopes or steep hillsides. Drought conditions also contribute to concerns about wildfire vulnerability. During periods of drought, the threat of wildfire increases. Once a wildfire has been detected and the area assessed, the wildfire is assigned one of the following categories from lowest to highest: category 1 (incipient- initial), category 2 (growing and threatening), category 3 (major aggressive fires), category 4 (major aggressive fire of at least 5,000 acres expanding at 400 acres per hour), or category 5 (major very aggressive fire of at least 16,000 acres expanding at 1000 acres per hour or more). These categories may change as the wildfire continues to burn. The topography and climate of Middletown make it less vulnerable to wildfires. The fact that Middletown has a limited number of forested acres and is not known to be a popular camping destination further reduces its susceptibility to wildfire. Location Although Middletown currently has a low risk for wildfire and urban/wildland interface fires, there are areas of concern. Steep slopes with dense canopy are most at risk of a fire. Vegetation is the primary fuel for both types of fires, and because fire spreads more rapidly uphill than on flat terrain, steep slopes increase this risk. Wooded areas, such as, the Norman Bird Sanctuary are susceptible to higher conflagration risk. These areas present a more significant risk due to the close proximity and age of the structures located on the outer edges of these wildlands. The map Hazard Areas and Vulnerable Populations - Appendix D shows the extent of wildlife and ember zones around the southeastern part of town.

47
Timing and Duration Fire season for Rhode Island is typically early July to October, when the weather is the driest, with the greatest risk in the northern part of the state, which has a drier climate than southern Rhode Island. Severity Potential losses from wildfire include human life, structures and other improvements, natural and cultural resources, the quality and quantity of the water supply, range and crop lands, and economic losses. Smoke and air pollution from wildfires can be a severe health hazard. Other secondary impacts include future flooding and erosion during heavy rains.
The severity of both wildfires and urban/wildland interface fires is influenced by topography, vegetation, development patterns, the use of flammable landscaping and construction materials, and weather conditions. The severity of fires in Middletown varies depending on the type of fire.
A wildfire, primarily fueled by natural vegetation, can have a major impact in areas with dense canopy coverage, specifically areas of more undeveloped land. The severity of an interface fire will increase as urban development encroaches into areas previously undeveloped. Development may decrease the risk of wildfire, but the risk of interface fires will increase. As development continues, the man-made structures will provide fuel for fire and increase the severity of urban/wildland fires.
Frequency The Town of Middletown has not historically experienced an urban/wildland fire and has no frequency interval. It has a low probability of occurrence.
Wildfire and Conflagration History
There has not been a significant urban/wildland interface fire recorded in Newport County.
Probability of Future Events
Climate change may make summers drier and hotter and droughts more common. These changes would increase the frequency and severity of fire. New development in previously wooded or undeveloped areas, specifically in areas of high risk for wildfires, will increase the risk of urban/wildland interface fires. However, the possible increase in fire risk over time is negligible within the next 5 years.

48
2.2.5 DROUGHT Drought Profile
Drought is a gradual phenomenon that occurs slowly, over a multi-year period. Most natural disasters, such as floods or forest fires, occur relatively rapidly and afford little time for preparing for disaster response. Due to its coastal location in a temperate climate, Rhode Island rarely experiences extended periods of drought. However, seasonal droughts have occurred when precipitation levels are low. Drought conditions can impact crops, water available for fire suppression, and reservoir levels.
Location Drought would impact residents who use private wells for their water needs and the Town’s large agricultural industry. Approximately 700 of the Town’s 6374 parcels lie outside the urban service boundary and rely on well water. Those parcels are located largely on the east side of town as shown in, from Figure 5 the Town’s 2015 Comprehensive Community Plan.
FIGURE 5: MAP L-1 SHOWING URBAN SERVICE BOUNDARY

49
The Town can enforce water bans as dictated by the State. For specific statewide mitigation efforts, refer to the current Rhode Island State Hazard Mitigation Plan. Timing and Duration
Drought season, like wildfire season for Rhode Island is typically early July to October, when the weather is the driest. The greatest risk is in the northern part of the state, which has a drier climate than southern Rhode Island.
Severity In more developed areas of Middletown, drought impacts may be dominated by economic losses and possible potable water shortages. In the more rural areas, drought can cause a strain on crops, livestock, and potable water wells.
Frequency Drought is highly unpredictable; it is difficult to forecast its frequency. While scientists project an increase in mean precipitation due to climate change, the additional moisture will not be spread evenly throughout the year. Much of the increase will occur in the winter and spring and/or during increasingly frequent heavy rainfalls. Droughts, meanwhile, are also projected to increase in frequency. Their severity is expected to worsen due to higher temperatures and increased evaporation rates. 40,41 In other words, Middletown should expect more frequent and severe periods of drought punctuated by increasingly heavy rain events.
Drought History Two drought events have occurred throughout Rhode Island since 1993, both in the Spring/Summer of 2012. A meteorological drought was documented by precipitation that had been approximately one half of normal from January 2012 through April 2012. Rivers and streams ran at record low levels during the spring run-off season. However, Rhode Island did not issue drought declarations as reservoirs were at normal levels, due to above normal precipitation falling between August 2011 and November 2011. During fall 2016, southern New England experienced drought conditions due to well below normal precipitation. In Newport County, a severe drought advisory was in effect during September and October and a moderate drought advisory was in effect in November. In many areas the drought began in July. The drought forced farmers to irrigate their crops much more than usual and, anecdotally, to choose which fields to irrigate and which to let go. It also prevented farmers from planting second and third plantings of late summer crops. Groundwater was below to well-below normal. Despite the drought, reservoir levels were normal in Newport. 42
40 NOAA National Centers for Environmental Information, “State Summaries 149 RI,” 2014. 42 “Storm Events Database,” NOAA, accessed December 2018

50
2.2.6 GEOLOGIC HAZARDS- EARTHQUAKES
Earthquake Profile
The USGS estimates that there is a 40 to 60 percent chance of experiencing an earthquake of magnitude 6.0 or greater on the Richter Scale in the central or eastern United States within the next 30 years. Buildings that are most at risk from earthquakes are old masonry buildings and large structures.
All earthquakes produce both vertical and horizontal ground shaking. This ground movement begins at the focus or hypocenter, deep in the earth, and spreads in all directions. The felt motion is the result of several kinds of seismic vibrations. The magnitude of these vibrations are expressed by a value on the Richter Magnitude Scale. Richter magnitudes are technical quantitatively based calculations that measure the amplitude of the largest seismic wave recorded. Richter magnitudes are based on a logarithmic scale and are commonly scaled from 1 to 8. The higher the magnitude on the Richter Scale, the more severe the earthquake. Location Rhode Island is located in the North Atlantic tectonic plate and is in a region of historically low seismicity. Only three or four earthquakes of Modified Mercalli Intensity Scale (MMI) V or greater have been centered in Rhode Island, including the 1951 South Kingstown earthquake of magnitude 4.6 on the Richter scale. Earthquakes are not localized and may impact Middletown town-wide. Timing and Duration Earthquakes are very short events and can happen any time throughout the year. Severity The severity of an earthquake (expressed by intensity and magnitude) depends on the earthquake’s epicenter. An urban area will sustain more damage than an undeveloped area. Generally, Middletown experiences low-magnitude earthquakes that cause little to no damage, Occasional higher magnitude earthquakes have been recorded in the region. According to the United States Geological Survey, predicting the magnitude at which an earthquake will cause damage is challenging. Many factors are involved including a structure’s distance from the epicenter and the type of soil a structure is on. That said, the agency notes that damage does not usually occur until the earthquake magnitude reaches somewhere above 4 or 5.43
43 United States Geological Survey website, “At What Magnitude Does Damage Begin to Occur in an Earthquake?” accessed January 2019.

51
Frequency According to a report in the Boston Globe, “No active faults have been identified in our region… Using rough estimates… New England each year experiences 100 earthquakes in the 1 to 2 magnitude range; 10 in the 2 to 3 range; and one in the 3 to 4 magnitude range… The region can expect a 4 to 5 magnitude quake every decade, a 5 to 6 every century, and a magnitude 6 or above every thousand years.” A worst-case-scenario shake would likely be limited to 7.5 magnitude in this region.44 Earthquake History Since 1974, there have been 14 measured earthquakes near Rhode Island, the largest of which occurred in 1996 and measured 3.1 on the Richter Scale. Of those 14 earthquakes, seven have occurred since 2013, with the largest measuring 2.3 on the Richter Scale.45 Other than maintaining appropriate building codes, the Town of Middletown does not have specific mitigation actions related to earthquakes due to the low history of seismic activity in the town.
2.2.7 HAZARDOUS MATERIALS Hazardous Materials Profile
The EPA defines hazardous materials as liquid, solid, contained gas, or sludge wastes that contain properties that are potentially harmful to human health or the environment.46 Hazardous materials are typically released in the form of spills, leaks, or vapor emissions. These are known as either a point source release that can be traced back to a single origin, or non-point source releases that occur incrementally, slowly polluting the environment. Non-point source hazardous materials are difficult to track and control. Facilities that contain large quantities of hazardous materials are regulated to reduce the risk of point source spills. These facilities are categorized as Tier II facilities, which are defined as those that equal or exceed the thresholds of hazardous
44 Matt Rocheleau, Boston Globe, “Major quake expected in N.E. once every 1,000 years,” July 23, 2015. 45 United States Geological Survey, Earthquake Mapper, accessed December 2018 46 U.S. Environmental Protection Agency, “Wastes–Hazardous Waste,” http://www.epa.gov/osw/hazard/ index.htm.
52
materials listed under Section 311(e) of Title III of the Superfund Amendments and Reauthorization Act (SARA).47 Tier II facilities are required to complete a Tier II Emergency and Hazardous Chemical Inventory report by The Rhode Island State Emergency Response Commission (SERC). These facilities are also required to report to the Local Emergency Planning Committee (LEPC), and local fire department. Tier II storage facilities are required to comply with federal safety requirements and are regulated by the U.S. Environmental Protection Agency. Location The location can be anywhere within the town. Of most concern are the transportation corridors and the facilities that store large amounts of hazardous materials substances. Both point source and non-point source pollution is likely to occur where hazardous materials are located. Point source releases are more easily identified. While non-point source pollution can also occur where hazardous materials are present, such releases may not be immediately recognizable. Both types of releases can occur either at the location where the hazardous materials are stored, or along transportation routes. Propane: Currently there are three propane filling sites that maintain storage of 1,000 pounds or more of liquefied propane. Newport Propane and Taylor Rental have above ground storage, while BJ’s Wholesale Club of Middletown has underground storage. The tank formerly sited at Rocky Ace Hardware has been eliminated. Anhydrous ammonia: St. George’s School ice rink has more than 500 gallons of anhydrous ammonia on site for the operation of ice making equipment. Timing and Duration The time component of point source hazardous materials incidents can range from hours to days. Factors contributing to the duration and subsequent severity of hazardous materials events are the ability of local and/or regional transportation agencies, incident response, and toxic chemical handlers to respond to the event. Non-point source hazardous material release occurs slowly over an extended period of time. Severity According to the U.S. Department of Transportation Pipeline and Hazardous Materials Safety Administration (PHMSA), hazardous materials are most dangerous when they are first released from
47 Emergency Planning and Community Right-to-Know Act (EPCRA), “Hazardous Chemical Storage Reporting Requirements,” U.S. Environmental Protection Agency, http://www.epa.gov/oem/content/epcra/epcra_storage.htm.

53
containment, and the severity of an event depends on the chemical and biological components of the material released.48
The worst-case scenarios for hazardous events related to 1,000 pounds of propane are as follows:
Scenario 1: Fire involving an above ground tank in which flame impingement causes weakening of the vessel while simultaneously heating the liquid propane inside. This type of fire can lead to a catastrophic failure known as a boiling liquid expanding vapor explosion (B.L.E.V.E.). In a B.L.E.V.E. scenario the propane is exposed to temperatures above its boiling point, increasing vapor production and fire intensity. The fire can weaken the structure of the tank to the point of failure with the ensuing explosion sending the vessel hundreds of feet away from its original location. This scenario requires evacuation radius of 1,700 feet to 3,500 feet. A B.L.E.V.E hazard is considerably mitigated when the tanks are located underground as they are protected from most flame impingement. Due to the proximity to critical infrastructure (Middletown Police Department) and vulnerable populations (Newport County Mental Health and Walk in Medical Clinic), the propane filling station tank at BJ’s was required to be located underground. Scenario 2: A vapor leak in which atmospheric conditions or confinement allow the collection of vapors where an explosion is possible with an ignition source. Propane vapors are heavier than air, so they tend to settle in low areas in the absence of a wind to dissipate them. The explosion potential is determined by the size of the confined area and where the vapors are located (e.g. inside of a structure, outside in a swale). Severe vapor leaks may require the downwind evacuation of half of a mile due to explosion potential.
The worst-case scenario for a hazardous event related 500 gallons of anhydrous ammonia would require the downwind protection (shelter in place or evacuation) of .4 miles during daytime and a nighttime protection distance of 1.4 miles while the chemical dissipates. Anhydrous Ammonia is heavier than air, so it tends to settle in low areas in the absence of a wind to dissipate it. Breathing in Anhydrous Ammonia can damage the lungs and cause suffocation.
A slow leak of propane would result in minimal negative human health impacts; low concentrations of exposure is not harmful to humans, even if the exposure is long-term. A slow leak of anhydrous ammonia would also result in minimal negative impacts. The chemical dissipates when released into the atmosphere in favorable, dry, breezy conditions, or, in rainy conditions, forms ammonia hydroxide. Slow leaks in confined areas can cause severe injury to exposed individuals if unable to escape.
Frequency The Town of Middletown experiences routine hazardous materials incidents; however, has a low frequency of significant hazardous materials events.
48 U.S. Department of Transportation Pipeline and Hazardous Materials Safety Administration. “Incident Reporting.” http://phmsa.dot.gov/hazmat/incident-report

54
Hazardous Materials History
On March 13, 2012, there was a major propane gas leak at the Rocky’s Ace Hardware store. Approximately 500 gallons of propane escaped from an underground storage tank when a filling hose detached from a 20-pound propane cylinder that was being filled by a store employee. This event caused a temporary shutdown of West Main Road and the evacuation of homes and businesses within 800 feet of the leak. No injuries or significant property damage was caused by this event.
Probability of Future Events
An increase in hazardous material facilities due to the projected growth of the town will increase the potential for both point source and non-point source events.
2.2.8 TERRORIST EVENTS Terrorist Event Profile Terrorism can strike not just in large cities, but in communities of any size. While no amount of planning and mitigation can remove 100-percent of the risk from terrorism, hazard mitigation and preparedness can help reduce the risk. According to the FBI, “there is no single, universally accepted, definition of terrorism. Terrorism is defined in the Code of Federal Regulations as ‘the unlawful use of force and violence against persons or property to intimidate or coerce a government, the civilian population, or any segment thereof, in furtherance of political or social objectives’ (28 CFR Section 0.85).” 49 Terrorists often use threats to create fear among the public, to convince citizens that government is powerless to prevent terrorism, and to get immediate publicity for their causes. Weapons of mass destruction (WMD), including incendiary, explosive, chemical, biological, radiological, and nuclear agents, have the capability to cause death or serious bodily injury to a significant number of people, thus posing the threat of a catastrophic incident. Terrorism includes the following hazards:
• CONVENTIONAL BOMB • BIOLOGICAL AGENT • CHEMICAL AGENT • NUCLEAR BOMB • RADIOLOGICAL AGENT • ARSON/INCENDIARY ATTACK • ARMED ATTACK • AGROTERRORISM • INTENTIONAL HAZARDOUS MATERIALS RELEASE • ASSAULTS ON THE INFRASTRUCTURE AND ELECTRONIC INFORMATION SYSTEMS THAT COULD
RESULT IN CONSEQUENCES AFFECTING HUMAN LIFE, HEALTH AND SAFETY A terrorist attack can take several forms, depending on the technological means available to the terrorist, the nature of issue motivating the attack, and the points of weakness of the terrorist’s target. Bombings are
49 Federal Bureau of Investigation, http://www.fbi.gov/stats-services/publications/terrorism-2002-2005.

55
the most frequently used terrorist method in the United States. A terrorist using a chemical or biological weapon is of concern to officials. Special trainings and equipment are needed in order to safely manage a WMD incident. Biological agents are infectious microbes or toxins used to produce illness or death in people, animals or plants. Biological agents can be dispersed as aerosols or airborne particles. Terrorists may use biological agents to contaminate food or water because they are extremely difficult to detect. Chemical agents kill or incapacitate people, destroy livestock, or ravage crops. Some chemical agents are odorless and tasteless and are therefore difficult to detect. They can have an immediate effect (a few seconds to a few minutes) or a delayed effect (several hours to several days.) Mass-shootings, such as the school shooting at Sandy Hook, CT, in 2012 or the shooting at an outdoor concert in Las Vegas, NV, in 2017 that resulted in the death of 58 people and injured hundreds more, are another form of terrorist attack. Despite public perception, multiple-victim school shootings are not trending upward. These shootings are less common today than they were in the 1990s. There is an average of about one multiple-victim school shooting each year in a country with more than 100,000 schools. Further, the probability of a student being shot and killed at school has decreased significantly since the 1990s. That said, multiple-victim shootings in general are trending upward. 50 Thirty-five public mass shootings occurred between 1990 and 2000 and the same number occurred between 2000 and 2010. Since 2010, 51 public mass shootings have occurred. Public mass shootings are more common in restaurants, stores, and offices than schools or places of worship.51 Whether intentional or accidental, terrorist incidents – as with other natural and technological disasters – involve the application of one or more modes of harmful force to the built environment. These modes include contamination (as in the case of chemical, biological radiological or nuclear hazards), energy (explosives, arson, and even electromagnetic waves), or denial of service (sabotage, infrastructure breakdown, and transportation service disruption.) Location Terrorist events are unique. The types, frequencies, and locations of most natural hazards are identifiable and with current weather technology, predictable. However, terrorist events cannot be forecast with the same accuracy. Some instances can be tracked through intelligence; however, terrorist events can occur anywhere and at any time. Terrorists may target large groups of people, whether gathered at a public event, school, workplace, or retail business, or critical infrastructure. Timing and Duration It is not possible to predict the timing and/or duration of a terrorist event.
Severity
Terrorist events can have a substantial severity of impact. They can cause mass casualties, shut down facilities for long periods of time, and completely destroy property.
50 Martin Kaste, “Despite Heightened Fear of School Shootings, It’s Not a Growing Epidemic,” NPR, March 15, 2018. 51 Bonnie Berkowitz, Denise Lu, and Chris Alcantara, “The Terrible Numbers that Grow with Each Mass Shooting,” The Washington Post, October 1, 2017 (updated January 24,2019).

56
Frequency The Town of Middletown has not directly experienced any terrorist attacks and therefore does not have a frequency interval. However, due to the geography of the town and the location of the military base and other Department of Defense facilities, terrorism is still a concern. Terrorist Event History There are several terrorist events that have occurred in the United States in the past twenty years. The first World Trade Center Bombing in 1993, the 1995 bombing of the Murrah Federal Building in Oklahoma City, and the attacks of September 11, 2001 on the World Trade Center in New York, the Pentagon in Washington D.C., and the aircraft that crashed in Pennsylvania. Following the 2001 attacks were the series of anthrax attacks. While the forgoing represents the largest terrorist events, it is important to note that smaller terrorist events have happened throughout the nation on a more frequent basis and many have been thwarted by law enforcement through intelligence gathering mechanisms. There are no previous terrorist event occurrences within the Town of Middletown.
Probability of Future Events It is not possible to predict the probability of a future event. Middletown’s proximity to Naval Station Newport increases the risk of becoming a target of terrorism. This base contains the Naval War College, the Navy’s Officer Candidate School and the Naval Justice School. In addition to these key United States Military assets, the navy base also contains the Naval Undersea Warfare Center (NUWC). NUWC is the Navy’s full spectrum research, development, testing, engineering and fleet support center for submarines. The Town will remain vigilant and will continue to participate with other local, State, and Federal agencies for training and exercising opportunities.
2.2.9 CLIMATE CHANGE Climate Change Profile The Intergovernmental Panel on Climate Change’s findings demonstrate that global air and ocean temperatures are rising due to increasing greenhouse gas emissions.52 As a result, the global climate patterns are very likely change. Locally, Middletown is predicted see the following climate change related occurrences over the next century:
• RISING SEA LEVEL • HOTTER, DRIER SUMMERS • WETTER WINTERS • STRONGER AND MORE INTENSE STORMS
These climate related occurrences may result in impacts to the health and safety of Middletown residents by increasing the likelihood of:
52 IPCC, 2014: Climate Change 2014: Synthesis Report. Contribution of Working Groups I, II and III to the Fifth Assessment Report of the Intergovernmental Panel on Climate Change [Core Writing Team, R.K. Pachauri and L.A. Meyer (eds.)]. IPCC, Geneva, Switzerland, 151 pp.

57
• COASTAL OR RIVERINE FLOODING • BRIDGE CLOSURES DUE TO STORMS • DROUGHT • FIRE • HEAT-RELATED HEALTH CONSEQUENCES
Location Climate change, resulting in sea level rise and increased storm intensity, is expected to cause coastal flooding, overland flooding in areas of poor soil permeability, and riverine flooding. Issues of flooding will be most apparent in the Atlantic Beach District, where the properties are located within the FEMA Flood Zone V. And in Middletown’s Watershed Protection District Zone 1, where the land is located within 200-feet of a public water supply or otherwise located on Stissing Silt Loam (Se) soils (see Parcels Impacted by Flood Zones - Appendix D). The CRMC right-of-way adjacent to Dunlap-Wheeler Park experiences extreme tidal flooding. With increased sea level rise, parcels along Wave Avenue in the Atlantic Beach District will begin to be impacted. Three to five feet of sea level rise will inundate much of Second Beach, Third Beach, parts of the Norman Bird Sanctuary, lands adjacent to Nelson Pond and Gardiner Pond owned by the Newport City Water Department, and Sandy Point Beach.53 The public drinking water supply may be impacted by seawater inundation in Easton’s and Gardner Ponds.54 With an increase in extreme weather and increasing intensity of storms, the entirety of Middletown will be impact by storm-driven bridge closures, thereby restricting the ability of residents to evacuate or seek medical care off Aquidneck Island. Climate change related drought would impact residents who use private wells for their water needs and the Town’s large agricultural industry. Approximately 700 of the Town’s 6374 parcels lie outside the urban service boundary and rely on well water. Those parcels are located largely on the east side of town as shown in Figure 6: Urban Service Boundary, from the Town’s 2015 Comprehensive Community Plan.
53 R.I. Coastal Resources Management Council, “STORMTOOLS for Beginners,” accessed December 2018 54 Aquidneck Island Resiliency Strategy, University of Rhode Island Coastal Resources Center and Rhode Island Sea Grant, located at the URI Graduate School of Oceanography, 2017

58
With hotter drier weather, the incidents of fire may increase. The impact of fires will be felt most heavily in the wildlife urban fire intermix zone and airborne ember extent in the southeastern area of Town shown on the map Hazard Areas and Vulnerable Populations - Appendix D. Heat related health consequences may impact any community member but will most heavily impact those without air conditioning in their home, the elderly, children, and those on the voluntary special need’s registry. There are 2 day-program facilities, 8 group homes, 1 low income elderly housing area, 5 nursing homes, and 13 schools in Middletown spread throughout town, as shown on the map Hazard Areas and Vulnerable Populations - Appendix D. Timing and Duration The United States Army Corps of Engineers predicts a rise of between 0.6 to 4.93 feet rise for Newport in the coming century as shown in Figure 6 Sea-Level Change Curve Calculator. Extreme weather events have already become more frequent and the trend is expected to continue.55
55 IPCC, 2014: Climate Change 2014: Synthesis Report. Contribution of Working Groups I, II and III to the Fifth Assessment Report of the Intergovernmental Panel on Climate Change [Core Writing Team, R.K. Pachauri and L.A. Meyer (eds.)]. IPCC, Geneva, Switzerland, 151 pp.
FIGURE 6: URBAN SERVICE BOUNDARY

59
Severity
Climate Change can lead to loss of life and loss of property. It can also permanently alter the coastline and buildable land area of the Town. As a tourist destination, climate-change-related-weather-events can impact the economy of the summer vacation and beach industries in Town. For non-residents the increased likelihood of storm-related bridge closures could cause sever impacts to the ability of workers to arrive at work or return home after work.
Frequency and Probability of Future Events According to the Intergovernmental Panel on Climate Change’s 2014 report, it is very likely that heat waves will occur more often and last longer, sea levels will rise, and extreme precipitation events will become more intense and frequent in North America as climate change resulting from increasing greenhouse gas emissions continues progress.56 History The Newport, RI tide gauge indicates a sea level rise rate of 10.2 inches over the last century.57 As a result of the higher sea levels, the area around Dunlap-Wheeler Park currently experiences nuisance flooding during extreme tidal events. The Newport Pell Bridge experiences closures when wind speeds exceed 58 miles per hour, far below even a category 1 hurricane strength (see Table 8: Saffir-Simpson hurricane Scale ). In 2018 both the Newport Pell Bridge and the Mt. Hope Bridge were closed for a period following a high-wind event on March 2. The state’s climatologists and the regional National Oceanographic and Atmospheric Administration office reports that temperatures in the state have risen at the rate of 1-degree Fahrenheit every 33 years, that the number of days over 90-degree Fahrenheit has increased, and precipitation and flooding caused by large slow-moving storm systems has increased.58
56 IPCC, 2014: Climate Change 2014: Synthesis Report. Contribution of Working Groups I, II and III to the Fifth Assessment Report of the Intergovernmental Panel on Climate Change [Core Writing Team, R.K. Pachauri and L.A. Meyer (eds.)]. IPCC, Geneva, Switzerland, 151 pp. 57 Rhode Island Hazard Mitigation Plan 2014 Update, Rhode Island Emergency Management Agency, 2014. 58 Overview of a Changing Climate in Rhode Island, Vallee and Guiliano, RI Executive Climate Change Coordinating Council, 2014.
FIGURE 7: SEA-LEVEL CHANGE CURVE CALCULATOR

60
Additional history of climate change related severe weather, hurricanes, flooding, wildfire, drought, are profiled in sections 2.2.1-2.2.5.
2.3 CAPABILITY ASSESSMENT
2.3.1 PLANNING EFFORTS The Town of Middletown employs one full-time Director of Planning and Economic Development and one Principal Planner and GIS Manager in its Department of Planning and Economic Development. Middletown has initiated many studies and activities over the years that have laid the foundation for the development of this mitigation strategy. In 1992, the Town developed its first Comprehensive Plan under the Comprehensive Planning and Land Use Act of 1990. The Comprehensive Plan outlines goals, policies, issues, and actions to provide a framework for future decision making. It also addresses increased development pressures, economic development, open space, recreation, and public services and facilities. The Town recognizes that by incorporating mitigation initiatives (both pre-disaster and post-disaster) into the Comprehensive Plan it would not only benefit the community by reducing human suffering, damages and the cost of recovery, but would also assist in building and maintaining the economic health of the town. The 2014 update of the Hazard Mitigation Plan was included as an appendix to Middletown’s 2014 Comprehensive Plan. When the Comprehensive Plan is updated in 2024, the Hazard Mitigation Plan will be more fully incorporated into the main body of the document.
Middletown implements and enforces the state building code, is a member of the National Flood Insurance Program (NFIP) and participates in the Community Rating System (CRS). Middletown joined the NFIP on April 9, 1971 and became a CRS Community on October 1, 1991. The NFIP is a Federal program enabling property owners in participating communities to purchase insurance as a protection against flood losses in exchange for State and community floodplain management regulations that reduce future flood damages. Participation in the NFIP is based on an agreement between communities and the Federal Government. This insurance is designed to provide an insurance alternative to disaster assistance to reduce the escalating costs of repairing damage to buildings and replacing their contents.
The CRS provides discounts on National Flood Insurance Program (NFIP) premiums in those communities that establish floodplain management programs that go beyond NFIP minimum requirements. Under the CRS, communities receive credit for more restrictive regulations, acquisition, relocation, or flood proofing of flood-prone buildings, preservation of open space, and other measures that reduce flood damages or protect the natural resources and functions of floodplains. Middletown is rated a class 8 on a scale of 10 (with 1 being the best). This rating provides flood insurance policy holders of Middletown property a 10-percent discount on their premiums. The Town has continuously met CRS reporting requirements.
The Aquidneck Island Special Area Management Plan (SAMP) is part of the Rhode Island Coastal Resources Management Council’s (CRMC) ongoing responsibility under the Coastal Zone Management Act (CZMA). It includes the Towns of Portsmouth and Middletown and the City of Newport. The CRMC is empowered by Rhode Island statute §46-23-15 to administer land and water use regulations as necessary to fulfill their responsibilities under the Federal CZMA (16 U.S.C. §1451). The Aquidneck Island Special Area Management plan provides guidance for projects located within the CRMC jurisdiction located either on a coastal shoreline feature or the 200-foot contiguous area adjacent to a coastal shoreline feature to

61
ensure compliance with the Coastal Resources Management Plan. The policies also include provisions for implementing a coastal greenway in lieu of a standard CRMC buffer. Middletown has collaborated with the City of Newport, the Rhode Island Department of Environmental Management, and the Aquidneck Land Trust to protect open space, including flood prone areas.
2.3.2 EMERGENCY MANAGEMENT Middletown revised its Emergency Operations Plan (EOP) in July 2017. The plan details the Town’s responsibilities and actions in the event of an extraordinary emergency situation associated with natural, man-made and technological disasters. The hazards identified in the EOP have been reviewed, assessed, and prioritized so they may be linked to mitigation actions identified in this plan. Middletown’s EOP offers pre- and post-disaster strategies and measures designed to utilize emergency response organizations for protection of Middletown’s population and infrastructure, thus reducing the loss of life and limiting damage to private and public property.
Middletown has identified two Red Cross approved emergency mass care facilities. The total mass care facility evacuation capacity is 588. The facilities can shelter (sleep) 294 people. According to FEMA, in the event of a natural disaster, twenty percent of an evacuated population will seek public mass care facilities. In Middletown that translates to 3,230 people based on the 2010 population. In the event of overcrowding at the designated mass care facilities, Middletown will utilize the Forest Avenue School and the Aquidneck School. Middletown also has agreements with nursing homes in town to shelter elderly evacuees.
The ARC mass care facilities in Middletown are:
• GAUDET MIDDLE SCHOOL (PRIMARY FACILITY WITH GENERATOR) • MIDDLETOWN HIGH SCHOOL (SECONDARY FACILITY WITH GENERATOR)
Middletown looks for opportunities to improve their other essential services and critical facilities. Based on findings from a mass care facility inspection, the fire alarm systems in Gaudet Middle School and Middletown High School were upgraded and air conditioning was installed in Gaudet Middle School.
The fire department received an Assistance to Firefighters Grant in 2010 to upgrade its radio communications system. Redundancy was added by outfitting all apparatus with 800 MHz radio equipment. A new base station radio system was also installed that provides a second dispatch control area for use during major events. The ability to replay radio and emergency phone conversations as well as archiving of these records was also added as part of this grant.
The police department recently upgraded its radio antennae at its Valley Road headquarters to provide better coverage. Communication redundancy was added by outfitting all police vehicles with 800 MHz radio equipment. A new base station radio system provides a second dispatch control area for use during major events. All radio and emergency phone conversations are archived and can be replayed.
RIEMA is currently in the processes of creating an East Bay Zone for the Rhode Island Statewide Communication Network (RISCON) 800 MHz radio system. At present the RISCON system has 3 zones and due to the increased volume of radio traffic on the RISCON system extra capacity is necessary. RIEMA

62
has received funding from the General Assembly to build out an additional 10 channel zone for the East Bay. This extra zone will provide additional voice capacity as well as improved coverage in the East Bay and South zones for the police and fire departments in Middletown. Infrastructure upgrades have been completed and the next step is reprogramming all of the 800 Mhz radios in the State. Anticipated completion of the upgrade for the East Bay is Spring of 2019.
Middletown conducts public education programs each year. The fire department conducts fire prevention and fire extinguisher training for local schools, group homes, nursing homes and businesses. The police department implements ALICE training and exercise drills for local schools and businesses designed to prepare people for the possibility of an active-shooter situation. The police and fire departments are in the process of coordinating their response to such situations with local schools. The police department has developed an active shooter plan and has procedures in place to manage bomb threats.
The police and fire departments continue to encourage people to download the Code RED app, which allows the Town to send emergency notifications to nearby cell phones. It also encourages people to sign up for the Rhode Island Special Needs Registry, a State program for people with disabilities, chronic conditions, and other special healthcare needs. The system is designed to identify individuals who require special assistance during emergencies and allows first responders to appropriately plan for and respond to the needs of the community.
2.3.3 GIS CAPABILITIES The Town of Middletown began implementing its Geographic Information System (GIS) in 2003. In 2004, the Town was awarded a Homeland Security Grant to conduct a town-wide Aerial Base Mapping Project. Data developed included the following GIS layers: building footprints, roads, parking areas, sidewalks, hydrography, infrastructure, railroad lines and 2-foot contours. High resolution large-scale color aerial photography was also obtained.
In 2006, a digital parcels base was developed that depicted the information shown on the hard copy Tax Assessor maps. In Fall of 2007, the Town contracted to digitally map and inspect the Town’s 80-mile sewer system and storm water outfalls. Additional GIS information such as canvassing districts, fire hydrants, open space and zoning have been developed in-house by Town personnel. Other geospatial data utilized in town mapping and analysis is provided by the Rhode Island Geographic Information System (RIGIS).

63
In 2012, the Town launched an online WebGIS to provide the public with access to the Town’s GIS data in an interactive way allowing them to produce customized maps. Base maps include topography, aerial photography, and property boundaries. Dozens of GIS data layers are available to view on top of the base maps including flood zones, hurricane inundation layers, building footprints, fire hydrants, sewers, etc. The Town’s WebGIS can be utilized to quickly determine if a property and its structures are within a flood zone (see Figure 8). Original FEMA flood maps are available for download on the Town’s Planning Department webpage.
Building and maintaining the Town’s GIS is an ongoing process. The Department of Planning and Economic Development includes a GIS Manager who is responsible for the implementation of the GIS throughout many of the Town’s Departments.
2.3.4 PUBLIC WORKS Middletown coordinates snow removal efforts with the State Department of Transportation (RIDOT), to clear the state roads in town during snow emergencies. The Town runs a tree trimming program to help reduce storm debris and damage to utility lines. The Town has developed a debris removal standard operating procedure for storm related debris.
2.3.5 NATIONAL GRID National Grid is the gas and electric utility for Aquidneck Island. The utility’s On-Island Project includes a number of hazard mitigation efforts. An on-going tree trimming program reduces the risk of power
FIGURE 8: IMAGE FROM TOWN'S WEB-GIS

64
outages due to limbs or trees falling on power lines. A project to replace the island’s gas mains increases their resiliency to earthquakes because the new pipes are more flexible. Wire upgrades along Boulevard reduced the risk of power outages by grouping three formerly individual wires into one insulated bundle. The Aquidneck Island Reliability Project or “OnIsland” project, invested $93 Million to improve the electrical infrastructure on Aquidneck island and eliminated substations in flood zones making the electrical network less vulnerable. Many wires and poles were replaced in association with the substation project and are more durable than their predecessors.
2.3.6 MODELING TOOLS Middletown has access to and uses modeling tools to assess risks associated with some of the most severe natural hazards. FEMA developed HURREVAC, a hurricane modeling tool, to assist communities in tracking hurricanes, assessing the impact on the community and planning evacuation or other activities in advance of the approaching storm. HURREVAC is used in Middletown and town emergency personnel have received training. SLOSH is a widely used inundation model used by federal agencies to determine the potential for storm surge. The National Hurricane Center developed a SLOSH model for Narragansett Bay using the bathymetry of the Bay and the topography of coastal Rhode Island to predict the coastal flooding effect from hurricanes that could be experienced in the region. The SLOSH model is used to delineate hurricane evacuation zones. These areas are based on the storm surge that can be expected given a hurricane’s category and forward wind speed. SLOSH is available at the Rhode Island Emergency Management Agency and in case of need, Middletown will rely on RIEMA for assistance. FEMA has a software package called HAZUS that is used to help assess the risk from earthquakes, floods, hurricanes, and tsunamis. Information in this database includes building materials, design levels, economic value, population and bridges. This software allows the user to input a scenario to predict the damages that can be expected based on the intensity and location. The state is now working on compiling more state-specific datasets for use with this software program that would supplement the generic Northeast states information that is currently used. Without locally specific data on such things as transportation systems, utility systems, hazardous materials, demographics, vehicles inventory, building stock and essential facilities, it is difficult to achieve an accurate risk assessment using this software. HAZUS is available at the Rhode Island Emergency Management Agency and in case of need, Middletown will rely on RIEMA for assistance.
3.0 ASSESSING VULNERABILITY Vulnerability indicates what is likely to be damaged by the identified hazards and how severe that damage could be. This section focuses on Middletown’s vulnerable areas regarding the identified hazards, what is at risk in these areas (structures, population, natural resources) and what the impacts will be (loss of life, environmental damage, inconvenience to residents.) The Risk Assessment Matrix (Table 13) summarizes the major vulnerable areas in Middletown. This section also looks at Middletown’s population at risk, the potential economic losses and future development trends.

65
The Town of Middletown created maps portraying parcels impact by floods, hazard areas and vulnerable populations, and dam failure extents, shown in Appendix D: Maps.
3.1 SEVERE WEATHER Middletown rates its vulnerability to severe weather as medium. Middletown’s location on Narragansett Bay makes it less vulnerable to severe winter storms than more inland areas of the state. However, nor’easters and severe snow/ice storms do occur and impact essential services and transportation and electrical infrastructure. Severe storms may result in school and business closings, major transportation problems, power outages, flooding and loss of life. Occasionally the beach areas experience minor erosion due to severe weather. The Rhode Island Turnpike and Bridge Authority restricts travel on the Pell/Newport and Mount Hope bridges when winds reach 57.5 mph and considers closing the bridges when winds reach 69 mph.
3.1.1 TORNADOS Middletown rates its vulnerability to tornados as high. Though tornados have been rare in Middletown, there is a high probability that tornados would cause significant damage to the built environment including buildings, infrastructure, and critical facilities.
Transportation and electrical systems are highly vulnerable to tornados. Disruption to these systems may limit businesses’ abilities to operate normally. Businesses may be forced to close temporarily due to lack of power or access to roads and deliveries. Small businesses are particularly vulnerable to temporary closures and property damage. Road closures could also isolate neighborhoods and limit the arrival of services and supplies.
Given the short warning time for tornados and their town-wide reach, all people are equally vulnerable to tornados in Middletown. There is not much data about how tornados effect the natural environment, but vegetation, soil, and wildlife within the path of a tornado will be severely impacted or destroyed.
3.2 HURRICANES AND TROPICAL STORMS Middletown rates its overall vulnerability to hurricanes as medium. Coddington Cove, the Atlantic Beach District, Easton’s Point, Sachuest Point, Sachuest Campground, and Third Beach are all vulnerable to hurricane storm surge. The Wave Avenue sewer pumping station is within the 100-year flood zone and the Paradise Ave. Pump Station is vulnerable to a 500-year flood. If the Wave Avenue station flooded, sewage would discharge into a sensitive coastal area around First Beach and into local streets. Mitigation actions have been taken to reduce the likelihood of such an event. The station’s equipment has been raised to the 2010 FEMA standard for a 100-year flood and the building has been dry floodproofed via replacement doors. If the Paradise Avenue station flooded, sewage would discharge into sensitive wetland areas around Second Beach and into swimming inlets.
Mobile home residents and visitors in recreational vehicles at the town’s campground are vulnerable to hurricane winds. In 2017, the Town raised the campground connector road between Sachuest Point Road and Third Beach Road by 30 inches, increasing the Town’s ability to evacuate the campground as a storm approaches. The town also recently developed a campground evacuation procedure. The Rhode Island Turnpike and Bridge Authority restricts travel on the Pell/Newport and Mount Hope bridges when winds

66
are 57.5 mph and considers closing the bridges when winds reach 69 mph. Any restrictions or closures would affect Middletown evacuation efforts. Public Safety buildings are not located in flood zones and are not overly vulnerable to hurricanes.
Fictional Scenario
For the 2014 Hazard Mitigation Plan update, a sample storm event was drafted for planning purposes including the Town’s preparation for debris generation after a hurricane, and for HAZUS modeling. The following scenario, shown in Figure 9 was used:
FIGURE 9: WORST-CASE HURRICANE SCENARIO
A large hurricane develops in the far eastern Atlantic, near the Cape Verde Islands in late summer. It moves west across the Atlantic and turns north on the 8th day accelerating up the Eastern Seaboard at 60 mph on a track that would bring it directly over Narragansett, Rhode Island. This hurricane is a strong Category 3 storm. The center makes landfall at the time of astronomical high tide, moving north. The track of the storm takes it approximately 10-15 miles west of Middletown, almost the same track of the Hurricane of 1938. The map below depicts the 1938 Hurricane, which is also the track used in this Hazard Mitigation Plan update.
Given the fictional scenario described above, the town could expect impacts similar to those described in Table 10 below.
Legend --- 1938 Hurricane Track --- Hurricane Scenario Track

67
TABLE 10: EXPECTED BUILDING DAMAGE BY OCCUPANCY
Occupancy None Minor Moderate Severe Destruction Count % Count % Count % Count % Count % Agriculture 8 25.29 10 32.42 7 23.37 4 14.98 1 3.93 Commercial 114 30.50 99 26.34 104 27.86 57 15.15 1 0.15 Education 5 29.52 4 25.13 5 28.38 3 16.96 0 0.01 Government 2 31.64 2 24.01 2 27.98 1 16.38 0 0.00 Industrial 29 29.43 22 23.04 27 28.21 18 18.59 1 0.73 Religion 7 31.87 7 31.30 6 25.30 3 11.51 0 0.01 Residential 2,030 30.84 2,426 36.85 1,466 22.26 378 5.74 284 4.31 Total 2,195 2,569 1,616 464 286
HAZUS
3.3 FLOODING
3.3.1 Storm Surge and Riverine Flooding Middletown rates its overall vulnerability to flooding as medium. FEMA’s flood maps identify A, V, and X flood zones in Middletown. A zones would be inundated by an one-hundred-year flood event. V zones would be inundated by a one-hundred-year flood event and would be subject to velocity wave impact. X zones would be inundated by a 500-year flood event. Middletown’s coastal areas – especially the Atlantic Beach District – are vulnerable to storm surge flooding, while areas near Bailey Brook, the Maidford River, and Paradise Brook are vulnerable to riverine flooding from heavy rain events. Historically, flood-prone areas in the town include Berkeley Avenue, Hanging Rock Road, Third Beach, Wood Road, and the Atlantic Beach District.
The Wave Avenue sewer pumping station is within the 100-year flood zone and the Paradise Ave station is vulnerable to a 500-year flood. If the Wave Avenue station flooded, sewage would discharge into a sensitive coastal area around Easton’s Beach and into local streets. Mitigation actions have been taken to reduce the likelihood of such an event. The station’s equipment and generator have been raised to the 2010 FEMA standard for a 100-year flood and the building has been dry floodproofed via replacement doors. If the Paradise Avenue station flooded, sewage would discharge into sensitive wetland areas around Sachuest Beach and into swimming inlets.
A 100-year flood of Bailey Brook, the Maidford River, or Paradise Brook would cause pollution of the water supply. A 100-year riverine flood or surge event would flood sensitive wetlands and evacuation routes, cause property damage, and could result in deaths. Flooding can also disrupt local businesses. Following the 2010 flood in Warwick, businesses closed for months while damaged structures were repaired or replaced.
As seen in Table 11, FEMA estimated that the value of property insured by the NFIP in Middletown is $38,704,700 as of October 31, 2018. Currently, there are three repetitive loss buildings in Middletown, all three are currently residential structures.

68
TABLE 11: SUMMARY OF NATIONAL FLOOD INSURANCE PROGRAM ACTIVITY IN MIDDLETOWN
Total Policies*
Value of Property Covered
Policies in V-Zone**
Policies in A-Zone
Claims Since 1978
110
$38,704,700
3
28
51***
*Data as of October 31, 2018 from the Risk & Hazards Planner/Mapping Coordinator, RIEMA ** V-zone refers to the velocity zone, where waves greater than 2.9 feet are feasible during a 100-year flood. A-zone refers to other areas within the 100-year flood zone with less than 2.9-foot waves (FEMA, 1997). ***While 51 claims have been made by policy holders, only 31 have been paid. The difference has either yet to be paid or were denied by FEMA.
The Town of Middletown is a participant in the National Flood Insurance Program’s (NFIP) Community Rating System (CRS). CRS is a voluntary incentive program that recognizes and encourages community floodplain management activities that exceed the minimum NFIP requirements. Middletown currently holds a score of an 8, which entitles its residents in a Special Flood Hazard Area (SFHA) to a 10% premium reduction on their flood insurance and those residents outside of an SFHA to a 5% premium reduction. 59 The Town has found benefit by participating in the CRS program because it has allowed employees to better educate residents on flood risks while also saving them money.
FEMA updated the Digital Flood Insurance Rate Maps (DFIRMs) for Newport County on April 5, 2010. Amendments to Section 4.7 (Special Flood Hazard Area Overlay District) were voted on and approved at the April 5, 2010 Town Council meeting. These amendments included the reference to the April 5, 2010 DFIRMS. FEMA made further updates to the DFIRMs on September 4, 2013. As a result of recent coastal hazard analyses and mapping by FEMA, flood zone designations changed in many locations along the shoreline. In some cases, property not previously designated as being in a Special Flood Hazard Area (100-year floodplain) was designated as being in a SFHA on the revised maps. In other cases, property was removed from the SFHA. The Town mailed notifications to property owners impacted by the changes.
3.3.2 Dam Failure Middletown rates its overall vulnerability to dam failure as low. Gardiner Pond and Nelson Pond, two reservoirs owned by the City of Newport, are located across from Second Beach on Sachuest Road. There is an eight-foot earthen retaining wall around each reservoir totaling approximately two miles in length. Each reservoir has a high-hazard dam, meaning that failure or inappropriate operation of the dam will result in a probable loss of human life. 60 This is especially likely if the Gardiner Pond dam failed while the
59 Federal Emergency Management Agency, “National Flood Insurance Program Community Rating System.” 60 RIDEM Office of Compliance and Inspection, “2017 Annual Report to the Governor on the Activities of the Dam Safety Program,” April 6, 2018

69
Second Beach parking lot and campground were occupied. See Parcels Impacted by Flood Zones - Appendix D for a map showing the dam failure locations.
The City of Newport was issued a Notice of Violation (NOV) from the RIDEM Dam Safety Program for each dam in April 2016. According to the NOV, the dams are considered unsafe due to the presence of vegetation growing on their embankments that inhibit proper inspection. Additionally, the Nelson Pond Dam may be unsafe because of a deteriorated auxiliary spillway, while the Gardiner Pond Dam may be unsafe due to suspected erosion along the toe of the embankment adjacent to Maidford Brook. According to staff from the RIDEM Dam Safety Program, the City of Newport is working towards compliance, but the dams’ statuses remain unchanged since issuance of the NOV. While these dams are categorized as unsafe based on the definitions in the State’s dam safety regulations, that categorization is not indicative of an imminent dam failure.
Besides possible loss of life, failure of the retaining walls or dams would mean the loss and/or contamination of valuable drinking water for the City of Newport and Town of Middletown and the flooding of roads, sensitive marshland, and the Second Beach area. In Spring 2017, the pathways that cross the dunes at Second Beach were raised to 12 feet above sea level and angled to mitigate damage from storm surge to the beach building, parking lot, and campground and the retaining walls and dams at Gardiner Pond and Nelson Pond. This action reduces the likelihood of a dam failure occurring.
The Easton’s Pond North Dam is another high-hazard dam located in Middletown. The City of Newport, the dam’s owner, was issued a NOV by the RIDEM Dam Safety Program for the dam in April 2016.61 The dam is considered unsafe because of vegetation that inhibits a proper inspection and because of vegetation that may inhibit flow, according to the NOV. Further, the dam may be unsafe because of its deteriorated primary and auxiliary spillways. The status of the dam remains unchanged since the issuance of the NOV, but the City of Newport is working towards compliance. Again, categorization as “unsafe” under the dam safety regulations is not indicative of imminent dam failure, according to RIDEM Dam Safety Program staff. A failure of the Easton’s Pond North Dam could result in loss of life at first beach and in the Atlantic Beach District, the damage to Wave Ave Pump Station and Memorial Blvd/Aquidneck Ave bridge to the south of the pond, and disruption to businesses and tourism in the Atlantic Beach District.
According to the City of Newport most of the vegetation had been cleared from the dams as of February 2019. Stabilization efforts are underway at Nelsons Pond Dam and Easton’s Pond North Dam.62
There are three other low hazards dams in Middletown (Wanumetonomy Pond Dam and Prescott Farm Dam, and Newport Memorial Cemetery Dam). Failure of these dams would result in no probable loss of human life and low economic losses. 63, 64
61 RIDEM Office of Compliance and Inspection, “2017 Annual Report to the Governor on the Activities of the Dam Safety Program,” April 6, 2018 62 City of Newport, Department of Utilities letter to RIDEM Dam Safety Program, “Re: Dam State I.D. Numbers 395, 396, 485, 580, 581, 582, 583, 584 and 585,” February 25, 2019 63 RIDEM Office of Compliance and Inspection, “2017 Annual Report to the Governor on the Activities of the Dam Safety Program,” April 6, 2018 64 RIDEM Office of Compliance and Inspection, “2016 Dam Safety Annual Report Attachment,” accessed January 18, 2019

70
3.4 WILDFIRE AND CONFLAGRATION Middletown rates its overall vulnerability to conflagration as low. There are few significant forested areas or compact residential or commercial areas in town. The marsh/brush area around Second/Sachuest and Third Beach is vulnerable; a conflagration in this area would pose a medium threat to life and limited threat to the structures adjacent to the wildlife protection areas. According to the State of Rhode Island Hazard Identification and Risk Assessment, the area just north of Sachuest near the Norman Bird Sanctuary is the only part of town where there is significant intermingling of housing and vegetation, which creates an environment in which fire can move readily between structural and vegetation fuels, as shown in Figure 10: Wildfire - Areas of Concern.
FIGURE 10: WILDFIRE - AREAS OF CONCERN
RI Hazard Mitigation Plan 2017
3.5 DROUGHT Middletown rates its overall vulnerability to drought as low. In more developed areas of Middletown, drought impacts may be dominated by economic losses and possible potable water shortages. In the more rural areas, drought can cause a strain on crops, livestock, and potable water wells. According to the 2012 Economic Impact Study of Rhode Island Plant-Based Industries and Agriculture, the sector contributes $1.78 billion and 12,372 jobs to the Rhode Island economy, accounting for approximately 3% of the state’s total economy. Middletown, with its nurseries, vineyards, farms, and related businesses

71
stands to be significantly impacted should a prolonged drought disrupt agricultural and other plant-based industries.65
3.6 GEOLOGIC HAZARDS - EARTHQUAKES Middletown rates its overall vulnerability to earthquakes as low. Earthquakes with the magnitude to cause significant damage to occur extremely rarely in New England. A magnitude 6 earthquake can be expected once every 1,000 years in New England.66 The probability that such an earthquake strikes near Middletown specifically is even less. Should an earthquake strike, urbanized areas of the town will likely sustain more damage than less densely developed areas. Areas constructed on fill are also likely to sustain more damage than other areas of the town.
3.7 HAZARDOUS MATERIALS Middletown rates its overall vulnerability to hazardous materials as high. There are numerous sites in Middletown that contain sizable amounts of Tier II hazardous materials. Fortunately, the stringent regulations for handling, storage, transport, and recording of Tier II hazardous materials and related facilities limit the vulnerabilities.
The built environment is vulnerable to a hazardous materials spill. The combination of fire, water and chemicals could result in an explosion that is likely to damage both the buildings storing hazardous materials and neighboring buildings. A hazardous materials spill anywhere along Middletown’s transportation network will have an immediate impact on travel time. A flammable material that explodes would cause significant damage to the roads, bridges, and electrical infrastructure. Factors contributing to the vulnerability of natural systems are the type of chemical spilled, the physical state of the chemical, the amount released, and the location of the incident. Vulnerability of the natural environment to hazardous materials events is higher for species and ecosystems in the immediate vicinity of the event, and moderate for those located downstream. Municipal water systems and stormwater drainage systems are vulnerable to a toxic spill. Chemicals that reach the water system could limit the supply of potable water. Toxic spills that enter a stormwater drainage system may feed directly into local rivers or into the groundwater. Human health and life are also vulnerable to hazardous materials spills. Populations near a spill will be particularly vulnerable. Over time, non-point source hazards may accumulate and pose a threat to the natural environment; however, the lack of data on non-point source hazards makes it difficult to justify a significant vulnerability.
3.8 TERRORIST EVENTS Middletown rates its overall vulnerability to terrorist events as medium. There is no defined geographic boundary for a terrorist event. All populations, buildings, critical facilities, infrastructure and hazardous materials facilities are considered exposed to the hazards of terrorism and could potentially be impacted. However, having Department of Navy lands and activities in Middletown could make the town more vulnerable.
65 Thomas Sproul and Brandon Elsner, “Economic Impact Study of Rhode Island Plant-Based Industries and Agriculture,” URI, January 2013 66 Matt Rocheleau, Boston Globe, “Major quake expected in N.E. once every 1,000 years,” July, 23, 2015.
72
3.9 POPULATION AT RISK According to FEMA, in the event of a natural disaster that requires mass care facilities, twenty percent of an evacuated population will seek public mass care facilities. Currently, Middletown can provide mass care for approximately 588 people in the event of a natural disaster, which is only 3.6% of Middletown’s 2010 population of 16,150. This could result in a deficit of mass care spaces for the town in the case of wide-spread evacuation. Middletown will open Forest Avenue School and the Aquidneck School for mass care in the event of overcrowding at the designated mass care facilities. Middletown has established evacuation routes and has posted evacuation signs that can be utilized for either Town-wide evacuations or localized evacuations.
The Town of Middletown, like all towns, has a variety of vulnerable populations. These include, but are not limited to, children and the elderly, and people with low-incomes, mental and physical disabilities, and illnesses. It is important to consider these vulnerable populations during the hazard mitigation planning process. The Town has mapped facilities with known vulnerable populations, such as group homes, schools, and day programs and overlaid those facilities with mappable hazard areas, such as flood, dam failure, and hazardous material event zones to determine which facilities are in danger from which hazardous events (see Appendix D for a map on Vulnerable Populations). The Town also helps ensure the safety of its vulnerable populations by making use of the RI Department of Health’s Special Needs Registry. This voluntary registry is for people with disabilities, chronic conditions and other special healthcare needs. The Town downloads an updated copy of this list in preparation for or during hazard events and emergency management staff call each impacted individual on the list to ensure they are safe. The Town’s Fire Department web page (http://fire.middletownri.com/middletown-emergency-management) includes instructions on how to sign up for the registry.
Although Middletown experienced a small population decline from 2000 to 2010, there is some residential and commercial development occurring in town. New development occurring within the 100-year flood zone is required to meet rigorous standards to mitigate the impact of natural hazards. Hotels and new commercial development within the Atlantic Beach District, for example have been elevated or floodproofed. That said, many of the approximately 67 commercial and residential structures located in the flood zone are of older stock and at greater risk from hazards. Ninety-two parcels in Middletown would be greater than 50% inundated by a 100-year flood, 69 of which would be greater than 75% impacted.
Table 12: Vulnerability to Mappable Hazards, identifies the number of town-wide structures at risk from various mappable hazards. It also identifies the number of vulnerable people impacted by the hazards and the facilities that serve them.

73
TABLE 12: VULNERABILITY TO MAPPABLE HAZARDS
Based on GIS analysis using RIGIS, Town, and RIDOH data. See Appendix D: Maps.
Note: “Structures” include all e-911 structures, so may include sheds, uninhabited buildings, etc.
The proposed mitigation actions identified in this plan will not only address the current needs of the town’s residents in the event of a natural disaster but also the future needs of the town based on demographic data and population projections.
3.10 POTENTIAL LOSSES TO THE LOCAL ECONOMY According to Middletown’s Finance Department, the general fund budget for FY2019 for Middletown is $72.3 million and the local Tax Assessor reports that approximately $44.40 million comes from real estate taxes ($32.1 million in residential taxes and $12.3 million commercial taxes). The destruction or reduction in assessed value of taxable properties due to natural hazards is a threat to the town’s budgetary needs. In the Atlantic Beach District alone, 28 residential and commercial properties that would be at least 75% inundated by a 100-year flood account for approximately $42 million in assessed value and $750 thousand dollars in property tax revenue (based on 2018 rates) or 1.7% of the entire town’s real estate tax revenue. The value of these properties to the town will only increase over time as redevelopment and public improvements continue in this area.
As seen in Table 11: Summary of National Flood Insurance Program Activity in Middletown, FEMA estimated that the value of property insured by the NFIP in Middletown is $38,704,700. Severe weather, hurricanes, flooding, conflagration and earthquakes could negatively impact the local tourism economy and hurt many local businesses, furthering the community’s loss. The U.S. Navy is the largest employer in Middletown. Damage to Navy facilities and any local companies that contract with the Navy could have a significantly disruptive impact on the local economy.

74
3.11 CLIMATE CHANGE Climate change will generally increase Middletown’s vulnerability to natural hazards. Although the state is working to significantly reduce its contributions to sources of climate change, some impacts may not be prevented. For Middletown, expected changes include:
• Hotter, drier summers • Wetter winters with increasing rain intensity • Increases in weather extremes • Increased chance of wildland/urban interface fires, heat waves, insect infestation, drought,
potable water shortages, flooding, erosion and landslides. • Sea level rise which intensifies tidal events during storms
3.11.1 Sea Level Rise and Storm Surge
Sea level in Newport has increased more than 9 inches since 1930. Sea level rise is accelerating globally and accelerating at a greater-than-average rate along much of the East Coast of the United States, including along Rhode Island’s coastline.67 In 2017, CRMC adopted the latest sea level rise projections from the National Oceanic and Atmospheric Administration that project a worst-case scenario of 11.5 feet of sea level rise along the Rhode Island coast by 2100.68 Sea level rise can cause coastal flooding and impact existing infrastructure. Some locations in Rhode Island, including Watch Hill in Westerly and Wickford Village in North Kingstown are already experiencing sunny-day flooding during regularly occurring extreme high tides. In both cases, seawater is entering drainage infrastructure at its outfalls and working its way backward through the system to flood parking lots. In Middletown, the CRMC right-of-way next to Dunlap-Wheeler Park experiences extreme tide flooding. At about five feet of sea level rise, parcels along Wave Ave. in the Atlantic Beach District will begin to be impacted. That said, impacts could happen sooner during extreme high tides or minor to moderate storm surge events coupled with 1 to 4 feet of sea level rise. Three to five feet of sea level rise will inundate much of Second Beach, Third Beach, parts of the Norman Bird Sanctuary, lands adjacent to Nelson Pond and Gardiner Pond owned by the Newport City Water Department, and Sandy Point Beach.69 Sea level rise also amplifies the effect of storm surge. Just as storm surge is more impactful if it arrives during a high tide cycle, it is also more impactful if the baseline sea level is higher. Experts suggest that damages in New York City during Superstorm Sandy would not have been as widespread if the storm
67 RI Executive Climate Change Coordinating Council – Science and Technical Advisory Board, “Current State of Climate Science in Rhode Island,” May 1, 2016. 68 R.I. Coastal Resources Management Council, “New NOAA sea level rise projectsions dramatically increase by 2100,” February 22, 2017. 69 R.I. Coastal Resources Management Council, “STORMTOOLS for Beginners,” accessed December 2018

75
surge had not been riding on top of elevated sea levels.70 Already, storm surge from a 100-year storm will inundate a significant portion of the Atlantic Beach District and Sachuest including lands surrounding the capped landfill near Second Beach and adjacent to Nelson Pond and Gardiner Pond owned by the Newport City Water Department. Figure 11: Coastal Inundation with Sea Level Rise, shows the areas in Middletown projected to be impacted by 25-year-storms with 1 foot of Sea Level Rise and by 100-year-storms with 3 feet of Sea Level Rise. Also noted are the evacuation roads that will be impacted.71
FIGURE 11: COASTAL INUNDATION WITH SEA LEVEL RISE (COASTAL RESOURCES CENTER, 2017)
70 Brian Kahn, “Superstom Sandy and Sea Level Rise,” NOAA, November 5, 2012. 71 (Coastal Resources Center, 2017)

76
3.11.2 Heat and Drought
According to the NOAA National Centers for Environmental Information, “Temperatures in Rhode Island have risen by more than three degrees F since the beginning of the 20th century, the number of hot days, [days above 90 degrees F] has been above the long-term average since the mid-1990s.” The five-year period between 2010 and 2014 had more hot days than any period on record (see Figure 12).72 Human health risks rise dramatically when temperatures top 80 degrees F due to asthma events and heat-related cardio-respiratory problems.73 Heatwaves are projected to become more intense and result in more deaths, especially in urbanized areas.74 The elderly, children, immigrants, and the poor are most vulnerable to the impacts of heat waves. 75
FIGURE 12: 5-YEAR AVERAGE OBSERVED HOT DAYS, RHODE ISLAND
Figure 12 depicts the observed number of hot days (annual number of days with maximum temperature above 90°F) for 1950–2014, averaged over 5-year periods, at Kingston, RI. The number of hot days has been above average since the mid-1990s. The highest number of such days occurred in the most recent 5-year period (2010–2014), with an average of 11 hot days occurring each year.76 Infrastructure is also impacted by higher temperatures. Increased electrical demand due to air conditioner use coupled with lower performance in power generation and transmission when temperatures reach 90 degrees F increases the risk of electrical grid failure. Rail systems are also sensitive to temperatures above 90 degrees F. 77
72 NOAA National Centers for Environmental Information, “State Summaries 149-RI” 2014. 73 RI Executive Climate Change Coordinating Council – Science and Technical Advisory Board, “Current State of Climate Science in Rhode Island,” May 1, 2016. 74 NOAA National Centers for Environmental Information, “State Summaries 149-RI” 2014. 75 RI Executive Climate Change Coordinating Council – Science and Technical Advisory Board, “Current State of Climate Science in Rhode Island,” May 1, 2016. 76 NOAA National Centers for Environmental Information, “State Summaries 149-RI” 2014. 77 RI Executive Climate Change Coordinating Council – Science and Technical Advisory Board, “Current State of Climate Science in Rhode Island,” May 1, 2016.
Ave
rage
Num
ber o
f Day
s

77
Higher temperatures are likely to cause more frequent and severe droughts. Drought can strain farming operations including Middletown’s agriculture and nursery businesses. Further, Aquidneck Island depends on shallow ground-water wells and shallow surface reservoirs which can run low during droughts.78 Drought also increases the risk of wild fire.
3.11.3 Precipitation and Flooding
Mean annual precipitation and the number of extreme precipitation events are both projected to continue their upward trajectory. Most of the additional precipitation is expected to come in the winter and spring79 and/or during heavier rain events and will exacerbate the risk of flooding. During the past 80 years, Rhode Island has experienced a doubling of flood frequency and an increase of flood magnitude (see Figure 13). 80 Flooding puts human life, private and public property, infrastructure, and the transportation system at risk. In Middletown, approximately 42 non-open-space parcels would be more than 50 percent inundated during a 100-year riverine flood according to FEMA’s flood maps. Climate change is increasing the likelihood of a 100-year event, putting these parcels and the people on them at greater risk. With more rain falling during heavy precipitation events, properties once thought to be safe from flooding may become vulnerable as the flood zone expands.
78 RI Executive Climate Change Coordinating Council – Science and Technical Advisory Board, “Current State of Climate Science in Rhode Island,” May 1, 2016. 79 NOAA National Centers for Environmental Information, “State Summaries 149-RI” 2014. 80 RI Executive Climate Change Coordinating Council – Science and Technical Advisory Board, “Current State of Climate Science in Rhode Island,” May 1, 2016.

78
FIGURE 13: OBSERVED ANNUAL PRECIPITATION, RHODE ISLAND
Observed annual precipitation averaged over 5-year periods has been above the long-term average (dark horizontal line) since the five-year period from 1970-1974. The wettest 5-year period on record occurred between 2005 and 2009 with an estimated 54 inches of annual precipitation. 81
3.11.4 Hurricanes and Severe Weather In the Atlantic Basin, tropical storms and hurricanes are projected to decrease in number, but the number of Category 4 and 5 storms are projected to increase dramatically. Extra-tropical storms, such as nor’easters, are projected to increase in frequency and intensity.82 In addition to concerns about storm surge and flooding, these storms can bring wind, snow, and ice that can knock out power and make evacuation challenging. Concerns range from loss of heat during winter months, delayed emergency response, closure of schools and businesses following storms, and damage to property and infrastructure.
3.1 RISK ASSESSMENT MATRIX – VULNERABLE AREAS The Local Hazard Mitigation Committee (LHMC) met regularly to discuss the town’s vulnerability to natural hazards, select projects and develop actions that would assist the Town in meetings its mitigation goals. Organization of projects and actions was accomplished by reviewing the identified hazards and special areas, essential services, and critical facilities and infrastructure in Middletown which are at risk. The result of these efforts was the Risk Assessment Matrix (Table 13). Vulnerable areas have been prioritized and ordered as such.
81 NOAA National Centers for Environmental Information, “State Summaries 149-RI” 2014. 82 RI Executive Climate Change Coordinating Council – Science and Technical Advisory Board, “Current State of Climate Science in Rhode Island,” May 1, 2016.
Tota
l Ann
ual P
reci
pita
tion
(inch
es)

TABLE 13: RISK ASSESSMENT MATRIX
Vulnerable Areas
(in order of priority)
Location Ownership Natural Hazard
Primary Problem/Effect Mitigation Objective Risk H -Historical P - Potential
1 Vulnerable Populations • Low-income • Disabled • Elderly • Children
- L-I: Oxbow & Commodore Perry - Disabled: Unity Dr. - Group homes: Anita Jackson House, Jepson Ln, Beacon St, Green End Ave, Beagle Dr, William Dr, Toni Lynn Ter - Day programs: Maher Center & Forest Farm Adult Day Services, - Nursing homes & assisted living - Daycare & schools - People with Special Needs Registry (RIDOH)
Town and Private
Severe weather, wind, hurricane, flooding
- No access to car to evacuate - Unable to evacuate independently - Isolation during power outage or due to roadways being impassible - Health risk due to medical equipment failing during a power outage
- Assist in evacuation Increase public safety - Maintain power and communication during hazards
2 Vulnerable Business Districts
Atlantic Beach District: south of Newport Ave. & Aquidneck Ave.
Private Hurricanes, storm-surge flooding
- Property damage Economic and tourism disruption
- Mitigate damage to properties - Improve business continuity after storms
H, P
3 Critical roads Town: - Berkeley Ave. - Birchwood Rd. - Champlin Terrace - Forest Ave. - Green End Ave. - Oliphant Ln. - Third Beach Rd. - Wave Ave.
Town, State and Federal
Flooding and erosion
- Evacuation and emergency services hindered. - Property, infrastructure and lives at risk
- Increase safety - Decrease damage to structures and infrastructure - Decrease public and private costs of post disaster clean-up
H

- Wood Rd. State: - E. Main Rd./Bailey Brook - E. Main/Wyatt Rd. - Sachuest Pt. Rd. - Wave Ave bridge
4 Hazardous Materials Evacuation Zones
- Anhydrous Ammonia: St. Georges School Ice Rink - Propane: B.J.’s, Newport Propane, Taylor Rental
Private Hazardous Materials Incident
- Explosion could cause property damage and human injury/loss of life - Leak could cause respiratory problems including suffocation
- Mitigate the extent of damage and limit shrapnel/projectiles.
P
5 Wave Ave. Sewage Pump Station
Wave Ave. and Memorial Blvd.
Town Flooding and severe weather
- Overflow, pollution of sensitive coastal area (Easton’s Bay) around First Beach and local streets - fines
- Increase capacity of station and back-up power supply - Decrease costs of clean-up after disaster - Prevent Pollution - Decrease fines
H, P
6 Paradise Ave. Sewage Pump Station
Paradise Ave. at Sachuest Pt. Rd.
Town Flooding and severe weather
- Overflow, pollution of sensitive wetland areas around Second Beach and swimming inlets
- Decrease costs of clean-up after disaster - Prevent Pollution
P
7 Evacuation Route Intersections
East Main Rd at Forest Ave,Valley Rd West Main Rd. at Forest Ave, Valley Rd, Admiral Kalbfus, Coddington Hwy, and East Main Rd Green End Ave at Valley Rd, Aquidneck Ave
State Flooding, hurricane, and severe weather
- Evacuation and emergency services hindered - Lives at risk - Potential loss of traffic signals
- Increase public safety H,P

8
Essential Services Town-wide Town Severe weather, hurricanes and wind
- Downed utility lines, loss of power and communications - Evacuation routes and roads blocked
- Maintain power & communications during - Increase road safety
H,P
9 Maidford River
Watershed extends from East Main Rd. to Sachuest Point and Turner Rd. to Wapping Rd.
Town & private (Water Dept.)
Flooding & erosion
- Flooding of evacuation routes and sensitive wetlands - Pollution of water supply
- Increase public safety - Decrease post-disaster clean-up costs - Decrease pollution to public water supply & flooding of wetlands
H, P
10 Bailey Brook
Watershed extends from Green End Pond to Greene Ln. & from East Main Rd. to Turner Rd.
Town & private (Water Dept.)
Flooding & erosion
- Pollution of water supply - Flooding of sensitive wetlands
- Decrease post-disaster clean-up costs - Decrease pollution to public water supply - Decrease flooding of wetlands
H, P
11 Dams and Reservoirs
- Gardiner Pond Dam and surrounding retaining wall - Nelson Pond Dam and surrounding retaining wall - N. Easton’s Pond Dam
City of Newport
Flooding and hurricane
- Loss of water supply - Flooding of local roads, sensitive wetlands and Second Beach area
- Dam owners notified of maintenance responsibility - Protection of public water supply and low lying areas
P
12 Campgrounds and Trailer Parks
- Sachuest Pt. Campground - Forest Ave. Trailer Park - Mello Trailer Park - Prospect Ave. Trailer Park
Town Flooding, erosion & wind
- Campers not properly anchored
- Increase public safety - Decrease post-disaster clean-up costs
P

13 Recent Development Project Stormwater BMPs
- Island Drive - Overlea Farm - Valley View - Windover Farm - Wave Ave - Aquidneck - Highlands (Julia Ct) - Saltwood Farm - Bay Ridge
Homeowners Associations
Flooding - Overtopping of runoff storage areas
- Decrease personal & property loss - Minimize overtopping
P
14 Shoreline Property - All Shoreline Property along the Atlantic Ocean and Narragansett Bay
Town and Private
Erosion, hurricane, and severe weather
- Property loss due to shoreline erosion.
- Decrease personal & property loss -Increase public safety
H, P
15 Vegetated Wildlife Areas
-Sachuest Point - Norman Bird - Sanctuary, - Albro Woods
Federal, Private, and Town
Wildfire - Habitat loss due to accidental wildfires during drought periods
-maintain public safety -minimize loss to natural habitat
P

83
4.0 MITIGATION ACTIONS The Local Hazard Mitigation Committee (LHMC) in Middletown assessed the risks to the town and developed mitigation actions that include both structural initiatives and nonstructural initiatives to minimize the effect of future hazards. By creating this strategy and incorporating hazard mitigation techniques into the town’s Comprehensive Plan and the site plan review process, Middletown is establishing an ongoing process that will make hazard mitigation a part of municipal government review and consideration.
In completing the risk and vulnerability analysis, the LHMC considered projects and actions that would reduce Middletown’s vulnerability to the identified hazards. The Risk Assessment Matrix is the basis for the mitigation actions presented in Table 13: Risk Assessment Matrix. The LHMC considered the goals of this plan (1.1 MIDDLETOWN’S GOAL AND OBJECTIVES) and prioritized the matrix and the associated actions based on historical damage, safety of the population, property protection, and consistency with town-wide goals and objectives. Objectives were aligned to public health risks, evacuation and mass care considerations, disruption of essential services, and potential economic losses to Middletown.
Once the mitigation actions were identified, the LHMC members were provided with several sets of decision-making tools, including FEMA’s recommended criteria, STAPLE/E (which considers social, technical, administrative, political, legal, economic, and environmental constraints and benefits.)
• Social: Does the measure treat people fairly? • Technical: Will it work? (Does it solve the problem? Is it feasible?) • Administrative: Is there capacity to implement and manage the project? • Political: Who are the stakeholders? Did they get to participate? Is there public
support? Is political leadership willing to support the project? • Legal: Does your organization have the authority to implement? Is it legal? Are there liability
implications? • Economic: Is it cost-beneficial? Is there funding? Does it contribute to the local economy or economic
development? Does it reduce direct property losses or indirect economic losses? • Environmental: Does it comply with environmental regulations or have adverse environmental impacts?
Other criteria used to recommend what actions might be more important, more effective, or more likely to be implemented than another included:
• Does the action protect lives? • Does the action address hazards or areas with the highest risk? • Does the action protect critical facilities, infrastructure or community assets? • Does the action meet multiple objectives (Multiple Objective Management)?
In accordance with the FEMA requirements, an emphasis was placed on the importance of a benefit-cost analysis in determining project priority (the ‘economic’ factor of STAPLE/E.) The LHMC prioritized the vulnerable areas in order of vulnerability which indicated that more damage could be sustained to these areas thus more costs could be incurred by the town in damages and repairs. The mitigation actions identified would maximize the use of funding and reduce loss of people and property. This prioritization also included the mitigation actions that incorporated the NFIP. They are listed in order of priority within the Vulnerable Areas.

84
The LHMC determined that the identified objectives could be met by considering actions aligned to the following:
• Planning and Regulations • Property Protection (including acquisition and elevation), Structural Projects, Maintenance, and Repair • Public Information and Outreach, Incentive Programs • Protection of Essential Services (including critical facilities) • Post Disaster Opportunities
This committee has worked to set goals and objectives that are bound by a time frame and are compatible and consistent with state hazard mitigation goals. Upon submittal of this plan to RIEMA, the State Hazard Mitigation Committee (SHMC) is expected to review and approve these goals and objectives to ensure consistency with statewide goals and objectives. The time frames used for these strategies are as follows:
• Short Term = 0 to 6 Months • Medium Term = 6 to 18 Months • Long Term = 18 Months to 5 Years • Ongoing
The following actions use the Risk Assessment Matrix (Table 13) to identify areas at risk, offer mitigation strategies and consider benefits. Current status of each action is noted since adoption of the previous plan, and if action is “new,” this is indicated. Each action offers a discussion of the project and, if applicable, includes the options considered. Multiple actions associated with a vulnerable area reflect town priorities and are simply prioritized high, medium, or low. Each action is assigned a responsible party to lead with implementation efforts as well as other departments that can offer support. If available, cost estimates are provided, and potential funding options are offered. The action plan is further summarized in Table 14: Action plan summary in section 4.3 ACTION PLAN SUMMARY.
4.1 ACTION PLAN
1 Vulnerable Area: Vulnerable Populations
1.A1. Action – Study the necessity and feasibility of offering buses from low-income neighborhoods to evacuation shelters. If the decision is made to offer this service, then develop an implementation plan
Determine if there is a need to offer transportation for low-income people without vehicles to evacuation shelters during evacuation events. Discuss options with providers including the Rhode Island Public Transit Authority (RIPTA) and Ocean State Transit, the company the Town contracts with for school buses. The Town already has access to school buses during emergencies through its contract with Ocean State Transit.
• ACTION TYPE – PLANNING AND REGULATION • PRE- OR POST-DISASTER – PRE-DISASTER • 2019 PRIORITY – HIGH • CHANGE IN PRIORITY FROM 2014 – 2019 – NEW ACTION • LEAD – EMA • SUPPORTING – TOWN ADMINISTRATOR • FINANCING OPTIONS – STAFF TIME

85
• COST ESTIMATE – STAFF TIME • TIME FRAME – MEDIUM-TERM • BENEFIT – DECREASE RISK OF PEOPLE BECOMING STRANDED DURING AN EVACUATION.
Current Status: This is a new action.
1.A2. Action – Prioritize communicating with individuals who rely on electronic health devices during power outages
The Rhode Island Department of Health maintains a voluntary registry of people with special needs. When a hazard event is impending, Middletown emergency management staff request the current list and contact individuals that have been impacted or are likely to be impacted. Individuals who rely on electronic health devices are at particular risk during power outages. These people can be identified using the registry’s data and should be prioritized on the call list during power outages by emergency management staff. This action will require the coordination of the director of emergency management and GIS manager. The GIS manager should maintain an updated map of the RIDOH registry so that emergency management staff may request a list of people within the outage area, sorted to raise people with electronic health devices to the top of the list.
• ACTION TYPE – PLANNING AND REGULATION • PRE- OR POST-DISASTER – PRE-DISASTER • 2019 PRIORITY – HIGH • CHANGE IN PRIORITY FROM 2014 – 2019 – NEW ACTION • LEAD – EMERGENCY MANAGEMENT (POLICE AND FIRE DEPARTMENT) • SUPPORTING – PLANNING/GIS • FINANCING OPTIONS – STAFF TIME • COST ESTIMATE – STAFF TIME • TIME FRAME – SHORT-TERM • BENEFIT – DECREASE RISK OF PEOPLE WITH SPECIAL NEEDS DURING POWER OUTAGES.
Current Status: This is a new action.
1.A3. Action – Increase efforts to encourage the public to be added to RI Department of Health’s registry of people with special needs and to sign up for Code Red alerts
The Rhode Island Department of Health maintains a voluntary registry of people with special needs. When a hazard event is impending, Middletown emergency management staff request the current list and contact individuals that have been impacted or are likely to be impacted. Unfortunately, this procedure does not assist people with special needs who have not proactively had themselves added to the registry. Emergency management staff should increase its efforts to encourage people with special needs to have themselves added to the registry. Middletown participates in the Code Red alert system which allows the Town to communicate with residents and visitors via a smart phone app in the case of an emergency. The Town should increase its efforts to encourage Middletown residents and visitors to download the Code Red app so emergency notifications have a greater reach. Already, there is information and links to sign up for the registry and Code Red on the Police and Fire Departments’ webpages and awareness is raised via social media. Further, a brochure is being developed about these programs and will be made available at the Police and Fire Departments’ headquarters. Additional measures should be taken, including stocking the brochure at other public locations including Town Hall, public libraries, and schools and

86
creating awareness of the system during existing emergency management speaking events, including school assemblies. The Town could also consider paid advertising, such as on RIPTA buses or on social media platforms.
• ACTION TYPE – PLANNING AND REGULATION • PRE- OR POST-DISASTER – PRE-DISASTER • 2019 PRIORITY – HIGH • CHANGE IN PRIORITY FROM 2006 – 2014 – N/A • CHANGE IN PRIORITY FROM 2014 – 2019 – NEW ACTION • LEAD – EMERGENCY MANAGEMENT (POLICE AND FIRE DEPARTMENT) • FINANCING OPTIONS – BROCHURES: TOWN BUDGET, IMPLEMENTATION: STAFF TIME • COST ESTIMATE – STAFF TIME • TIME FRAME – SHORT-TERM • BENEFIT – DECREASE RISK OF PEOPLE WITH SPECIAL NEEDS AND THE GENERAL PUBLIC DURING EMERGENCIES.
Current Status: This is a new action.
1.A4. Action – Evaluate the possibility of expanding the number of emergency shelter beds available during an evacuation event. –
Determine if it is feasible to expand the number of shelter beds by increasing the sheltering areas managed by the Town and the Rhode Island Red Cross. Discuss options and necessary upgrades with the school department to investigate bringing additional school facilities up to emergency shelter specifications by the Rhode Island Red Cross. Investigate any private facilities with the capacity to serve as an emergency evacuation shelter in the time of need.
• ACTION TYPE – PLANNING AND REGULATION • PRE- OR POST-DISASTER – PRE-DISASTER • 2019 PRIORITY – HIGH • CHANGE IN PRIORITY FROM 2014 – 2019 – NEW ACTION • LEAD – EMA • SUPPORTING – TOWN ADMINISTRATOR • FINANCING OPTIONS – STAFF TIME • COST ESTIMATE – STAFF TIME • TIME FRAME – MEDIUM-TERM • BENEFIT – DECREASE RISK OF PEOPLE BECOMING STRANDED DURING AN EVACUATION.
Current Status: This is a new action.
2. Vulnerable Area: Vulnerable Business Districts 2.A1. Action – Develop incentives for property owners with properties in the flood zone to flood proof
their structures Many properties within the Atlantic Beach District are in the 100-year flood zone. Further, most of the existing structures on these properties are of older stock and vulnerable to flooding. Until each property is redeveloped, these properties will not be required to comply with FEMA standards. To mitigate the impact of flooding in this area, the Town should develop incentives that encourage property owners in the Atlantic Beach District to floodproof their properties.

87
• ACTION TYPE – PLANNING AND REGULATION/INCENTIVE PROGRAMS • PRE- OR POST-DISASTER – PRE-DISASTER • 2019 PRIORITY – MEDIUM • CHANGE IN PRIORITY FROM 2014 – 2019 – NEW ACTION • LEAD – PLANNING DEPARTMENT / TOWN COUNCIL • SUPPORTING – BUILDING DEPARTMENT • FINANCING OPTIONS – TAX INCENTIVES, FEMA GRANTS • COST ESTIMATE –DEPENDS ON INCENTIVES THE TOWN COUNCIL AGREES TO • TIME FRAME – SHORT-TERM • BENEFIT – DECREASE STRUCTURAL DAMAGE DURING FLOODS. IMPROVE BUSINESS CONTINUITY POST-
HAZARD.
Current Status: This is a new action.
2.A2. Action – Offer technical assistance on business continuity plans to local business community
Many properties within the Atlantic Beach District are in the 100-year flood zone. Business continuity plans can help a business get back up and running more quickly after a severe flood. RIEMA offers technical assistance on business continuity plans. The Town should coordinate with RIEMA to offer this technical assistance locally, including workshops that explain what business continuity plans are and how they are developed.
• ACTION TYPE – PUBLIC INFORMATION AND OUTREACH • PRE- OR POST-DISASTER – PRE-DISASTER • 2019 PRIORITY – MEDIUM • CHANGE IN PRIORITY FROM 2014 – 2019 – NEW ACTION • LEAD – PLANNING DEPARTMENT • SUPPORTING – BUILDING DEPARTMENT • FINANCING OPTIONS – STAFF TIME • COST ESTIMATE – STAFF TIME • TIME FRAME – MEDIUM-TERM • BENEFIT – IMPROVE BUSINESS CONTINUITY POST-HAZARD.
Current Status: This is a new action. 3. Vulnerable Area: Critical Roads
3.A1. Action – Increase culvert size, raise roadbeds, clear brooks, add guiderails, and make
stormwater and drainage improvements to Town roads
Many of the main roads, including evacuation routes, flood, making them impassable to emergency service crews and evacuees. The flooding also puts property, infrastructure and lives at risk. Increasing culvert size, raising roadbeds, clearing brooks of debris, adding guiderails, and making stormwater and drainage improvements will help prevent road flooding.
• ACTION TYPE – PROPERTY PROTECTION (INCLUDING ACQUISITION AND ELEVATION), STRUCTURAL PROJECTS, MAINTENANCE, AND REPAIR
• PRE- OR POST-DISASTER – PRE-DISASTER • 2019 PRIORITY – HIGH

88
• CHANGE IN PRIORITY FROM 2006-2014 – SAME • CHANGE IN PRIORITY FROM 2014-2019 - SAME • LEAD – PUBLIC WORKS • SUPPORTING – ENGINEERING • FINANCING OPTIONS – TOWN BUDGET (CAPITAL IMPROVEMENT PROGRAM), FEMA HMA GRANTS, RIDOT,
FHWA • COST ESTIMATE – $1.5M • TIME FRAME – LONG-TERM • BENEFIT – INCREASED PUBLIC SAFETY AND DECREASED DAMAGE TO STRUCTURES AND INFRASTRUCTURE.
DECREASED COSTS OF POST-DISASTER CLEAN UP Current Status: Town roads While some projects on this list have been completed, many remain incomplete due to lack of funding. These projects are still relevant and will remain on the list until funding is available. The Town regularly seeks grant funding for these projects from sources such as the Southeast New England Program (SNEP) Watershed Grants. Berkeley Avenue: In order to solve the flooding problems, Berkeley Avenue needs to be raised and land must be acquired to accomplish this. The project would also require further permitting because it will change the grade of the road. The Town would like to install guiderails to prevent vehicles from entering the Maidford River during flooding events. The Town considers this a Medium priority and estimates the cost at $300,000. This is a long-term project that has not yet been implemented due to lack of funding. Berkeley Avenue was repaved in Fall 2012. Birchwood Road: The Town did drainage work in 2006-2007 to assist with the flooding issues at Birchwood Road. Infrastructure was upgraded under West Main Road which better transports water below the road surface to the brook instead of flooding Birchwood Road. However, there are still more issues that need to be addressed.
Champlin Terrace: Champlin Terrace currently experiences flooding during and after moderate storm events. The Town would like to improve grading and extend storm drainage to eliminate the flooding conditions. This project has not been accomplished due to lack of funding. Forest Avenue—COMPLETE: The Town completed upgrades to Forest Avenue in 2016. The design improved the sanitary sewer system and drainage. The Bailey Brook culvert was reviewed during this process. Minor bank protection of the downstream side of culvert was completed and pedestrian/vehicle safety improvements were made to the guide rail and fencing.
Green End Avenue: On Green End Avenue, it is necessary to raise the road and install guiderails. The culvert has been downgraded to fair, and eventually will need to be repaired. This has not been accomplished due to lack of funding.
Oliphant Lane: Oliphant Lane floods in several locations. Following the March 2010 Flood, the Town rebuilt some catch basins and culverts to reduce the risk of vehicles and pedestrians. Drainage improvements are also necessary. This has not been accomplished due to lack of funding.
Third Beach Road-COMPLETE: The southern section of Third Beach Road experiences flooding and there are water quality issues in this area. Third Beach Road is critical for evacuation routes from the beaches and campgrounds. The Connector Road between the Campground and Third Beach Road was raised in 2017, which increases the ability to evacuate the area more safely and for a longer period of time.

89
Wave Avenue: Wave Avenue is a low-lying road in a dense residential and commercial area. There is a need to prevent water from overflowing from Green End Pond and inundating the road. This has not been accomplished due to lack of funding.
Wood Road: Drainage in the Wood Road neighborhood was improved as part of RIDOT’s reconstruction of the Two-Mile Corner intersection of West Main Road and East Main Road in 2013. The project included storm water drainage control and treatment. No further action is needed at this time, but the area should continue to be monitored for drainage issues.
RIDOT Roads
State roads in Middletown that would benefit from hazard mitigation measures include the following:
East Main Road at Bailey Brook: Unfortunately, this brook crossing was recently replaced without incorporating necessary flood mitigation measures. Flood mitigation measures should be included in any future projects that include this crossing.
East Main Road and Wyatt Road: The State recently upgraded the East Main Road and Wyatt Road intersection subsequently causing flooding during rainstorms. Drainage needs to be improved in this area.
Sachuest Point Road: The road was damaged during Hurricane Sandy and basically replaced in-kind. Should another major storm hit, the road is likely to experience similar damage. The rip-rap used to armor the shoreline could be thrown onto the road during a significant storm. Should the road be damaged again, more consideration should be given to mitigating damage from hazards when the road is rebuilt.
Wave Ave Bridge: The bridge spans Newport’s and Middletown’s boundary. It crosses the outlet creek that connects Easton’s Pond to Easton’s Bay. The existing bridge and nearby road are between 6 and 8 feet above sea level and are in the 100-year flood zone. RIDOT plans to replace the bridge in the near future. Any replacement bridge should be designed to withstand storm surge and associated erosion. Sea level rise should also be factored into the design. Sea level rise could raise the height of storm surge considerably by the end of the bridge’s design life.
4. Vulnerable Area: Hazardous Materials Evacuation Zone 4.A1. Action – Formalize input of emergency management staff in DPR application process for
applications relating to hazardous materials
During the Technical Review Committee stage of the Development Plan Review process, input on all projects is requested from the Fire Department. This input process should be formalized in the regulations, especially when hazardous materials are involved in a development plan. During review, if hazardous materials are found to be located near critical facilities or vulnerable populations, measures to mitigate the impacts of an incident should be taken, such as burying a proposed propane filling tank.
• ACTION TYPE – PLANNING AND REGULATION • PRE- OR POST-DISASTER – PRE-DISASTER • 2019 PRIORITY – HIGH

90
• CHANGE IN PRIORITY FROM 2014 – 2019 – NEW ACTION • LEAD – PLANNING DEPARTMENT • SUPPORTING – FIRE DEPARTMENT • FINANCING OPTIONS – STAFF TIME • COST ESTIMATE – STAFF TIME • TIME FRAME – MEDIUM-TERM • BENEFIT – REDUCE RISK OF AND IMPACTS OF HAZARDOUS MATERIAL INCIDENTS.
Current Status: This is a new action. 5. Vulnerable Area: Wave Avenue Sewage Pump Station
5.A1. Action – Reduce Inflow and Infiltration at the Wave Avenue Pump Station – COMPLETE
The main sewer line serving the Wave Avenue pump station runs alongside Valley Road and Bailey’s Brook. Heavy rain events allow groundwater to leak into cracked pipes causing the Wave Avenue pump station to overflow into Easton’s Bay. The Town is fined each time the station overflows into the Bay.
• ACTION TYPE – PROPERTY PROTECTION (INCLUDING ACQUISITION AND ELEVATION), STRUCTURAL PROJECTS, MAINTENANCE, AND REPAIR
• PRE- OR POST-DISASTER – PRE-DISASTER • 2019 PRIORITY – HIGH • CHANGE IN PRIORITY FROM 2006-2019 – SAME • CHANGE IN PRIORITY FROM 2014-2019 - COMPLETE • LEAD – PUBLIC WORKS • SUPPORTING – ENGINEERING • FINANCING OPTIONS – TOWN BOND PROJECT • COST ESTIMATE – $2M • TIME FRAME – SHORT-TERM • BENEFIT – REDUCE INFLOW AND INFILTRATION TO MAIN SEWER LINE. REDUCE SEWAGE DISCHARGE TO
EASTON’S BAY Current Status: A project is currently underway to slip line the pipes to prevent groundwater seepage. The section of the pipe that is being slip lined is located in the Easton’s Point neighborhood between Second Beach in Middletown and First Beach in Newport. The Paradise Avenue pump station pumps to the Wave Avenue pump station through this line.
Work to correct these issues began in the Fall of 2012. The overall scope was broken down into two projects: spot repairs (completed in 2017) and slip lining. $4 million has been spent on the slip lining project. 100% of the sewer mains have been slip lined and approximately 50% of the 550 sewer laterals have been slip lines.
5.A2. Action – Increase Capacity at Wave Avenue Pump Station - COMPLETE
The Wave Avenue Pump Station is located at Wave Avenue and Memorial Boulevard. Heavy rains and flood conditions could inundate the station’s current capacity causing it to overflow into Easton’s Bay and local streets. The Town would like to upgrade the pump station capacity by adding a pump increase backup power capability and flood proof the building.

91
• ACTION TYPE – PROPERTY PROTECTION (INCLUDING ACQUISITION AND ELEVATION), STRUCTURAL PROJECTS, MAINTENANCE, AND REPAIR
• PRE- OR POST-DISASTER – PRE-DISASTER • 2014 PRIORITY – HIGH • CHANGE IN PRIORITY FROM 2006-2014 – COMPLETED • LEAD – PUBLIC WORKS • SUPPORTING – ENGINEERING • FINANCING OPTIONS – TOWN BOND PROJECT • COST ESTIMATE – $2.5M • TIME FRAME – SHORT-TERM • BENEFIT – INCREASE CAPACITY OF PUMP STATION. REDUCE OVERFLOW INTO EASTON’S BAY AND LOCAL
STREETS Current Status: This action has been completed. The capacity cannot be increased. The pump has been added but produces redundancy.
5.A3. Action – Eliminate Illegal Sump Pump Connections to Sanitary Sewer System
There is the potential for residents in the neighborhood between First and Second beach to hook up their sump pumps to the Town’s sanitary sewer system. The extra water contributes to overflows at the Wave Avenue pump station, which results in fines against the Town. The Town hired a company to inspect houses to determine whether or not their sump pump is hooked up to the sanitary sewer line. The company will disconnect any sump pump violations they find.
• ACTION TYPE – PROPERTY PROTECTION (INCLUDING ACQUISITION AND ELEVATION), STRUCTURAL PROJECTS, MAINTENANCE, AND REPAIR
• PRE- OR POST-DISASTER – PRE-DISASTER • 2019 PRIORITY – HIGH • CHANGE IN PRIORITY FROM 2006-2014 – SAME • CHANGE IN PRIORITY FROM 2014-2019 - SAME • LEAD – PUBLIC WORKS • SUPPORTING – ENGINEERING • FINANCING OPTIONS – TOWN DPW BUDGET, TOWN SEWER FUND • COST ESTIMATE – $20,000 – 50,000 • TIME FRAME – ONGOING • BENEFIT – DECREASE ILLEGAL SUMP PUMP HOOKUPS TO THE SANITARY SEWER LINE, REDUCING OVERFLOW
AT THE WAVE AVE. PUMP STATION Current Status: The action item was completed in 2005-2007 however; this is still an ongoing effort. Sump pump violations are reviewed when a house is inspected. During the project the Town found 800 violations between residential and commercial properties. When violations were found the Town worked successfully with the property owners to correct the situation, without the need for fines or other penalties. During a sewer main slip lining project (see Action 4.A1) the Town identified four additional illegal sump pump connections. These will be disconnected in 2019. As of early 2019, the Department of Public Works is in the early phases of developing a program to assist property owners in identifying whether they have problems with their lateral sewer connections and assist those who do have problems in getting them repaired. The Town would like to keep this action item as it is an ongoing program and is still a priority.

92
6. Vulnerable Area: Paradise Avenue Sewage Pump Station – COMPLETE 6.A1. Action – Reduce Inflow and Infiltration at Paradise Avenue Pump Station
The Paradise Avenue Pump Station is located at Paradise Avenue and Sachuest Point Road, near Second Beach and the U.S. Sachuest Point Wildlife Refuge. A flood could cause the pump station to overflow into a sensitive wetland area around Second Beach and into swimming areas.
• ACTION TYPE – PROPERTY PROTECTION, STRUCTURAL PROJECTS, MAINTENANCE, AND REPAIR • PRE- OR POST-DISASTER – PRE-DISASTER • 2019 PRIORITY – HIGH • CHANGE IN PRIORITY FROM 2006-2014 – SAME • CHANGE IN PRIORITY FROM 2014-2019 - COMPLETE • LEAD – PUBLIC WORKS • SUPPORTING – ENGINEERING • FINANCING OPTIONS – FEMA HMA GRANT • COST ESTIMATE – $2M • TIME FRAME – LONG-TERM • BENEFIT – REDUCE THREAT OF SEWAGE DISCHARGE TO SENSITIVE WETLANDS AROUND SECOND BEACH AND
SWIMMING AREAS Current Status: Since 2005, the Town completed a Sanitary Sewer Evaluation Study up to a Phase II and is in the process of completing a continued study. The Town conducted additional Inflow and Infiltration (I&I) investigations in Fall 2012 to identify any sources. During these I&I investigations, additional sources were identified. Property owners were contacted via letter and the minor fixes required have been completed. Any additional actions necessary will be incorporated into the Town’s Capital Improvement Plan, as required.
7. Vulnerable Area: Evacuation Route Intersections 7.A1. Action – Install OptiCom Sensors on Traffic Signals - COMPLETE
There are major intersections with traffic signals along many of the town’s evacuation routes that could hinder evacuation efforts. OptiCom would give equipped Town vehicles the ability to manipulate the traffic signals to aid in a safer, more effective evacuation effort. The Rhode Island Department of Transportation (RIDOT) is currently installing OptiCom sensors on Route 138.
• ACTION TYPE – PROPERTY PROTECTION (INCLUDING ACQUISITION AND ELEVATION), STRUCTURAL PROJECTS, MAINTENANCE, AND REPAIR
• PRE- OR POST-DISASTER – PRE-DISASTER • 2014 PRIORITY – HIGH • CHANGE IN PRIORITY FROM 2006-2014 – COMPLETED • LEAD – RIDOT • SUPPORTING – PUBLIC WORKS, ENGINEERING • FINANCING OPTIONS – RIDOT • COST ESTIMATE – $1M • TIME FRAME – LONG-TERM • BENEFIT – INCREASE PUBLIC SAFETY AND EFFECTIVE EVACUATION

93
Current Status: RIDOT has completed installation of OptiCom sensors at all major intersections. This action is complete.
7.A2. Action- Acquire Temporary Stop Signs for Use During a Power Outage
During Tropical Storm Irene in 2011, the town experienced a long-term power outage which affected all the traffic signals. Public Safety personnel were posted at most major intersections to assist with traffic control. The Town requested assistance from the National Guard, but resources were not made available to Middletown. To assist the Town in managing the safety at signalized intersections during a power outage, for both day-to-day activities or evacuations efforts, the Town would like to acquire temporary stop signs.
• ACTION TYPE – PROPERTY PROTECTION (INCLUDING ACQUISITION AND ELEVATION), STRUCTURAL PROJECTS, MAINTENANCE, AND REPAIR
• PRE- OR POST-DISASTER – PRE-DISASTER • 2019 PRIORITY – MEDIUM • CHANGE IN PRIORITY FROM 2006-2014 – NEW ACTION • CHANGE IN PRIORITY FROM 2014-2019 – HIGH TO MEDIUM • LEAD – PUBLIC WORKS • SUPPORTING – POLICE • FINANCING OPTIONS – EMERGENCY MANAGEMENT GRANTS, FEDERAL GRANTS • COST ESTIMATE – $10,000 • TIME FRAME – SHORT-TERM • BENEFIT – INCREASE PUBLIC SAFETY AND EFFECTIVE EVACUATION
Current Status: In September 2014, grant money was allocated for a proposal to purchase 30 portable stop signs with bases, along with other traffic and crowd control devices. Unfortunately, in October 2014, the money was reallocated to another project and the Town opted not to purchase these items at that time. The department of Public Works purchased about 5 temporary stop signs out of its operating budget between 2014 and 2019. This project is still relevant and may be more achievable if traffic control devices and crowd control devices were targeted as individual projects, thereby making each less complicated and a more manageable cost.
8. Vulnerable Area: Essential Services 8.A1. Action – Continue Town Tree-Trimming Program
The Town would like to continue a town-wide tree trimming program to prevent damage and debris from severe weather, high winds and hurricanes.
• ACTION TYPE – PROPERTY PROTECTION (INCLUDING ACQUISITION AND ELEVATION), STRUCTURAL PROJECTS, MAINTENANCE, AND REPAIR
• PRE- OR POST-DISASTER – PRE-DISASTER • 2019 PRIORITY – HIGH • CHANGE IN PRIORITY FROM 2006-2014 – SAME • CHANGE IN PRIORITY FROM 2014-2019 - SAME • LEAD – PUBLIC WORKS • FINANCING OPTIONS – TOWN DPW BUDGET • COST ESTIMATE – $100,000

94
• TIME FRAME – ONGOING • BENEFIT – AN ANNUAL TREE TRIMMING PROGRAM WILL HELP REDUCE DAMAGE TO UTILITY LINES AND WILL
CUT DOWN ON POTENTIAL POST-DISASTER TRAFFIC DISRUPTION DEBRIS AND CLEAN-UP EFFORTS Current Status: The Town increased its budget from $20,000 per year to approximately $25,000 a year to conduct this annual program. Looking forward, another similar increase in funding is likely to occur to account for the true annual cost of the program. If additional funding was available, the Town could more thoroughly identify and trim problem trees throughout town as well as assist private property owners with the removal of dangerous trees and limbs. That said, if a tree or limb is considered dangerous, the Town cuts it regardless of funding availability, and then makes up the difference by borrowing from other budgeted sources. The Town still identifies this as a priority and will keep it as an action item.
8.A2. Action – Create a Public Tree Database for the Town’s Geographic Information System (GIS)
The Town would like to create a GIS layer of all trees on Town property or on public rights of way to assist in the maintenance efforts of the town-wide tree trimming program as well as effectively identifying downed trees post disaster.
• ACTION TYPE – PROPERTY PROTECTION (INCLUDING ACQUISITION AND ELEVATION), STRUCTURAL PROJECTS, MAINTENANCE, AND REPAIR
• PRE- OR POST-DISASTER – PRE-DISASTER • 2019 PRIORITY – MEDIUM • CHANGE IN PRIORITY FROM 2006-2014 – NEW ACTION • CHANGE IN PRIORITY FROM 2014-2019 - SAME • LEAD – PLANNING • SUPPORTING – PUBLIC WORKS • FINANCING OPTIONS – TOWN STAFF TIME, TOWN BUDGET, OR STATE GIS OR OPEN SPACE GRANTS • COST ESTIMATE – $50,000 • TIME FRAME – MEDIUM-TERM • BENEFIT – THIS WOULD ASSIST IN THE MAINTENANCE EFFORTS AND COORDINATION OF THE TREE TRIMMING
PROGRAM AS WELL AS ASSIST IN IDENTIFYING DOWNED TREES POST DISASTER Current Status: The Town has not acted on this action due to a lack of resources. The action is still relevant and will remain on the list.
8.A3. Action – Maintain Safe Roads during Snow and Ice Events
Maintain the Town’s existing program for efficient snow removal on Town streets and roads. The Department of Public Works personnel and snow removal vehicles and equipment help to keep the roadways clear during the multiple annual snow events. Cleared roads provide safe passage for emergency vehicles and residents.
• ACTION TYPE – PROPERTY PROTECTION (INCLUDING ACQUISITION AND ELEVATION), STRUCTURAL PROJECTS, MAINTENANCE, AND REPAIR
• PRE OR POST DISASTER – PRE-DISASTER • 2019 PRIORITY – HIGH • CHANGE IN PRIORITY FROM 2006-2014 – SAME • CHANGE IN PRIORITY FROM 2014-2019 - SAME • LEAD – PUBLIC WORKS • FINANCING OPTIONS – TOWN BUDGET • COST ESTIMATE – $200,000

95
• TIME FRAME – ONGOING • BENEFIT – CLEARED ROADS FOR PUBLIC SAFETY AND EMERGENCY VEHICLES.
Current Status: The Town continually implements this program. The annual budget for the Town is approximately $200,000.
8.A4. Action – Assess Impact of the Privatization of Navy Housing - COMPLETE
Assess the impact that the population increase, from Navy housing and land, will have on the town. In the near future 750 Navy housing units and a parcel of land are going to be coming under the Town’s jurisdiction. None of the property is located in a FEMA designated floodplain. Response organizations within the town need to assess the impact that the population and land increase will have on their departments and required services.
• ACTION TYPE – PLANNING AND REGULATIONS • PRE- OR POST-DISASTER – PRE-DISASTER • 2014 PRIORITY – HIGH • CHANGE IN PRIORITY FROM 2006-2014 – COMPLETED • LEAD – FIRE, POLICE • SUPPORTING – FINANCE DEPARTMENT, DPW, PLANNING DEPARTMENT • FINANCING OPTIONS – TOWN BUDGET • COST ESTIMATE – STAFF TIME • TIME FRAME – SHORT-TERM • BENEFIT – RESPONSE ORGANIZATIONS HAVE A BETTER UNDERSTANDING OF THE IMPACT THAT THE NAVY
HOUSING AND LAND WILL HAVE ON THE TOWN Current Status: This is complete. This area is under the jurisdiction of the Town of Middletown and the Town offers all required services. The Town has a municipal services agreement in place for police and fire services for Navy housing units.
9. Vulnerable Area: Maidford River 9.A1. Action – Continually Clear Debris from the Maidford River
The Maidford River watershed extends from East Main Road to Sachuest Point and from Turner Road to Wapping Road. Flooding of the river would result in pollution of water supply and the flooding of sensitive wetlands and major connector roads. Keeping the culverts along the river clear of debris will help to alleviate flooding.
• ACTION TYPE – PROPERTY PROTECTION (INCLUDING ACQUISITION AND ELEVATION), STRUCTURAL PROJECTS, MAINTENANCE, AND REPAIR/ PLANNING AND REGULATIONS
• PRE- OR POST-DISASTER – PRE-DISASTER • 2019 PRIORITY – HIGH • CHANGE IN PRIORITY FROM 2006-2014 – SAME • CHANGE IN PRIORITY FROM 2014-2019 - SAME • LEAD – PUBLIC WORKS • SUPPORTING – TOWN ENGINEER • FINANCING OPTIONS – TOWN DPW BUDGET, VOLUNTEER GROUPS • COST ESTIMATE – $50,000 • TIME FRAME – ONGOING

96
• BENEFIT – PREVENT POLLUTION OF THE WATER SUPPLY AND PREVENT FLOODING OF SENSITIVE WETLANDS AND EVACUATION ROUTES
Current Status: This action item is not complete; however, the Town has made some efforts. Debris was cleared from the Maidford River in 2008. One of the culverts was replaced on Prospect Avenue and Paradise Avenue. The LHMC feels that this action item needs to be annually implemented and the Town does not currently have sufficient funding or resources to accomplish this. An additional obstacle is that much of the clearing needs to take place on private property, complicating logistics.
9.A2. Action – Regulate Development in the Maidford River Watershed
Provide for appropriate development levels in the watershed of the Maidford River through adoption of zoning and other regulatory protections. The Maidford River watershed extends from East Main Road to Sachuest Point and from Turner Road to Wapping Road. Heavy development in this area could cause the river to flood due to excess in run-off. Flooding of the river would result in pollution of Aquidneck Island water supply and flooding of wetlands and evacuation routes.
Additionally, RIDEM has adopted Total Maximum Daily Load (TMDL) reports for bacteria on the Maidford River. The reports recommend adopting measures to better manage stormwater, preserve the watershed’s wetlands and woodlands, and institute controls on development in the watershed.
• ACTION TYPE – PROPERTY PROTECTION (INCLUDING ACQUISITION AND ELEVATION), STRUCTURAL PROJECTS, MAINTENANCE, AND REPAIR/ PLANNING AND REGULATIONS
• PRE- OR POST-DISASTER – PRE-DISASTER • 2019 PRIORITY – MEDIUM • CHANGE IN PRIORITY FROM 2006-2014 – SAME • CHANGE IN PRIORITY FROM 2014-2019 – HIGH TO MEDIUM • LEAD – PLANNING BOARD, TOWN COUNCIL • FINANCING OPTIONS – TOWN STAFF TIME, TOWN BUDGET • COST ESTIMATE – $20,000 • TIME FRAME – LONG-TERM • BENEFIT – PREVENT POLLUTION OF THE WATER SUPPLY AND PREVENT FLOODING OF SENSITIVE WETLANDS
AND EVACUATION ROUTES Current Status: The Town has a Watershed Protection District in place to provide for oversight of development in these areas. Whenever a special use permit is required within the Watershed Protection District, an advisory report is provided by the planning board and the conservation commission. Further, the zoning board is required to hold a public hearing on the application, giving the public an opportunity to voice concerns. Through this process, conditions can be placed on the proposed project to ensure safety and avoid the degradation of water quality. The Town has implemented conservation subdivision design regulations to help preserve open space and concentrate development on the most suitable land within each subdivision. Developers must comply with the Town’s stormwater management ordinance, which incorporates the Rhode Island Stormwater Design Manual. Counterintuitively, responsible development that complies with the ordinance can improve stormwater runoff and water quality conditions in some situations. One example includes a development plan that was constructed along Bailey Brook south of Thelma Lane, where, prior to development, stormwater runoff traveled directly from West Main Road into the wetland. The Planning Board approves reduced road widths for proposed developments in appropriate situations, which reduces storm water runoff and is currently considering reducing the minimum required road width in its subdivision regulations.

97
The LHMC suggests the Town consider offering incentives to developers to assist in achieving the goals of this action item. Possible incentives include tax credits or density bonuses for developers who reduce or manage stormwater beyond what is required by regulation.
10. Vulnerable Area: Bailey Brook 10.A1. Action –Implement Debris Clearing of Bailey Brook
The Bailey Brook watershed extends from Green End Pond to Greene Lane and from West Main Road to Turner Road. Flooding of the brook would result in pollution of the drinking water supply and flooding of sensitive wetlands. Keeping the culverts along the brook clear of debris will help to alleviate flooding.
• ACTION TYPE – PROPERTY PROTECTION (INCLUDING ACQUISITION AND ELEVATION), STRUCTURAL PROJECTS, MAINTENANCE, AND REPAIR/ PLANNING AND REGULATIONS
• PRE- OR POST-DISASTER – PRE-DISASTER • 2019 PRIORITY – HIGH • CHANGE IN PRIORITY FROM 2006-2014 – SAME • CHANGE IN PRIORITY FROM 2014-2019 - HIGH • LEAD – PUBLIC WORKS • SUPPORTING – ENGINEERING • FINANCING OPTIONS – TOWN DPW BUDGET, VOLUNTEER GROUPS • COST ESTIMATE – $50,000 • TIME FRAME – ONGOING • BENEFIT – PREVENT POLLUTION OF THE PUBLIC WATER SUPPLY AND FLOODING OF SENSITIVE WETLANDS
Current Status: The Town performed substantial debris clearing in 2008 and clears a culvert on Woolsey Road annually. This action item is not complete. The LHMC feels that this needs to be annually implemented and the Town does not currently have sufficient funding or resources for this action item. An additional obstacle is that much of the clearing needs to take place on private property, complicating logistics. The Town is attempting to work with local schools and community groups to assist in the clearing of some sections as part of their study and research. While no action is needed at this time, the Town should monitor flooding in East Bay Village. Multiple structures are near Bailey Brook’s 100-year floodplain.
10.A2. Action – Limit Development in the Watershed of Bailey Brook
The Bailey Brook watershed extends from Green End Pond to Greene Lane and from West Main Road to Turner Road. Heavy development in this area could cause the brook to flood due to excess run-off. Flooding of the brook would result in pollution of the drinking water supply and flooding of sensitive wetlands. Limiting development would help to prevent excess run-off.
RIDEM has adopted a Total Maximum Daily Load (TMDL) report for phosphorous for North Easton’s Pond and a separate TMDL for bacteria on Bailey Brook. Both reports include recommended actions to reduce phosphorous and bacteria loading. Primarily, the reports recommend better stormwater management in priority catchments, ideally using infiltration, filtration, and retention rather than end-of-pipe solutions. The Bailey Brook TMDL

98
recommends land use protection within the watershed to help filter and absorb stormwater and agricultural runoff and to protect stream channel stability.
• ACTION TYPE – PROPERTY PROTECTION (INCLUDING ACQUISITION AND ELEVATION), STRUCTURAL PROJECTS, MAINTENANCE, AND REPAIR/ PLANNING AND REGULATIONS
• PRE- OR POST-DISASTER – PRE-DISASTER • 2019 PRIORITY – MEDIUM • CHANGE IN PRIORITY FROM 2006-2014 – SAME • CHANGE IN PRIORITY FROM 2014-2019 – HIGH TO MEDIUM • LEAD –PLANNING DEPARTMENT, BUILDING INSPECTOR • SUPPORTING – ENGINEERING • FINANCING OPTIONS – TOWN STAFF TIME, TOWN BUDGET • COST ESTIMATE – $20,000 • TIME FRAME – LONG-TERM • BENEFIT – PREVENT POLLUTION OF THE WATER SUPPLY AND PREVENT FLOODING OF SENSITIVE WETLANDS
Current Status: The Town has a Watershed Protection District in place to provide for oversight of development in these areas. Whenever a special use permit is required within the Watershed Protection District, an advisory report is provided by the planning board and the conservation commission. Further, the zoning board is required to hold a public hearing on the application, giving the public an opportunity to voice concerns. Through this process, conditions can be placed on the proposed project to ensure safety and avoid the degradation of water quality. The Town has implemented conservation subdivision design regulations to help preserve open space and concentrate development on the most suitable land within each subdivision. Developers must comply with the Town’s stormwater management ordinance, which incorporates the Rhode Island Stormwater Design Manual. Counterintuitively, responsible development that complies with the ordinance can improve stormwater runoff and water quality conditions in some situations. Once example includes a development plan that was constructed along Bailey Brook south of Thelma Lane, where, prior to development stormwater runoff traveled directly from West Main Road into the wetland. The Planning Board approves reduced road widths in appropriate situations, which reduces storm water runoff and is currently considering reducing the minimum required road width in its subdivision regulations. Since 2004, The Town of Middletown, City of Newport, RIDEM, and Aquidneck Land Trust have combined to preserve approximately 72 acres along the southern banks of Bailey Brook. The LHMC suggests the Town may want to consider offering incentives to developers to assist in achieving the goals of this action item. Possible incentives include tax credits or density bonuses for developers who reduce or manage stormwater beyond what is required by regulation.
10.A3. Action – Complete Watershed Analysis and Update Flood Maps as Needed - COMPLETE
Complete watershed analysis to determine areas in town vulnerable to flooding. Update FEMA floodplain maps as needed.
• ACTION TYPE – PROPERTY PROTECTION (INCLUDING ACQUISITION AND ELEVATION), STRUCTURAL PROJECTS, MAINTENANCE, AND REPAIR/ PLANNING AND REGULATIONS
• PRE- OR POST-DISASTER – PRE-DISASTER • 2014 PRIORITY – HIGH • CHANGE IN PRIORITY FROM 2006-2014 – COMPLETED • LEAD – TOWN ENGINEER • SUPPORTING – PLANNING DEPARTMENT • FINANCING OPTIONS – FEMA

99
• COST ESTIMATE – $100,000 • TIME FRAME – LONG-TERM • BENEFIT – FLOOD AREAS ARE DETERMINED, AND FEMA FLOODPLAIN MAPS ARE UPDATED ACCORDINGLY
Current Status: FEMA issued new floodplain maps in 2010, and revisions to the maps for coastal areas in 2013. The Town adopted these maps. They can be accessed from the Planning Department’s floodplain management webpage (http://planning.middletownri.com/floodplain-management). The Town also has WebGIS which allows for interactive mapping of floodplains for the public. No formal watershed analysis was completed, but the Town uses the FEMA floodplain maps and local experience to identify areas prone to flooding in Middletown. This action item is complete.
10.A4. Action – Extension of Buck Road to Serve as Evacuation Route - COMPLETE
Commodore Perry Village has one single ingress and egress through Woosley Road which floods during moderate rainstorms and prevents emergency access or evacuation of the hundreds of residents within the neighborhood. An opportunity exists to extend Buck Road and provide a second ingress and egress for the residents of the neighborhood.
• ACTION TYPE – PROPERTY PROTECTION (INCLUDING ACQUISITION AND ELEVATION), STRUCTURAL PROJECTS, MAINTENANCE, AND REPAIR/ PLANNING AND REGULATIONS
• PRE- OR POST-DISASTER – PRE-DISASTER • 2019 PRIORITY – HIGH • CHANGE IN PRIORITY FROM 2006-14 – NEW ACTION • CHANGE IN PRIORITY FROM 2014-2019 - COMPLETED • LEAD – TOWN ENGINEER • SUPPORTING – PUBLIC WORKS • FINANCING OPTIONS – TOWN BUDGET, EMERGENCY MANAGEMENT GRANTS, • COST ESTIMATE – $175,000 • TIME FRAME – SHORT-TERM • BENEFIT – RESTRICTS EMERGENCY SERVICES AND EVACUATION WHEN THE ROAD FLOODS
Current Status: This action was completed between 2014 and 2019. The Town needed to acquire an easement across private property to complete the extension. Woolsey Road has not flooded since the completion of the Buck Road extension, so the evacuation route has not yet been utilized during an emergency.
11. Vulnerable Area: Dams and Reservoirs 11.A1. Action – Work with Dam Owners to Encourage Proper Maintenance
Notify dam owners of their responsibility for inspection, maintenance, and repair of their dams. Middletown has six dams. The Nelson Pond Dam, Gardiner Pond Dam, and Easton’s Pond North Dam are owned by the City of Newport and each is associated with its own reservoir. The City of Newport dams protect the public water supply. These three dams are classified as high hazard dams, meaning that failure or inappropriate operation of the dam will result in a probable loss of human life. There are three other low hazards dams in Middletown (Wanumetonomy Pond Dam, Prescott Farm Dam, and Newport Memorial Cemetery Dam). Failure of these dams would result in no probable loss of human life and low economic losses. Dam owners are responsible for the upkeep of their dams to ensure public safety and property protection.

100
• ACTION TYPE – PLANNING AND REGULATIONS • PRE- OR POST-DISASTER – PRE-DISASTER • 2019 PRIORITY – MEDIUM • CHANGE IN PRIORITY FROM 2006-2014 – SAME • CHANGE IN PRIORITY FROM 2014-2019 – SAME • LEAD – TOWN ADMINISTRATOR • SUPPORTING – PUBLIC WORKS • FINANCING OPTIONS –TOWN STAFF TIME, TOWN BUDGET • COST ESTIMATE – STAFF TIME • TIME FRAME – ONGOING • BENEFIT – RAISE DAM OWNERS’ AWARENESS OF THEIR RESPONSIBILITIES. PROTECTION OF PROPERTY, PUBLIC
WATER SUPPLY, LOCAL ROADS AND SENSITIVE WETLANDS Current Status: The Town does notify the dam owners annually and will continue to implement this action item. The Town added the Easton’s Pond/Green End Pond Dam to the list above. Though this is an annual process, the LHMC would like to keep the action in the plan due to its importance.
12. Vulnerable Area: Campgrounds and Trailer Parks 12.A1. Action – Properly Anchor and Secure Mobile Homes and Recreational Vehicles
The Sachuest Point Campground, Forest Avenue Trailer Park, Bay View Park, Prospect Avenue Trailer Park, and Paradise Park all contain mobile homes or recreational vehicles that are not properly tied down. Properly anchoring the homes will reduce clean-up cost and prevent property and personal damage from hurricanes or high wind events. Transient campers would be asked to evacuate and/or notified of the risk; whereas the permanent mobile homes would need to be properly tied down.
• ACTION TYPE – PROPERTY PROTECTION (INCLUDING ACQUISITION AND ELEVATION), STRUCTURAL PROJECTS, MAINTENANCE, AND REPAIR/ PLANNING AND REGULATIONS
• PRE- OR POST-DISASTER – PRE-DISASTER • 2019 PRIORITY – HIGH • CHANGE IN PRIORITY FROM 2006-2014 – SAME • CHANGE IN PRIORITY FROM 2014-2019 - SAME • LEAD – BUILDING DEPARTMENT • SUPPORTING – PUBLIC WORKS • FINANCING OPTIONS – FEMA PDM GRANT • COST ESTIMATE – $100,000 • TIME FRAME – ONGOING • BENEFIT – PROPERLY ANCHOR CAMPERS AT CAMPGROUND AND TRAILER PARKS TO PREVENT DAMAGE FROM
HURRICANE OR HIGH WIND EVENTS Current Status: Permanent mobile homes are currently only inspected when a building permit is issued. At the time of the issuance of the permit, the Town can require that the unit be brought into code compliance. State building code dictates the anchoring requirements for mobile homes based on the wind zone the mobile home is located within. In the past Middletown was upgraded to a 110-mph wind zone and is likely to be upgraded to a 120-mph wind zone in the near future. As the wind zone increases, so too does the stringency of the anchoring requirements.

101
Safety of recreational vehicles is an ongoing process which is storm-event driven. The Town established a written procedure for evacuation notification of the Sachuest Point Campground. The procedure includes three warning levels with the third being a complete campground evacuation order when a hurricane is predicted to make landfall within 48 hours. During an evacuation, recreational vehicles may be stored at Gaudet Middle School and may not return to the campground until it has been assessed for safety by Town staff. In addition to the evacuation procedure, the Town raised the campground connector road in 2017, which increases the ability to evacuate the area more safely and for a longer period of time.
13. Vulnerable Area: Recent Development Project Stormwater BMPs 13.A1. Action – Enforce Property Owners/Homeowners Associations to Maintain Drainage Features
The Town must enforce that in new subdivisions homeowners’ associations and property owners must keep retention ponds clear of debris. The outflow drains in the retention ponds get clogged causing ponds to overflow and flood. Annual cleaning of the drains would help prevent flooding. The property owners/homeowners’ associations are responsible for maintenance of the retention ponds.
• ACTION TYPE – PLANNING AND REGULATIONS • PRE- OR POST-DISASTER – PRE-DISASTER • 2019 PRIORITY – HIGH • CHANGE IN PRIORITY FROM 2006-2014 – SAME • CHANGE IN PRIORITY FROM 2014-2019 - SAME • LEAD – PLANNING • SUPPORTING – ENGINEERING • FINANCING OPTIONS –TOWN STAFF TIME, TOWN BUDGET • COST ESTIMATE – STAFF TIME • TIME FRAME – ONGOING • BENEFIT – DECREASE PERSONAL AND PROPERTY LOSS
Current Status: In 2006 the Town passed a stormwater management ordinance (Chapter 153) setting stormwater management standards and requiring developers to submit a stormwater management plan when developing a property. The plan must explain the BMPs employed during and after construction and describe the maintenance requirements of the BMPs during and after construction. The ordinance requires the developer to enter into a maintenance agreement with the Town, which allows the Town to inspect BMPs and cite property owners when they are not compliant with the standards. In 2007 the Town notified and cited any property owner/homeowner association not in compliance. All property owners/homeowner associations came into compliance after that notification. The Town noticed homeowners’ associations again in 2013 and provided on-site education to property owners on proper stormwater system maintenance. The Town also plans to complete a condition index to rate the condition of drainage features on an ongoing basis.
14. Vulnerable Area: All Shoreline Property Vulnerable to Storm Surge Erosion 14.A1. Action – Evaluate which shoreline properties are at significant erosion risk due to coastal surge
and wave action during Hurricanes, Tropical Storms, and other Severe Weather
After Hurricane Sandy property owners at the Newport Clambake Club notified the Town that they suffered significant erosion of their shoreline that threatened to compromise the foundation of a structure on their historic property. Additionally, the storm surge and intense high wave action during Hurricane Sandy caused extensive

102
damage to Sachuest Point Road between the Second Beach Campground and the Sachuest Point Wildlife Refuge. Much of the roadway in this area was covered with heavy debris that made the road impassable. Some areas of the road suffered severe buckling and/or were undermined causing officials to close the road for safety reasons until permanent repairs could be made. More significant erosion could have threatened a capped landfill located just north of Sachuest Point Road causing environmental harm and posing a serious public health threat. This event precipitated an overall concern that more properties have similar risks that have not been brought to the Town’s attention. The Town will conduct site visits to properties along the shoreline to evaluate if there is a need for mitigation measures to reduce the risk of property erosion due to storm surge and wave action. The process will include the development of a condition index to rate the condition of shoreline features that protect property from storm surge and wave action to establish a baseline for future mitigation actions. After evaluations are complete, property owners with significant risk will be contacted to discuss coordinated mitigation projects and funding opportunities.
• ACTION TYPE – PLANNING AND REGULATIONS • PRE- OR POST-DISASTER – PRE-DISASTER • 2019 PRIORITY – MEDIUM • CHANGE IN PRIORITY FROM 2006-2014 – NEW ACTION • CHANGE IN PRIORITY FROM 2014-2019 - SAME • LEAD – PLANNING • SUPPORTING – ENGINEERING • FINANCING OPTIONS – TOWN STAFF TIME, TOWN BUDGET • COST ESTIMATE – STAFF TIME • TIME FRAME – LONG-TERM • BENEFIT – DECREASE PERSONAL AND PROPERTY LOSS
Current Status: The Town has not acted on this action due to a lack of resources. The action is still relevant and will remain on the list.
14.A2. Action – Armor the shoreline at Dunlap Wheeler Park. The parking lot associated with Dunlap Wheeler Park and the CRMC right-of-way that provides public access to Easton’s Bay floods regularly. Tidal flooding occurs during extreme high tides. Storm surge flooding occurs during storms that strike during a high-tide cycle. During Hurricane Sandy, flooding reached Aquidneck Avenue north of the parking lot. The shoreline should be armored between Dunlap Wheeler Park and the seawall at the Newport Beach House (3 Aquidneck Ave) to prevent tidal flooding and mitigate the impact of storm surge from lesser storms.
• ACTION TYPE – PROPERTY PROTECTION • PRE- OR POST-DISASTER – PRE-DISASTER • 2019 PRIORITY – MEDIUM • CHANGE IN PRIORITY FROM 2014 – 2019 – NEW ACTION • LEAD – PUBLIC WORKS • SUPPORTING – PLANNING • FINANCING OPTIONS – FEDERAL GRANT FUNDING IN PARTNERSHIP WITH CLEAN OCEAN ACCESS. • COST ESTIMATE – $750,000 • TIME FRAME – LONG-TERM

103
• BENEFIT – REDUCE DEBRIS IN AND DAMAGE TO PARKING LOT AND RIGHT-OF-WAY.
Current Status: This is a new action to the Hazard Mitigation Plan, but the Town has previously applied for and failed to receive grant funding for this project.
15. Vulnerable Area: Vegetated Wildlife Areas Vulnerable to Wildfires 15.A1. Action – Identify any forested or heavy brush areas within the Town’s jurisdiction that could
create a wildfire hazard including the U.S. Sachuest Point Wildlife Refuge
Determine if, after extended periods of dry weather, any areas could create a threat of wildfire conditions. Work with property owners to reduce property risk from wildfires by creating protective barriers to fire spread from any forested or heavy brush areas near combustible structures.
• ACTION TYPE – PROPERTY PROTECTION • PRE- OR POST-DISASTER – PRE-DISASTER • 2019 PRIORITY – LOW • CHANGE IN PRIORITY FROM 2006 – 2014 – NEW ACTION • CHANGE IN PRIORITY FROM 2014 – 2019 - SAME • LEAD – FIRE DEPARTMENT • SUPPORTING – PUBLIC WORKS • FINANCING OPTIONS – MIDDLETOWN FIRE DEPARTMENT STAFF TIME AND BUDGET • COST ESTIMATE – STAFF TIME • TIME FRAME – LONG-TERM • BENEFIT – DECREASE RISK OF PROPERTY LOSS DUE TO FIRES IN WOODED AREAS
Current Status: The town does not presently contain any large areas of forest susceptible to wildfires after extended periods of dry weather. Some limited areas of wooded property exist, mainly north of Gardiner Pond. Residential homes are located along the edge of this forested area. In 2018, the Middletown Fire Department purchased a replacement medium duty firefighting response vehicle that can be utilized for fire suppression in wooded or remote areas. Heavy brush areas have been monitored. Sachuest Point Wildlife Refuge utilized a small prescribed burn to manage accumulated heavy brush in addition to brush cutting. Unfortunately, the weather conditions and timing of the prescribed burn limited the extent of brush eliminated. The project will be ongoing as vegetation continues to accumulate. There has been no recent evaluation of present conditions related to wildfire risk in Middletown. This action will remain on the list as a low priority, and should an evaluation be conducted, the Town will work with the owners of properties susceptible to wildfires to come up with a plan to reduce risk.
15.A2. Action – Monitor fire risk areas and implement outside burn restrictions during times of severe drought
Fire risk areas include Sachuest Point Wildlife Refuge and the wooded area north of Gardiner pond. These areas should be monitored during times of drought, so fires may be extinguished before expanding to areas with structures. To further reduce the risk of fire during times of drought, outside burn restrictions should be imposed.

104
• ACTION TYPE – PROPERTY PROTECTION • PRE- OR POST-DISASTER – PRE-DISASTER • 2019 PRIORITY – MEDIUM • CHANGE IN PRIORITY FROM 2014 – 2019 - NEW ACTION • LEAD – FIRE DEPARTMENT • SUPPORTING – PUBLIC WORKS • FINANCING OPTIONS – MIDDLETOWN FIRE DEPARTMENT STAFF TIME AND BUDGET • COST ESTIMATE – STAFF TIME • TIME FRAME – SHORT-TERM • BENEFIT – DECREASE RISK OF PROPERTY LOSS AND LOSS OF LIFE DUE TO FIRES
Current Status: This is a new action.

105
4.2 ACTIONS CATEGORIZED BY HAZARD ADDRESSED All Hazards
• 1.A3 – Increase efforts to encourage the public to be added to RI Department of Health’s registry of people with special needs and to sign up for Code Red alerts.
• 1.A4. Evaluate the possibility of expanding the number of emergency shelter beds available during an evacuation event.
• 8.A4 – Assess Impact of the Privatization of Navy Housing - COMPLETE
Severe Weather: nor’easters, winter storms, thunderstorms, high winds and tornadoes
• 1.A1 – Study the necessity and feasibility of offering buses from low-income neighborhoods to evacuation shelters. If the decision is made to offer this service, then develop an implementation plan
• 1.A2– Prioritize communicating with individuals who rely on electronic health devices during power outages
• 2.A2 – Offer technical assistance on business continuity plans to local business community • 7.A2 – Acquire Temporary Stop Signs for Use During a Power Outage • 8.A1 – Continue Town Tree-Trimming Program • 8.A2 – Create a Public Tree Database for the Town’s Geographic Information System • 8.A3 – Maintain Safe Roads during Snow and Ice Events • 12.A1 – Properly Anchor and Secure Mobile Homes and Recreational Vehicles • 14.A1 – Evaluate which shoreline properties are at significant erosion risk due to coastal surge and wave
action during hurricanes, tropical storms, and other severe weather • 14.A2 – Armor the shoreline at Dunlap Wheeler Park
Hurricanes and Tropical Storms
• 1.A1 – Study the necessity and feasibility of offering buses from low-income neighborhoods to evacuation shelters. If the decision is made to offer this service, then develop an implementation plan
• 1.A2 – Prioritize communicating with individuals who rely on electronic health devices during power outages
• 7.A1 – Install OptiCom Sensors on Traffic Signals – COMPLETE • 7.A2 – Acquire Temporary Stop Signs for Use During a Power Outage • 8.A1 – Continue Town Tree-Trimming Program • 8.A2– Create a Public Tree Database for the Town’s Geographic Information System • 12.A1 – Properly Anchor and Secure Mobile Homes and Recreational Vehicles • 14.A1 – Evaluate which shoreline properties are at significant erosion risk due to coastal surge and wave
action during hurricanes, tropical storms, and other severe weather • 14.A2 – Armor the shoreline at Dunlap Wheeler Park • 2.A2– Offer technical assistance on business continuity plans to local business community
Flooding
• 1.A1– Study the necessity and feasibility of offering buses from low-income neighborhoods to evacuation shelters. If the decision is made to offer this service, then develop an implementation plan

106
• 2.A1 – Develop incentives for property owners with properties in the flood zone to flood proof their structures
• 3.A1 – Increase culvert size, raise roadbeds, clear brooks, add guiderails, and make stormwater and drainage improvements to Town roads.
• 5.A1 – Reduce Inflow and Infiltration at the Wave Avenue Pump Station • 5.A2 – Increase Capacity at Wave Avenue Pump Station – COMPLETE • 5.A3– Eliminate Illegal Sump Pump Connections to Sanitary Sewer System • 6.A1 – Reduce Inflow and Infiltration at Paradise Avenue Pump Station • 9.A1 – Continually Clear Debris from the Maidford River • 9.A2 – Regulate Development in the Maidford River Watershed • 10.A1 –Implement Debris Clearing of Bailey Brook • 10.A2 – Limit Development in the Watershed of Bailey Brook • 10.A3 – Complete Watershed Analysis and Update Flood Maps as Needed - COMPLETE • 10.A4 – Extension of Buck Road to Serve as Evacuation Route • 13.A1 – Enforce Property Owners/Homeowners Associations to Maintain Drainage Features
Dam Failure
• 11.A1 – Work with Dam Owners to Encourage Proper Maintenance
Wildfire
• 15.A1 – Identify any forested or heavy brush areas within the Town’s jurisdiction that could create a wildfire hazard including the U.S. Sachuest Point Wildlife Refuge
• 15.A2– Monitor fire risk areas and implement outside burn restrictions during times of severe drought
Drought
• 15.A2– Monitor fire risk areas and implement outside burn restrictions during times of severe drought
Earthquakes
• Due to the low frequency of damage inducing earthquakes, no action specifically addresses this hazard. The Town enforces the State building code.
Hazardous Materials
• 1.A1 – Study the necessity and feasibility of offering buses from low-income neighborhoods to evacuation shelters. If the decision is made to offer this service, then develop an implementation plan
• 4.A1– Formalize input of emergency management staff in DPR application process for applications relating to hazardous materials in order to mitigate the impact of incidents
Terrorist Events
• No action specifically addresses vulnerability to terrorist events, though emergency management staff have various programs and procedures to prepare for and respond to some terrorist events as noted in the vulnerability assessment.

4.3 ACTION PLAN SUMMARY
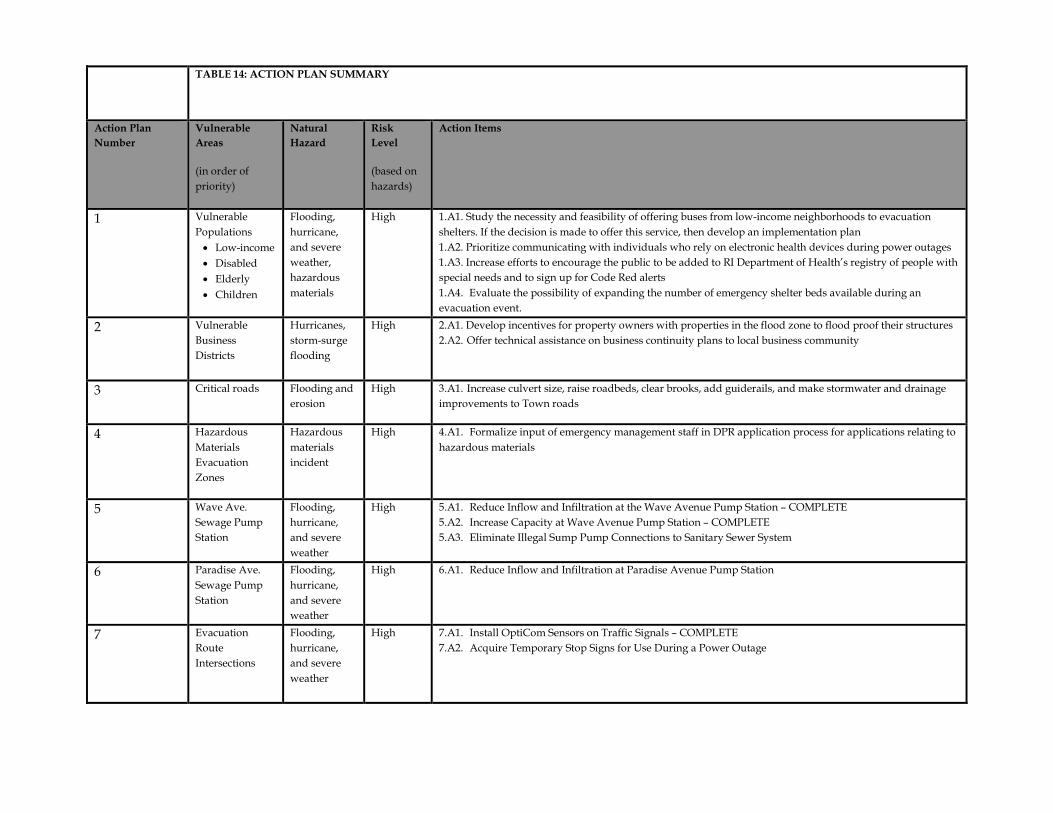
TABLE 14: ACTION PLAN SUMMARY
Action Plan Number
Vulnerable Areas
(in order of priority)
Natural Hazard
Risk Level
(based on hazards)
Action Items
1 Vulnerable Populations • Low-income • Disabled • Elderly • Children
Flooding, hurricane, and severe weather, hazardous materials
High 1.A1. Study the necessity and feasibility of offering buses from low-income neighborhoods to evacuation shelters. If the decision is made to offer this service, then develop an implementation plan 1.A2. Prioritize communicating with individuals who rely on electronic health devices during power outages 1.A3. Increase efforts to encourage the public to be added to RI Department of Health’s registry of people with special needs and to sign up for Code Red alerts 1.A4. Evaluate the possibility of expanding the number of emergency shelter beds available during an evacuation event.
2 Vulnerable Business Districts
Hurricanes, storm-surge flooding
High 2.A1. Develop incentives for property owners with properties in the flood zone to flood proof their structures 2.A2. Offer technical assistance on business continuity plans to local business community
3 Critical roads Flooding and erosion
High 3.A1. Increase culvert size, raise roadbeds, clear brooks, add guiderails, and make stormwater and drainage improvements to Town roads
4 Hazardous Materials Evacuation Zones
Hazardous materials incident
High 4.A1. Formalize input of emergency management staff in DPR application process for applications relating to hazardous materials
5 Wave Ave. Sewage Pump Station
Flooding, hurricane, and severe weather
High 5.A1. Reduce Inflow and Infiltration at the Wave Avenue Pump Station – COMPLETE 5.A2. Increase Capacity at Wave Avenue Pump Station – COMPLETE 5.A3. Eliminate Illegal Sump Pump Connections to Sanitary Sewer System
6 Paradise Ave. Sewage Pump Station
Flooding, hurricane, and severe weather
High 6.A1. Reduce Inflow and Infiltration at Paradise Avenue Pump Station
7 Evacuation Route Intersections
Flooding, hurricane, and severe weather
High 7.A1. Install OptiCom Sensors on Traffic Signals – COMPLETE 7.A2. Acquire Temporary Stop Signs for Use During a Power Outage

8
Essential Services
Severe weather, hurricanes and wind
High 8.A1. Continue Town Tree-Trimming Program 8.A2. Create a Public Tree Database for the Town’s Geographic Information System (GIS) 8.A3. Maintain Safe Roads during Snow and Ice Events 8.A4. Assess Impact of the Privatization of Navy Housing - COMPLETE
9 Maidford River
Flooding & erosion
High 9.A1. Continually Clear Debris from the Maidford River 9.A2. Regulate Development in the Maidford River Watershed
10 Bailey Brook
Flooding & erosion
High
10.A1 Implement Debris Clearing of Bailey Brook 10.A2. Limit Development in the Watershed of Bailey Brook 10.A3. Complete Watershed Analysis and Update Flood Maps as Needed – COMPLETE 10.A4. Extension of Buck Road to Serve as Evacuation Route - COMPLETE
11 Dams and Reservoirs
Flooding and hurricanes
High 11.A1. Work with Dam Owners to Encourage Proper Maintenance
12 Campgrounds and Trailer Parks
Flooding, erosion & wind
High
12.A1. Properly Anchor and Secure Mobile Homes and Recreational Vehicles
13 Recent Development Project Stormwater BMPs
Flooding High 13.A1. Enforce Property Owners/Homeowners Associations to Maintain Drainage Features
14 Shoreline Property
Erosion, hurricane, and severe weather
High 14.A1. Evaluate which shoreline properties are at significant erosion risk due to coastal surge and wave action during Hurricanes, Tropical Storms, and other Severe Weather 14.A2. Armor the shoreline at Dunlap Wheeler Park.
15 Vegetated Wildlife Areas
Wildfire, Drought
Low 15.A1. Identify any forested or heavy brush areas within the Town’s jurisdiction that could create a wildfire hazard including the U.S. Sachuest Point Wildlife Refuge 15.A2. Monitor fire risk areas and implement outside burn restrictions during times of severe drought

110
5.0 PLAN MAINTENANCE
The Town of Middletown and the Local Hazard Mitigation Committee realize that successful hazard mitigation is an ongoing process that requires implementation, evaluation, and updates to this plan. Also realized is the importance of integrating appropriate sections of the plan into the town’s Comprehensive Plan, Emergency Operations Plan, and site plan review process. It is intended that this plan and the ongoing efforts of the Local Hazard Mitigation Committee will preserve and enhance the quality of life, property, and resources for the Town of Middletown.
The town’s original hazard mitigation plan was approved by the Town Council and FEMA in 2005. The plan was updated in 2014. FEMA requires the plan to be updated every five years. Having a current plan affords Middletown important benefits that impact local property owners financially. Therefore, meeting the five-year update requirement is in the town’s interest.
Formal adoption of a hazard mitigation strategy gains Middletown credit points under the Federal Emergency Management Agency’s (FEMA) Community Rating System (CRS) which provides discounts on National Flood Insurance premiums. Adoption of this mitigation strategy also increases Middletown’s eligibility for federal hazard mitigation grants. These grants originate from FEMA’s Pre-Disaster Flood Mitigation Assistance (FMA), Pre-Disaster Mitigation (PDM) and post-disaster Hazard Mitigation Grant (HMGP) Programs. (Refer to Appendix B: Existing Protection Systems - State and Federal for further information.)
5.1 IMPLEMENTATION Upon adoption of the Hazard Mitigation Plan, its actions are assigned to the responsible agencies for planning and implementation. The Local Hazard Mitigation Committee assigns a time frame to each recommended mitigation action so that implementation of actions can be coordinated with other governmental functions, such as committee meetings and budget hearings. Assigning time frames also provides a way to track the progress of implementation. Generally, time frames do not account for fiscal constraints. Instead, they reflect the time it would take to complete a project once funded. As a result, not all actions in the plan will be completed within the set time frame if funding is unavailable.
Middletown’s comprehensive plan includes the entire Hazard Mitigation Plan as an appendix. When the comprehensive plan is updated in 2024, the hazard mitigation plan will be integrated into the body of the report. Including the theme of hazard mitigation in the comprehensive plan establishes the authority for the Town to implement the plan.
5.2 MONITORING The Local Hazard Mitigation Committee, under the leadership of the Fire Chief/EMA Director, will on a continuing basis monitor the actions contained in the plan. At each meeting, the committee members will discuss the actions assigned to them to ensure continual progress with mitigation efforts. The LHMC will also continue to reevaluate membership on the committee to ensure effective engagement of the appropriate parties. Lastly, the public will be invited to these open meetings to ensure continued public involvement.
111
5.3 EVALUATION The Local Hazard Mitigation Committee, under the leadership of the Fire Chief/EMA Director, will meet annually to evaluate the actions contained in the plan. The LHMC will base its evaluation on whether or not the actions have met the following criteria: increased public awareness/education, reduction in hazard damage, actions being implemented in the designated time frames, and actions staying within the cost estimate. The committee will document and report its findings. The LHMC will involve the public in the action evaluation process by holding advertised public meetings in order to review the evaluation and solicit input.
5.4 REVISIONS The Local Hazard Mitigation Committee, under the leadership of the Fire Chief/EMA Director, will evaluate and update the plan after a disaster, as funding opportunities arise for the actions and projects identified in the plan, or as actions are completed in order to re-prioritize.
A full revision of the Plan will commence a year in advance of the current plan expiration date in order to ensure the Town always has an approved plan. The update will be completed every five years and will incorporate a formalized process for prioritizing actions and weighing the cost/benefit of such actions. All updates or revisions to the plan will be submitted to the RIEMA. The Town Council will involve the public in the plan revision process by holding an advertised public meeting to present recommended revisions and solicit input. Revised plans will also be sent to the neighboring communities of Newport and Portsmouth and stakeholder groups as identified by FEMA, RIEMA, and the LHMC.
All future meetings will again be open to the public and it is the hope of the LHMC Committee that once the public education and outreach actions begin, public involvement in the plan will increase and will be reflected in future revisions. The LHMC ensured with the 2019 update that there were several opportunities for public involvement and the LHMC will continue this practice going forward. The LHMC will involve the public its meetings by posting it on the website and in the local newspaper to encourage involvement.
5.5 INCORPORATION INTO EXISTING PLANNING MECHANISMS State regulations require that Hazard Mitigation be addressed within Community Comprehensive Plans. Middletown’s comprehensive plan includes the entire Hazard Mitigation Plan as an appendix. When the comprehensive plan is updated in 2024, the hazard mitigation will be more thoroughly integrated into the body of the text. Including the theme of hazard mitigation in the comprehensive plan establishes the authority for the Town to implement the plan.
The hazard mitigation plan will be incorporated, where appropriate, into other town plans. These plans include but are not limited to the Town of Middletown Emergency Operations Plan (EOP), land use plans and regulations, and the Capital Improvement Plan. The LHMP may also be incorporated into mutual aid agreements, evacuation plans, and stormwater management plans.

112
Bibliography
Aquidneck Island Planning Commission & VHB. (July, 2011). Aquidneck Island Transportation Study. pp. Section 2-3.
Aquidneck Island Planning Commission. (2012). Aquidneck Island Open Space Mapping Project, Final Report.
Berkowitz, B., Denise Lu, and Chris Alcantara. (October 1, 2017 - updated January 24,2019). The Terrible Numbers that Grow with Each Mass Shooting,. The Washington Post.
Center, T. N. (2019, July 25). Hurricanes in History. Retrieved from NOAA: https://www.nhc.noaa.gov/outreach/history/#great
City of Newport: Department of Utilities. (February 25, 2019). Letter to RIDEM Dam Safety Program, “Re: Dam State I.D. Numbers 395, 396, 485, 580, 581, 582, 583, 584 and 585,”.
Climate Impacts Group. (n.d.). Joint Institute for the Study of the Atmosphere and Ocean.
Coastal Resources Center. (2017). Aquidneck Island Resilience Strategy. Narragansett, RI: Rhode Island Sea Grant.
Coastal Resources Management Council. (2019). Retrieved from STORMTOOLS: http://www.beachsamp.org/stormtools/
Council, R. C. (February 22, 2017. ). New NOAA sea level rise projectsions dramatically increase by 2100.
Edwards, R. (n.d.). The Online Tornado FAQ. Retrieved September 2012, from National Oceanic and Atmospheric Administration: Storm Prediction Center: http://www.spc.noaa.gov/faq/tornado
Elsner, T. S. (January 2013). Economic Impact Study of Rhode Island Plant-Based Industries and Agriculture. URI.
Federal Bureau of Investigation. (n.d.). Terrorism 2002-2005. Retrieved June 2012, from http://www.fbi.gov/stats-services/publications/terrorism-2002-2005
FEMA. (1997). Multi Hazards Risk Assessment.
FEMA. (2008). FEMA Local Multi-Hazard Mitigation Planning Guidance.
FEMA. (2012). Expected Building Damage by Occupancy. HAZUS.
FEMA. (2012). Hurricane Scenario Track v. 1938 Hurricane. HAZUS.
FEMA. (n.d.). Chapter 2, Types of Floods and Floodplains. Retrieved December 2018

113
Intergovernmental Panel on Climate Change. (2007). Climate Change 2007: Synthesis Report, Contribution of Working Groups I, II and III to the Fourth Assessment Report of the Intergovernmental Panel on Climate Change. Retrieved from IPCC: http://www.ipcc.ch/publications_and_data/ar4/syr/en/contents.html
Kahn, B. (November 5, 2012). Superstom Sandy and Sea Level Rise. NOAA.
Kaste, M. (March 15, 2018). Despite Heightened Fear of School Shootings, It’s Not a Growing Epidemic. NPR.
Madsen, T. a. (December 2007). When It Rains It Pours: Global Warming and the Rising Frequency of Extreme Precipitation in the United States. Environment America.
Merriam Webster Dictionary. (n.d.). Wind. Retrieved September 2012, from http://www.merriam-webster.com/dictionary/wind
Middletown Planning Department. (2011). West Main/Coddington Development Center Master Plan.
Middletown Planning Department. (2014). Town of Middletown Comprehensive Community Plan.
National Oceanic and Atmospheric Administration. (n.d.). Storm Event Database. Retrieved December 2018
National Oceanic and Atmospheric Administration. (n.d.). Storm Surge Overview. Retrieved December 2018, from https://www.nhc.noaa.gov/surge/
National Oceanic and Atmospheric Administration: National Centers for Environmental Information. (2014). State Summaries 149 RI.
National Weather Service. (2009, June 25). Glossary: Dam.
National Weather Service. (n.d.). NWS Boston - Hurricane Bob (1991). Retrieved June 2012, from https://www.weather.gov/box/hurricane_bob
National Weather Service. (n.d.). Saffir-Simpson Hurricane Wind Scale. Retrieved June 2012, from National Hurricane Center and Central Pacific Hurricane Center: www.nhc.noaa.gov/aboutsshws.php
Naval Undersea Warfare Center - Newport. (2018, March 9). 2017 Impact on Southern New England.
Neumann, C. e. (1987). Tropical Cyclones of the North Atlantic Ocean, 1871-1986. Washington, D.C.: U.S. Department of Commerce, NOAA.
NewportRIWeather.com. (n.d.). Monthly Weather Charts. Retrieved July 2012, from NewportRIWeather.com: http://www.newportriweather.com/mwd/years.html

114
R.I. Coastal Resources Management Council. (n.d.). STORMTOOLS for Beginners. Retrieved December 2018
Rhode Island Department of Environmental Management: Dam Safety Program. (April 2016). Notice of Violation: City of Newport.
Rhode Island Emergency Management Agency. (2008). State of Rhode Island Hazard Mitigation Plan.
Rhode Island Emergency Management Agency. (2011). State of Rhode Island Hazard Mitigation Plan.
Rhode Island Emergency Management Agency. (2018). State of Rhode Island Hazard Mitigation Plan.
RI Executive Climate Change Coordinating Council – Science and Technical Advisory Board. (May 1, 2016). Current State of Climate Science in Rhode Island.
RIDEM Office of Compliance and Inspection. (n.d.). 2016 Dam Safety Annual Report Attachment. Retrieved January 18, 2019
RIDEM Office of Compliance and Inspection. (April 6, 2018 ). 2017 Annual Report to the Governor on the Activities of the Dam Safety Program.
Rocheleau, M. (July 23, 2015). Major quake expected in N.E. once every 1,000 years. Boston Globe.
Survey, U. S. (December 2018). Earthquake Mapper.
The Atlantic Oceanographic and Meteorological Laboratory. (2007). Map of Empiracal Probability of a Named Storm.
The Insurance Institute for Property Loss Reduction. (1994).
The Weather Channel. (1995-2001). Hurricanes and Tropical Storms: Saffir-Simpson Hurricane Scale. Retrieved September 2012
U.S. Census Bureau. (2010). Census.
U.S. Census Bureau. (2016). American Community Survey.
U.S. Department of Transportation Pipeline and Hazardous Materials Safety Administration. (n.d.). Incident Reporting. Retrieved June 2012, from http://phmsa.dot.gov/hazmat/incident-report
U.S. Environmental Protection Agency. (n.d.). Hazardous Chemical Storage Reporting Requirements. Retrieved June 2012, from Emergency Planning and Community Right-to-Know Act (EPCRA): http://www.epa.gov/oem/content/epcra/epcra_storage.htm
U.S. Environmental Protection Agency. (n.d.). Wastes-Hazardous Waste. Retrieved June 2012, from http://www.epa.gov/osw/hazard/index.htm

115
United States Geological Survey. (n.d.). At What Magnitude Does Damage Begin to Occur in an Earthquake. Retrieved January 2019., from https://www.usgs.gov/faqs/what-magnitude-does-damage-begin-occur-earthquake?qt-news_science_products=0#qt-news_science_products
URI Climate Change. (2011, March). Climate Change in Rhode Island: What's Happening Now & What You Can Do. Retrieved May 2012, from URI Climate Change Collaborative: http://oceanservice.noaa.gov/education/pd/climate/teachingclimate/climate_change_in_rhode_island.pdf
Vallee, D. (1993). RHODE ISLAND HURRICANES AND TROPICAL STORMS A FIFTY -SIX YEAR SUMMARY . NOAA Technical Memorandum NWS ER-86.

116
Appendices

117
Appendix A: Technical and Financial Assistance for Mitigation

118
State Resources – Appendix A Rhode Island Emergency Management Agency 645 New London Avenue Cranston, RI 02920 (401) 946-9996 Coastal Resources Center University of Rhode Island Narragansett Bay Campus Narragansett, RI 02882 (401) 874-6224 Coastal Resources Management Council Stedman Government Center 4808 Tower Hill Road Wakefield, RI 02879 (401) 222-2476 Department of Administration/Division of Planning One Capitol Hill Providence, RI 02908 (401) 222-6478 State of Rhode Island Building Committee Office Building Commissioner’s Office 560 Jefferson Blvd, Suite 204 Warwick, RI 02886 (401) 222-3529 Rhode Island Builders Association The Terry Lane Corporation Terry Lane Gloucester, RI 02814 (401) 568-8006
Department of Transportation-Design Section/Bridges 2 Capitol Hill, Room 231D Providence, RI 02903 (401) 222-2053 Rhode Island Department of Business Regulations 233 Richmond Street Providence, RI 02903 (401) 222-2246 State Fire Marshal’s Office 272 West Exchange Street Providence, RI 02903 (401) 222-2335 Rhode Island Banking Commission/ Associate Director 233 Richmond Street Providence, RI 02903 (401) 222-2405 Public Utilities Commission 100 Orange Street Providence, RI 02903 (401) 222-3500 Ext. 153 Department of Environmental Management Division of Parks and Recreation 2321 Hartford Avenue Johnston, RI 02919 (401) 222-2635

119
Federal Resources - Appendix A
Federal Emergency Management Agency Mitigation Division Region I Office 99 High Street Boston, MA (617) 223-9561 U.S. Army Corps of Engineers New England District 696 Virginia Road Concord, MA 01742-2751 (978) 318-8111) U.S. Department of Agriculture Natural Resources Conservation Service (formerly Soil Conservation Service) 451 West Street Amherst, MA 01002 (413) 253-4362 U.S. Department of Commerce National Weather Service Forecast Office 445 Myles Standish Boulevard Taunton, MA 02780 (508) 823-2262 Economic Development Administration Philadelphia Regional Office The Curtis Center 601 Walnut Street, Suite 140 South Philadelphia, PA 19106-3323 (215) 597-8822 U.S. Department of the Interior National Park Service Rivers and Trails Conservation Program Regional Office 15 State Street Boston, MA 02109 (617) 223-5203
U.S. Fish and Wildlife Service Northeast Regional Office U.S. Fish and Wildlife Service 300 Westgate Center Drive Hadley, MA 01035-9587 (413) 253-8200 U.S. Department of Housing and Urban Development Community Development Block Grants Region I - O’Neill Federal Building 10 Causeway Street Boston, MA 02222 (617) 565-5354 Small Business Administration 10 Causeway Street Room 265 Boston, MA 02222 (617) 565-5590 U.S. Environmental Protection Agency Region I Offices 5 Post Office Square - Suite 100 Boston, MA 02109-3912 (617) 565 3400

120
Other Resources - Appendix A The Association of State Floodplain Managers (ASFPM) Professional association with a membership of almost 1,000 state employees that assists communities with the NFIP. ASFPM has developed a series of technical and topical research papers and a series of proceedings from their annual conferences. Many mitigation “success stories” have been documented through these resources and provide a good starting point for planning. Floodplain Management Resources Center Free library and referral service of the ASFPM for floodplain management publications. Co-located with the Natural Hazards Center at the University of Colorado in Boulder, staff can use keywords to identify useful publications from the more than 900 flood related documents in the library. Institute for Business and Home Safety (IBHS) (formerly Insurance Institute for Property Loss Reduction) An insurance industry–sponsored, nonprofit organization dedicated to reducing losses— deaths, injuries, and property damage—resulting from natural hazards. IBHS efforts are directed at five specific hazards: flood, windstorm, hail, earthquake, and wildfire. Through its public education efforts and information center, IBHS communicates the results of its research and statistical gathering, as well as mitigation information, to a broad audience. Volunteer Organizations Organizations, such as the American Red Cross, the Salvation Army, Habitat for Humanity, Interfaith, and the Mennonite Disaster Service, are often available to help after disasters. Service organizations, such as the Lions, Elks, and VFW are also available. These organizations have helped others with food, shelter, clothing, money, etc. Habitat for Humanity and the Mennonite Disaster Service provide skilled labor to help rebuild damaged buildings incorporating mitigation or flood proofing concepts. The offices of individual organizations can be contacted directly, or the FEMA Regional Office may be able to assist. Flood Relief Funds After a disaster, local businesses, residents, and out-of-town groups often donate money to local relief funds. They may be managed by the local government, one or more local churches, or an ad hoc committee. No government disaster declaration is needed. Local officials should recommend that the funds be held until an applicant exhausts all sources of public disaster assistance. Doing so allows the funds to be used for mitigation and other projects that cannot be funded elsewhere. New England States Emergency Consortium (NESEC) NESEC conducts public awareness and education programs on natural disaster and emergency management activities throughout New England. Brochures and videotapes are available on such topics as earthquake preparedness, mitigation, and hurricane safety tips. NESEC maintains a website that is accessible at http://www.serve.com/NESEC.
121
Appendix B: Existing Protection Systems - State and Federal

122
State- Appendix B Earthquakes and Hurricanes A certain amount of funding is allotted to each state per year based on a risk formula for earthquakes. Coastal states are allocated funds based on a risk formula for hurricanes. Each state receiving such funds has the ability to grant project funds to a community. There is not a match requirement on the part of the community, but the funds are limited, and are generally only available once a year. The projects or products proposed for such funding must demonstrate that earthquake or hurricane risk will be reduced or eliminated, and that the proposed project or product is a cost-effective measure (a stringent cost/benefit analysis need not be performed). Information about the amount of funding available per year and the state requirements for eligibility and performance may be obtained from RIEMA at (401) 946-9996. Economic/Community Development There may be programs existing to help flood-proof homes using Community Development Block Grant funds. There may be housing assistance programs in the community that can be used following a major flood, achieving both the objectives of reducing flood damage and improving the community’s housing stock (see Appendix A, Federal Resources, for more information). Evacuation Plans and Systems Your community’s emergency operations center should have evacuation plans in place. For communities near a nuclear power plant, evacuation plans are required, and may also be used for flood evacuation. RIEMA may have additional evacuation plan information. Land Use Restrictions There are several federal and state regulations that serve to restrict land use in certain areas that may help reduce flood hazard vulnerability. If your community has open land owned by the state or federal government, examine what restrictions are placed on its development. In addition, the state Wetlands Protection Act regulates the development of all lands identified as significant to the protection of resources identified in the act. Septic Systems If there are areas in the community not served by a public sewer system, state septic system regulations influence development and may be a consideration for mitigation alternatives that include rebuilding and elevation of structures. Specific design requirements must be met for any construction in coastal velocity zones or river floodways. Generally, an inspection of a septic system is required if there is a change in use of the structure, an increase in flow, or a failed system. Limited inspections are required if the footprint of the structure is being changed. Upgrades are required by the state if an inspection reveals a failed system. However, local regulations may be more restrictive than state requirements, requiring inspections or upgrades in other cases. State Barrier Beaches Your community may have barrier beaches, as defined by the state’s Coastal Resources Management Program. The regulations applying to these areas are enforced by CRMC. These regulations restrict alteration of the beach and/or dunes and the construction of coastal engineering structures. New or substantially reconstructed buildings generally must be elevated to a minimum of 1 foot above base flood elevation. No new commercial development is allowed on barrier beaches. If a structure is damaged more than 50 percent, it cannot be rebuilt. Warning Systems and Emergency Operations Plans Your community may have a flood warning system in place and should have a plan for response to flooding. In addition, RIEMA has offices throughout the state that maintain area-wide plans for flood events.

123
Federal- Appendix B Coastal Barrier Resource Act Administered by the U.S. Fish and Wildlife Service, this program has mapped public and private land identified as undeveloped coastal barrier areas. These areas may be denoted as “Otherwise Protected Areas” if they are owned by public entities. In the coastal barrier areas shown on FEMA’s flood insurance rate maps, structures newly built or substantially improved after the date shown on the maps are ineligible for federal flood insurance. This serves to restrict new development in these areas because the purchase of flood insurance is required to obtain federally backed mortgages and improvement loans for structures located in special flood hazard areas. Community Rating System (CRS) A voluntary initiative of the NFIP, the CRS was developed to encourage communities to perform activities that exceed the minimum NFIP floodplain management standards. If a community participating in the CRS performs activities that include maintaining records for floodplain development, publicizing the flood hazard, improving flood data, and conducting floodplain management planning, then the flood insurance premiums paid by policy holders in the community will be reduced by 5 to 45 percent. Developing a flood mitigation plan will help communities gain additional credit under the CRS. Hazard Mitigation Grant Program Also known as the 404 Program or HMGP, this program is available only after a federally declared disaster occurs. It represents an additional 15 percent of all the infrastructure and individual assistance funds that are provided to states to repair damages and recover from losses, and is administered by the state in partnership with FEMA. Having a plan or completed mitigation action matrix prior to a disaster event is extremely helpful in meeting the state’s deadlines for applications and ensuring the project is eligible and technically feasible. It provides 75/25 matching grants on a competitive basis to state, local, and tribal governments, as well as to certain nonprofit organizations that can be matched by either cash or in-kind services. The grants are specifically directed toward reducing future hazard losses, and can be used for projects protecting property and resources against the damaging effects of floods, earthquakes, wind, and other hazards. Specific activities encouraged under the HMGP include acquiring damaged structures to turn the land over to the community for open space or recreational use, relocating damaged or damage-prone structures out of the hazard area, and retrofitting properties to resist the damaging effects of disasters. Retrofitting can include wet- or dry-flood-proofing, elevation of the structure above flood level, elevation of utilities, or proper anchoring of the structure. Two programs that have been authorized under the National Flood Insurance Reform Act of 1994 include the Flood Mitigation Assistance (FMA) program and a provision for increased cost of compliance (ICC) coverage. FMA makes grants available on a pre-disaster basis for flood mitigation planning and activities, including acquisition, relocation, and retrofitting of structures. FMA grants for mitigation projects will be available only to those communities with approved hazard mitigation plans. ICC coverage has recently been implemented for all new NFIP policies and renewals and is intended to be “mitigation insurance” to allow homeowners whose structures have been repeatedly or substantially damaged to cover the cost of elevation and design requirements for rebuilding with their flood insurance claim up to a maximum of $15,000. A certain amount of funding is allotted to each state per year based on a risk formula for floods. Each state has the discretion to award funds to communities or to state government agencies. States may use whatever criteria or method they choose to award the funds as long as the applicant and the proposal are eligible. The program may fund up to 75 percent of the total cost of the proposed project, with a minimum of 25 percent of the cost coming from the community. A minimum of half the community share must be cash or “hard match.” Funds can also be granted to communities to help them prepare local flood mitigation plans. The same match requirements apply. Once a community receives a planning grant, however, it is not eligible to receive additional planning grants for another five years. For further information on the FMA program or ICC coverage contact RIEMA at (401) 946-9996.

124
National Flood Insurance Program (NFIP) All of Rhode Island’s 39 municipalities participate in the NFIP. This program is a direct agreement between the federal government and the local community that flood insurance will be made available to residents in exchange for community compliance with minimum floodplain management regulations. Communities participating in the NFIP must:
• Adopt the flood insurance rate maps as an overlay regulatory district • Require that all new construction or substantial improvement to existing structures in the flood
hazard area be elevated or (if nonresidential) flood-proofed to the identified flood level on the maps
• Require design techniques to minimize flood damage for structures being built in high hazard areas, such as floodways or velocity zones
In return for community adoption of these standards, any structure in that community is eligible for protection by flood insurance, which covers property owners from losses due to inundation from surface water of any source. Coverage for land subsidence, sewer backup, and water seepage is also available subject to the conditions outlined in the NFIP standard policy (see Appendix A, Federal Resources, for contacts regarding insurance coverage and purchase). Since homeowner’s insurance does not cover flooding, a community’s participation in the NFIP is vital to protecting property in the floodplain as well as being essential to ensure that federally backed mortgages and loans can be used to finance flood-prone property.

125
Appendix C: Public Information and Outreach
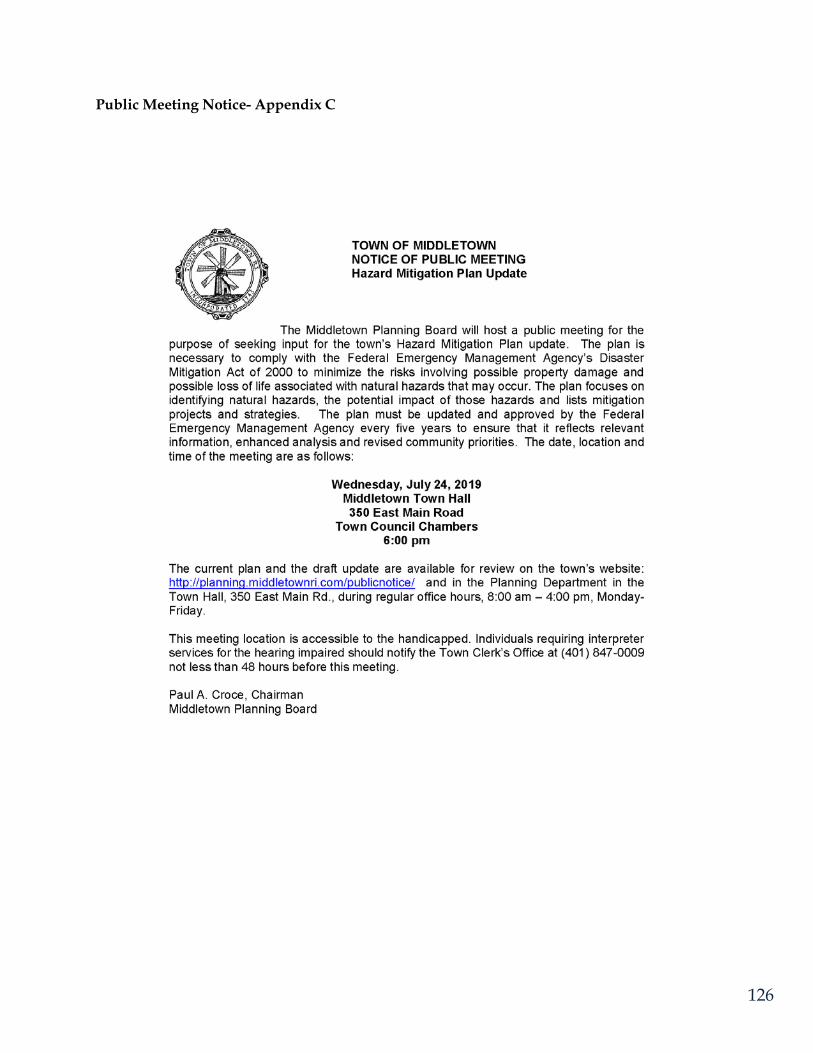
126
Public Meeting Notice- Appendix C

127
128

129
Public Meeting Presentation- Appendix C Public Hearing, Planning Board 7/24/2019

130

131

132

133
Public Presentation of Final Plan Pending Adoption,
Middletown Town Council, 11/22/2019

134

135

136
Appendix D: Maps

137
Zoning Map- Appendix D

138
Parcels Impacted by Flood Zones - Appendix D

139

140

141

142

143

144

145

146

147
Hazard Areas and Vulnerable Populations - Appendix D

148
Dam Failure - Appendix D

149