asian pacific islander catholics in the united states asian pacific islander catholics in the united...
TRANSCRIPT

1
Asian Pacific Islander Catholics in the United States:
A Preliminary Report1
January 2015
Prepared by
Jerry Z. Park
W. Matthew Henderson Kenneth Vaughan Baylor University2
Tricia Bruce
Maryville College3
Stephen Cherry University of Houston-Clear Lake4
1 This report is funded in part by support from the US Catholic Conference of Bishops. We are grateful for data and reports from the Pew Research Centers, and the Center for Applied Research in the Apostolate from which these findings were developed. All errors are the responsibility of the research team. 2 Jerry Z. Park is associate professor of sociology at Baylor University; W. Matthew Henderson and Kenneth Vaughan are graduate students in the department of sociology at Baylor University 3 Tricia Bruce is associate professor of sociology at Maryville College. 4 Stephen Cherry is assistant professor of sociology at the University of Houston-Clear Lake
2
Introduction
Christianity throughout the world constitutes the largest body of religious peoples according to
recent estimates. As of 2010, there are an estimated 2.2 billion Christians in the world, nearly
one-third of the world population. At an estimated 1.1 billion, Roman Catholicism stands as the
largest body of Christian believers when divided along the most traditional demarcations of
Catholic, Orthodox and Protestant.
The largest concentration of the world’s 7 billion inhabitants is in Asia, and historically
Christianity has been a minority faith community within the many nations that make up this
continent (about 6 percent), and a majority faith in a very few. The 20th and 21st centuries,
however, have born witness to a growth of Christianity throughout more countries in this region.
We know this more clearly in recent years as researchers have made better efforts to collect the
best estimates of the world’s religious adherents. We know also that of the 214 million
individuals who have emigrated from one country to another, Christians are the largest share of
these sojourners (49 percent). Moreover, we now know the specific origins of religious
immigrants. Migration to the United States from Asia competes with migration from Latin
America, and religion plays an important part in the stories of immigrants. While Christianity,
specifically Catholicism, is the dominant religion among immigrants from Latin America, it is a
minority faith among immigrants from Asia. In the specific US context, the largest receiving
nation of the world’s migrants, Christianity remains the majority among today’s new arrivals,
and much like Asian immigrants around the world, the majority of US Asian immigrants are not
Christian.

3
In this report, we present some of these new estimates as they relate to several important but
largely overlooked populations: Catholics in Asia and the Pacific Islands, and Asian and Pacific
Islander Catholic Americans. We find that the Catholic population in Asia and the Pacific Islands
stretches across more than 40 nations, but the majority are located in but a handful of countries.
Catholicism in Asia varies significantly from Catholicism in the Pacific Islands. The nations of
the Pacific Islands are predominantly Christian, whereas only one country in Asia is
predominantly Christian. In both regions, Catholicism specifically dominates only one nation.
Christianity is not the dominant religion among the migrants from Asia, but a large fraction of
US Asian immigrants are Catholic. Among the 16 million people who identify as Asian or
Pacific Islander Americans, both immigrant and native-born, Catholicism is also a large but not a
dominant fraction. Relative to other religious Asian Americans, Catholic Asian Americans are
highly devout, retain their faith across generations, and marry within their faith tradition.

4
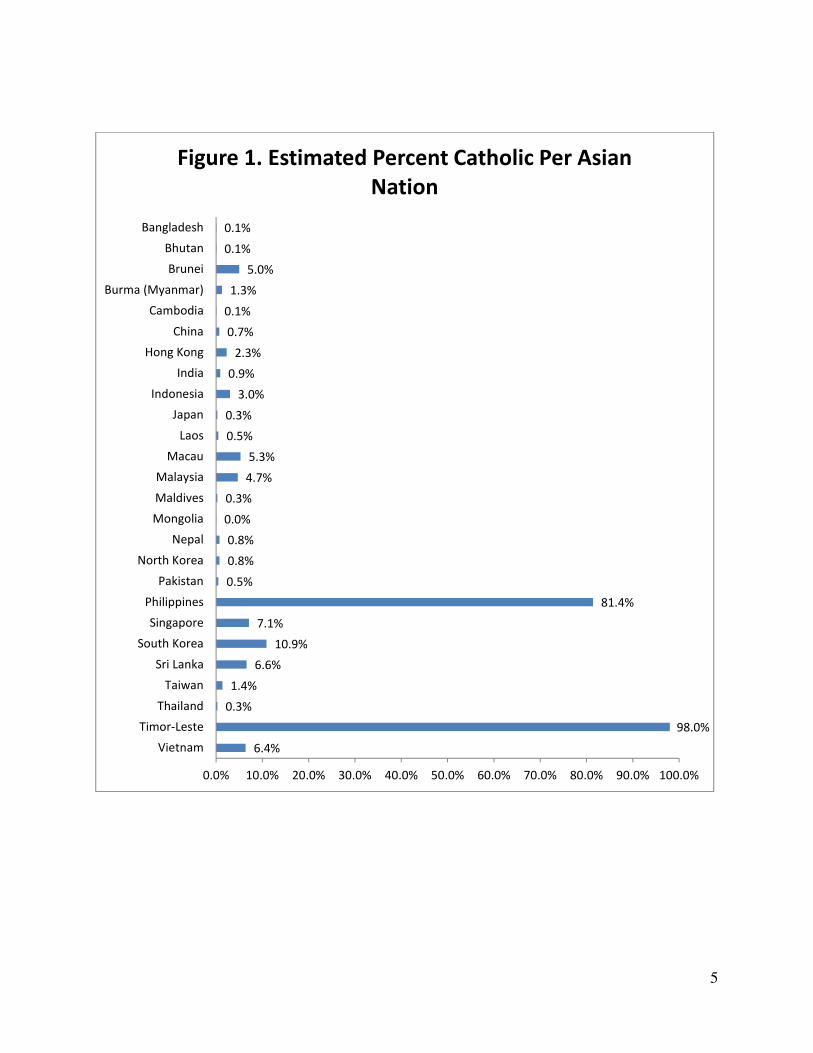
Catholicism in Asia
• According to analyses of numerous surveys across 26 countries in Asia, the Pew
Research Centers estimate about 120 million Catholics living in Asia. This is the largest
percentage of Catholics in the Asian and Pacific Island region.
• Only 3 percent of Asia’s population identifies as Catholic.
• The only Asian nations or territories5 with Catholic majorities are the Philippines (about
81 percent of the Filipino population) and Timor-Leste (98 percent).
• Timor-Leste’s percentage of Catholics is also the highest percentage among all Asian and
Pacific Islands nations.
• Among the Asian host nations and territories, Catholics make up a majority of Christians
in Sri Lanka, Timor-Leste, Vietnam, and the Philippines. Catholics make up a very slight
majority of the Christian population in Brunei and Malaysia.
• Of the Asian nations and territories, Bangladesh, Bhutan, Cambodia, and Mongolia have
the lowest percentages of Catholics. All of these nations have Catholic populations of less
than 0.1 percent.
• The persecution of minority Christians in several of the Asian host nations have
contributed to Asian Christian immigration to the United States.
5 Territories refer to disputed territories and culturally distinct or governmentally autonomous areas that are under the governance of another nation.
5
6.4%
98.0%
0.3%
1.4%
6.6%
10.9%
7.1%
81.4%
0.5%
0.8%
0.8%
0.0%
0.3%
4.7%
5.3%
0.5%
0.3%
3.0%
0.9%
2.3%
0.7%
0.1%
1.3%
5.0%
0.1%
0.1%
0.0% 10.0% 20.0% 30.0% 40.0% 50.0% 60.0% 70.0% 80.0% 90.0% 100.0%
Vietnam
Timor-Leste
Thailand
Taiwan
Sri Lanka
South Korea
Singapore
Philippines
Pakistan
North Korea
Nepal
Mongolia
Maldives
Malaysia
Macau
Laos
Japan
Indonesia
India
Hong Kong
China
Cambodia
Burma (Myanmar)
Brunei
Bhutan
Bangladesh
Figure 1. Estimated Percent Catholic Per Asian
Nation
6
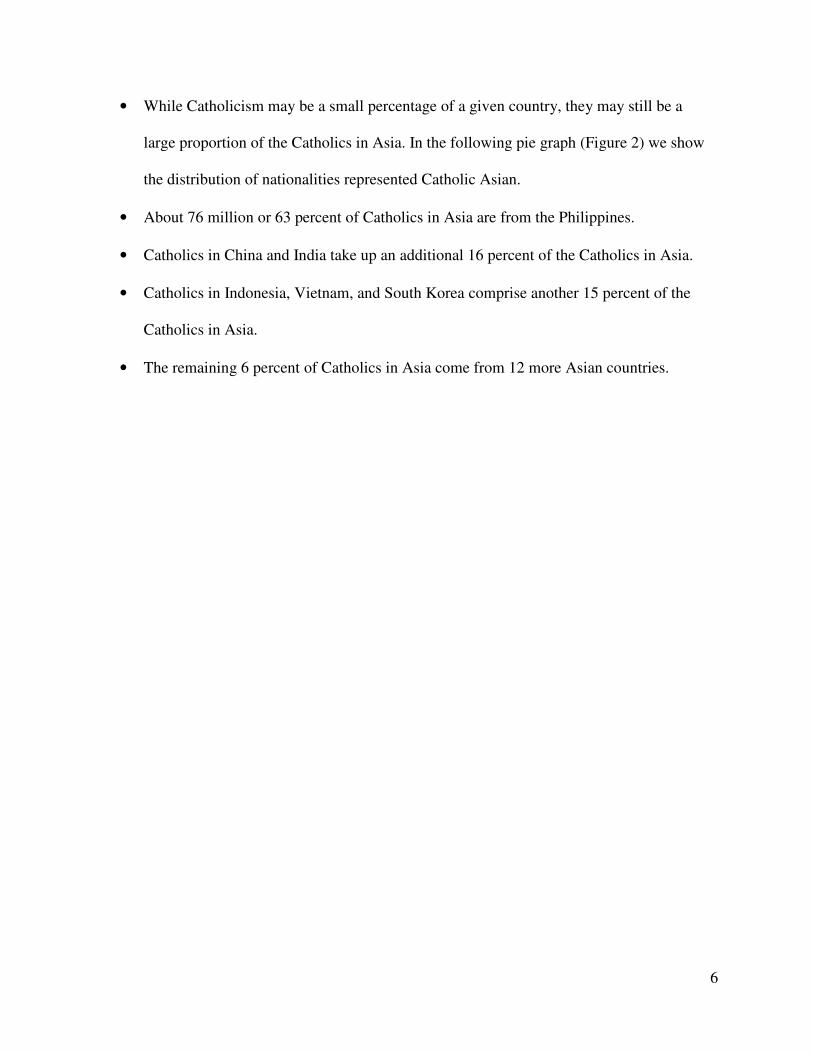
• While Catholicism may be a small percentage of a given country, they may still be a
large proportion of the Catholics in Asia. In the following pie graph (Figure 2) we show
the distribution of nationalities represented Catholic Asian.
• About 76 million or 63 percent of Catholics in Asia are from the Philippines.
• Catholics in China and India take up an additional 16 percent of the Catholics in Asia.
• Catholics in Indonesia, Vietnam, and South Korea comprise another 15 percent of the
Catholics in Asia.
• The remaining 6 percent of Catholics in Asia come from 12 more Asian countries.

7
Bangladesh, 0.09%
Bhutan, 0.00%
Brunei, 0.02%Burma (Myanmar), 0.51%
Cambodia, 0.00%
China, 7.47%
Hong Kong, 0.13%
India,
8.77%
Indonesia, 6.00%
Japan, 0.33%
Laos, 0.02%
Macau, 0.02%
Malaysia, 1.10%
Maldives, 0.00%
Mongolia, 0.00%
Nepal, 0.00%
North Korea, 0.03%
Pakistan, 0.67%
Philippines, 62.99%
Singapore, 0.30%
South Korea,
4.37%
Sri Lanka, 1.14%
Taiwan, 0.27%
Thailand, 0.20%
Timor-Leste, 0.91%
Vietnam,
4.64%
Other, 3.52%
Figure 2. Estimated Ethnic Distribution of Asian Catholics (2010)
8
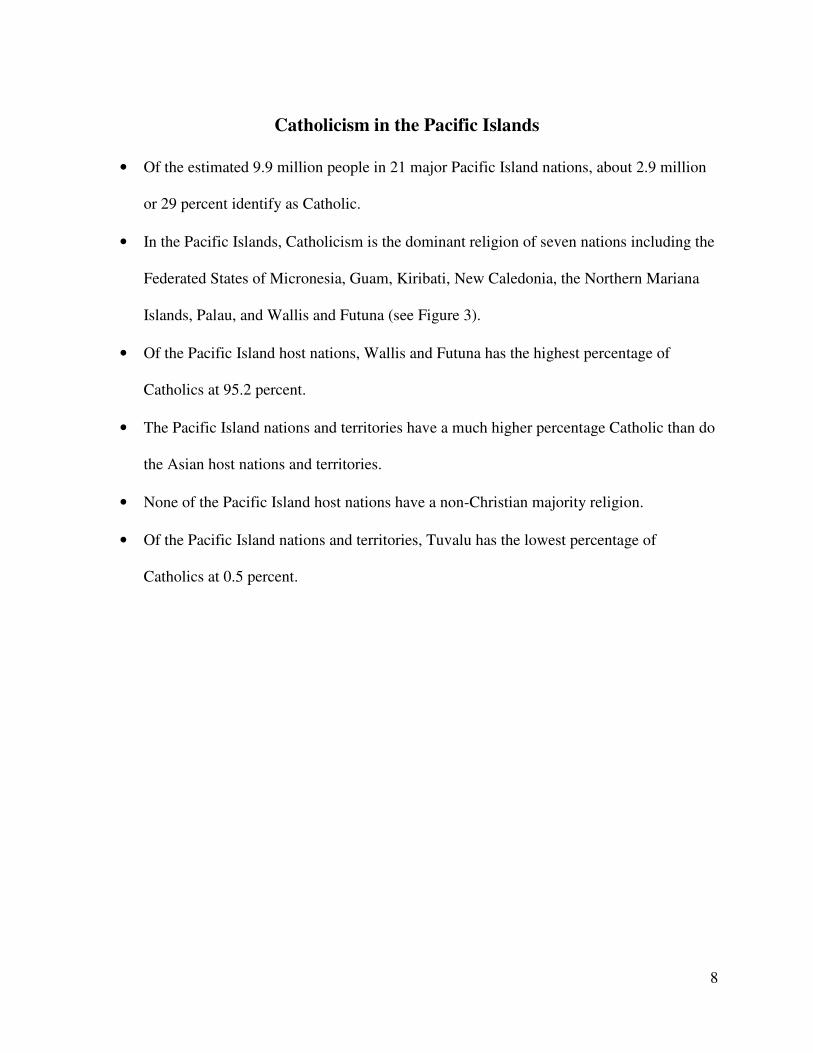
Catholicism in the Pacific Islands
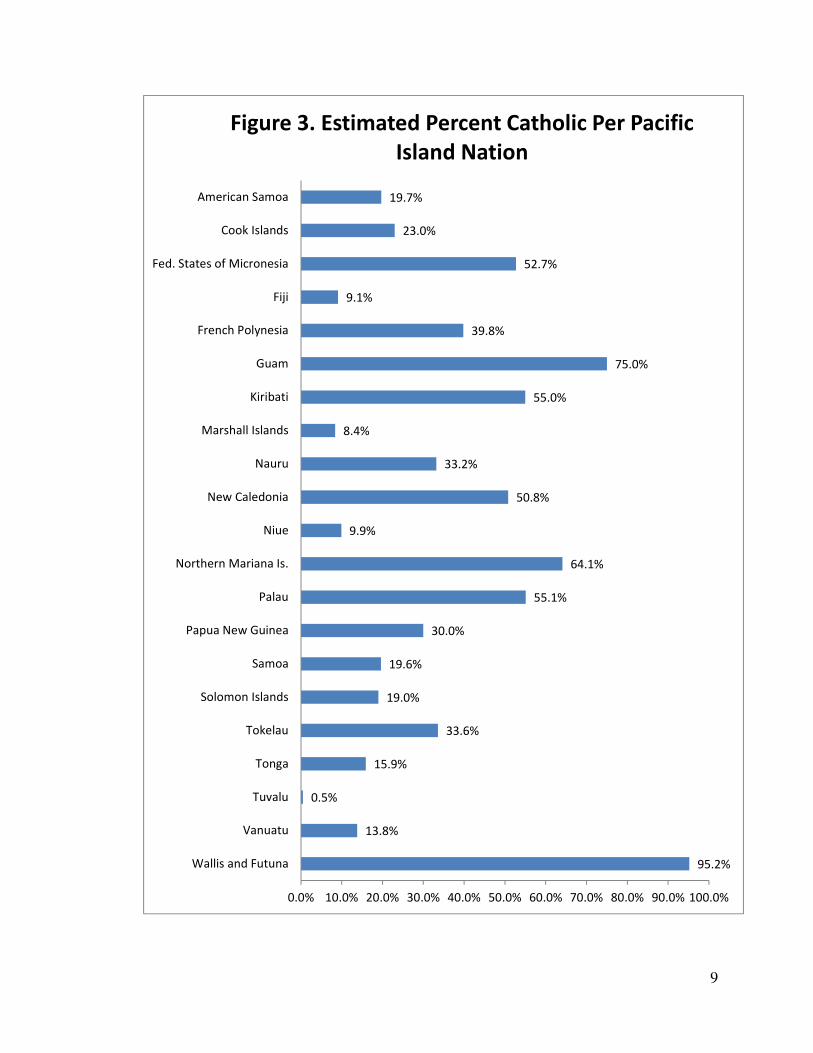
• Of the estimated 9.9 million people in 21 major Pacific Island nations, about 2.9 million
or 29 percent identify as Catholic.
• In the Pacific Islands, Catholicism is the dominant religion of seven nations including the
Federated States of Micronesia, Guam, Kiribati, New Caledonia, the Northern Mariana
Islands, Palau, and Wallis and Futuna (see Figure 3).
• Of the Pacific Island host nations, Wallis and Futuna has the highest percentage of
Catholics at 95.2 percent.
• The Pacific Island nations and territories have a much higher percentage Catholic than do
the Asian host nations and territories.
• None of the Pacific Island host nations have a non-Christian majority religion.
• Of the Pacific Island nations and territories, Tuvalu has the lowest percentage of
Catholics at 0.5 percent.
9
95.2%
13.8%
0.5%
15.9%
33.6%
19.0%
19.6%
30.0%
55.1%
64.1%
9.9%
50.8%
33.2%
8.4%
55.0%
75.0%
39.8%
9.1%
52.7%
23.0%
19.7%
0.0% 10.0% 20.0% 30.0% 40.0% 50.0% 60.0% 70.0% 80.0% 90.0% 100.0%
Wallis and Futuna
Vanuatu
Tuvalu
Tonga
Tokelau
Solomon Islands
Samoa
Papua New Guinea
Palau
Northern Mariana Is.
Niue
New Caledonia
Nauru
Marshall Islands
Kiribati
Guam
French Polynesia
Fiji
Fed. States of Micronesia
Cook Islands
American Samoa
Figure 3. Estimated Percent Catholic Per Pacific
Island Nation
10
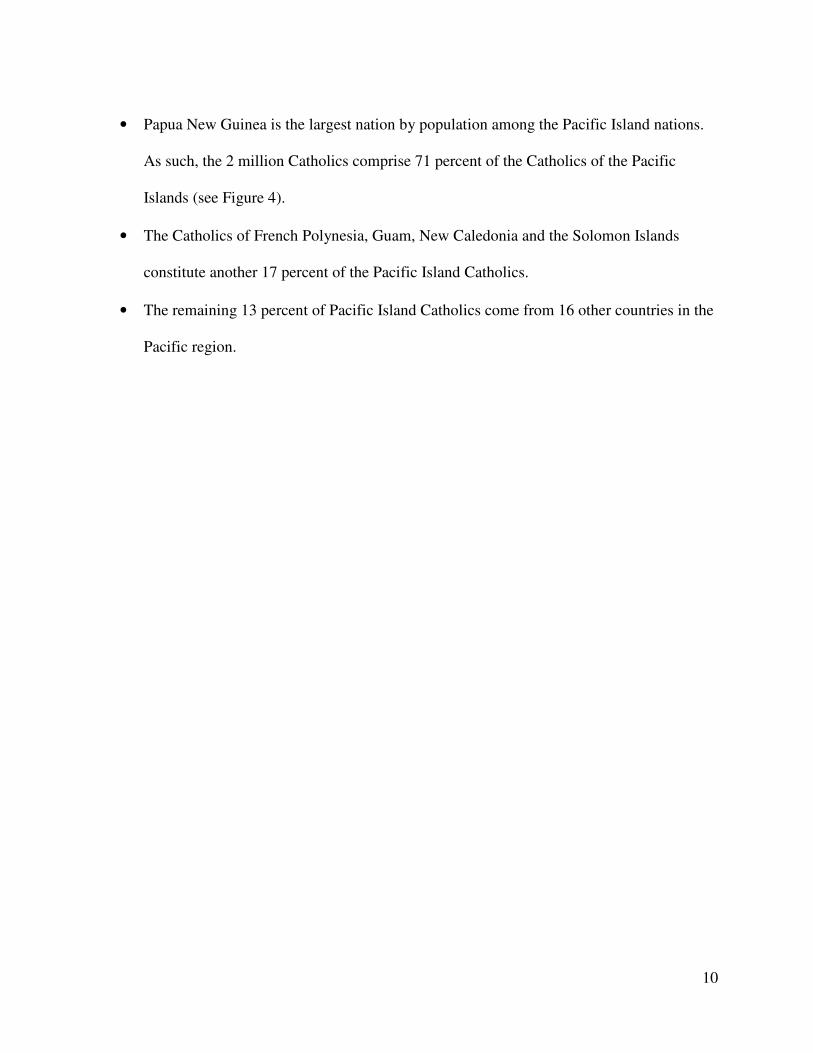
• Papua New Guinea is the largest nation by population among the Pacific Island nations.
As such, the 2 million Catholics comprise 71 percent of the Catholics of the Pacific
Islands (see Figure 4).
• The Catholics of French Polynesia, Guam, New Caledonia and the Solomon Islands
constitute another 17 percent of the Pacific Island Catholics.
• The remaining 13 percent of Pacific Island Catholics come from 16 other countries in the
Pacific region.

11
American Samoa,
0.34%
Cook Islands, 0.17%
Fed. States of Micronesia,
2.06%
Fiji, 2.75%
French Polynesia, 3.78%
Guam, 4.82%
Kiribati, 1.72%
Marshall Islands, 0.17%
Nauru, 0.17%
New Caledonia, 4.47%
Niue, 0.02%
Northern Mariana Is., 1.38%
Palau, 0.34%
Papua New Guinea, 70.86%
Samoa, 1.38% Solomon Islands, 3.44%
Tokelau, 0.02%
Tonga, 0.69% Tuvalu, 0.03%
Vanuatu, 1.03%Wallis and Futuna, 0.34%
Figure 4. Estimated Ethnic Distribution of Pacific Islander Catholics
(2010)

12
Catholicism in Migration: From Asia to the United States
• Scholars have long noted that migration to the US tends to be “pro-Christian.” Even in
countries where Christianity is not the dominant religion, we find that immigrants from
those countries are disproportionally Christian.
• In Figure 5, we showcase the comparative difference between the percentage of Catholics
in specific Asian sending nations and the percentage of Catholic immigrants from those
countries.
• With the exception of Filipino immigrants to the US, Asian immigrants are
disproportionally Catholic compared to their presence in their countries of origin. For
example, while less than 7 percent of Vietnam is Catholic, more than 30 percent of
Vietnamese immigrants identify as Catholic.

13
0%
10%
20%
30%
40%
50%
60%
70%
80%
90%
China Philippines India Japan South Korea Vietnam All Other
Asian/Pacific
Islander
Figure 5. Percent of Catholics in Sending Nations and among First
Generation Asian American Ethnic Groups
Percent of Sending Nation
Percent of American Ethnic
Group

14
Catholicism among Asian Pacific Islanders in the US
In the following we present findings using data from the Pew Research Center’s Asian American
Survey 2012 (PAAS). Unlike most surveys, the PAAS was translated into 7 Asian languages to
identify APIs with limited English fluency. Out of 3,500 adult respondents surveyed about 700
self-identified as Catholic. This is about 20 percent of the adult API population.
Demographic Characteristics
• The ethnic group with the largest share of Catholics among Asian Pacific Islanders is
Filipino (51%)
• Asian Pacific Islander Catholicism is the second religion among Asian Pacific Islander
Americans that is dominated by one ethnic group.
0%
20%
40%
60%
80%
100%
Catholics Other Christians Other Religion No Religion
Figure 6. Ethnicity by Religious Tradition Among
Asian Americans
Chinese
Filipino
Indian
Japanese
Korean
Vietnamese
All Other Asian

15
• The majority of Asian Pacific Islanders are foreign-born immigrants (about 70 percent),
and Asian Pacific Islanders are dominated by members of this first generation (about 71
percent).
• Asian Pacific Islander Catholics are more largely first generation compared to other
Christian APIs (see Figure 7).
• The second generation (those born in the US to immigrant parents, and those immigrants
who were raised in the US (arriving prior to age 13)) take up the second largest share of
Asian Pacific Islander Catholics (about 26 percent).
0%
10%
20%
30%
40%
50%
60%
70%
80%
90%
100%
Catholics Other
Christians
Other Religion No Religion
Figure 7. Generational Status by Religous
Tradition
First Generation
Second Generation
Third Generation
16
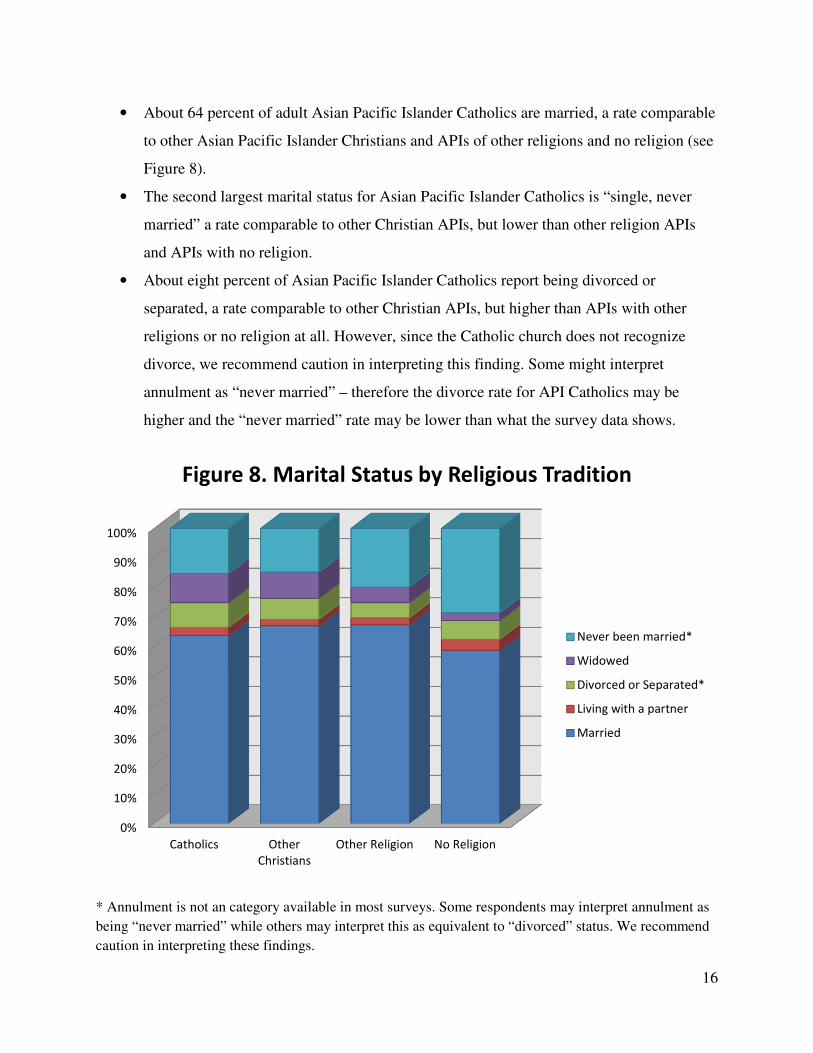
• About 64 percent of adult Asian Pacific Islander Catholics are married, a rate comparable
to other Asian Pacific Islander Christians and APIs of other religions and no religion (see
Figure 8).
• The second largest marital status for Asian Pacific Islander Catholics is “single, never
married” a rate comparable to other Christian APIs, but lower than other religion APIs
and APIs with no religion.
• About eight percent of Asian Pacific Islander Catholics report being divorced or
separated, a rate comparable to other Christian APIs, but higher than APIs with other
religions or no religion at all. However, since the Catholic church does not recognize
divorce, we recommend caution in interpreting this finding. Some might interpret
annulment as “never married” – therefore the divorce rate for API Catholics may be
higher and the “never married” rate may be lower than what the survey data shows.
* Annulment is not an category available in most surveys. Some respondents may interpret annulment as
being “never married” while others may interpret this as equivalent to “divorced” status. We recommend
caution in interpreting these findings.
0%
10%
20%
30%
40%
50%
60%
70%
80%
90%
100%
Catholics Other
Christians
Other Religion No Religion
Figure 8. Marital Status by Religious Tradition
Never been married*
Widowed
Divorced or Separated*
Living with a partner
Married
17
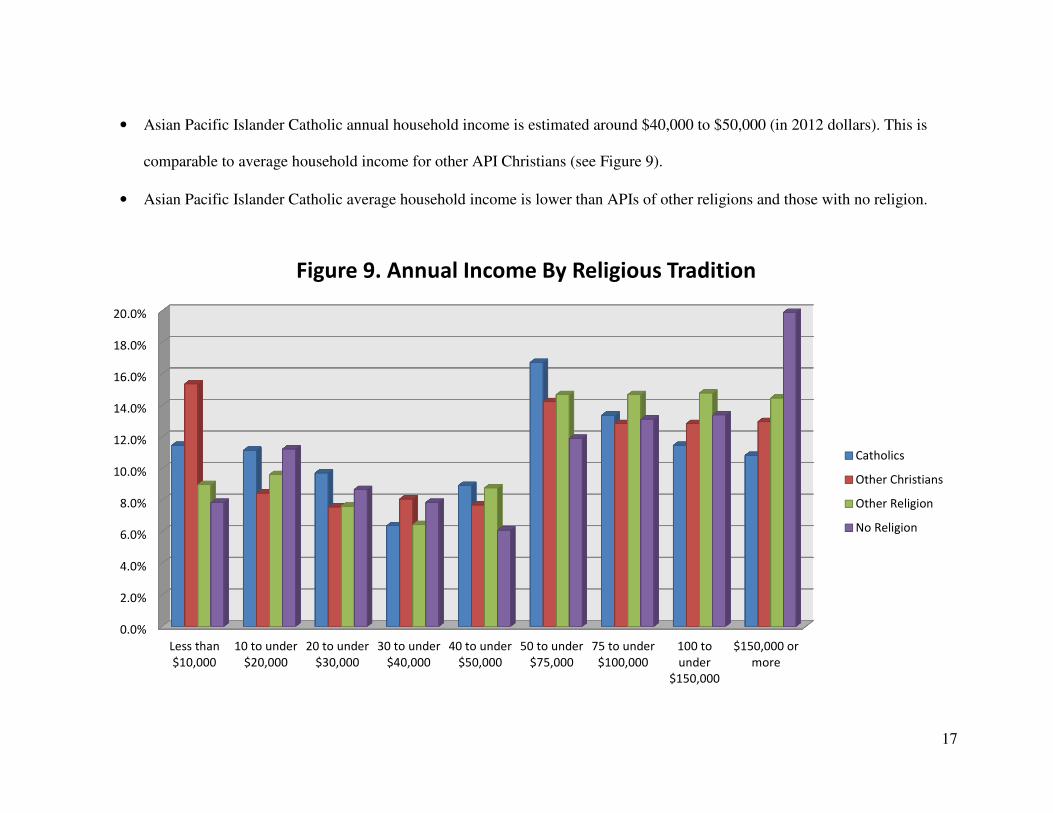
• Asian Pacific Islander Catholic annual household income is estimated around $40,000 to $50,000 (in 2012 dollars). This is
comparable to average household income for other API Christians (see Figure 9).
• Asian Pacific Islander Catholic average household income is lower than APIs of other religions and those with no religion.
0.0%
2.0%
4.0%
6.0%
8.0%
10.0%
12.0%
14.0%
16.0%
18.0%
20.0%
Less than
$10,000
10 to under
$20,000
20 to under
$30,000
30 to under
$40,000
40 to under
$50,000
50 to under
$75,000
75 to under
$100,000
100 to
under
$150,000
$150,000 or
more
Figure 9. Annual Income By Religious Tradition
Catholics
Other Christians
Other Religion
No Religion
18
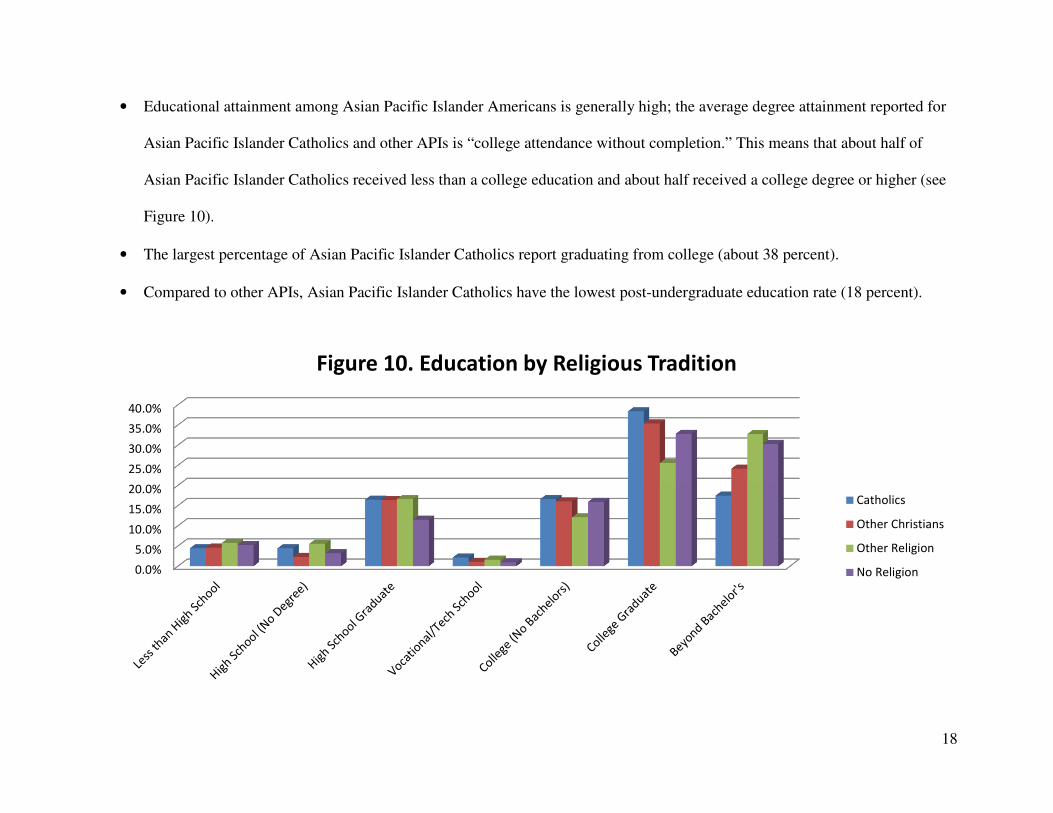
• Educational attainment among Asian Pacific Islander Americans is generally high; the average degree attainment reported for
Asian Pacific Islander Catholics and other APIs is “college attendance without completion.” This means that about half of
Asian Pacific Islander Catholics received less than a college education and about half received a college degree or higher (see
Figure 10).
• The largest percentage of Asian Pacific Islander Catholics report graduating from college (about 38 percent).
• Compared to other APIs, Asian Pacific Islander Catholics have the lowest post-undergraduate education rate (18 percent).
0.0%
5.0%
10.0%
15.0%
20.0%
25.0%
30.0%
35.0%
40.0%
Figure 10. Education by Religious Tradition
Catholics
Other Christians
Other Religion
No Religion
19
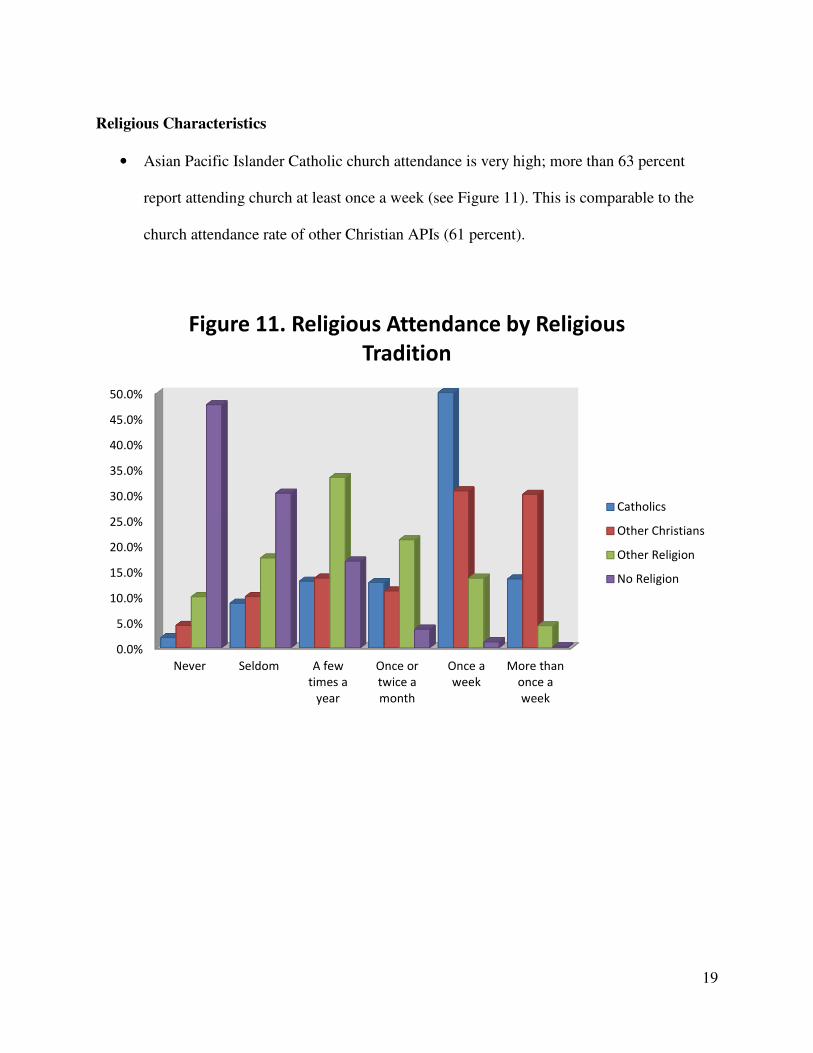
Religious Characteristics
• Asian Pacific Islander Catholic church attendance is very high; more than 63 percent
report attending church at least once a week (see Figure 11). This is comparable to the
church attendance rate of other Christian APIs (61 percent).
0.0%
5.0%
10.0%
15.0%
20.0%
25.0%
30.0%
35.0%
40.0%
45.0%
50.0%
Never Seldom A few
times a
year
Once or
twice a
month
Once a
week
More than
once a
week
Figure 11. Religious Attendance by Religious
Tradition
Catholics
Other Christians
Other Religion
No Religion

20
• Asian Pacific Islander Catholics pray frequently; about 65 percent report praying once a
day; this is similar to the frequency of prayer of APIs of other Christian faiths (see Figure
12).
0.0%
10.0%
20.0%
30.0%
40.0%
50.0%
60.0%
Never Seldom A few
times a
month
Once a
week
A few
times a
week
Once a
day
Several
times a
day
Figure 12. Frequency of Prayer by Religous
Tradition
Catholics
Other Christians
Other Religion
No Religion
21
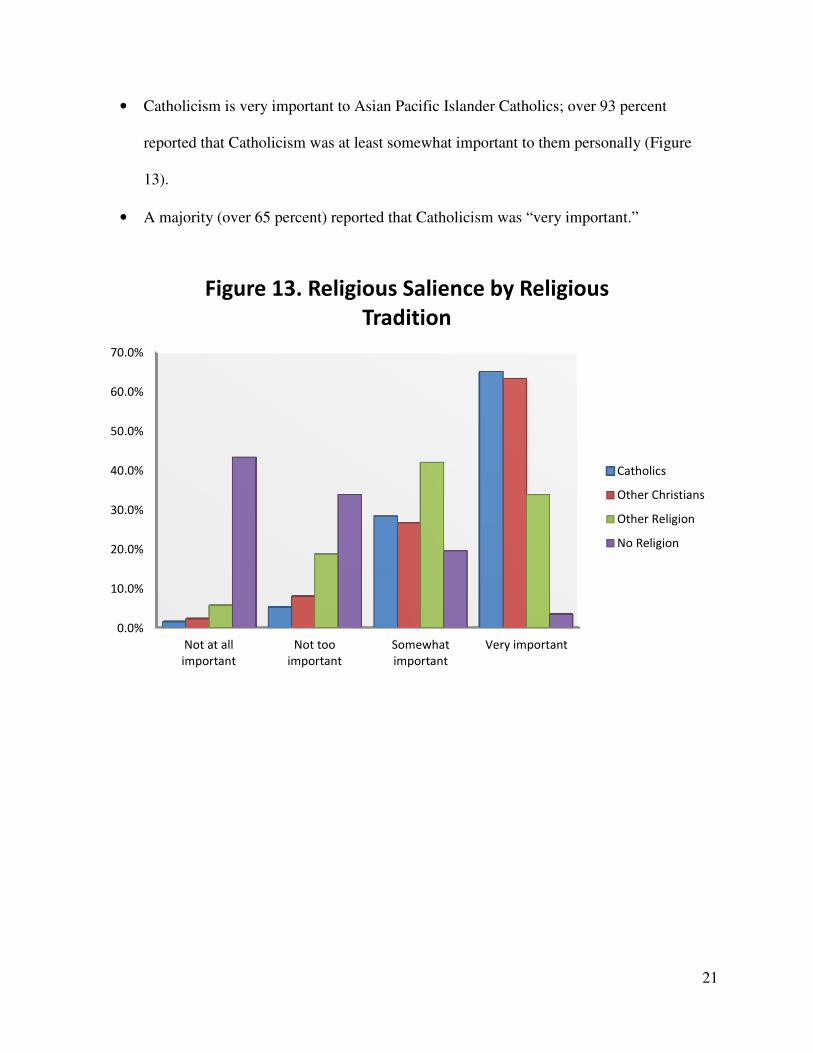
• Catholicism is very important to Asian Pacific Islander Catholics; over 93 percent
reported that Catholicism was at least somewhat important to them personally (Figure
13).
• A majority (over 65 percent) reported that Catholicism was “very important.”
0.0%
10.0%
20.0%
30.0%
40.0%
50.0%
60.0%
70.0%
Not at all
important
Not too
important
Somewhat
important
Very important
Figure 13. Religious Salience by Religious
Tradition
Catholics
Other Christians
Other Religion
No Religion

22
• A traditional question asked of Americans on social surveys is their interpretation of the
Christian scriptures. When asked for their view of the Bible, about one-third of Asian
Pacific Islander Catholics affirmed that the Bible is “inspired word of God and should be
taken literally.” The largest share (about 43 percent) supported the view that the Bible is
the inspired word of God but should not be taken literally (see Figures 14a and 14b).
• Nearly a quarter of Asian Pacific Islander Catholics affirmed that the Bible is a book of
stories and myth. This is a much higher rate than other Christian APIs’ view of the Bible
(15 percent).
33%
43%
24%
Figure 14a. API
Catholic Views of the
Bible
Inspired and Literal
Inspired but Not Literal
Not Inspired
49%
36%
15%
Figure 14b. API
Christian (Non-
Catholic) Views of the
Bible
Inspired and Literal
Inspired but Not Literal*
Not Inspired

23
• Most Americans remain in the religion in which they started as a child. When identifying
religious pathways, we can look at the rate of those who “switched to” one religion to
another and those who “switched from” one religion to another. In the following we will
show the relative difference between these two perspectives with regard to Asian Pacific
Islander Catholics (see Figure 15).
• Most Asian Pacific Islander Catholics today report having grown up Catholic (about 86
percent)
• Another 14 percent reported converting (or switching) to Catholicism from another
religion or no religion at all.
• Of the converts to Catholicism among APIs come primarily from three streams: non-
Christian religions (6 percent), other Christian denominations (about 3 percent), and from
no religion (5 percent).
Raised Catholic
86%
Convert from
Other Christian
3%
Convert
from
Other
Religion
6%
Convert
from No
Religion
5%Convert
14%
Figure 15. Staying and Switching to Catholicism
24
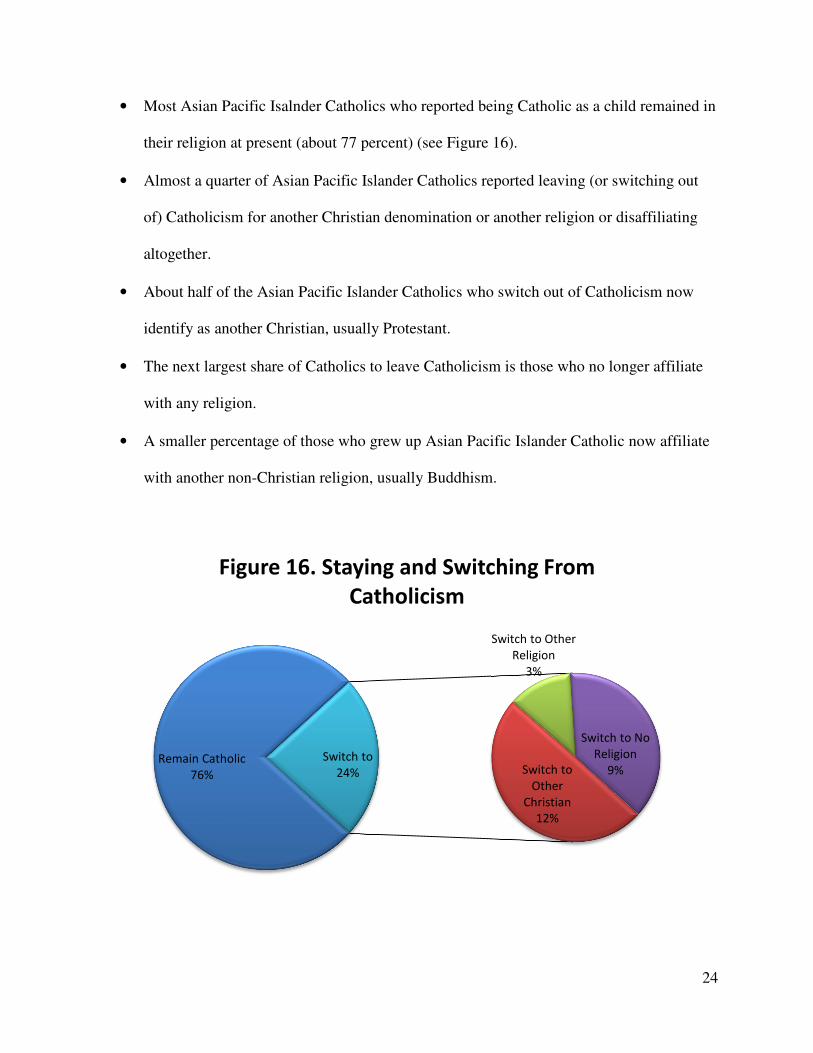
• Most Asian Pacific Isalnder Catholics who reported being Catholic as a child remained in
their religion at present (about 77 percent) (see Figure 16).
• Almost a quarter of Asian Pacific Islander Catholics reported leaving (or switching out
of) Catholicism for another Christian denomination or another religion or disaffiliating
altogether.
• About half of the Asian Pacific Islander Catholics who switch out of Catholicism now
identify as another Christian, usually Protestant.
• The next largest share of Catholics to leave Catholicism is those who no longer affiliate
with any religion.
• A smaller percentage of those who grew up Asian Pacific Islander Catholic now affiliate
with another non-Christian religion, usually Buddhism.
Remain Catholic
76% Switch to
Other
Christian
12%
Switch to Other
Religion
3%
Switch to No
Religion
9%Switch to
24%
Figure 16. Staying and Switching From
Catholicism

25
• Asian Pacific Islander Catholics exhibit the highest rate of same-religion marriages
(homogamous). About 86 percent of married API Catholics report that their spouse is
also Catholic (see Figure 17). This rate is higher than other married API Christians, non-
Christians and nonaffiliated.
86.0%
73.9% 77.7%
62.5%
14.0%
26.1% 22.3%
37.5%
0%
10%
20%
30%
40%
50%
60%
70%
80%
90%
100%
Catholic Other Christians Other Religion No Religion
Married Different Religion
Married Same Religion
Figure 17. Distribution of Same and Interfaith Marriages

26
Future Directions
Existing data from surveys taken around the world and in the United States helps shed some light
on some of the broad characteristics of Asian Pacific Islander Catholics today. Asian Pacific
Islander Catholics originate from a diverse collection of believers across many countries and
ethnic groups. In most cases, Catholics in Asia are a minority religious community. In the
nations of the Pacific Islands, Catholics form part of the dominant Christian presence in most of
those nations. A substantial minority of Asian Pacific Islander Catholics today are emerging as
native-born to the US. The largest share of Asian Pacific Islander Catholics resides in the Pacific
western states, but the majority reside outside of this region. They are about average relative to
other APIs in their household income levels and educational attainment, but a smaller percentage
report holding advanced degrees. Asian Pacific Islander Catholics are highly committed in terms
of basic Christian practices of attending worship services and personal prayer. They remain
largely Catholic from an early age, but a substantial minority leave their faith, and a similar
minority join the Catholic church as adults. Among married Asian Pacific Islander Catholics
most are married to someone of the same faith, but a sizable minority are married to someone of
a different faith.
Given the diversity of Asian Pacific Islander Catholics, there is still much that we do not know.
Since the majority of Asian Pacific Islander Catholics are immigrants, we know little of the
specific modes of worship that are important to their identities as ethnic Asian Pacific Islander
Catholics. English language fluency is not an uncommon challenge for immigrants in general,
yet we do not know whether Asian Pacific Islander Catholics specifically struggle with
participation in their local Catholic community due to limited English proficiency. We do not
27
know if these immigrants and other socially vulnerable Asian Pacific Islander Catholics are
receiving adequate support in meeting their basic needs to access medical, legal, occupational
organizations to assist them with daily living. We do not know whether Asian Pacific Islander
Catholics are primarily involved in parishes dominated by their ethnic group or whether they are
on the margins of a local non-Asian Pacific Islander Catholic community. We do not know how
involved Asian Pacific Islander Catholics are in their civic involvement. We know nothing of the
post-immigrant Asian Pacific Islander Catholic experience: to what extent are second-generation
Asian Pacific Islander Catholics actively involved in a local Catholic community? Are they
participating in the parishes dominated by their ethnic group or are they integrated into
predominantly white or Latino Catholic communities?
In addition to those larger questions, we do not know how different Asian Pacific Islander
Catholic ethnic groups differ from one another on most of the factors presented in this report, nor
any of the unanswered questions we just raised. As we have shown the majority of Asian Pacific
Islander Catholics identify as Filipino or Vietnamese; when specific groups dominate a social
category like Asian Pacific Islander Catholicism, most subsequent findings about that category
are a function of the characteristics of the dominant groups. In other words, Chinese, Korean,
Indian, and Japanese American Catholics might vary substantially from Filipino and Vietnamese
American Catholics on a variety of social and demographic characteristics as well as religious
characteristics. All of the findings reported here cannot be disaggregated into comparisons of
groups that are more difficult to survey in a major study of all APIs. The need for bigger and
more comprehensive data on Asian Pacific Islander Catholics is evident.

28
Appendix

29
0.0% 20.0% 40.0% 60.0% 80.0% 100.0%
American Samoa
Bangladesh
Bhutan
Brunei
Burma (Myanmar)
Cambodia
China
Cook Islands
Fed. States of Micronesia
Fiji
French Polynesia
Guam
Hong Kong
India
Indonesia
Japan
Kiribati
Laos
Macau
Malaysia
Maldives
Marshall Islands
Mongolia
Nauru
Nepal
New Caledonia
Niue
North Korea
Northern Mariana Is.
Pakistan
Palau
Papua New Guinea
Philippines
Samoa
Singapore
Solomon Islands
South Korea
Sri Lanka
Taiwan
Thailand
Timor-Leste
Tokelau
Tonga
Tuvalu
Vanuatu
Vietnam
Wallis and Futuna
Figure 18. Estimated Percent Catholic Per Nation
Est. Percent
Catholic per
Nation
30
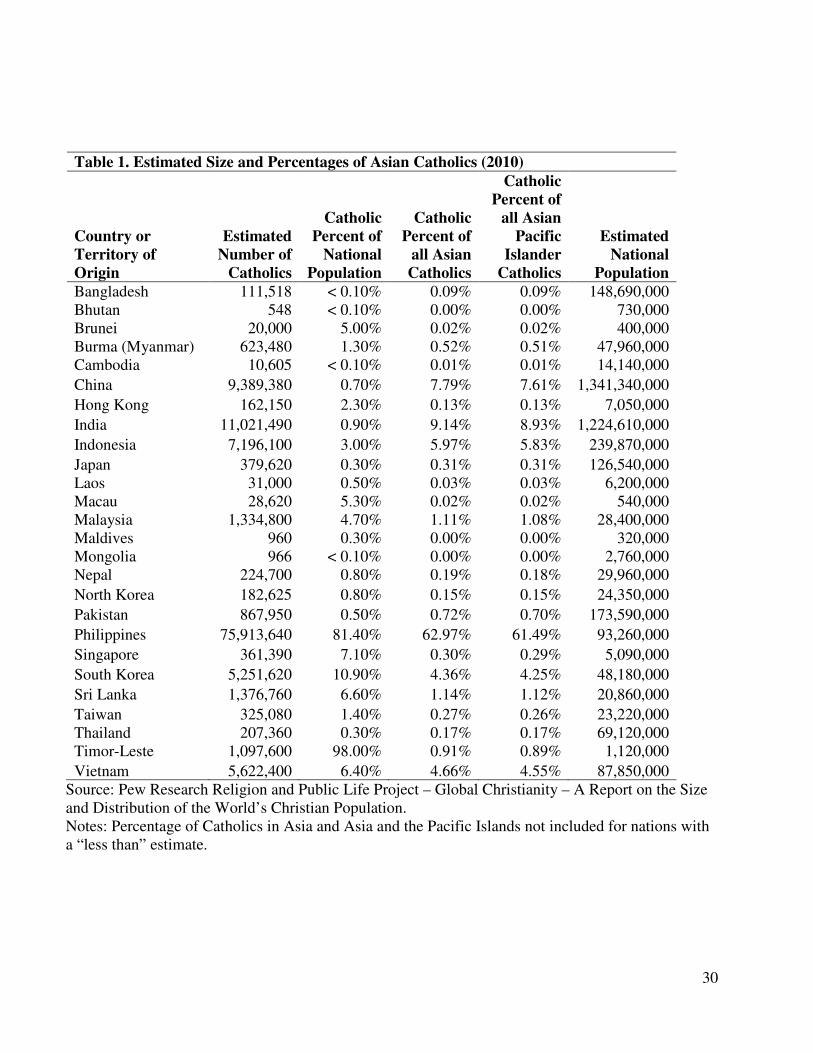
Table 1. Estimated Size and Percentages of Asian Catholics (2010)
Country or
Territory of
Origin
Estimated
Number of
Catholics
Catholic
Percent of
National
Population
Catholic
Percent of
all Asian
Catholics
Catholic
Percent of
all Asian
Pacific
Islander
Catholics
Estimated
National
Population
Bangladesh 111,518 < 0.10% 0.09% 0.09% 148,690,000 Bhutan 548 < 0.10% 0.00% 0.00% 730,000 Brunei 20,000 5.00% 0.02% 0.02% 400,000 Burma (Myanmar) 623,480 1.30% 0.52% 0.51% 47,960,000 Cambodia 10,605 < 0.10% 0.01% 0.01% 14,140,000
China 9,389,380 0.70% 7.79% 7.61% 1,341,340,000
Hong Kong 162,150 2.30% 0.13% 0.13% 7,050,000
India 11,021,490 0.90% 9.14% 8.93% 1,224,610,000
Indonesia 7,196,100 3.00% 5.97% 5.83% 239,870,000
Japan 379,620 0.30% 0.31% 0.31% 126,540,000 Laos 31,000 0.50% 0.03% 0.03% 6,200,000 Macau 28,620 5.30% 0.02% 0.02% 540,000 Malaysia 1,334,800 4.70% 1.11% 1.08% 28,400,000 Maldives 960 0.30% 0.00% 0.00% 320,000 Mongolia 966 < 0.10% 0.00% 0.00% 2,760,000 Nepal 224,700 0.80% 0.19% 0.18% 29,960,000
North Korea 182,625 0.80% 0.15% 0.15% 24,350,000
Pakistan 867,950 0.50% 0.72% 0.70% 173,590,000
Philippines 75,913,640 81.40% 62.97% 61.49% 93,260,000
Singapore 361,390 7.10% 0.30% 0.29% 5,090,000
South Korea 5,251,620 10.90% 4.36% 4.25% 48,180,000
Sri Lanka 1,376,760 6.60% 1.14% 1.12% 20,860,000
Taiwan 325,080 1.40% 0.27% 0.26% 23,220,000 Thailand 207,360 0.30% 0.17% 0.17% 69,120,000 Timor-Leste 1,097,600 98.00% 0.91% 0.89% 1,120,000
Vietnam 5,622,400 6.40% 4.66% 4.55% 87,850,000 Source: Pew Research Religion and Public Life Project – Global Christianity – A Report on the Size and Distribution of the World’s Christian Population. Notes: Percentage of Catholics in Asia and Asia and the Pacific Islands not included for nations with a “less than” estimate.
31
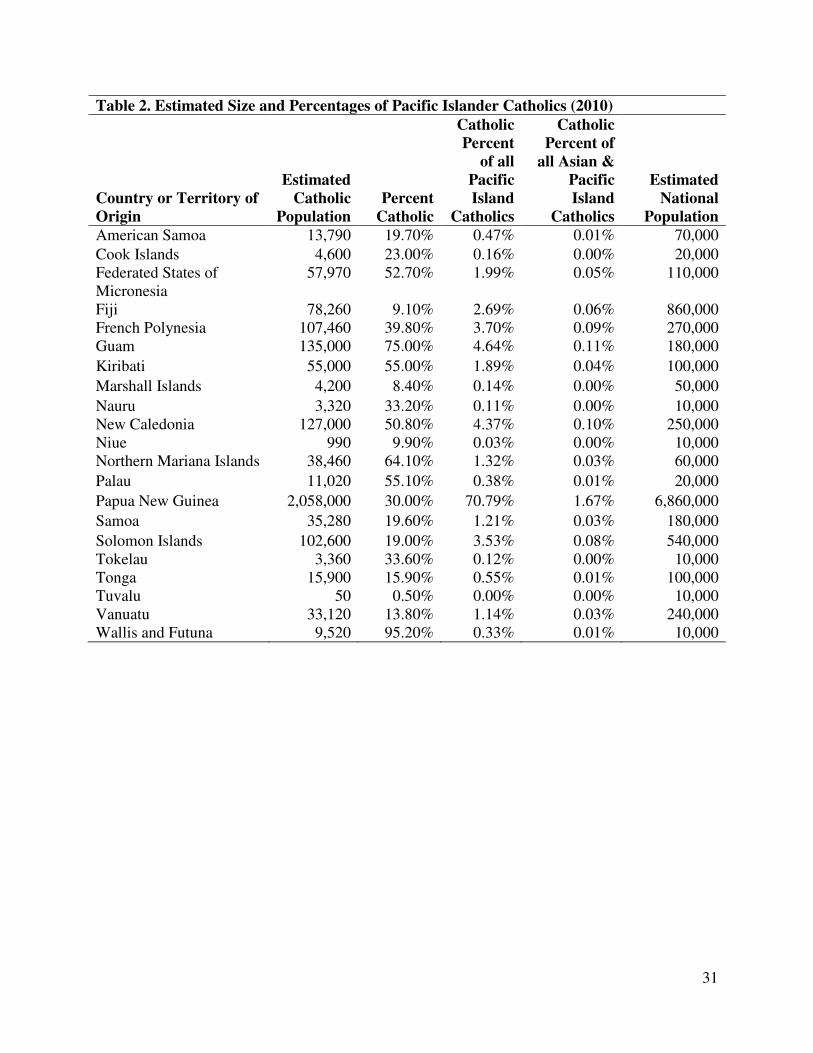
Table 2. Estimated Size and Percentages of Pacific Islander Catholics (2010)
Country or Territory of
Origin
Estimated
Catholic
Population
Percent
Catholic
Catholic
Percent
of all
Pacific
Island
Catholics
Catholic
Percent of
all Asian &
Pacific
Island
Catholics
Estimated
National
Population
American Samoa 13,790 19.70% 0.47% 0.01% 70,000
Cook Islands 4,600 23.00% 0.16% 0.00% 20,000 Federated States of Micronesia
57,970 52.70% 1.99% 0.05% 110,000
Fiji 78,260 9.10% 2.69% 0.06% 860,000 French Polynesia 107,460 39.80% 3.70% 0.09% 270,000 Guam 135,000 75.00% 4.64% 0.11% 180,000
Kiribati 55,000 55.00% 1.89% 0.04% 100,000
Marshall Islands 4,200 8.40% 0.14% 0.00% 50,000
Nauru 3,320 33.20% 0.11% 0.00% 10,000 New Caledonia 127,000 50.80% 4.37% 0.10% 250,000 Niue 990 9.90% 0.03% 0.00% 10,000 Northern Mariana Islands 38,460 64.10% 1.32% 0.03% 60,000
Palau 11,020 55.10% 0.38% 0.01% 20,000
Papua New Guinea 2,058,000 30.00% 70.79% 1.67% 6,860,000
Samoa 35,280 19.60% 1.21% 0.03% 180,000
Solomon Islands 102,600 19.00% 3.53% 0.08% 540,000 Tokelau 3,360 33.60% 0.12% 0.00% 10,000 Tonga 15,900 15.90% 0.55% 0.01% 100,000 Tuvalu 50 0.50% 0.00% 0.00% 10,000 Vanuatu 33,120 13.80% 1.14% 0.03% 240,000 Wallis and Futuna 9,520 95.20% 0.33% 0.01% 10,000

32
Table 3. Percentage of Catholics in Sending Nations and Asian American Ethnic Group
Frequency* Percent of Sending Nation
China 9,510,000 0.72%
Philippines 75,940,000 81.40%
India 10,570,000 0.90%
Japan 400,000 0.30%
South Korea 5,270,000 10.90%
Vietnam 5,590,000 6.40%
All Other Asian/Pacific Islander 16,017,540 2.66%
Frequency Percent of First Generation
Asian American Ethnic Group
Chinese 55 7.6%
Filipino 356 70.6%
Indian 26 4.5%
Japanese 25 4.9%
Korean 62 12.3%
Vietnamese 156 31.0%
All Other Asian/Pacific Islander 22 12.9%
Frequency
Percent of Second & Third Generation Asian American
Ethnic Group
Chinese 34 8.4%
Filipino 115 37.3%
Indian 10 2.3%
Japanese 15 7.9%
Korean 7 1.8%
Vietnamese 30 7.3%
All Other Asian/Pacific Islander 13 15.1%
*Source: Pew Research Religion and Public Life Project – Global Christianity – A Report on
the Size and Distribution of the World’s Christian Population and Pew Asian American
Survey 2012. All figures are estimates.

33
Table 4. Demographic Characteristics of Asian American Catholics
Age Catholics % or Mean
for Catholics Other
Christians Other
Religion No
Religion
691 51.0 51.6 45.8 43.7
Response Rate 98.4%
Ethnic Group Catholics % or Mean
for Catholics Other
Christians Other
Religion No
Religion
Chinese 55 7.8% 19.6% 11.1% 44.7% Filipino 356 50.7% 10.3% 1.4% 4.5% Indian 26 3.7% 8.0% 40.3% 7.0% Japanese 25 3.6% 18.7% 14.3% 20.0% Korean 62 8.8% 35.5% 2.3% 10.8% Vietnamese 156 22.2% 4.2% 22.5% 8.8% ALL Other Asian 22 3.1% 3.6% 8.1% 4.3%
TOTAL 702 Response Rate 100.0%
Generation Catholics % or Mean
for Catholics Other
Christians Other
Religion No
Religion
First Generation a 478 70.5% 60.6% 75.9% 56.2% Second Generation b 178 26.3% 28.1% 18.0% 36.0% Third Generation c 22 3.2% 11.3% 6.0% 7.8%
TOTAL 678
Response Rate 96.6%
Gender Catholics % or Mean
for Catholics Other
Christians Other
Religion No
Religion
Male 341 48.6% 43.2% 53.1% 47.9% Female 361 51.4% 56.8% 46.9% 52.1%
TOTAL 702
Response Rate 100.0%
Marital Status Catholics % or Mean
for Catholics Other
Christians Other
Religion No
Religion
Married 446 63.7% 67.1% 67.4% 58.8% Living with a partner 20 2.9% 2.2% 2.4% 3.7% Divorced or Separated 58 8.3% 7.1% 5.1% 6.3% Widowed 69 9.9% 8.9% 5.3% 2.6% Never been married 107 15.3% 14.8% 19.9% 28.6%
TOTAL 700 100.0%
Response Rate 99.7% a Foreign born and raised abroad; b Native or emigrated at age < 13; c Respondent and both
parents native-born

34
Table 5. Income and Education of Asian American Catholics
Income Bracket Catholics % or Mean
for Catholics Other
Christians Other
Religion No Religion
Less than $10,000 72 11.5% 15.4% 9.0% 7.8% 10 to under $20,000 70 11.1% 8.4% 9.6% 11.2% 20 to under $30,000 61 9.7% 7.6% 7.6% 8.7% 30 to under $40,000 40 6.4% 8.1% 6.4% 7.8% 40 to under $50,000 56 8.9% 7.7% 8.8% 6.1% 50 to under $75,000 105 16.7% 14.2% 14.7% 11.9%
75 to under $100,000 84 13.4% 12.8% 14.7% 13.1% 100 to under $150,000 72 11.5% 12.8% 14.8% 13.4%
$150,000 or more 68 10.8% 13.0% 14.5% 19.9%
Mean
≈ 40,000 -
$50,000 ≈ 40,000 -
$50,000 ≈ 50,000 -
$75,000 ≈ 50,000 -
$75,000
TOTAL 628
Response Rate 89.5%
Education Catholics % or Mean
for Catholics Other
Christians Other
Religion No Religion
Less than High School 31 4.4% 4.6% 5.8% 5.2% High School (No
Degree) 31 4.4% 2.3% 5.6% 3.2%
High School Graduate 115 16.5% 16.4% 16.6% 11.5% Vocational/Tech School 15 2.1% 1.1% 1.6% 1.0% College (No Bachelors) 116 16.6% 16.0% 12.1% 15.9%
College Graduate 268 38.4% 35.4% 25.6% 32.8% Beyond Bachelor's 122 17.5% 24.2% 32.8% 30.3%
Mean College –
No Degree College –
No Degree College –
No Degree College –
No Degree
TOTAL 698
Response Rate 99.4%
35
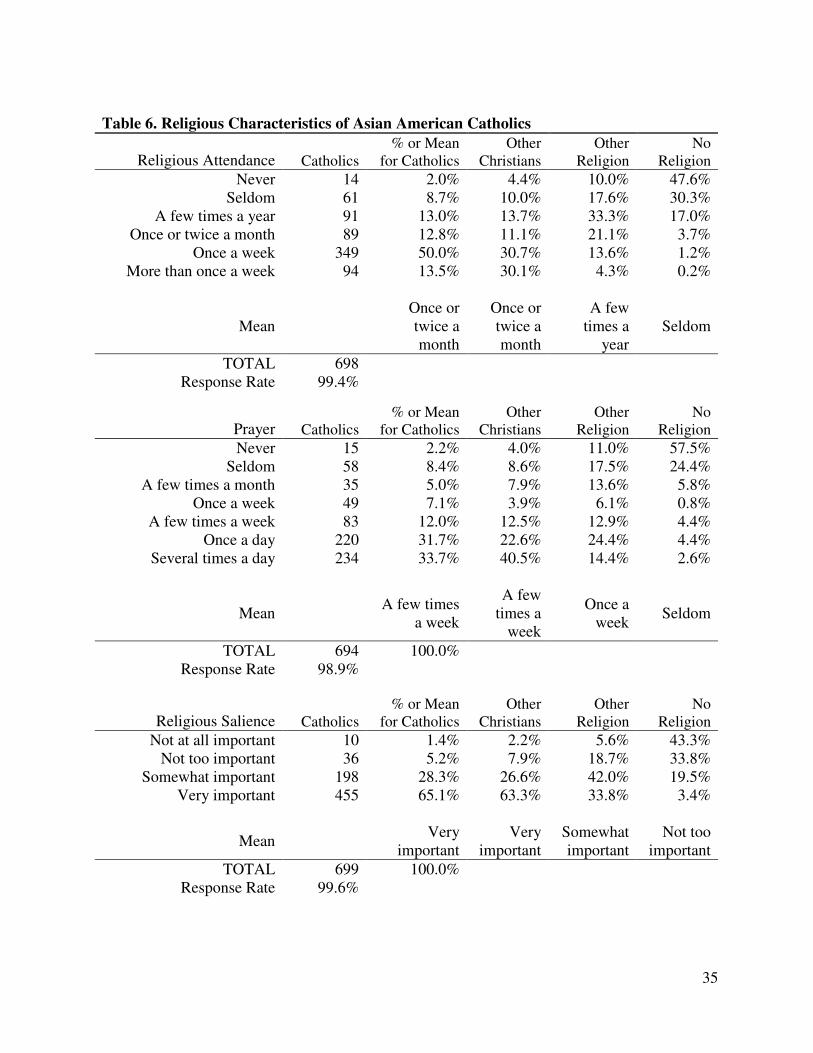
Table 6. Religious Characteristics of Asian American Catholics
Religious Attendance Catholics % or Mean
for Catholics Other
Christians Other
Religion No
Religion
Never 14 2.0% 4.4% 10.0% 47.6% Seldom 61 8.7% 10.0% 17.6% 30.3%
A few times a year 91 13.0% 13.7% 33.3% 17.0% Once or twice a month 89 12.8% 11.1% 21.1% 3.7%
Once a week 349 50.0% 30.7% 13.6% 1.2% More than once a week 94 13.5% 30.1% 4.3% 0.2%
Mean Once or twice a month
Once or twice a month
A few times a
year Seldom
TOTAL 698
Response Rate 99.4%
Prayer Catholics % or Mean
for Catholics Other
Christians Other
Religion No
Religion
Never 15 2.2% 4.0% 11.0% 57.5% Seldom 58 8.4% 8.6% 17.5% 24.4%
A few times a month 35 5.0% 7.9% 13.6% 5.8% Once a week 49 7.1% 3.9% 6.1% 0.8%
A few times a week 83 12.0% 12.5% 12.9% 4.4% Once a day 220 31.7% 22.6% 24.4% 4.4%
Several times a day 234 33.7% 40.5% 14.4% 2.6%
Mean A few times
a week
A few times a
week
Once a week
Seldom
TOTAL 694 100.0%
Response Rate 98.9%
Religious Salience Catholics % or Mean
for Catholics Other
Christians Other
Religion No
Religion
Not at all important 10 1.4% 2.2% 5.6% 43.3% Not too important 36 5.2% 7.9% 18.7% 33.8%
Somewhat important 198 28.3% 26.6% 42.0% 19.5% Very important 455 65.1% 63.3% 33.8% 3.4%
Mean Very
important Very
important Somewhat important
Not too important
TOTAL 699 100.0%
Response Rate 99.6%
36
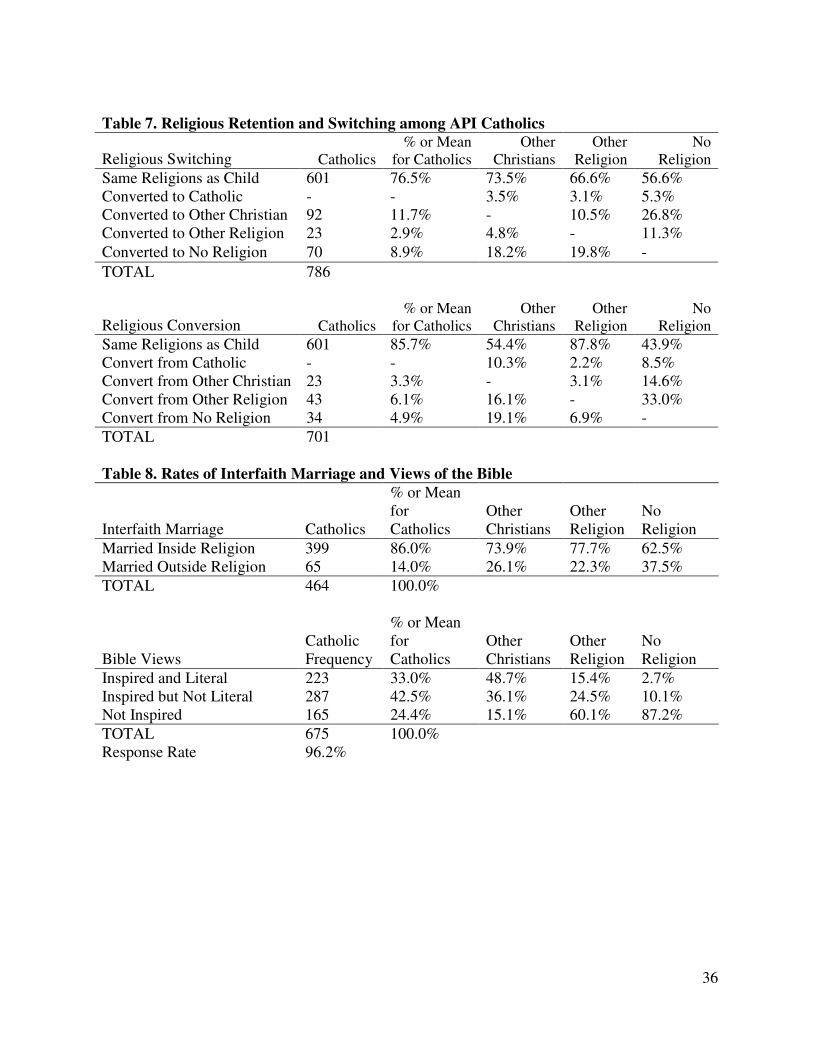
Table 7. Religious Retention and Switching among API Catholics
Religious Switching Catholics % or Mean
for Catholics Other
Christians Other
Religion No
Religion
Same Religions as Child 601 76.5% 73.5% 66.6% 56.6% Converted to Catholic - - 3.5% 3.1% 5.3% Converted to Other Christian 92 11.7% - 10.5% 26.8% Converted to Other Religion 23 2.9% 4.8% - 11.3%
Converted to No Religion 70 8.9% 18.2% 19.8% -
TOTAL 786
Religious Conversion Catholics % or Mean
for Catholics Other
Christians Other
Religion No
Religion
Same Religions as Child 601 85.7% 54.4% 87.8% 43.9% Convert from Catholic - - 10.3% 2.2% 8.5% Convert from Other Christian 23 3.3% - 3.1% 14.6% Convert from Other Religion 43 6.1% 16.1% - 33.0% Convert from No Religion 34 4.9% 19.1% 6.9% -
TOTAL 701 Table 8. Rates of Interfaith Marriage and Views of the Bible
Interfaith Marriage Catholics
% or Mean for Catholics
Other Christians
Other Religion
No Religion
Married Inside Religion 399 86.0% 73.9% 77.7% 62.5% Married Outside Religion 65 14.0% 26.1% 22.3% 37.5%
TOTAL 464 100.0%
Bible Views Catholic Frequency
% or Mean for Catholics
Other Christians
Other Religion
No Religion
Inspired and Literal 223 33.0% 48.7% 15.4% 2.7% Inspired but Not Literal 287 42.5% 36.1% 24.5% 10.1% Not Inspired 165 24.4% 15.1% 60.1% 87.2%
TOTAL 675 100.0%
Response Rate 96.2%