asia/world energy outlook 2015eneken.ieej.or.jp/data/6585.pdf · oil prices. actually, however,...
TRANSCRIPT

ASIA / WORLD ENERGY OUTLOOK 2015
- Analyses of oil pricing and climate change measures under new circumstances -
IEEJ:February 2016 © IEEJ2016

"Asia/World Energy Outlook 2015" team members
Research Advisor Kokichi ITO
The Energy Data and Modelling Center (EDMC) Strategy Research Unit
Director Yukari YAMASHITA Managing Director and
Group Manager Akira YANAGISAWA Chief Economist Ken KOYAMA
Senior Economist Yuji MATSUO Group Manager Tomoko MURAKAMI
Senior Economist LIM Eui Soon Researcher Kei SHIMOGORI
Senior Economist Momoko AOSHIMA Researcher Fumihiro OCHI
Senior Economist Ryouhei IKARII Researcher Atsuhiko SUZUKI
Senior Economist LU Zheng
Economist Souhei IWATA Fossil Fuels and Electric Power Industry Unit
Economist Ryo ETO Group Manager Yoshikazu KOBAYASHI
Economist Yasuaki KAWAKAMI Group Manager Tetsuo MORIKAWA
Economist Kodai TOMOKAWA Group Manager Atsuo SAGAWA
Economist Miyuki TSUNODA Senior Researcher Hiroshi HASHIMOTO
Researcher Yu NAGATOMI
Global Environment and
Sustainable Development Unit Councillor Rejean CASAUBON
Managing Director Akihiro KUROKI
Assistant Director Koichi SASAKI
Group Manager Takahiko TAGAMI
New and Renewable Energy and
International Cooperation Unit
Group Manager Yoshiaki SHIBATA
Researcher KAN Sichao
The Institute of Energy Economics, Japan © 2015
IEEJ:February 2016 © IEEJ2016
Foreword
Asia/World Energy Outlook 2015 i
Foreword he global energy environment has changed dramatically since only a little more than one year ago. Doubts have arisen about whether emerging countries would drive the acceleration of global economic growth in the near future. In Greece, default, unexpected in
any industrial country, has become a real fear. Confrontation or attempts to change the status quo with the backing of “power”, in such regions as Ukraine, the Middle East and Asia have remained a great matter of concern. We have also seen historic developments for détente, including an agreement on Iran’s nuclear problem and the normalization of U.S. – Cuban relations. But signs of improvements in U.S. – Iran relations and the very recently started bombing in the Middle East by Russia are feared to trigger new disputes in the Middle East.
If the oil supply-demand balance were tight, the deterioration of relations between Western countries and Russia, the geopolitical tensions growing through terrorist attacks by the Islamic State and other militants, or the Arab League forces’ intervention in Yemen plagued with a civil war could have stimulated a fear of energy supply interruption and triggered remarkable hikes in international oil prices. Actually, however, crude oil prices have halved from the latest peak recorded in June 2014 due to growing U.S. unconventional oil production, a strategy of the Organization of the Petroleum Exporting Countries (OPEC) giving priority to maintaining its market share and economic deceleration in emerging and developing countries.
Oil prices had been gradually rising over some 10 years, including some periods of pauses in hikes, before staying high until recently. Analysts may be divided over whether the fallback from levels above $100 per barrel should be interpreted as symbolizing an end to the so-called Super Cycle, in which commodity prices continued rising over a long term due to structural factors, or as a simple temporary adjustment. The division leads to differences over future crude oil prices. Regardless of the interpretation for the fallback, it is very difficult now to foresee oil prices, particularly for the distant future. As crude oil prices have plunged more rapidly than expected at this time, it has grown more difficult to forecast future oil prices.
Excessive crude oil price fluctuations induce unacceptable income transfers between oil producing and consuming countries. If the distribution of wealth through income transfers is excessive, its negative effects may endanger the world’s sustainable development over a medium to long term. Any great price instability as well as low price levels may impose unignorable negative effects on the energy system and on the world economy through incomplete supply-demand adjustment. We must be alert to this risk.
Global energy system components, whether they are on the supply side or the demand side and whether they are hardware or software including institutions, characteristically feature long lead and life times. As they are upgraded, preliminary investment grows larger. Large-scale, long-term investment is based on future prospects. If confidence in future prospects declines due to an
T
IEEJ:February 2016 © IEEJ2016

Foreword
Asia/World Energy Outlook 2015 ii
excessive increase in uncertainties, investors, excluding very risk-preferring ones, may attempt to reduce initial investment. If they put off their supply capacity expansion or continue to select cheap, inefficient equipment, the world may plunge into a severe situation where the energy supply-demand balance may collapse.
Regarding uncertainties, we must touch upon how to address the climate change problem that cannot be separated from energy problems. At the 21st Conference of Parties to the United Nations Framework Convention on Climate Change, or COP21, opening in Paris in late 2015, more countries will be requested to participate in an agreement under a bottom-up approach, giving top priority to the effectiveness of any agreement. Over the past quarter century, multilateral negotiations have made a rough going with many countries pursuing ideals, bringing about an unintended result in which efforts to reduce the emissions of greenhouse gases including energy-related carbon dioxide have been stalled. COP21 should depart from the stalemate and make a breakthrough.
However, COP21 may not necessarily solve all problems. In fact, scientific knowledge is still limited about the difficult challenge of climate change that will face the human race over many generations or a very long term. But we should not be allowed to abandon the emission-reducing efforts for the reason that the climate system has yet to be clarified. As well, it may not be wise to decide measures for implementation over a long term in a very quick, biased manner.
As noted in the fifth climate change assessment report by the Intergovernmental Panel on Climate Change (IPCC), the potential of climate sensitivity or relations between GHG emissions, the atmospheric GHG concentration and temperature hikes has become greater than earlier conceived. It is very important to take maximum advantage of the scientific knowledge available at present to consider the best mix of climate change mitigation and adaptation measures to minimize damage over a long term. Such approach is significant for securing the implementability of these measures and the effectiveness of damage reduction.
In the Asia/World Energy Outlook 2015, or the 10th edition of the series, we attempted to depict the world’s long-term energy supply and demand picture based on the latest information and precise analyses as usual. At the same time, we provided an analysis made for presenting a direction in which the world should go in the face of the above two major questions from a realistic point of view. We would be pleased if this latest outlook is able to contribute to accumulating knowledge for contemplating the future of the energy situation plagued with uncertainties.
Tokyo, October 2015
IEEJ:February 2016 © IEEJ2016

Table of contents
Asia/World Energy Outlook 2015 iii
Table of contents
EXECUTIVE SUMMARY ............................................................................................................ 1
PART I VOLATILE ENERGY PRICES AND IMPLICATIONS FOR FUTURE OUTLOOKS ............................................................................................................................... 15
1. ANALYSING CRUDE OIL AND NATURAL GAS PRICES ....................................................................... 17 1.1 Crude oil prices .................................................................................................................... 17
Why reviewing crude oil prices?.................................................................................. 17 Factors influencing crude oil prices ............................................................................. 19 Price assumptions .......................................................................................................... 21
1.2 Natural gas prices ................................................................................................................ 24 Natural gas as a commodity ......................................................................................... 24 Factors forming natural gas prices ............................................................................... 24 Natural gas pricing methods ........................................................................................ 26 Price assumptions .......................................................................................................... 27
PART II ASIA/WORLD ENERGY DEMAND AND SUPPLY OUTLOOK .................. 29
2. MAJOR ASSUMPTIONS ...................................................................................................................... 31 2.1 Model and scenarios ........................................................................................................... 31
Reference Scenario ......................................................................................................... 31 Advanced Technologies Scenario ................................................................................. 31 Lower Price Scenario ..................................................................................................... 32
2.2 Major assumptions .............................................................................................................. 32 Population ....................................................................................................................... 32 Economy .......................................................................................................................... 34 International energy prices ........................................................................................... 35
3. ENERGY DEMAND ............................................................................................................................... 38 3.1 Primary energy consumption ............................................................................................ 38
World ............................................................................................................................... 38 Asia................................................................................................................................... 40 Oil ..................................................................................................................................... 41 Natural gas ...................................................................................................................... 44 Coal .................................................................................................................................. 47
3.2 Final energy consumption .................................................................................................. 49 World ............................................................................................................................... 49 By region ......................................................................................................................... 49 By sector .......................................................................................................................... 50 By energy source ............................................................................................................ 51
4. ENERGY SUPPLY .................................................................................................................................. 54 4.1 Crude oil ............................................................................................................................... 54
Supply .............................................................................................................................. 54
IEEJ:February 2016 © IEEJ2016

Table of contents
Asia/World Energy Outlook 2015 iv
Trade ................................................................................................................................ 54 4.2 Natural gas ........................................................................................................................... 57
Production ....................................................................................................................... 57 Trade ................................................................................................................................ 58
4.3 Coal ....................................................................................................................................... 61 Production ....................................................................................................................... 61 Trade ................................................................................................................................ 64
4.4 Electricity generation .......................................................................................................... 66 Electricity generation and its mix ................................................................................ 66 Nuclear ............................................................................................................................ 70 Renewables...................................................................................................................... 71
4.5 Biofuels ................................................................................................................................. 73
PART III EXPLORING OTHER PATHS THROUGH SCENARIO ANALYSIS SUCH AS: ADVANCED TECHNOLOGIES AND LOWER PRICE............................................... 75
5. POTENTIAL AND EFFECTS OF INTRODUCING ENERGY CONSERVATION AND DECARBONISATION
TECHNOLOGIES ....................................................................................................................................... 77 5.1 Present energy conservation .............................................................................................. 77 5.2 Five major energy conservation principles ...................................................................... 78
Box 1: India’s Bachat Lamp Yojana Scheme ................................................................ 79 Box 2: Japan’s Top Runner System ............................................................................... 80
5.3 Energy conservation potential ........................................................................................... 81 Box 3 If the Japanese levels of energy conservation and decarbonisation are achieved in each country ............................................................................................... 83
6. IMPACTS OF TECHNOLOGICAL ADVANCEMENTS ON ENERGY SUPPLY AND DEMAND ................. 86 6.1 Major measures .................................................................................................................... 86
Energy conservation ...................................................................................................... 86 Renewable energy .......................................................................................................... 88 Nuclear ............................................................................................................................ 89 CO2 capture and storage................................................................................................ 91
6.2 Energy supply and demand ............................................................................................... 92 Primary energy consumption ....................................................................................... 92 Final energy consumption ............................................................................................ 94 Electricity generation mix ............................................................................................. 97 Crude oil supply ............................................................................................................. 98 Natural gas supply ......................................................................................................... 99 Coal supply ................................................................................................................... 100
7. IMPACTS OF LOW OIL PRICES CAUSED BY LOOSE SUPPLY-DEMAND BALANCE ......................... 103 7.1 Position of Lower Price Scenario ..................................................................................... 103 7.2 Energy demand ................................................................................................................. 103
Primary energy consumption ..................................................................................... 103 7.3 Energy supply and trade .................................................................................................. 104
Crude oil supply ........................................................................................................... 104
IEEJ:February 2016 © IEEJ2016
Table of contents
Asia/World Energy Outlook 2015 v
Crude oil trade .............................................................................................................. 104 Natural gas supply ....................................................................................................... 106 Natural gas trade .......................................................................................................... 107
7.4 Economy ............................................................................................................................. 107 Net value of crude oil exports .................................................................................... 107 Real GDP ....................................................................................................................... 108 World should increase talks for stabilising energy markets................................... 110
PART IV ANALYSING TRANSITION TOWARDS LOW-CARBON WHILE ADDRESSING CLIMATE CHANGE ................................................................................... 113
8. CO2 EMISSION OUTLOOK AND ASSESSMENT OF NATIONAL GHG EMISSION REDUCTION TARGETS ................................................................................................................................................ 115
8.1 Energy-related CO2 emissions in the Advanced Technologies Scenario ................... 115 8.2 Extra-long-term CO2 equivalent concentration and temperature increase ............... 118 8.3 Assessing total national emission reduction targets ..................................................... 119
Comparing emission reduction targets ..................................................................... 119 International comparison of GHG emissions ........................................................... 119 Comparing total INDCs with Reference and Advanced Technology Scenarios . 120
8.4 Assessing national emission reduction targets .............................................................. 121 International comparison of per capita GHG emissions and GHG emissions per GDP ................................................................................................................................ 121 National INDC emission levels and Reference and Advanced Technologies Scenarios ........................................................................................................................ 122
9. CO2 EMISSION REDUCTION MEASURES AND ADDRESSING CLIMATE CHANGE PROBLEM ....... 124 9.1 Mitigation and adaptation costs and climate change damage .................................... 124
Models to project climate change damage and adaptation costs .......................... 124 Projecting mitigation and adaptation costs and damage ........................................ 126
9.2 Very long-term CO2 emission reduction scenario ......................................................... 128 Mitigation costs, damage and adaptation costs, and emission reduction scenario ........................................................................................................................................ 128 Toward a long-term future .......................................................................................... 130
ANNEX ..................................................................................................................................... 133
List of figures Figure 1 Real oil price and OECD economic growth ...................................................................... 1 Figure 2 Factors contributing to forming oil prices ......................................................................... 3 Figure 3 Historical oil price and actual supply/demand factors ................................................... 3 Figure 4 Global primary energy consumption ................................................................................. 4 Figure 5 Oil consumption changes .................................................................................................... 5 Figure 6 Crude oil supply changes .................................................................................................... 5 Figure 7 Natural gas consumption .................................................................................................... 6
IEEJ:February 2016 © IEEJ2016

Table of contents
Asia/World Energy Outlook 2015 vi
Figure 8 Coal consumption changes.................................................................................................. 6 Figure 9 Increases in final electricity consumption in selected regions ........................................ 7 Figure 10 Global power generation mix ........................................................................................... 7 Figure 11 Five energy conservation principles................................................................................. 8 Figure 12 Costs and benefits of highly efficient lighting and energy conservation .................... 8 Figure 13 Primary energy consumption ........................................................................................... 9 Figure 14 Energy consumption changes [2013-2040] ...................................................................... 9 Figure 15 Oil price assumptions ...................................................................................................... 10 Figure 16 Crude oil production in selected regions [2030] ........................................................... 10 Figure 17 Natural gas production in selected regions [2030] ....................................................... 10 Figure 18 Impacts of loose energy supply-demand balance and low prices [2030] .................. 11 Figure 19 Global CO2 emissions and each measure’s contribution to emission reductions..... 12 Figure 20 GHG emissions ................................................................................................................. 12 Figure 21 Temperature rise from 1850-1900 ................................................................................... 14 Figure 22 Mitigation and adaptation costs and damage [2100] ................................................... 14 Figure 23 Real oil price and OECD economic growth .................................................................. 17 Figure 24 Traded volume and speculative index in NYMEX ....................................................... 21 Figure 25 Crude oil prices assumptions .......................................................................................... 22 Figure 26 Natural gas prices assumptions ...................................................................................... 28 Figure 27 Geological coverage .......................................................................................................... 31 Figure 28 Assumptions for the Advanced Technologies Scenario............................................... 32 Figure 29 Population .......................................................................................................................... 33 Figure 30 Real GDP growth .............................................................................................................. 35 Figure 31 Global primary energy consumption by source [Reference Scenario] ...................... 38 Figure 32 Primary energy consumption for selected countries/regions [Reference Scenario] 40 Figure 33 Asian primary energy consumption [Reference Scenario] ......................................... 41 Figure 34 Global oil consumption and oil’s share of total primary energy supply [Reference
Scenario] .................................................................................................................................... 42 Figure 35 Oil consumption by region [Reference Scenario] ......................................................... 42 Figure 36 Asian oil consumption [Reference Scenario] ................................................................ 43 Figure 37 Asian oil consumption by sector [Reference Scenario] ................................................ 44 Figure 38 Global primary consumption of natural gas [Reference Scenario] ............................ 45 Figure 39 Natural gas consumption by region [Reference Scenario] .......................................... 45 Figure 40 Asian natural gas consumption [Reference Scenario] ................................................. 46 Figure 41 Global natural gas consumption by sector [Reference Scenario] ............................... 47 Figure 42 Global coal consumption [Reference Scenario] ............................................................ 47 Figure 43 Coal consumption by region [Reference Scenario] ...................................................... 48 Figure 44 Global coal consumption by sector ................................................................................ 48 Figure 45 GDP and Final energy consumption .............................................................................. 49 Figure 46 Final energy consumption by region [Reference Scenario] ........................................ 50 Figure 47 Final energy consumption by sector [Reference Scenario] ......................................... 51 Figure 48 Global final energy consumption by source [Reference Scenario] ............................ 52 Figure 49 Electricity consumption [Reference Scenario] .............................................................. 53 Figure 50 Major crude oil trade flows [2014] .................................................................................. 55 Figure 51 Major crude oil trade flows [Reference Scenario, 2030]............................................... 56
IEEJ:February 2016 © IEEJ2016

Table of contents
Asia/World Energy Outlook 2015 vii
Figure 52 Major crude oil trade flows [Reference Scenario, 2040]............................................... 57 Figure 53 Major natural gas trade flows [2014] .............................................................................. 59 Figure 54 Major natural gas trade flows [Reference Scenario, 2030] .......................................... 60 Figure 55 Major natural gas trade flows [Reference Scenario, 2040] .......................................... 60 Figure 56 Coal production by type [Reference Scenario] ............................................................. 61 Figure 57 Coal production by region [Reference Scenario] .......................................................... 63 Figure 58 Coal trade by type [Reference Scenario] ........................................................................ 65 Figure 59 Net coal imports by region [Reference Scenario] ......................................................... 66 Figure 60 Global power generation and consumption [Reference Scenario] ............................. 67 Figure 61 Power generation by region [Reference Scenario]........................................................ 67 Figure 62 Global power generation mix [Reference Scenario] ..................................................... 68 Figure 63 Power generation mix for OECD and non-OECD [Reference Scenario] ................... 69 Figure 64 Asian power generation mix [Reference Scenario] ...................................................... 69 Figure 65 Number of countries with commercial nuclear power plants [Reference Scenario] 70 Figure 66 Nuclear power generating capacity by region [Reference Scenario] ......................... 71 Figure 67 Global renewable energy power generation except hydro [Reference Scenario] .... 72 Figure 68 Wind and solar PV power generating capacity by region [Reference Scenario]...... 73 Figure 69 Biofuel consumption [Reference Scenario].................................................................... 74 Figure 70 Energy intensity for selected countries [2013] .............................................................. 78 Figure 71 Five major energy conservation principles ................................................................... 78 Figure 72 Bachat Lamp Yojana Scheme Mechanism ..................................................................... 79 Figure 73 Improvements in fuel efficiencies of gasoline vehicles in Japan ................................ 80 Figure 74 Fuel Economy Label in Japan .......................................................................................... 80 Figure 75 Energy saving by region and by sector [2040] .............................................................. 82 Figure 76 Costs and benefits of energy saving ............................................................................... 83 Figure 77 CO2 intensity by region [2013] ........................................................................................ 84 Figure 78 Global CO2 emissions in case of achieving Japanese levels ........................................ 85 Figure 79 Assumptions for the Advanced Technologies Scenario............................................... 86 Figure 80 Energy saving from the Reference Scenario [2040] ...................................................... 87 Figure 81 Improvements in fuel efficiencies ................................................................................... 88 Figure 82 Wind and solar PV power generating capacities by region [Advanced Technologies
Scenario] .................................................................................................................................... 89 Figure 83 Nuclear power generating capacity by region.............................................................. 90 Figure 84 CO2 emissions reduction by CCS [Advanced Technologies Scenario] ...................... 92 Figure 85 Primary energy saving by region ................................................................................... 93 Figure 86 Changes in primary energy consumption from the Reference Scenario .................. 93 Figure 87 Primary energy consumption per unit of GDP [Advanced Technologies Scenario] 94 Figure 88 Change in final energy consumption from the Reference Scenario ........................... 95 Figure 89 Energy consumption share (Road sector, World) ......................................................... 95 Figure 90 Changes in road sector energy consumption from the Reference Scenario [World,
2040] ........................................................................................................................................... 96 Figure 91 Primary energy reduction by electricity demand saving [Advanced Technologies
Scenario, 2040] .......................................................................................................................... 96 Figure 92 Global power generation by source [Advanced Technologies Scenario] .................. 97 Figure 93 Asian power generation by source [Advanced Technologies Scenario] ................... 98
IEEJ:February 2016 © IEEJ2016

Table of contents
Asia/World Energy Outlook 2015 viii
Figure 94 Coal production by type [Advanced Technologies Scenario] ................................... 101 Figure 95 Global primary energy consumption [Lower Price Scenario, 2030] ........................ 103 Figure 96 Major crude oil trade flows [Lower Price Scenario, 2030] ......................................... 105 Figure 97 Major natural gas trade flows [Lower Price Scenario, 2030] ..................................... 107 Figure 98 Impact of lower prices on crude oil import/export bills in selected regions and
countries [2030] ....................................................................................................................... 108 Figure 99 Impact on real GDP in 2030 ........................................................................................... 109 Figure 100 Global CO2 emissions reduction by region [Advanced Technologies Scenario] .. 115 Figure 101 Global CO2 emissions reduction by technology ....................................................... 116 Figure 102 Global primary energy consumption and CO2 emissions [1990-2013, 2020, 2030,
2040, 2050] ............................................................................................................................... 117 Figure 103 CO2-eq. concentration and temperature rise ............................................................. 118 Figure 104 GHG emission paths based on the INDCs ................................................................ 120 Figure 105 Comparison of GHG emission paths ......................................................................... 121 Figure 106 GHG emissions per capita and per unit of GDP ...................................................... 121 Figure 107 INDCs compared with the Reference and Advanced Technologies Scenarios .... 123 Figure 108 Annual loss estimation by DICE, FUND and PAGE models .................................. 125 Figure 109 Estimated adaptation costs for 2°C and 4°C temperature rise ............................... 126 Figure 110 Assumed CO2 mitigation paths .................................................................................. 127 Figure 111 Mitigation, adaptation costs and damage ................................................................. 128 Figure 112 Evaluation of the optimal long-term emissions path ............................................... 129
List of tables Table 1 Differences between past oil price plunges ......................................................................... 2 Table 2 Background for oil price assumptions ............................................................................... 10 Table 3 Differences between past oil price plunges ....................................................................... 18 Table 4 Primary energy prices .......................................................................................................... 37 Table 5 Crude oil production [Reference Scenario] ....................................................................... 54 Table 6 Natural gas production [Reference Scenario] ................................................................... 58 Table 7 Steam coal production [Reference Scenario] ..................................................................... 63 Table 8 Coking coal production [Reference Scenario] ................................................................... 64 Table 9 Energy saving policies in selected countries ..................................................................... 77 Table 10 Crude oil production [Advanced Technologies Scenario] ............................................ 99 Table 11 Natural gas production [Advanced Technologies Scenario] ...................................... 100 Table 12 Steam coal production [Advanced Technologies Scenario] ........................................ 101 Table 13 Coking coal production [Advanced Technologies Scenario] ...................................... 102 Table 14 Crude oil production [Lower Price Scenario] ............................................................... 104 Table 15 Natural gas production [Lower Price Scenario] ........................................................... 106 Table 16 INDCs of 8 major parties ................................................................................................. 119 Table 17 Example of innovative technologies............................................................................... 131 Table A18 Regional groupings ....................................................................................................... 135 Table A19 Major energy and economic indicators ....................................................................... 137 Table A20 Population ....................................................................................................................... 138 Table A21 GDP [Reference Scenario and Advanced Technologies Scenario] .......................... 139
IEEJ:February 2016 © IEEJ2016
Table of contents
Asia/World Energy Outlook 2015 ix
Table A22 International energy prices ........................................................................................... 140 Table A23 Primary energy consumption [Reference Scenario] .................................................. 141 Table A24 Primary energy consumption, coal [Reference Scenario] ......................................... 142 Table A25 Primary energy consumption, oil [Reference Scenario] ........................................... 143 Table A26 Primary energy consumption, natural gas [Reference Scenario] ............................ 144 Table A27 Final energy consumption [Reference Scenario] ....................................................... 145 Table A28 Final energy consumption, industry [Reference Scenario] ...................................... 146 Table A29 Final energy consumption, transport [Reference Scenario] ..................................... 147 Table A30 Final energy consumption, buildings, etc. [Reference Scenario] ............................. 148 Table A31 Final energy consumption, electricity [Reference Scenario] .................................... 149 Table A32 Electricity generation [Reference Scenario] ................................................................ 150 Table A33 GDP per capita [Reference Scenario] .......................................................................... 151 Table A34 Primary energy consumption per capita [Reference Scenario] ............................... 152 Table A35 Primary energy consumption per GDP [Reference Scenario] ................................. 153 Table A36 Energy–related carbon dioxide emissions [Reference Scenario] ............................. 154 Table A37 World [Reference Scenario] .......................................................................................... 155 Table A38 Asia [Reference Scenario] ............................................................................................. 156 Table A39 China [Reference Scenario] ........................................................................................... 157 Table A40 India [Reference Scenario] ............................................................................................ 158 Table A41 Japan [Reference Scenario] ........................................................................................... 159 Table A42 Korea [Reference Scenario] ........................................................................................... 160 Table A43 Chinese Taipei [Reference Scenario] ........................................................................... 161 Table A44 ASEAN [Reference Scenario] ....................................................................................... 162 Table A45 Indonesia [Reference Scenario] .................................................................................... 163 Table A46 Malaysia [Reference Scenario] ..................................................................................... 164 Table A47 Myanmar [Reference Scenario] .................................................................................... 165 Table A48 Philippines [Reference Scenario] ................................................................................. 166 Table A49 Thailand [Reference Scenario] ..................................................................................... 167 Table A50 Viet Nam [Reference Scenario] .................................................................................... 168 Table A51 North America [Reference Scenario] ........................................................................... 169 Table A52 United States [Reference Scenario] .............................................................................. 170 Table A53 Latin America [Reference Scenario] ............................................................................ 171 Table A54 OECD Europe [Reference Scenario] ............................................................................ 172 Table A55 Non-OECD Europe [Reference Scenario] ................................................................... 173 Table A56 European Union [Reference Scenario] ........................................................................ 174 Table A57 Africa [Reference Scenario]........................................................................................... 175 Table A58 Middle East [Reference Scenario] ................................................................................ 176 Table A59 Oceania [Reference Scenario] ....................................................................................... 177 Table A60 OECD [Reference Scenario] .......................................................................................... 178 Table A61 Non-OECD [Reference Scenario] ................................................................................. 179 Table A62 World [Advanced Technologies Scenario] .................................................................. 180 Table A63 Asia [Advanced Technologies Scenario] ..................................................................... 181 Table A64 China [Advanced Technologies Scenario] .................................................................. 182 Table A65 India [Advanced Technologies Scenario] ................................................................... 183 Table A66 Japan [Advanced Technologies Scenario] ................................................................... 184
IEEJ:February 2016 © IEEJ2016

Table of contents
Asia/World Energy Outlook 2015 x
Table A67 ASEAN [Advanced Technologies Scenario] ............................................................... 185 Table A68 United States [Advanced Technologies Scenario] ..................................................... 186 Table A69 European Union [Advanced Technologies Scenario] ............................................... 187
IEEJ:February 2016 © IEEJ2016

Executive summary
Asia/World Energy Outlook 2015 1
Executive summary
Greatly changed surroundings for international oil market Why are oil prices attracting attention now?
▌ Oil prices’ plunge since the second half of 2014 has led us to recognise the importance of oil prices for global political, economic and energy situations. They not only represent the prices of the world’s largest energy source but also serve as a benchmark for natural gas prices mainly in Asia, exerting great influences over the global energy supply-demand balance and options. Fluctuations in prices of the world’s largest traded commodity can bring about income and wealth relocations in line with its massive trading volume, working to greatly shake the balance of power in the world economy and in international politics. Oil prices plunged after remaining stable above $100 per barrel since 2012, leading their importance to attract interests from throughout the world again.
Figure 1 Real oil price and OECD economic growth
▌ There are many uncertainties about the future course of oil prices. In the past, this
Outlook projected specific oil price levels under the assumption that oil prices will follow an upward trend over a medium to long term. This is because global oil demand is expected to continue firm growth in the future. Higher-cost oilfield development will have to be implemented to make up for a decline in production from currently operating oilfields and secure new oil supply sources to satisfy the increasing demand. Specifically, if global oil demand increases at an annual average pace of 1 million barrels per day (Mb/d) in the future, the cumulative demand expansion through 2020 will be 5 Mb/d. At present, the international oil market has a supply surplus of a little more than 1 Mb/d. Given the abovementioned demand growth, however, some higher-cost oil production
-4%
-2%
0%
2%
4%
6%
8%
10%
12%
0
20
40
60
80
100
120
1970 1980 1990 2000 2010
GD
P growth
Real
oil
pric
e ($
2014
/bbl
)
OECDGDP growth
Real oil price
1st
oil crisis
2nd
oil crisis
OPEC shareslips below 30%
Gulf War
Asian currencycrisis
Lehman
Shock
Rise of unconventionalcrude oil
IEEJ:February 2016 © IEEJ2016
Executive summary
Asia/World Energy Outlook 2015 2
will be required due partly to a drop in production at currently operating oilfields, despite an expected increase in production in major Middle Eastern oil producing countries. Therefore, oil prices are expected to rise to $75/bbl or a higher level in 2020. In and after 2020, a continued expansion in demand and relevant investment (including investment in higher-cost oil production) could exert upward pressure on oil prices, leading oil prices to exceed $100/bbl in 2030.
▌ However, current oil prices, from which the future prices are projected, have fallen to extremely low levels due to the plunge since the second half of 2014. Given progress in the shale revolution, potential growth in production in Iraq, Iran and other members of the Organization of the Petroleum Exporting Countries (OPEC) and energy conservation affecting oil demand growth, as well as the recent weakness of oil prices, we cannot necessarily conclude that oil prices could follow an upward trend as earlier expected. Therefore, we have analysed a Lower Price Scenario in which an oil price hike will be very limited. As indicated on Page 9 more specifically, the benchmark oil price will be limited to $70/bbl (or an even lower level) in 2020 due to a slack demand increase and a substantial expansion in unconventional crude oil production, and to $75/bbl in 2030 with a price hike remaining restricted. As the oil price plunge since the second half of 2014 and factors behind the plunge have led interests to globally grow in a future scenario that differs far from the traditional one, we must conduct an analysis responding to such growing interests.
Crude oil market history and latest price plunge, and oil pricing factors
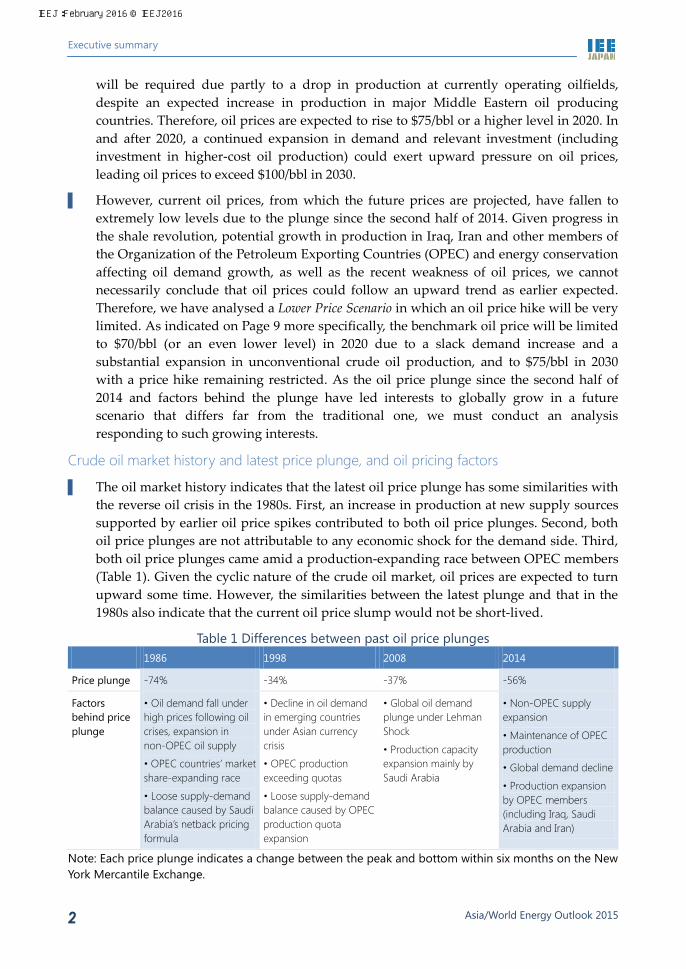
▌ The oil market history indicates that the latest oil price plunge has some similarities with the reverse oil crisis in the 1980s. First, an increase in production at new supply sources supported by earlier oil price spikes contributed to both oil price plunges. Second, both oil price plunges are not attributable to any economic shock for the demand side. Third, both oil price plunges came amid a production-expanding race between OPEC members (Table 1). Given the cyclic nature of the crude oil market, oil prices are expected to turn upward some time. However, the similarities between the latest plunge and that in the 1980s also indicate that the current oil price slump would not be short-lived.
Table 1 Differences between past oil price plunges 1986 1998 2008 2014
Price plunge -74% -34% -37% -56%
Factors behind price plunge
• Oil demand fall under high prices following oil crises, expansion in non-OPEC oil supply
• OPEC countries’ market share-expanding race
• Loose supply-demand balance caused by Saudi Arabia’s netback pricing formula
• Decline in oil demand in emerging countries under Asian currency crisis
• OPEC production exceeding quotas
• Loose supply-demand balance caused by OPEC production quota expansion
• Global oil demand plunge under Lehman Shock
• Production capacity expansion mainly by Saudi Arabia
• Non-OPEC supply expansion
• Maintenance of OPEC production
• Global demand decline
• Production expansion by OPEC members (including Iraq, Saudi Arabia and Iran)
Note: Each price plunge indicates a change between the peak and bottom within six months on the New York Mercantile Exchange.
IEEJ:February 2016 © IEEJ2016

Executive summary
Asia/World Energy Outlook 2015 3
▌ In the actual market (including futures markets), crude oil is priced based on expectations among market participants in regard to four factors – demand, supply, risks, and finance (Figure 2). This means that factors other than pure supply and demand factors can play roles in forming oil prices. Our estimation1 indicates that historical oil prices were higher than indicated by supply and demand factors when oil prices were spiking from 2011 (Figure 3). Depending on international oil market developments in the future, factors other than those related to supply and demand could have great influences on prices again.
Figure 2 Factors contributing to forming oil prices
Figure 3 Historical oil price and actual supply/demand factors
Note: Front-month futures contract for Brent crude oil
▌ Among non-supply/demand factors influencing future oil prices, geopolitical risks may
exert influences that may not be negligible. Islamic State radical militants are operating mainly in Iraq and Syria. While Iran is steadily preparing for its comeback to the international oil market after the removal of economic sanctions, its neighbours are concerned about the Iranian move. In Ukraine, Russia has maintained a status quo change backed by its military power. There is the problem of security on the sea-lane between the Hormuz Strait and the Malacca Strait. We now see a great number of risk factors that may add premiums to oil prices irrespective of oil supply or demand. We must also take note of Russia’s recent start of bombing in the Middle East and its impacts.
1 Akira YANAGISAWA (2015) “Reconsidering oil price fundamentals – Non-supply/demand factors contributing greatly to oil price plunge,” http://eneken.ieej.or.jp/report_detail.php?article_info__id=6284 [To be translated into English shortly.]
Market participants’ “expectations”
Supply factors
OPEC production policy Fiscal breakeven oil prices
for oil producing countries Surplus OPEC capacityUnconventional oil
production increase
Finance factors
Stock prices, exchange rates
Expected inflation rates Money supply Investors’ risk appetiteNew investment products
and approaches
Risk factors
Political situations in oil producing countries
Foreign policy Terror attacks on relevant
facilitiesAbnormal weather/disastersAccidentsWalkouts, etc.
Economic growth Inventories in developed
countriesOil use policies in
developing countriesNumber of vehicles and
fuel efficiency
Demand factors
0
50
100
150
2001 2005 2010 2015
$/bb
l
Historical Actual supply/demand factors
IEEJ:February 2016 © IEEJ2016

Executive summary
Asia/World Energy Outlook 2015 4
Asia/world energy supply and demand outlook Energy consumption will expand 1.4-fold in 27 years. Fossil fuels will continue to account for most of energy consumption.
▌ Primary energy consumption in the world is decelerating its growth. In the Reference Scenario in which the current trends of social, economic, policy and technology changes regarding energy supply and demand are assumed to continue, however, global energy consumption will increase by 5,408 million tonnes of oil equivalent (Mtoe) from 13,555 Mtoe in 2013 to 18,963 Mtoe in 2040. The increase exceeds a combination of current consumption in China, the world’s largest energy consumer, and the United States in the second position.
▌ Energy consumption will increase primarily in countries outside the Organisation for Economic Cooperation and Development (OECD). Non-OECD countries will expand energy consumption by 4,871 Mtoe by 2040, accounting for 90% of the global increase. Among them, China, India and the Association of Southeast Asian Nations (ASEAN) members will capture 55%. In contrast, OECD countries will command only 5% of the global energy consumption increase.
▌ At present, fossil fuels (oil, coal and natural gas) account for 81% of primary energy consumption. The situation will not change greatly as they cover 70% of new future energy demand. While hopes are placed on non-fossil fuels, even their combination is likely to fall short of rivalling any of the three fossil fuels.
Figure 4 Global primary energy consumption
▌ Oil consumption, which stood at 87.1 Mb/d in 2013, will increase to more than 100 Mb/d
in the mid-2020s and reach 113.7 Mb/d in 2040, driven by demand growth in the transport sector including automobiles. The increase of 26.6 Mb/d from 2013 to 2040 exceeds the present crude oil production in Middle Eastern and North African OPEC members at 25.2 Mb/d. Even in 2040, oil remains the largest energy source.
8,768
10,057
13,555
15,207
17,211
18,963
0
5,000
10,000
15,000
20,000
1990 2000 2013 2020 2030 2040
Mto
e
Natural gas
Oil
Coal
Biomass and wastes
Nuclear
Other renewables
Hydro
+5,408
IEEJ:February 2016 © IEEJ2016
Executive summary
Asia/World Energy Outlook 2015 5
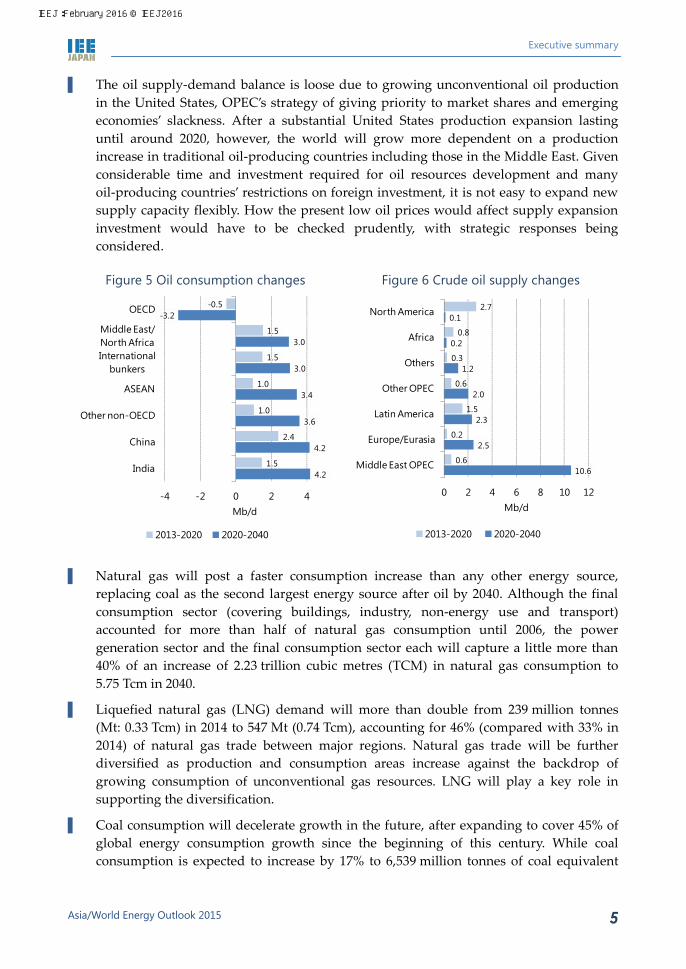
▌ The oil supply-demand balance is loose due to growing unconventional oil production in the United States, OPEC’s strategy of giving priority to market shares and emerging economies’ slackness. After a substantial United States production expansion lasting until around 2020, however, the world will grow more dependent on a production increase in traditional oil-producing countries including those in the Middle East. Given considerable time and investment required for oil resources development and many oil-producing countries’ restrictions on foreign investment, it is not easy to expand new supply capacity flexibly. How the present low oil prices would affect supply expansion investment would have to be checked prudently, with strategic responses being considered.
Figure 5 Oil consumption changes Figure 6 Crude oil supply changes
▌ Natural gas will post a faster consumption increase than any other energy source,
replacing coal as the second largest energy source after oil by 2040. Although the final consumption sector (covering buildings, industry, non-energy use and transport) accounted for more than half of natural gas consumption until 2006, the power generation sector and the final consumption sector each will capture a little more than 40% of an increase of 2.23 trillion cubic metres (TCM) in natural gas consumption to 5.75 Tcm in 2040.
▌ Liquefied natural gas (LNG) demand will more than double from 239 million tonnes (Mt: 0.33 Tcm) in 2014 to 547 Mt (0.74 Tcm), accounting for 46% (compared with 33% in 2014) of natural gas trade between major regions. Natural gas trade will be further diversified as production and consumption areas increase against the backdrop of growing consumption of unconventional gas resources. LNG will play a key role in supporting the diversification.
▌ Coal consumption will decelerate growth in the future, after expanding to cover 45% of global energy consumption growth since the beginning of this century. While coal consumption is expected to increase by 17% to 6,539 million tonnes of coal equivalent
4.2
4.2
3.6
3.4
3.0
3.0
-3.2
1.5
2.4
1.0
1.0
1.5
1.5
-0.5
-4 -2 0 2 4
India
China
Other non-OECD
ASEAN
Internationalbunkers
Middle East/North Africa
OECD
Mb/d
2013-2020 2020-2040
10.6
2.5
2.3
2.0
1.2
0.2
0.1
0.6
0.2
1.5
0.6
0.3
0.8
2.7
0 2 4 6 8 10 12
Middle East OPEC
Europe/Eurasia
Latin America
Other OPEC
Others
Africa
North America
Mb/d
2013-2020 2020-2040
IEEJ:February 2016 © IEEJ2016

Executive summary
Asia/World Energy Outlook 2015 6
(Mtce)2 in 2040, the growth rate is the lowest among energy sources. The great change is attributable to Chinese developments, including slowing economic growth and an emerging shift to a cleaner energy mix, and their effects. In the second half of the Outlook period, India’s influence on global coal consumption will remarkably grow stronger. Steam coal for power generation will account for most of global coal consumption growth. While Europe and the United States with relatively easier access to cheap natural gas are switching from coal to natural gas, cleaner use of coal has great significance in Asia.
▌ Coal trade will increase, centring on steam coal trade in the Asian market where coal demand will increase. In place of China that has rapidly expanded coal imports, India and ASEAN will increase their coal imports. Among coal-exporting countries, Indonesia will reduce exports due to growing domestic demand and its coal resources protection policy, after the past fast increase in steam coal exports. Coal importers will thus grow more dependent on Australia.
Figure 7 Natural gas consumption Figure 8 Coal consumption changes
Note: Annual average change in each period
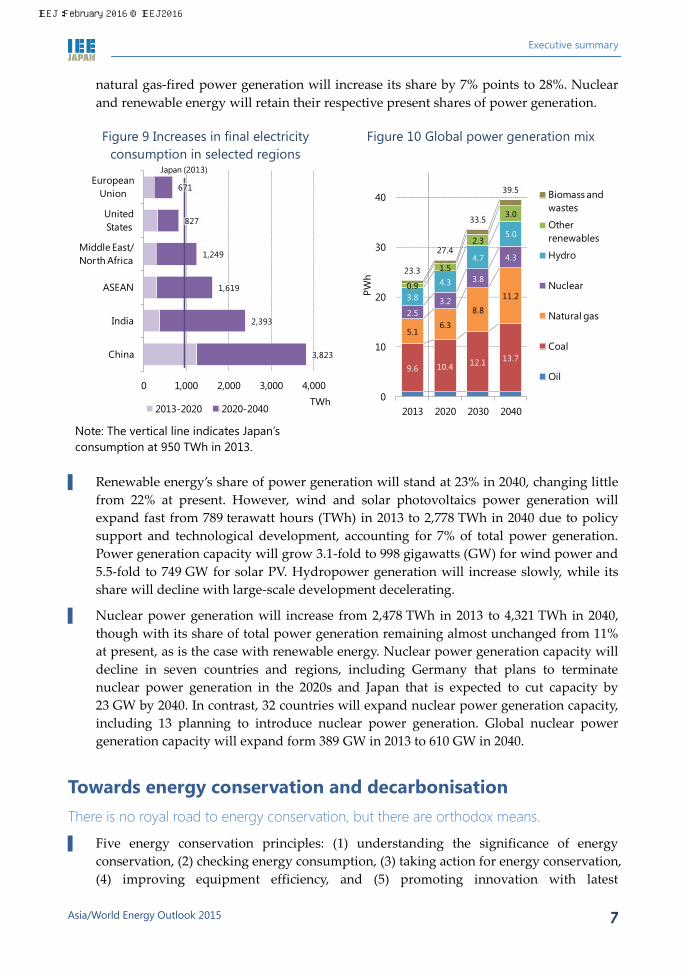
▌ Final electricity consumption has continued increasing in the past, excluding 2009 when
consumption fell on the global financial crisis, and will continuously expand in each region irrespective of economic development stages or geographical conditions. Particularly, non-OECD will post remarkable growth in electricity consumption after surpassing OECD in 2012. Electricity consumption growth in China will be equivalent to four times Japan’s present consumption. Indian growth will be equivalent to 2.5 times.
▌ Power generation will remain heavily dependent on fossil fuels (accounting for nearly 70% of total generation). However, coal-fired power generation will reduce its share by 7 percentage points to 35% due to a drop in Europe and the United States. Instead,
2 1 Mtce = 0.7 Mtoe.
China
Other non-OECD Asia
Middle East/North Africa
Othernon-OECD
Internationalbunkers
OECD
Power generation
Final consumption
Others
3.52
5.75 5.75
0
2
4
6
2013 2040 2040
Tcm
23
149
235 -4
8
21
1822 32
-50
0
50
100
150
200
1990-2000
2000-2013
2013-2020
2020-2030
2030-2040
Mtc
e Others
India
China
IEEJ:February 2016 © IEEJ2016
Executive summary
Asia/World Energy Outlook 2015 7
natural gas-fired power generation will increase its share by 7% points to 28%. Nuclear and renewable energy will retain their respective present shares of power generation.
Figure 9 Increases in final electricity consumption in selected regions
Figure 10 Global power generation mix
Note: The vertical line indicates Japan’s consumption at 950 TWh in 2013.
▌ Renewable energy’s share of power generation will stand at 23% in 2040, changing little
from 22% at present. However, wind and solar photovoltaics power generation will expand fast from 789 terawatt hours (TWh) in 2013 to 2,778 TWh in 2040 due to policy support and technological development, accounting for 7% of total power generation. Power generation capacity will grow 3.1-fold to 998 gigawatts (GW) for wind power and 5.5-fold to 749 GW for solar PV. Hydropower generation will increase slowly, while its share will decline with large-scale development decelerating.
▌ Nuclear power generation will increase from 2,478 TWh in 2013 to 4,321 TWh in 2040, though with its share of total power generation remaining almost unchanged from 11% at present, as is the case with renewable energy. Nuclear power generation capacity will decline in seven countries and regions, including Germany that plans to terminate nuclear power generation in the 2020s and Japan that is expected to cut capacity by 23 GW by 2040. In contrast, 32 countries will expand nuclear power generation capacity, including 13 planning to introduce nuclear power generation. Global nuclear power generation capacity will expand form 389 GW in 2013 to 610 GW in 2040.
Towards energy conservation and decarbonisation There is no royal road to energy conservation, but there are orthodox means.
▌ Five energy conservation principles: (1) understanding the significance of energy conservation, (2) checking energy consumption, (3) taking action for energy conservation, (4) improving equipment efficiency, and (5) promoting innovation with latest
Japan (2013)
3,823
2,393
1,619
1,249
827
671
0 1,000 2,000 3,000 4,000
China
India
ASEAN
Middle East/North Africa
United States
European Union
TWh2013-2020 2020-2040
9.6 10.4 12.1 13.7
5.16.3
8.8
11.2
2.53.2
3.8
4.3
3.8
4.3
4.7
5.0
0.9
1.5
2.3
3.0
23.3
27.4
33.5
39.5
0
10
20
30
40
2013 2020 2030 2040
PWh
Biomass and wastes
Other renewables
Hydro
Nuclear
Natural gas
Coal
Oil
IEEJ:February 2016 © IEEJ2016

Executive summary
Asia/World Energy Outlook 2015 8
technologies such as Internet of Things. Appropriate use or operation of equipment (reducing wasteful use) and maintenance for keeping performance play a key role in energy conservation.
▌ Energy conservation generates benefits while resulting in commensurate costs in most cases. For example, the introduction of highly efficient lighting may generate cumulative benefits worth $1.4 trillion due mainly to a decline in fuel consumption for power generation and result in an additional cost of $400 billion through 2040, bringing about net benefits worth $1 trillion.
Figure 11 Five energy conservation principles Figure 12 Costs and benefits of highly efficient lighting and energy conservation
▌ In the Advanced Technologies Scenario that assumes maximum carbon dioxide emission
reduction measures based on their application opportunities and social acceptability, energy consumption in 2040 will be 2,567 Mtoe less than in the Reference Scenario, with the increase from the present level limited to 53% of the growth in the Reference Scenario. Asia including China and India will account for 45% of the energy savings, playing a key role in energy conservation. Particularly, Asia will capture as much as 74% of coal consumption savings. Asia will also command 56% of an increase in consumption of nuclear and non-hydro renewables including solar PV and wind.
▌ Among energy sources, coal mainly for power generation will post the largest consumption decline from the Reference Scenario due to an electricity demand fall, power generation efficiency improvement and switching to other energy sources. Total fossil fuel will be 3,387 Mtoe less than in the Reference Scenario, while nuclear will be 471 Mtoe more and renewables 350 Mtoe more. As a result, fossil fuels’ share of power generation will drop from 81% in 2013 to 70% in 2040.
Realising energy conservation
UnderstandingSignificance/utility/secondary effects
Innovation Integration/
systemisation/automation
•HEMS/BEMS/CEMS• IoT
ImprovementProducts/
technology
•Energy conservation standards
•Development subsidies•Operation and maintenance
•Education: From children to adults
•PR activities: Energy conservation month/events
• International cooperation: Information/policy/technology
• (Experiences: oil crisis/blackout)
CheckingConsumption/energy saving performance
ActionImplementation/
introduction/purchasing
•Legal obligations•Setting targets•Labelling •Subsidies forintroducing equipment
•Correcting energy prices
•Taxation (tax exemption/reduction/levy)
•Energy conservation diagnosis
•Energy conservation monitoring
•Specifying consumption on power/gas bills
•Developing statistics•Energy management•ESCO
0
20
40
60
80
-0.4
-0.2
0.0
0.2
0.4
0.6
0.8
OECD Non-OECD Asia
Energy conservation in 2040 (Mtoe)
Cum
ulat
ive
cost
s and
ben
efits
thro
ugh
2040
($
2014
trill
ion)
Cumulative costs Cumulative benefits
Energy conservation
IEEJ:February 2016 © IEEJ2016

Executive summary
Asia/World Energy Outlook 2015 9
Figure 13 Primary energy consumption Figure 14 Energy consumption changes [2013-2040]
Results from lower energy prices Lower prices resulting from consumption reduction and resources development will change the world.
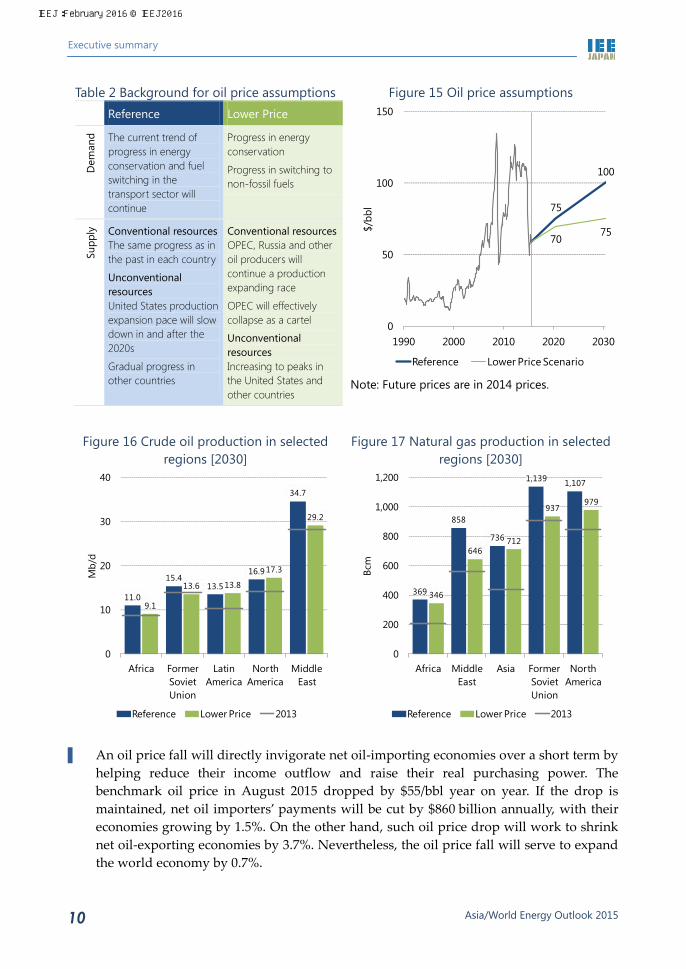
▌ In the Lower Price Scenario, we assumed that fossil fuel demand will be held down through policies for energy security, climate change mitigation and other purposes. The energy supply-demand balance will also ease as energy supply capacity expands substantially due to global progress in the development of unconventional oil and natural gas resources through technology advancement. The oil price in 2030 is assumed at $75/bbl in the Lower Price Scenario against $100/bbl in the Reference Scenario.
▌ In the Lower Price Scenario, the effects of energy conservation measures, assumed to be strongly promoted, will far exceed those of global economic expansion (described later) and rebound caused by lower energy prices. Required energy supply in 2030 will total 16,048 Mtoe, as much as 1,163 Mtoe less than in the Reference Scenario. Oil supply in 2030 will total 96.5 Mb/d with the increase from the present level limited to 7.7 Mb/d due to switching from oil to other energy sources. As unconventional oil production expands substantially mainly in North America, the increase in Middle Eastern oil production will be limited to 1.0 Mb/d, with Russia forced to reduce oil production by 0.8 Mb/d.
▌ Natural gas production will be affected by energy conservation, while switching to natural gas from other energy sources will make progress. This will not be the same case with oil. Natural gas production in 2030 in the Lower Price Scenario will increase by 825 Bcm from the present level to 4,355 Bcm, slipping below 4,971 Bcm in the Reference Scenario. Production will decline substantially in North America, the former Soviet Union, the Middle East and other net exporters, all affected by demand restrictions in other regions.
Advanced Technologies
16,39613,555
Reference18,963
Advanced Technologies
7,5345,409
Reference8,691
0
5,000
10,000
15,000
20,000
2000 2010 2020 2030 2040
Mto
e
World
Asia
650
1,287
1,839
480
1,1471,393
-822
448
763951
1,497
891
-1,000
0
1,000
2,000
Coal Oil
Nat
ural
gas
Nuc
lear
Rene
wab
les
Elec
tric
ityge
nera
ted
Primary consumption
Mto
eReference Advanced Technologies
IEEJ:February 2016 © IEEJ2016
Executive summary
Asia/World Energy Outlook 2015 10
Table 2 Background for oil price assumptions Figure 15 Oil price assumptions Reference Lower Price
Dem
and The current trend of
progress in energy conservation and fuel switching in the transport sector will continue
Progress in energy conservation
Progress in switching to non-fossil fuels
Supp
ly
Conventional resources The same progress as in the past in each country
Unconventional resources United States production expansion pace will slow down in and after the 2020s
Gradual progress in other countries
Conventional resources OPEC, Russia and other oil producers will continue a production expanding race
OPEC will effectively collapse as a cartel
Unconventional resources Increasing to peaks in the United States and other countries
Note: Future prices are in 2014 prices.
Figure 16 Crude oil production in selected regions [2030]
Figure 17 Natural gas production in selected regions [2030]
▌ An oil price fall will directly invigorate net oil-importing economies over a short term by
helping reduce their income outflow and raise their real purchasing power. The benchmark oil price in August 2015 dropped by $55/bbl year on year. If the drop is maintained, net oil importers’ payments will be cut by $860 billion annually, with their economies growing by 1.5%. On the other hand, such oil price drop will work to shrink net oil-exporting economies by 3.7%. Nevertheless, the oil price fall will serve to expand the world economy by 0.7%.
75
100
7075
0
50
100
150
1990 2000 2010 2020 2030
$/bb
lReference Lower Price Scenario
11.0
15.413.5
16.9
34.7
9.1
13.6 13.8
17.3
29.2
0
10
20
30
40
Africa Former Soviet Union
Latin America
North America
Middle East
Mb/
d
Reference Lower Price 2013
369
858
736
1,139 1,107
346
646712
937979
0
200
400
600
800
1,000
1,200
Africa Middle East
Asia Former Soviet Union
North America
Bcm
Reference Lower Price 2013
IEEJ:February 2016 © IEEJ2016

Executive summary
Asia/World Energy Outlook 2015 11
▌ In the Lower Price Scenario in which oil demand will be restricted with oil prices falling, net crude oil imports and exports in value3 will shrink substantially (Figure 18). Net imports of other fossil fuels will also be restricted, benefiting energy-importing economies. The entire world economy will expand by 1.9%. In Middle Eastern and other countries that depend heavily on revenues from energy exports, however, the energy exports decline will exert downward pressures on economies.
Figure 18 Impacts of loose energy supply-demand balance and low prices [2030]
Net crude oil import/export value in selected regions
Real GDP
Note: Combined effects of energy price drops, fossil fuel savings and use of unconventional oil and natural gas resources ▌ Excessively volatile energy prices could affect appropriate investment on both the
supply and demand sides, destabilising the future supply-demand balance. Promoting constructive discussions between energy producing and consuming countries to share market outlooks and other information and understanding for sound market development for various energy sources like oil, natural gas and LNG will be significant for stabilising energy markets and triggering their sustainable development. To this end, the International Energy Agency (IEA) and OPEC should promote their talks through the International Energy Forum and other forums. To secure communications between energy consuming countries, the IEA should enhance cooperation with China and India that will expand oil imports in the future.
3 Nominal value
99
151
238
336
145
195
795
149
302
340
553
343
1,252
260
0 500 1,000
Japan
United States
Western Europe
China
Africa
Former Soviet Union
Middle East
Net
impo
rts
Net
exp
orts
$ billion
Lower Price Volume contributionPrice contribution Reference
European Union
ASEAN
United States India
JapanChinaOceania
Russia
Middle East
OthersGlobal
average
-4%
-2%
0%
2%
0 20 40 60 80 100
Low
er P
rice
(com
pare
d w
ith R
eren
ce)
Reference ($2010 trillion)
IEEJ:February 2016 © IEEJ2016

Executive summary
Asia/World Energy Outlook 2015 12
Realistic approach required on climate change issue INDC implementation alone may fail to reduce GHG emissions substantially.
▌ Global energy-related CO2 emissions will increase by 39% from 2013 to 45.9 Gt in 2050 in the Reference Scenario. In the Advanced Technologies Scenario accompanied by carbon capture and storage (CCS), CO2 emissions will be reduced by 29% from the present level to 23.3 Gt. However, the emissions will still fall short of being halved.
▌ Based on intended national determined contributions (INDCs) commitments by seven major countries and the European Union4, global GHG emissions in 2030 are estimated at a level that is closer to the Reference Scenario than to the Advanced Technologies Scenario. The United States and Japanese estimates are close to those in the Advanced Technologies Scenario and the European Union estimate is midway between the estimates in the Advanced Technologies and Reference Scenarios. The Chinese estimate is close to the Reference Scenario level, while the Indian estimate exceeds the Reference Scenario level. All parties will be required to make efforts in line with the Advanced Technologies Scenario. Particularly, developing countries will have to effectively enhance their GHG emission reduction efforts.
Figure 19 Global CO2 emissions and each measure’s contribution to emission
reductions
Figure 20 GHG emissions
Note: GHG emissions for the Reference Scenario
and the Advanced Technologies Scenario plus CCS are assumed proportional to the energy-related CO2 emissions.
4 The seven major countries and the European Union accounted for 65% of global GHG emissions in 2010.
21.2
32.9
39.5
45.9
32.6
23.3
10
20
30
40
50
1990 2010 2030 2050
GtC
O2
Efficiency
Biofuel
Wind, solar, etc.
Nuclear
Fuel switching
CCS
Reference
Advanced Technologies + CCS
30
40
50
60
70
2000 2010 2020 2030
GtC
O2-
eq
Reference
INDC
Advanced Technologies + CCS
Halving emissions by 2050
IEEJ:February 2016 © IEEJ2016

Executive summary
Asia/World Energy Outlook 2015 13
Take advantage of time left to spare for making balanced efforts with future technologies and adaptation taken into account.
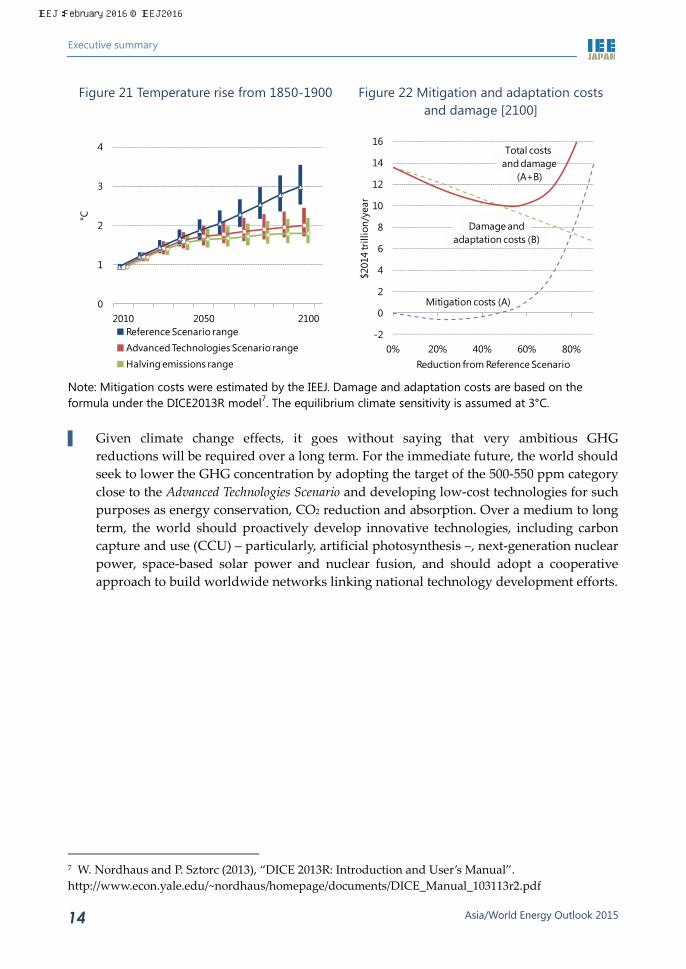
▌ In the extension of the Reference Scenario, the atmospheric concentration of GHGs in 2100 will come to 760-860 ppm (parts-per-million CO2-equivalent) with the average temperature change from the 1850-1900 period reaching 2.8-4.0°C. In the extension of the Advanced Technologies Scenario accompanied by CCS, the GHG concentration in 2100 will total 540-600 ppm, with the temperature change reaching 1.7-2.4°C. The temperature will thus slip below 2.5°C and could fall below 2°C, indicating that the scenario could be combined with adaptation measures5 into an option close to the one that would halve CO2 emissions in 2050 from 2013 and eliminate them in 2100.
▌ If CO2 emission reduction and other climate change mitigation measures 6 are implemented in the Reference Scenario, mitigation costs will increase with “adaptation and damage” costs decreasing. Adaptation and damage costs will be less than mitigation costs over a short to medium term. Over a long term beyond 2050, however, they will grow larger. While uncertainties are still great regarding these cost estimates, there may be some point at which a total of mitigation, adaptation and damage costs could be minimised between the Reference Scenario and the scenario for halving GHG emissions by 2050. Mitigation, adaptation and damage costs trade off with each other, meaning that it is impossible to reduce the three simultaneously. A realistic option may be to balance the three with minimisation of the comprehensive costs kept in mind.
5 Adaptation measures are designed to prevent adverse effects of climate change, including damage from sea level rise, farm drought and new disease epidemics. These measures include river and coastal banks, storage reservoirs, agricultural research, and disease prevention and treatment. 6 Mitigation measures are designed to artificially reduce GHG sources or expand GHG sinks to hold down greenhouse effects.
IEEJ:February 2016 © IEEJ2016
Executive summary
Asia/World Energy Outlook 2015 14
Figure 21 Temperature rise from 1850-1900 Figure 22 Mitigation and adaptation costs and damage [2100]
Note: Mitigation costs were estimated by the IEEJ. Damage and adaptation costs are based on the formula under the DICE2013R model7. The equilibrium climate sensitivity is assumed at 3°C. ▌ Given climate change effects, it goes without saying that very ambitious GHG
reductions will be required over a long term. For the immediate future, the world should seek to lower the GHG concentration by adopting the target of the 500-550 ppm category close to the Advanced Technologies Scenario and developing low-cost technologies for such purposes as energy conservation, CO2 reduction and absorption. Over a medium to long term, the world should proactively develop innovative technologies, including carbon capture and use (CCU) – particularly, artificial photosynthesis –, next-generation nuclear power, space-based solar power and nuclear fusion, and should adopt a cooperative approach to build worldwide networks linking national technology development efforts.
7 W. Nordhaus and P. Sztorc (2013), “DICE 2013R: Introduction and User’s Manual”. http://www.econ.yale.edu/~nordhaus/homepage/documents/DICE_Manual_103113r2.pdf
0
1
2
3
4
2010 2050 2100
°C
Reference Scenario rangeAdvanced Technologies Scenario rangeHalving emissions range
-2
0
2
4
6
8
10
12
14
16
0% 20% 40% 60% 80%$2
014
trill
ion/
year
Reduction from Reference Scenario
Mitigation costs (A)
Total costs and damage
(A+B)
Damage andadaptation costs (B)
IEEJ:February 2016 © IEEJ2016

Asia/World Energy Outlook 2015 15
Part I Volatile energy prices and implications for future outlooks
IEEJ:February 2016 © IEEJ2016

IEEJ:February 2016 © IEEJ2016

1. Analysing crude oil and natural gas prices
Asia/World Energy Outlook 2015 17
1. Analysing crude oil and natural gas prices
1.1 Crude oil prices
Why reviewing crude oil prices?
This Outlook focuses on crude oil prices and analyses scenarios for different price levels. There are fundamental and contemporary reasons for taking up crude oil prices anew.
Importance of crude oil prices for world economy
First, it may be needless to say that fundamentaly crude oil prices exert great influences on the world’s politics and economy. Crude oil is the world’s largest trading commodity. As crude oil producing regions collect massive rent (excessive profit), trade in the commodity causes huge wealth transfers that greatly influence the balance of power in international politics. In terms of energy supply and demand, oil is the world’s largest primary energy source8, being used for transportation, power generation and petrochemicals and consumed in the industry, commercial and residential sectors. Therefore, crude oil prices are one of the important input prices for the macro economy and influence economic activities overall (Figure 23). In Asia and some other regions, crude oil prices are also used for pricing natural gas, serving as a key benchmark for the selection of energy sources. In considering future energy problems, therefore, crude oil prices are one of the most important factors.
Figure 23 Real oil price and OECD economic growth
8 According to the BP Statistical Review of World Energy 2015, oil accounted for 33% of total energy demand in 2014.
-4%
-2%
0%
2%
4%
6%
8%
10%
12%
0
20
40
60
80
100
120
1970 1980 1990 2000 2010
GD
P growth
Real
oil
pric
e ($
2014
/bbl
)
OECDGDP growth
Real oil price
1st
oil crisis
2nd
oil crisis
OPEC shareslips below 30%
Gulf War
Asian currencycrisis
Lehman
Shock
Rise of unconventionalcrude oil
IEEJ:February 2016 © IEEJ2016

Part I Volatile energy prices and implications for future outlooks
Asia/World Energy Outlook 2015 18
Increased importance of crude oil prices
One of the contemporary reasons for taking up a review of crude oil prices is that they plunged rapidly during the second half of 2014 and remained weak ever since. The Brent crude oil price stood around $110/bbl in July 2014 and started a rapid drop in the autumn of that year. As of late September 2015, the price stood around $40/bbl. It is the understanding of the impacts of such price plunge on future global energy supply and demand that motivates this analysis.
Another contemporary reason is that the crude oil price weakness is expected to remain over the long term rather than ending in one year or two, as a short-term phenomenon. The history of the crude oil market includes cases of such rapid oil price plunges (Table 3). The latest is similar to the sharp drop in the 1980s as they both resulted from an increase in non-OPEC oil supply under prolonged high price levels rather than any demand-side shock like an economic crisis. As a matter of course, the present international crude oil market differs from that in the 1980s as the price elasticity of oil demand has declined due to the diversification of market players and the transport sector’s growing share of oil demand. Moreover, shale oil’s growing price competitiveness (productivity improvements, lower prices for materials and equipment), expected growth in supply from Iraq and Iran, and the reluctance by Saudi Arabia to revise its present production policy have increased the chance for oil prices to remain weak over the long term, as seen in the 1980s and after.
Table 3 Differences between past oil price plunges 1986 1998 2008 2014
Price plunge
-74% -34% -37% -56%
Factors behind price plunge
• Oil demand fall under high prices following oil crises, expansion in non-OPEC oil supply
• OPEC countries’ market share-expanding race
• Loose supply-demand balance caused by Saudi Arabia’s netback pricing formula
• Decline in oil demand in emerging countries under Asian currency crisis
• OPEC production exceeding quotas
• Loose supply-demand balance caused by OPEC production quota expansion
• Global oil demand plunge under Lehman Shock
• Production capacity expansion mainly by Saudi Arabia
• Non-OPEC supply expansion
• Maintenance of OPEC production
• Global demand decline
• Production expansion by OPEC members (including Iraq, Saudi Arabia and Iran)
Note: Each price plunge indicates a change between the peak and bottom within six months on the New York Mercantile Exchange. If the oil price weakness remains over the long term, it will surely exert great impacts on future energy supply and demand. Low oil prices’ stimulation of oil demand and constraints on upstream oil resources development could cause the oil supply-demand balance to rapidly tighten, as seen after the middle of the 2000s. The crude oil price plunge and subsequent natural gas price drops could also change the price relationship between fuels and affect fuel choices. Furthermore, the oil price plunge will affect the diffusion of renewable energy and the promotion of low-carbon policies. If resource-rich countries’ fiscal conditions deteriorate due to the prolonged crude oil price weakness, it may affect overall
IEEJ:February 2016 © IEEJ2016
1. Analysing crude oil and natural gas prices
Asia/World Energy Outlook 2015 19
political and economic conditions. Given these possibilities, it is very significant to conduct analyses based on plural crude oil price scenarios for projecting into the future.
Factors influencing crude oil prices
What factors are contributing to forming crude oil prices? We here briefly explain the factors influencing oil prices as they are related to later scenario discussions. They are divided into three categories -- supply and demand factors, risk factors, and financial and speculative factors.
Demand factors
It may be needless to say that the oil supply and demand trends are among the most important factors forming crude oil prices. While oil demand has entered a structural downward trend in advanced countries due to improvements in vehicle fuel efficiency and falling population, demand is expected to increase in emerging countries thanks to expanding economic activities, income growth and progress in motorization.
Oil is used not only in the transport sector but also in other sectors including buildings, power generation, industry and petrochemicals. In the future, oil demand will increase mainly for transport and petrochemicals while, epoch-making technological progress in electric or natural gas vehicles and alternative fuels such as biofuels and hydrogen may largely decelerate the growth.
Supply factors
The supply trend is as important as the demand trend. In the absence of economic shocks, oil demand tends to increase at a certain annual pace while supply can change greatly and rapidly depending on crude oil price levels, OPEC production policies and other factors. Therefore, supply factors have more often decisive effects on daily crude oil prices than demand factors and holding the decisive key to future oil supply may be the fate of the ongoing U.S. shale revolution. The global oil supply picture could change greatly depending on how far continuing productivity improvements and cost cuts for shale oil production would go and on how far shale oil production technologies would diffuse outside North America. Attracting attention as a future conventional oil supply source is an increase in oil output in non-Gulf Middle Eastern countries Iran and Iraq. In Iraq, oilfields that have been developed after the Iraq war are smoothly expanding output. As transport and shipment infrastructure problems (current bottlenecks) are solved, Iraq may increase output further. As in Iraq, Iran may expand its oil production capacity and output using foreign capital if Western countries lift their economic sanctions smoothly.
Risk factors
Non-supply/demand factors such as sudden or unexpected events that actually affect supply and demand and are identified by market participants as such are generally called risk factors. These risk factors exert great influences on crude oil prices. Representative risk factors include political destabilization in oil producing regions (the so-called geopolitical risk), natural disasters such as hurricanes and earthquakes, and accidents at oil production facilities. Most risk factors serve as sudden factors with less long-term influences on oil prices than supply or demand factors. Among risk factors, however, structural political turmoil in
IEEJ:February 2016 © IEEJ2016

Part I Volatile energy prices and implications for future outlooks
Asia/World Energy Outlook 2015 20
the Middle East is a factor that could exert great influences on future crude oil prices. Prolonged political instability in Iraq and Syria, particularly radical Islamic State (IS) militants’ expanding operations since the spring of 2014, could destabilize the political situation not only in Iraq and Syria but also in the whole of the Middle East and North Africa through terrorism and armed attacks. In fact, militants claiming to be IS members conducted terrorist attacks against Shiite Muslims in eastern Saudi Arabia in April 2015. There is a risk that the IS and IS-influenced organizations could cause events affecting oil supply in the Middle East and North Africa.
At a time when Western countries are moving to lift economic sanctions on Iran, we cannot ignore the fact that Iran’s neighbours are concerned about Iran’s rising as a regional power again. While any large-scale dispute involving the whole of the Middle East is unlikely to occur, limited disputes such as the Yemen situation are likely to emerge at any time, leading crude oil prices to rise.
Russia’s aerial bombing on Syria, which started in September 2015, could also create more destabilizing factors by shaking the regional political power balance. Even outside the Middle East, Russia has changed the status quo by the use of force in Ukraine. In Asia as well, some events could affect crude oil prices. If security in sea lanes from the Strait of Hormuz to the Strait of Malacca and Singapore is threatened, it may exert a great impact on the crude oil market.
Financial and speculative factors
In addition to the three abovementioned categories of factors, financial and speculative factors have been growing more important over recent years. Since the mid-2000s when commodity futures as a whole became alternative investment targets, massive investment money has been flowing into the crude oil futures market. On the New York Mercantile Exchange (NYMEX), as a result, open interest for crude futures quadrupled for 300,000-400,000 contracts in the beginning of the 2000s to 1.6 million contracts in September 2015. Working’s speculative index, which measures excessive speculation, rose from 1.1-1.2 in the beginning of the 2000s to 1.5-1.6 in September 2015. These changes indicate that investment money’s flow into the crude oil futures market is no longer any temporary phenomenon and that crude oil futures are viewed as one of the leading investment “commodities” in the world’s financial markets.
IEEJ:February 2016 © IEEJ2016

1. Analysing crude oil and natural gas prices
Asia/World Energy Outlook 2015 21
Figure 24 Traded volume and speculative index in NYMEX
Investment money moves in the world’s financial markets are susceptible to government and central bank monetary policies. Monetary easing may encourage investment money to flow into the crude oil futures market by increasing investors’ risk appetite. Conversely, monetary tightening may lead money to leave the risky commodity futures market. While the United States is discussing an interest rate hike toward the end of 2015, Europe and Japan are likely to maintain their accommodative monetary policy. Investment money moves and crude oil price changes are thus expected to continuously have strong correlations.
Meanwhile, Western countries have been moving to toughen regulations on excessive speculative transactions on the commodity futures market. This is because daily crude oil prices have become susceptible to stock prices, exchange rates and other financial and economic indicators having no relations with oil supply or demand and to geopolitical risks, and have deviated from actual supply and demand fundamentals as crude oil futures have become a financial instrument. Moves to toughen such regulations might have lost some momentum as crude oil prices have plunged since the second half of 2014. But appropriate regulation frameworks should be developed promptly to prevent excessive speculative transactions that could destabilize the crude oil market.
Price assumptions
Crude oil price assumptions for the Reference and Lower Price Scenarios are given in Figure 25. The price trend in the Reference Scenario is viewed as the most feasible one based on forecasts for the above three categories of factors influencing oil prices. The Lower Price Scenario is less likely than the Reference Scenario but could be realized if various factors work in a composite manner.
0
500
1,000
1,500
2,000
1.0
1.2
1.4
1.6
1.8
1993 1995 1997 1999 2001 2003 2005 2007 2009 2011 2013 2015
Traded volume (1,000 units)
Spec
ulat
ive
inde
x Speculative index
Traded volume (right)
IEEJ:February 2016 © IEEJ2016

Part I Volatile energy prices and implications for future outlooks
Asia/World Energy Outlook 2015 22
Figure 25 Crude oil prices assumptions
Note: Future prices are in 2014 prices. Background for Reference Scenario
On the demand side, motorization will make smooth progress in line with income improvements in emerging countries, including China, as their economies grow robustly. Oil demand will therefore continue increasing as the auto fleet will also expand due to population growth. Despite vehicle fuel efficiency that will continue to improve gradually, oil’s superiority in the transport sector will still remain unshaken even by 2040. Electric, fuel cell and natural gas vehicles will not diffuse in a full-blown manner by then.
On the supply side, U.S. shale oil production will peak in the 2020s while development will continue in major production areas such as Bakken, Eagle Ford and Permian. Global shale oil output will continue increasing until 2040 as non-U.S. shale oil development makes steady progress toward 2030 despite a number of geological, technological and political constraints or problems. Conventional oil output in Iraq, though failing to reach the government target of 9 million barrels per day (Mb/d) in 2020 due to political deterioration, will reach 6 Mb/d in 2030. Iranian oil production capacity will reach 6 Mb/d by 2040, as foreign companies take part in oil development following the termination of Western economic sanctions.
As the oil supply-demand balance tightens gradually after the current oversupply, sporadic risk factors will exert upward pressure on crude oil prices. While fundamental solutions will fail to resolve disputes in the Middle East including Syria and Iraq, the IS and IS-influenced radical groups will continue armed attacks in the Middle East and North Africa. As Western countries will lift the economic sanctions on Iran, imposed over its nuclear development program, Iran’s comeback to the international community and confrontation with its neighbours will remain deep-rooted and serve as a destabilizing factor in the Middle Eastern situation. The Russian military operations launched in Syria in 2015 further deteriorated the existing Russia-U.S. confrontation over the Ukraine problem. If Western economic sanctions on Russia continue, Russian oil output will fall short of increasing greatly with Western companies failing to promote investment in Russia.
75
100
125
7075
80
0
50
100
150
1990 2000 2010 2020 2030 2040
$/bb
l
Reference
Lower Price
IEEJ:February 2016 © IEEJ2016

1. Analysing crude oil and natural gas prices
Asia/World Energy Outlook 2015 23
Meanwhile, financial and speculative factors will continue to shake crude oil prices on a daily basis. Given that a number of countries are expected to retain monetary easing policy until around 2020, crude oil prices and financial indicators are likely to continue to have strong correlations. Attempts to regulate speculative transactions in Western countries since the late 2000s will gradually work to restrict excessive speculation, while failing to decisively stop investment money’s flow into the crude oil futures market. So, crude oil futures will remain one of the investment targets.
In the Reference Scenario, the benchmark crude oil price is assumed at $75/bbl for 2020 and more than $100/bbl for 2030. If global oil demand increases by an annual average of 1 Mb/d, the cumulative increase through 2020 will total 5 Mb/d. The current supply surplus of more than 1 Mb/d in the international oil market and the potential output increase in major Middle Eastern oil producing countries are not sufficient and some high-cost oil production will be required to meet the abovementioned demand expansion. Therefore, the crude oil price is assumed to rise to $75/bbl or more by 2020. From 2020, continuous demand growth and investment in expanding supply (including high-cost oil) will exert upward pressure on the crude oil price. So, the price is assumed to rise further by 2030.
Background for Lower Price Scenario
On the demand side for the Lower Price Scenario, motorization itself will make progress as in the Reference Scenario. But auto fuel efficiency regulations will diffuse as a part of energy conservation measures not only in advanced countries but also in developing nations based on Western experiences. Global auto fuel efficiency will continue to improve while the selling price for hybrid and other next-generation vehicles will fall. Through 2040, oil demand growth in the transport sector will be restricted due to technological breakthroughs regarding battery costs and capabilities for electric, natural gas and fuel cell vehicles.
On the supply side, despite low oil prices, U.S. shale oil output will reach 5.5 Mb/d in 2020 as productivity improves. Later, the production growth will decelerate due to domestic geological constraints. In the meantime, shale oil development will spread in Argentina, Mexico, Turkey, China and other countries, leading global shale oil output to rise to 8.9 Mb/d in 2030. Within OPEC, Saudi Arabia and other Persian Gulf oil producing countries will escalate the rivalry that began in the mid-2010s with Iran and Iraq and, therefore, OPEC will no longer work effectively as a cartel. From 2020 through 2030, OPEC’s influence on the crude oil market will remain limited and Iran will expand oil output. Later, upstream oil development investment will expand in African oil producing countries, increasing global supply.
As the supply-demand balance stays structurally loose, risk factors will have less chance to be reflected in the crude oil market. The Middle Eastern situation, including Syrian and Iraqi conditions, and the Russia-Ukraine situation, though remaining unstable, will be stalled and avoid decisive deterioration, limiting the possibility of working to exert upward pressure on crude oil prices.
In the meantime, Western countries’ enhanced regulations on speculative transactions will gradually succeed in reducing excessive speculation in the finance and investment area. At the same time, a decline in crude oil price volatility under the loosening supply-demand
IEEJ:February 2016 © IEEJ2016
Part I Volatile energy prices and implications for future outlooks
Asia/World Energy Outlook 2015 24
balance will help prevent speculative money from flowing into the crude oil market. Influences of financial and speculative factors on the crude oil market will thus decrease gradually.
In the Lower Price Scenario, the benchmark crude oil price will stand at $70/bbl (or less) in 2020 and will still be limited to $75/bbl in 2030. The price is assumed to turn upward from the present low level (in October 2015) due to the low price’s stimulation of demand and restrictions on output at high-cost wells mainly in non-OPEC oil producing countries over a short-term, rallying to around $70/bbl in 2020. Later, however, substantial growth in unconventional oil output and restrictions on demand growth are assumed to cap a price hike, limiting the price in 2030 to $75/bbl.
1.2 Natural gas prices
Natural gas as a commodity
The combustion of natural gas, consisting primarily of methane (CH4), emits less carbon dioxide (CO2) and sulphur oxide (SOx) than oil or coal, having an environmental advantage. But the calorific value per volume of natural gas is limited to only one-1,000th of that of oil and the calorific value per volume of liquefied natural gas is about one-1.7th that of oil.
The liquefaction of natural gas to reduce the volume to one-600th of the volume of the gas in its natural state has allowed natural gas to be transported by sea over long distances. But high-cost nickel and stainless steel and aluminium alloy are used for LNG tanks to keep the temperature as low as minus 162 degrees Celsius. Such characteristics of LNG require massive investment in the LNG distribution process including liquefaction plants, tankers and receiving terminals.
Therefore, the efficiency of LNG transportation via pipelines or tankers is far less than that of oil, meaning far more transportation costs for LNG. So, natural gas prices are regional, having yet to be globalized. Natural gas or LNG has thus failed to develop into any financial instrument in regions other than the United States and Western Europe.
Factors forming natural gas prices
Natural gas commoditization has relatively failed to make progress over the last few decades. The supply-demand balance (particularly in Asia and Europe), crude oil prices and risks are factors forming prices for natural gas. These factors are considered more important than market participants’ expectations that play a significant role in setting oil prices. Unlike crude oil, natural gas has no global benchmark prices and factors forming natural gas prices work on a region-by-region basis. These regional natural gas prices influence each other through international trade. In the following, we analyse the international natural gas price formation, and discuss domestic natural gas prices to the extent they influence international prices.
Supply and demand factors are the most important among factors forming natural gas prices over a medium to long term.
While macroeconomic conditions and population define overall energy demand, natural gas use promotion measures, infrastructure development, CO2 prices (that have the most remarkable impact in Europe among regions) and technological innovation influence the
IEEJ:February 2016 © IEEJ2016
1. Analysing crude oil and natural gas prices
Asia/World Energy Outlook 2015 25
price competitiveness of natural gas against rival fuels and define natural gas demand. Particularly, economic growth in China, India, ASEAN (Association of Southeast Asian Nations) members and other emerging countries is very important on the demand side.
In Europe, natural gas prices have been stable since 2009. The average wholesale gas price known as the National Balancing Price in the U.K. gas market that is the most liquid in Europe reached $11 per million British thermal units (MBtu) in 2008 and plunged to $4.9/MBtu in 2009. Since then, prices other than temporarily high prices caused by cold waves have never recovered the 2008 peak. The price trend is common to major West European natural gas consuming countries including Germany. This is because macroeconomic conditions have deteriorated on financial and sovereign debt crises and natural gas has lost competitiveness against renewable energy sources supported by policies and against coal whose consumption has expanded due to slumping CO2 prices. Similarly, China has seen slowing growth in natural gas demand and has been considering lowering regulated natural gas prices as of autumn 2015 due mainly to economic deterioration growing remarkable in 2015 and natural gas’s loss of price competitiveness.
On the supply side, the shale revolution may be the most important factor, as is the case with crude oil. The U.S. Henry Hub natural gas price has remained low below $3/MBtu up to October 2015. Whether productivity could be improved further to justify continuous investment even at the price level and whether the shale revolution would be realized in Canada, China, Argentina and Mexico may be important.
The United States has had a typical case in which supply factors have influenced natural gas prices. As is well known, a technological innovation combining hydraulic crushing, horizontal drilling and three-dimensional geological mapping has dramatically reduced shale gas production costs. The cost reduction stimulated progress in investment in shale gas development, leading shale gas output to expand rapidly. As demand growth failed to catch up with output growth, the Henry Hub price plunged to less than $3/MBtu in 2015 from a peak of $13/MBtu reached in July 2008. Technological innovations have been faster than the loosening of the supply-demand balance, allowing shale gas to maintain its competitiveness. Whether technological innovation could be continued in the future may greatly influence U.S. natural gas prices.
Prices for crude oil that account for most of international energy transactions exert great influences on those of petroleum products and electricity, or on prices in general, as fuel or materials costs. While supply and demand, finance, economy and risk factors form crude oil prices as explained above, crude oil prices directly influence natural gas prices because of natural gas supply contracts for Asia and Central and Eastern Europe that mostly link prices to oil prices. The link to oil prices takes various forms depending on the degree of the link (pricing formula tilt) and the presence or absence of an “S curve” mechanism for mitigating extreme price fluctuations. Therefore, how and when crude oil prices influence natural gas prices in individual contracts for the oil price link cannot be generalized.
Japan LNG Cocktail (JLC) prices in the 2000s indicate a remarkable case in which oil prices greatly influenced natural gas prices. The JLC price was almost equal to the Japan Crude Cocktail (JCC) price in 2000 and was limited to some 70% of the JCC price in 2007 despite a sharp crude oil price hike as the “S curve” and other mechanisms adopted for many contracts
IEEJ:February 2016 © IEEJ2016
Part I Volatile energy prices and implications for future outlooks
Asia/World Energy Outlook 2015 26
for LNG for Japan worked to restrict LNG price hikes even amid the oil price upsurge. LNG thus improved its price competitiveness against petroleum products in this way, allowing Japan’s city gas demand to grow in the decade.
While supply and demand factors and crude oil prices define a medium to long-term price trend for natural gas, abnormal weather, natural disasters, accidents, terrorist attacks, walkouts, armed conflicts and other risk factors cause relatively short-term price volatility in most cases. Since the Middle East’s share of natural gas exports in the global market is relatively small, the Middle Eastern situation exerts less direct impact on international natural gas prices than on crude oil prices. Through the oil link, however, the Middle Eastern situation could work to push up natural gas prices for Asia and Europe.
In the most remarkable case in which a risk factor brought about a major price fluctuation for natural gas, hurricane damage caused a sharp natural gas price hike in the United States in 2005. Great Hurricanes Katrina and Rita hit the Gulf of Mexico in August and September 2005, respectively, bringing about the largest ever natural disaster in the United States. As the hurricanes drowned, damaged or destroyed gas/oil drilling rigs in the gulf, the loss of gas production capacity totalled up to 8.8 billion cubic feet per day. As a result, the Henry Hub natural gas price soared from the July 2005 average of $8/MBtu to the October 2005 average of $13/MBtu.
Natural gas pricing methods
International natural gas pricing methods differ from region to region. Asian natural gas prices are generally linked to the JCC price. United States and United Kingdom natural gas prices are linked to Henry Hub and NBP domestic wholesale prices, respectively. Although Continental Europe had generally linked natural gas prices to petroleum product and Brent crude oil prices, Germany and other major West European gas importing countries have linked their natural gas prices to domestic wholesale prices, as is the case with the United States and the United Kingdom.
Natural gas prices’ link to oil prices originated from business practices in Northwest Europe in the 1960s. In a bid to locally consume natural gas from the Groningen gas field discovered in the Netherlands in 1959, gas field developers and the Dutch government linked the prices of natural gas to those of petroleum products, assumed to compete with natural gas, to achieve both the diffusion of natural gas and the maximization of natural gas sales income. The concept of natural gas prices linked to oil prices successfully diffused natural gas in Europe, leading gas exporting countries Norway, Russia and Algeria to follow the oil-linked natural gas pricing method.
Asia has also followed the concept of natural gas prices linked to oil prices. Fixed prices reflecting production and liquefaction costs had been adopted for early-stage LNG imports from Alaska and Brunei. As crude oil prices were destabilized, however, LNG prices for Japan shifted to the oil price link in the 1970s. Reference crude oil prices for LNG prices had initially included OPEC’s posted price and oil producing countries’ government selling prices. As these government selling prices deviated from spot crude oil prices in the 1980s, doubts emerged about the advisability of linking LNG prices to crude oil prices announced by oil producing countries. Therefore, the JCC price replaced government selling prices as the
IEEJ:February 2016 © IEEJ2016
1. Analysing crude oil and natural gas prices
Asia/World Energy Outlook 2015 27
reference for LNG prices in the 1990s. The link to oil prices has seemingly been adopted for pipeline gas transactions within the ASEAN region and for China as well.
When LNG prices for Asia posted an unprecedented excess (the so-called Asian premium) over those for Europe and the United States in the 2010s, however, doubts emerged about the advisability of linking LNG prices to oil prices. As the oil price plunge since the second half of 2014 has worked to lower LNG prices linked to oil prices, the Asian premium has shrunk. But the unreasonableness of LNG prices rising in line with oil price hikes irrespective of supply and demand conditions for LNG or natural gas has still been left untouched.
At present, hybrid contracts that include European and U.S. gas hub prices or spot LNG prices into LNG pricing formulas are increasing. Prices for LNG imports from the United States will be linked to the Henry hub price. In this way, the diversification of gas pricing formulas has been making progress. For a medium to long term, it will be desirable for natural gas prices for Asia to be based on LNG or natural gas supply and demand conditions. The improvement of LNG market liquidity in LNG importing countries and the repeal or relaxation of the destination clause in the international market will be required to allow any benchmark Asian natural gas price to be formed.
Price assumptions
Background for Reference Scenario
In the Reference Scenario, the natural gas price in 2020 is assumed at $4.5/MBtu for the United States (Henry Hub), at $8.5/MBtu for the United Kingdom (NBP) and at $10.7/MBtu for Japan (JLC). The price in 2040 is put at $6.8/MBtu for the United States, at $11.7/MBtu for the United Kingdom and at $14.1/MBtu for Japan. On the demand side, natural gas consumption in the power generation and transport sectors, energy conservation, infrastructure development and natural gas use promotion policies will make progress as recognized at present. On the supply side, unconventional gas will continue to account for half of total output in the United States. Unconventional gas development in other countries will not make progress before 2025. Reflecting the loosening LNG supply-demand balance, the JLC price will stay around $10/MBtu until 2020 and rise slowly later. As a result, interregional gas price gaps will narrow to some extent.
Background for Lower Price Scenario
In the Lower Price Scenario, United States, United Kingdom and Japanese natural gas prices are assumed to rise little in real terms. On the demand side, energy conservation will diffuse considerably not only in advanced countries but also in emerging countries and be combined with the utilization of non-fossil fuels to restrict natural gas consumption in the power generation sector. On the supply side, unconventional gas production costs will dramatically decline on technological development. Unconventional gas will continue to account for more than half of total natural gas output in the United States and unconventional gas development in other countries will begin to make progress after 2020. The natural gas price in 2020 is assumed at $3.4/MBtu for the United States, at $6.8/MBtu for the United Kingdom and $9.6/MBtu for Japan. The price in 2040 is put at $3.9/MBtu for the United States, at $8.1/MBtu for the United Kingdom and $10.2/MBtu for Japan. As a result, interregional natural gas price gaps will narrow further.
IEEJ:February 2016 © IEEJ2016

Part I Volatile energy prices and implications for future outlooks
Asia/World Energy Outlook 2015 28
Figure 26 Natural gas prices assumptions
Solid lines: Reference Scenario, Dotted lines: Lower Price Scenario. In both scenarios, the natural gas pricing formulas for Asia are assumed to make progress in diversification while falling short of shifting away completely from the link to oil prices. If domestic and international gas market liquidity is improved in Asia, with LNG prices fluctuating more wildly than oil prices, Asia may shift away from the oil price link to importing countries’ wholesale gas prices or spot LNG prices.
16.3
10.7
12.814.1
8.2 8.59.8
11.7
4.4 4.55.6
6.8
9.6 9.8 10.2
6.8 7.38.1
3.4 3.7 3.9
0
5
10
15
20
2010 2014 2020 2030 2040
$201
4/M
btu
Crude oil
Japan
U.S.
Europe (U.K.)
IEEJ:February 2016 © IEEJ2016
Asia/World Energy Outlook 2015 29
Part II Asia/World energy demand and supply outlook
IEEJ:February 2016 © IEEJ2016

IEEJ:February 2016 © IEEJ2016
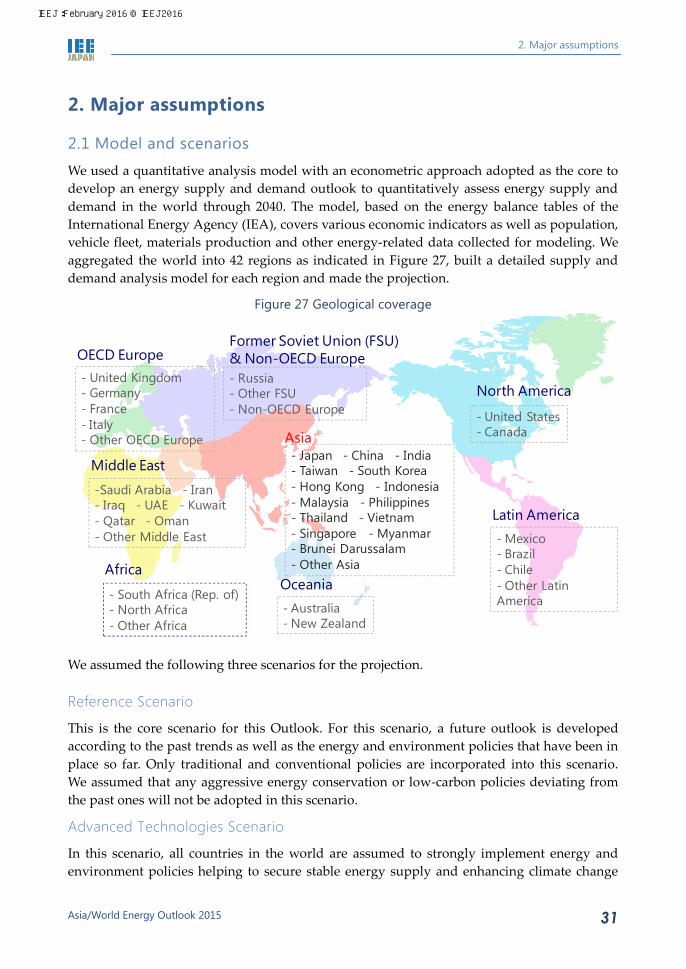
2. Major assumptions
Asia/World Energy Outlook 2015 31
2. Major assumptions
2.1 Model and scenarios
We used a quantitative analysis model with an econometric approach adopted as the core to develop an energy supply and demand outlook to quantitatively assess energy supply and demand in the world through 2040. The model, based on the energy balance tables of the International Energy Agency (IEA), covers various economic indicators as well as population, vehicle fleet, materials production and other energy-related data collected for modeling. We aggregated the world into 42 regions as indicated in Figure 27, built a detailed supply and demand analysis model for each region and made the projection.
Figure 27 Geological coverage
We assumed the following three scenarios for the projection. Reference Scenario
This is the core scenario for this Outlook. For this scenario, a future outlook is developed according to the past trends as well as the energy and environment policies that have been in place so far. Only traditional and conventional policies are incorporated into this scenario. We assumed that any aggressive energy conservation or low-carbon policies deviating from the past ones will not be adopted in this scenario.
Advanced Technologies Scenario
In this scenario, all countries in the world are assumed to strongly implement energy and environment policies helping to secure stable energy supply and enhancing climate change
- United States- Canada
North America
- Australia- New Zealand
Oceania- South Africa (Rep. of)- North Africa- Other Africa
Africa
-Saudi Arabia - Iran- Iraq - UAE - Kuwait- Qatar - Oman- Other Middle East
Middle East- Japan - China - India- Taiwan - South Korea- Hong Kong - Indonesia- Malaysia - Philippines- Thailand - Vietnam- Singapore - Myanmar - Brunei Darussalam- Other Asia
Asia
- United Kingdom- Germany- France - Italy- Other OECD Europe
OECD Europe- Russia- Other FSU- Non-OECD Europe
Former Soviet Union (FSU)& Non-OECD Europe
- Mexico- Brazil- Chile- Other Latin America
Latin America
IEEJ:February 2016 © IEEJ2016
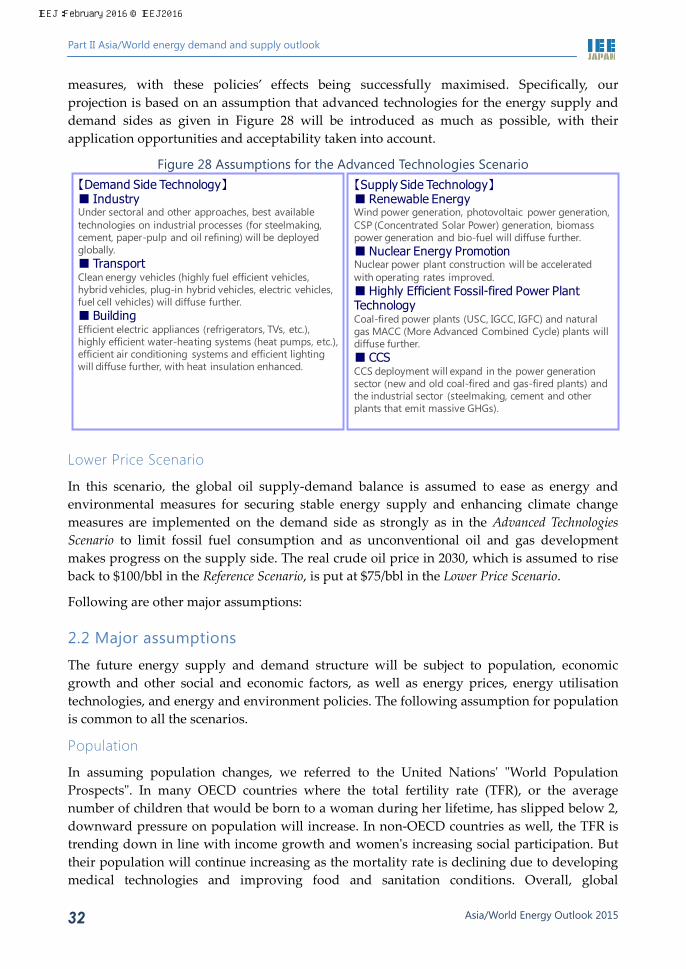
Part II Asia/World energy demand and supply outlook
Asia/World Energy Outlook 2015 32
measures, with these policies’ effects being successfully maximised. Specifically, our projection is based on an assumption that advanced technologies for the energy supply and demand sides as given in Figure 28 will be introduced as much as possible, with their application opportunities and acceptability taken into account.
Figure 28 Assumptions for the Advanced Technologies Scenario
Lower Price Scenario
In this scenario, the global oil supply-demand balance is assumed to ease as energy and environmental measures for securing stable energy supply and enhancing climate change measures are implemented on the demand side as strongly as in the Advanced Technologies Scenario to limit fossil fuel consumption and as unconventional oil and gas development makes progress on the supply side. The real crude oil price in 2030, which is assumed to rise back to $100/bbl in the Reference Scenario, is put at $75/bbl in the Lower Price Scenario.
Following are other major assumptions:
2.2 Major assumptions
The future energy supply and demand structure will be subject to population, economic growth and other social and economic factors, as well as energy prices, energy utilisation technologies, and energy and environment policies. The following assumption for population is common to all the scenarios.
Population
In assuming population changes, we referred to the United Nations' "World Population Prospects". In many OECD countries where the total fertility rate (TFR), or the average number of children that would be born to a woman during her lifetime, has slipped below 2, downward pressure on population will increase. In non-OECD countries as well, the TFR is trending down in line with income growth and women's increasing social participation. But their population will continue increasing as the mortality rate is declining due to developing medical technologies and improving food and sanitation conditions. Overall, global
【Demand Side Technology】■ IndustryUnder sectoral and other approaches, best available technologies on industrial processes (for steelmaking, cement, paper-pulp and oil refining) will be deployed globally.■ TransportClean energy vehicles (highly fuel efficient vehicles, hybrid vehicles, plug-in hybrid vehicles, electric vehicles, fuel cell vehicles) will diffuse further.■ BuildingEfficient electric appliances (refrigerators, TVs, etc.), highly efficient water-heating systems (heat pumps, etc.), efficient air conditioning systems and efficient lighting will diffuse further, with heat insulation enhanced.
【Supply Side Technology】■ Renewable EnergyWind power generation, photovoltaic power generation, CSP (Concentrated Solar Power) generation, biomass power generation and bio-fuel will diffuse further.■ Nuclear Energy Promotion Nuclear power plant construction will be accelerated with operating rates improved.■ Highly Efficient Fossil-fired Power Plant TechnologyCoal-fired power plants (USC, IGCC, IGFC) and natural gas MACC (More Advanced Combined Cycle) plants will diffuse further.■ CCSCCS deployment will expand in the power generation sector (new and old coal-fired and gas-fired plants) and the industrial sector (steelmaking, cement and other plants that emit massive GHGs).
IEEJ:February 2016 © IEEJ2016

2. Major assumptions
Asia/World Energy Outlook 2015 33
population will increase at an annual rate of 0.9%, expanding to 9 billion in 2040 from 5.3 billion in 1990 and 7.1 billion in 2013 (Figure 29, Appendix Table 3).
Figure 29 Population
Among OECD countries, North America, particularly the United States, will post a relatively steady population increase due to a massive population influx from abroad and a high TFR. But the increase will be moderate, with the United States' share of global population falling slightly. In Europe, population will decrease for Germany and Italy while increasing moderately for France and the United Kingdom. The total population of the European Union will increase very moderately. Among Asian countries, Japan has seen a population decline since 2011 and will post the fastest population fall in the world in the future. In 2015, the elderly population grew to more than double the young population, indicating a further fall in the birth rate and further population aging in the future. In Korea, population will peak out in the middle of the 2030s.
Most non-OECD countries will see population continuing to increase. Non-OECD countries will account for most of a global population increase through 2040. Africa is expected to post a rapid annual population increase of 2.3%, still slower than the past population explosion, as many countries in the region see continued high birth rates. The Middle Eastern population will expand about 1.5-fold in the next 25 years due to governments’ financial incentives for increasing population and a growing population influx from other regions. In Asia, India will maintain a high population growth rate, with its population surpassing Chinese population in the middle of the 2020s. In 2040, India will have the world’s largest population at 1.59 billion. Population in the Association of Southeast Asian Nations (ASEAN) has far exceeded European population and will increase at a pace only second to India’s. Meanwhile, China’s population, now the largest in the world, will peak at 1.41 billion around 2030 and decrease by more than 20 million toward 2040. China is the only country with more than 100 million elderly people aged 65 or more and will see further population aging. As the young population concentrates in urban regions, rural population aging will grow more
0 500 1,000 1,500 2,000
Taiwan
S. Korea
Japan
ASEAN
China
India
Middle East
N. America
EU
L. America
Africa
Asi
a
0 2,000 4,000 6,000 8,000
Asia
OECD
Non-OECD
million
2040
2013
1990
IEEJ:February 2016 © IEEJ2016
Part II Asia/World energy demand and supply outlook
Asia/World Energy Outlook 2015 34
serious. In Europe, Russia, plagued with a population fall since the collapse of the Soviet Union, will see a continuous downward trend. Population in Eastern European countries will decline faster than in Russia.
Asia as a whole will see a continuous population increase. But its share of global population will slowly decline. The share in 2040 will be half down from 55% in 2013.
Economy
Annual global economic growth over the next 27 years in the Reference and Advanced Technologies Scenarios is assumed at 2.9%.
At present, the future course of the world economy is growing uncertain. In the United States, the largest economy in the world, a domestic demand expansion through robust private consumption stimulated by low crude oil prices and the falling unemployment rate is supporting an economic recovery. But an external demand slump under the dollar’s appreciation is dragging down economic growth. In the European economy, second to the U.S. economy, private consumption has been recovering thanks to low oil prices, the euro’s depreciation and low interest rates. But slack non-residential investment and destabilizing factors such as the Greek debt problem are exerting downward pressure on economic growth. The Chinese economy, the third largest after the United States and Europe, has decelerated its annual growth to around 7% due to decelerated exports to Japan, Europe and ASEAN under its declining export competitiveness through rising labour costs, slack real estate investment and weak private consumption accompanying the termination of measures for spreading energy-saving home electrical appliances. In the middle of 2015, financial market turmoil emerged in China and spilled over to the rest of the world. Asian emerging economies, which had maintained their growth through exports to China, look less strong than in the past. The decelerating Chinese demand is dragging down economic growth in Singapore, Malaysia and Thailand where exports to China account for large shares of total exports. Oil producing and resource-rich economies like Russia, the Middle East and Latin America have deteriorated due to weak oil prices over a short term.
However, many economies are likely to rebound through appropriate fiscal and monetary policies and concerted international actions over a medium to long term. In the future, India will increase its presence as a new driver of global economic growth. Over the 27-year outlook period, the Indian economy will grow at the world’s fastest annual pace of 6.5%. Over a medium to long term, structural reform and export growth through a global economic recovery will support India’s economic growth. Given that India’s exports to China account for only 8% of its total exports and 2% of its gross domestic product, India will remain unaffected by the current economic growth deceleration in China. China, even with the current economic growth slowdown, is expected to maintain an annual economic growth rate of 5.2%. The ASEAN economy will grow at an annual rate of 4.4%.
In this way, Asia is expected to remain the centre of global economic growth after achieving strong growth. But rising wages and citizens’ growing consciousness of rights will force Asia to switch away from export-oriented economic growth that takes advantage of abundant surplus labour and low costs. While the current economic growth deceleration does not necessarily indicate any limit on their future growth, the current environment has changed
IEEJ:February 2016 © IEEJ2016
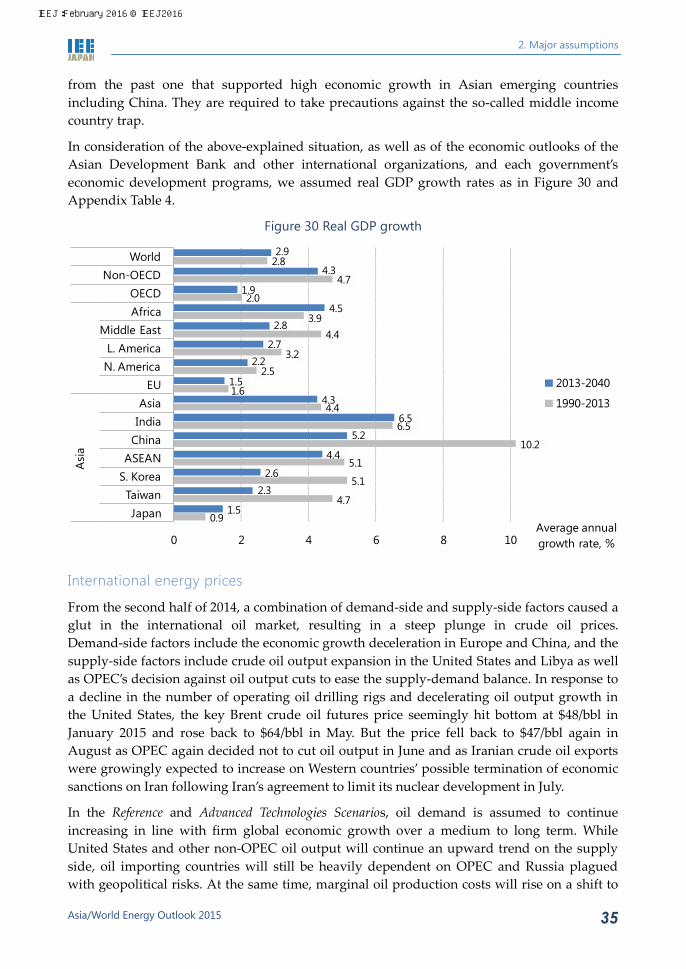
2. Major assumptions
Asia/World Energy Outlook 2015 35
from the past one that supported high economic growth in Asian emerging countries including China. They are required to take precautions against the so-called middle income country trap.
In consideration of the above-explained situation, as well as of the economic outlooks of the Asian Development Bank and other international organizations, and each government’s economic development programs, we assumed real GDP growth rates as in Figure 30 and Appendix Table 4.
Figure 30 Real GDP growth
International energy prices
From the second half of 2014, a combination of demand-side and supply-side factors caused a glut in the international oil market, resulting in a steep plunge in crude oil prices. Demand-side factors include the economic growth deceleration in Europe and China, and the supply-side factors include crude oil output expansion in the United States and Libya as well as OPEC’s decision against oil output cuts to ease the supply-demand balance. In response to a decline in the number of operating oil drilling rigs and decelerating oil output growth in the United States, the key Brent crude oil futures price seemingly hit bottom at $48/bbl in January 2015 and rose back to $64/bbl in May. But the price fell back to $47/bbl again in August as OPEC again decided not to cut oil output in June and as Iranian crude oil exports were growingly expected to increase on Western countries’ possible termination of economic sanctions on Iran following Iran’s agreement to limit its nuclear development in July.
In the Reference and Advanced Technologies Scenarios, oil demand is assumed to continue increasing in line with firm global economic growth over a medium to long term. While United States and other non-OPEC oil output will continue an upward trend on the supply side, oil importing countries will still be heavily dependent on OPEC and Russia plagued with geopolitical risks. At the same time, marginal oil production costs will rise on a shift to
0.9
4.7
5.1
5.1
10.2
6.5
4.41.6
2.53.2
4.43.9
2.0
4.7
2.8
1.5
2.32.6
4.4
5.26.5
4.3
1.5
2.22.7
2.84.5
1.9
4.3
2.9
0 2 4 6 8 10
JapanTaiwan
S. KoreaASEAN
ChinaIndiaAsia
EUN. AmericaL. America
Middle EastAfricaOECD
Non-OECDWorld
Asi
a
Average annualgrowth rate, %
2013-2040
1990-2013
IEEJ:February 2016 © IEEJ2016
Part II Asia/World energy demand and supply outlook
Asia/World Energy Outlook 2015 36
small and medium-sized, polar and ultra-deep-sea oil fields where production costs are relatively higher. Any tough restrictions on excessive money inflow into the futures market are unlikely to be introduced, indicating speculative investment money could push up oil prices. Given these factors, crude oil prices are expected to fluctuate wildly over a short term and gradually rise over a medium to long term. The real crude oil price (in 2014 prices) is assumed to increase to $75/bbl in 2020 and $125/bbl in 2040 (Table 4). Under an annual inflation rate of 2%, the nominal price is projected to reach $84/bbl in 2020 and $209/bbl in 2040.
In the Lower Price Scenario, major U.S. oil fields will grow more competitive to produce profit even at low oil prices with OPEC countries increasing output on the supply side. On the demand side, most countries in the world will strongly tackle climate change measures to restrict fossil fuel consumption. In the Lower Price Scenario, the real crude oil price is assumed to stand at $70/bbl in 2020 and $75/bbl in 2030.
Natural gas prices in the Reference Scenario will rise from current record-low levels in line with development and production cost hikes, although they will remain low in the United States. In Japan, however, incoming unconventional natural gas imports from the United States will contribute to eliminating or easing the problem of the so-called Asian premium on LNG prices. In contrast to rising natural gas prices in the United States and Europe, the LNG price in Japan will fall from $16.3/MBtu in 2014 to $14.1/MBtu toward 2040. But the price in Japan will still be higher than in Western countries due to certain limits on liquefaction and maritime transportation cost cuts. In the Lower Price Scenario, natural gas prices will decline in line with weak crude oil prices toward 2020 in Western countries as well and rise gradually later.
Coal prices are low at present, reflecting the loose supply-demand balance. In the Reference Scenario, coal prices are assumed to rise faster than crude oil and natural gas prices due to growing global demand for coal for power generation and a rebound from the current low levels, despite less resource constraints for coal. But prices per thermal unit for coal will still be lower than those for crude oil or natural gas. In the Lower Price Scenario, coal price hikes will be limited to moderate levels in response to a loose supply-demand balance in the international energy market.
IEEJ:February 2016 © IEEJ2016
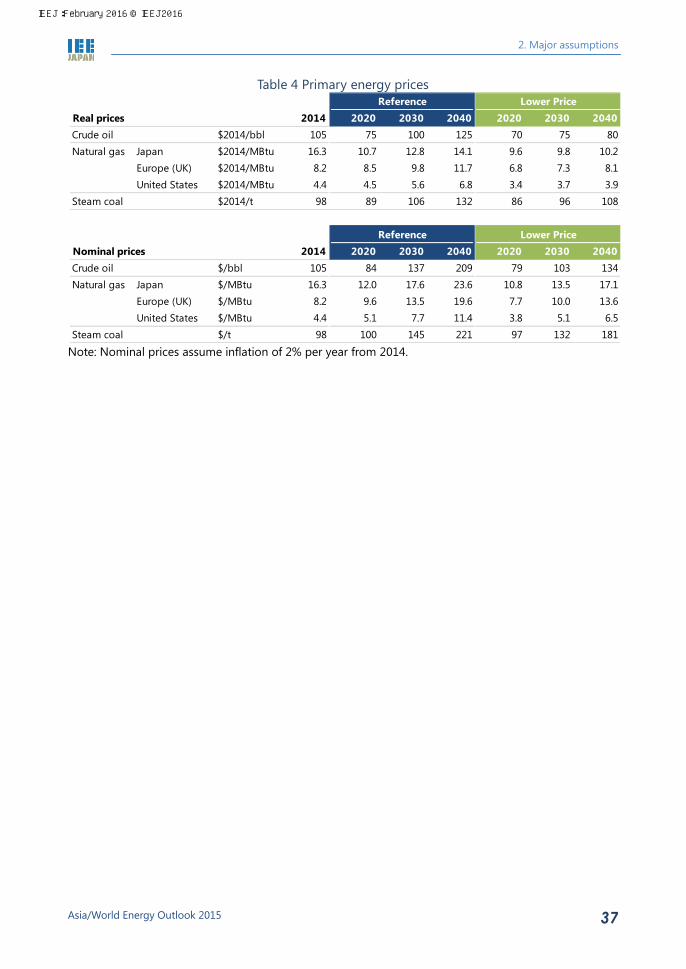
2. Major assumptions
Asia/World Energy Outlook 2015 37
Table 4 Primary energy prices
Note: Nominal prices assume inflation of 2% per year from 2014.
Reference Lower PriceReal prices 2014 2020 2030 2040 2020 2030 2040Crude oil $2014/bbl 105 75 100 125 70 75 80Natural gas Japan $2014/MBtu 16.3 10.7 12.8 14.1 9.6 9.8 10.2
Europe (UK) $2014/MBtu 8.2 8.5 9.8 11.7 6.8 7.3 8.1United States $2014/MBtu 4.4 4.5 5.6 6.8 3.4 3.7 3.9
Steam coal $2014/t 98 89 106 132 86 96 108
Reference Lower PriceNominal prices 2014 2020 2030 2040 2020 2030 2040Crude oil $/bbl 105 84 137 209 79 103 134Natural gas Japan $/MBtu 16.3 12.0 17.6 23.6 10.8 13.5 17.1
Europe (UK) $/MBtu 8.2 9.6 13.5 19.6 7.7 10.0 13.6United States $/MBtu 4.4 5.1 7.7 11.4 3.8 5.1 6.5
Steam coal $/t 98 100 145 221 97 132 181
IEEJ:February 2016 © IEEJ2016

Part II Asia/World energy demand and supply outlook
Asia/World Energy Outlook 2015 38
3. Energy demand
3.1 Primary energy consumption
World
The growth in world primary energy consumption is decelerating in response to a slowdown in the world economy. In the Reference Scenario where social, economic, policy and technology introduction trends involving energy supply and demand are assumed to continue, global primary energy consumption will increase by 5,408 million tonnes of oil equivalent (Mtoe) from 13,555 Mtoe in 2013 to 18,963 Mtoe in 2040. The increase will exceed the combined current consumption in the United States as the world’s largest energy consumer and China as the second largest. In the 27-year outlook period, the world economy will grow 2.2-fold with energy consumption increasing 1.4-fold, meaning that energy conservation will restrict energy consumption to a lower level than indicated by economic growth. This also indicates how difficult it would be to limit energy consumption while promoting economic growth with the presently anticipated national energy policies and energy-saving technologies taken into account.
At present, fossil fuels (oil, coal and natural gas) account for 81% of primary energy consumption. They will still capture more than 70% of future consumption growth and account for 78% of global primary energy consumption in 2040. The world will thus remain heavily dependent on fossil fuels (Figure 31).
Figure 31 Global primary energy consumption by source [Reference Scenario]
Consumption Share
Oil’s share of primary energy consumption will shrink from 31% in 2013 to 29% in 2040 due to a switch from oil to natural gas and other fuels and progress in energy conservation in the transport sector. But it will remain the most consumed energy source. Global oil consumption
0
1,000
2,000
3,000
4,000
5,000
6,000
1990 2000 2010 2020 2030 2040
Mtoe
0
10
20
30
40
1990 2000 2010 2020 2030 2040
%
Oil
Natural gas
Coal
Other renewables
Nuclear
Hydro
IEEJ:February 2016 © IEEJ2016
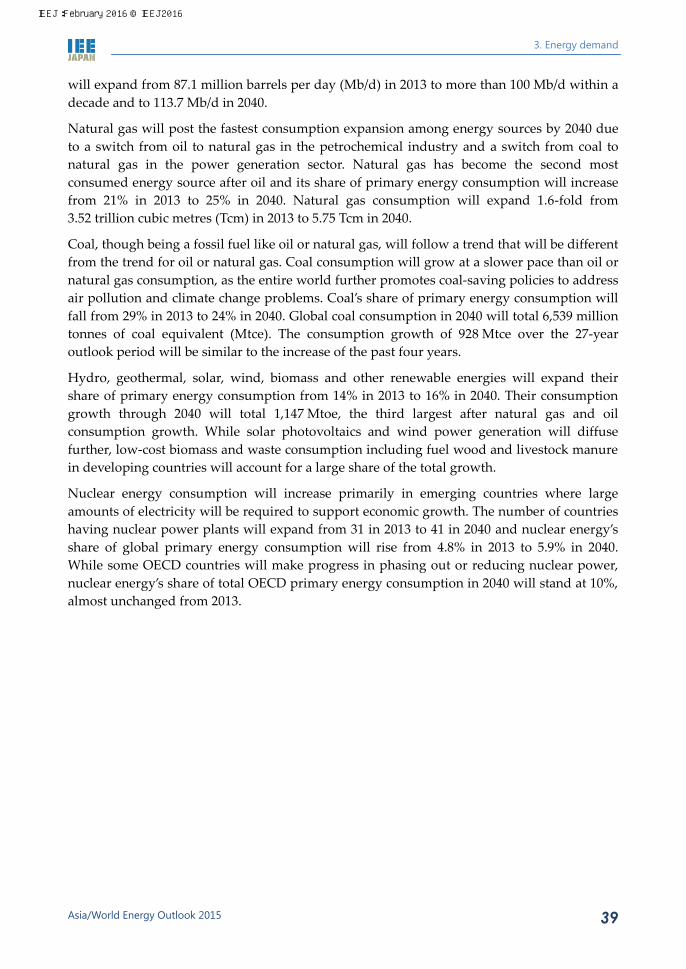
3. Energy demand
Asia/World Energy Outlook 2015 39
will expand from 87.1 million barrels per day (Mb/d) in 2013 to more than 100 Mb/d within a decade and to 113.7 Mb/d in 2040.
Natural gas will post the fastest consumption expansion among energy sources by 2040 due to a switch from oil to natural gas in the petrochemical industry and a switch from coal to natural gas in the power generation sector. Natural gas has become the second most consumed energy source after oil and its share of primary energy consumption will increase from 21% in 2013 to 25% in 2040. Natural gas consumption will expand 1.6-fold from 3.52 trillion cubic metres (Tcm) in 2013 to 5.75 Tcm in 2040.
Coal, though being a fossil fuel like oil or natural gas, will follow a trend that will be different from the trend for oil or natural gas. Coal consumption will grow at a slower pace than oil or natural gas consumption, as the entire world further promotes coal-saving policies to address air pollution and climate change problems. Coal’s share of primary energy consumption will fall from 29% in 2013 to 24% in 2040. Global coal consumption in 2040 will total 6,539 million tonnes of coal equivalent (Mtce). The consumption growth of 928 Mtce over the 27-year outlook period will be similar to the increase of the past four years.
Hydro, geothermal, solar, wind, biomass and other renewable energies will expand their share of primary energy consumption from 14% in 2013 to 16% in 2040. Their consumption growth through 2040 will total 1,147 Mtoe, the third largest after natural gas and oil consumption growth. While solar photovoltaics and wind power generation will diffuse further, low-cost biomass and waste consumption including fuel wood and livestock manure in developing countries will account for a large share of the total growth.
Nuclear energy consumption will increase primarily in emerging countries where large amounts of electricity will be required to support economic growth. The number of countries having nuclear power plants will expand from 31 in 2013 to 41 in 2040 and nuclear energy’s share of global primary energy consumption will rise from 4.8% in 2013 to 5.9% in 2040. While some OECD countries will make progress in phasing out or reducing nuclear power, nuclear energy’s share of total OECD primary energy consumption in 2040 will stand at 10%, almost unchanged from 2013.
IEEJ:February 2016 © IEEJ2016

Part II Asia/World energy demand and supply outlook
Asia/World Energy Outlook 2015 40
Figure 32 Primary energy consumption for selected countries/regions [Reference Scenario]
Consumption Share
Including India and ASEAN countries where high economic growth is expected, Asia will greatly contribute to the global energy consumption growth (Figure 32). While China will continue to expand energy consumption, its share will remain unchanged from 2013. The United States and the European Union will reduce their respective shares of global energy consumption over the next 27 years.
Asia
Asian primary energy consumption will expand from 5,409 Mtoe in 2013 to 8,691 Mtoe in 2040 (Figure 33). The growth of 3,281 Mtoe, equivalent to China’s annual demand, accounts for 60% of the global increase. Asia’s share of global primary energy consumption will rise from 40% in 2013 to 46% in 2040.
Asian primary energy consumption will grow at an annual rate of 1.8% through 2040 in line with robust economic growth mainly in China, India and ASEAN. Consumption in these countries will account for 91% of total Asian energy consumption growth and their combined share of Asian energy consumption will widen from 81% at present to 85% in 2040. Meanwhile, energy consumption will level off in mature Asian economies such as Japan, Korea and Chinese Taipei.
Fossil fuels account for 84% of Asian primary energy consumption at present and will cover 76% of the increase during the next 27 years. Asia’s share of global fossil fuel consumption will rise from 41% in 2013 to 47% in 2040.
Asian oil consumption will expand from 25.9 Mb/d in 2013 to 42.5 Mb/d in 2040. The average annual growth will be 1.8%, 0.8 percentage points higher than the global growth. Oil’s share of Asian primary energy consumption will level off from 23% in 2013 to 24% in 2040. Chinese, Indian and ASEAN oil consumption will expand primarily in the transport sector, accounting for 81% of total Asian consumption in 2040 against 69% in 2013.
0
1,000
2,000
3,000
4,000
5,000
1990 2000 2010 2020 2030 2040
Mtoe
0
10
20
30
1990 2000 2010 2020 2030 2040
%
China
U.S.
India
EU
Middle East/North Africa
ASEAN
IEEJ:February 2016 © IEEJ2016

3. Energy demand
Asia/World Energy Outlook 2015 41
Figure 33 Asian primary energy consumption [Reference Scenario]
Asian natural gas consumption will increase 2.7-fold from 0.65 Tcm in 2013 to 1.72 Tcm in 2040. The increase will be much faster than the global growth of 1.6-fold. Global LNG trade will expand from 239 Mt in 2014 to 547 Mt in 2040, of which Asian countries will account for 70%. China, India and ASEAN will boost natural gas consumption mainly in the power generation sector. Natural gas’s share of Asian primary energy consumption will expand from 9.8% in 2013 to 16% in 2040.
Although Asian coal consumption will rise from 3,925 Mtce in 2013 to 5,065 Mtce in 2040, surpassing global growth, its share of primary energy consumption will shrink from 51% in 2013 to 41% in 2040. While China’s coal consumption will decrease slightly from 2030, India and ASEAN will boost coal consumption primarily in the power generation sector, for a combined share of Asian coal consumption remaining at 90% through 2040.
Meanwhile, Asian renewable energy consumption will increase from 785 Mtoe in 2013 to 1,192 Mtoe in 2040. Asia, which has great potential to expand renewable energy consumption, will raise its share of global renewable energy consumption including hydro, geothermal, solar, wind and other energy, excluding biomass and waste, from 38% in 2013 to 45% in 2040. China will capture more than half of the Asian renewable energy consumption.
Asian nuclear power generation will increase from 340 TWh in 2013 to 1,833 TWh in 2040. Nuclear energy’s share of primary energy consumption will rise from 1.6% in 2013 to 5.5% in 2040. Asia will account for 81% of global nuclear energy generation, including China and India where nuclear power generation will expand in line with sharp growth in electricity demand. Asia’s share of global nuclear energy consumption will increase from 14% in 2013 to 42% in 2040, indicating Asia’s growing presence in the global nuclear energy market.
Oil
Global oil consumption will rise at an annual rate of 1.0% from 87.1 Mb/d in 2013 to 113.7 Mb/d in 2040 (Figure 34). The growth of 26.6 Mb/d exceeds Middle Eastern and North
2,110
2,920
5,409
6,411
7,567
8,691
0
2,000
4,000
6,000
8,000
1990 2000 2013 2020 2030 2040
Mtoe
Other renewablesBiomass, etc.Hydro
Nuclear
Natural gas
Oil
Coal
IEEJ:February 2016 © IEEJ2016

Part II Asia/World energy demand and supply outlook
Asia/World Energy Outlook 2015 42
African OPEC countries’ present crude oil output of 25.2 Mb/d. The transport sector including vehicles will account for 17.6 Mb/d or two-thirds of the growth. In 2040, the transport sector will account for 58% of oil consumption and petrochemical feedstocks for 15%.
Figure 34 Global oil consumption and oil’s share of total primary energy supply [Reference Scenario]
Non-OECD oil consumption exceeded OECD consumption in 2012 for the first time in history and continues to show strong growth. Over the next 27 years, non-OECD oil consumption will increase at an annual rate of 1.8% (Figure 35), while OECD oil consumption will decrease at an annual rate of 0.4%. OECD countries’ share of global oil consumption will decline from 45% in 2013 to 31% in 2040.
Figure 35 Oil consumption by region [Reference Scenario]
0%
5%
10%
15%
20%
25%
30%
35%
40%
0
20
40
60
80
100
120
140
160
1990 2000 2013 2020 2030 2040
Mb/d
Oil consump-tion
Share of TPES (right)
0
10
20
1990 2000 2013 2020 2030 2040
Mb/d
China
U.S.
Middle East/North Africa
India
EU
ASEAN
IEEJ:February 2016 © IEEJ2016
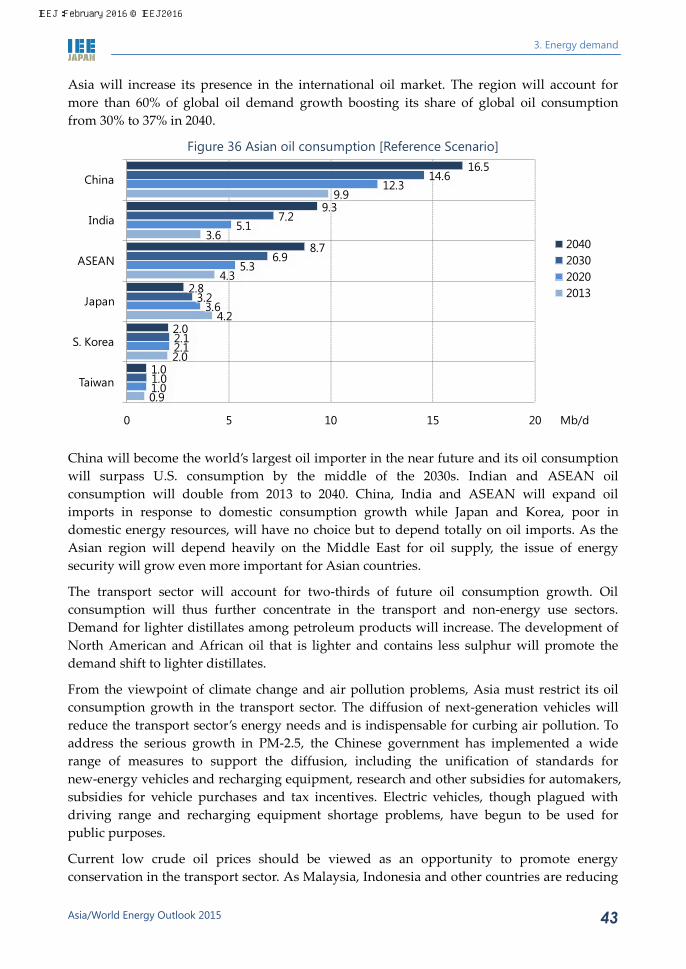
3. Energy demand
Asia/World Energy Outlook 2015 43
Asia will increase its presence in the international oil market. The region will account for more than 60% of global oil demand growth boosting its share of global oil consumption from 30% to 37% in 2040.
Figure 36 Asian oil consumption [Reference Scenario]
China will become the world’s largest oil importer in the near future and its oil consumption will surpass U.S. consumption by the middle of the 2030s. Indian and ASEAN oil consumption will double from 2013 to 2040. China, India and ASEAN will expand oil imports in response to domestic consumption growth while Japan and Korea, poor in domestic energy resources, will have no choice but to depend totally on oil imports. As the Asian region will depend heavily on the Middle East for oil supply, the issue of energy security will grow even more important for Asian countries.
The transport sector will account for two-thirds of future oil consumption growth. Oil consumption will thus further concentrate in the transport and non-energy use sectors. Demand for lighter distillates among petroleum products will increase. The development of North American and African oil that is lighter and contains less sulphur will promote the demand shift to lighter distillates.
From the viewpoint of climate change and air pollution problems, Asia must restrict its oil consumption growth in the transport sector. The diffusion of next-generation vehicles will reduce the transport sector’s energy needs and is indispensable for curbing air pollution. To address the serious growth in PM-2.5, the Chinese government has implemented a wide range of measures to support the diffusion, including the unification of standards for new-energy vehicles and recharging equipment, research and other subsidies for automakers, subsidies for vehicle purchases and tax incentives. Electric vehicles, though plagued with driving range and recharging equipment shortage problems, have begun to be used for public purposes.
Current low crude oil prices should be viewed as an opportunity to promote energy conservation in the transport sector. As Malaysia, Indonesia and other countries are reducing
0.9
2.0
4.2
4.3
3.6
9.9
1.0
2.1
3.6
5.3
5.1
12.3
1.0
2.1
3.2
6.9
7.2
14.6
1.0
2.0
2.8
8.7
9.3
16.5
0 5 10 15 20
Taiwan
S. Korea
Japan
ASEAN
India
China
Mb/d
2040203020202013
IEEJ:February 2016 © IEEJ2016

Part II Asia/World energy demand and supply outlook
Asia/World Energy Outlook 2015 44
or eliminating fuel subsidies, they should use the savings for investment in the improvement of fuel efficiency and for the diffusion of next-generation vehicles to help curb oil consumption in the transport sector.
The transport sector’s share of oil consumption in Asian countries will reach 50% in 2040 (Figure 37). The power generation sector’s share of total oil consumption is limited to only 3%.
Figure 37 Asian oil consumption by sector [Reference Scenario]
Natural gas
Global natural gas consumption will increase from 3,521 billion cubic metres (Bcm) in 2013 to 5,753 Bcm in 2040, scoring an annual average rise of 1.8%, the fastest growth among fossil fuels (Figure 38). Natural gas’s share of primary energy consumption will expand from 21% in 2013 to 25% in 2040.
Transport43%
Non-energy20%
Res & com14%
Industry11%
Power generation
6% Others6%
201325.9 Mb/d
Transport49%
Non-energy20%
Res & com12%
Industry11%
Power generation
5%
Others3%
2040年
42.5 Mb/d
IEEJ:February 2016 © IEEJ2016
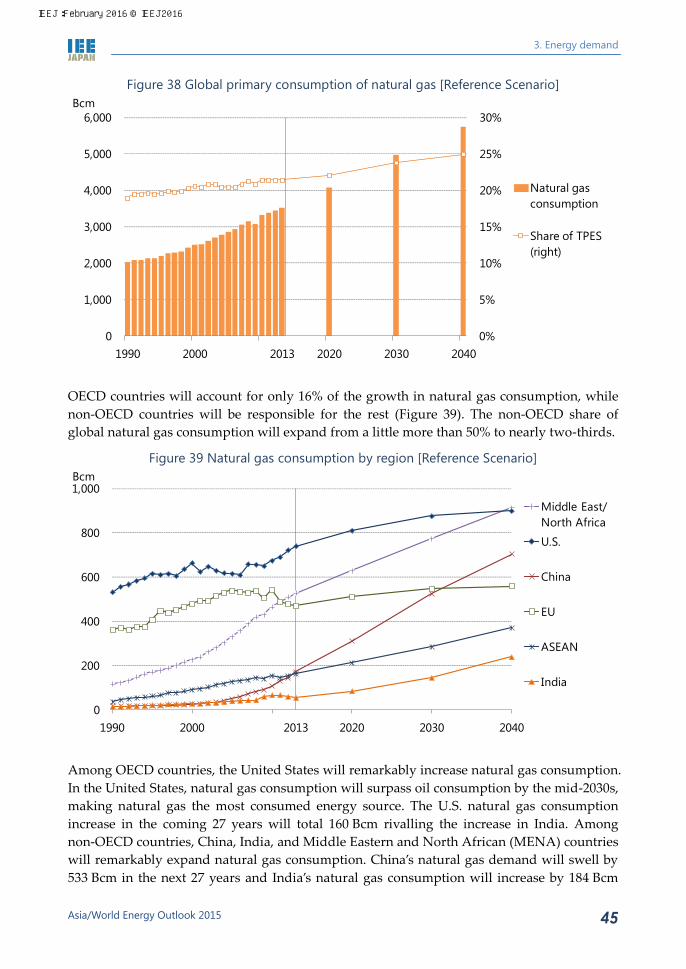
3. Energy demand
Asia/World Energy Outlook 2015 45
Figure 38 Global primary consumption of natural gas [Reference Scenario]
OECD countries will account for only 16% of the growth in natural gas consumption, while non-OECD countries will be responsible for the rest (Figure 39). The non-OECD share of global natural gas consumption will expand from a little more than 50% to nearly two-thirds.
Figure 39 Natural gas consumption by region [Reference Scenario]
Among OECD countries, the United States will remarkably increase natural gas consumption. In the United States, natural gas consumption will surpass oil consumption by the mid-2030s, making natural gas the most consumed energy source. The U.S. natural gas consumption increase in the coming 27 years will total 160 Bcm rivalling the increase in India. Among non-OECD countries, China, India, and Middle Eastern and North African (MENA) countries will remarkably expand natural gas consumption. China’s natural gas demand will swell by 533 Bcm in the next 27 years and India’s natural gas consumption will increase by 184 Bcm
0%
5%
10%
15%
20%
25%
30%
0
1,000
2,000
3,000
4,000
5,000
6,000
1990 2000 2013 2020 2030 2040
Bcm
Natural gas consumption
Share of TPES(right)
0
200
400
600
800
1,000
1990 2000 2013 2020 2030 2040
Bcm
Middle East/North Africa
U.S.
China
EU
ASEAN
India
IEEJ:February 2016 © IEEJ2016
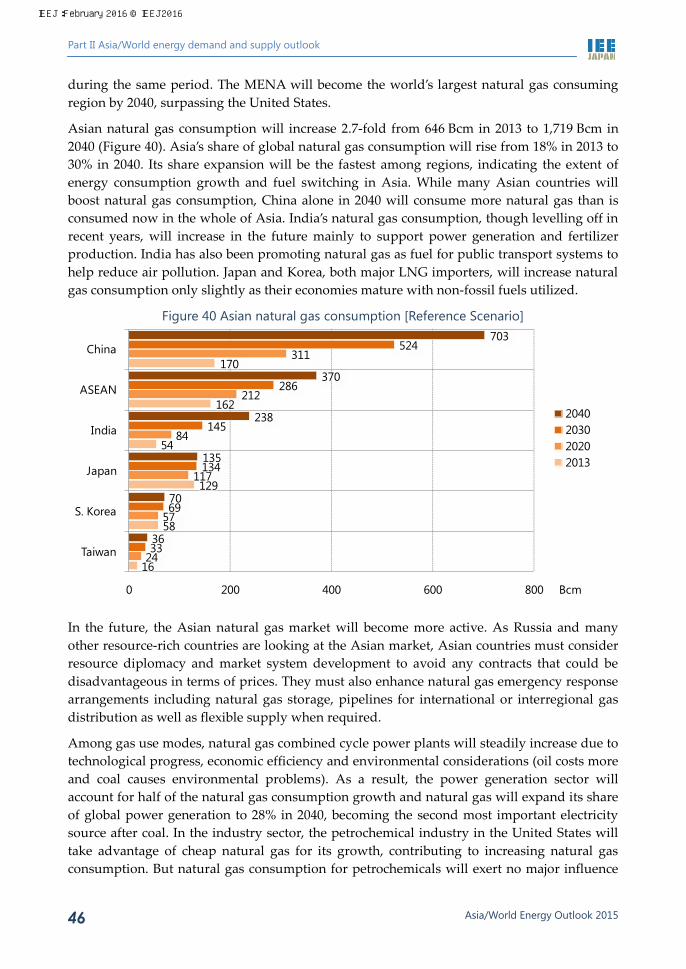
Part II Asia/World energy demand and supply outlook
Asia/World Energy Outlook 2015 46
during the same period. The MENA will become the world’s largest natural gas consuming region by 2040, surpassing the United States.
Asian natural gas consumption will increase 2.7-fold from 646 Bcm in 2013 to 1,719 Bcm in 2040 (Figure 40). Asia’s share of global natural gas consumption will rise from 18% in 2013 to 30% in 2040. Its share expansion will be the fastest among regions, indicating the extent of energy consumption growth and fuel switching in Asia. While many Asian countries will boost natural gas consumption, China alone in 2040 will consume more natural gas than is consumed now in the whole of Asia. India’s natural gas consumption, though levelling off in recent years, will increase in the future mainly to support power generation and fertilizer production. India has also been promoting natural gas as fuel for public transport systems to help reduce air pollution. Japan and Korea, both major LNG importers, will increase natural gas consumption only slightly as their economies mature with non-fossil fuels utilized.
Figure 40 Asian natural gas consumption [Reference Scenario]
In the future, the Asian natural gas market will become more active. As Russia and many other resource-rich countries are looking at the Asian market, Asian countries must consider resource diplomacy and market system development to avoid any contracts that could be disadvantageous in terms of prices. They must also enhance natural gas emergency response arrangements including natural gas storage, pipelines for international or interregional gas distribution as well as flexible supply when required.
Among gas use modes, natural gas combined cycle power plants will steadily increase due to technological progress, economic efficiency and environmental considerations (oil costs more and coal causes environmental problems). As a result, the power generation sector will account for half of the natural gas consumption growth and natural gas will expand its share of global power generation to 28% in 2040, becoming the second most important electricity source after coal. In the industry sector, the petrochemical industry in the United States will take advantage of cheap natural gas for its growth, contributing to increasing natural gas consumption. But natural gas consumption for petrochemicals will exert no major influence
16
58
129
54
162
170
24
57
117
84
212
311
33
69
134
145
286
524
36
70
135
238
370
703
0 200 400 600 800
Taiwan
S. Korea
Japan
India
ASEAN
China
Bcm
2040203020202013
IEEJ:February 2016 © IEEJ2016

3. Energy demand
Asia/World Energy Outlook 2015 47
on the whole of natural gas consumption. The building sector will also increase natural gas consumption as emerging countries promote urbanization in line with economic growth.
Figure 41 Global natural gas consumption by sector [Reference Scenario]
Coal
Global coal consumption will increase at an annual rate of 0.6% from 5,611 Mtce in 2013 to 6,539 Mtce in 2040 (Figure 42). Most of the increase will be for power generation.
Figure 42 Global coal consumption [Reference Scenario]
In OECD countries including the United States and European nations, increasing taxes on coal power plants and enhanced regulations on CO2 and mercury emissions will force coal power plants to shut down. Non-OECD countries will account for all of the coal consumption
0
500
1,000
1,500
2,000
2,500
1990 2000 2013 2020 2030 2040
Bcm
Power generation
Others
Res & com
Industry
Transport
0%
5%
10%
15%
20%
25%
30%
35%
40%
0
1,000
2,000
3,000
4,000
5,000
6,000
7,000
8,000
1990 2000 2013 2020 2030 2040
Mtce
Coal consump-tion
Share of TPES (right)
IEEJ:February 2016 © IEEJ2016

Part II Asia/World energy demand and supply outlook
Asia/World Energy Outlook 2015 48
growth in the next 27 years, with Asia accounting for 94% of the growth. India will replace the United States as the world’s second largest coal consumer after China by 2020 (Figure 43).
Figure 43 Coal consumption by region [Reference Scenario]
Many areas in the world are endowed with coal resources so that coal has less supply risk than oil or natural gas, which are found in a limited range of regions. Due to lower prices for coal, consumption will increase mainly in the power generation sector where fuel costs are significant for economic efficiency (Figure 44). Coal consumption for power generation will increase at an annual rate of 1.3% through 2040, posting a total rise of 1.4-fold from the present level.
Figure 44 Global coal consumption by sector
0
500
1,000
1,500
2,000
2,500
3,000
3,500
1990 2000 2013 2020 2030 2040
Mtce
China
India
ASEAN8
U.S.
EU
0
1,000
2,000
3,000
4,000
5,000
1990 2000 2013 2020 2030 2040
Mtce
Power generation
Others
Industry
IEEJ:February 2016 © IEEJ2016

3. Energy demand
Asia/World Energy Outlook 2015 49
In the future, more thoughts must be directed towards environmental considerations and air pollution when coal power plants are built or expanded. Some progress has been observed in this respect as China is considering shutting down inefficient small coal power plants. India has limited the ash content to 34% or less for coal for transportation beyond 1,000 kilometres to help reduce coal consumption for transportation and pulverisation at plants.
3.2 Final energy consumption
World
Final energy consumption in the world has grown at a slower pace than the world economy. Between 1990 and 2013, the annual growth in final energy consumption came to 1.7% against the annual real GDP growth rate of 2.8%. In OECD countries where energy conservation has made progress, annual final energy consumption growth was limited to 0.7% against the annual real GDP growth rate of 2.0%. In non-OECD countries, final energy consumption growth was also slower than economic growth, but was much faster than in OECD countries at 2.4% due to the high economic growth of 4.7%, growth in energy-intensive industries and increasing population. Final energy consumption will remain bipolarized between OECD and non-OECD countries. OECD final energy consumption will rise from 3,631 Mtoe in 2013 to 3,819 Mtoe in 2040 with an annual growth limited to 0.2%, while non-OECD consumption will increase at an annual rate of 1.9% from 5,188 Mtoe in 2013 to 8,564 Mtoe in 2040 (Figure 45).
Figure 45 GDP and Final energy consumption
[1990-2013, Reference Scenario: 2020, 2030 and 2040]
By region
Out of 3,818 Mtoe in global final energy consumption growth through 2040, Asia will account for 2,105 Mtoe or 55% (Figure 46). In Asia where high economic growth will continue, final energy consumption will increase at an annual rate of 1.8% from 3,476 Mtoe in 2013 to
0
2,000
4,000
6,000
8,000
10,000
0 20 40 60 80 100
Fina
l ene
rgy
cons
umpt
ion
(Mto
e)
Real GDP (2010 USD trillion)
Non-OECD
OECD
IEEJ:February 2016 © IEEJ2016

Part II Asia/World energy demand and supply outlook
Asia/World Energy Outlook 2015 50
5,581 Mtoe in 2040 due to the development of steel, chemical and other energy-consuming industries, progress in urbanization and improvements in living standards. In the United States and European Union where society has matured, final energy consumption will level off from 1,495 Mtoe in 2013 to 1,506 Mtoe in 2040 and from 1,139 Mtoe to 1,179 Mtoe, respectively. In the Middle East and North Africa, final energy consumption will grow from 587 Mtoe in 2013 to 1,032 Mtoe in 2040 with an annual growth rate exceeding the Chinese rate, at 2.1%. The MENA’s final energy consumption growth will account for some 10% of global growth.
Of Asian countries, China and India alone will account for some 40% of global final energy consumption growth through 2040. Final energy consumption will increase at an annual rate of 1.3% or by 790 Mtoe from 2013 to 2040 in China and at an annual rate of 3.0% or by 641 Mtoe in India.
Figure 46 Final energy consumption by region [Reference Scenario]
By sector
The buildings (residential and commercial) sector will account for 1,354 Mtoe or about one-third of the final energy consumption growth of 3,818 Mtoe between 2013 and 2040 (Figure 47), followed by the industry sector with an increase of 1,054 Mtoe, the transport sector at 1,037 Mtoe and the non-energy use sector at 373 Mtoe. The annual growth rate will be 1.3% for each of those sectors. From 2013 to 2040, final energy consumption will level off in OECD countries while increasing rapidly mainly in the buildings and transport sectors in non-OECD countries.
6,2817,085
9,17310,309
11,735
12,991
0
2,000
4,000
6,000
8,000
10,000
12,000
14,000
1990 2000 2013 2020 2030 2040
Mtoe
Other Asia
China
Middle East/North Africa
Others
EU
U.S.
IEEJ:February 2016 © IEEJ2016

3. Energy demand
Asia/World Energy Outlook 2015 51
Figure 47 Final energy consumption by sector [Reference Scenario]
OECD Non-OECD
In the buildings sector, non-OECD Asian countries will post an annual final energy consumption growth rate of 2.0%, higher than in any other countries or regions. As China, India and ASEAN are improving their living standards, electrical home appliances are penetrating in line with income growth. China will record a remarkable consumption increase of 334 Mtoe, exceeding Japan’s annual final energy consumption.
In the industry sector, energy consumption will increase as many non-OECD countries shift from agriculture and other primary industries to steel, chemical and other energy intensive industries that consume in line with economic growth. Those countries’ domestic infrastructure development and proactive call for foreign investments will further promote their industrialization. The industry sector’s energy consumption will rise from 2,623 Mtoe in 2013 to 3,678 Mtoe in 2040 with Asia accounting for 60% of the 1,054 Mtoe increase.
The transport sector will increase its global energy consumption at an annual rate of 1.3% as progress in motorisation in non-OECD countries drives the consumption growth. The global vehicle fleet will expand from 1,195 million vehicles in 2013 to 2,142 million vehicles in 2040. Non-OECD Asian countries will account for 57% of the global vehicle fleet expansion. The transport sector’s energy consumption will decline in OECD countries at an annual rate of 0.2% due to vehicle fuel efficiency improvements, while increasing at an annual rate of 2.3% in non-OECD countries as the effects of the vehicle fleet expansion outdo fuel efficiency improvements.
By energy source
A breakdown of final energy consumption by energy source shows that oil will score the largest consumption growth among energy sources, accounting for 34% of the final energy consumption growth. Natural gas consumption will increase substantially in China’s buildings sector and the Latin American and the Middle Eastern industry sector. Electricity
0
1,000
2,000
1990 2000 2013 2020 2030 2040
Mtoe
Res & com TransportIndustry Non-energy
0
1,000
2,000
3,000
4,000
1990 2000 2013 2020 2030 2040
Mtoe
Res & com IndustryTransport Non-energy
IEEJ:February 2016 © IEEJ2016

Part II Asia/World energy demand and supply outlook
Asia/World Energy Outlook 2015 52
will post the highest growth rate among major energy sources both in OECD and non-OECD countries (Figure 48). Between 2013 and 2040, consumption will increase at an annual rate of 1.1% for oil, at 2.0% for electricity and at 1.6% for natural gas. Meanwhile, the annual growth rate for coal will be limited to 0.2%. The order of energy sources’ shares of total energy consumption will remain unchanged in the outlook period. The share will fall slightly from 40% to 38% for oil and rise from 18% to 22% for electricity and from 15% to 17% for natural gas. Coal’s share will shrink from 10% to 8%.
A major driver of oil consumption growth will be the transport sector in China, India and the Middle East. As gasoline and diesel oil consumption in the transport sector increases, oil consumption will shift to lighter petroleum products.
The major drivers of growth for natural gas consumption will be China’s residential sector, Latin America’s industry sector and the Middle East’s non-energy use sector. The Chinese residential sector still uses coal and biomass fuels including firewood and will shift to city gas in consideration of health and sanitation problems. In Latin America, Brazilian and Mexican energy intensive industries such as steel, chemicals and cement will switch fuels from coal and oil to natural gas. Middle Eastern countries will promote domestic natural gas utilization while giving priority to oil exports to earn foreign currencies. They will also promote petrochemical plants using natural gas, for job creation purposes.
Figure 48 Global final energy consumption by source [Reference Scenario]
Generally, people’ use of electricity is in line with income growth and this trend will remain unchanged. Electricity will score the highest consumption growth rate among major energy sources both in OECD and non-OECD countries. Driving electricity consumption growth will be Asia including China and India, as well as emerging countries like Russia and Brazil (Figure 49). The electricity infrastructure development in rural and urban areas and the penetration of electrical home appliances like air conditioners and televisions under growing income will induce electricity consumption growth.
0
1,000
2,000
3,000
4,000
5,000
6,000
1990 2000 2013 2020 2030 2040
Mtoe
OilElectricityNatural gasRenewablesCoal
IEEJ:February 2016 © IEEJ2016

3. Energy demand
Asia/World Energy Outlook 2015 53
Figure 49 Electricity consumption [Reference Scenario]
At the moment, OECD countries capture 48% of final electricity consumption. From 2013 to 2040, however, China (the world’s largest electricity consumer) will further expand its consumption by 3,823 TWh, an amount which exceeds the present consumption of the second largest electricity consumer, the United States. India’s electricity consumption will rise at an annual rate of 5.0%, reaching 3,283 TWh. Non-OECD countries will thus expand electricity consumption rapidly and substantially. About 80% of global electricity consumption growth in the outlook period will be generated in non-OECD countries. In several years from now, the non-OECD share of global electricity consumption will overwhelm the OECD share.
6,473
2,332
2,336
2,822
3,283
3,443
4,609
8,315
3,872
713
1,087
1,886
890
2,771
3,782
4,492
0 2,000 4,000 6,000 8,000
Others
ASEAN
Middle East/North Africa
Other Asia
India
EU
U.S.
China
TWh
2013
2013-2040 increase (Res & com)
2013-2040 increase (Others)
IEEJ:February 2016 © IEEJ2016

Part II Asia/World energy demand and supply outlook
Asia/World Energy Outlook 2015 54
4. Energy supply
4.1 Crude oil
Supply
Table 5 shows a crude oil supply outlook in the Reference Scenario. In response to global oil demand growth, both OPEC and non-OPEC oil producing countries will expand crude oil supply. Their respective shares of global crude oil supply will remain almost unchanged between 2013 and 2020, standing at 40% for OPEC and 60% for non-OPEC oil producers. From 2030 to 2040, however, OPEC will gradually expand its share.
Through 2020, Iraq among the OPEC members will increase crude oil production. If Western countries lift economic sanctions on Iran in late 2015, Iran will also expand production. Among non-OPEC oil producers, North America will maintain a great presence with the expansion of shale and other oil production, which has slightly slackened on the crude oil price plunge since 2014. From 2020 through 2040, non-OPEC oil supply will continue increasing but at a much slower pace than OPEC. OPEC with abundant oil resources available for low-cost development will gradually grow dominant and the non-OPEC share of global oil supply will thus fall to 58% in 2030 and to 56% in 2040.
Table 5 Crude oil production [Reference Scenario]
Trade
Figure 50 and Figure 51 indicate crude oil trade flows as of 2014 and 2030, respectively9. Global crude oil trade will increase by nearly 6 Mb/d from 38.8 Mb/d in 2014 to 44.6 Mb/d in
9 We used a global trade model based on linear programming for analysing crude oil trade flows. We
(Mb/d)2013 2020 2030 2040 2013-2040
Total 88.77 95.42 106.00 114.20 +25.43OPEC 36.63 37.82 44.80 50.40 +13.78
Middle East 26.84 27.45 33.10 38.00 +11.16Others 9.79 10.37 11.70 12.40 +2.61
Non-OPEC 49.95 55.10 58.20 60.50 +10.56North America 14.05 16.70 16.90 16.80 +2.75Latin America 7.00 8.50 9.80 10.80 +3.80Europe and Eurasia 17.16 17.40 18.50 19.85 +2.70Middle East 1.36 1.45 1.55 1.60 +0.24Africa 2.11 2.90 3.00 3.10 +0.99Asia 8.28 8.15 8.45 8.35 +0.07
China 4.22 3.90 3.70 3.60 -0.62Indonesia 0.88 0.90 0.90 0.85 -0.03India 0.91 0.80 0.70 0.65 -0.26
Processing gains 2.20 2.50 3.00 3.30 +1.10
IEEJ:February 2016 © IEEJ2016

4. Energy supply
Asia/World Energy Outlook 2015 55
2030 in line with global oil consumption growth. OECD countries including Western nations and Japan will reduce crude oil imports due to a structural demand fall through the improvement of vehicle fuel efficiency and falling population, as well as increasing domestic oil production in North America. But growth in imports by non-OECD countries with increasing oil demand will more than offset the decline in imports by OECD countries.
Figure 50 Major crude oil trade flows [2014]
Note: Does not include petroleum products Source: BP (2015), DOE/EIA website, etc.
adopted energy production projections as well as product-by-product oil demand projections in each scenario as preconditions for the model calculations. We referred to the annual average crude oil prices and price gaps between crude oil brands in 2013 to make assumptions for 2030.The oil refining capacities in the future are assumed based on future growth in petroleum product demand (particularly middle distillate demand) in addition to published investment projects.
Japan/Korea/Taiwan
Non-OECD Europe/Central Asia
North America
MiddleEast
LatinAmerica
Africa
OECD Europe
China
ASEAN
Oceania
SouthAsia
2,245
4,125
2,056
1,968
375
667
808
1,360
3,212
288
121356
776
662
285
2,785 1,861
1,403
5,815
152
Unit:Thousand b/d
IEEJ:February 2016 © IEEJ2016
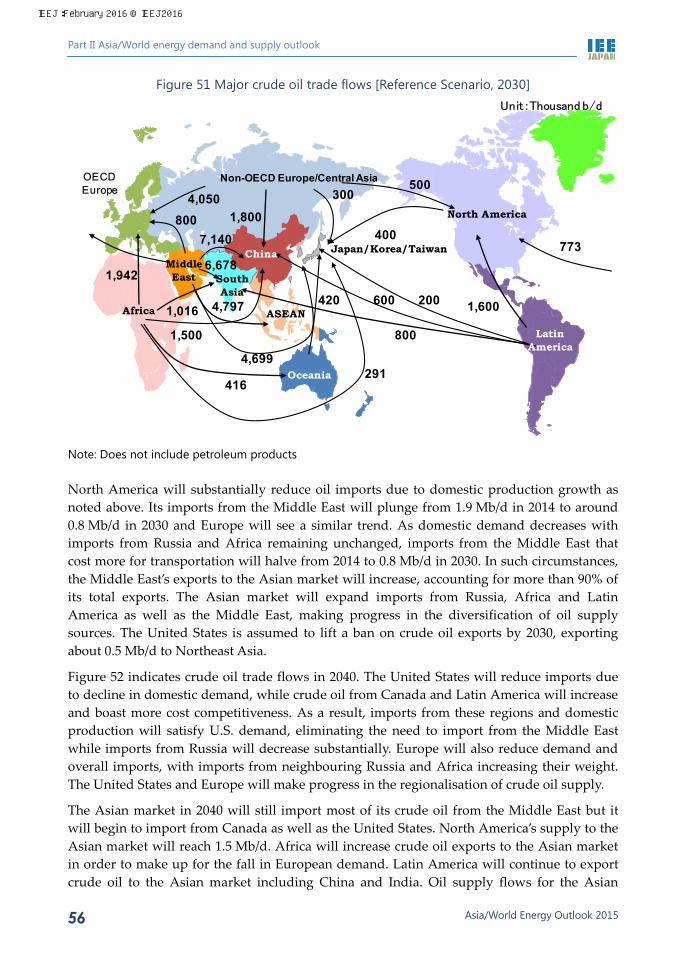
Part II Asia/World energy demand and supply outlook
Asia/World Energy Outlook 2015 56
Figure 51 Major crude oil trade flows [Reference Scenario, 2030]
Note: Does not include petroleum products North America will substantially reduce oil imports due to domestic production growth as noted above. Its imports from the Middle East will plunge from 1.9 Mb/d in 2014 to around 0.8 Mb/d in 2030 and Europe will see a similar trend. As domestic demand decreases with imports from Russia and Africa remaining unchanged, imports from the Middle East that cost more for transportation will halve from 2014 to 0.8 Mb/d in 2030. In such circumstances, the Middle East’s exports to the Asian market will increase, accounting for more than 90% of its total exports. The Asian market will expand imports from Russia, Africa and Latin America as well as the Middle East, making progress in the diversification of oil supply sources. The United States is assumed to lift a ban on crude oil exports by 2030, exporting about 0.5 Mb/d to Northeast Asia.
Figure 52 indicates crude oil trade flows in 2040. The United States will reduce imports due to decline in domestic demand, while crude oil from Canada and Latin America will increase and boast more cost competitiveness. As a result, imports from these regions and domestic production will satisfy U.S. demand, eliminating the need to import from the Middle East while imports from Russia will decrease substantially. Europe will also reduce demand and overall imports, with imports from neighbouring Russia and Africa increasing their weight. The United States and Europe will make progress in the regionalisation of crude oil supply.
The Asian market in 2040 will still import most of its crude oil from the Middle East but it will begin to import from Canada as well as the United States. North America’s supply to the Asian market will reach 1.5 Mb/d. Africa will increase crude oil exports to the Asian market in order to make up for the fall in European demand. Latin America will continue to export crude oil to the Asian market including China and India. Oil supply flows for the Asian
1,600
4,050
1,942
1,800
1,500
7,140
4,699
4,797
6,678
416
800
1,016
400
291
300500
773
800
600 200420
Unit:Thousand b/d
Japan/Korea/Taiwan
Non-OECD Europe/Central Asia
North America
MiddleEast
LatinAmerica
Africa
OECD Europe
China
ASEAN
Oceania
SouthAsia
IEEJ:February 2016 © IEEJ2016

4. Energy supply
Asia/World Energy Outlook 2015 57
market will thus be globalised or internationalised, unlike those for European and U.S. markets.
Figure 52 Major crude oil trade flows [Reference Scenario, 2040]
Note: Does not include petroleum products
4.2 Natural gas
Production
Through 2040, conventional and unconventional natural gas production in the world will increase to meet growing demand. Production in non-OECD Europe/Central Asia and the Middle East, both traditional producers of conventional natural gas, will expand production by 361 Bcm and 416 Bcm from 2013 to 1,272 Bcm and 979 Bcm, respectively, in 2040. North America will increase natural gas production in 2040 to 1,191 Bcm, becoming the world’s second largest producer after non-OECD Europe/Central Asia. Spurred by a robust demand, Asia and Oceania will increase natural gas production at a higher pace than traditional conventional gas producers, posting 1,184 Bcm in natural gas production in 2040.
Shale gas production will gain momentum mainly in Canada, Argentina and China after 2025. As a result, unconventional natural gas will reach 27% of global natural gas production in 2040.
2,550
4,610
1,640
2,600
1,750
6,950
3,934
5,710
7,200
160
900
700
460
820
180100
230
900
Unit:Thousand b/d
Japan/Korea/Taiwan
Non-OECD Europe/Central Asia
North America
MiddleEast
LatinAmerica
Africa
OECD Europe
China
ASEAN
Oceania
SouthAsia
IEEJ:February 2016 © IEEJ2016
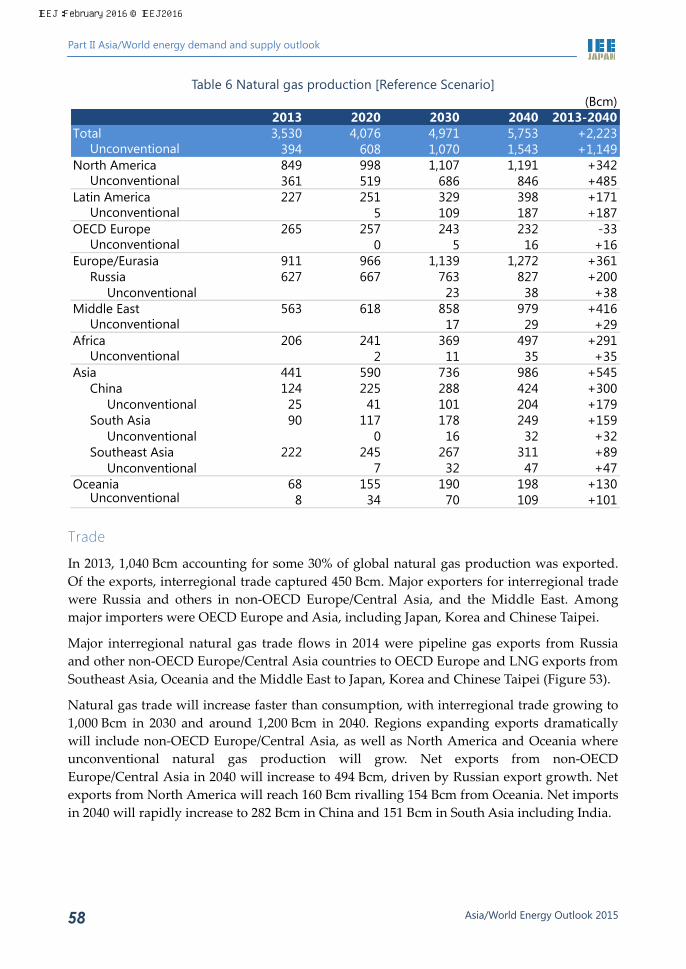
Part II Asia/World energy demand and supply outlook
Asia/World Energy Outlook 2015 58
Table 6 Natural gas production [Reference Scenario]
Trade
In 2013, 1,040 Bcm accounting for some 30% of global natural gas production was exported. Of the exports, interregional trade captured 450 Bcm. Major exporters for interregional trade were Russia and others in non-OECD Europe/Central Asia, and the Middle East. Among major importers were OECD Europe and Asia, including Japan, Korea and Chinese Taipei.
Major interregional natural gas trade flows in 2014 were pipeline gas exports from Russia and other non-OECD Europe/Central Asia countries to OECD Europe and LNG exports from Southeast Asia, Oceania and the Middle East to Japan, Korea and Chinese Taipei (Figure 53).
Natural gas trade will increase faster than consumption, with interregional trade growing to 1,000 Bcm in 2030 and around 1,200 Bcm in 2040. Regions expanding exports dramatically will include non-OECD Europe/Central Asia, as well as North America and Oceania where unconventional natural gas production will grow. Net exports from non-OECD Europe/Central Asia in 2040 will increase to 494 Bcm, driven by Russian export growth. Net exports from North America will reach 160 Bcm rivalling 154 Bcm from Oceania. Net imports in 2040 will rapidly increase to 282 Bcm in China and 151 Bcm in South Asia including India.
(Bcm)2013 2020 2030 2040 2013-2040
Total 3,530 4,076 4,971 5,753 +2,223394 608 1,070 1,543 +1,149
North America 849 998 1,107 1,191 +342361 519 686 846 +485
Latin America 227 251 329 398 +1715 109 187 +187
OECD Europe 265 257 243 232 -330 5 16 +16
Europe/Eurasia 911 966 1,139 1,272 +361Russia 627 667 763 827 +200
Unconventional 23 38 +38Middle East 563 618 858 979 +416
17 29 +29Africa 206 241 369 497 +291
2 11 35 +35Asia 441 590 736 986 +545
China 124 225 288 424 +300Unconventional 25 41 101 204 +179
South Asia 90 117 178 249 +159Unconventional 0 16 32 +32
Southeast Asia 222 245 267 311 +89Unconventional 7 32 47 +47
Oceania 68 155 190 198 +1308 34 70 109 +101
Unconventional
Unconventional
Unconventional
Unconventional
Unconventional
Unconventional
Unconventional
IEEJ:February 2016 © IEEJ2016

4. Energy supply
Asia/World Energy Outlook 2015 59
Figure 53 Major natural gas trade flows [2014]
Asia will become a major market for net export growth in North America, Oceania and non-OECD Europe/Central Asia. North America will rapidly expand exports as the United States becomes a net exporter by 2020 and Canada’s LNG exports gain momentum in the 2020s. In 2030, North America will export 42 Bcm to Japan, Korea and Chinese Taipei and 16 Bcm to Europe, rising as a major LNG exporting region. To meet growing Chinese demand, non-OECD Europe/Central Asia will rapidly expand pipeline gas supply to 109 Bcm in 2030. LNG supply mainly from Oceania and the Middle East will also contribute to satisfying Chinese demand. Supply from non-OECD Europe/Central Asia to OECD Europe, which is now trending down, will recover moderately due to a decline in production in non-OECD Europe and the construction of pipelines via Turkey.
The basic trend of natural gas flows will continue through 2040. North America will further expand LNG exports, supplying 55 Bcm to Japan, Korea and Chinese Taipei and 19 Bcm to Europe in 2040. Non-OECD Europe/Central Asia will increase pipeline gas supply to China to 148 Bcm, enhancing a shift to the Asian market. Oceania, which also has great export potential, will increase LNG exports mainly to Asia, supplying 48 Bcm to Japan, Korea and Chinese Taipei and 31 Bcm to China.
Unit:BCM
30
29
142
20
1423
54
21
69
17
28
11
PipelineLNG
Japan/Korea/Taiwan
Non-OECD Europe/Central Asia
North America
MiddleEast
LatinAmerica
Africa
OECD Europe
China
ASEAN
Oceania
SouthAsia
IEEJ:February 2016 © IEEJ2016
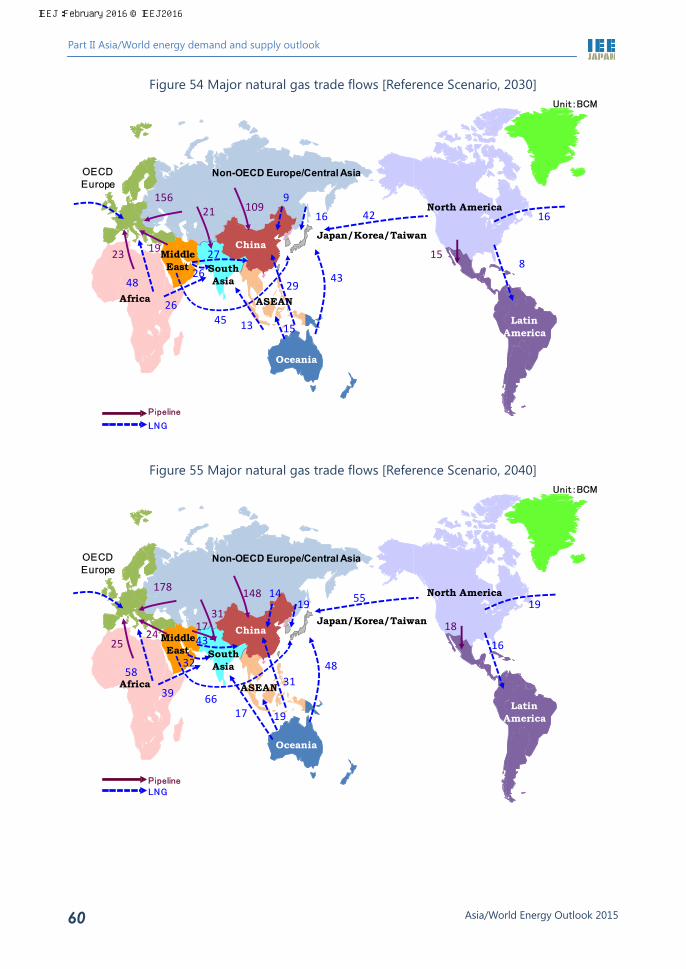
Part II Asia/World energy demand and supply outlook
Asia/World Energy Outlook 2015 60
Figure 54 Major natural gas trade flows [Reference Scenario, 2030]
Figure 55 Major natural gas trade flows [Reference Scenario, 2040]
1642
4326
23
109156
48
1621
819
9
27
4526
15
1513
29
Unit:BCM
LNG
Pipeline
Japan/Korea/Taiwan
Non-OECD Europe/Central Asia
North America
MiddleEast
LatinAmerica
Africa
OECD Europe
China
ASEAN
Oceania
SouthAsia
1955
314832
25
148178
58
1931
1624
14
6639
18
17
17
19
43
Unit:BCM
LNGPipeline
Japan/Korea/Taiwan
Non-OECD Europe/Central Asia
North America
MiddleEast
LatinAmerica
Africa
OECD Europe
China
ASEAN
Oceania
SouthAsia
IEEJ:February 2016 © IEEJ2016

4. Energy supply
Asia/World Energy Outlook 2015 61
4.3 Coal
Production
Global coal production will increase from 8,075 Mt in 2013 to 9,418 Mt in 2040 as coal demand expands mainly in Asia (Figure 56). Steam coal production will rise 1.25-fold from 6,195 Mt in 2013 to 7,741 Mt in 2040, while coking coal production will decrease from 1,045 Mt in 2013 to 905 Mt in 2040 and lignite production from 835 Mt in 2013 to 771 Mt in 2040.
Figure 56 Coal production by type [Reference Scenario]
By region, coal production will increase in Asia with growing coal demand and in Oceania, Africa and Latin America with major coal exporting countries. But it will decrease in North America and OECD Europe where coal demand will decline (Figure 57). Table 7 indicates steam coal production by region and Table 8 coking coal production by region.
Asian coal production will grow by 1,118 Mt from 5,080 Mt in 2013 to 6,198 Mt in 2040. In China, the world’s largest coal consumer, producer and importer, domestic coal production has slackened after expanding rapidly to meet demand growth. As steam coal demand increases in line with electricity demand growth, coal production will rise moderately before almost leveling off after 2030. Meanwhile, coking coal production will trend down as demand falls in line with a decline in crude steel production. As a result, the growth in Chinese coal production (a combination of steam and coking coal production) will gradually decelerate, peaking around 2030. India, with its abundant coal resources high in ash content, will increase steam and coking coal production in conjunction with demand growth. As coal mining development and transport infrastructure construction have in the past failed to catch up with demand growth, India may fail in the future to cover its growing demand with domestic production. Indonesia had so far substantially increased steam coal production in line with the expansion of the Asian market. At present, however, production has decreased on a fall in Chinese imports and slack in coal prices. In the future, Indonesia is expected to increase coal production in line with domestic demand growth but the growth may be
1,118 844 835 810 809 771
600 477 1,045 977 918 905
2,928 3,316
6,195 6,655 7,217 7,7414,645 4,637
8,075 8,4418,944
9,418
0
2,000
4,000
6,000
8,000
10,000
1990 2000 2013 2020 2030 2040
Mt
Steam coal
Coking coal
Lignite
IEEJ:February 2016 © IEEJ2016

Part II Asia/World energy demand and supply outlook
Asia/World Energy Outlook 2015 62
limited as the Indonesian government plans to sustainably and efficiently use domestic coal resources for the benefit of its people under its new mining law and restrict production.
North American coal production will decrease from 973 Mt in 2013 to 665 Mt in 2040. U.S. production will decline due to a domestic demand fall, production cost hikes and environmental problems involving coal mining. Steam coal production will fall substantially from 756 Mt in 2013 to 500 Mt in 2040 on a domestic demand drop under environmental regulations, although demand for exports to such regions as Latin America, Africa and Asia is expected to increase. In Canada as well, steam coal production will drop in line with a domestic demand decline.
In OECD Europe, coal production will fall from 533 Mt in 2013 to 450 Mt in 2040 due to a regional decline, production cost hikes and the elimination of subsidies for the coal industry in some countries. Both steam and coking coal production will decline.
In non-OECD Europe, coal production will almost level off as demand for exports increases despite a decline in regional demand. Russia will increase both steam and coking coal production as the Asian market expands despite the shrinkage of the European market.
In Africa, coal production will rise from 268 Mt in 2013 to 424 Mt in 2040 in line with growth in regional steam coal demand and in export demand (including Asian steam coal demand and Indian coking coal demand). In South Africa, steam coal production will increase. Mozambique will expand both coking and steam coal production.
Latin America will increase coal production due to expanding regional and export demand. Steam coal exporter Columbia will increase production on the expansion of the Asian market while its major export destination, the European market, will shrink. Exports to Africa, South America and the Middle East will increase.
In Oceania, Australia will substantially raise coal production in line with the expansion of the coal market including Asia. Australian steam coal production in 2040 will increase 2.6-fold from 2013 to meet growing exports to Asia and make up for a decline in steam coal exports from Indonesia.
IEEJ:February 2016 © IEEJ2016
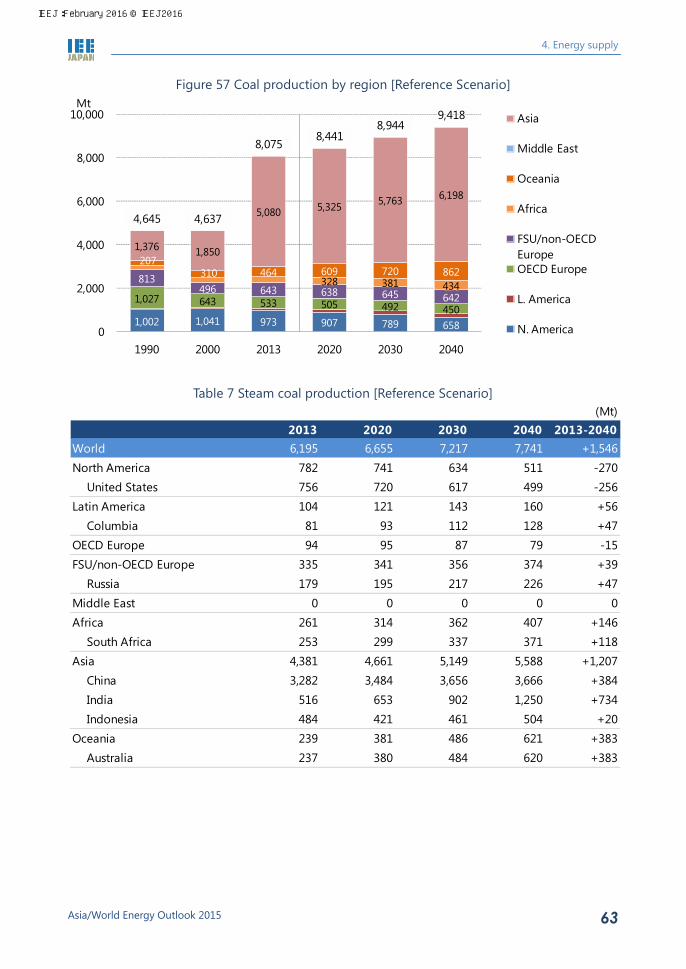
4. Energy supply
Asia/World Energy Outlook 2015 63
Figure 57 Coal production by region [Reference Scenario]
Table 7 Steam coal production [Reference Scenario]
1,002 1,041 973 907 789 658
1,027 643 533 505 492 450
813496 643 638 645 642
328 381 434
207310 464 609 720 862
1,376 1,850
5,080 5,325 5,763 6,198
4,645 4,637
8,0758,441
8,9449,418
0
2,000
4,000
6,000
8,000
10,000
1990 2000 2013 2020 2030 2040
MtAsia
Middle East
Oceania
Africa
FSU/non-OECD EuropeOECD Europe
L. America
N. America
(Mt)2013 2020 2030 2040 2013-2040
World 6,195 6,655 7,217 7,741 +1,546North America 782 741 634 511 -270
United States 756 720 617 499 -256Latin America 104 121 143 160 +56
Columbia 81 93 112 128 +47OECD Europe 94 95 87 79 -15FSU/non-OECD Europe 335 341 356 374 +39
Russia 179 195 217 226 +47Middle East 0 0 0 0 0Africa 261 314 362 407 +146
South Africa 253 299 337 371 +118Asia 4,381 4,661 5,149 5,588 +1,207
China 3,282 3,484 3,656 3,666 +384India 516 653 902 1,250 +734Indonesia 484 421 461 504 +20
Oceania 239 381 486 621 +383Australia 237 380 484 620 +383
IEEJ:February 2016 © IEEJ2016
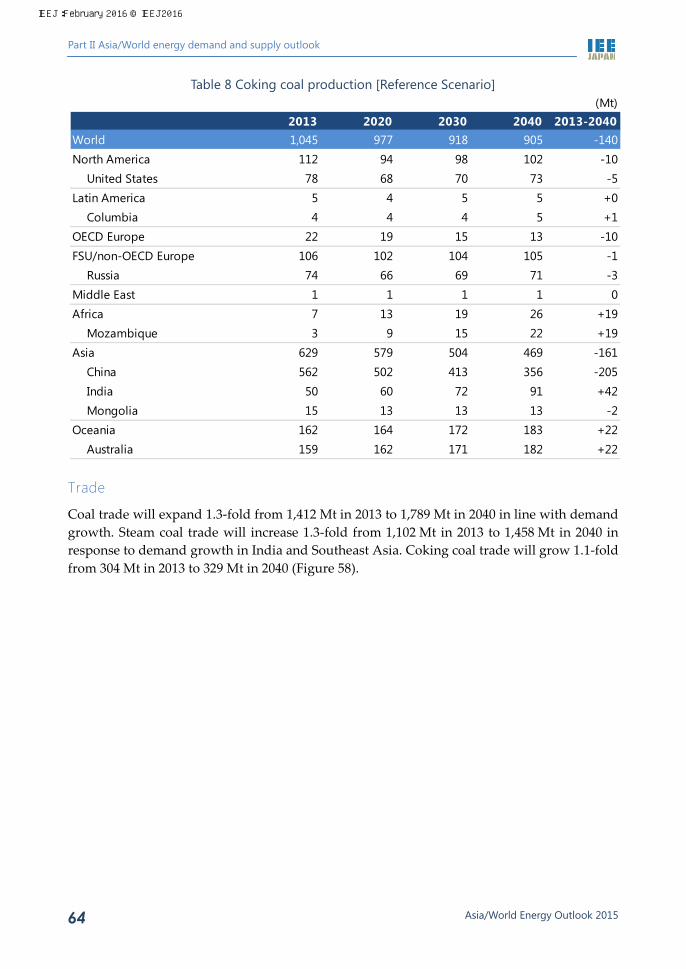
Part II Asia/World energy demand and supply outlook
Asia/World Energy Outlook 2015 64
Table 8 Coking coal production [Reference Scenario]
Trade
Coal trade will expand 1.3-fold from 1,412 Mt in 2013 to 1,789 Mt in 2040 in line with demand growth. Steam coal trade will increase 1.3-fold from 1,102 Mt in 2013 to 1,458 Mt in 2040 in response to demand growth in India and Southeast Asia. Coking coal trade will grow 1.1-fold from 304 Mt in 2013 to 329 Mt in 2040 (Figure 58).
(Mt)2013 2020 2030 2040 2013-2040
World 1,045 977 918 905 -140North America 112 94 98 102 -10
United States 78 68 70 73 -5Latin America 5 4 5 5 +0
Columbia 4 4 4 5 +1OECD Europe 22 19 15 13 -10FSU/non-OECD Europe 106 102 104 105 -1
Russia 74 66 69 71 -3Middle East 1 1 1 1 0Africa 7 13 19 26 +19
Mozambique 3 9 15 22 +19Asia 629 579 504 469 -161
China 562 502 413 356 -205India 50 60 72 91 +42Mongolia 15 13 13 13 -2
Oceania 162 164 172 183 +22Australia 159 162 171 182 +22
IEEJ:February 2016 © IEEJ2016
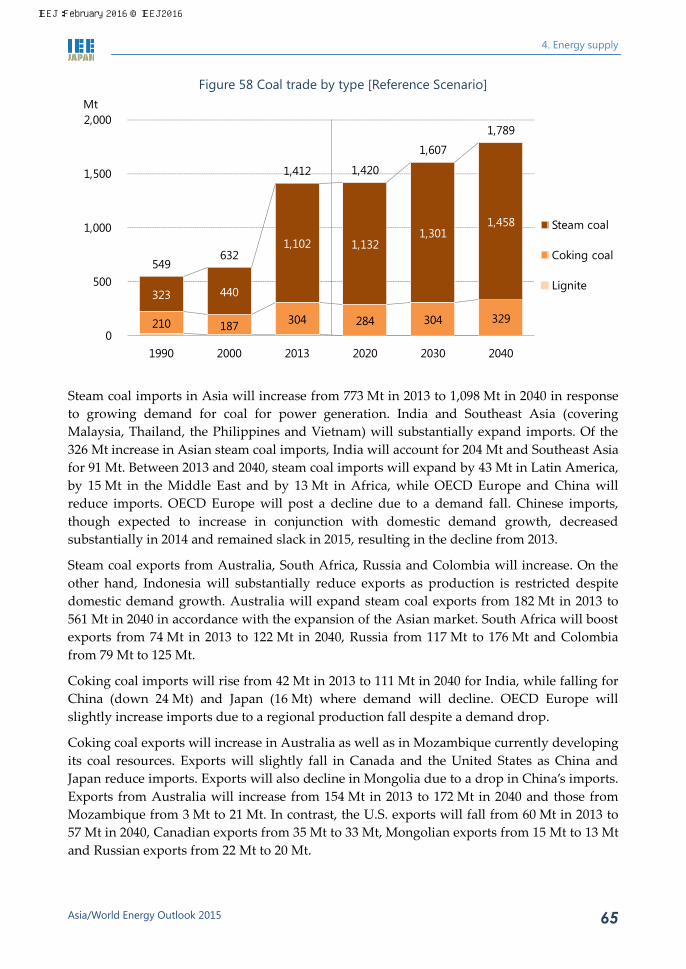
4. Energy supply
Asia/World Energy Outlook 2015 65
Figure 58 Coal trade by type [Reference Scenario]
Steam coal imports in Asia will increase from 773 Mt in 2013 to 1,098 Mt in 2040 in response to growing demand for coal for power generation. India and Southeast Asia (covering Malaysia, Thailand, the Philippines and Vietnam) will substantially expand imports. Of the 326 Mt increase in Asian steam coal imports, India will account for 204 Mt and Southeast Asia for 91 Mt. Between 2013 and 2040, steam coal imports will expand by 43 Mt in Latin America, by 15 Mt in the Middle East and by 13 Mt in Africa, while OECD Europe and China will reduce imports. OECD Europe will post a decline due to a demand fall. Chinese imports, though expected to increase in conjunction with domestic demand growth, decreased substantially in 2014 and remained slack in 2015, resulting in the decline from 2013.
Steam coal exports from Australia, South Africa, Russia and Colombia will increase. On the other hand, Indonesia will substantially reduce exports as production is restricted despite domestic demand growth. Australia will expand steam coal exports from 182 Mt in 2013 to 561 Mt in 2040 in accordance with the expansion of the Asian market. South Africa will boost exports from 74 Mt in 2013 to 122 Mt in 2040, Russia from 117 Mt to 176 Mt and Colombia from 79 Mt to 125 Mt.
Coking coal imports will rise from 42 Mt in 2013 to 111 Mt in 2040 for India, while falling for China (down 24 Mt) and Japan (16 Mt) where demand will decline. OECD Europe will slightly increase imports due to a regional production fall despite a demand drop.
Coking coal exports will increase in Australia as well as in Mozambique currently developing its coal resources. Exports will slightly fall in Canada and the United States as China and Japan reduce imports. Exports will also decline in Mongolia due to a drop in China’s imports. Exports from Australia will increase from 154 Mt in 2013 to 172 Mt in 2040 and those from Mozambique from 3 Mt to 21 Mt. In contrast, the U.S. exports will fall from 60 Mt in 2013 to 57 Mt in 2040, Canadian exports from 35 Mt to 33 Mt, Mongolian exports from 15 Mt to 13 Mt and Russian exports from 22 Mt to 20 Mt.
210 187 304 284 304 329
323 440
1,102 1,1321,301
1,458
549632
1,412 1,420
1,607
1,789
0
500
1,000
1,500
2,000
1990 2000 2013 2020 2030 2040
Mt
Steam coal
Coking coal
Lignite
IEEJ:February 2016 © IEEJ2016
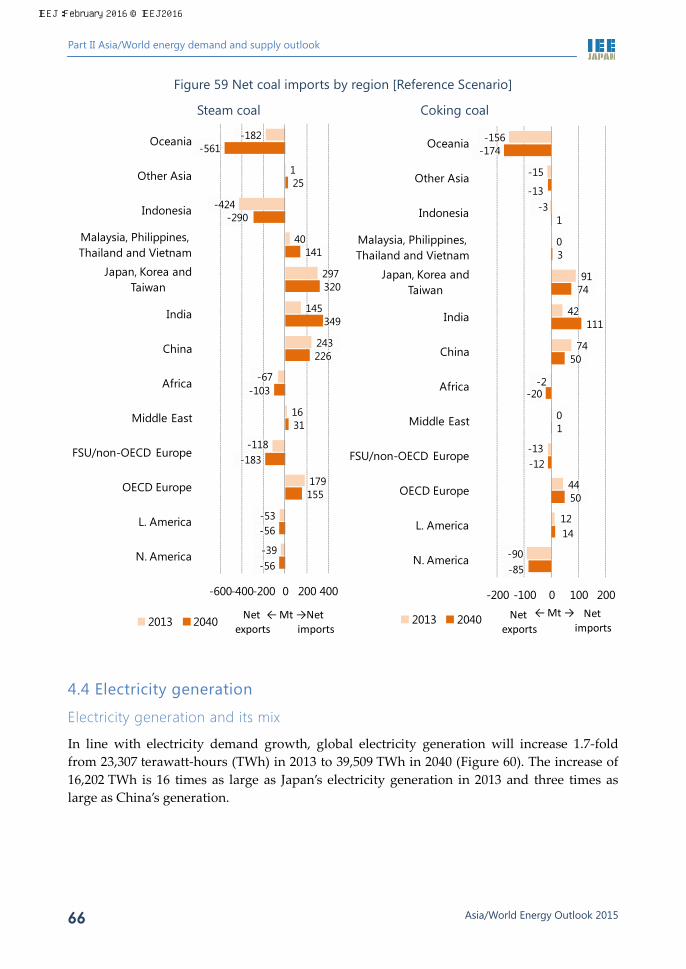
Part II Asia/World energy demand and supply outlook
Asia/World Energy Outlook 2015 66
Figure 59 Net coal imports by region [Reference Scenario]
Steam coal Coking coal
4.4 Electricity generation
Electricity generation and its mix
In line with electricity demand growth, global electricity generation will increase 1.7-fold from 23,307 terawatt-hours (TWh) in 2013 to 39,509 TWh in 2040 (Figure 60). The increase of 16,202 TWh is 16 times as large as Japan’s electricity generation in 2013 and three times as large as China’s generation.
-56
-56
155
-183
31
-103
226
349
320
141
-290
25
-561
-39
-53
179
-118
16
-67
243
145
297
40
-424
1
-182
-600-400-200 0 200 400
N. America
L. America
OECD Europe
FSU/non-OECD Europe
Middle East
Africa
China
India
Japan, Korea and Taiwan
Malaysia, Philippines, Thailand and Vietnam
Indonesia
Other Asia
Oceania
2013 2040 Netexports
Netimports
← Mt →
-85
14
50
-12
1
-20
50
111
74
3
1
-13
-174
-90
12
44
-13
0
-2
74
42
91
0
-3
-15
-156
-200 -100 0 100 200
N. America
L. America
OECD Europe
FSU/non-OECD Europe
Middle East
Africa
China
India
Japan, Korea and Taiwan
Malaysia, Philippines, Thailand and Vietnam
Indonesia
Other Asia
Oceania
2013 2040 Netexports
Netimports
← Mt →
IEEJ:February 2016 © IEEJ2016

4. Energy supply
Asia/World Energy Outlook 2015 67
Figure 60 Global power generation and consumption [Reference Scenario]
Non-OECD countries will account for more than 80% of the electricity generation growth through 2040 (Figure 61). Asian electricity generation, driven by China, India and ASEAN, will increase at an annual rate of 2.7% from 9,481 TWh in 2013 to 19,519 TWh in 2040. . Generation growth in China between 2013 and 2040 will reach 4,305 TWh.
Figure 61 Power generation by region [Reference Scenario]
Coal accounted for the largest share of global electricity generation in 2013 at 41%, followed by 22% for natural gas, 16% for hydro and 11% for nuclear (Figure 62). Through 2040, coal will retain the largest share, continuing to serve as a mainstay electricity source. As technological development allows combined cycle gas turbines (CCGTs) to diffuse, with gas turbines used to adjust for variable renewable energy generation, a shift to natural gas for power generation will make progress. The share for natural gas will thus expand from 22% in
11,826
23,307
27,414
33,547
39,509
9,695
19,49423,110
28,440
33,613
0
10,000
20,000
30,000
40,000
1990 2000 2013 2020 2030 2040
TWh
Generation
Consumption
9,728
5,188
4,196
4,041
0
2,000
4,000
6,000
8,000
10,000
1990 2000 2013 2020 2030 2040
TWh
China
U.S.
India
EU
Middle East/North AfricaASEAN
IEEJ:February 2016 © IEEJ2016

Part II Asia/World energy demand and supply outlook
Asia/World Energy Outlook 2015 68
2013 to 28% in 2040. The share for oil will trend down in OECD countries as well as in the oil-rich Middle East. Nuclear plant construction will make progress mainly in Asia as a measure to ensure energy security and prevent climate change. But nuclear power generation growth will fail to exceed electricity demand growth through 2040. Nuclear energy's share of electricity generation will thus level off from 2013 to 2040 at 11%. Wind power, solar photovoltaic and other renewable energy generation will expand at an unrivaled annual rate of 5.5% on the strength of policy support and cost reduction. But renewable energy's share of electricity generation will still be limited to less than 10% in 2040.
Figure 62 Global power generation mix [Reference Scenario]
In OECD countries, renewable energy’s share of total electricity generation in 2040 will rise to 30%, rivalling the natural gas share. The renewable energy share in 2040 will be the second largest after natural gas.
37% 39% 41% 38% 36% 35%
11% 8% 5% 3% 3% 3%
15% 18% 22%23% 26% 28%
17% 17% 11% 12% 11% 11%
18% 17% 16% 16% 14% 13%
3% 3% 3%3% 5% 7% 8%
0%
20%
40%
60%
80%
100%
1990 2000 2013 2020 2030 2040
PV, geothermal, etc.
Biomass, etc.
Hydro
Nuclear
Natural gas
Oil
Coal
IEEJ:February 2016 © IEEJ2016
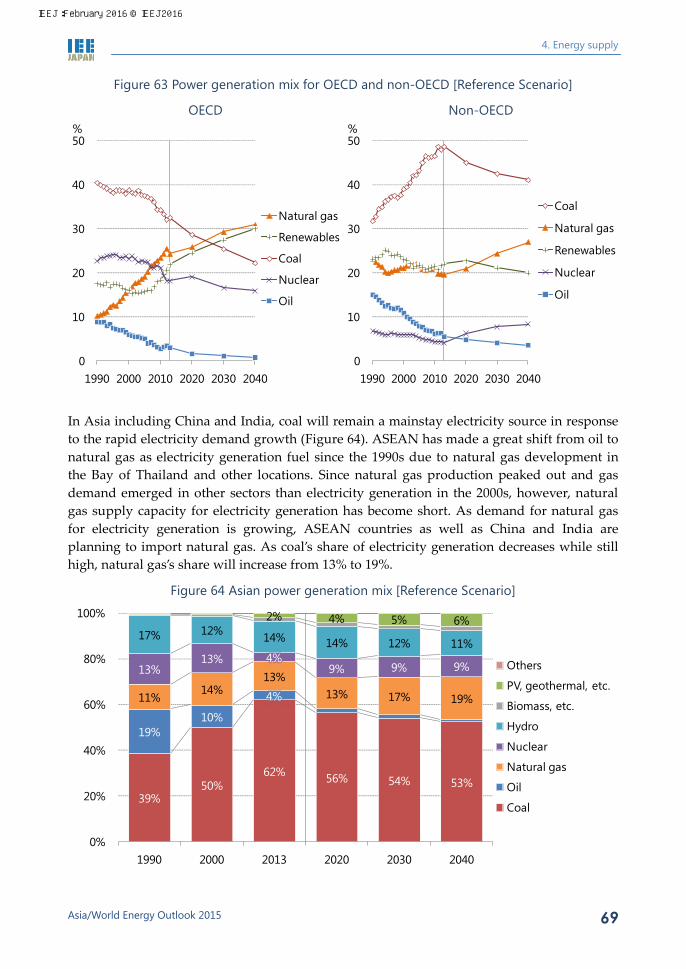
4. Energy supply
Asia/World Energy Outlook 2015 69
Figure 63 Power generation mix for OECD and non-OECD [Reference Scenario]
OECD Non-OECD
In Asia including China and India, coal will remain a mainstay electricity source in response to the rapid electricity demand growth (Figure 64). ASEAN has made a great shift from oil to natural gas as electricity generation fuel since the 1990s due to natural gas development in the Bay of Thailand and other locations. Since natural gas production peaked out and gas demand emerged in other sectors than electricity generation in the 2000s, however, natural gas supply capacity for electricity generation has become short. As demand for natural gas for electricity generation is growing, ASEAN countries as well as China and India are planning to import natural gas. As coal’s share of electricity generation decreases while still high, natural gas’s share will increase from 13% to 19%.
Figure 64 Asian power generation mix [Reference Scenario]
0
10
20
30
40
50
1990 2000 2010 2020 2030 2040
%
Natural gas
Renewables
Coal
Nuclear
Oil
0
10
20
30
40
50
1990 2000 2010 2020 2030 2040
%
Coal
Natural gas
Renewables
Nuclear
Oil
39%50%
62% 56% 54% 53%
19%10%
4%11%14%
13%13% 17% 19%
13%13% 4%
9% 9% 9%
17% 12% 14% 14% 12% 11%
2% 4% 5% 6%
0%
20%
40%
60%
80%
100%
1990 2000 2013 2020 2030 2040
Others
PV, geothermal, etc.
Biomass, etc.
Hydro
Nuclear
Natural gas
Oil
Coal
IEEJ:February 2016 © IEEJ2016

Part II Asia/World energy demand and supply outlook
Asia/World Energy Outlook 2015 70
Nuclear
The number of nuclear generating countries will expand from 31 in 2014 to 41 in 2040 (Figure 65). The number of nuclear generating OECD countries will fall from 18 in 2014 to 17 in 2040, while the number will rise from 13 to 24 during the same period in non-OECD countries that need large amounts of electricity to support their economic growth.
Figure 65 Number of countries with commercial nuclear power plants [Reference Scenario]
The Fukushima Daiichi nuclear power plant accident has directly affected nuclear energy policies in Japan and some European countries. The United States, France, Russia and Korea continue to proactively promote nuclear power generation. Emerging countries like China have not changed their respective nuclear promotion policies aimed at securing stable energy supply, preventing global warming, and maintaining and enhancing international competitiveness through their nuclear industry development. As explained later, France has passed an energy transition law to limit nuclear generation capacity to the present level of 63 GW and increase renewable energy’s share of final energy consumption to 32% by 2030. France made no change to its policy of maintaining nuclear generation as a mainstay electricity source.
In the United States, the world’s largest nuclear generating country with 99 nuclear reactors, new nuclear plant construction has slowed down as the economic advantages of its fossil energy resources have increased thanks to shale gas and oil development. The country is even shutting down some existing reactors for economic reasons. Given fuel price fluctuation risks accompanying a shift from nuclear energy to natural gas, as well as climate change implications, however, the United States will retain the policy of maintaining nuclear power plants. Installed capacity for nuclear power generation declined to 103 GW in 2014 and will rise back to 108 GW in 2040 as new reactors under construction launch operation (Figure 66).
18 17
13
24
31
41
0
10
20
30
40
2014 2040
IEEJ:February 2016 © IEEJ2016

4. Energy supply
Asia/World Energy Outlook 2015 71
Figure 66 Nuclear power generating capacity by region [Reference Scenario]
In France known as the largest nuclear energy promoter in Europe, an energy transition law was enacted in July 2015 to reduce nuclear energy’s share of electricity generation to 50% by 2025. But France has faced electricity rate hikes and employment problems and only released a plan to shut down the Fessenheim Unit 1 reactor. The present situation, including installed nuclear generation capacity at 66 GW as of 2014, will be maintained for the immediate future. Germany, Switzerland and Belgium have made clear their nuclear phase-out plans in response to the Fukushima accident and will eliminate nuclear generation from 2025 to 2035. While outdated nuclear reactors are being decommissioned in European OECD countries, their moves to construct new reactors are also seen. Therefore, Europe’s installed nuclear generation capacity will fall to 115 GW temporarily in 2030 and rise back later. Russia has vowed to proactively use nuclear energy at home and abroad and its installed nuclear generation capacity in 2040 will more than double from the level of 25 GW for 2014 to 53 GW.
The presence of Asia including China and India will increase more and more in nuclear power generation. China will boost its installed nuclear generation capacity from 15 GW in 2014 to 112 GW in 2035, replacing the United States as the largest nuclear power generator in the world. Asian installed nuclear generation capacity will reach 261 GW in 2040, surpassing the combined OECD Europe and U.S. capacity of 244 GW. The United Arab Emirates and Saudi Arabia will lead the Middle East to raise installed nuclear generation capacity to 11 GW in 2025. South Africa and Brazil are planning to introduce nuclear generation and will steadily construct nuclear plants.
Renewables
Great expectations are placed on renewable energy including solar and wind energy. Renewable energy, particularly renewable energy power generation, has seen strong growth despite negative factors such as the unstable world economy, the reduction of subsidies, and crude oil price plunges. But non-hydro renewable energy-based electricity generation, which
147
386
449
525
610
0
200
400
600
1980 2014 2020 2030 2040
GW
Middle East and Africa
L. America
FSU and non-OECD europe
OECD Europe
N. America
Asia
IEEJ:February 2016 © IEEJ2016

Part II Asia/World energy demand and supply outlook
Asia/World Energy Outlook 2015 72
costs more and is intermittent depending on natural conditions (for solar photovoltaic and wind), will fall short of becoming a mainstay electricity source rivaling fossil resources on a global scale (Figure 67).
Figure 67 Global renewable energy power generation except hydro [Reference Scenario]
Renewable energy penetration may contribute to expanding low-carbon electricity sources, reducing dependence on energy imports, and potentially holding down fossil fuel prices. Large-scale renewable energy penetration will depend on cost reduction, improved efficiency, and harmonisation of renewable energy with energy systems through continuous research and development.
Although Europe and North America are still major wind power generation markets, Asia has become the world’s largest wind power generation market, driven by China and India. In recent years, investment has increased in emerging wind power generation markets like Latin America and Africa. Installed wind electricity generation capacity is projected to more than triple from 318 GW in 2013 to 998 GW in 2040.
523
1,940
435
1,200
99
747
239108100
500
1,000
1,500
2,000
1990 2000 2010 2020 2030 2040
TWh
Wind
Biomass
Solar PV
Geothermal
CSP
Ocean
IEEJ:February 2016 © IEEJ2016
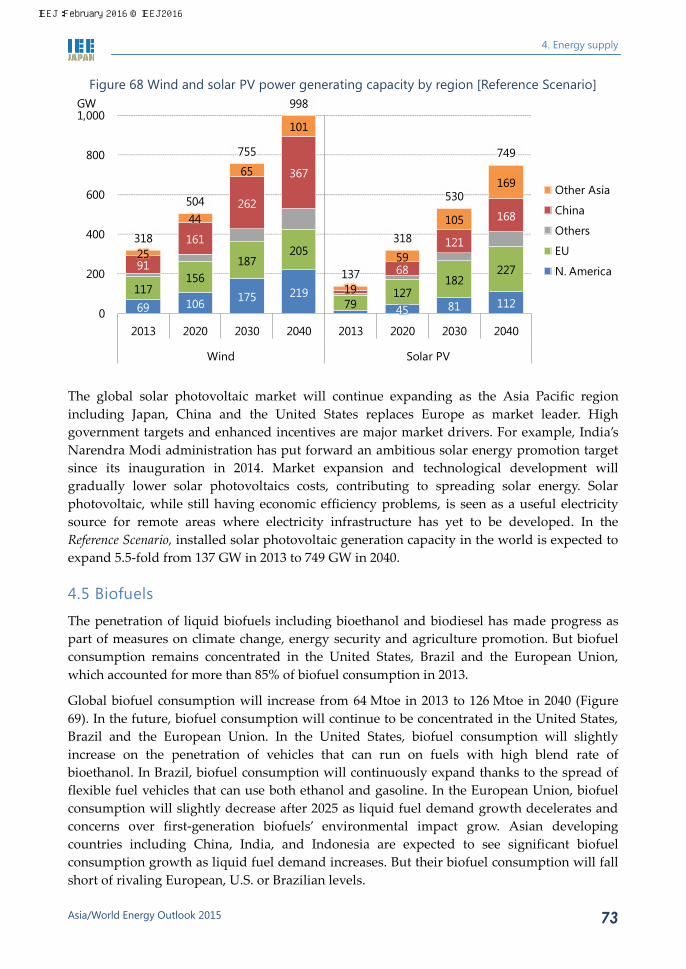
4. Energy supply
Asia/World Energy Outlook 2015 73
Figure 68 Wind and solar PV power generating capacity by region [Reference Scenario]
The global solar photovoltaic market will continue expanding as the Asia Pacific region including Japan, China and the United States replaces Europe as market leader. High government targets and enhanced incentives are major market drivers. For example, India’s Narendra Modi administration has put forward an ambitious solar energy promotion target since its inauguration in 2014. Market expansion and technological development will gradually lower solar photovoltaics costs, contributing to spreading solar energy. Solar photovoltaic, while still having economic efficiency problems, is seen as a useful electricity source for remote areas where electricity infrastructure has yet to be developed. In the Reference Scenario, installed solar photovoltaic generation capacity in the world is expected to expand 5.5-fold from 137 GW in 2013 to 749 GW in 2040.
4.5 Biofuels
The penetration of liquid biofuels including bioethanol and biodiesel has made progress as part of measures on climate change, energy security and agriculture promotion. But biofuel consumption remains concentrated in the United States, Brazil and the European Union, which accounted for more than 85% of biofuel consumption in 2013.
Global biofuel consumption will increase from 64 Mtoe in 2013 to 126 Mtoe in 2040 (Figure 69). In the future, biofuel consumption will continue to be concentrated in the United States, Brazil and the European Union. In the United States, biofuel consumption will slightly increase on the penetration of vehicles that can run on fuels with high blend rate of bioethanol. In Brazil, biofuel consumption will continuously expand thanks to the spread of flexible fuel vehicles that can use both ethanol and gasoline. In the European Union, biofuel consumption will slightly decrease after 2025 as liquid fuel demand growth decelerates and concerns over first-generation biofuels’ environmental impact grow. Asian developing countries including China, India, and Indonesia are expected to see significant biofuel consumption growth as liquid fuel demand increases. But their biofuel consumption will fall short of rivaling European, U.S. or Brazilian levels.
69 106 175 21945 81 112
117156
187205
79127
18222791
161
262
367
68
121
168
25
44
65
101
19
59
105
169
318
504
755
998
137
318
530
749
0
200
400
600
800
1,000
2013 2020 2030 2040 2013 2020 2030 2040
Wind Solar PV
GW
Other Asia
China
Others
EU
N. America
IEEJ:February 2016 © IEEJ2016

Part II Asia/World energy demand and supply outlook
Asia/World Energy Outlook 2015 74
Figure 69 Biofuel consumption [Reference Scenario]
28 30 35 39
1332 32 31
14
1825
3164
94
111
126
0
50
100
150
2013 2020 2030 2040
Mto
e
Other Asia
Indonesia
India
China
Others
Brazil
EU
U.S.
IEEJ:February 2016 © IEEJ2016

Asia/World Energy Outlook 2015 75
Part III Exploring other paths through scenario analysis such as: Advanced Technologies and Lower Price
IEEJ:February 2016 © IEEJ2016

IEEJ:February 2016 © IEEJ2016

5. Potential and effects of introducing energy conservation and decarbonisation technologies
Asia/World Energy Outlook 2015 77
5. Potential and effects of introducing energy conservation and decarbonisation technologies
5.1 Present energy conservation
Energy conservation is important for energy security, for cutting costs and for climate change prevention. It is significant not only for energy consuming countries, but also for energy supplying countries as a means to maintain surplus export capacity. Energy conservation potential in 2040 in the Advanced Technologies Scenario will total 1,678 Mtoe, making the greatest contribution among climate change measures.
Table 9 indicates the introduction of energy conservation measures and policies, and the current emission intensity (CO2 emissions per GDP) for major countries. While all of these countries have introduced a variety of energy conservation measures, their emission intensity data differs widely (Figure 70). This is because the energy conservation coverage, levels and degrees differ from country to country depending on industrial structure, weather, culture, population and economic development conditions. For example, the years for the introduction of some energy conservation laws differ from country to country. Similarly, the years for the introduction and coverage (including the range of products subject to energy conservation labelling) and degrees (including energy consumption standards) of conservation are different. Some countries introduced energy conservation policies without monitoring, verification or any other follow-up measures, leaving these policies ineffective. Despite the introduction of many energy conservation policies, therefore, there exists great energy conservation potential, with future efforts remaining important.
Table 9 Energy saving policies in selected countries
Energy saving law
Energy saving targets
Energy saving
diagnosis
Efficiency standards
Labelling system
Subsidies Energy manager system
Energy intensity in 2013*
Japan ◎(1979) ◎ ○ ◎ ◎ ◎ ◎ 80
United States ◎(1975) ◎ ○ ◎ ◎ ◎ ○ 138
United Kingdom ○ ◎ ○ ◎ ◎ ◎ ○ 76
Germany ○(1976) ◎ ◎ ◎ ◎ ◎ - 89
China ◎(1975) ◎ ◎ ◎ ◎ ◎ ◎ 402
India ◎(1975) ◎ ○ ○ ◎ ○ ◎ 380
Indonesia ○(2007) ◎ ◎ ○ ◎ ◎ ◎ 252
Vietnam ◎(2003) ◎ ○ ◎ ◎ ◎ ◎ 439
Saudi Arabia △ ◎ ○ ◎ ◎ - △ 306 ◎: Exist, ○: Exist but limited, △: Planned or considering, -: None. * toe/$2010 million
IEEJ:February 2016 © IEEJ2016

Part III Exploring other paths through scenario analysis such as: Advanced Technologies and Lower Price
Asia/World Energy Outlook 2015 78
Figure 70 Energy intensity for selected countries [2013]
Note: Total primary energy consumption per unit of real GDP
5.2 Five major energy conservation principles
There are five major principles for promoting energy conservation.
Figure 71 Five major energy conservation principles
(1) Understanding Significance / Direct and indirect effects of energy saving (Health, environment, etc.)
(2) Checking Consumption / Energy saving efficiencies
(3) Action Implementation / Introduction / Purchasing
(4) Improvement Products / Technologies (Appliances, vehicles, buildings, etc.)
(5) Innovation Integration / Systematization / Automation
(1) The first principle is to understand and be aware of the significance and importance of the effects and co-benefits of energy conservation. Measures to promote awareness include education (at schools, communities, workplaces, etc.), public relations activities (energy conservation campaigns and energy-saving events) and international cooperation (information sharing on technologies and policies). Events such as the Oil crises and the Great East Japan Earthquake have been important for citizens to recognize the importance of energy conservation in Japan.
(2) The second important principle is to visualize the performance of the current equipment through quantifying energy consumption. Means to check consumption include the provision of information through energy monitors, and power and gas utility bills to
76 80 89
138
252
306
380402
439 439
0
100
200
300
400
U.K. Japan Germany U.S. Indo-nesia
Saudi Arabia
India China Vietnam Russia
toe/2010 USD million
IEEJ:February 2016 © IEEJ2016

5. Potential and effects of introducing energy conservation and decarbonisation technologies
Asia/World Energy Outlook 2015 79
visualize consumption. Metering energy consumption allows for the selection of effective measures which can be identified through diagnoses (for example, by energy service companies) of energy conservation potential in uses and performance of equipment, reviews of operations by energy managers at companies, and the development of statistical energy data.
(3) The third principle is to implement energy conservation measures, including the introduction of high-performance equipment. Means to promote such actions include reviewing energy conservation operations, setting conservation targets and labelling the energy conservation performance of equipment in an easy-to-understand manner. Other means may also include subsidies (Box 1) for the introduction of efficient equipment, tax reductions for highly efficient equipment or imposing fines on inefficient equipment, and the provision of incentives through setting appropriate energy prices.
Box 1: India’s Bachat Lamp Yojana Scheme
The Indian government’s Bureau of Energy Efficiency (IBEE) implemented a scheme to replace incandescent bulbs for lighting with fluorescent bulbs, diffusing 29 million fluorescent bulbs between 2010 and 2013 to save 415 MW in electricity generation capacity. The scheme featured the use of funds under the Clean Development Mechanism to subsidize the gap between incandescent and fluorescent bulb prices (paying €8/CER (Certified Emission Reduction)) to diffuse fluorescent bulbs.
Figure 72 Bachat Lamp Yojana Scheme Mechanism
Source: IBEE
(4) The fourth principle is to ensure the continuous improvement of energy efficiency for equipment (electrical home appliances, vehicles and buildings). Means to promote improvements include establishing energy efficiency standards (such as minimum efficient standards and the Top Runner System (Box 2)) and subsidizing technological development. It
IEEJ:February 2016 © IEEJ2016
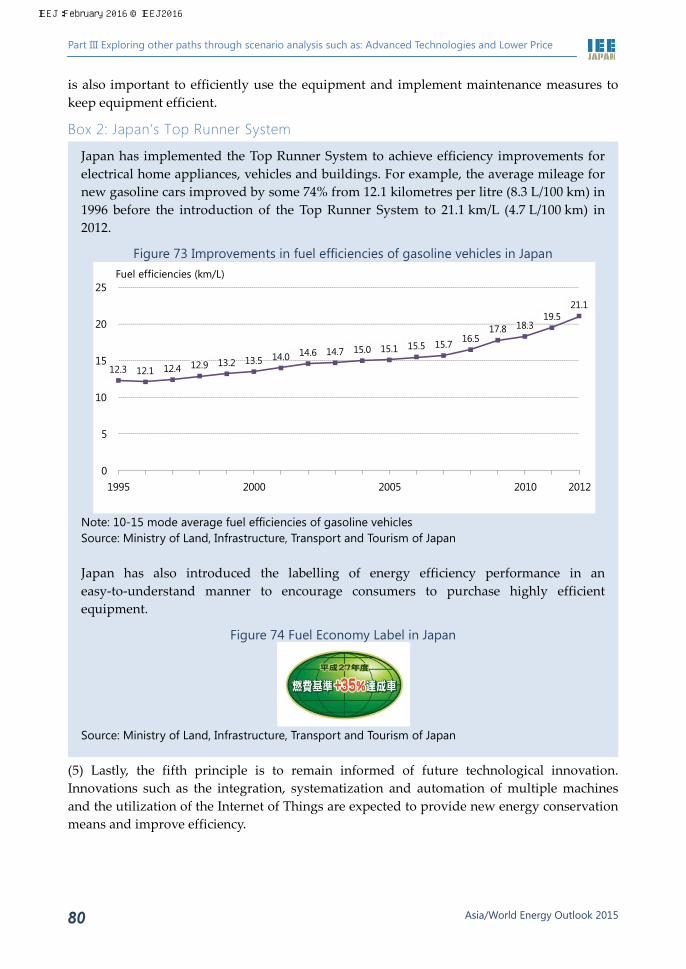
Part III Exploring other paths through scenario analysis such as: Advanced Technologies and Lower Price
Asia/World Energy Outlook 2015 80
is also important to efficiently use the equipment and implement maintenance measures to keep equipment efficient.
Box 2: Japan’s Top Runner System
Japan has implemented the Top Runner System to achieve efficiency improvements for electrical home appliances, vehicles and buildings. For example, the average mileage for new gasoline cars improved by some 74% from 12.1 kilometres per litre (8.3 L/100 km) in 1996 before the introduction of the Top Runner System to 21.1 km/L (4.7 L/100 km) in 2012.
Figure 73 Improvements in fuel efficiencies of gasoline vehicles in Japan
Note: 10-15 mode average fuel efficiencies of gasoline vehicles Source: Ministry of Land, Infrastructure, Transport and Tourism of Japan
Japan has also introduced the labelling of energy efficiency performance in an easy-to-understand manner to encourage consumers to purchase highly efficient equipment.
Figure 74 Fuel Economy Label in Japan
Source: Ministry of Land, Infrastructure, Transport and Tourism of Japan
(5) Lastly, the fifth principle is to remain informed of future technological innovation. Innovations such as the integration, systematization and automation of multiple machines and the utilization of the Internet of Things are expected to provide new energy conservation means and improve efficiency.
12.3 12.1 12.4 12.9 13.2 13.5 14.0 14.6 14.7 15.0 15.1 15.5 15.7 16.517.8 18.3
19.521.1
0
5
10
15
20
25
1995 2000 2005 2010 2012
Fuel efficiencies (km/L)
IEEJ:February 2016 © IEEJ2016

5. Potential and effects of introducing energy conservation and decarbonisation technologies
Asia/World Energy Outlook 2015 81
Important for the promotion of energy conservation is to understand its potential and then take action. Anyone can contribute to energy conservation and technological advancements to improve efficiency will continue to play a great role.
Although energy conservation efforts have been made in each country, there still remains a large potential to conserve energy. This is because priorities, policy coverage and the degree of energy conservation differ from country to country depending on national circumstances, as indicated in Table 9. A most common problem is the cost for energy conservation. For as long as priority will be given to cost efficiency rather than energy efficiency, there will be limits on energy conservation efforts. In order to lower barriers and promote energy conservation efforts, the policy means that could be implemented include further technological development for lowering costs, financial assistance and tax incentives for the introduction of energy-efficient equipment.
Experiences and best practices for energy conservation have been accumulated in many countries, allowing Japan to share them and learn from overseas cases. In order to promote energy conservation, each country should step up international cooperation to introduce and combine feasible policies and deepen policies in suitable ways in line with the five major energy conservation principles.
Finally, there will be “no end to energy conservation.”
5.3 Energy conservation potential
As indicated in Figure 75, in the Advanced Technologies Scenario, the maximum energy conservation to reduce global final energy consumption in 2040 will be 1,678 Mtoe (13%) lower than in the Reference Scenario, down from 12,991 Mtoe to 11,313 Mtoe. Among sectors, the buildings sector will make the greatest contribution to reducing final energy consumption. The sector’s energy conservation will account for 47% of the final energy consumption decline. The buildings sector’s energy conservation will depend greatly on improvements in the efficiency of the appliances, such as air-conditioning equipment, refrigerators, water heaters and lighting equipment. Energy consumption on air-conditioning equipment, for example, can be reduced through improvements not only in the efficiency of equipment but also in the insulation performance of buildings which has great potential to cut energy consumption. But such potential may differ from region to region since heating accounts for 60-70% of residential energy consumption in Europe, Russia and Canada while air conditioners capture only less than 30% of residential energy consumption in Japan. In the Middle East, cooling accounts for 70% of residential energy consumption.
IEEJ:February 2016 © IEEJ2016
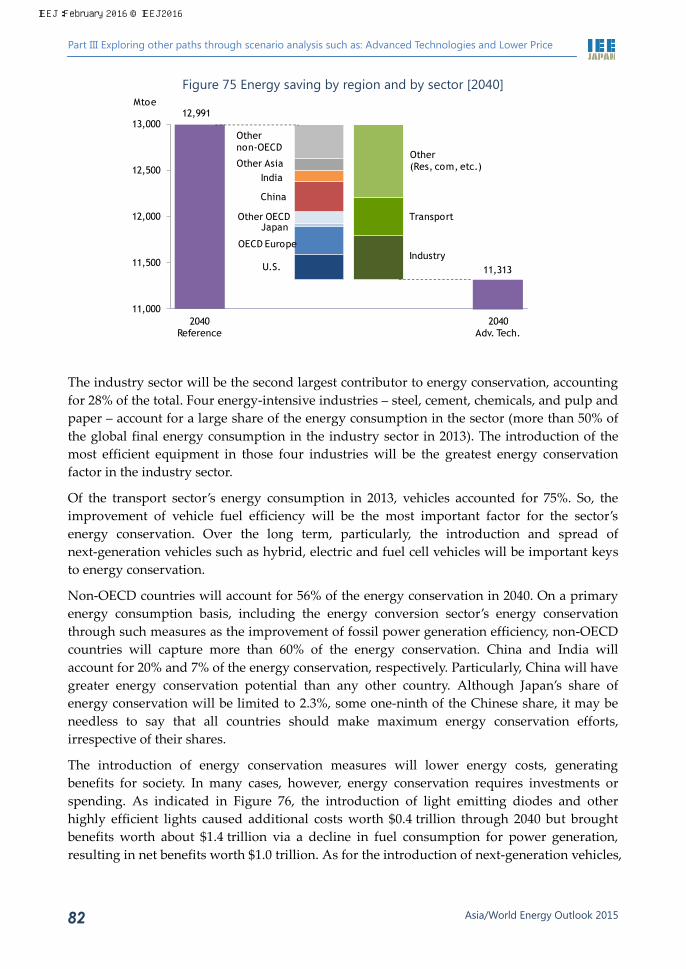
Part III Exploring other paths through scenario analysis such as: Advanced Technologies and Lower Price
Asia/World Energy Outlook 2015 82
Figure 75 Energy saving by region and by sector [2040]
The industry sector will be the second largest contributor to energy conservation, accounting for 28% of the total. Four energy-intensive industries – steel, cement, chemicals, and pulp and paper – account for a large share of the energy consumption in the sector (more than 50% of the global final energy consumption in the industry sector in 2013). The introduction of the most efficient equipment in those four industries will be the greatest energy conservation factor in the industry sector.
Of the transport sector’s energy consumption in 2013, vehicles accounted for 75%. So, the improvement of vehicle fuel efficiency will be the most important factor for the sector’s energy conservation. Over the long term, particularly, the introduction and spread of next-generation vehicles such as hybrid, electric and fuel cell vehicles will be important keys to energy conservation.
Non-OECD countries will account for 56% of the energy conservation in 2040. On a primary energy consumption basis, including the energy conversion sector’s energy conservation through such measures as the improvement of fossil power generation efficiency, non-OECD countries will capture more than 60% of the energy conservation. China and India will account for 20% and 7% of the energy conservation, respectively. Particularly, China will have greater energy conservation potential than any other country. Although Japan’s share of energy conservation will be limited to 2.3%, some one-ninth of the Chinese share, it may be needless to say that all countries should make maximum energy conservation efforts, irrespective of their shares.
The introduction of energy conservation measures will lower energy costs, generating benefits for society. In many cases, however, energy conservation requires investments or spending. As indicated in Figure 76, the introduction of light emitting diodes and other highly efficient lights caused additional costs worth $0.4 trillion through 2040 but brought benefits worth about $1.4 trillion via a decline in fuel consumption for power generation, resulting in net benefits worth $1.0 trillion. As for the introduction of next-generation vehicles,
12,991
11,313
11,000
11,500
12,000
12,500
13,000
2040Reference
2040Adv. Tech.
Mtoe
U.S.
OECD Europe
JapanOther OECD
China
IndiaOther Asia
Othernon-OECD
Other(Res, com, etc.)
Transport
Industry
IEEJ:February 2016 © IEEJ2016
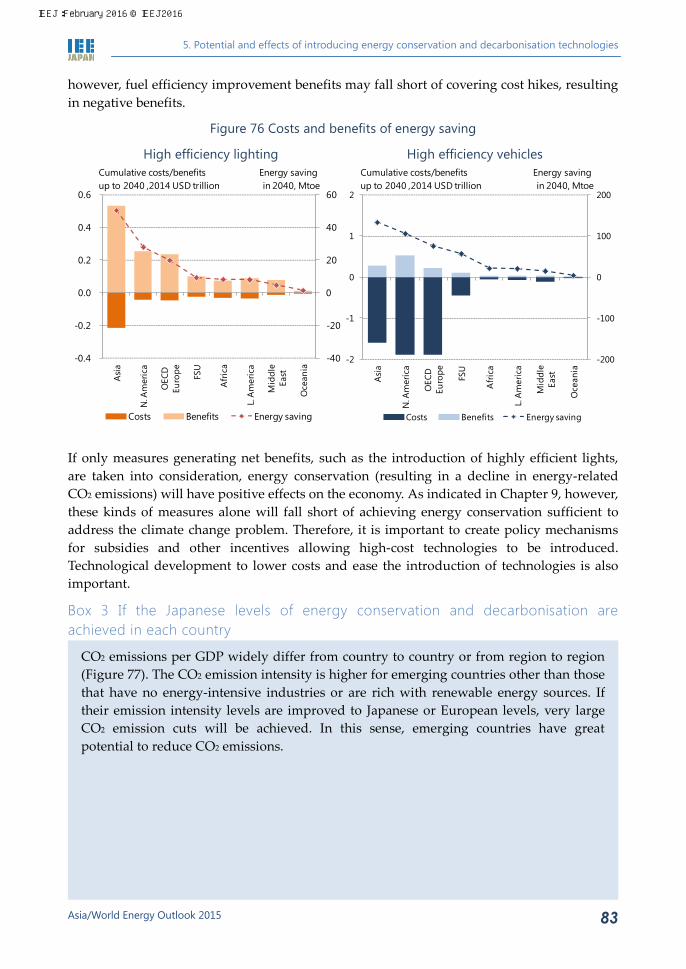
5. Potential and effects of introducing energy conservation and decarbonisation technologies
Asia/World Energy Outlook 2015 83
however, fuel efficiency improvement benefits may fall short of covering cost hikes, resulting in negative benefits.
Figure 76 Costs and benefits of energy saving
High efficiency lighting High efficiency vehicles
If only measures generating net benefits, such as the introduction of highly efficient lights, are taken into consideration, energy conservation (resulting in a decline in energy-related CO2 emissions) will have positive effects on the economy. As indicated in Chapter 9, however, these kinds of measures alone will fall short of achieving energy conservation sufficient to address the climate change problem. Therefore, it is important to create policy mechanisms for subsidies and other incentives allowing high-cost technologies to be introduced. Technological development to lower costs and ease the introduction of technologies is also important.
Box 3 If the Japanese levels of energy conservation and decarbonisation are achieved in each country
CO2 emissions per GDP widely differ from country to country or from region to region (Figure 77). The CO2 emission intensity is higher for emerging countries other than those that have no energy-intensive industries or are rich with renewable energy sources. If their emission intensity levels are improved to Japanese or European levels, very large CO2 emission cuts will be achieved. In this sense, emerging countries have great potential to reduce CO2 emissions.
-40
-20
0
20
40
60
-0.4
-0.2
0.0
0.2
0.4
0.6
Asi
a
N. A
mer
ica
OEC
D
Euro
pe FSU
Afr
ica
L. A
mer
ica
Mid
dle
East
Oce
ania
Costs Benefits Energy saving
Cumulative costs/benefitsup to 2040 ,2014 USD trillion
Energy saving in 2040, Mtoe
-200
-100
0
100
200
-2
-1
0
1
2
Asi
a
N. A
mer
ica
OEC
D
Euro
pe FSU
Afr
ica
L. A
mer
ica
Mid
dle
East
Oce
ania
Costs Benefits Energy saving
Cumulative costs/benefitsup to 2040 ,2014 USD trillion
Energy saving in 2040, Mtoe
IEEJ:February 2016 © IEEJ2016
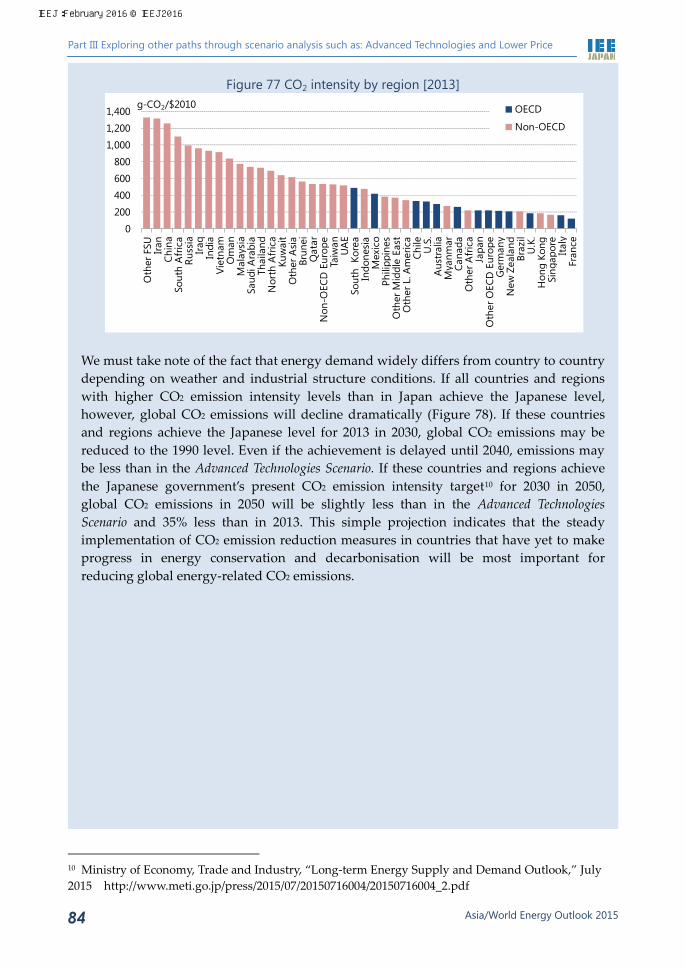
Part III Exploring other paths through scenario analysis such as: Advanced Technologies and Lower Price
Asia/World Energy Outlook 2015 84
Figure 77 CO2 intensity by region [2013]
We must take note of the fact that energy demand widely differs from country to country depending on weather and industrial structure conditions. If all countries and regions with higher CO2 emission intensity levels than in Japan achieve the Japanese level, however, global CO2 emissions will decline dramatically (Figure 78). If these countries and regions achieve the Japanese level for 2013 in 2030, global CO2 emissions may be reduced to the 1990 level. Even if the achievement is delayed until 2040, emissions may be less than in the Advanced Technologies Scenario. If these countries and regions achieve the Japanese government’s present CO2 emission intensity target10 for 2030 in 2050, global CO2 emissions in 2050 will be slightly less than in the Advanced Technologies Scenario and 35% less than in 2013. This simple projection indicates that the steady implementation of CO2 emission reduction measures in countries that have yet to make progress in energy conservation and decarbonisation will be most important for reducing global energy-related CO2 emissions.
10 Ministry of Economy, Trade and Industry, “Long-term Energy Supply and Demand Outlook,” July 2015 http://www.meti.go.jp/press/2015/07/20150716004/20150716004_2.pdf
0
200
400
600
800
1,000
1,200
1,400
Oth
er F
SU Iran
Chin
aSo
uth
Afr
ica
Russ
iaIra
qIn
dia
Viet
nam
Om
anM
alay
sia
Saud
i Ara
bia
Thai
land
Nor
th A
fric
aKu
wai
tO
ther
Asi
aBr
unei
Qat
arN
on-O
ECD
Eur
ope
Taiw
anU
AE
Sout
h K
orea
Indo
nesi
aM
exic
oPh
ilipp
ines
Oth
er M
iddl
e Ea
stO
ther
L. A
mer
ica
Chile U.S
.A
ustr
alia
Mya
nmar
Cana
daO
ther
Afr
ica
Japa
nO
ther
OEC
D E
urop
eG
erm
any
New
Zea
land
Braz
ilU
.K.
Hon
g Ko
ngSi
ngap
ore
Italy
Fran
ce
OECD
Non-OECD
g-CO2/$2010
IEEJ:February 2016 © IEEJ2016

5. Potential and effects of introducing energy conservation and decarbonisation technologies
Asia/World Energy Outlook 2015 85
Figure 78 Global CO2 emissions in case of achieving Japanese levels
0
5
10
15
20
25
30
35
40
45
50
1990 2000 2013 2020 2030 2040 2050
GtCO2
Reference
Adv. Tech.
Japanese level in 2030
Japanese levelin 2040
Japan's 2030 targetin 2050
IEEJ:February 2016 © IEEJ2016

Part III Exploring other paths through scenario analysis such as: Advanced Technologies and Lower Price
Asia/World Energy Outlook 2015 86
6. Impacts of technological advancements on energy supply and demand
6.1 Major measures
In the Advanced Technologies Scenario, maximum CO2 emission reduction measures will be implemented with their application opportunities and acceptability to society taken into account. Each country will implement aggressive energy conservation and decarbonisation policies contributing to securing stable energy supply, further enhancing climate change measures, and accelerating the development and introduction of innovative technologies globally. Against the backdrop of the introduction of environmental regulations and national targets, the enhancement of technological development and the promotion of international technological cooperation, the demand side will expand the spread of energy conservation equipment and the supply side will further promote renewable and nuclear energies and introduce carbon capture and storage technologies (Figure 79).
Figure 79 Assumptions for the Advanced Technologies Scenario
Energy conservation
Final energy consumption in the Advanced Technologies Scenario will be 1,678 Mtoe less than in the Reference Scenario. The energy savings correspond to the present final energy consumption in North America (the United States and Canada). Of the energy savings, the buildings sector will account for 783 Mtoe, the industry sector for 477 Mtoe and the transport sector for 418 Mtoe (Figure 80). Non-OECD countries will capture more than 50% of industry and transport sector energy savings and 47% of buildings sector savings. Whether or not non-OECD countries would realize their potential energy conservation is key to global
【Demand Side Technology】■ IndustryUnder sectoral and other approaches, best available technologies on industrial processes (for steelmaking, cement, paper-pulp and oil refining) will be deployed globally.■ TransportClean energy vehicles (highly fuel efficient vehicles, hybrid vehicles, plug-in hybrid vehicles, electric vehicles, fuel cell vehicles) will diffuse further.■ BuildingEfficient electric appliances (refrigerators, TVs, etc.), highly efficient water-heating systems (heat pumps, etc.), efficient air conditioning systems and efficient lighting will diffuse further, with heat insulation enhanced.
【Supply Side Technology】■ Renewable EnergyWind power generation, photovoltaic power generation, CSP (Concentrated Solar Power) generation, biomass power generation and bio-fuel will diffuse further.■ Nuclear Energy Promotion Nuclear power plant construction will be accelerated with operating rates improved.■ Highly Efficient Fossil-fired Power Plant TechnologyCoal-fired power plants (USC, IGCC, IGFC) and natural gas MACC (More Advanced Combined Cycle) plants will diffuse further.■ CCSCCS deployment will expand in the power generation sector (new and old coal-fired and gas-fired plants) and the industrial sector (steelmaking, cement and other plants that emit massive GHGs).
Introducing and Enhancing Environmental Regulations and National Targets
Environment Tax, Emissions Trading, RPS, Subsidy Provisions, FIT, Efficiency Standards, Automobile Fuel Efficiency Standard, Low Carbon Fuel Standard, Energy Efficiency Labeling, National Targets, etc.
R&D Investment Expansion, International Cooperation on Energy Efficient Technology (steelmaking, cement and other areas), Support for Establishing Energy Efficiency Standards, etc.
Promoting Technology Development and International Technology Cooperation
IEEJ:February 2016 © IEEJ2016
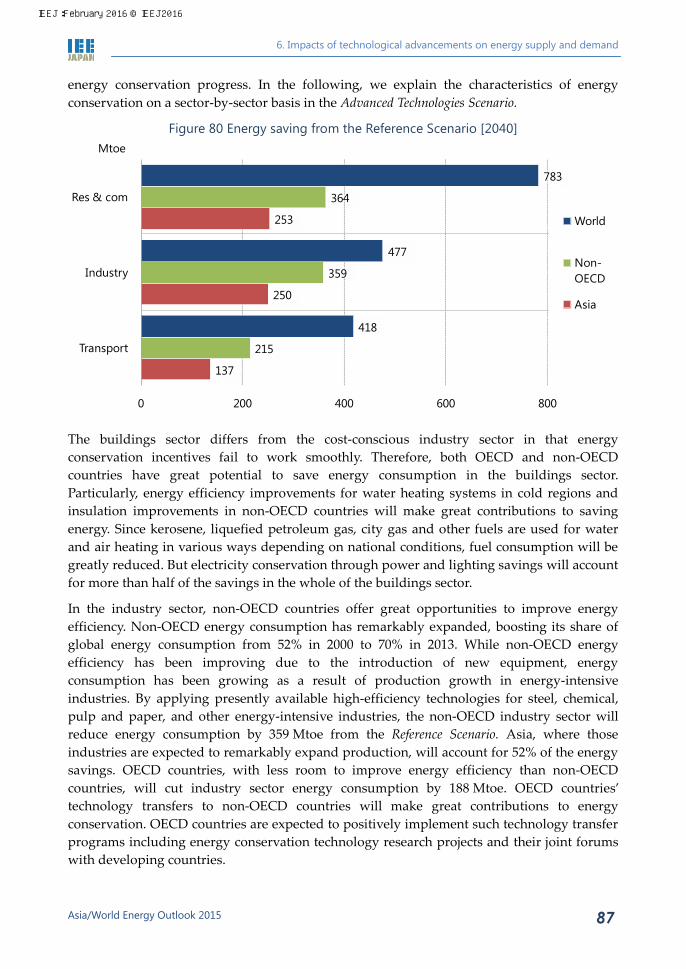
6. Impacts of technological advancements on energy supply and demand
Asia/World Energy Outlook 2015 87
energy conservation progress. In the following, we explain the characteristics of energy conservation on a sector-by-sector basis in the Advanced Technologies Scenario.
Figure 80 Energy saving from the Reference Scenario [2040]
The buildings sector differs from the cost-conscious industry sector in that energy conservation incentives fail to work smoothly. Therefore, both OECD and non-OECD countries have great potential to save energy consumption in the buildings sector. Particularly, energy efficiency improvements for water heating systems in cold regions and insulation improvements in non-OECD countries will make great contributions to saving energy. Since kerosene, liquefied petroleum gas, city gas and other fuels are used for water and air heating in various ways depending on national conditions, fuel consumption will be greatly reduced. But electricity conservation through power and lighting savings will account for more than half of the savings in the whole of the buildings sector.
In the industry sector, non-OECD countries offer great opportunities to improve energy efficiency. Non-OECD energy consumption has remarkably expanded, boosting its share of global energy consumption from 52% in 2000 to 70% in 2013. While non-OECD energy efficiency has been improving due to the introduction of new equipment, energy consumption has been growing as a result of production growth in energy-intensive industries. By applying presently available high-efficiency technologies for steel, chemical, pulp and paper, and other energy-intensive industries, the non-OECD industry sector will reduce energy consumption by 359 Mtoe from the Reference Scenario. Asia, where those industries are expected to remarkably expand production, will account for 52% of the energy savings. OECD countries, with less room to improve energy efficiency than non-OECD countries, will cut industry sector energy consumption by 188 Mtoe. OECD countries’ technology transfers to non-OECD countries will make great contributions to energy conservation. OECD countries are expected to positively implement such technology transfer programs including energy conservation technology research projects and their joint forums with developing countries.
137
250
253
215
359
364
418
477
783
0 200 400 600 800
Transport
Industry
Res & com
World
Non-OECD
Asia
Mtoe
IEEJ:February 2016 © IEEJ2016

Part III Exploring other paths through scenario analysis such as: Advanced Technologies and Lower Price
Asia/World Energy Outlook 2015 88
In the transport sector, fuel efficiency and vehicle fleet mix improvements will make further progress. The global average new vehicle gas mileage in 2040 will improve by 6.6 km/L (1.4 L/100 km) from the Reference Scenario to 25.6 km/L (3.9 L/100 km) and the average stock mileage by 3.4 km/L (1.5 L/100 km) to 16.7 km/L (6.0 L/100 km) (Figure 81). Developed countries are expected to introduce and spread next-generation vehicles including plug-in hybrid, electric as well as fuel cell vehicles. The next-generation vehicles' auto fleet share will increase faster in developed countries. Non-OECD countries' share of 418 Mtoe in energy savings in the transport sector from the Reference Scenario will be limited to 51%, smaller than in the industry sector.
Figure 81 Improvements in fuel efficiencies
Sales Stock
Renewable energy
In the Advanced Technologies Scenario, all renewables ranging from hydro to biomass will increase their share of primary energy consumption from 14% in 2013 to 21% in 2040, 5 percentage points higher than in the Reference Scenario. Driving the renewable energy share expansion will be wind and solar photovoltaics.
The introduction of onshore wind power generation will accelerate mainly in emerging and developing countries as well as in the United States, as power plant costs are further reduced and electricity transmission and distribution infrastructure is further developed. Offshore wind power generation, on the other hand, will expand mainly in Europe as construction, operation and management, and grid connection costs are reduced (Figure 82). Global installed wind power generation capacity in 2040 in the Advanced Technologies Scenario will reach 1,579 GW, about 1.6 times as much as in the Reference Scenario.
Solar PV power generation will spread further in emerging and developing countries thanks to lower system costs. Solar PV generation will significantly grow in the Sun Belt (rich with sunlight resources) including China, India, the Middle East, North Africa and Latin America.
14.3
19.0
25.6
0
5
10
15
20
25
30
Ref. Adv. Tech.
2010 2040
km/L
35% up
9.5
13.3
16.7
0
5
10
15
20
Ref. Adv. Tech.
2010 2040
km/L25% up
IEEJ:February 2016 © IEEJ2016

6. Impacts of technological advancements on energy supply and demand
Asia/World Energy Outlook 2015 89
In developed countries, lower solar cell prices will be combined with the commercialization of low-cost small storage cells to accelerate the spread of household PV generation. Global installed solar PV generation capacity in 2040 will be 1,381 GW, 1.8 times as large as in the Reference Scenario.
Factors for accelerating the spread of wind, solar PV and other intermittent electricity sources include the reduction of construction and system costs, particularly in developing countries where low-cost financing is a major factor. Technologies in output control, generation prediction and storage, combined with network expansion will play major roles in support of these intermittent electricity sources. Smart grid systems combining these technologies will greatly enhance grid stabilization.
Figure 82 Wind and solar PV power generating capacities by region [Advanced Technologies Scenario]
Nuclear
In the Advanced Technologies Scenario, nuclear energy’s share of primary energy consumption will rise from 4.8% in 2013 to 10% in 2040, 4 percentage points higher than in the Reference Scenario. Installed nuclear power generation capacity will increase from 386 GW in 2014 to 868 GW in 2040, 1.4 times as much as in the Reference Scenario at 610 GW.
69 133257
394
57 127 234117172
208239
79163
253326
91
200
346
494
97
192
293
25
83
202
311
19
82
176
383
318
630
1,096
1,579
137
428
823
1,381
0
500
1,000
1,500
2013 2020 2030 2040 2013 2020 2030 2040
Wind Solar PV
GW
Other Asia
China
Others
EU
N. America
IEEJ:February 2016 © IEEJ2016
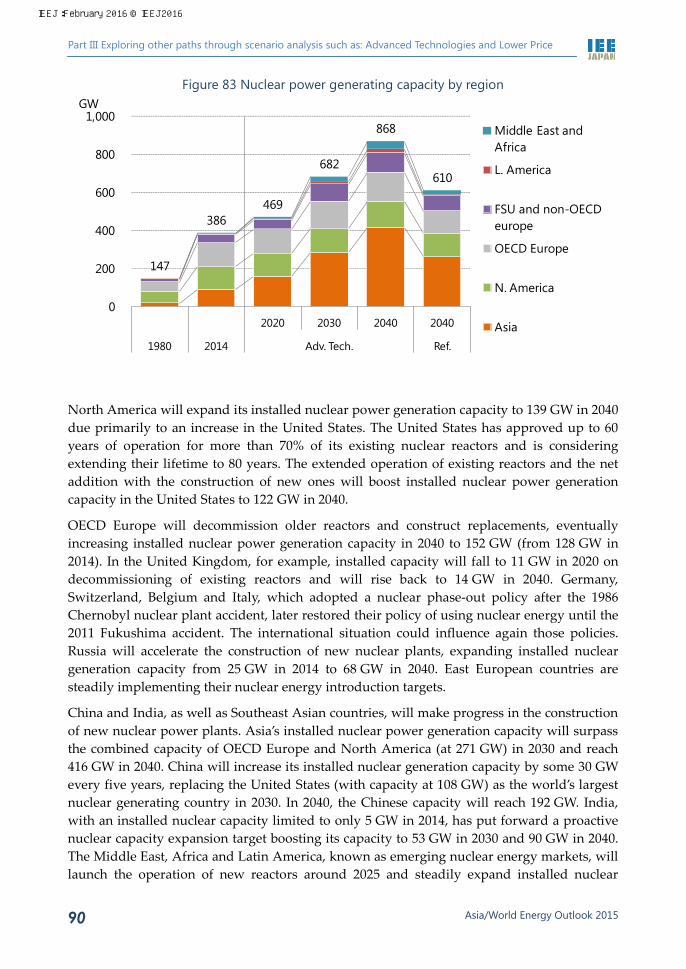
Part III Exploring other paths through scenario analysis such as: Advanced Technologies and Lower Price
Asia/World Energy Outlook 2015 90
Figure 83 Nuclear power generating capacity by region
North America will expand its installed nuclear power generation capacity to 139 GW in 2040 due primarily to an increase in the United States. The United States has approved up to 60 years of operation for more than 70% of its existing nuclear reactors and is considering extending their lifetime to 80 years. The extended operation of existing reactors and the net addition with the construction of new ones will boost installed nuclear power generation capacity in the United States to 122 GW in 2040.
OECD Europe will decommission older reactors and construct replacements, eventually increasing installed nuclear power generation capacity in 2040 to 152 GW (from 128 GW in 2014). In the United Kingdom, for example, installed capacity will fall to 11 GW in 2020 on decommissioning of existing reactors and will rise back to 14 GW in 2040. Germany, Switzerland, Belgium and Italy, which adopted a nuclear phase-out policy after the 1986 Chernobyl nuclear plant accident, later restored their policy of using nuclear energy until the 2011 Fukushima accident. The international situation could influence again those policies. Russia will accelerate the construction of new nuclear plants, expanding installed nuclear generation capacity from 25 GW in 2014 to 68 GW in 2040. East European countries are steadily implementing their nuclear energy introduction targets.
China and India, as well as Southeast Asian countries, will make progress in the construction of new nuclear power plants. Asia’s installed nuclear power generation capacity will surpass the combined capacity of OECD Europe and North America (at 271 GW) in 2030 and reach 416 GW in 2040. China will increase its installed nuclear generation capacity by some 30 GW every five years, replacing the United States (with capacity at 108 GW) as the world’s largest nuclear generating country in 2030. In 2040, the Chinese capacity will reach 192 GW. India, with an installed nuclear capacity limited to only 5 GW in 2014, has put forward a proactive nuclear capacity expansion target boosting its capacity to 53 GW in 2030 and 90 GW in 2040. The Middle East, Africa and Latin America, known as emerging nuclear energy markets, will launch the operation of new reactors around 2025 and steadily expand installed nuclear
147
386469
682
868
610
0
200
400
600
800
1,000
2020 2030 2040 2040
1980 2014 Adv. Tech. Ref.
GW
Middle East and Africa
L. America
FSU and non-OECD europe
OECD Europe
N. America
Asia
IEEJ:February 2016 © IEEJ2016
6. Impacts of technological advancements on energy supply and demand
Asia/World Energy Outlook 2015 91
capacity thereafter. In the Middle East where the United Arab Emirates, Saudi Arabia and other countries are planning to build nuclear power plants, installed nuclear capacity will reach 19 GW in 2030 and 28 GW in 2040.
Great expectations are placed on the introduction of nuclear power generation as a decarbonisation measure. Emerging countries are considering introducing nuclear power generation to meet the rapid growth in domestic electricity demand and promote decarbonisation. The United States, France, Russia and Korea, which have traditionally and proactively promoted nuclear power generation, will extend the lifetime of existing nuclear reactors and build new ones to increase their respective capacities. Germany, Switzerland, Belgium and Italy clarified their nuclear phase-out policy in response to the Fukushima Daiichi nuclear power station accident but could change the policy of phasing-out their nuclear power plant, maintain the present installed capacity or reconsider frozen nuclear plant construction projects.
CO2 capture and storage
Carbon dioxide capture and storage (CCS) technology is an important decarbonisation technology to substantially reduce emissions of CO2 in the atmosphere while the world remains highly dependent on fossil fuels in the future. CCS technology is expected to develop in large CO2 emission sources such as the power generation and industry sectors. According to the Global CCS Institute (GCCSI), 55 large-scale CCS projects are underway in the world including North America, China and the United Kingdom. CO2 capture through ongoing CCS projects is estimated at about 27 Mt per year. Japan’s Strategic Energy Plan calls for research and development to commercialize CCS technologies around 2020. Consequently, a CCS demonstration test at an oil refinery in Tomakomai is underway, planning to store 100,000 tonnes of CO2 per year under pressure into undersea aquifers during the period FY2016 to FY2018.
CCS technology will be used at new fossil fuel power plants, and steelmaking and other industrial processes in line with the enhancement of climate change measures11. CO2 to be captured and stored will increase at a higher pace than at present, reaching 3.6 Gt in 2040 and 7.2 Gt in 2050 (Figure 84). The power generation sector will account for the largest share of CCS.
11 We assumed that the power generation sector will install CCS equipment at new coal and natural gas power plants to be built from 2030. As for the industry sector where steel and cement manufacturers are expected to introduce CCS equipment, we projected CCS introduction based on crude steel and cement production.
IEEJ:February 2016 © IEEJ2016

Part III Exploring other paths through scenario analysis such as: Advanced Technologies and Lower Price
Asia/World Energy Outlook 2015 92
Figure 84 CO2 emissions reduction by CCS [Advanced Technologies Scenario]
6.2 Energy supply and demand
Primary energy consumption
The strong implementation of the abovementioned energy conservation and climate change measures will substantially reduce primary energy consumption (Figure 85). Primary energy consumption in 2040 in the Advanced Technologies Scenario will total 16,396 Mtoe, down 2,567 Mtoe from the Reference Scenario. The gap corresponds to the present primary energy consumption in North America. Accumulated energy savings through 2040 will total about 34 Gtoe, 2.5 times as much as global primary energy consumption in 2013. In the Advanced Technologies Scenario, non-OECD and Asian countries, projected to expand energy demand while offering huge energy conservation potential, will play a great role. Non-OECD countries will account for 61% of global energy conservation in 2040 and Asian countries for 45%. Non-OECD and Asian countries hold the key to reforming the broadly defined global energy system, including consumption and production ways for energy sources required by the world. They influence the global environment.
0
2,000
4,000
6,000
8,000
2040 2050
Industry
Power generation
Mt-CO2/yr
IEEJ:February 2016 © IEEJ2016

6. Impacts of technological advancements on energy supply and demand
Asia/World Energy Outlook 2015 93
Figure 85 Primary energy saving by region
Among energy sources, fossil fuels will feature great primary energy consumption savings (Figure 86). Of the 2,567 Mtoe decline in primary energy consumption from the Reference Scenario in 2040, coal will account for 1,472 Mtoe, natural gas for 1,076 Mtoe and oil for 839 Mtoe. Meanwhile, nuclear and renewable energy will accelerate their penetration. Nuclear energy consumption in the Advanced Technologies Scenario will be 471 Mtoe (including 292 Mtoe in Asia) more than in the Reference Scenario. Renewable energy consumption excluding hydro will be 341 Mtoe (including 175 Mtoe in Asia) more. As a result, fossil fuels’ share of primary energy consumption in the Advanced Technologies Scenario will fall from 81% in 2013 to 70% in 2040.
Figure 86 Changes in primary energy consumption from the Reference Scenario
10,057
15,207
17,211
18,963
14,615
15,70216,396
10,000
12,000
14,000
16,000
18,000
20,000
2000 2013 2020 2030 2040
MtoeOther asia
China
Middle East/North AfricaOthers
EU
U.S.
Ref.
Adv. Tech.
-1,500
-1,000
-500
0
500
2020
2030
2040
2020
2030
2040
2020
2030
2040
2020
2030
2040
2020
2030
2040
2020
2030
2040
Coal Oil Natural gas Nuclear Hydro Other renewables
Mtoe
WorldAsia
IEEJ:February 2016 © IEEJ2016
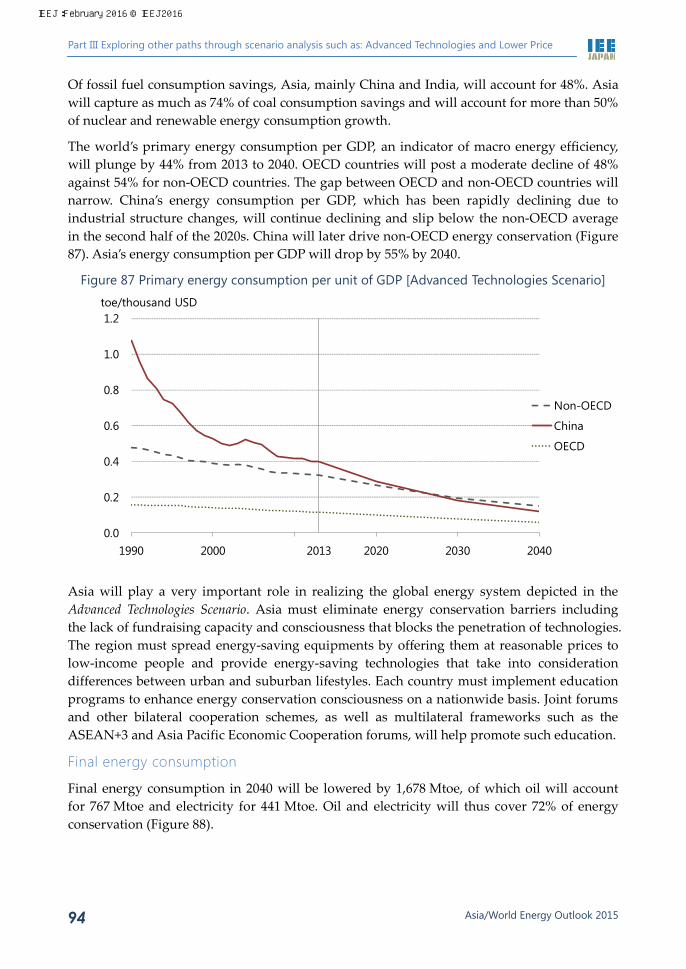
Part III Exploring other paths through scenario analysis such as: Advanced Technologies and Lower Price
Asia/World Energy Outlook 2015 94
Of fossil fuel consumption savings, Asia, mainly China and India, will account for 48%. Asia will capture as much as 74% of coal consumption savings and will account for more than 50% of nuclear and renewable energy consumption growth.
The world’s primary energy consumption per GDP, an indicator of macro energy efficiency, will plunge by 44% from 2013 to 2040. OECD countries will post a moderate decline of 48% against 54% for non-OECD countries. The gap between OECD and non-OECD countries will narrow. China’s energy consumption per GDP, which has been rapidly declining due to industrial structure changes, will continue declining and slip below the non-OECD average in the second half of the 2020s. China will later drive non-OECD energy conservation (Figure 87). Asia’s energy consumption per GDP will drop by 55% by 2040.
Figure 87 Primary energy consumption per unit of GDP [Advanced Technologies Scenario]
Asia will play a very important role in realizing the global energy system depicted in the Advanced Technologies Scenario. Asia must eliminate energy conservation barriers including the lack of fundraising capacity and consciousness that blocks the penetration of technologies. The region must spread energy-saving equipments by offering them at reasonable prices to low-income people and provide energy-saving technologies that take into consideration differences between urban and suburban lifestyles. Each country must implement education programs to enhance energy conservation consciousness on a nationwide basis. Joint forums and other bilateral cooperation schemes, as well as multilateral frameworks such as the ASEAN+3 and Asia Pacific Economic Cooperation forums, will help promote such education.
Final energy consumption
Final energy consumption in 2040 will be lowered by 1,678 Mtoe, of which oil will account for 767 Mtoe and electricity for 441 Mtoe. Oil and electricity will thus cover 72% of energy conservation (Figure 88).
0.0
0.2
0.4
0.6
0.8
1.0
1.2
1990 2000 2013 2020 2030 2040
toe/thousand USD
Non-OECD
China
OECD
IEEJ:February 2016 © IEEJ2016

6. Impacts of technological advancements on energy supply and demand
Asia/World Energy Outlook 2015 95
Figure 88 Change in final energy consumption from the Reference Scenario
With regard to oil consumption savings, energy conservation progress mainly in the transport sector will make great contributions. In the Advanced Technologies Scenario, oil’s share of energy consumption in the road sector will decline from 95% in 2013 to 79% in 2040 (Figure 89). As natural gas, electric, fuel cell and other next-generation vehicles spread further, the share for natural gas, electricity, biofuels and hydrogen will reach 21% in 2040.
Figure 89 Energy consumption share (Road sector, World)
Electricity demand growth will capture the greatest share of energy consumption changes from the Reference Scenario in the road sector. In the Advanced Technologies Scenario, electric vehicles will spread along with information technologies for traffic demand management to ease congestion and increase distribution efficiency.
-800
-600
-400
-200
020
20
2030
2040
2020
2030
2040
2020
2030
2040
2020
2030
2040
2020
2030
2040
2020
2030
2040
Coal Oil Natural gas Electricity Heat Renewables
Mtoe
WorldAsia
95%
91%
79%
3%
6% 6%
3%
5%
10%
0% 20% 40% 60% 80% 100%
Reference
Adv. Tech.
2013
20
40
Oil Natural gas Electricity Biofuel, hydrogen, etc.
IEEJ:February 2016 © IEEJ2016

Part III Exploring other paths through scenario analysis such as: Advanced Technologies and Lower Price
Asia/World Energy Outlook 2015 96
Figure 90 Changes in road sector energy consumption from the Reference Scenario [World, 2040]
Final electricity consumption will be reduced by 441 Mtoe, lowering required power generation by 502 Mtoe. The electricity savings will be coupled with power generation efficiency improvement to save primary energy consumption by 1,177 Mtoe (Figure 91). The savings are equivalent to 46% of total primary energy consumption savings. Making great contributions to the savings will be Asia. Through the introduction of new power generation equipment and the replacement of outdated equipment, Asian emerging countries’ power generation efficiency will improve to almost the same levels as in developed countries by 2040.
Figure 91 Primary energy reduction by electricity demand saving [Advanced Technologies Scenario, 2040]
-322
18
60
52
-331
24
48
47
-700 -600 -500 -400 -300 -200 -100 0 100
Oil
Natural gas
Electricity
Biofuel, hydrogen, etc.
Mtoe
OECD
Non-OECD
831
964
2,012
1,619
1,933
4,287
1,236
1,433
3,291
188
198
425
253
304
752
204
247
612
0 1,000 2,000 3,000 4,000 5,000
Consumption
Generation
Fuel input for generation
Consumption
Generation
Fuel input for generation
Consumption
Generation
Fuel input for generation
OEC
DN
on-O
ECD
Asi
a
Mtoe
Adv. Tech.
Saving from the Reference Scenario
IEEJ:February 2016 © IEEJ2016

6. Impacts of technological advancements on energy supply and demand
Asia/World Energy Outlook 2015 97
Developed countries should cooperate with Asian emerging countries in improving the latter’s power generation efficiency. Emerging countries frequently fail to take into account environmental conservation while giving top priority to high economic growth. For example, efforts to address and solve air pollution problems caused by the industry are likely to suppress economic growth. Therefore, developed countries’ cooperation with emerging countries will grow even more important.
Asia will also make great contributions to reducing final coal consumption, accounting for some 80% of the global coal consumption reduction in 2040. In this respect, steelmakers’ energy conservation will be important in India and other countries where crude steel production will expand rapidly. Japan’s energy consumption per unit of steel production is one of the lowest levels in the world, standing at less than one-third of India’s. If highly efficient technologies are transferred from Japan and other developed countries to India and other Asian emerging countries, relevant sectors’ energy consumption savings will become more feasible. Developed countries will contribute to energy savings not only in energy-saving equipment and other hardware but also in software including equipment operations.
Electricity generation mix
In the Advanced Technologies Scenario, final energy consumption savings will work to cut electricity generation by about 5,839 TWh, about six times as much as Japan’s electricity generation. In this scenario, the integrated gasification combined cycle (IGCC) for coal-fired electricity generation and the development of technology for mixing coal with biomass energy will contribute to cutting coal consumption for electricity generation (Figure 92). Natural gas, nuclear energy and renewables will increase their presence in electricity generation while coal will diminish.
Figure 92 Global power generation by source [Advanced Technologies Scenario]
Note: Dashed lines represent the Reference Scenario
0
5,000
10,000
15,000
2000 2013 2020 2030 2040
TWh
Coal
Natural gas
Other renewablesNuclear
Hydro
Oil
IEEJ:February 2016 © IEEJ2016
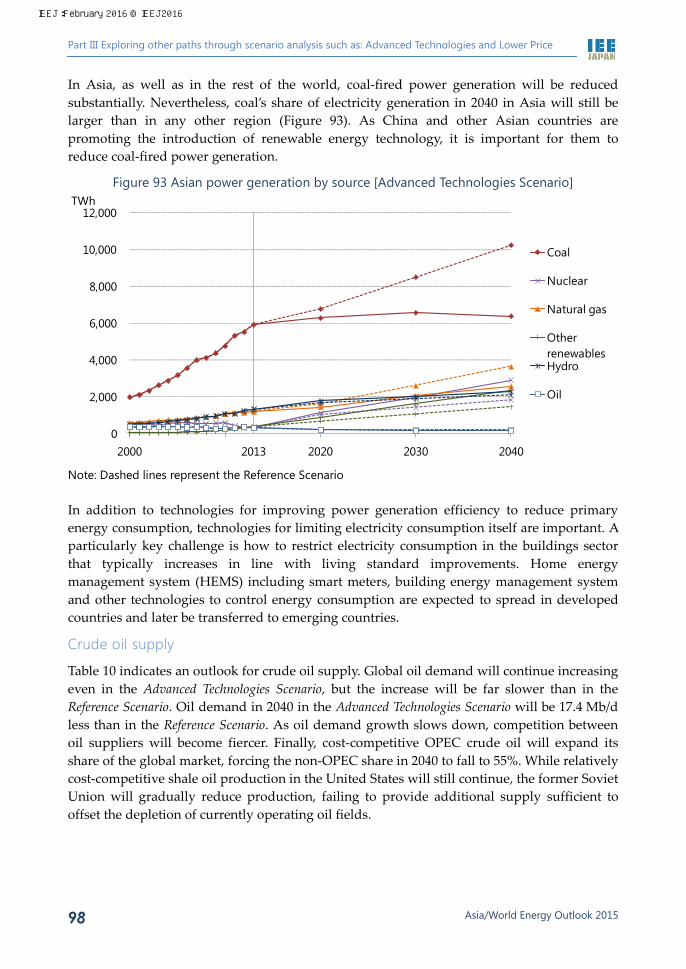
Part III Exploring other paths through scenario analysis such as: Advanced Technologies and Lower Price
Asia/World Energy Outlook 2015 98
In Asia, as well as in the rest of the world, coal-fired power generation will be reduced substantially. Nevertheless, coal’s share of electricity generation in 2040 in Asia will still be larger than in any other region (Figure 93). As China and other Asian countries are promoting the introduction of renewable energy technology, it is important for them to reduce coal-fired power generation.
Figure 93 Asian power generation by source [Advanced Technologies Scenario]
Note: Dashed lines represent the Reference Scenario In addition to technologies for improving power generation efficiency to reduce primary energy consumption, technologies for limiting electricity consumption itself are important. A particularly key challenge is how to restrict electricity consumption in the buildings sector that typically increases in line with living standard improvements. Home energy management system (HEMS) including smart meters, building energy management system and other technologies to control energy consumption are expected to spread in developed countries and later be transferred to emerging countries.
Crude oil supply
Table 10 indicates an outlook for crude oil supply. Global oil demand will continue increasing even in the Advanced Technologies Scenario, but the increase will be far slower than in the Reference Scenario. Oil demand in 2040 in the Advanced Technologies Scenario will be 17.4 Mb/d less than in the Reference Scenario. As oil demand growth slows down, competition between oil suppliers will become fiercer. Finally, cost-competitive OPEC crude oil will expand its share of the global market, forcing the non-OPEC share in 2040 to fall to 55%. While relatively cost-competitive shale oil production in the United States will still continue, the former Soviet Union will gradually reduce production, failing to provide additional supply sufficient to offset the depletion of currently operating oil fields.
0
2,000
4,000
6,000
8,000
10,000
12,000
2000 2013 2020 2030 2040
TWh
Coal
Nuclear
Natural gas
Other renewablesHydro
Oil
IEEJ:February 2016 © IEEJ2016
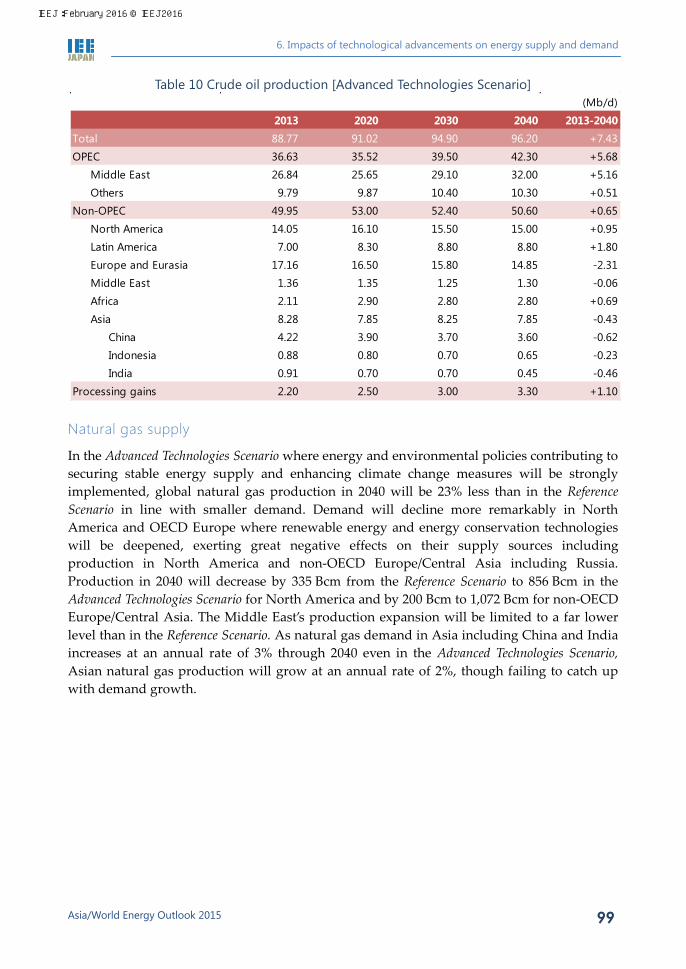
6. Impacts of technological advancements on energy supply and demand
Asia/World Energy Outlook 2015 99
Table 10 Crude oil production [Advanced Technologies Scenario]
Natural gas supply
In the Advanced Technologies Scenario where energy and environmental policies contributing to securing stable energy supply and enhancing climate change measures will be strongly implemented, global natural gas production in 2040 will be 23% less than in the Reference Scenario in line with smaller demand. Demand will decline more remarkably in North America and OECD Europe where renewable energy and energy conservation technologies will be deepened, exerting great negative effects on their supply sources including production in North America and non-OECD Europe/Central Asia including Russia. Production in 2040 will decrease by 335 Bcm from the Reference Scenario to 856 Bcm in the Advanced Technologies Scenario for North America and by 200 Bcm to 1,072 Bcm for non-OECD Europe/Central Asia. The Middle East’s production expansion will be limited to a far lower level than in the Reference Scenario. As natural gas demand in Asia including China and India increases at an annual rate of 3% through 2040 even in the Advanced Technologies Scenario, Asian natural gas production will grow at an annual rate of 2%, though failing to catch up with demand growth.
(Mb/d)2013 2020 2030 2040 2013-2040
Total 88.77 91.02 94.90 96.20 +7.43OPEC 36.63 35.52 39.50 42.30 +5.68
Middle East 26.84 25.65 29.10 32.00 +5.16Others 9.79 9.87 10.40 10.30 +0.51
Non-OPEC 49.95 53.00 52.40 50.60 +0.65North America 14.05 16.10 15.50 15.00 +0.95Latin America 7.00 8.30 8.80 8.80 +1.80Europe and Eurasia 17.16 16.50 15.80 14.85 -2.31Middle East 1.36 1.35 1.25 1.30 -0.06Africa 2.11 2.90 2.80 2.80 +0.69Asia 8.28 7.85 8.25 7.85 -0.43
China 4.22 3.90 3.70 3.60 -0.62Indonesia 0.88 0.80 0.70 0.65 -0.23India 0.91 0.70 0.70 0.45 -0.46
Processing gains 2.20 2.50 3.00 3.30 +1.10
IEEJ:February 2016 © IEEJ2016
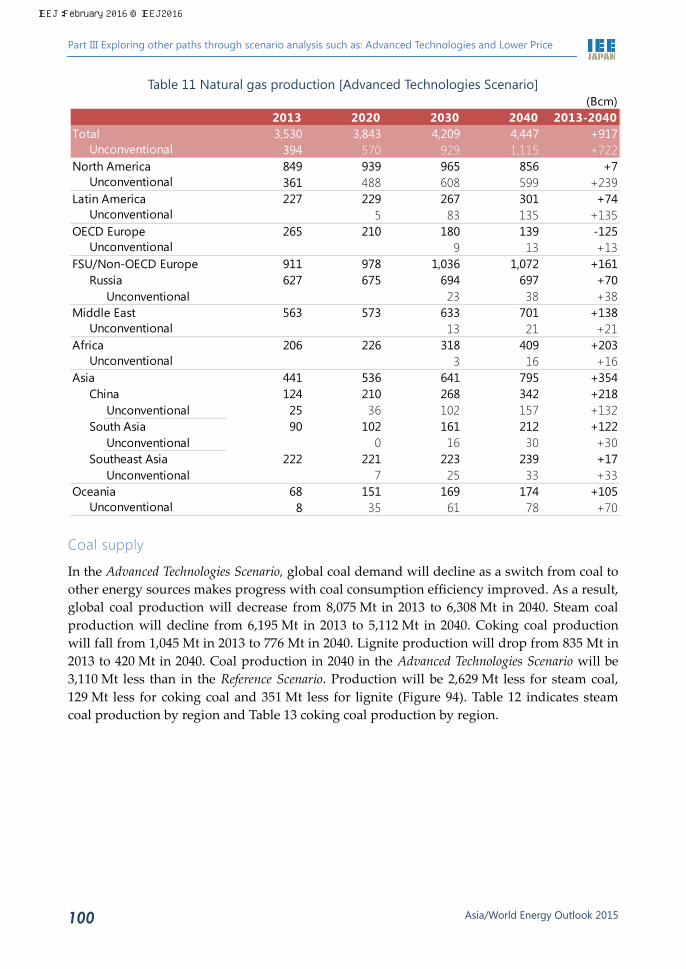
Part III Exploring other paths through scenario analysis such as: Advanced Technologies and Lower Price
Asia/World Energy Outlook 2015 100
Table 11 Natural gas production [Advanced Technologies Scenario]
Coal supply
In the Advanced Technologies Scenario, global coal demand will decline as a switch from coal to other energy sources makes progress with coal consumption efficiency improved. As a result, global coal production will decrease from 8,075 Mt in 2013 to 6,308 Mt in 2040. Steam coal production will decline from 6,195 Mt in 2013 to 5,112 Mt in 2040. Coking coal production will fall from 1,045 Mt in 2013 to 776 Mt in 2040. Lignite production will drop from 835 Mt in 2013 to 420 Mt in 2040. Coal production in 2040 in the Advanced Technologies Scenario will be 3,110 Mt less than in the Reference Scenario. Production will be 2,629 Mt less for steam coal, 129 Mt less for coking coal and 351 Mt less for lignite (Figure 94). Table 12 indicates steam coal production by region and Table 13 coking coal production by region.
(Bcm)2013 2020 2030 2040 2013-2040
Total 3,530 3,843 4,209 4,447 +917394 570 929 1,115 +722
North America 849 939 965 856 +7361 488 608 599 +239
Latin America 227 229 267 301 +745 83 135 +135
OECD Europe 265 210 180 139 -1259 13 +13
FSU/Non-OECD Europe 911 978 1,036 1,072 +161Russia 627 675 694 697 +70
Unconventional 23 38 +38Middle East 563 573 633 701 +138
13 21 +21Africa 206 226 318 409 +203
3 16 +16Asia 441 536 641 795 +354
China 124 210 268 342 +218Unconventional 25 36 102 157 +132
South Asia 90 102 161 212 +122Unconventional 0 16 30 +30
Southeast Asia 222 221 223 239 +17Unconventional 7 25 33 +33
Oceania 68 151 169 174 +1058 35 61 78 +70
Unconventional
Unconventional
Unconventional
Unconventional
Unconventional
Unconventional
Unconventional
IEEJ:February 2016 © IEEJ2016

6. Impacts of technological advancements on energy supply and demand
Asia/World Energy Outlook 2015 101
Figure 94 Coal production by type [Advanced Technologies Scenario]
Table 12 Steam coal production [Advanced Technologies Scenario]
1,118 844 835 710 531 420
600 477 1,045 960 845 776
2,928 3,316
6,195 6,1705,727
5,112
4,645 4,637
8,075 7,8407,104
6,308
0
2,000
4,000
6,000
8,000
10,000
1990 2000 2013 2020 2030 2040
Mt
Steam coal
Coking coal
Lignite
(Mt)2013 2020 2030 2040 2013-2040
World 6,195 6,170 5,727 5,112 -1,082North America 782 641 435 232 -550
United States 756 622 425 227 -529Latin America 104 105 94 86 -18
Columbia 81 80 66 55 -26OECD Europe 94 82 56 37 -57FSU/Non-OECD Europe 335 326 273 242 -93
Russia 179 186 161 136 -42Middle East 0 0 0 0 0Africa 261 303 316 333 +72
South Africa 253 289 296 306 +53Asia 4,381 4,419 4,251 3,881 -500
China 3,282 3,269 3,009 2,478 -804India 516 632 682 792 +276Indonesia 484 420 441 464 -20
Oceania 239 293 302 303 +64Australia 237 292 300 301 +64
IEEJ:February 2016 © IEEJ2016

Part III Exploring other paths through scenario analysis such as: Advanced Technologies and Lower Price
Asia/World Energy Outlook 2015 102
Table 13 Coking coal production [Advanced Technologies Scenario]
(Mt)2013 2020 2030 2040 2013-2040
World 1,045 960 845 776 -270North America 112 101 98 93 -19
United States 78 75 73 70 -7Latin America 5 4 4 4 -1
Columbia 4 4 4 4 -0OECD Europe 22 20 17 15 -7FSU/Non-OECD Europe 106 101 99 95 -11
Russia 74 67 67 66 -8Middle East 1 1 1 1 0Africa 7 12 13 17 +10
Mozambique 3 9 11 15 +11Asia 629 570 468 409 -220
China 562 495 392 329 -232India 50 59 60 65 +15Mongolia 15 12 11 9 -7
Oceania 162 150 146 141 -21Australia 159 148 144 140 -20
IEEJ:February 2016 © IEEJ2016

7. Impacts of low oil prices caused by loose supply-demand balance
Asia/World Energy Outlook 2015 103
7. Impacts of low oil prices caused by loose supply-demand balance
7.1 Position of Lower Price Scenario
In the Lower Price Scenario, the oil supply-demand balance is assumed to ease substantially. The implementation of energy and environmental measures contributing to securing stable energy supply and enhancing climate change measures stimulates the development of unconventional oil and gas resources on the supply side. The same measures will restrict fossil fuel consumption on the demand side. Real crude oil prices in 2030 are assumed to rise back to $75/bbl in the Lower Price Scenario against $100/bbl in the Reference Scenario.
In this chapter, we focus the analysis on 2030.
7.2 Energy demand
Primary energy consumption
In the Lower Price Scenario, the world energy supply required in 2030 will be limited to 16,048 Mtoe (Figure 95), 1,163 Mtoe less than in the Reference Scenario. As noted above, the effects of energy conservation to be promoted strongly will outdo those of global economic expansion or rebound to be caused by energy price declines. Fuel switching will also affect fossil fuel consumption. Of the energy supply, oil and natural gas will account for 4,689 Mtoe and 3,635 Mtoe, respectively. The Reference Scenario increase will be reduced by half for oil and one third for natural gas.
Figure 95 Global primary energy consumption [Lower Price Scenario, 2030]
0
5,000
10,000
15,000
Lower Price Reference
2000 2013 2030
Mto
e
Natural gas
Oil
Coal
Other renewables
Nuclear
Hydro
IEEJ:February 2016 © IEEJ2016
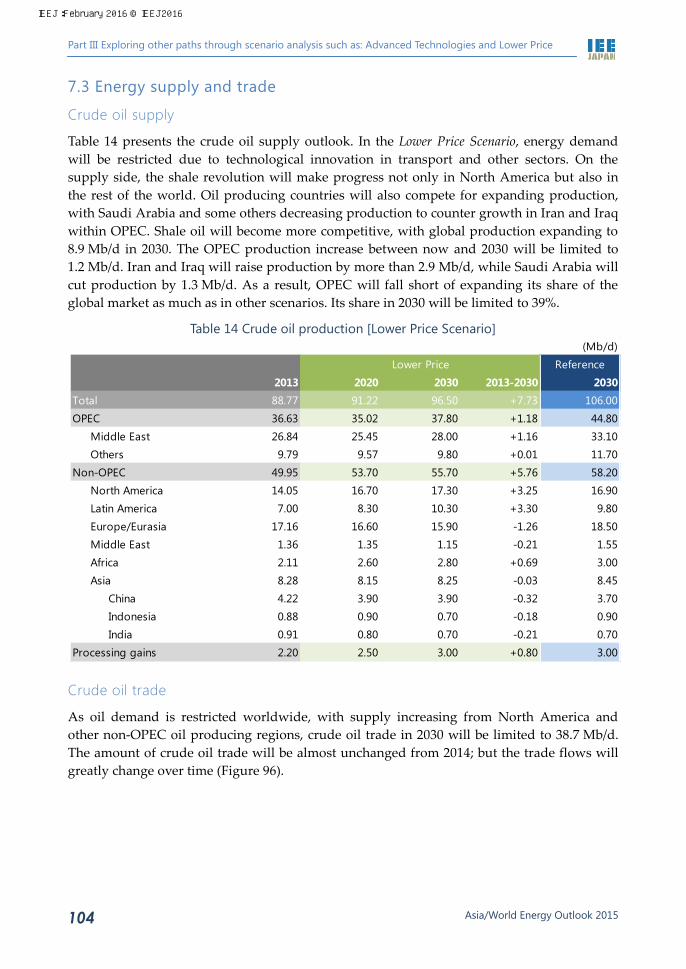
Part III Exploring other paths through scenario analysis such as: Advanced Technologies and Lower Price
Asia/World Energy Outlook 2015 104
7.3 Energy supply and trade
Crude oil supply
Table 14 presents the crude oil supply outlook. In the Lower Price Scenario, energy demand will be restricted due to technological innovation in transport and other sectors. On the supply side, the shale revolution will make progress not only in North America but also in the rest of the world. Oil producing countries will also compete for expanding production, with Saudi Arabia and some others decreasing production to counter growth in Iran and Iraq within OPEC. Shale oil will become more competitive, with global production expanding to 8.9 Mb/d in 2030. The OPEC production increase between now and 2030 will be limited to 1.2 Mb/d. Iran and Iraq will raise production by more than 2.9 Mb/d, while Saudi Arabia will cut production by 1.3 Mb/d. As a result, OPEC will fall short of expanding its share of the global market as much as in other scenarios. Its share in 2030 will be limited to 39%.
Table 14 Crude oil production [Lower Price Scenario]
Crude oil trade
As oil demand is restricted worldwide, with supply increasing from North America and other non-OPEC oil producing regions, crude oil trade in 2030 will be limited to 38.7 Mb/d. The amount of crude oil trade will be almost unchanged from 2014; but the trade flows will greatly change over time (Figure 96).
(Mb/d)Lower Price Reference
2013 2020 2030 2013-2030 2030Total 88.77 91.22 96.50 +7.73 106.00OPEC 36.63 35.02 37.80 +1.18 44.80
Middle East 26.84 25.45 28.00 +1.16 33.10Others 9.79 9.57 9.80 +0.01 11.70
Non-OPEC 49.95 53.70 55.70 +5.76 58.20North America 14.05 16.70 17.30 +3.25 16.90Latin America 7.00 8.30 10.30 +3.30 9.80Europe/Eurasia 17.16 16.60 15.90 -1.26 18.50Middle East 1.36 1.35 1.15 -0.21 1.55Africa 2.11 2.60 2.80 +0.69 3.00Asia 8.28 8.15 8.25 -0.03 8.45
China 4.22 3.90 3.90 -0.32 3.70Indonesia 0.88 0.90 0.70 -0.18 0.90India 0.91 0.80 0.70 -0.21 0.70
Processing gains 2.20 2.50 3.00 +0.80 3.00
IEEJ:February 2016 © IEEJ2016

7. Impacts of low oil prices caused by loose supply-demand balance
Asia/World Energy Outlook 2015 105
Figure 96 Major crude oil trade flows [Lower Price Scenario, 2030]
The United States will reduce net imports from 6.4 Mb/d in the Reference Scenario to 5.0 Mb/d as domestic demand falls and domestic production increases. Its import sources will be limited to Canada and Latin America. The Americas will thus become almost self-sufficient in crude oil with the U.S. exports that will more than double from 0.4 Mb/d in the Reference Scenario to 1.0 Mb/d, including those for Asia. Europe will receive crude oil supply primarily from the former Soviet Union and Africa as in the Reference Scenario. Imports from the Middle East will be cut to zero from a small amount in the Reference Scenario as the Middle East faces growing competition from the former Soviet Union and Africa. In this way, both the United States and Europe will no longer be dependent on Middle Eastern crude oil.
China will reduce crude oil imports by about 20% from the Reference Scenario as domestic production remains robust with demand growth restricted. As Latin America will be forced to export crude oil to non-U.S. markets, China imports from Latin America will be increasing. Given that China promotes diversification of crude oil supply sources as its top priority for energy security and that Chinese state-run oil companies produce crude oil at overseas locations, China will also expand imports from the former Soviet Union and Africa. As a result, Middle Eastern crude oil’s share of China’s total crude imports will remain dominant but limited to around 66%. China will diversify its crude oil import sources in the Reference Scenario as well as in the Lower Price Scenario, resulting in a fall in its dependence on the Middle East.
Japan, Korea and Chinese Taipei will greatly reduce imports due to lower demand. While Japan has already begun to reduce its oil refining capacity, Korea with a surplus capacity of more than 1 Mb/d is expected to do so toward 2030. Although Japan, Korea and Chinese Taipei will expand imports from the United States and Latin America, the Middle East will
1,809
4,002
2,336
1,200
1,000
5,950
3,322
3,937
7,751
179
500
840
355
800760190
Unit:Thousand b/d
Japan/Korea/Taiwan
Non-OECD Europe/Central Asia
North America
MiddleEast
LatinAmerica
Africa
OECD Europe
China
ASEAN
Oceania
SouthAsia
IEEJ:February 2016 © IEEJ2016

Part III Exploring other paths through scenario analysis such as: Advanced Technologies and Lower Price
Asia/World Energy Outlook 2015 106
remain an important exporter. The Middle East’s share of imports into the three economies will fall from 74% in the Reference Scenario to 61% in the Lower Price Scenario. Japan, Korea and Chinese Taipei will thus diversify their import sources.
Natural gas supply
The supply-demand balance globally eases in the Lower Price Scenario. Total natural gas production in 2030 will decline by 12.4% from the Reference Scenario due to lower demand, the result of the implementation of energy and environmental measures. Since production costs for shale and other unconventional natural gas are assumed to smoothly drop, North America will expand production, despite a domestic demand decrease, taking advantage of exports. Canada, Argentina, China and Europe will also boost shale gas production after 2020. As a result, unconventional natural gas will increase its share of total production to 29.4% in 2030. Consequently, conventional natural gas producers (non-OECD Europe/Central Asia and the Middle East) will reduce their share of global natural gas production from the Reference Scenario.
Table 15 Natural gas production [Lower Price Scenario]
(Bcm)Lower Price Reference
2013 2020 2030 2013-2030 2030Total 3,530 3,889 4,355 +825 4,971
394 689 1,108 +714 1,070North America 849 973 979 +130 1,107
361 516 627 +266 686Latin America 227 232 312 +85 329
12 109 +109 109OECD Europe 265 235 246 -19 243
7 15 +15 5FSU/Non-OECD Europe 911 932 937 +26 1,139
Russia 627 624 609 -18 763Unconventional 19 47 +47 23
Middle East 563 578 646 +83 85823 39 +39 17
Africa 206 231 346 +140 36912 28 +28 11
Asia 441 558 712 +271 736China 124 240 322 +198 288
Unconventional 25 48 122 +97 101South Asia 90 91 126 +36 178
Unconventional 5 14 +14 16Southeast Asia 222 224 261 +39 267
Unconventional 11 34 +34 32Oceania 68 151 177 +109 190
8 38 74 +66 70Unconventional
Unconventional
Unconventional
Unconventional
Unconventional
Unconventional
Unconventional
IEEJ:February 2016 © IEEJ2016

7. Impacts of low oil prices caused by loose supply-demand balance
Asia/World Energy Outlook 2015 107
Natural gas trade
In the Lower Price Scenario, interregional natural gas trade in 2030 will be limited to 700 Bcm as natural gas production in Asia steadily increases, with OECD Europe preventing any production fall. Exports from non-OECD Europe/Central Asia and the Middle East will grow little from 2020, while North American exports will increase faster than in the Reference Scenario.
As in the Reference Scenario, any increase in net exports from North America, Oceania and non-OECD Europe/Central Asia will mostly be destined to Asia. Since unconventional natural gas is assumed to grow more competitive in the Lower Price Scenario, North America will export 45 Bcm more to Japan, Korea and Chinese Taipei and 23 Bcm more to Europe than in the Reference Scenario. Meanwhile, pipeline gas supply from non-OECD Europe/Central Asia will be limited to 98 Bcm for OECD Europe and 95 Bcm for China, far less than in the Reference Scenario.
Figure 97 Major natural gas trade flows [Lower Price Scenario, 2030]
7.4 Economy
Net value of crude oil exports
As oil demand is restricted and real crude oil prices set at 25% lower than in the Reference Scenario, the net nominal value of crude oil imports and exports in the Lower Price Scenario will be far less than in the Reference Scenario (Figure 98).
2445
243920
19
9198
42
141215
19
3921
18
12
Unit:BCM
PipelineLNG
Japan/Korea/Taiwan
Non-OECD Europe/Central Asia
North America
MiddleEast
LatinAmerica
Africa
OECD Europe
China
ASEAN
Oceania
SouthAsia
IEEJ:February 2016 © IEEJ2016

Part III Exploring other paths through scenario analysis such as: Advanced Technologies and Lower Price
Asia/World Energy Outlook 2015 108
Figure 98 Impact of lower prices on crude oil import/export bills in selected regions and countries [2030]
China will benefit the most from a decline in crude oil import costs. The drop in import costs from the Reference Scenario in 2030 will be $217 billion, almost equivalent to China’s 2014 annual crude oil imports ($228 billion). Lower energy prices, fuel switching to natural gas and lower domestic demand are contributing to the decline in the cost of China’s crude oil imports. The United States is the second largest beneficiary from a drop in the value of crude oil imports. Shale oil production growth and oil consumption savings will account for 60% of the net decline. For most of the other crude oil importers, the lower levels of prices capture the greatest share of the drop in the cost of crude oil imports.
Meanwhile, by 2030, Middle Eastern oil producing countries’ net exports are valued at $457 billion less than in the Reference Scenario. The difference is similar to the Middle East’s Asia-bound crude oil exports in 2014 (about $470 billion). The decline will become a major economic downside factor for Middle Eastern oil producing countries that depend on energy export income for revenues. The net value of crude oil exports will be $148 billion less than in the Reference Scenario for the former Soviet Union and $115 billion less for Africa. The declines in value will be one-fourth to one-third of the Middle Eastern drop. In percentage, however, their drops will exceed the 36% for the Middle East at 43% and 44% respectively.
Real GDP
In the Lower Price Scenario, the world’s real GDP for 2030 will increase by 1.9% from the Reference Scenario (Figure 99).
99
151
238
336
145
195
795
149
302
340
553
343
1,252
260
0 200 400 600 800 1,000 1,200
Japan
United States
Western Europe
China
Africa
Former Soviet Union
Middle East
Net
impo
rts
Net
exp
orts
USD billion
Lower Price
Volume contribution
Price contribution
Refernece
2014
-457
-148
-115
-217
-102
-150
-50
IEEJ:February 2016 © IEEJ2016

7. Impacts of low oil prices caused by loose supply-demand balance
Asia/World Energy Outlook 2015 109
Figure 99 Impact on real GDP in 2030
The European Union, which accounts for 20% of global real GDP, will get greater economic benefits than any other country or region. The European Union, though now depending on imports for 90% of its oil and natural gas supply, will take advantage of lower energy prices and lower imports to reduce industrial production costs and enhance its export competitiveness. It will thus hold down wealth outflow. The European Union’s real GDP will increase by 2.7% from the Reference Scenario in 2030
In the United States, the drop in energy prices will weaken earnings for the oil and natural gas industry, exerting adverse effects on that part of the economy. Nevertheless, the economic impacts for the whole of the U.S. economy will be positive in 2030 as it remains a net oil importer. Given that private consumption accounts for as much as 70% of GDP, consumers will greatly benefit. A decline in the share of energy-related spending relative to disposable income has already been observed under the current low crude oil prices. If disposable income increases through energy price drops, consumers may expand consumption including vehicle purchases. In response to such demand growth, companies will increase employment, creating a virtuous circle. Given these points, the U.S. economy will grow by 2.4% from the Reference Scenario.
Asia, heavily dependent on energy imports, will greatly benefit from lower energy prices. The ASEAN economy will expand by 2.6% from the Reference Scenario in 2030, with economic effects as high as the European Union. Real GDP in 2030 will increase by 2.2% from the Reference Scenario for India and by 1.7% for China. In Japan that depends on imports for more than 90% of its energy supply, the economy will grow by 2.0% from the Reference Scenario in 2030. Many countries will save fuel and transport costs at the company levels and these
European Union2.7%
ASEAN2.6%
United States2.4%
India2.2%
Japan2.0%
China1.7%
Oceania0.1%
Russia-1.3%
Middle East-3.1%
Others2.0%
Global average1.9%
-4%
-2%
0%
2%
0 20 40 60 80 100
Low
er P
rice
(Com
pare
d w
ith R
efer
ence
)
Reference (2010 USD trillion)
IEEJ:February 2016 © IEEJ2016

Part III Exploring other paths through scenario analysis such as: Advanced Technologies and Lower Price
Asia/World Energy Outlook 2015 110
savings will be used for expanding infrastructure development and corporate capital investment. Indonesia and Malaysia will experience a temporary consumption plunge as domestic energy prices rise due to reduced or eliminated fuel subsidies. The subsidy reduction or elimination will in turn improve their fiscal and current balances to advantage their economies.
Meanwhile, the Middle East’s real GDP in 2030 will decline by 3.1% from the Reference Scenario. In the outlook period through 2040, Middle Eastern oil producing countries will accelerate their fiscal reform, including the reduction or elimination of subsidies for gasoline and diesel oil that will reduce consumption as energy prices rise. The global growth in unconventional resources development will further weaken the Middle East’s presence as producers. This trend has already emerged under low crude oil prices. Kuwait is considering repealing subsidies for meat in anticipation of fiscal difficulties while King Salman bin Abdulaziz Al Saud of Saudi Arabia is now reconsidering its January 2015 promise regarding electricity and water subsidies. The United Arab Emirates have withdrawn their energy subsidies with gasoline prices already increasing by more than 20%.
Russia endowed with rich energy resources will maintain its government system where political power is based on the redistribution of income from natural gas and other energy development. Therefore, as pressure will grow on its fiscal balance, Russian real GDP will contract by 1.3% from the Reference Scenario.
World should increase talks for stabilising energy markets
As energy prices remain low, the Middle East, Russia and other countries, rich with energy resources, are vulnerable of concentrating too much of their economic activities in the energy sector. The Middle East and Russia have tried to diversify their economies but except for the UAE already facing less and less oil resources, the diversification have been slow. In an era of low energy prices, the Middle East and Russia should take note of their vulnerability and take advantage of the low energy prices to promote medium- to long-term efforts to diversify their economies. Specifically, the Middle East should exploit savings from their ongoing subsidy reduction or elimination for accelerating economic diversification. In that process, the region will have to develop an investment climate including security, sanitation and working conditions to attract foreign investment.
Even in countries that benefit from energy price falls, stock price drops for resource-related and other companies could destabilise the stock market, causing a negative chain reaction that will dampen consumption. Energy prices perceived to be much lower than anticipation and destabilising of many markets, could block appropriate investment.
Some predict that North America will slowly reduce unconventional energy resources production through 2020. Then, only Middle Eastern oil producing countries will be able to fulfil the growing energy demand in emerging countries. Over a longer term beyond 2030, the Middle East could increase its presence again.
Therefore, the world should not be relieved to see the end of the high energy price age. In an era of low energy prices, energy producing and consuming countries should participate in each other’s territories to build a structure benefiting both and should share information and understanding to reduce uncertainties. For example, the ongoing scheme for Asian natural
IEEJ:February 2016 © IEEJ2016
7. Impacts of low oil prices caused by loose supply-demand balance
Asia/World Energy Outlook 2015 111
gas procurement cooperation would be an important case. The natural gas supply chain includes not only gas consuming countries but also upstream gas development, gas liquefaction and transport. Asian countries should be united to participate in the natural gas production process to help stabilise procurement and break the natural gas supply structure dominated by international oil majors, contributing to the elimination of the so-called Asian premium on gas prices.
In the future, countries that produce and consume oil, natural gas and other energy sources should promote constructive talks for sound market development. The dialogue between the IEA and OPEC through the International Energy Forum should be furthered. To facilitate communications between energy consuming countries, the IEA should enhance cooperation with China and India that will increase oil imports in the future.
IEEJ:February 2016 © IEEJ2016

IEEJ:February 2016 © IEEJ2016

Asia/World Energy Outlook 2015 113
Part IV Analysing transition towards low-carbon while addressing climate change
IEEJ:February 2016 © IEEJ2016

IEEJ:February 2016 © IEEJ2016

8. CO2 emission outlook and assessment of national GHG emission reduction targets
Asia/World Energy Outlook 2015 115
8. CO2 emission outlook and assessment of national GHG emission reduction targets
8.1 Energy-related CO2 emissions in the Advanced Technologies Scenario
The further development of energy conservation and decarbonisation technologies will help reduce global CO2 emissions from 2020 and post a decline of 2.4 Gt from 2013 to 2050 (Figure 100). An emission reduction of 15.4 Gt from the Reference Scenario in 2050 will exceed Asia’s current emissions. The cumulative reductions through 2050 will reach 278 Gt, 8.5 times as much as current global emissions.
Figure 100 Global CO2 emissions reduction by region [Advanced Technologies Scenario]
Of global CO2 emission cuts in 2050, non-OECD countries will account for about 70%. China, the largest CO2 emitter in the world, will reduce CO2 emissions by 4.5 Gt, some three times as much as Japan’s current emissions, and capture 53% of the Asian contribution. In order for China and other non-OECD countries to substantially reduce CO2 emission, developed countries’ decarbonisation technology assistance (technology transfer, institutional development, etc.) will be very important.
Of the global CO2 emission reduction from the Reference Scenario to the Advanced Technologies Scenario in 2050, energy conservation will account for the largest share at 8.3 Gt, renewables will be second at 3.3 Gt, nuclear at 2.4 Gt and fuel switching at 1.4 Gt (Figure 101). CO2 capture and storage (CCS) will account for 7.2 Gt mainly in the power generation sector. But CCS technology, unlike other means including energy conservation, does not positively impact the energy supply. It is important to look for various options without excessively
21.223.5
35.7
39.5
42.7
45.9
32.9 33.5 33.0
31.830.5
20
25
30
35
40
45
50
1990 2000 2013 2020 2030 2040 2050
GtOther Asia
China
Middle East/North Africa
Others
EU
U.S.
Reference
Adv. Tech.
IEEJ:February 2016 © IEEJ2016
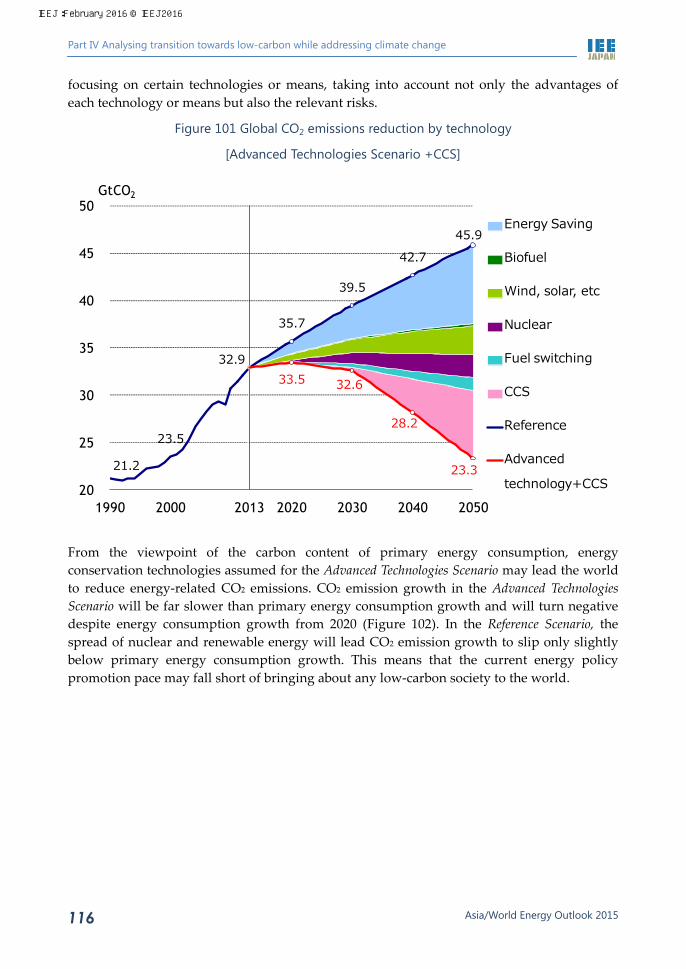
Part IV Analysing transition towards low-carbon while addressing climate change
Asia/World Energy Outlook 2015 116
focusing on certain technologies or means, taking into account not only the advantages of each technology or means but also the relevant risks.
Figure 101 Global CO2 emissions reduction by technology
[Advanced Technologies Scenario +CCS]
From the viewpoint of the carbon content of primary energy consumption, energy conservation technologies assumed for the Advanced Technologies Scenario may lead the world to reduce energy-related CO2 emissions. CO2 emission growth in the Advanced Technologies Scenario will be far slower than primary energy consumption growth and will turn negative despite energy consumption growth from 2020 (Figure 102). In the Reference Scenario, the spread of nuclear and renewable energy will lead CO2 emission growth to slip only slightly below primary energy consumption growth. This means that the current energy policy promotion pace may fall short of bringing about any low-carbon society to the world.
21.2
23.5
32.9
35.7
39.5
42.7 45.9
33.5 32.6
28.2
23.3 20
25
30
35
40
45
50
1990 2000 2013 2020 2030 2040 2050
GtCO2
Energy Saving
Biofuel
Wind, solar, etc
Nuclear
Fuel switching
CCS
Reference
Advanced
technology+CCS
IEEJ:February 2016 © IEEJ2016

8. CO2 emission outlook and assessment of national GHG emission reduction targets
Asia/World Energy Outlook 2015 117
Figure 102 Global primary energy consumption and CO2 emissions [1990-2013, 2020, 2030, 2040, 2050]
Amid the growing recognition that GHG emissions must be substantially reduced to counter climate change, not only developed countries but also emerging countries have set voluntary medium-term GHG emission reduction targets in preparation for the 21st Conference of Parties to the United Nations Framework Convention on Climate Change, known as COP21, in December 2015. At COP21, a legal framework in which all countries will participate will take effect, requiring them to comply with the framework. From a long-term viewpoint, the world and individual countries could realize a bottom-up approach without concentrating on a single measure by building a GHG emission reduction framework, as seen in the Advanced Technologies Scenario. But we must test whether these voluntary targets would be as ambitious as in the Advanced Technologies Scenario.
Among primary energy sources, coal will undergo the greatest change from the Reference Scenario to the Advanced Technologies Scenario due to energy conservation, power generation efficiency improvements and fuel switching. Asia, including China and India, that is expected to continue to experience economic growth, will remain dependent on coal. CCS and other coal-related technology innovations will be important along with frameworks to support OECD countries’ technology transfer to non-OECD countries, sectoral approaches and other global measures.
Even if each country sets ambitious CO2 emission reduction targets and achieve them, CO2 emissions in 2050 will still be higher than in 1990. The world will fall far short of halving CO2 emissions by 2050. Unless dramatic technology innovations that are now considered as difficult are realized, the world will have difficulties halving 2013 CO2 emissions by 2050. Not only climate change mitigation measures but also adaptation measures should be taken to effectively address climate change. Therefore, any analysis on climate change should be based on climate change damage and adaptation measures. The relationship between the GHG concentration and temperature rise should be further clarified for setting more realistic GHG emission reduction targets.
60
80
100
120
140
160
180
60 80 100 120 140 160 180
CO2
(201
3=10
0)
Primary energy (2013=100)
ReferenceAdv. Tech.
IEEJ:February 2016 © IEEJ2016

Part IV Analysing transition towards low-carbon while addressing climate change
Asia/World Energy Outlook 2015 118
8.2 Extra-long-term CO2 equivalent concentration and temperature increase
In Figure 103, the atmospheric CO2 equivalent concentration12 and a temperature rise from the 1850-1900 average are projected for the Reference and Advanced Technologies Scenarios extended through 2100 and for the 2050 halving scenario in which global CO2 emissions will be halved from 2013 to 2050 and reduced to zero in 2100. Projection concentration ranges were estimated with the MAGICC model13.
In the Reference Scenario, the atmospheric CO2 equivalent concentration will reach 811 ppm of CO2 equivalent (760-860 ppm) in 2100 and continue rising later. In the 2050 halving scenario, the concentration will stand at 535 ppm in 2100 and will remain stable in a 500-550 ppm range14 later. While the temperature is projected to increase by 2.5-3.6°C from the latter half of the 19th century to 2100 in the Reference Scenario, the temperature rise will be limited to 1.5°-2.2°C, below 2.5°, with a probability to slip below 2°C in the 2050 halving scenario. The concentration in the Advanced Technologies Scenario + CCS in 2100 will be 575 ppm of CO2 equivalent (540-600 ppm), relatively close to the projection in the 2050 halving scenario, with the temperature rise also being close. Given this projection, adaptation measures can be combined with mitigation measures into an option close to the 2050 halving scenario. As mitigation costs to achieve a projected CO2 emission cut in the Advanced Technology Scenario or a higher target are substantial, the assessment of adaptation costs is important.
Figure 103 CO2-eq. concentration and temperature rise
CO2-equivalent concentration Temperature rise from the latter half
of the 19th century
Note: 17th-83rd percentiles
12 The “CO2-equivalent concentration” includes the forcing of all GHGs, as well as aerosols and albedo change. 13 Meinshausen, M., S. C. B. Raper and T. M. L. Wigley (2011). “Emulating coupled atmosphere-ocean and carbon cycle models with a simpler model, MAGICC6: Part I – Model Description and Calibration.” Atmospheric Chemistry and Physics 11: 1417-1456. doi:10.5194/acp-11-1417-2011. 14 In order to cut the CO2 equivalent concentration to 450 ppm by 2100, GHG emissions will have to be more than halved by 2050 and become negative later.
300
400
500
600
700
800
900
2010 2020 2030 2040 2050 2060 2070 2080 2090 2100
ppm
Reference Adv. Tech. 50% reduction
0
0.5
1
1.5
2
2.5
3
3.5
4
2010 2020 2030 2040 2050 2060 2070 2080 2090 2100
℃
Reference Adv. Tech. 50% reduction
IEEJ:February 2016 © IEEJ2016

8. CO2 emission outlook and assessment of national GHG emission reduction targets
Asia/World Energy Outlook 2015 119
8.3 Assessing total national emission reduction targets
In the following, we are assessing the effectiveness of the CO2 emission reduction targets proposed by the Intended Nationally Determined Contributions (INDCs)15. We projected global emissions in 2030 based on INDCs submitted by eight major economies (China, the United States, the European Union, India, Russia, Indonesia, Brazil and Japan) for comparison with emissions in the Reference and Advanced Technologies Scenarios. The eight major economies covered 65% of global GHG emissions totalling 49.8 Gt in 2010.
Comparing emission reduction targets
The eight major economies’ INDCs are summarized into Table 16. INDCs provide three types of targets -- target emissions compared with base years, target emissions per GDP compared with base years and target emissions compared with a BAU (business as usual) level.
Table 16 INDCs of 8 major parties
International comparison of GHG emissions
Figure 104 indicates global GHG emissions projected16 for 2025 and 2030 based on the above INDCs.
15 The Intended Nationally Determined Contribution (INDC) is a country’s draft contribution providing commitments or targets. At the COP19 meeting in 2013, all parties to the United Nations Framework Convention on Climate Change were urged to notify the United Nations of their INDCs well before the 2015 COP21 meeting in Paris. At the 2014 COP20 meeting, an effective deadline for the notification was set for October 1, 2015. By this deadline, 117 countries and regions (144 countries) had submitted INDCs. 16 As for emissions in base years and 2010, we used national inventory reports for developed countries and GHG or CO2 emissions in the IEA’s “CO2 Emissions from Fuel Combustion 2014” for developing countries. For countries setting target emissions per GDP compared with base years, we used this Outlook’s GDP projections. For countries submitting target emissions compared with BAU levels, we used BAU levels specified in INDCs. China’s CO2 emissions were converted into GHG emissions based on the ratio of CO2 emissions to GHG
Party Date of submission Target type Reduction target Base year Target year Coverage
EU Mar 6 Absolute emissions 40% 1990 2030 GHG
United States Mar 31 Absolute emissions 26~28% 2005 2025 GHGincluding LULUCF
Russia Apr 1 Absolute emissions 25~30% 1990 2030 GHG
China Jun 30 GDP intensity 60~65% 2005 2030 CO2
Japan Jul 17 Absolute emissions 26% 2013 2030 GHG
Indonesia Sep 24 Reduction from BAU 29% BAU 2030 GHG
Brazil Sep 30 Absolute emissions 37%(43% for 2030)
2005 2025 GHG
India Oct 1 GDP intensity 33~35% 2005 2030 GHG
IEEJ:February 2016 © IEEJ2016

Part IV Analysing transition towards low-carbon while addressing climate change
Asia/World Energy Outlook 2015 120
Figure 104 GHG emission paths based on the INDCs
China will expand GHG emissions by 56% from 10.8 Gt in 2010 to 16.8 Gt in 2030. India will increase them 2.8-fold from 2.8 Gt in 2010 to 8.0 Gt in 2030, outdoing the United States and the European Union. The United States will cut GHG emissions from 6.0 Gt in 2010 to 4.3 Gt in 2030. The European Union will also reduce them from 4.8 Gt in 2010 to 3.4 Gt in 2030.
Comparing total INDCs with Reference and Advanced Technology Scenarios
Figure 105 compares total emissions under the INDCs with those in the Reference and Advanced Technologies Scenarios17. The IEA’s INDC Scenario and Bridge Scenario18 are also shown in the chart.
emissions in 2010 in the IEA’s “CO2 Emissions from Fuel Combustion 2014.” For the United States, the 2005-2025 trends were extrapolated through 2030. The emission levels in 2020 were based on the Cancun Pledge. 17 In the INDC Scenario, we converted the eight major economies’ emissions into global emissions based on the ratio of their emissions to global emissions in 2010 in the IEA’s “CO2 Emissions from Fuel Combustion 2014.” Similarly, we converted energy-related CO2 emissions in the Reference and Advanced Technologies Scenarios and the IEA scenario into GHG emissions based on the ratio of CO2 emissions through fuel combustion to GHG emissions in 2010 in the IEA’s “CO2 Emissions from Fuel Combustion 2014.” 18 The IEA Bridge Scenario was announced in “Energy and Climate Change,” a special report for the IEA’s Energy Outlook 2015 published in June 2015. It deepens the IEA’s INDC scenario, providing a GHG emission reduction scenario using five key policy measures – energy conservation, fossil-fuel subsidy reform, renewable energy technology investment, reducing the least-efficient coal-fired power plants and reducing upstream methane emissions. The five policy pillars are: • Increasing energy efficiency • Reducing the use of the least-efficient coal-fired power plants and banning their construction • Increasing investment in renewable energy technologies in the power sector from $270 billion in 2014 to $400 billion in 2030 • Gradual phasing out of fossil-fuel subsidies to end-users by 2030 • Reducing methane emissions in oil and gas production
The Bridge Scenario is based only on existing technologies and policy measures and lowers the
0
2
4
6
8
10
12
14
16
18
2010 2015 2020 2025 2030
GtCO2-eq
China
India
U.S.EURussia
Japan BrazilIndonesia
IEEJ:February 2016 © IEEJ2016

8. CO2 emission outlook and assessment of national GHG emission reduction targets
Asia/World Energy Outlook 2015 121
Figure 105 Comparison of GHG emission paths
Global GHG emissions in 2030, projected with the major economies’ INDCs, are closer to those in the Reference Scenario than those in the Advanced Technologies Scenario. The projected emissions post an increase, indicating a wide gap with the Advanced Technologies Scenario.
8.4 Assessing national emission reduction targets
International comparison of per capita GHG emissions and GHG emissions per GDP
Regarding national GHG emission reduction targets, we first conducted international comparison of per capita GHG emissions and GHG emissions per GDP.
Figure 106 GHG emissions per capita and per unit of GDP
GHG per capita
GHG per unit of GDP
Per capita GHG emissions will decline in the United States and increase in China through 2030. As a result, per capita GHG emissions in the United States will remarkably match those
application standard for these policies for a case in which these measures affect economic growth or access to modern energy services in developing countries.
64.1
52.9
62.0
50.5
43.8
30
35
40
45
50
55
60
65
70
1990 2000 2010 2020 2030
GtCO2-eq
Reference
INDCs
Adv. Tech.
IEA Bridge
50% reductionby 2050
0
5
10
15
20
25
2010 2020 2030
tCO2-eq/person
Russia
U.S.
China
Japan
IndonesiaEU
Brazil
India0
0.5
1
1.5
2
2.5
3
2010 2020 2030
Russia
U.S.China
Japan
Indonesia
Brazil
India
kgCO2-eq/USD
EU
IEEJ:February 2016 © IEEJ2016

Part IV Analysing transition towards low-carbon while addressing climate change
Asia/World Energy Outlook 2015 122
in China in 2030. Those in India will post an increase while remaining low. Among developed countries, Japan will post the second lowest per capita GHG emissions after the European Union.
GHG emissions per GDP will decrease both in China and India. India’s decrease will be slower than China’s. Japan will keep its GHG emissions per GDP lower than in the European Union or the United States through 2030.
National INDC emission levels and Reference and Advanced Technologies Scenarios
Figure 107 compares national INDC emission levels with the Reference and Advanced Technologies Scenarios19, 20.
Emissions will exceed those in the Reference Scenario for India and match those in the scenario for China and Russia. European Union emissions will be positioned between those in the Reference and Advanced Technologies Scenarios. U.S. and Japanese emissions will be at their respective levels in the Advanced Technologies Scenario. Indonesia and Brazil will reduce emissions to levels less than in the Advanced Technologies Scenario. This may be because these countries project very high levels of emission reductions from current deforestation and forest degradation.
All these economies will be required to make as much effort as projected in the Advanced Technologies Scenario. In this respect, technology transfer to developing countries will be important.
19 As for China, we used CO2 emissions for comparison. We converted energy-related CO2 emissions in the Reference and Advanced Technologies Scenarios into CO2 emissions with the ratio of CO2 emissions from fuel combustion to CO2 emissions in 2010 in the IEA’s “CO2 Emissions from Fuel Combustion 2014.” 20 Japan’s target for 2020 excludes emission cuts through nuclear energy.
IEEJ:February 2016 © IEEJ2016
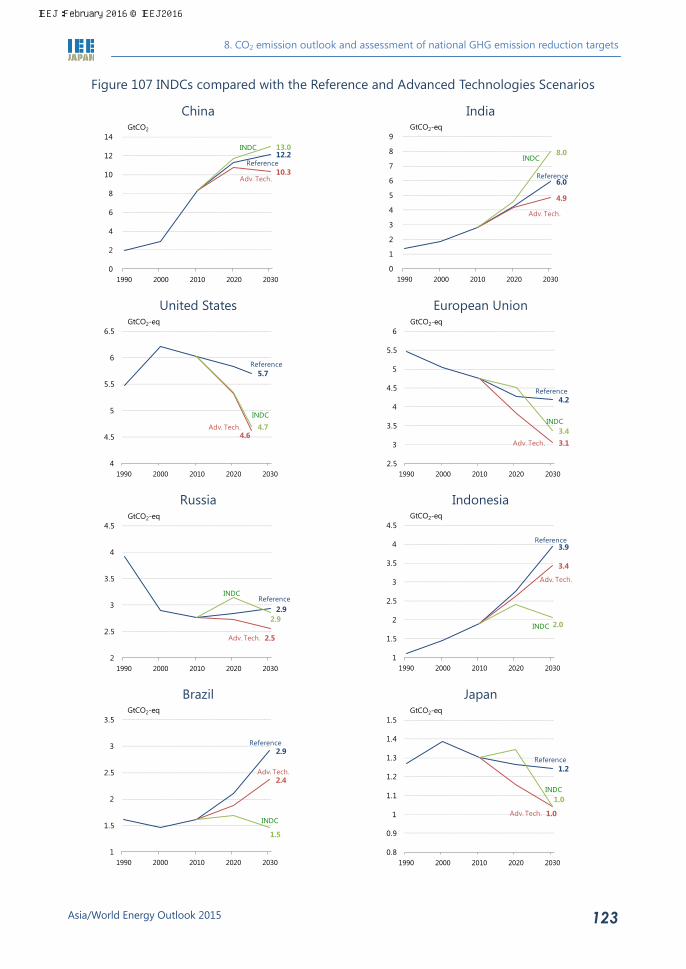
8. CO2 emission outlook and assessment of national GHG emission reduction targets
Asia/World Energy Outlook 2015 123
Figure 107 INDCs compared with the Reference and Advanced Technologies Scenarios
China
India
United States
European Union
Russia
Indonesia
Brazil
Japan
12.2
10.3
13.0
0
2
4
6
8
10
12
14
1990 2000 2010 2020 2030
GtCO2
Reference
INDC
Adv. Tech. 6.0
4.9
8.0
0
1
2
3
4
5
6
7
8
9
1990 2000 2010 2020 2030
GtCO2-eq
Reference
INDC
Adv. Tech.
5.7
4.6 4.7
4
4.5
5
5.5
6
6.5
1990 2000 2010 2020 2030
GtCO2-eq
Reference
INDC
Adv. Tech.
4.2
3.1 3.4
2.5
3
3.5
4
4.5
5
5.5
6
1990 2000 2010 2020 2030
GtCO2-eq
Reference
INDC
Adv. Tech.
2.9
2.5
2.9
2
2.5
3
3.5
4
4.5
1990 2000 2010 2020 2030
GtCO2-eq
ReferenceINDC
Adv. Tech.
3.9
3.4
2.0
1
1.5
2
2.5
3
3.5
4
4.5
1990 2000 2010 2020 2030
GtCO2-eq
Reference
INDC
Adv. Tech.
2.9
2.4
1.5
1
1.5
2
2.5
3
3.5
1990 2000 2010 2020 2030
GtCO2-eq
Reference
INDC
Adv. Tech. 1.2
1.0
1.0
0.8
0.9
1
1.1
1.2
1.3
1.4
1.5
1990 2000 2010 2020 2030
GtCO2-eq
Reference
INDC
Adv. Tech.
IEEJ:February 2016 © IEEJ2016
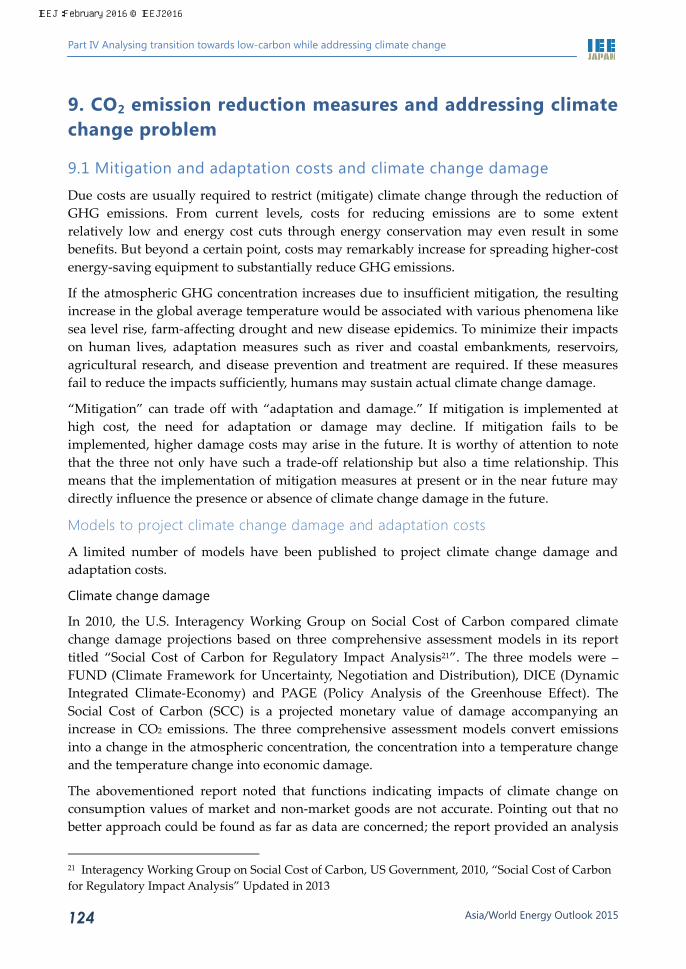
Part IV Analysing transition towards low-carbon while addressing climate change
Asia/World Energy Outlook 2015 124
9. CO2 emission reduction measures and addressing climate change problem
9.1 Mitigation and adaptation costs and climate change damage
Due costs are usually required to restrict (mitigate) climate change through the reduction of GHG emissions. From current levels, costs for reducing emissions are to some extent relatively low and energy cost cuts through energy conservation may even result in some benefits. But beyond a certain point, costs may remarkably increase for spreading higher-cost energy-saving equipment to substantially reduce GHG emissions.
If the atmospheric GHG concentration increases due to insufficient mitigation, the resulting increase in the global average temperature would be associated with various phenomena like sea level rise, farm-affecting drought and new disease epidemics. To minimize their impacts on human lives, adaptation measures such as river and coastal embankments, reservoirs, agricultural research, and disease prevention and treatment are required. If these measures fail to reduce the impacts sufficiently, humans may sustain actual climate change damage.
“Mitigation” can trade off with “adaptation and damage.” If mitigation is implemented at high cost, the need for adaptation or damage may decline. If mitigation fails to be implemented, higher damage costs may arise in the future. It is worthy of attention to note that the three not only have such a trade-off relationship but also a time relationship. This means that the implementation of mitigation measures at present or in the near future may directly influence the presence or absence of climate change damage in the future.
Models to project climate change damage and adaptation costs
A limited number of models have been published to project climate change damage and adaptation costs.
Climate change damage
In 2010, the U.S. Interagency Working Group on Social Cost of Carbon compared climate change damage projections based on three comprehensive assessment models in its report titled “Social Cost of Carbon for Regulatory Impact Analysis21”. The three models were – FUND (Climate Framework for Uncertainty, Negotiation and Distribution), DICE (Dynamic Integrated Climate-Economy) and PAGE (Policy Analysis of the Greenhouse Effect). The Social Cost of Carbon (SCC) is a projected monetary value of damage accompanying an increase in CO2 emissions. The three comprehensive assessment models convert emissions into a change in the atmospheric concentration, the concentration into a temperature change and the temperature change into economic damage.
The abovementioned report noted that functions indicating impacts of climate change on consumption values of market and non-market goods are not accurate. Pointing out that no better approach could be found as far as data are concerned; the report provided an analysis
21 Interagency Working Group on Social Cost of Carbon, US Government, 2010, “Social Cost of Carbon for Regulatory Impact Analysis” Updated in 2013
IEEJ:February 2016 © IEEJ2016
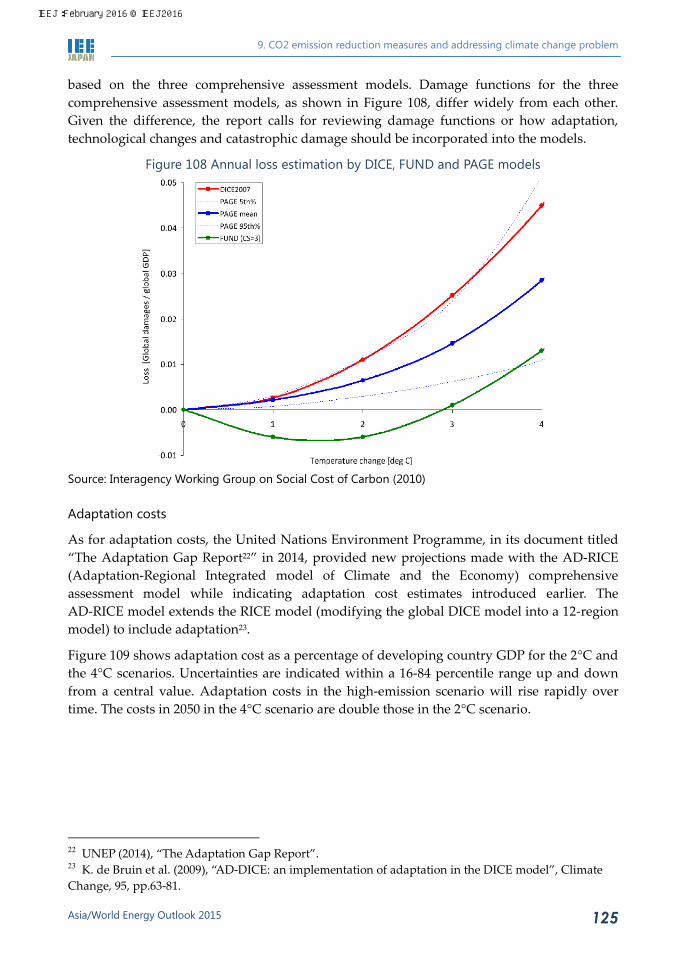
9. CO2 emission reduction measures and addressing climate change problem
Asia/World Energy Outlook 2015 125
based on the three comprehensive assessment models. Damage functions for the three comprehensive assessment models, as shown in Figure 108, differ widely from each other. Given the difference, the report calls for reviewing damage functions or how adaptation, technological changes and catastrophic damage should be incorporated into the models.
Figure 108 Annual loss estimation by DICE, FUND and PAGE models
Source: Interagency Working Group on Social Cost of Carbon (2010) Adaptation costs
As for adaptation costs, the United Nations Environment Programme, in its document titled “The Adaptation Gap Report22” in 2014, provided new projections made with the AD-RICE (Adaptation-Regional Integrated model of Climate and the Economy) comprehensive assessment model while indicating adaptation cost estimates introduced earlier. The AD-RICE model extends the RICE model (modifying the global DICE model into a 12-region model) to include adaptation23.
Figure 109 shows adaptation cost as a percentage of developing country GDP for the 2°C and the 4°C scenarios. Uncertainties are indicated within a 16-84 percentile range up and down from a central value. Adaptation costs in the high-emission scenario will rise rapidly over time. The costs in 2050 in the 4°C scenario are double those in the 2°C scenario.
22 UNEP (2014), “The Adaptation Gap Report”. 23 K. de Bruin et al. (2009), “AD-DICE: an implementation of adaptation in the DICE model”, Climate Change, 95, pp.63-81.
IEEJ:February 2016 © IEEJ2016

Part IV Analysing transition towards low-carbon while addressing climate change
Asia/World Energy Outlook 2015 126
Figure 109 Estimated adaptation costs for 2°C and 4°C temperature rise
Note: 16th to 84th percentiles. Source: UNEP (2014) Projecting mitigation and adaptation costs and damage
In this section, we project and compare mitigation and adaptation costs and damage at different points in time. For “damage and adaptation costs,” we used the equation in the DICE-2013E model24. For example, climate change damage in 2100 will depend not only on the CO2 (or GHG for a more general case) emission reduction rate in 2100 but also on an emission reduction path through 2100. As described in Chapter 8, energy-related CO2 emissions will increase from 32.9 Gt in 2013 to 45.9 Gt in 2050 in the Reference Scenario. If this trend continues further, CO2 emissions will continue to increase over a longer term. In the Advanced Technologies Scenario + CCS, meanwhile, CO2 emissions in 2050 will stand at 23.3 Gt, 49% less than in the Reference Scenario and 29% less than in 2013. Here, we make the projection according to paths indicated in Figure 110 for these scenarios extended through 2100 and the 2050 halving scenario in which global CO2 emissions will be halved from 2013 in 2050 and cut to zero in 2100. We use our estimates for mitigation costs and assume an annual cost drop through technological advancement after 2050 at 0.5% in line with the DICE model.
24 W. Nordhaus and P. Sztorc, “DICE 2013R: Introduction and User’s Manual”, http://www.econ.yale.edu/~nordhaus/homepage/documents/DICE_Manual_103113r2.pdf
IEEJ:February 2016 © IEEJ2016

9. CO2 emission reduction measures and addressing climate change problem
Asia/World Energy Outlook 2015 127
Figure 110 Assumed CO2 mitigation paths
Figure 111 shows estimates for mitigation costs, and damage and adaptation costs in 2050 and 2100. The global average temperature gap between the Reference Scenario and the 2050 halving scenario will be limited to 0.1-0.2°C so that the damage and adaptation cost gap will be relatively small. Meanwhile, mitigation costs will be negative as an energy cost drop accompanying energy conservation for a certain degree of emission cuts from the Reference Scenario exceeds additional costs. As CO2 emission cuts deepen, mitigation costs will increase gradually. Costs will increase rapidly as energy conservation measures beyond the Advanced Technologies Scenario + CCS are taken. In or after 2100, meanwhile, the impact of damage will remarkably increase. In the relatively near future, the impact of a mitigation cost change on total costs will be greater. Although the uncertainties accompanying the projection of these costs remain very high, it is safe to say that the impact of damage and adaptation costs will grow relatively greater in the far future. The total of mitigation and adaptation costs and damage may be minimized at some point between the Reference Scenario and the 2050 halving scenario. As mitigation costs and damage and adaptation costs have a trade-off relationship, it is impossible to simultaneously minimize the three. It is realistic to balance the three while taking into account minimization of the total costs.
0
10
20
30
40
50
60
1980 2010 2030 2050 2070 2100
Gt
Reference
Adv. Tech. +CCS
50% reduction by 2050
IEEJ:February 2016 © IEEJ2016

Part IV Analysing transition towards low-carbon while addressing climate change
Asia/World Energy Outlook 2015 128
Figure 111 Mitigation, adaptation costs and damage
2050 2100
Note: Adaptation cost and damage: Estimated using the equations in the DICE2013R model.
Mitigation cost: IEEJ estimate. Equilibrium Climate Sensitivity: Assumed at 3°C.
9.2 Very long-term CO2 emission reduction scenario
Mitigation costs, damage and adaptation costs, and emission reduction scenario
While damage and adaptation costs can be assessed, the results remain very uncertain. In contrast, many attempts to project mitigation costs have traditionally been made, so their assessment can be viewed as more realistic. Nevertheless, the assessment includes great uncertainties. Recognizing the uncertainties sufficiently, we here attempt to assess an emission path to minimize mitigation and adaptation costs and damage as described in Section 9-1.
The dotted line in Figure 111 indicates a long-term emission path to minimize the total accumulation of mitigation costs, damage and adaptation costs (more precisely, to maximize the cumulative utility corresponding to consumption affected by these costs). The path shows that global CO2 emissions will gradually decline from the present to a greater level than in the Advanced Technologies Scenario + CCS in 2050. But the path may differ depending on mitigation cost and damage assumptions. If mitigation costs are assumed to be higher, the path will indicate greater CO2 emissions. If damage is assumed to be higher, the path will indicate less CO2 emissions.
If the Equilibrium Climate Sensitivity (ECS) is assumed at 2.5°C instead of 3.0°C, the path will indicate greater emissions. If the discount rate (see Box 4) is lower, emissions in 2050 will slip slightly below those in the Advanced Technologies Scenario + CCS. In this way, the optimum emission path widely differs depending on assumptions. Even if mitigation costs and damage are determined at accurate levels, the path cannot be determined uniquely. At least,
-0.5
0.0
0.5
1.0
1.5
2.0
2.5
3.0
3.5
4.0
0% 20% 40% 60%
2014
USD
trill
ion/
yr
Reduction from Reference
50%reduction
Adv. Tech.+CCS
Mitigation cost (A)
Adaptatin cost+ damage (B)
Total (A+B)
-2
0
2
4
6
8
10
12
14
16
0% 20% 40% 60% 80%20
14 U
SD t
rillio
n /y
rReduction from Reference
Mitigation cost (A)
Adaptation cost+ damage (B)
Total(A+B)
IEEJ:February 2016 © IEEJ2016
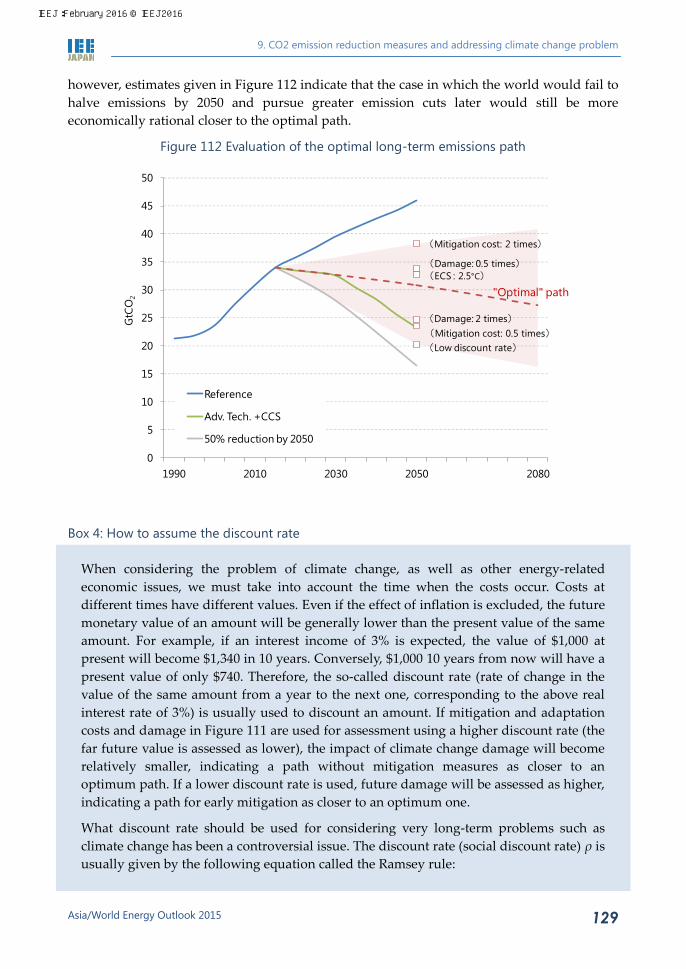
9. CO2 emission reduction measures and addressing climate change problem
Asia/World Energy Outlook 2015 129
however, estimates given in Figure 112 indicate that the case in which the world would fail to halve emissions by 2050 and pursue greater emission cuts later would still be more economically rational closer to the optimal path.
Figure 112 Evaluation of the optimal long-term emissions path
Box 4: How to assume the discount rate
When considering the problem of climate change, as well as other energy-related economic issues, we must take into account the time when the costs occur. Costs at different times have different values. Even if the effect of inflation is excluded, the future monetary value of an amount will be generally lower than the present value of the same amount. For example, if an interest income of 3% is expected, the value of $1,000 at present will become $1,340 in 10 years. Conversely, $1,000 10 years from now will have a present value of only $740. Therefore, the so-called discount rate (rate of change in the value of the same amount from a year to the next one, corresponding to the above real interest rate of 3%) is usually used to discount an amount. If mitigation and adaptation costs and damage in Figure 111 are used for assessment using a higher discount rate (the far future value is assessed as lower), the impact of climate change damage will become relatively smaller, indicating a path without mitigation measures as closer to an optimum path. If a lower discount rate is used, future damage will be assessed as higher, indicating a path for early mitigation as closer to an optimum one.
What discount rate should be used for considering very long-term problems such as climate change has been a controversial issue. The discount rate (social discount rate) ρ is usually given by the following equation called the Ramsey rule:
0
5
10
15
20
25
30
35
40
45
50
1990 2010 2030 2050 2080
Reference
Adv. Tech. +CCS
50% reduction by 2050
GtC
O2
(Damage: 0.5 times)(ECS : 2.5°C)
(Mitigation cost: 0.5 times)(Damage: 2 times)
(Low discount rate)
(Mitigation cost: 2 times)
"Optimal" path
IEEJ:February 2016 © IEEJ2016
Part IV Analysing transition towards low-carbon while addressing climate change
Asia/World Energy Outlook 2015 130
gηδρ += (1)
Here, δ indicates the pure time preference rate. If this numeral is higher, people may view the future value as lower than at present. g is the consumption growth rate. Generally, consumption grows along with the economic size. η is the elasticity of marginal utility of consumption, indicating the percentage rate at which the value of an amount drops in response to a 1% expansion in consumption per capita.
Stern25 gave priority to the equity between generations and assumed a low discount rate, setting δ at 0.1% and η at 1.0. Meanwhile, Nordhaus set δ and η to allow the present discount rate to match the real interest rate (slightly more than 5% per annum) actually observed in the United States (as indicated by Equation (1), the discount rate will fall as the economic size or consumption growth decelerates). The DICE-2013R model by Nordhaus uses 1.5% for δ and 1.45 for η. In this way, experts have different views on the discount rate assumption and assert their respective positions. The impact of these differences is very great as shown in Figure 112.
Actually, people usually use interest rates as discount rates for discounting computation at least for a period of several or dozens of years, as seen in the abovementioned case of $1,000. In this sense, adopting Stern’s assumption is expected to mean deviating from realities. But recent researches have pointed out that lower discount rates will be appropriate if great uncertainties are expected in the long future or if the substitution of goods (e.g., the substitution of artificial goods for environmental goods) is difficult. Our projection accords with the parameter setting by Nordhaus for a standard case and uses Stern’s discount rate for a lower-discount rate case.
Toward a long-term future
In this way, it is impossible to minimize mitigation costs, adaptation costs and damage simultaneously. It is realistic to restrict their total while balancing them. In this respect, it is important that even if the world fails to halve emissions by 2050, environmental damage or mitigation costs will cumulatively increase unless emissions are reduced further later as close to zero as possible.
Therefore, the world should seek a very ambitious GHG emission reduction over a longer term by promoting technical development to make energy conservation, decarbonisation, CO2 absorption and other technologies available at low cost while pursuing the 500-550 ppm concentration close to the Advanced Technologies Scenario. Specifically, such ambitious GHG reduction will be difficult unless mitigation costs’ rapid increase indicated in the area for large emission cuts in Figure 111 is dragged down. Over a medium to long term, the world should promote a cooperative approach to build worldwide networks linking country-by-country efforts to develop innovative technologies, including carbon capture and utilisation (CCU) – particularly, artificial photosynthesis –, next-generation nuclear power,
25 N. Stern (2007), “The economics of climate change”, Cambridge University Press.
IEEJ:February 2016 © IEEJ2016

9. CO2 emission reduction measures and addressing climate change problem
Asia/World Energy Outlook 2015 131
space solar power systems and nuclear fusion. Furthermore, the world should develop and spread not only these energy supply side technologies but also innovative demand-side technologies that cannot be assumed now.
Table 17 Example of innovative technologies Technology Overview and challenges Carbon Capture and Utilisation (CCU)
The technologies to capture and use carbon dioxide as industrial materials, etc. Large-scale processing of CO2 is one of the major challenges.
Bioenergy and Carbon Capture and Storage (BECCS)
The technology to capture and store the carbon dioxide released by burning biofuels. If the biofuel can be regarded as carbon neutral, this technology makes it possible to achieve negative emissions. Barriers to large-scale deployment of BECCS include risks related to transport and provision of biomass feedstock.
Artificial photosynthesis A chemical process to convert sunlight, water and carbon dioxide into carbohydrates and oxygen. As with the BECCS technology, it could realize negative emissions. Major challenges include the development of the catalysis to split water into hydrogen and oxygen.
Next generation nuclear power
Advanced nuclear technologies under development worldwide, including fast breeder reactors, high temperature gas-cooled reactors, molten salt reactors and small modular reactors.
Nuclear fusion Unlike the conventional nuclear technologies that exploit the energy released by the fission of heavy nuclei, nuclear fusion makes use of the energy released during the reaction (fusion) of light nuclei. This technology could possibly result in an almost limitless supply of energy, without producing spent fuels as high-level radioactive wastes.
Space Solar Power System (SSPS)
A system that transmits energy from space-based solar power plants to the ground in the form of microwaves or laser beams. It can generate power stably with almost no influence from the weather. Reducing the costs of mass transition through space is one of the major challenges.
IEEJ:February 2016 © IEEJ2016

IEEJ:February 2016 © IEEJ2016

Asia/World Energy Outlook 2015 133
Annex
IEEJ:February 2016 © IEEJ2016

IEEJ:February 2016 © IEEJ2016

Annex
Asia/World Energy Outlook 2015 Annex-135
Table A18 Regional groupings Asia People’s Republic of China Hong Kong India Japan Korea Chinese Taipei ASEAN Brunei Darussalam Indonesia Malaysia Myanmar Philippines Singapore Thailand Viet Nam Others Bangladesh, Cambodia, D. P. R. Korea, Mongolia, Nepal,
Pakistan, Sri Lanka, and Other Asia in IEA statistics
North America United States Canada Latin America Brazil Chile Mexico Others Argentina, Bolivia, Colombia, Costa Rica, Cuba, Curaçao,
Dominican Republic, Ecuador, El Salvador, Guatemala, Haiti, Honduras, Jamaica, Nicaragua, Panama, Paraguay, Peru, Trinidad and Tobago, Uruguay, and Other Non–OECD Americas in IEA statistics
Europe OECD Europe France Germany Italy United Kingdom Others Austria, Belgium, the Czech
Republic, Denmark, Estonia, Finland, Greece, Hungary, Iceland, Ireland, Luxembourg, the Netherlands, Norway, Poland, Portugal, the Slovak Republic, Slovenia, Spain, Sweden, Switzerland, and Turkey
Non-OECD Europe Russia Other non-OECD
former Soviet Union Armenia, Azerbaijan, Belarus, Georgia, Kazakhstan, Kyrgyzstan, Latvia, Lithuania, Moldova, Tajikistan, Turkmenistan, Ukraine, and Uzbekistan
IEEJ:February 2016 © IEEJ2016

Annex
Asia/World Energy Outlook 2015 Annex-136
Others Albania, Bosnia and Herzegovina, Bulgaria, Croatia, Cyprus, Gibraltar, Kosovo, Former Yugoslav Republic of Macedonia, Malta, Montenegro, Romania, and Serbia
Africa Republic of South Africa North Africa Algeria, Egypt, Libya, Morocco, and Tunisia Others Angola, Benin, Botswana, Cameroon, Democratic
Republic of Congo, Congo, Côte d’Ivoire, Eritrea, Ethiopia, Gabon, Ghana, Kenya, Mozambique, Namibia, Niger, Nigeria, Senegal, South Sudan, Sudan, Togo, United Republic of Tanzania, Zambia, Zimbabwe, and Other Africa in IEA statistics
Middle East Iran Iraq Kuwait Oman Qatar Saudi Arabia United Arab Emirates Others Bahrain, Israel, Jordan, Lebanon, Syrian Arab Republic,
and Yemen Oceania Australia New Zealand International bunkers
European Union Austria, Belgium, Bulgaria, Croatia, Cyprus, the Czech Republic, Denmark, Estonia, Finland, France, Germany, Greece, Hungary, Ireland, Italy, Latvia, Lithuania, Luxembourg, Malta, the Netherlands, Poland, Portugal, Romania, the Slovak Republic, Slovenia, Spain, Sweden, and the United Kingdom
OECD Australia, Austria, Belgium, Canada, Chile, the Czech Republic, Denmark, Estonia, Finland, France, Germany, Greece, Hungary, Iceland, Ireland, Italy, Japan, Korea, Luxembourg, Mexico, the Netherlands, New Zealand, Norway, Poland, Portugal, the Slovak Republic, Slovenia, Spain, Sweden, Switzerland, Turkey, United Kingdom, and United States
Notes: (1) ASEAN includes neither Cambodia nor Lao P.D.R., (2) Other non-OECD former Soviet Union includes energy data of Estonia before 1990, and (3) OECD does not include Israel.
IEEJ:February 2016 © IEEJ2016

Annex
Asia/World Energy Outlook 2015 Annex-137
Table A19 Major energy and economic indicators CAGR (%)
1990 2013 2040 1990/2013 2013/2040
ReferenceAdvanced
Technologies ReferenceAdvanced
Technologies
Total primary energy World 8,768 13,555 18,963 16,396 1.9 1.3 0.7consumption Asia 2,110 5,409 8,691 7,534 4.2 1.8 1.2(Mtoe) China 871 3,022 4,227 3,533 5.6 1.3 0.6
India 307 775 1,830 1,582 4.1 3.2 2.7Japan 439 455 436 388 0.1 -0.2 -0.6
Oil consumption World 3,232 4,210 5,496 4,658 1.2 1.0 0.4(Mtoe) Asia 618 1,254 2,053 1,778 3.1 1.8 1.3
China 119 478 797 678 6.2 1.9 1.3India 61 176 451 396 4.7 3.5 3.0Japan 250 202 135 112 -0.9 -1.5 -2.2
Natural gas World 1,663 2,902 4,741 3,665 2.4 1.8 0.9consumption Asia 116 532 1,417 1,149 6.9 3.7 2.9(Mtoe) China 13 140 580 491 11.0 5.4 4.8
India 11 44 196 174 6.4 5.6 5.2Japan 44 106 112 72 3.9 0.2 -1.4
Coal consumption World 2,221 3,928 4,577 3,105 2.5 0.6 -0.9(Mtoe) Asia 786 2,747 3,546 2,460 5.6 0.9 -0.4
China 528 2,045 2,161 1,515 6.1 0.2 -1.1India 94 341 806 513 5.8 3.2 1.5Japan 77 121 116 95 2.0 -0.2 -0.9
Power generation World 11,826 23,307 39,509 33,671 3.0 2.0 1.4(TWh) Asia 2,215 9,481 19,519 16,649 6.5 2.7 2.1
China 621 5,422 9,728 8,224 9.9 2.2 1.6India 293 1,193 4,196 3,715 6.3 4.8 4.3Japan 836 1,038 1,200 1,015 0.9 0.5 -0.1
Energy-related World 21,200 32,920 42,693 31,762 1.9 1.0 -0.1carbon dioxide Asia 4,920 14,936 21,966 16,195 4.9 1.4 0.3emissions China 2,339 9,437 11,627 8,493 6.3 0.8 -0.4(Mt) India 546 1,894 4,757 3,377 5.6 3.5 2.2
Japan 1,070 1,234 1,034 791 0.6 -0.7 -1.6Primary energy World 234 192 125 108 -0.8 -1.6 -2.1consumption Asia 285 272 142 123 -0.2 -2.4 -2.9per GDP China 1,073 402 145 121 -4.2 -3.7 -4.3(toe/$2010 million) India 640 380 162 140 -2.2 -3.1 -3.6
Japan 96 80 52 46 -0.8 -1.6 -2.0Primary energy World 1.66 1.91 2.09 1.81 0.6 0.3 -0.2consumption Asia 0.72 1.39 1.90 1.65 2.9 1.2 0.6per capita China 0.77 2.23 3.04 2.54 4.7 1.2 0.5(toe/person) India 0.35 0.62 1.14 0.99 2.5 2.3 1.8
Japan 3.56 3.57 3.82 3.40 0.0 0.3 -0.2GDP World 37,514 70,542 152,280 152,341 2.8 2.9 2.9($2010 billion) Asia 7,400 19,855 61,360 61,421 4.4 4.3 4.3
China 811 7,513 29,180 29,180 10.2 5.2 5.2India 479 2,039 11,298 11,298 6.5 6.5 6.5Japan 4,553 5,656 8,369 8,429 0.9 1.5 1.5
Population World 5,271 7,114 9,068 9,068 1.3 0.9 0.9(Million) Asia 2,931 3,890 4,579 4,579 1.2 0.6 0.6
China 1,135 1,357 1,389 1,389 0.8 0.1 0.1India 869 1,252 1,599 1,599 1.6 0.9 0.9Japan 124 127 114 114 0.1 -0.4 -0.4
IEEJ:February 2016 © IEEJ2016

Annex
Asia/World Energy Outlook 2015 Annex-138
Table A20 Population (Million)
1990/ 2013/ 2020/ 2030/ 2013/1990 2000 2013 2020 2030 2040 2013 2020 2030 2040 2040
5,271 6,093 7,114 7,685 8,420 9,068(100) (100) (100) (100) (100) (100)
2,931 3,401 3,890 4,137 4,406 4,579(55.6) (55.8) (54.7) (53.8) (52.3) (50.5)1,135 1,263 1,357 1,398 1,410 1,389(21.5) (20.7) (19.1) (18.2) (16.7) (15.3)869 1,042 1,252 1,359 1,495 1,599
(16.5) (17.1) (17.6) (17.7) (17.8) (17.6)124 127 127 125 120 114(2.3) (2.1) (1.8) (1.6) (1.4) (1.3)
43 47 50 52 53 53(0.8) (0.8) (0.7) (0.7) (0.6) (0.6)
20 22 23 23 23 22(0.4) (0.4) (0.3) (0.3) (0.3) (0.2)427 503 594 640 693 732(8.1) (8.3) (8.3) (8.3) (8.2) (8.1)179 209 250 270 294 311(3.4) (3.4) (3.5) (3.5) (3.5) (3.4)
18 23 30 33 36 39(0.3) (0.4) (0.4) (0.4) (0.4) (0.4)
42 48 53 57 61 63(0.8) (0.8) (0.7) (0.7) (0.7) (0.7)
62 78 98 109 125 138(1.2) (1.3) (1.4) (1.4) (1.5) (1.5)
3 4 5 6 6 7(0.1) (0.1) (0.1) (0.1) (0.1) (0.1)
57 62 67 68 68 66(1.1) (1.0) (0.9) (0.9) (0.8) (0.7)
66 78 90 96 103 108(1.3) (1.3) (1.3) (1.3) (1.2) (1.2)
2,808 3,274 3,762 4,012 4,285 4,465(53.3) (53.7) (52.9) (52.2) (50.9) (49.2)277 313 351 370 395 415(5.3) (5.1) (4.9) (4.8) (4.7) (4.6)250 282 316 332 355 373(4.7) (4.6) (4.4) (4.3) (4.2) (4.1)441 521 611 656 710 749(8.4) (8.6) (8.6) (8.5) (8.4) (8.3)499 521 557 570 580 585(9.5) (8.5) (7.8) (7.4) (6.9) (6.5)478 488 507 516 523 526(9.1) (8.0) (7.1) (6.7) (6.2) (5.8)344 341 342 347 347 342(6.5) (5.6) (4.8) (4.5) (4.1) (3.8)627 806 1,109 1,318 1,652 2,030
(11.9) (13.2) (15.6) (17.2) (19.6) (22.4)132 166 226 256 296 332(2.5) (2.7) (3.2) (3.3) (3.5) (3.7)
20 23 28 30 33 36(0.4) (0.4) (0.4) (0.4) (0.4) (0.4)
1,062 1,150 1,254 1,299 1,348 1,380(20.2) (18.9) (17.6) (16.9) (16.0) (15.2)4,209 4,943 5,860 6,386 7,071 7,688(79.8) (81.1) (82.4) (83.1) (84.0) (84.8)
Source: United Nations "Population Estimates and Projections: The 2012 Revision", World Bank "World Development Indicators" Note: Figures in parentheses are global shares (%).
1.0
-0.2
2.12.5
1.3 1.3
0.91.3 1.1 0.9 0.7
1.0
0.4
2.3
1.0 1.00.8
2.4 1.8 1.5 1.41.1
0.7 0.5
CAGR (%)
1.2 0.9 0.4
0.7
0.6
0.8 0.1
0.4
1.3
0.7 0.4
0.4
-0.3
0.6
-0.1
0.7
0.6
0.7
0.50.7
0.4
0.6
0.6
-0.1
0.6
1.0
-0.4
0.0
-0.4
0.2
0.6 0.0 -0.1
0.7 0.4
0.1 -0.2
0.4 0.1
-0.5
1.6 1.2 0.9
-0.4
1.1
1.1 0.8
Philippines
ASEAN
0.8
2.2 1.4 1.1
0.8 0.5
1.0
0.6
0.7
Indonesia
Malaysia
1.4
1.5
0.8
Myanmar
Korea
Chinese Taipei
0.8
0.5
0.2
-0.2
0.91.0
2.0 1.5 1.3 1.0
1.0
0.7 0.2 0.0
0.40.7
0.80.71.52.5Singapore
1.0 0.8
Viet Nam
1.3 0.9
1.0 0.7
1.3
Thailand
0.7 0.61.0
2.3
0.0 0.2 0.0
0.10.2
0.0
2.5
0.0 0.10.3
0.3 0.2
0.3 0.1
Japan
China
India
Asia excl. Japan
World
0.2
0.81.4 1.2
Asia
North America
United States
Latin America
OECD Europe
Non-OECD Europe
European Union
0.5
0.51.4
Middle East
Oceania
OECD
Non-OECD
Africa
IEEJ:February 2016 © IEEJ2016
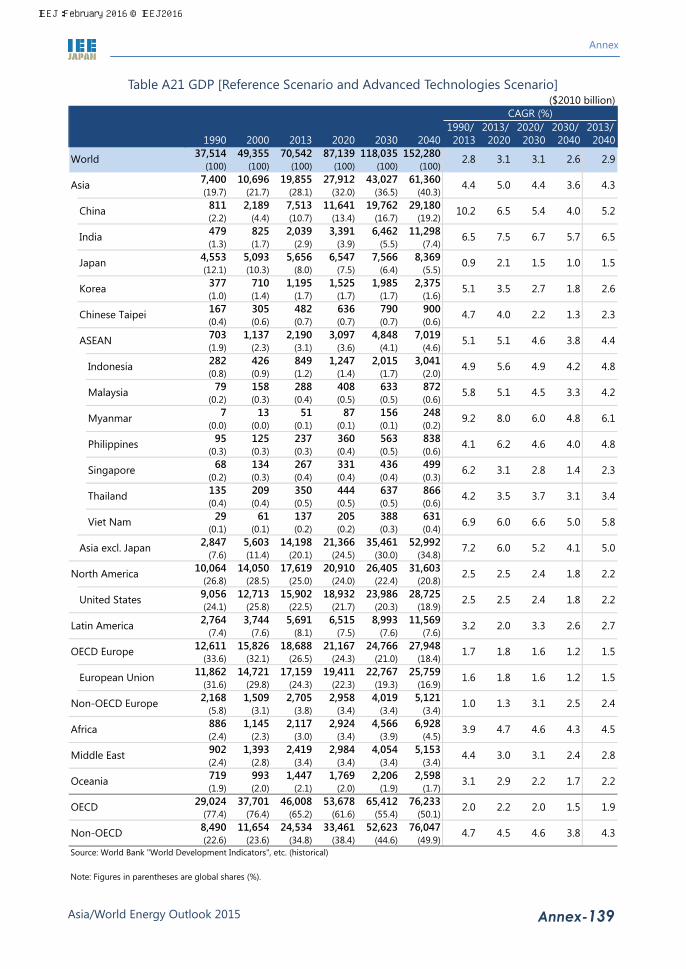
Annex
Asia/World Energy Outlook 2015 Annex-139
Table A21 GDP [Reference Scenario and Advanced Technologies Scenario] ($2010 billion)
1990/ 2013/ 2020/ 2030/ 2013/1990 2000 2013 2020 2030 2040 2013 2020 2030 2040 2040
37,514 49,355 70,542 87,139 118,035 152,280(100) (100) (100) (100) (100) (100)
7,400 10,696 19,855 27,912 43,027 61,360(19.7) (21.7) (28.1) (32.0) (36.5) (40.3)811 2,189 7,513 11,641 19,762 29,180(2.2) (4.4) (10.7) (13.4) (16.7) (19.2)479 825 2,039 3,391 6,462 11,298(1.3) (1.7) (2.9) (3.9) (5.5) (7.4)
4,553 5,093 5,656 6,547 7,566 8,369(12.1) (10.3) (8.0) (7.5) (6.4) (5.5)377 710 1,195 1,525 1,985 2,375(1.0) (1.4) (1.7) (1.7) (1.7) (1.6)167 305 482 636 790 900(0.4) (0.6) (0.7) (0.7) (0.7) (0.6)703 1,137 2,190 3,097 4,848 7,019(1.9) (2.3) (3.1) (3.6) (4.1) (4.6)282 426 849 1,247 2,015 3,041(0.8) (0.9) (1.2) (1.4) (1.7) (2.0)
79 158 288 408 633 872(0.2) (0.3) (0.4) (0.5) (0.5) (0.6)
7 13 51 87 156 248(0.0) (0.0) (0.1) (0.1) (0.1) (0.2)
95 125 237 360 563 838(0.3) (0.3) (0.3) (0.4) (0.5) (0.6)
68 134 267 331 436 499(0.2) (0.3) (0.4) (0.4) (0.4) (0.3)135 209 350 444 637 866(0.4) (0.4) (0.5) (0.5) (0.5) (0.6)
29 61 137 205 388 631(0.1) (0.1) (0.2) (0.2) (0.3) (0.4)
2,847 5,603 14,198 21,366 35,461 52,992(7.6) (11.4) (20.1) (24.5) (30.0) (34.8)
10,064 14,050 17,619 20,910 26,405 31,603(26.8) (28.5) (25.0) (24.0) (22.4) (20.8)9,056 12,713 15,902 18,932 23,986 28,725(24.1) (25.8) (22.5) (21.7) (20.3) (18.9)2,764 3,744 5,691 6,515 8,993 11,569
(7.4) (7.6) (8.1) (7.5) (7.6) (7.6)12,611 15,826 18,688 21,167 24,766 27,948
(33.6) (32.1) (26.5) (24.3) (21.0) (18.4)11,862 14,721 17,159 19,411 22,767 25,759
(31.6) (29.8) (24.3) (22.3) (19.3) (16.9)2,168 1,509 2,705 2,958 4,019 5,121
(5.8) (3.1) (3.8) (3.4) (3.4) (3.4)886 1,145 2,117 2,924 4,566 6,928(2.4) (2.3) (3.0) (3.4) (3.9) (4.5)902 1,393 2,419 2,984 4,054 5,153(2.4) (2.8) (3.4) (3.4) (3.4) (3.4)719 993 1,447 1,769 2,206 2,598(1.9) (2.0) (2.1) (2.0) (1.9) (1.7)
29,024 37,701 46,008 53,678 65,412 76,233(77.4) (76.4) (65.2) (61.6) (55.4) (50.1)8,490 11,654 24,534 33,461 52,623 76,047(22.6) (23.6) (34.8) (38.4) (44.6) (49.9)
Source: World Bank "World Development Indicators", etc. (historical)
Note: Figures in parentheses are global shares (%).
4.6
1.9
4.7 4.5
1.5
3.8
2.92.8 3.1 3.1 2.6
4.3
2.2
4.4 3.0 3.1 2.8
3.1 2.9 2.2
2.4
1.7
1.0
4.5
1.0 1.3 3.1 2.4
3.9 4.7 4.6
2.5
4.3
1.4 2.3
6.0
4.24.9
4.5
3.8
3.3
4.6
6.14.8
4.6 4.84.0
4.2
4.8
2.3
2.6
4.4
2.2
CAGR (%)
3.6
4.0
6.5
5.2
4.4 5.0 4.3
6.5
6.5 7.5 5.7
1.5
5.4
4.4
1.8
1.3
2.7
9.2 8.0
4.9 5.6
4.1
0.9 2.1 1.5
China
Indonesia
India
Japan
ASEAN
Myanmar
4.0
5.1 3.5
4.7
6.7
2.0
Middle East
Asia
5.1
5.8
10.2
2.0 2.2
6.0
2.5 2.5
Thailand
Korea
Malaysia
Philippines
Chinese Taipei
5.1
6.2
5.1
4.2 3.5
6.9 6.0
6.2
2.4
3.2 2.0 3.3
1.7 1.8 1.6
3.7
2.83.1
7.2
1.51.6 1.8 1.6 1.2
5.0
4.1
3.1
5.8
2.2
5.0
1.8
1.5
2.7
1.2
2.6
2.5 2.5 2.4 1.8 2.2
3.4
6.6
5.2
Non-OECD
Asia excl. Japan
World
North America
United States
Latin America
OECD Europe
Non-OECD Europe
European Union
Africa
Viet Nam
Oceania
OECD
Singapore
IEEJ:February 2016 © IEEJ2016

Annex
Asia/World Energy Outlook 2015 Annex-140
Table A22 International energy prices Reference Lower Price
Real prices 2014 2020 2030 2040 2020 2030 2040Crude oil $2014/bbl 105 75 100 125 70 75 80Natural gas Japan $2014/MBtu 16.3 10.7 12.8 14.1 9.6 9.8 10.2
Europe (UK) $2014/MBtu 8.2 8.5 9.8 11.7 6.8 7.3 8.1United States $2014/MBtu 4.4 4.5 5.6 6.8 3.4 3.7 3.9
Steam coal $2014/t 98 89 106 132 86 96 108
Reference Lower PriceNominal prices 2014 2020 2030 2040 2020 2030 2040Crude oil $/bbl 105 84 137 209 79 103 134Natural gas Japan $/MBtu 16.3 12.0 17.6 23.6 10.8 13.5 17.1
Europe (UK) $/MBtu 8.2 9.6 13.5 19.6 7.7 10.0 13.6United States $/MBtu 4.4 5.1 7.7 11.4 3.8 5.1 6.5
Steam coal $/t 98 100 145 221 97 132 181 Note: 2% per annum of inflation rates are assumed.
IEEJ:February 2016 © IEEJ2016

Annex
Asia/World Energy Outlook 2015 Annex-141
Table A23 Primary energy consumption [Reference Scenario] (Mtoe)
1990/ 2013/ 2020/ 2030/ 2013/1990 2000 2013 2020 2030 2040 2013 2020 2030 2040 2040
8,768 10,057 13,555 15,207 17,211 18,963(100) (100) (100) (100) (100) (100)
2,110 2,920 5,409 6,411 7,567 8,691(24.1) (29.0) (39.9) (42.2) (44.0) (45.8)871 1,161 3,022 3,498 3,918 4,227(9.9) (11.5) (22.3) (23.0) (22.8) (22.3)307 441 775 993 1,360 1,830(3.5) (4.4) (5.7) (6.5) (7.9) (9.7)439 519 455 471 461 436(5.0) (5.2) (3.4) (3.1) (2.7) (2.3)
93 188 264 300 328 325(1.1) (1.9) (1.9) (2.0) (1.9) (1.7)
48 85 109 120 126 128(0.5) (0.8) (0.8) (0.8) (0.7) (0.7)233 380 587 776 1,035 1,327(2.7) (3.8) (4.3) (5.1) (6.0) (7.0)
99 156 214 314 419 540(1.1) (1.5) (1.6) (2.1) (2.4) (2.8)
22 49 89 109 135 160(0.3) (0.5) (0.7) (0.7) (0.8) (0.8)
11 13 17 20 26 33(0.1) (0.1) (0.1) (0.1) (0.1) (0.2)
29 40 45 58 76 99(0.3) (0.4) (0.3) (0.4) (0.4) (0.5)
12 19 26 31 37 41(0.1) (0.2) (0.2) (0.2) (0.2) (0.2)
42 72 134 159 202 244(0.5) (0.7) (1.0) (1.0) (1.2) (1.3)
18 29 60 83 136 206(0.2) (0.3) (0.4) (0.5) (0.8) (1.1)
1,670 2,401 4,955 5,940 7,106 8,255(19.0) (23.9) (36.6) (39.1) (41.3) (43.5)2,124 2,525 2,442 2,519 2,538 2,463(24.2) (25.1) (18.0) (16.6) (14.7) (13.0)1,915 2,273 2,188 2,254 2,260 2,181(21.8) (22.6) (16.1) (14.8) (13.1) (11.5)464 594 849 964 1,194 1,381(5.3) (5.9) (6.3) (6.3) (6.9) (7.3)
1,620 1,746 1,737 1,788 1,807 1,795(18.5) (17.4) (12.8) (11.8) (10.5) (9.5)1,645 1,692 1,626 1,674 1,693 1,682(18.8) (16.8) (12.0) (11.0) (9.8) (8.9)1,537 1,003 1,156 1,185 1,266 1,323(17.5) (10.0) (8.5) (7.8) (7.4) (7.0)391 494 747 906 1,134 1,368(4.5) (4.9) (5.5) (6.0) (6.6) (7.2)222 374 713 837 1,006 1,160(2.5) (3.7) (5.3) (5.5) (5.8) (6.1)
99 125 149 162 169 172(1.1) (1.2) (1.1) (1.1) (1.0) (0.9)
4,511 5,274 5,276 5,520 5,627 5,558(51.4) (52.4) (38.9) (36.3) (32.7) (29.3)4,055 4,509 7,925 9,251 11,055 12,796(46.2) (44.8) (58.5) (60.8) (64.2) (67.5)
Source: International Energy Agency "World Energy Balances" (historical)
Note: Figures in parentheses are global shares (%). World includes international bunkers.
1.31.9 1.7 1.2 1.0
-0.1
1.8
0.7 0.6 0.2
1.8
1.8 1.2 0.4
1.4
0.2
0.2
1.53.0 2.2 1.8
0.5
2.3
-1.2 0.5
1.92.9 2.8 2.3
3.1
-0.1
0.1
0.1
2.7 1.8 2.2 1.8
0.4
0.4 0.1
1.5
-0.1
-0.1 0.4 0.1 -0.1 0.1
0.6
2.5
0.0
4.2
2.2
2.8
-0.6 -0.2
-0.4
2.9
4.7
0.0
1.91.5
-0.3
2.5
2.6
1.7
2.6
1.0
2.6
1.9
2.5
2.9
2.1
4.6 1.9 0.9 0.8
3.6 1.4 0.5
-0.20.1 0.5
4.2 2.5 1.4
0.8
India
1.7 1.8
5.6 2.1 1.1
3.23.04.1 3.2
Asia
CAGR (%)
Japan
3.6
3.4 5.6
6.2 3.0
5.2 2.4
3.6 2.5
ASEAN
Korea
Chinese Taipei
3.7
4.1 4.1
1.9
2.2
3.5
3.0
1.7
China 1.3
1.9 2.7
0.6
5.4 4.7 5.1
1.8
0.3
0.6
2.5
4.8 2.6 1.8
0.4 0.1
OECD
Non-OECD
Oceania
Viet Nam
Singapore
5.2 2.3 1.9
0.4 0.0
0.4 0.7
Thailand
World
North America
United States
Latin America
OECD Europe
Non-OECD Europe
European Union
Africa
Middle East
Asia excl. Japan
Myanmar
Indonesia
Malaysia
Philippines
IEEJ:February 2016 © IEEJ2016
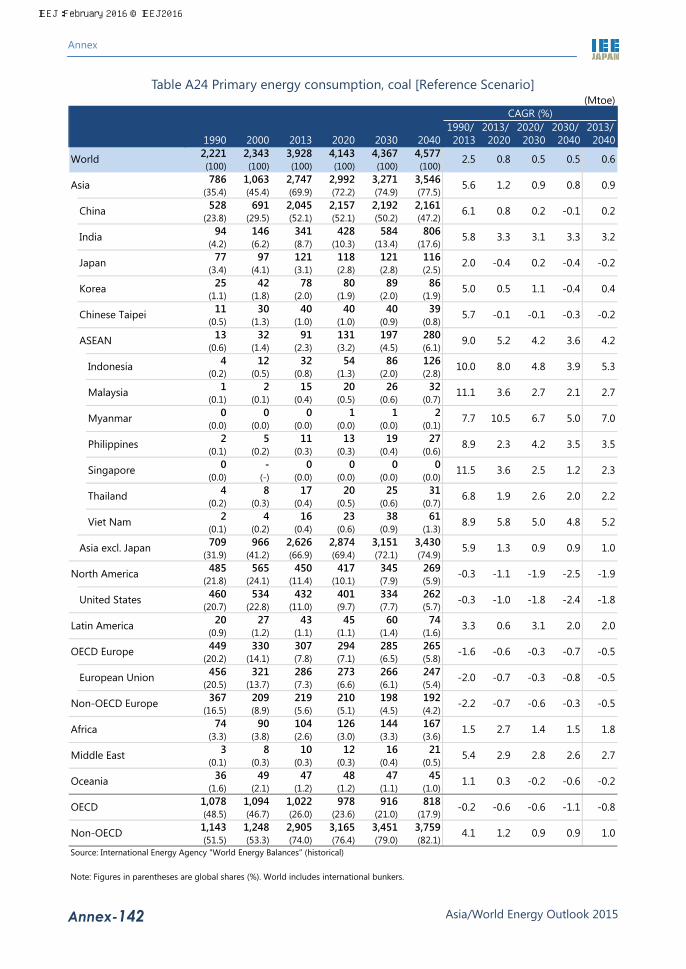
Annex
Asia/World Energy Outlook 2015 Annex-142
Table A24 Primary energy consumption, coal [Reference Scenario] (Mtoe)
1990/ 2013/ 2020/ 2030/ 2013/1990 2000 2013 2020 2030 2040 2013 2020 2030 2040 2040
2,221 2,343 3,928 4,143 4,367 4,577(100) (100) (100) (100) (100) (100)786 1,063 2,747 2,992 3,271 3,546
(35.4) (45.4) (69.9) (72.2) (74.9) (77.5)528 691 2,045 2,157 2,192 2,161
(23.8) (29.5) (52.1) (52.1) (50.2) (47.2)94 146 341 428 584 806
(4.2) (6.2) (8.7) (10.3) (13.4) (17.6)77 97 121 118 121 116
(3.4) (4.1) (3.1) (2.8) (2.8) (2.5)25 42 78 80 89 86
(1.1) (1.8) (2.0) (1.9) (2.0) (1.9)11 30 40 40 40 39
(0.5) (1.3) (1.0) (1.0) (0.9) (0.8)13 32 91 131 197 280
(0.6) (1.4) (2.3) (3.2) (4.5) (6.1)4 12 32 54 86 126
(0.2) (0.5) (0.8) (1.3) (2.0) (2.8)1 2 15 20 26 32
(0.1) (0.1) (0.4) (0.5) (0.6) (0.7)0 0 0 1 1 2
(0.0) (0.0) (0.0) (0.0) (0.0) (0.1)2 5 11 13 19 27
(0.1) (0.2) (0.3) (0.3) (0.4) (0.6)0 - 0 0 0 0
(0.0) (-) (0.0) (0.0) (0.0) (0.0)4 8 17 20 25 31
(0.2) (0.3) (0.4) (0.5) (0.6) (0.7)2 4 16 23 38 61
(0.1) (0.2) (0.4) (0.6) (0.9) (1.3)709 966 2,626 2,874 3,151 3,430
(31.9) (41.2) (66.9) (69.4) (72.1) (74.9)485 565 450 417 345 269
(21.8) (24.1) (11.4) (10.1) (7.9) (5.9)460 534 432 401 334 262
(20.7) (22.8) (11.0) (9.7) (7.7) (5.7)20 27 43 45 60 74
(0.9) (1.2) (1.1) (1.1) (1.4) (1.6)449 330 307 294 285 265
(20.2) (14.1) (7.8) (7.1) (6.5) (5.8)456 321 286 273 266 247
(20.5) (13.7) (7.3) (6.6) (6.1) (5.4)367 209 219 210 198 192
(16.5) (8.9) (5.6) (5.1) (4.5) (4.2)74 90 104 126 144 167
(3.3) (3.8) (2.6) (3.0) (3.3) (3.6)3 8 10 12 16 21
(0.1) (0.3) (0.3) (0.3) (0.4) (0.5)36 49 47 48 47 45
(1.6) (2.1) (1.2) (1.2) (1.1) (1.0)1,078 1,094 1,022 978 916 818(48.5) (46.7) (26.0) (23.6) (21.0) (17.9)1,143 1,248 2,905 3,165 3,451 3,759(51.5) (53.3) (74.0) (76.4) (79.0) (82.1)
Source: International Energy Agency "World Energy Balances" (historical)
Note: Figures in parentheses are global shares (%). World includes international bunkers.
0.9
-0.8
4.1 1.2
-1.1
0.9
0.62.5 0.8 0.5 0.5
1.0
-0.2
5.4 2.9 2.8 2.7
1.1 0.3 -0.2
2.6
-0.6
-0.4
1.8
-2.2 -0.7 -0.6 -0.5
1.5 2.7 1.4
-0.3
1.5
1.2 2.3
6.7
3.94.8
2.7
3.6
2.1
4.2
7.05.0
4.2 3.53.5
2.7
5.3
-0.2
0.4
4.2
-0.1
CAGR (%)
0.8
-0.1
3.2
0.2
5.6 1.2 0.9
0.8
5.8 3.3 3.3
-0.2
0.2
0.9
-0.4
-0.3
1.1
7.7 10.5
10.0 8.0
8.9
2.0 -0.4 0.2
China
Indonesia
India
Japan
ASEAN
Myanmar
-0.1
5.0 0.5
5.7
3.1
-0.6
Middle East
Asia
9.0
11.1
6.1
-0.2 -0.6
1.3
-0.3 -1.1
Thailand
Korea
Malaysia
Philippines
Chinese Taipei
3.6
2.3
5.2
6.8 1.9
8.9 5.8
11.5
-1.9
3.3 0.6 3.1
-1.6 -0.6 -0.3
2.6
2.53.6
5.9
-0.5-2.0 -0.7 -0.3 -0.8
4.8
0.9
2.0
5.2
-1.9
1.0
-2.5
-0.5
2.0
-0.7
2.0
-0.3 -1.0 -1.8 -2.4 -1.8
2.2
5.0
0.9
Non-OECD
Asia excl. Japan
World
North America
United States
Latin America
OECD Europe
Non-OECD Europe
European Union
Africa
Viet Nam
Oceania
OECD
Singapore
IEEJ:February 2016 © IEEJ2016

Annex
Asia/World Energy Outlook 2015 Annex-143
Table A25 Primary energy consumption, oil [Reference Scenario] (Mtoe)
1990/ 2013/ 2020/ 2030/ 2013/1990 2000 2013 2020 2030 2040 2013 2020 2030 2040 2040
3,232 3,660 4,210 4,616 5,121 5,496(100) (100) (100) (100) (100) (100)618 917 1,254 1,483 1,771 2,053
(19.1) (25.1) (29.8) (32.1) (34.6) (37.3)119 221 478 595 704 797(3.7) (6.0) (11.4) (12.9) (13.7) (14.5)
61 112 176 248 348 451(1.9) (3.1) (4.2) (5.4) (6.8) (8.2)250 255 202 175 155 135(7.7) (7.0) (4.8) (3.8) (3.0) (2.5)
50 99 97 100 101 98(1.5) (2.7) (2.3) (2.2) (2.0) (1.8)
26 38 42 46 47 47(0.8) (1.0) (1.0) (1.0) (0.9) (0.8)
88 153 209 256 333 422(2.7) (4.2) (5.0) (5.5) (6.5) (7.7)
33 58 77 93 119 155(1.0) (1.6) (1.8) (2.0) (2.3) (2.8)
11 19 31 38 46 52(0.4) (0.5) (0.7) (0.8) (0.9) (1.0)
1 2 3 4 6 9(0.0) (0.1) (0.1) (0.1) (0.1) (0.2)
11 16 14 19 26 34(0.3) (0.4) (0.3) (0.4) (0.5) (0.6)
11 17 16 18 21 23(0.4) (0.5) (0.4) (0.4) (0.4) (0.4)
18 32 53 62 78 92(0.6) (0.9) (1.3) (1.4) (1.5) (1.7)
3 8 16 21 37 56(0.1) (0.2) (0.4) (0.5) (0.7) (1.0)367 662 1,051 1,309 1,616 1,917
(11.4) (18.1) (25.0) (28.4) (31.6) (34.9)833 958 859 865 854 792
(25.8) (26.2) (20.4) (18.7) (16.7) (14.4)757 871 780 782 765 702
(23.4) (23.8) (18.5) (16.9) (14.9) (12.8)237 303 390 416 476 506(7.3) (8.3) (9.3) (9.0) (9.3) (9.2)606 650 549 519 490 454
(18.7) (17.8) (13.0) (11.3) (9.6) (8.3)606 623 513 489 463 430
(18.7) (17.0) (12.2) (10.6) (9.0) (7.8)468 203 242 248 260 262
(14.5) (5.5) (5.8) (5.4) (5.1) (4.8)86 98 168 207 248 284
(2.7) (2.7) (4.0) (4.5) (4.8) (5.2)146 217 342 393 455 509(4.5) (5.9) (8.1) (8.5) (8.9) (9.3)
35 40 52 57 61 63(1.1) (1.1) (1.2) (1.2) (1.2) (1.2)
1,861 2,103 1,874 1,848 1,803 1,692(57.6) (57.5) (44.5) (40.0) (35.2) (30.8)1,169 1,283 1,982 2,340 2,811 3,230(36.2) (35.1) (47.1) (50.7) (54.9) (58.8)
Source: International Energy Agency "World Energy Balances" (historical)
Note: Figures in parentheses are global shares (%). World includes international bunkers.
1.01.2 1.3 1.0 0.7
-0.6
1.8
0.0 -0.2 -0.2
1.5
1.8 1.3 0.7
1.1
0.3
-0.4
1.42.3 2.4 1.9
0.7
2.0
-2.8 0.3
1.42.9 3.0 1.8
2.6
-0.3
-0.2
-0.7
2.2 0.9 1.4 1.0
0.1
-0.8 -0.6
0.6
-0.8
-0.7 -0.7 -0.5 -0.8 -0.7
0.4
2.4
-0.4
4.4
2.1
3.2
-1.3 -1.5
-0.9
2.7
4.9
-0.3
2.31.7
-0.8
4.5
2.6
1.3
4.3
0.6
2.9
1.7
4.2
2.5
1.9
2.9 0.5 0.0 0.0
2.1 1.4 0.3
-1.2-0.9 -2.1
3.1 2.4 1.5
1.2
India
1.8 1.8
6.2 3.2 1.7
3.52.64.7 3.5
Asia
CAGR (%)
Japan
5.0
3.7 2.8
4.5 3.0
4.8 2.4
1.5 1.8
ASEAN
Korea
Chinese Taipei
4.7
3.8 2.9
1.0
2.0
2.6
3.5
1.3
China 1.9
6.0 4.3
0.1
7.9 4.4 5.7
1.6
-0.4
0.1
2.2
4.7 3.2 2.1
0.1 -0.1
OECD
Non-OECD
Oceania
Viet Nam
Singapore
3.8 2.0 1.5
0.0 -0.2
0.3 0.5
Thailand
World
North America
United States
Latin America
OECD Europe
Non-OECD Europe
European Union
Africa
Middle East
Asia excl. Japan
Myanmar
Indonesia
Malaysia
Philippines
IEEJ:February 2016 © IEEJ2016
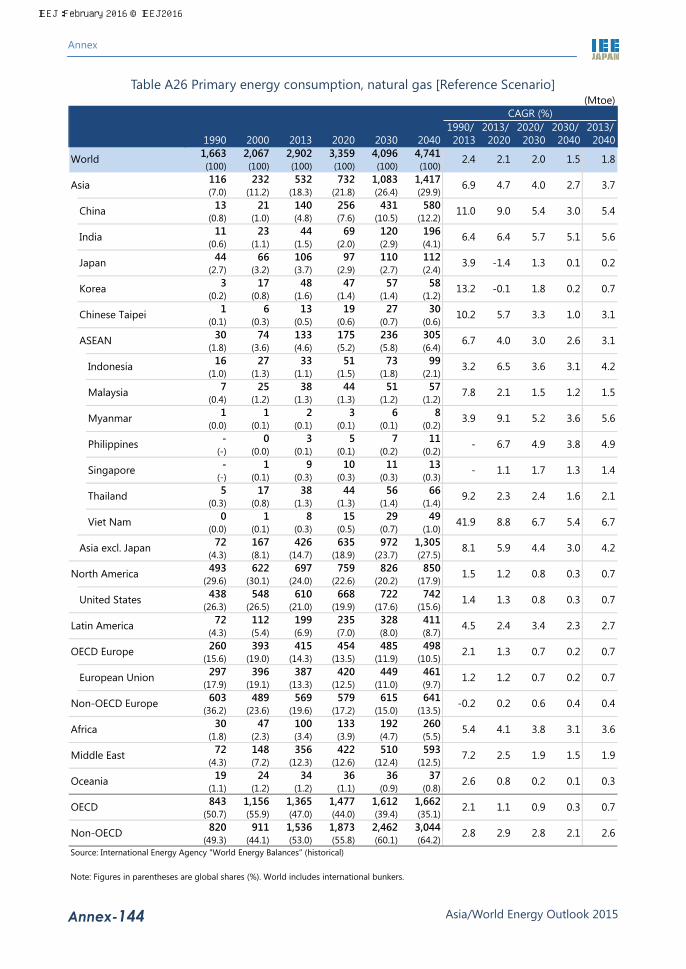
Annex
Asia/World Energy Outlook 2015 Annex-144
Table A26 Primary energy consumption, natural gas [Reference Scenario] (Mtoe)
1990/ 2013/ 2020/ 2030/ 2013/1990 2000 2013 2020 2030 2040 2013 2020 2030 2040 2040
1,663 2,067 2,902 3,359 4,096 4,741(100) (100) (100) (100) (100) (100)116 232 532 732 1,083 1,417(7.0) (11.2) (18.3) (21.8) (26.4) (29.9)
13 21 140 256 431 580(0.8) (1.0) (4.8) (7.6) (10.5) (12.2)
11 23 44 69 120 196(0.6) (1.1) (1.5) (2.0) (2.9) (4.1)
44 66 106 97 110 112(2.7) (3.2) (3.7) (2.9) (2.7) (2.4)
3 17 48 47 57 58(0.2) (0.8) (1.6) (1.4) (1.4) (1.2)
1 6 13 19 27 30(0.1) (0.3) (0.5) (0.6) (0.7) (0.6)
30 74 133 175 236 305(1.8) (3.6) (4.6) (5.2) (5.8) (6.4)
16 27 33 51 73 99(1.0) (1.3) (1.1) (1.5) (1.8) (2.1)
7 25 38 44 51 57(0.4) (1.2) (1.3) (1.3) (1.2) (1.2)
1 1 2 3 6 8(0.0) (0.1) (0.1) (0.1) (0.1) (0.2)
- 0 3 5 7 11(-) (0.0) (0.1) (0.1) (0.2) (0.2)- 1 9 10 11 13
(-) (0.1) (0.3) (0.3) (0.3) (0.3)5 17 38 44 56 66
(0.3) (0.8) (1.3) (1.3) (1.4) (1.4)0 1 8 15 29 49
(0.0) (0.1) (0.3) (0.5) (0.7) (1.0)72 167 426 635 972 1,305
(4.3) (8.1) (14.7) (18.9) (23.7) (27.5)493 622 697 759 826 850
(29.6) (30.1) (24.0) (22.6) (20.2) (17.9)438 548 610 668 722 742
(26.3) (26.5) (21.0) (19.9) (17.6) (15.6)72 112 199 235 328 411
(4.3) (5.4) (6.9) (7.0) (8.0) (8.7)260 393 415 454 485 498
(15.6) (19.0) (14.3) (13.5) (11.9) (10.5)297 396 387 420 449 461
(17.9) (19.1) (13.3) (12.5) (11.0) (9.7)603 489 569 579 615 641
(36.2) (23.6) (19.6) (17.2) (15.0) (13.5)30 47 100 133 192 260
(1.8) (2.3) (3.4) (3.9) (4.7) (5.5)72 148 356 422 510 593
(4.3) (7.2) (12.3) (12.6) (12.4) (12.5)19 24 34 36 36 37
(1.1) (1.2) (1.2) (1.1) (0.9) (0.8)843 1,156 1,365 1,477 1,612 1,662
(50.7) (55.9) (47.0) (44.0) (39.4) (35.1)820 911 1,536 1,873 2,462 3,044
(49.3) (44.1) (53.0) (55.8) (60.1) (64.2)Source: International Energy Agency "World Energy Balances" (historical)
Note: Figures in parentheses are global shares (%). World includes international bunkers.
2.8
0.7
2.8 2.9
0.3
2.1
1.82.4 2.1 2.0 1.5
2.6
0.3
7.2 2.5 1.9 1.9
2.6 0.8 0.2
1.5
0.1
0.1
3.6
-0.2 0.2 0.6 0.4
5.4 4.1 3.8
0.4
3.1
1.3 1.4
5.2
3.13.6
1.5
2.6
1.2
3.0
5.63.6
4.9 4.93.8
1.5
4.2
3.1
0.7
3.1
3.3
CAGR (%)
2.7
3.0
5.6
5.4
6.9 4.7 3.7
9.0
6.4 6.4 5.1
0.2
5.4
4.0
0.2
1.0
1.8
3.9 9.1
3.2 6.5
-
3.9 -1.4 1.3
China
Indonesia
India
Japan
ASEAN
Myanmar
5.7
13.2 -0.1
10.2
5.7
0.9
Middle East
Asia
6.7
7.8
11.0
2.1 1.1
5.9
1.5 1.2
Thailand
Korea
Malaysia
Philippines
Chinese Taipei
2.1
6.7
4.0
9.2 2.3
41.9 8.8
-
0.8
4.5 2.4 3.4
2.1 1.3 0.7
2.4
1.71.1
8.1
0.71.2 1.2 0.7 0.2
5.4
3.0
1.6
6.7
0.7
4.2
0.3
0.7
2.7
0.2
2.3
1.4 1.3 0.8 0.3 0.7
2.1
6.7
4.4
Non-OECD
Asia excl. Japan
World
North America
United States
Latin America
OECD Europe
Non-OECD Europe
European Union
Africa
Viet Nam
Oceania
OECD
Singapore
IEEJ:February 2016 © IEEJ2016

Annex
Asia/World Energy Outlook 2015 Annex-145
Table A27 Final energy consumption [Reference Scenario] (Mtoe)
1990/ 2013/ 2020/ 2030/ 2013/1990 2000 2013 2020 2030 2040 2013 2020 2030 2040 2040
6,281 7,085 9,173 10,309 11,735 12,991(100) (100) (100) (100) (100) (100)
1,572 2,039 3,476 4,088 4,829 5,581(25.0) (28.8) (37.9) (39.7) (41.1) (43.0)664 815 1,814 2,106 2,381 2,604
(10.6) (11.5) (19.8) (20.4) (20.3) (20.0)243 315 528 673 889 1,169(3.9) (4.5) (5.8) (6.5) (7.6) (9.0)298 341 311 313 305 289(4.7) (4.8) (3.4) (3.0) (2.6) (2.2)
65 127 168 185 199 197(1.0) (1.8) (1.8) (1.8) (1.7) (1.5)
29 49 68 75 81 82(0.5) (0.7) (0.7) (0.7) (0.7) (0.6)173 271 425 532 701 897(2.8) (3.8) (4.6) (5.2) (6.0) (6.9)
80 121 162 205 269 351(1.3) (1.7) (1.8) (2.0) (2.3) (2.7)
14 30 54 69 87 103(0.2) (0.4) (0.6) (0.7) (0.7) (0.8)
9 11 15 17 22 28(0.1) (0.2) (0.2) (0.2) (0.2) (0.2)
20 24 26 33 44 57(0.3) (0.3) (0.3) (0.3) (0.4) (0.4)
5 8 20 23 28 31(0.1) (0.1) (0.2) (0.2) (0.2) (0.2)
29 51 96 115 144 173(0.5) (0.7) (1.0) (1.1) (1.2) (1.3)
16 25 51 68 105 151(0.3) (0.4) (0.6) (0.7) (0.9) (1.2)
1,275 1,698 3,165 3,775 4,524 5,291(20.3) (24.0) (34.5) (36.6) (38.6) (40.7)1,452 1,736 1,694 1,752 1,785 1,740(23.1) (24.5) (18.5) (17.0) (15.2) (13.4)1,294 1,546 1,495 1,538 1,557 1,506(20.6) (21.8) (16.3) (14.9) (13.3) (11.6)344 449 610 685 841 963(5.5) (6.3) (6.6) (6.6) (7.2) (7.4)
1,122 1,225 1,219 1,256 1,268 1,254(17.9) (17.3) (13.3) (12.2) (10.8) (9.7)1,130 1,176 1,139 1,176 1,190 1,179(18.0) (16.6) (12.4) (11.4) (10.1) (9.1)1,073 654 704 757 838 896(17.1) (9.2) (7.7) (7.3) (7.1) (6.9)292 370 555 673 846 1,028(4.6) (5.2) (6.0) (6.5) (7.2) (7.9)157 255 467 558 685 801(2.5) (3.6) (5.1) (5.4) (5.8) (6.2)
66 83 94 105 114 120(1.1) (1.2) (1.0) (1.0) (1.0) (0.9)
3,099 3,631 3,631 3,783 3,867 3,819(49.3) (51.2) (39.6) (36.7) (33.0) (29.4)2,980 3,180 5,188 6,091 7,339 8,564(47.4) (44.9) (56.6) (59.1) (62.5) (65.9)
Source: International Energy Agency "World Energy Balances" (historical)
Note: Figures in parentheses are global shares (%). World includes international bunkers.
1.9
0.2
2.4 2.3
-0.1
1.6
1.31.7 1.7 1.3 1.0
1.9
0.9
4.9 2.6 2.1 2.0
1.5 1.6 0.8
1.6
0.5
-0.5
2.3
-1.8 1.0 1.0 0.9
2.8 2.8 2.3
0.7
2.0
1.0 1.7
2.2
2.72.8
2.3
2.5
1.8
2.8
2.22.4
2.9 3.02.8
2.4
2.9
0.7
0.6
2.8
0.7
CAGR (%)
1.5
0.9
3.0
1.3
3.5 2.3 1.8
2.2
3.4 3.5 2.8
-0.3
1.2
1.7
-0.1
0.2
0.7
2.1 2.0
3.1 3.4
1.2
0.2 0.1 -0.2
China
Indonesia
India
Japan
ASEAN
Myanmar
1.6
4.2 1.4
3.7
2.8
0.2
Middle East
Asia
4.0
6.1
4.5
0.7 0.6
2.6
0.7 0.5
Thailand
Korea
Malaysia
Philippines
Chinese Taipei
3.5
3.4
3.3
5.4 2.6
5.2 4.1
6.1
0.2
2.5 1.7 2.1
0.4 0.4 0.1
2.3
1.92.5
4.0
0.10.0 0.5 0.1 -0.1
3.7
1.6
1.8
4.1
0.1
1.9
-0.3
0.1
1.7
-0.1
1.4
0.6 0.4 0.1 -0.3 0.0
2.2
4.5
1.8
Non-OECD
Asia excl. Japan
World
North America
United States
Latin America
OECD Europe
Non-OECD Europe
European Union
Africa
Viet Nam
Oceania
OECD
Singapore
IEEJ:February 2016 © IEEJ2016

Annex
Asia/World Energy Outlook 2015 Annex-146
Table A28 Final energy consumption, industry [Reference Scenario] (Mtoe)
1990/ 2013/ 2020/ 2030/ 2013/1990 2000 2013 2020 2030 2040 2013 2020 2030 2040 2040
1,807 1,895 2,623 2,930 3,311 3,678(100) (100) (100) (100) (100) (100)518 672 1,367 1,567 1,761 1,965
(28.7) (35.5) (52.1) (53.5) (53.2) (53.4)244 329 878 960 987 997
(13.5) (17.3) (33.5) (32.8) (29.8) (27.1)67 83 179 230 312 424
(3.7) (4.4) (6.8) (7.9) (9.4) (11.5)101 96 82 89 89 87(5.6) (5.1) (3.1) (3.0) (2.7) (2.4)
19 38 48 55 59 58(1.1) (2.0) (1.8) (1.9) (1.8) (1.6)
12 19 23 26 27 28(0.7) (1.0) (0.9) (0.9) (0.8) (0.8)
43 76 116 153 212 279(2.4) (4.0) (4.4) (5.2) (6.4) (7.6)
18 31 37 51 74 102(1.0) (1.6) (1.4) (1.8) (2.2) (2.8)
6 12 15 20 25 30(0.3) (0.6) (0.6) (0.7) (0.8) (0.8)
0 1 2 3 4 6(0.0) (0.1) (0.1) (0.1) (0.1) (0.2)
5 5 7 9 11 14(0.3) (0.3) (0.3) (0.3) (0.3) (0.4)
1 2 6 7 8 9(0.0) (0.1) (0.2) (0.2) (0.3) (0.3)
9 17 30 35 45 55(0.5) (0.9) (1.1) (1.2) (1.4) (1.5)
5 8 19 28 44 63(0.3) (0.4) (0.7) (0.9) (1.3) (1.7)417 576 1,285 1,478 1,672 1,878
(23.1) (30.4) (49.0) (50.4) (50.5) (51.1)331 387 309 318 314 303
(18.3) (20.4) (11.8) (10.9) (9.5) (8.2)284 332 261 267 257 243
(15.7) (17.5) (10.0) (9.1) (7.8) (6.6)115 148 199 220 279 335(6.3) (7.8) (7.6) (7.5) (8.4) (9.1)323 323 281 294 296 292
(17.9) (17.1) (10.7) (10.0) (9.0) (7.9)343 308 258 270 274 273
(19.0) (16.2) (9.8) (9.2) (8.3) (7.4)396 206 203 211 254 287
(21.9) (10.9) (7.7) (7.2) (7.7) (7.8)55 58 85 107 142 183
(3.0) (3.0) (3.2) (3.7) (4.3) (5.0)47 73 150 180 231 277
(2.6) (3.8) (5.7) (6.1) (7.0) (7.5)23 28 29 33 35 36
(1.3) (1.5) (1.1) (1.1) (1.0) (1.0)826 908 794 839 851 843
(45.7) (47.9) (30.3) (28.6) (25.7) (22.9)981 987 1,830 2,091 2,460 2,835
(54.3) (52.1) (69.7) (71.4) (74.3) (77.1)Source: International Energy Agency "World Energy Balances" (historical)
Note: Figures in parentheses are global shares (%).
1.6
0.2
2.7 1.9
-0.1
1.4
1.31.6 1.6 1.2 1.1
1.6
0.7
5.2 2.6 2.5 2.3
1.1 1.5 0.6
1.8
0.3
-0.1
2.9
-2.9 0.6 1.8 1.3
1.9 3.4 2.9
1.3
2.5
1.2 1.8
4.5
3.23.7
2.3
2.8
1.8
3.3
4.54.4
2.6 2.72.4
2.6
3.8
0.7
0.7
3.3
0.7
CAGR (%)
1.1
0.1
3.2
0.5
4.3 2.0 1.4
1.3
4.4 3.7 3.1
0.2
0.3
1.2
-0.3
0.2
0.8
7.1 4.7
3.1 4.9
1.7
-0.9 1.1 0.0
China
Indonesia
India
Japan
ASEAN
Myanmar
1.5
4.0 2.0
2.8
3.1
0.1
Middle East
Asia
4.5
4.5
5.7
-0.2 0.8
2.0
-0.3 0.4
Thailand
Korea
Malaysia
Philippines
Chinese Taipei
4.1
3.2
4.0
5.5 2.4
6.5 5.2
10.4
-0.1
2.4 1.5 2.4
-0.6 0.6 0.1
2.5
2.12.3
5.0
0.2-1.2 0.7 0.2 -0.1
3.6
1.2
2.0
4.4
-0.1
1.4
-0.4
0.1
2.0
-0.1
1.9
-0.4 0.3 -0.4 -0.6 -0.3
2.3
4.8
1.2
Non-OECD
Asia excl. Japan
World
North America
United States
Latin America
OECD Europe
Non-OECD Europe
European Union
Africa
Viet Nam
Oceania
OECD
Singapore
IEEJ:February 2016 © IEEJ2016

Annex
Asia/World Energy Outlook 2015 Annex-147
Table A29 Final energy consumption, transport [Reference Scenario] (Mtoe)
1990/ 2013/ 2020/ 2030/ 2013/1990 2000 2013 2020 2030 2040 2013 2020 2030 2040 2040
1,576 1,965 2,552 2,884 3,291 3,589(100) (100) (100) (100) (100) (100)190 325 581 727 927 1,123
(12.1) (16.6) (22.8) (25.2) (28.2) (31.3)33 88 245 321 410 489
(2.1) (4.5) (9.6) (11.1) (12.5) (13.6)21 32 75 110 163 212
(1.3) (1.6) (2.9) (3.8) (5.0) (5.9)72 88 73 70 62 55
(4.6) (4.5) (2.9) (2.4) (1.9) (1.5)15 26 31 32 33 30
(0.9) (1.3) (1.2) (1.1) (1.0) (0.8)7 12 12 13 14 13
(0.4) (0.6) (0.5) (0.5) (0.4) (0.4)32 62 112 140 189 250
(2.1) (3.1) (4.4) (4.9) (5.8) (7.0)11 22 46 61 85 117
(0.7) (1.1) (1.8) (2.1) (2.6) (3.3)5 10 19 23 27 30
(0.3) (0.5) (0.8) (0.8) (0.8) (0.8)0 1 1 2 4 6
(0.0) (0.1) (0.1) (0.1) (0.1) (0.2)5 8 9 12 17 24
(0.3) (0.4) (0.3) (0.4) (0.5) (0.7)1 2 3 3 3 4
(0.1) (0.1) (0.1) (0.1) (0.1) (0.1)9 15 23 25 27 27
(0.6) (0.7) (0.9) (0.9) (0.8) (0.8)1 3 10 14 26 42
(0.1) (0.2) (0.4) (0.5) (0.8) (1.2)118 237 507 658 865 1,068(7.5) (12.1) (19.9) (22.8) (26.3) (29.8)531 640 669 684 679 634
(33.7) (32.6) (26.2) (23.7) (20.6) (17.7)488 588 608 618 611 569
(30.9) (29.9) (23.8) (21.4) (18.6) (15.9)103 141 216 252 312 346(6.5) (7.2) (8.5) (8.7) (9.5) (9.6)266 316 320 314 299 276
(16.9) (16.1) (12.6) (10.9) (9.1) (7.7)259 304 303 300 286 263
(16.4) (15.5) (11.9) (10.4) (8.7) (7.3)172 110 144 155 170 178
(10.9) (5.6) (5.7) (5.4) (5.2) (5.0)38 54 97 121 145 164
(2.4) (2.8) (3.8) (4.2) (4.4) (4.6)50 74 135 155 189 216
(3.2) (3.8) (5.3) (5.4) (5.7) (6.0)24 30 36 39 42 44
(1.5) (1.5) (1.4) (1.3) (1.3) (1.2)938 1,143 1,189 1,215 1,202 1,133
(59.6) (58.1) (46.6) (42.1) (36.5) (31.6)435 549 1,009 1,233 1,560 1,847
(27.6) (27.9) (39.5) (42.8) (47.4) (51.5)Source: International Energy Agency "World Energy Balances" (historical)
Note: Figures in parentheses are global shares (%). World includes international bunkers.
2.4
-0.2
3.7 2.9
-0.6
1.7
1.32.1 1.8 1.3 0.9
2.3
0.7
4.4 2.1 1.9 1.8
1.7 1.2 0.7
1.4
0.4
-1.1
2.0
-0.8 1.0 0.9 0.8
4.2 3.3 1.8
0.5
1.2
0.1 1.0
5.7
3.33.4
1.6
2.8
1.0
3.0
5.65.5
3.7 3.83.4
1.6
3.5
0.3
-0.1
3.0
0.4
CAGR (%)
1.9
1.8
3.9
2.6
5.0 3.3 2.5
3.9
5.7 5.7 2.6
-1.0
2.5
2.5
-0.7
-0.2
0.1
5.0 5.7
6.6 4.0
2.9
0.1 -0.8 -1.1
China
Indonesia
India
Japan
ASEAN
Myanmar
1.1
3.4 0.4
2.6
4.0
-0.1
Middle East
Asia
5.5
6.3
9.1
1.0 0.3
3.8
1.0 0.3
Thailand
Korea
Malaysia
Philippines
Chinese Taipei
2.5
4.4
3.3
4.1 1.4
9.2 4.5
3.0
-0.1
3.3 2.2 2.2
0.8 -0.3 -0.5
0.6
0.92.5
6.5
-0.50.7 -0.1 -0.5 -0.8
4.7
2.1
0.3
5.3
-0.2
2.8
-0.7
-0.6
1.8
-0.8
1.0
1.0 0.2 -0.1 -0.7 -0.2
0.7
6.4
2.8
Non-OECD
Asia excl. Japan
World
North America
United States
Latin America
OECD Europe
Non-OECD Europe
European Union
Africa
Viet Nam
Oceania
OECD
Singapore
IEEJ:February 2016 © IEEJ2016
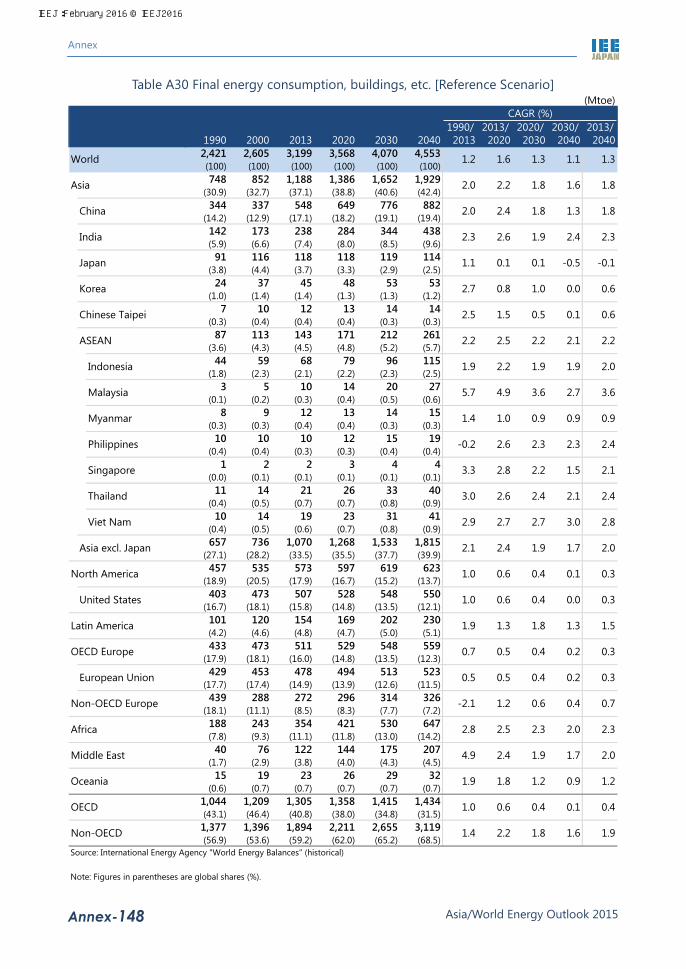
Annex
Asia/World Energy Outlook 2015 Annex-148
Table A30 Final energy consumption, buildings, etc. [Reference Scenario] (Mtoe)
1990/ 2013/ 2020/ 2030/ 2013/1990 2000 2013 2020 2030 2040 2013 2020 2030 2040 2040
2,421 2,605 3,199 3,568 4,070 4,553(100) (100) (100) (100) (100) (100)748 852 1,188 1,386 1,652 1,929
(30.9) (32.7) (37.1) (38.8) (40.6) (42.4)344 337 548 649 776 882
(14.2) (12.9) (17.1) (18.2) (19.1) (19.4)142 173 238 284 344 438(5.9) (6.6) (7.4) (8.0) (8.5) (9.6)
91 116 118 118 119 114(3.8) (4.4) (3.7) (3.3) (2.9) (2.5)
24 37 45 48 53 53(1.0) (1.4) (1.4) (1.3) (1.3) (1.2)
7 10 12 13 14 14(0.3) (0.4) (0.4) (0.4) (0.3) (0.3)
87 113 143 171 212 261(3.6) (4.3) (4.5) (4.8) (5.2) (5.7)
44 59 68 79 96 115(1.8) (2.3) (2.1) (2.2) (2.3) (2.5)
3 5 10 14 20 27(0.1) (0.2) (0.3) (0.4) (0.5) (0.6)
8 9 12 13 14 15(0.3) (0.3) (0.4) (0.4) (0.3) (0.3)
10 10 10 12 15 19(0.4) (0.4) (0.3) (0.3) (0.4) (0.4)
1 2 2 3 4 4(0.0) (0.1) (0.1) (0.1) (0.1) (0.1)
11 14 21 26 33 40(0.4) (0.5) (0.7) (0.7) (0.8) (0.9)
10 14 19 23 31 41(0.4) (0.5) (0.6) (0.7) (0.8) (0.9)657 736 1,070 1,268 1,533 1,815
(27.1) (28.2) (33.5) (35.5) (37.7) (39.9)457 535 573 597 619 623
(18.9) (20.5) (17.9) (16.7) (15.2) (13.7)403 473 507 528 548 550
(16.7) (18.1) (15.8) (14.8) (13.5) (12.1)101 120 154 169 202 230(4.2) (4.6) (4.8) (4.7) (5.0) (5.1)433 473 511 529 548 559
(17.9) (18.1) (16.0) (14.8) (13.5) (12.3)429 453 478 494 513 523
(17.7) (17.4) (14.9) (13.9) (12.6) (11.5)439 288 272 296 314 326
(18.1) (11.1) (8.5) (8.3) (7.7) (7.2)188 243 354 421 530 647(7.8) (9.3) (11.1) (11.8) (13.0) (14.2)
40 76 122 144 175 207(1.7) (2.9) (3.8) (4.0) (4.3) (4.5)
15 19 23 26 29 32(0.6) (0.7) (0.7) (0.7) (0.7) (0.7)
1,044 1,209 1,305 1,358 1,415 1,434(43.1) (46.4) (40.8) (38.0) (34.8) (31.5)1,377 1,396 1,894 2,211 2,655 3,119(56.9) (53.6) (59.2) (62.0) (65.2) (68.5)
Source: International Energy Agency "World Energy Balances" (historical)
Note: Figures in parentheses are global shares (%).
1.31.2 1.6 1.3 1.1
0.1
1.9
1.0 0.6 0.4
2.0
1.9 1.8 1.2
1.7
0.9
0.4
1.61.4 2.2 1.8
1.2
2.3
-2.1 0.7
2.02.8 2.5 2.3
2.2
0.0
0.1
0.3
1.9 1.3 1.8 1.5
0.4
0.5 0.4
1.3
0.2
0.5 0.5 0.4 0.2 0.3
0.6
2.1
0.3
3.0
2.4
2.3
-0.5 -0.1
0.0
2.2
2.8
0.3
2.01.7
0.1
0.9
1.9
2.7
0.9
1.5
2.3
2.1
0.9
1.9
3.6
2.7 0.8 1.0 0.6
2.5 1.5 0.5
0.11.1 0.1
2.0 2.2 1.6
1.3
India
1.8 1.8
2.0 2.4 1.8
2.32.42.3 1.9
Asia
CAGR (%)
Japan
2.6
1.9 2.2
5.7 4.9
3.0 2.6
3.3 2.8
ASEAN
Korea
Chinese Taipei
2.6
2.2 2.5
-0.2
3.6
2.0
2.4
2.1
China 1.8
1.4 1.0
1.0
2.9 2.7 2.7
2.2
0.7
1.0
2.4
2.1 2.4 1.9
0.6 0.4
OECD
Non-OECD
Oceania
Viet Nam
Singapore
4.9 2.4 1.9
0.6 0.4
1.2 0.6
Thailand
World
North America
United States
Latin America
OECD Europe
Non-OECD Europe
European Union
Africa
Middle East
Asia excl. Japan
Myanmar
Indonesia
Malaysia
Philippines
IEEJ:February 2016 © IEEJ2016

Annex
Asia/World Energy Outlook 2015 Annex-149
Table A31 Final energy consumption, electricity [Reference Scenario] (TWh)
1990/ 2013/ 2020/ 2030/ 2013/1990 2000 2013 2020 2030 2040 2013 2020 2030 2040 2040
9,695 12,688 19,494 23,110 28,440 33,613(100) (100) (100) (100) (100) (100)
1,812 3,229 7,981 10,211 13,438 16,751(18.7) (25.4) (40.9) (44.2) (47.2) (49.8)454 1,037 4,492 5,741 7,180 8,315(4.7) (8.2) (23.0) (24.8) (25.2) (24.7)215 376 890 1,266 2,090 3,283(2.2) (3.0) (4.6) (5.5) (7.4) (9.8)750 944 950 1,026 1,104 1,133(7.7) (7.4) (4.9) (4.4) (3.9) (3.4)
94 263 487 595 717 750(1.0) (2.1) (2.5) (2.6) (2.5) (2.2)
77 160 227 255 285 301(0.8) (1.3) (1.2) (1.1) (1.0) (0.9)130 320 713 1,015 1,589 2,332(1.3) (2.5) (3.7) (4.4) (5.6) (6.9)
28 79 188 303 501 768(0.3) (0.6) (1.0) (1.3) (1.8) (2.3)
20 61 127 170 246 336(0.2) (0.5) (0.7) (0.7) (0.9) (1.0)
2 3 9 16 30 51(0.0) (0.0) (0.0) (0.1) (0.1) (0.2)
21 37 62 85 125 173(0.2) (0.3) (0.3) (0.4) (0.4) (0.5)
13 27 46 51 61 69(0.1) (0.2) (0.2) (0.2) (0.2) (0.2)
38 88 164 202 289 388(0.4) (0.7) (0.8) (0.9) (1.0) (1.2)
6 22 114 184 332 541(0.1) (0.2) (0.6) (0.8) (1.2) (1.6)
1,063 2,285 7,031 9,185 12,334 15,619(11.0) (18.0) (36.1) (39.7) (43.4) (46.5)3,052 3,981 4,267 4,671 5,066 5,239(31.5) (31.4) (21.9) (20.2) (17.8) (15.6)2,634 3,499 3,782 4,115 4,470 4,609(27.2) (27.6) (19.4) (17.8) (15.7) (13.7)517 810 1,267 1,478 1,997 2,492(5.3) (6.4) (6.5) (6.4) (7.0) (7.4)
2,230 2,710 3,048 3,323 3,584 3,774(23.0) (21.4) (15.6) (14.4) (12.6) (11.2)2,163 2,531 2,771 3,011 3,259 3,443(22.3) (19.9) (14.2) (13.0) (11.5) (10.2)1,471 1,011 1,256 1,332 1,587 1,831(15.2) (8.0) (6.4) (5.8) (5.6) (5.4)257 361 595 769 1,056 1,401(2.7) (2.8) (3.1) (3.3) (3.7) (4.2)199 379 835 1,052 1,405 1,784(2.0) (3.0) (4.3) (4.6) (4.9) (5.3)157 207 244 275 309 340(1.6) (1.6) (1.3) (1.2) (1.1) (1.0)
6,399 8,304 9,304 10,258 11,256 11,838(66.0) (65.4) (47.7) (44.4) (39.6) (35.2)3,296 4,384 10,191 12,852 17,184 21,775(34.0) (34.6) (52.3) (55.6) (60.4) (64.8)
Source: International Energy Agency "World Energy Balances" (historical)
Note: Figures in parentheses are global shares (%).
2.9
0.9
5.0 3.4
0.5
2.4
2.03.1 2.5 2.1 1.7
2.9
1.2
6.4 3.3 2.9 2.8
1.9 1.7 1.2
2.4
1.0
0.3
3.2
-0.7 0.8 1.8 1.4
3.7 3.7 3.2
1.4
2.9
1.3 1.5
6.6
4.45.2
3.8
3.9
3.1
4.6
6.75.3
3.9 3.93.3
3.7
5.3
1.1
1.6
4.5
1.1
CAGR (%)
2.2
1.5
5.0
2.3
6.7 3.6 2.8
3.6
6.4 5.2 4.6
0.7
2.3
2.8
0.5
0.5
1.9
7.3 9.2
8.6 7.0
4.7
1.0 1.1 0.7
China
Indonesia
India
Japan
ASEAN
Myanmar
1.7
7.4 2.9
4.8
5.1
0.9
Middle East
Asia
7.7
8.4
10.5
1.6 1.4
3.9
1.5 1.3
Thailand
Korea
Malaysia
Philippines
Chinese Taipei
4.2
4.7
5.2
6.5 3.0
13.5 7.0
5.6
0.8
4.0 2.2 3.1
1.4 1.2 0.8
3.6
1.81.5
8.6
0.81.1 1.2 0.8 0.5
5.0
2.4
3.0
5.9
0.8
3.0
0.3
0.8
2.5
0.5
2.2
1.6 1.2 0.8 0.3 0.7
3.2
6.1
3.0
Non-OECD
Asia excl. Japan
World
North America
United States
Latin America
OECD Europe
Non-OECD Europe
European Union
Africa
Viet Nam
Oceania
OECD
Singapore
IEEJ:February 2016 © IEEJ2016

Annex
Asia/World Energy Outlook 2015 Annex-150
Table A32 Electricity generation [Reference Scenario] (TWh)
1990/ 2013/ 2020/ 2030/ 2013/1990 2000 2013 2020 2030 2040 2013 2020 2030 2040 2040
11,826 15,426 23,307 27,414 33,547 39,509(100) (100) (100) (100) (100) (100)
2,215 3,974 9,481 12,018 15,719 19,519(18.7) (25.8) (40.7) (43.8) (46.9) (49.4)621 1,356 5,422 6,833 8,459 9,728(5.3) (8.8) (23.3) (24.9) (25.2) (24.6)293 570 1,193 1,675 2,714 4,196(2.5) (3.7) (5.1) (6.1) (8.1) (10.6)836 1,049 1,038 1,116 1,188 1,200(7.1) (6.8) (4.5) (4.1) (3.5) (3.0)105 289 538 647 777 812(0.9) (1.9) (2.3) (2.4) (2.3) (2.1)
88 181 249 280 311 327(0.7) (1.2) (1.1) (1.0) (0.9) (0.8)154 370 786 1,117 1,738 2,538(1.3) (2.4) (3.4) (4.1) (5.2) (6.4)
33 93 216 345 570 871(0.3) (0.6) (0.9) (1.3) (1.7) (2.2)
23 69 138 185 267 363(0.2) (0.4) (0.6) (0.7) (0.8) (0.9)
2 5 12 22 40 65(0.0) (0.0) (0.1) (0.1) (0.1) (0.2)
26 45 75 104 150 206(0.2) (0.3) (0.3) (0.4) (0.4) (0.5)
16 32 48 53 63 72(0.1) (0.2) (0.2) (0.2) (0.2) (0.2)
44 96 166 201 280 367(0.4) (0.6) (0.7) (0.7) (0.8) (0.9)
9 27 127 201 361 587(0.1) (0.2) (0.5) (0.7) (1.1) (1.5)
1,380 2,925 8,442 10,903 14,531 18,319(11.7) (19.0) (36.2) (39.8) (43.3) (46.4)3,685 4,631 4,939 5,381 5,811 5,999(31.2) (30.0) (21.2) (19.6) (17.3) (15.2)3,203 4,026 4,287 4,652 5,037 5,188(27.1) (26.1) (18.4) (17.0) (15.0) (13.1)623 1,003 1,553 1,787 2,377 2,937(5.3) (6.5) (6.7) (6.5) (7.1) (7.4)
2,662 3,223 3,559 3,876 4,171 4,388(22.5) (20.9) (15.3) (14.1) (12.4) (11.1)2,576 3,005 3,230 3,511 3,806 4,041(21.8) (19.5) (13.9) (12.8) (11.3) (10.2)1,894 1,432 1,740 1,827 2,156 2,465(16.0) (9.3) (7.5) (6.7) (6.4) (6.2)316 442 732 933 1,271 1,678(2.7) (2.9) (3.1) (3.4) (3.8) (4.2)244 472 1,012 1,262 1,671 2,115(2.1) (3.1) (4.3) (4.6) (5.0) (5.4)187 249 292 329 370 408(1.6) (1.6) (1.3) (1.2) (1.1) (1.0)
7,608 9,685 10,736 11,789 12,883 13,513(64.3) (62.8) (46.1) (43.0) (38.4) (34.2)4,218 5,741 12,571 15,625 20,663 25,996(35.7) (37.2) (53.9) (57.0) (61.6) (65.8)
Source: International Energy Agency "World Energy Balances" (historical)
Note: Figures in parentheses are global shares (%).
0.9
Indonesia
Philippines
Japan
6.3
8.6
4.7 4.7
Korea
Chinese Taipei
Myanmar 7.1
ASEAN 7.3
4.6
OECD
Non-OECD
World
3.2 2.8
2.0
2.0
0.7 1.7
0.7
0.8
3.1
8.9
8.1Malaysia
North America
United States
Latin America
OECD Europe
Non-OECD Europe
European Union
Africa
Middle East
7.3
CAGR (%)
India
2.29.9 3.4 1.42.2China
4.8
2.7
5.0
2.26.5 3.4 2.7
4.5
Asia
4.9
2.03.0 2.3 2.0 1.6
1.0
4.4
0.5
1.7
0.6
1.5
0.1
3.1
1.1
2.7
1.0
0.4
0.5
4.37.0 5.1
5.1 4.5 3.9
4.2 3.7 3.6
5.3
1.9
0.81.3
6.3
2.9
6.0
1.3 1.2 0.8
8.2 3.7 2.9
3.8
0.3
5.0
2.3
0.7
0.7
2.4
1.5
0.3
2.7
6.5
5.8
3.0
2.7
0.9
1.2
3.1
1.3
2.8
1.0 0.8
4.9 3.2
0.5
2.3
1.5 1.3 0.9
2.8
3.7 3.5
1.7 1.2
0.6
2.4
1.0
6.4
3.2
5.0 1.5 1.8
5.0
1.3
5.9
2.9
1.2 0.5
4.0 2.1
0.81.3 1.2
2.8 3.4
3.8
12.4 6.8
1.3
2.8
-0.4
1.2
Oceania
Thailand
Viet Nam
Singapore
Asia excl. Japan
IEEJ:February 2016 © IEEJ2016

Annex
Asia/World Energy Outlook 2015 Annex-151
Table A33 GDP per capita [Reference Scenario] ($2010 thousand/person)
1990/ 2013/ 2020/ 2030/ 2013/1990 2000 2013 2020 2030 2040 2013 2020 2030 2040 2040
Source: World Bank "World Development Indicators", International Energy Agency "World Energy Balances", etc. (historical)
3.2
1.3 1.7 1.6 1.536.7 41.3
2.01.5 1.9 2.1 1.8
7.4 9.94.2 2.9
1.3
3.2 3.3 3.6
14.0 16.8
2.4
1.3
43.135.3 66.1 71.858.7
13.76.9 8.4 10.7 11.7 15.5
52.5 1.2
1.4
2.6
2.1
2.0 1.2 1.6 1.3
0.81.21.7 1.6
1.3
3.7
1.2 1.5 1.4
1.6
2.2 2.2 2.2
1.0 1.0 3.1
1.4 1.7
1.5 1.2
1.7 1.3
1.9
1.4
1.1
1.6
4.9 5.8 5.1
1.3
3.5 1.6 2.1 1.0
3.4
4.5
1.7 0.9 2.5 2.0
3.53.5 3.2 3.7
5.5
4.3
1.7 1.6
5.9
3.7 3.2 3.6
4.1
3.2 3.53.0
3.1
3.4 4.5 4.0 4.0
3.5 3.7 3.4
3.6
5.4
CAGR (%)
3.8
5.3
2.5
4.4 3.1 2.4 2.4
4.1 4.0 2.3
3.1
1.9
4.8 6.3 5.6 5.6
0.8 2.3 1.9
3.63.2
9.3 6.0
1.4 1.9 2.2 2.8
25.3 30.4 33.5 37.2
11.66.3 4.4
24.8 30.2 33.8 37.6 43.5
7.9 8.5 15.0
8.3
12.7 15.4
42.7 47.8
68.0
3.4
5.1
5.83.8
73.3
34.1
37.5 45.0
40.2
62.8
4.1
5.0
1.6
1.8
1.7
2.5
21.0
20.6
3.3
2.5
0.7
23.8 29.5
27.1
36.9 40.2 44.4 52.2
0.2
1.6
2.0
3.7
4.4 6.7
1.6 3.4 4.6
1.5
3.1
0.6
1.7
0.8
Korea
Chinese Taipei
China
India
Japan
8.8 15.1
8.2 13.7
Asia
7.1
6.75.1 9.8 13.4
4.3
8.3 14.05.5
1.6
Oceania
OECD
7.1
North America
United States
Latin America
OECD Europe
Non-OECD Europe
European Union
Africa
Middle East
Asia excl. Japan
2.5
ASEAN
Indonesia
0.4
22.2
Malaysia
Philippines
Singapore
Myanmar
Thailand
Viet Nam
36.3
Non-OECD
World
1.4
8.1 9.9 11.3
4.3
27.3 32.8
2.0 2.4 5.2
48.5 55.2
1.4 1.8
2.4
1.0
36.3 45.1 50.3
0.3
1.5
2.4
2.6 3.9 8.1 7.1 5.3
44.9
1.7 3.8
75.2
2.1
11.9
0.8 1.5
6.55.2
33.4 49.4
3.3
5.3
2.0 4.6
5.0 4.5
7.0 9.6 3.6 4.01.6 4.8
67.6
56.550.2
9.8
9.7 12.5 17.4 22.3
6.9
55.1
4.5 6.1
9.4 13.2
1.0
2.3
66.9 76.2
49.0
6.3 7.2 9.3 9.9
56.9 77.1
1.51.4
IEEJ:February 2016 © IEEJ2016

Annex
Asia/World Energy Outlook 2015 Annex-152
Table A34 Primary energy consumption per capita [Reference Scenario] (toe/person)
1990/ 2013/ 2020/ 2030/ 2013/1990 2000 2013 2020 2030 2040 2013 2020 2030 2040 2040
Source: World Bank "World Development Indicators", International Energy Agency "World Energy Balances", etc. (historical)
Note: World includes international bunkers.
1.65
1.14
3.35
2.94
0.61
2.25
5.44
0.91
1.2
0.0
1.5
3.5
-0.4
1.1
4.4
4.0
0.91 1.14
3.83
5.72
6.20
5.45
6.16
3.82
-0.1
-0.6
1.3
0.6
-0.5
2.8 0.5 0.4 0.4
0.4 -0.1 -0.6
0.3
-0.6
0.8
0.1 -0.2 -0.2
1.0 0.8
-0.4
0.0
-1.2 0.1 0.7 0.5
0.3 0.3 0.0 -0.2
0.6
1.1
1.4 1.1
-0.8
1.7
-0.3 -0.6
1.1
0.0 -0.1 0.0-0.3 0.2
-0.4 -0.3
0.1-0.2
3.6
-0.1
0.9
1.71.62.1 1.5
1.2
3.8
0.6
2.32.22.5
4.0
2.2
1.0
4.4
1.11.0
0.5
2.1
2.72.01.9 4.5 2.1
1.04.0 1.6
0.8
CAGR (%)
1.2
2.9 1.6 1.0
1.7
2.5 2.4
0.0 0.7
4.7
2.3
1.2
1.0
1.0
0.9
2.2
0.30.6 0.5 0.3 0.2
0.6
0.7
-0.1
0.30.2
2.3
0.0
3.9 1.5
3.0 1.3
0.7
1.90
2.780.77 2.23 2.50
0.72
3.04
1.721.39 1.55
3.56 4.09 3.57
2.17
3.76
0.35 0.62
4.00
3.81
5.25 5.81
0.73
0.61 0.71
0.74 2.00
4.07
0.55 0.86 1.16 1.43 1.74
1.22 2.99 3.34 3.70
0.51
1.16
4.63
0.25
5.81 6.18
1.32
2.33 2.98
0.37
5.85
5.94
3.72
4.17
3.20
4.76
3.073.14 3.12
1.84
3.12
6.95 6.81 6.438.07
1.39
0.96
0.67
3.50
5.06
1.69 3.16 3.27 3.40
4.25 4.59
4.86 5.39 5.36
4.03
1.35 1.45 1.56
1.91 1.98
0.62
1.32
8.06 6.92 6.78
4.25
3.25
5.18
1.05
0.59
0.74
2.11
0.46 0.45 0.53
0.42
0.86
0.92
2.34 4.65 5.10
0.86
2.09
1.66
4.21
1.85
0.76 0.99 1.21
7.67
3.47 3.21 3.24 3.24
6.37
2.04
4.47 3.38 3.41 3.65
3.44
3.87
0.67 0.69 0.69
1.66
Middle East
Oceania
OECD
Non-OECD
World
0.55
-0.6 -0.6
0.35
-0.8
1.8 2.10.42 0.52 0.9
1.48
2.0 2.31.49 1.81 2.6 3.0
1.9 1.9
-0.1
0.9
-0.2
0.8
Asia
North America
United States
Latin America
OECD Europe
China
India
Japan
0.27 0.31
3.78 4.83
0.27 0.67
0.73
1.47 1.68
7.66
1.66
1.91
Non-OECD Europe
European Union
Africa
Korea
Chinese Taipei
Myanmar
Indonesia
Malaysia
Philippines
Thailand
Viet Nam
Singapore
ASEAN
Asia excl. Japan
IEEJ:February 2016 © IEEJ2016
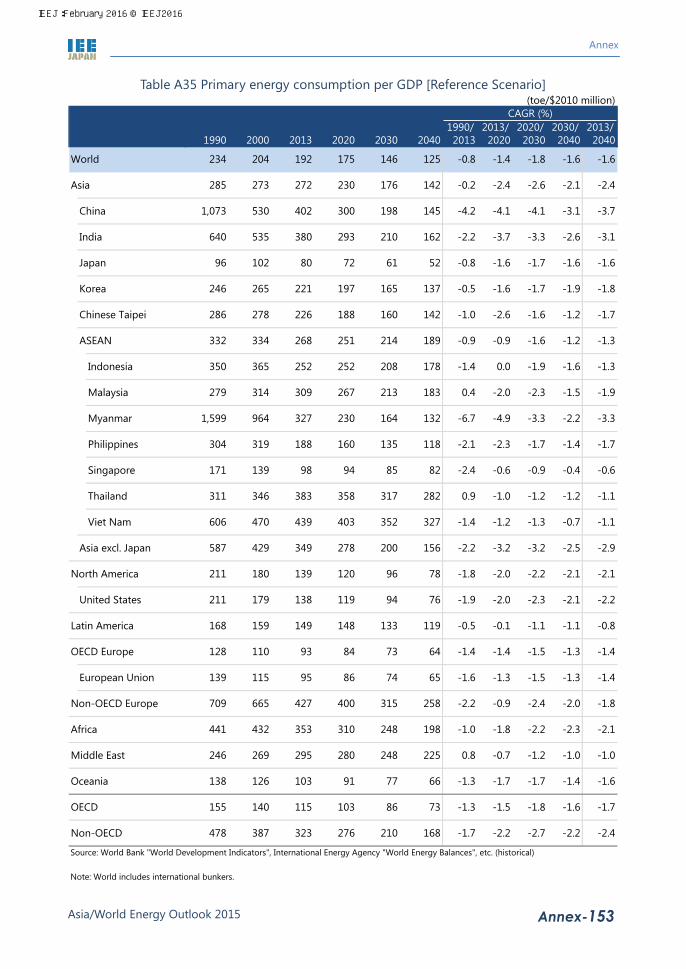
Annex
Asia/World Energy Outlook 2015 Annex-153
Table A35 Primary energy consumption per GDP [Reference Scenario] (toe/$2010 million)
1990/ 2013/ 2020/ 2030/ 2013/1990 2000 2013 2020 2030 2040 2013 2020 2030 2040 2040
Source: World Bank "World Development Indicators", International Energy Agency "World Energy Balances", etc. (historical)
Note: World includes international bunkers.
64
156
211 180 139 120 96 78
429 349587 278 200
-1.4
-0.1 -1.1
-1.5
-1.1 -0.8
-1.4 -1.4
-1.4-1.6 -1.3
-2.2
-1.6
-1.7-1.6
-1.4
-1.8
-1.7 -1.6
-0.7 -1.2
-1.7
-2.1
-2.4
-1.0
-2.2
-3.2
-2.0
-2.5
-2.1
-3.2
-1.3
-1.8
-2.2
-0.9
-1.4 0.0 -1.9
0.4 -2.0 -2.3
-3.3
-1.7 -2.2
-2.2
-2.7
-1.3 -1.5 -1.8
-1.8
-2.2
-1.0
-6.7 -4.9
-1.6
-2.2 -3.7 -3.3 -2.6
-1.6
-3.1
-1.7
-1.2 -1.3
-1.7
-1.8-1.9
-1.2-1.0 -2.6
-1.6
-1.6
61
213 183
52
165 137
160 142
164 132
383
98 94
-0.8 -1.6
208 178
309 267
72
160
268 251 214 189 -0.9 -0.9
-2.1 -2.3
82
197
135 118
317
CAGR (%)
-3.7
-0.2 -2.4 -2.6 -2.4
-4.2 -4.1
-2.1
-3.1-4.1
-0.8 -1.4 -1.8 -1.6
285 273 272 142
162
145
230
China
India 293
402
176
210
1983001,073 530
380640 535
Asia
188
327 230
96 102 80
332
350 365
279 314
221
334
252
311
606
Korea
Chinese Taipei
Myanmar
470 439
265
171 139
188304 319
1,599 964
252
ASEAN
Indonesia
Malaysia
246
286 278 226
346
665 427
179 138
310 248441 432 353
159
128 110
315
139 115 95 86 74
709
149
93
168
211
146 125234 204 192 175
77 66
86 73155 140 115 103
258
280
138 126 103 91
248 225246 269
210 168478 387 323 276
-0.5 -1.6 -1.7
-2.3-1.9 -2.0119 94 76
65
148 133 -0.5
84 73
119
-1.5
295
-3.3
-1.9
-1.3-1.6
-1.5
-2.2
-0.9 -0.6
-1.1
-1.7-1.4
-2.1
-1.1
-0.4
-1.2
-0.7
-1.7
-2.9
-2.2
403
85
358
400
198
-2.4 -2.0
0.8
-1.3
-2.3
-1.0
352
282
327 -1.4 -1.2 -1.3
0.9 -1.0
-2.4 -0.6
-1.2
-1.3
-2.1
OECD
Non-OECD
World
North America
United States
Latin America
OECD Europe
Non-OECD Europe
European Union
Africa
Middle East
Asia excl. Japan
Thailand
Viet Nam
Philippines
Singapore
Japan
Oceania
IEEJ:February 2016 © IEEJ2016

Annex
Asia/World Energy Outlook 2015 Annex-154
Table A36 Energy–related carbon dioxide emissions [Reference Scenario] (Mt)
1990/ 2013/ 2020/ 2030/ 2013/1990 2000 2013 2020 2030 2040 2013 2020 2030 2040 2040
21,200 23,520 32,920 35,719 39,498 42,693(100) (100) (100) (100) (100) (100)
4,920 6,989 14,936 16,874 19,447 21,966(23.2) (29.7) (45.4) (47.2) (49.2) (51.4)2,339 3,258 9,437 10,406 11,196 11,627(11.0) (13.9) (28.7) (29.1) (28.3) (27.2)546 901 1,894 2,480 3,459 4,757(2.6) (3.8) (5.8) (6.9) (8.8) (11.1)
1,070 1,196 1,234 1,120 1,105 1,034(5.0) (5.1) (3.7) (3.1) (2.8) (2.4)239 433 582 583 631 606(1.1) (1.8) (1.8) (1.6) (1.6) (1.4)115 225 255 272 285 282(0.5) (1.0) (0.8) (0.8) (0.7) (0.7)362 710 1,162 1,519 2,102 2,814(1.7) (3.0) (3.5) (4.3) (5.3) (6.6)134 262 406 582 836 1,158(0.6) (1.1) (1.2) (1.6) (2.1) (2.7)
54 120 222 269 327 377(0.3) (0.5) (0.7) (0.8) (0.8) (0.9)
4 10 14 22 35 54(0.0) (0.0) (0.0) (0.1) (0.1) (0.1)
39 69 90 117 171 235(0.2) (0.3) (0.3) (0.3) (0.4) (0.6)
29 48 45 48 55 59(0.1) (0.2) (0.1) (0.1) (0.1) (0.1)
81 152 254 288 352 411(0.4) (0.6) (0.8) (0.8) (0.9) (1.0)
17 43 125 185 319 512(0.1) (0.2) (0.4) (0.5) (0.8) (1.2)
3,850 5,793 13,702 15,754 18,342 20,932(18.2) (24.6) (41.6) (44.1) (46.4) (49.0)5,236 6,125 5,626 5,632 5,414 4,962(24.7) (26.0) (17.1) (15.8) (13.7) (11.6)4,820 5,617 5,184 5,186 4,954 4,517(22.7) (23.9) (15.7) (14.5) (12.5) (10.6)905 1,187 1,718 1,881 2,333 2,664(4.3) (5.0) (5.2) (5.3) (5.9) (6.2)
3,952 3,891 3,560 3,468 3,398 3,227(18.6) (16.5) (10.8) (9.7) (8.6) (7.6)4,068 3,783 3,320 3,239 3,184 3,023(19.2) (16.1) (10.1) (9.1) (8.1) (7.1)4,123 2,462 2,720 2,698 2,757 2,794(19.4) (10.5) (8.3) (7.6) (7.0) (6.5)593 718 1,108 1,377 1,702 2,050(2.8) (3.1) (3.4) (3.9) (4.3) (4.8)571 952 1,756 2,028 2,402 2,754(2.7) (4.0) (5.3) (5.7) (6.1) (6.4)281 357 410 428 437 433(1.3) (1.5) (1.2) (1.2) (1.1) (1.0)
11,096 12,396 11,975 11,898 11,753 11,118(52.3) (52.7) (36.4) (33.3) (29.8) (26.0)9,484 10,284 19,859 22,489 26,137 29,732(44.7) (43.7) (60.3) (63.0) (66.2) (69.6)
Source: Compiled from International Energy Agency "World Energy Balances" (historical)
Note: Figures in parentheses are global shares (%). Excludes emission reduction by CCS. World includes international bunkers.
2.1
0.1
1.9
-1.8 -0.1 0.1
0.8
0.3 -0.1 -0.1
-0.1
5.0 2.1 1.7 1.7
2.8 3.2
3.4 3.5
-0.1
-0.4
-0.5 -0.3
0.7
1.5
1.9
3.3 1.8 1.3
1.2 1.0
1.6
-0.5 -0.4 -0.2 -0.5
1.3
-0.3-0.6
1.0
1.5
0.2
2.3
-0.4
1.7 0.6 0.2
1.4
4.0
0.4
0.1
3.3
2.8 2.0
3.35.3 3.7
3.0
5.2
-0.5
1.8
-0.4
CAGR (%)
1.2
Korea
3.2
-0.7-1.4
China
India
Japan
3.9 0.0
0.8
4.9 1.4
6.3 1.4
1.4Asia 1.8
2.0
0.6
0.4
-0.7-0.1
5.6 3.9
-0.9
1.3
Chinese Taipei
0.8
4.3
1.4
0.9 0.5
5.1 1.8 2.0
1.9 1.0 1.4
9.0
5.7 2.0 1.5
3.8
3.5
-0.2
5.9 5.6
-0.9
0.0 -0.4
ASEAN
Myanmar
6.3
3.9 3.35.2
5.4
4.9Indonesia
Malaysia
Singapore
6.8 5.0
0.2
0.3 0.0 -0.5
2.8 1.3 2.2
1.0
-0.5
1.6
0.3
3.3
1.6
4.8
0.7
-0.9
3.8 3.8
5.4
3.6
Oceania
OECD
Non-OECD
World
North America
United States
Latin America
OECD Europe
Non-OECD Europe
European Union
Africa
Middle East
Asia excl. Japan
Philippines
Thailand
Viet Nam
IEEJ:February 2016 © IEEJ2016
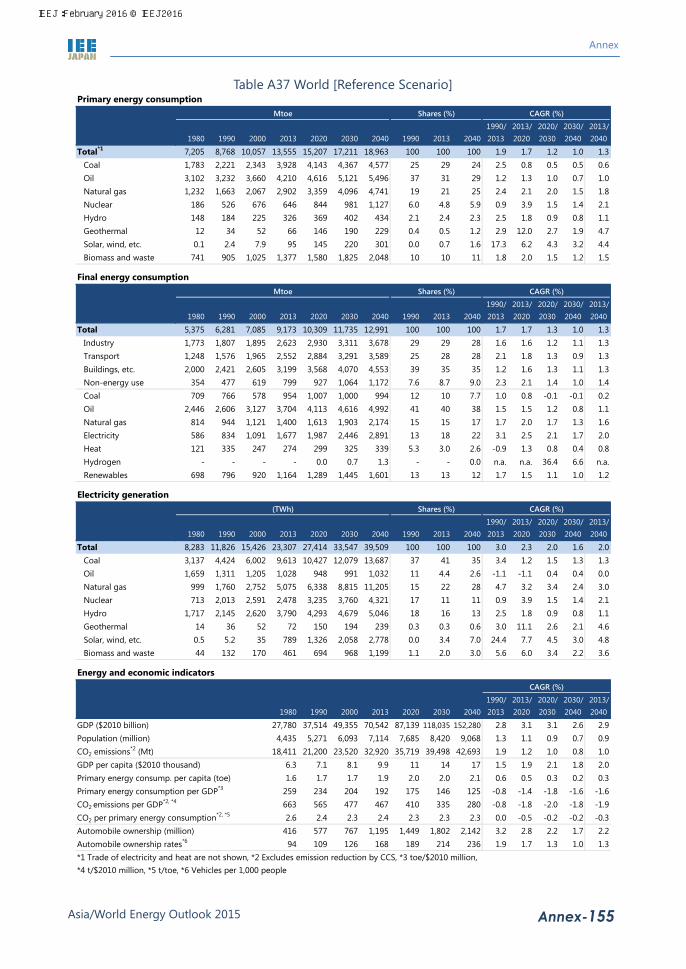
Annex
Asia/World Energy Outlook 2015 Annex-155
Table A37 World [Reference Scenario] Primary energy consumption
Mtoe Shares (%) CAGR (%)
1990/ 2013/ 2020/ 2030/ 2013/1980 1990 2000 2013 2020 2030 2040 1990 2013 2040 2013 2020 2030 2040 2040
Total*1 7,205 8,768 10,057 13,555 15,207 17,211 18,963 100 100 100 1.9 1.7 1.2 1.0 1.3Coal 1,783 2,221 2,343 3,928 4,143 4,367 4,577 25 29 24 2.5 0.8 0.5 0.5 0.6Oil 3,102 3,232 3,660 4,210 4,616 5,121 5,496 37 31 29 1.2 1.3 1.0 0.7 1.0Natural gas 1,232 1,663 2,067 2,902 3,359 4,096 4,741 19 21 25 2.4 2.1 2.0 1.5 1.8Nuclear 186 526 676 646 844 981 1,127 6.0 4.8 5.9 0.9 3.9 1.5 1.4 2.1Hydro 148 184 225 326 369 402 434 2.1 2.4 2.3 2.5 1.8 0.9 0.8 1.1Geothermal 12 34 52 66 146 190 229 0.4 0.5 1.2 2.9 12.0 2.7 1.9 4.7Solar, wind, etc. 0.1 2.4 7.9 95 145 220 301 0.0 0.7 1.6 17.3 6.2 4.3 3.2 4.4Biomass and waste 741 905 1,025 1,377 1,580 1,825 2,048 10 10 11 1.8 2.0 1.5 1.2 1.5
Final energy consumptionMtoe Shares (%) CAGR (%)
1990/ 2013/ 2020/ 2030/ 2013/1980 1990 2000 2013 2020 2030 2040 1990 2013 2040 2013 2020 2030 2040 2040
Total 5,375 6,281 7,085 9,173 10,309 11,735 12,991 100 100 100 1.7 1.7 1.3 1.0 1.3Industry 1,773 1,807 1,895 2,623 2,930 3,311 3,678 29 29 28 1.6 1.6 1.2 1.1 1.3Transport 1,248 1,576 1,965 2,552 2,884 3,291 3,589 25 28 28 2.1 1.8 1.3 0.9 1.3Buildings, etc. 2,000 2,421 2,605 3,199 3,568 4,070 4,553 39 35 35 1.2 1.6 1.3 1.1 1.3Non-energy use 354 477 619 799 927 1,064 1,172 7.6 8.7 9.0 2.3 2.1 1.4 1.0 1.4Coal 709 766 578 954 1,007 1,000 994 12 10 7.7 1.0 0.8 -0.1 -0.1 0.2Oil 2,446 2,606 3,127 3,704 4,113 4,616 4,992 41 40 38 1.5 1.5 1.2 0.8 1.1Natural gas 814 944 1,121 1,400 1,613 1,903 2,174 15 15 17 1.7 2.0 1.7 1.3 1.6Electricity 586 834 1,091 1,677 1,987 2,446 2,891 13 18 22 3.1 2.5 2.1 1.7 2.0Heat 121 335 247 274 299 325 339 5.3 3.0 2.6 -0.9 1.3 0.8 0.4 0.8Hydrogen - - - - 0.0 0.7 1.3 - - 0.0 n.a. n.a. 36.4 6.6 n.a.Renewables 698 796 920 1,164 1,289 1,445 1,601 13 13 12 1.7 1.5 1.1 1.0 1.2
Electricity generation(TWh) Shares (%) CAGR (%)
1990/ 2013/ 2020/ 2030/ 2013/1980 1990 2000 2013 2020 2030 2040 1990 2013 2040 2013 2020 2030 2040 2040
Total 8,283 11,826 15,426 23,307 27,414 33,547 39,509 100 100 100 3.0 2.3 2.0 1.6 2.0Coal 3,137 4,424 6,002 9,613 10,427 12,079 13,687 37 41 35 3.4 1.2 1.5 1.3 1.3Oil 1,659 1,311 1,205 1,028 948 991 1,032 11 4.4 2.6 -1.1 -1.1 0.4 0.4 0.0Natural gas 999 1,760 2,752 5,075 6,338 8,815 11,205 15 22 28 4.7 3.2 3.4 2.4 3.0Nuclear 713 2,013 2,591 2,478 3,235 3,760 4,321 17 11 11 0.9 3.9 1.5 1.4 2.1Hydro 1,717 2,145 2,620 3,790 4,293 4,679 5,046 18 16 13 2.5 1.8 0.9 0.8 1.1Geothermal 14 36 52 72 150 194 239 0.3 0.3 0.6 3.0 11.1 2.6 2.1 4.6Solar, wind, etc. 0.5 5.2 35 789 1,326 2,058 2,778 0.0 3.4 7.0 24.4 7.7 4.5 3.0 4.8Biomass and waste 44 132 170 461 694 968 1,199 1.1 2.0 3.0 5.6 6.0 3.4 2.2 3.6
Energy and economic indicatorsCAGR (%)
1990/ 2013/ 2020/ 2030/ 2013/1980 1990 2000 2013 2020 2030 2040 2013 2020 2030 2040 2040
GDP ($2010 billion) 27,780 37,514 49,355 70,542 87,139 118,035 152,280 2.8 3.1 3.1 2.6 2.9Population (million) 4,435 5,271 6,093 7,114 7,685 8,420 9,068 1.3 1.1 0.9 0.7 0.9CO2 emissions*2 (Mt) 18,411 21,200 23,520 32,920 35,719 39,498 42,693 1.9 1.2 1.0 0.8 1.0GDP per capita ($2010 thousand) 6.3 7.1 8.1 9.9 11 14 17 1.5 1.9 2.1 1.8 2.0Primary energy consump. per capita (toe) 1.6 1.7 1.7 1.9 2.0 2.0 2.1 0.6 0.5 0.3 0.2 0.3Primary energy consumption per GDP*3 259 234 204 192 175 146 125 -0.8 -1.4 -1.8 -1.6 -1.6CO2 emissions per GDP*2, *4 663 565 477 467 410 335 280 -0.8 -1.8 -2.0 -1.8 -1.9CO2 per primary energy consumption*2, *5 2.6 2.4 2.3 2.4 2.3 2.3 2.3 0.0 -0.5 -0.2 -0.2 -0.3Automobile ownership (million) 416 577 767 1,195 1,449 1,802 2,142 3.2 2.8 2.2 1.7 2.2Automobile ownership rates*6 94 109 126 168 189 214 236 1.9 1.7 1.3 1.0 1.3*1 Trade of electricity and heat are not shown, *2 Excludes emission reduction by CCS, *3 toe/$2010 million,*4 t/$2010 million, *5 t/toe, *6 Vehicles per 1,000 people
IEEJ:February 2016 © IEEJ2016

Annex
Asia/World Energy Outlook 2015 Annex-156
Table A38 Asia [Reference Scenario] Primary energy consumption
Mtoe Shares (%) CAGR (%)
1990/ 2013/ 2020/ 2030/ 2013/1980 1990 2000 2013 2020 2030 2040 1990 2013 2040 2013 2020 2030 2040 2040
Total*1 1,440 2,110 2,920 5,409 6,411 7,567 8,691 100 100 100 4.2 2.5 1.7 1.4 1.8Coal 466 786 1,063 2,747 2,992 3,271 3,546 37 51 41 5.6 1.2 0.9 0.8 0.9Oil 477 618 917 1,254 1,483 1,771 2,053 29 23 24 3.1 2.4 1.8 1.5 1.8Natural gas 51 116 232 532 732 1,083 1,417 5.5 9.8 16 6.9 4.7 4.0 2.7 3.7Nuclear 25 77 132 89 270 373 478 3.6 1.6 5.5 0.6 17.2 3.3 2.5 6.4Hydro 20 32 41 113 145 163 182 1.5 2.1 2.1 5.7 3.6 1.2 1.1 1.8Geothermal 2.6 8.2 23 31 78 102 116 0.4 0.6 1.3 6.0 13.8 2.8 1.3 5.0Solar, wind, etc. - 1.2 2.1 38 60 95 138 0.1 0.7 1.6 16.1 6.5 4.7 3.8 4.8Biomass and waste 397 472 510 602 649 706 757 22 11 8.7 1.1 1.1 0.8 0.7 0.9
Final energy consumptionMtoe Shares (%) CAGR (%)
1990/ 2013/ 2020/ 2030/ 2013/1980 1990 2000 2013 2020 2030 2040 1990 2013 2040 2013 2020 2030 2040 2040
Total 1,136 1,572 2,039 3,476 4,088 4,829 5,581 100 100 100 3.5 2.3 1.7 1.5 1.8Industry 390 518 672 1,367 1,567 1,761 1,965 33 39 35 4.3 2.0 1.2 1.1 1.4Transport 126 190 325 581 727 927 1,123 12 17 20 5.0 3.3 2.5 1.9 2.5Buildings, etc. 567 748 852 1,188 1,386 1,652 1,929 48 34 35 2.0 2.2 1.8 1.6 1.8Non-energy use 54 116 190 340 408 489 564 7.4 9.8 10 4.8 2.6 1.8 1.4 1.9Coal 308 435 408 795 839 827 817 28 23 15 2.7 0.8 -0.1 -0.1 0.1Oil 327 464 742 1,102 1,344 1,623 1,897 30 32 34 3.8 2.9 1.9 1.6 2.0Natural gas 21 47 89 248 342 496 658 3.0 7.1 12 7.5 4.7 3.8 2.9 3.7Electricity 88 156 278 686 878 1,156 1,441 9.9 20 26 6.7 3.6 2.8 2.2 2.8Heat 7.5 14 30 82 95 104 108 0.9 2.4 1.9 7.9 2.2 0.9 0.3 1.0Hydrogen - - - - 0.0 0.2 0.4 - - 0.0 n.a. n.a. 22.1 7.4 n.a.Renewables 386 456 493 562 589 623 660 29 16 12 0.9 0.7 0.6 0.6 0.6
Electricity generation(TWh) Shares (%) CAGR (%)
1990/ 2013/ 2020/ 2030/ 2013/1980 1990 2000 2013 2020 2030 2040 1990 2013 2040 2013 2020 2030 2040 2040
Total 1,196 2,215 3,974 9,481 12,018 15,719 19,519 100 100 100 6.5 3.4 2.7 2.2 2.7Coal 298 862 1,990 5,939 6,784 8,513 10,257 39 63 53 8.8 1.9 2.3 1.9 2.0Oil 476 422 386 306 218 209 206 19 3.2 1.1 -1.4 -4.7 -0.4 -0.2 -1.5Natural gas 90 247 567 1,206 1,622 2,615 3,652 11 13 19 7.1 4.3 4.9 3.4 4.2Nuclear 97 294 505 340 1,035 1,430 1,833 13 3.6 9.4 0.6 17.2 3.3 2.5 6.4Hydro 232 370 481 1,319 1,686 1,897 2,114 17 14 11 5.7 3.6 1.2 1.1 1.8Geothermal 3.0 8.4 20 22 51 68 77 0.4 0.2 0.4 4.2 13.1 2.8 1.3 4.8Solar, wind, etc. - 0.0 3.0 219 429 708 1,027 0.0 2.3 5.3 44.7 10.1 5.1 3.8 5.9Biomass and waste 0.0 11 22 129 193 280 353 0.5 1.4 1.8 11.1 5.9 3.8 2.4 3.8
Energy and economic indicatorsCAGR (%)
1990/ 2013/ 2020/ 2030/ 2013/1980 1990 2000 2013 2020 2030 2040 2013 2020 2030 2040 2040
GDP ($2010 billion) 4,333 7,400 10,696 19,855 27,912 43,027 61,360 4.4 5.0 4.4 3.6 4.3Population (million) 2,442 2,931 3,401 3,890 4,137 4,406 4,579 1.2 0.9 0.6 0.4 0.6CO2 emissions*2 (Mt) 3,269 4,920 6,989 14,936 16,874 19,447 21,966 4.9 1.8 1.4 1.2 1.4GDP per capita ($2010 thousand) 1.8 2.5 3.1 5.1 6.7 9.8 13 3.1 4.1 3.8 3.2 3.6Primary energy consump. per capita (toe) 0.6 0.7 0.9 1.4 1.5 1.7 1.9 2.9 1.6 1.0 1.0 1.2Primary energy consumption per GDP*3 332 285 273 272 230 176 142 -0.2 -2.4 -2.6 -2.1 -2.4CO2 emissions per GDP*2, *4 754 665 653 752 605 452 358 0.5 -3.1 -2.9 -2.3 -2.7CO2 per primary energy consumption*2, *5 2.3 2.3 2.4 2.8 2.6 2.6 2.5 0.7 -0.7 -0.2 -0.2 -0.3Automobile ownership (million) 48 86 140 322 464 652 864 5.9 5.3 3.5 2.9 3.7Automobile ownership rates*6 19 29 41 83 112 148 189 4.6 4.4 2.8 2.5 3.1*1 Trade of electricity and heat are not shown, *2 Excludes emission reduction by CCS, *3 toe/$2010 million,*4 t/$2010 million, *5 t/toe, *6 Vehicles per 1,000 people
IEEJ:February 2016 © IEEJ2016

Annex
Asia/World Energy Outlook 2015 Annex-157
Table A39 China [Reference Scenario] Primary energy consumption
Mtoe Shares (%) CAGR (%)
1990/ 2013/ 2020/ 2030/ 2013/1980 1990 2000 2013 2020 2030 2040 1990 2013 2040 2013 2020 2030 2040 2040
Total*1 598 871 1,161 3,022 3,498 3,918 4,227 100 100 100 5.6 2.1 1.1 0.8 1.3Coal 313 528 691 2,045 2,157 2,192 2,161 61 68 51 6.1 0.8 0.2 -0.1 0.2Oil 89 119 221 478 595 704 797 14 16 19 6.2 3.2 1.7 1.2 1.9Natural gas 12 13 21 140 256 431 580 1.5 4.6 14 11.0 9.0 5.4 3.0 5.4Nuclear - - 4.4 29 117 177 237 - 1.0 5.6 n.a. 22.1 4.2 3.0 8.1Hydro 5.0 11 19 78 100 106 110 1.3 2.6 2.6 8.9 3.6 0.5 0.4 1.3Geothermal - - 1.7 4.5 6.4 8.6 10 - 0.1 0.2 n.a. 5.1 3.1 1.5 3.0Solar, wind, etc. - 0.0 1.0 32 48 76 109 0.0 1.1 2.6 34.9 6.0 4.7 3.7 4.7Biomass and waste 180 200 203 216 219 224 224 23 7.1 5.3 0.3 0.2 0.2 0.0 0.1
Final energy consumptionMtoe Shares (%) CAGR (%)
1990/ 2013/ 2020/ 2030/ 2013/1980 1990 2000 2013 2020 2030 2040 1990 2013 2040 2013 2020 2030 2040 2040
Total 494 664 815 1,814 2,106 2,381 2,604 100 100 100 4.5 2.2 1.2 0.9 1.3Industry 188 244 329 878 960 987 997 37 48 38 5.7 1.3 0.3 0.1 0.5Transport 24 33 88 245 321 410 489 5.0 14 19 9.1 3.9 2.5 1.8 2.6Buildings, etc. 272 344 337 548 649 776 882 52 30 34 2.0 2.4 1.8 1.3 1.8Non-energy use 10 43 62 143 176 208 236 6.5 7.9 9.1 5.4 3.0 1.7 1.3 1.9Coal 220 318 304 603 611 558 496 48 33 19 2.8 0.2 -0.9 -1.2 -0.7Oil 59 85 181 435 547 650 737 13 24 28 7.4 3.3 1.7 1.3 2.0Natural gas 6.4 8.9 12 94 148 240 334 1.3 5.2 13 10.8 6.8 4.9 3.4 4.8Electricity 21 39 89 386 494 617 715 5.9 21 27 10.5 3.6 2.3 1.5 2.3Heat 7.4 13 25 76 88 94 95 2.0 4.2 3.7 7.9 2.0 0.7 0.1 0.8Hydrogen - - - - - - - - - - n.a. n.a. n.a. n.a. n.a.Renewables 180 200 204 220 219 222 227 30 12 8.7 0.4 -0.1 0.1 0.2 0.1
Electricity generation(TWh) Shares (%) CAGR (%)
1990/ 2013/ 2020/ 2030/ 2013/1980 1990 2000 2013 2020 2030 2040 1990 2013 2040 2013 2020 2030 2040 2040
Total 301 621 1,356 5,422 6,833 8,459 9,728 100 100 100 9.9 3.4 2.2 1.4 2.2Coal 159 441 1,061 4,090 4,526 5,312 5,816 71 75 60 10.2 1.5 1.6 0.9 1.3Oil 82 50 47 6.6 6.5 6.3 6.2 8.1 0.1 0.1 -8.5 -0.3 -0.2 -0.2 -0.2Natural gas 0.7 2.8 5.8 99 302 608 851 0.4 1.8 8.7 16.9 17.2 7.2 3.4 8.3Nuclear - - 17 112 451 681 911 - 2.1 9.4 n.a. 22.1 4.2 3.0 8.1Hydro 58 127 222 909 1,167 1,228 1,280 20 17 13 8.9 3.6 0.5 0.4 1.3Geothermal - 0.1 0.1 0.1 0.3 0.3 0.4 0.0 0.0 0.0 2.9 14.6 1.5 1.4 4.7Solar, wind, etc. - 0.0 0.6 155 304 504 708 0.0 2.9 7.3 51.5 10.1 5.2 3.4 5.8Biomass and waste - - 2.4 50 77 120 155 - 0.9 1.6 n.a. 6.3 4.5 2.6 4.3
Energy and economic indicatorsCAGR (%)
1990/ 2013/ 2020/ 2030/ 2013/1980 1990 2000 2013 2020 2030 2040 2013 2020 2030 2040 2040
GDP ($2010 billion) 334 811 2,189 7,513 11,641 19,762 29,180 10.2 6.5 5.4 4.0 5.2Population (million) 981 1,135 1,263 1,357 1,398 1,410 1,389 0.8 0.4 0.1 -0.1 0.1CO2 emissions*2 (Mt) 1,505 2,339 3,258 9,437 10,406 11,196 11,627 6.3 1.4 0.7 0.4 0.8GDP per capita ($2010 thousand) 0.3 0.7 1.7 5.5 8.3 14 21 9.3 6.0 5.3 4.1 5.1Primary energy consump. per capita (toe) 0.6 0.8 0.9 2.2 2.5 2.8 3.0 4.7 1.7 1.0 0.9 1.2Primary energy consumption per GDP*3 1,790 1,073 530 402 300 198 145 -4.2 -4.1 -4.1 -3.1 -3.7CO2 emissions per GDP*2, *4 4,505 2,882 1,489 1,256 894 567 398 -3.5 -4.7 -4.5 -3.5 -4.2CO2 per primary energy consumption*2, *5 2.5 2.7 2.8 3.1 3.0 2.9 2.8 0.7 -0.7 -0.4 -0.4 -0.5Automobile ownership (million) 1.2 5.3 16 127 217 309 398 14.8 8.0 3.6 2.6 4.3Automobile ownership rates*6 1.2 4.7 12 93 155 219 286 13.9 7.5 3.5 2.7 4.2*1 Trade of electricity and heat are not shown, *2 Excludes emission reduction by CCS, *3 toe/$2010 million,*4 t/$2010 million, *5 t/toe, *6 Vehicles per 1,000 people
IEEJ:February 2016 © IEEJ2016
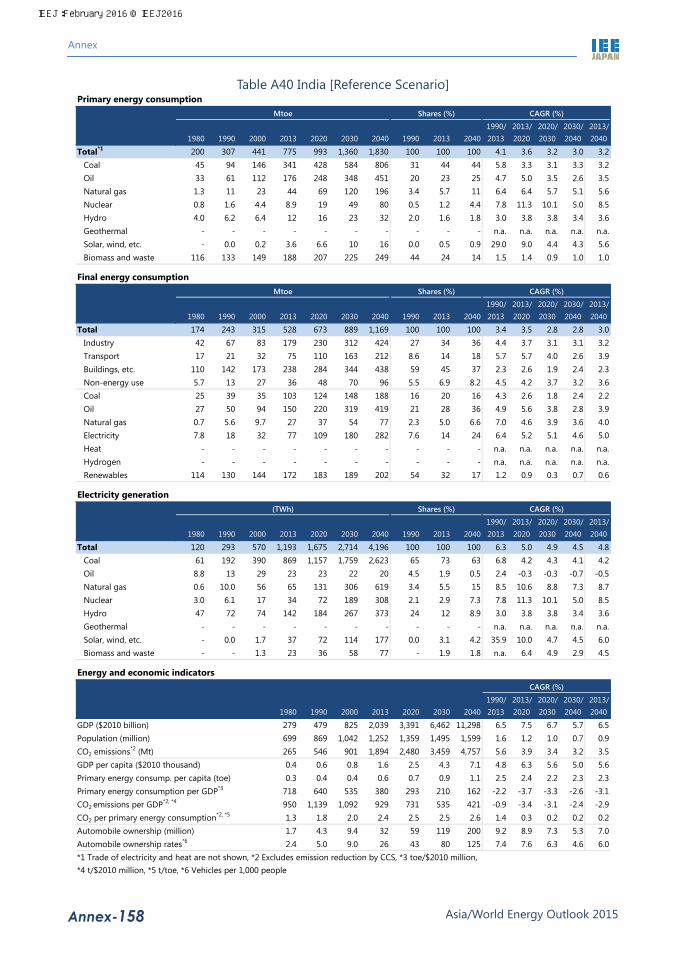
Annex
Asia/World Energy Outlook 2015 Annex-158
Table A40 India [Reference Scenario] Primary energy consumption
Mtoe Shares (%) CAGR (%)
1990/ 2013/ 2020/ 2030/ 2013/1980 1990 2000 2013 2020 2030 2040 1990 2013 2040 2013 2020 2030 2040 2040
Total*1 200 307 441 775 993 1,360 1,830 100 100 100 4.1 3.6 3.2 3.0 3.2Coal 45 94 146 341 428 584 806 31 44 44 5.8 3.3 3.1 3.3 3.2Oil 33 61 112 176 248 348 451 20 23 25 4.7 5.0 3.5 2.6 3.5Natural gas 1.3 11 23 44 69 120 196 3.4 5.7 11 6.4 6.4 5.7 5.1 5.6Nuclear 0.8 1.6 4.4 8.9 19 49 80 0.5 1.2 4.4 7.8 11.3 10.1 5.0 8.5Hydro 4.0 6.2 6.4 12 16 23 32 2.0 1.6 1.8 3.0 3.8 3.8 3.4 3.6Geothermal - - - - - - - - - - n.a. n.a. n.a. n.a. n.a.Solar, wind, etc. - 0.0 0.2 3.6 6.6 10 16 0.0 0.5 0.9 29.0 9.0 4.4 4.3 5.6Biomass and waste 116 133 149 188 207 225 249 44 24 14 1.5 1.4 0.9 1.0 1.0
Final energy consumptionMtoe Shares (%) CAGR (%)
1990/ 2013/ 2020/ 2030/ 2013/1980 1990 2000 2013 2020 2030 2040 1990 2013 2040 2013 2020 2030 2040 2040
Total 174 243 315 528 673 889 1,169 100 100 100 3.4 3.5 2.8 2.8 3.0Industry 42 67 83 179 230 312 424 27 34 36 4.4 3.7 3.1 3.1 3.2Transport 17 21 32 75 110 163 212 8.6 14 18 5.7 5.7 4.0 2.6 3.9Buildings, etc. 110 142 173 238 284 344 438 59 45 37 2.3 2.6 1.9 2.4 2.3Non-energy use 5.7 13 27 36 48 70 96 5.5 6.9 8.2 4.5 4.2 3.7 3.2 3.6Coal 25 39 35 103 124 148 188 16 20 16 4.3 2.6 1.8 2.4 2.2Oil 27 50 94 150 220 319 419 21 28 36 4.9 5.6 3.8 2.8 3.9Natural gas 0.7 5.6 9.7 27 37 54 77 2.3 5.0 6.6 7.0 4.6 3.9 3.6 4.0Electricity 7.8 18 32 77 109 180 282 7.6 14 24 6.4 5.2 5.1 4.6 5.0Heat - - - - - - - - - - n.a. n.a. n.a. n.a. n.a.Hydrogen - - - - - - - - - - n.a. n.a. n.a. n.a. n.a.Renewables 114 130 144 172 183 189 202 54 32 17 1.2 0.9 0.3 0.7 0.6
Electricity generation(TWh) Shares (%) CAGR (%)
1990/ 2013/ 2020/ 2030/ 2013/1980 1990 2000 2013 2020 2030 2040 1990 2013 2040 2013 2020 2030 2040 2040
Total 120 293 570 1,193 1,675 2,714 4,196 100 100 100 6.3 5.0 4.9 4.5 4.8Coal 61 192 390 869 1,157 1,759 2,623 65 73 63 6.8 4.2 4.3 4.1 4.2Oil 8.8 13 29 23 23 22 20 4.5 1.9 0.5 2.4 -0.3 -0.3 -0.7 -0.5Natural gas 0.6 10.0 56 65 131 306 619 3.4 5.5 15 8.5 10.6 8.8 7.3 8.7Nuclear 3.0 6.1 17 34 72 189 308 2.1 2.9 7.3 7.8 11.3 10.1 5.0 8.5Hydro 47 72 74 142 184 267 373 24 12 8.9 3.0 3.8 3.8 3.4 3.6Geothermal - - - - - - - - - - n.a. n.a. n.a. n.a. n.a.Solar, wind, etc. - 0.0 1.7 37 72 114 177 0.0 3.1 4.2 35.9 10.0 4.7 4.5 6.0Biomass and waste - - 1.3 23 36 58 77 - 1.9 1.8 n.a. 6.4 4.9 2.9 4.5
Energy and economic indicatorsCAGR (%)
1990/ 2013/ 2020/ 2030/ 2013/1980 1990 2000 2013 2020 2030 2040 2013 2020 2030 2040 2040
GDP ($2010 billion) 279 479 825 2,039 3,391 6,462 11,298 6.5 7.5 6.7 5.7 6.5Population (million) 699 869 1,042 1,252 1,359 1,495 1,599 1.6 1.2 1.0 0.7 0.9CO2 emissions*2 (Mt) 265 546 901 1,894 2,480 3,459 4,757 5.6 3.9 3.4 3.2 3.5GDP per capita ($2010 thousand) 0.4 0.6 0.8 1.6 2.5 4.3 7.1 4.8 6.3 5.6 5.0 5.6Primary energy consump. per capita (toe) 0.3 0.4 0.4 0.6 0.7 0.9 1.1 2.5 2.4 2.2 2.3 2.3Primary energy consumption per GDP*3 718 640 535 380 293 210 162 -2.2 -3.7 -3.3 -2.6 -3.1CO2 emissions per GDP*2, *4 950 1,139 1,092 929 731 535 421 -0.9 -3.4 -3.1 -2.4 -2.9CO2 per primary energy consumption*2, *5 1.3 1.8 2.0 2.4 2.5 2.5 2.6 1.4 0.3 0.2 0.2 0.2Automobile ownership (million) 1.7 4.3 9.4 32 59 119 200 9.2 8.9 7.3 5.3 7.0Automobile ownership rates*6 2.4 5.0 9.0 26 43 80 125 7.4 7.6 6.3 4.6 6.0*1 Trade of electricity and heat are not shown, *2 Excludes emission reduction by CCS, *3 toe/$2010 million,*4 t/$2010 million, *5 t/toe, *6 Vehicles per 1,000 people
IEEJ:February 2016 © IEEJ2016

Annex
Asia/World Energy Outlook 2015 Annex-159
Table A41 Japan [Reference Scenario] Primary energy consumption
Mtoe Shares (%) CAGR (%)
1990/ 2013/ 2020/ 2030/ 2013/1980 1990 2000 2013 2020 2030 2040 1990 2013 2040 2013 2020 2030 2040 2040
Total*1 345 439 519 455 471 461 436 100 100 100 0.1 0.5 -0.2 -0.6 -0.2Coal 60 77 97 121 118 121 116 17 27 27 2.0 -0.4 0.2 -0.4 -0.2Oil 234 250 255 202 175 155 135 57 45 31 -0.9 -2.1 -1.2 -1.3 -1.5Natural gas 21 44 66 106 97 110 112 10 23 26 3.9 -1.4 1.3 0.1 0.2Nuclear 22 53 84 2.4 54 41 34 12 0.5 7.9 -12.5 56.0 -2.8 -1.7 10.3Hydro 7.6 7.7 7.5 6.7 8.1 8.1 8.1 1.7 1.5 1.9 -0.6 2.7 0.0 0.0 0.7Geothermal 0.8 1.6 3.1 2.4 3.8 7.7 9.0 0.4 0.5 2.1 1.9 6.9 7.1 1.6 5.0Solar, wind, etc. - 1.2 0.8 2.0 3.1 4.7 6.6 0.3 0.4 1.5 2.3 6.5 4.2 3.4 4.5Biomass and waste - 4.9 5.7 11 13 14 16 1.1 2.5 3.6 3.6 1.8 1.0 1.1 1.3
Final energy consumptionMtoe Shares (%) CAGR (%)
1990/ 2013/ 2020/ 2030/ 2013/1980 1990 2000 2013 2020 2030 2040 1990 2013 2040 2013 2020 2030 2040 2040
Total 232 298 341 311 313 305 289 100 100 100 0.2 0.1 -0.2 -0.5 -0.3Industry 91 101 96 82 89 89 87 34 26 30 -0.9 1.1 0.0 -0.1 0.2Transport 54 72 88 73 70 62 55 24 24 19 0.1 -0.8 -1.1 -1.1 -1.0Buildings, etc. 58 91 116 118 118 119 114 31 38 39 1.1 0.1 0.1 -0.5 -0.1Non-energy use 28 34 41 38 36 35 33 12 12 11 0.4 -0.9 -0.2 -0.6 -0.5Coal 25 32 25 26 26 25 23 11 8.3 7.9 -0.9 0.3 -0.5 -1.0 -0.5Oil 157 182 208 166 155 137 118 61 53 41 -0.4 -1.0 -1.2 -1.5 -1.2Natural gas 5.8 15 23 34 37 39 39 5.1 11 14 3.5 1.1 0.5 0.1 0.5Electricity 44 64 81 82 88 95 97 22 26 34 1.0 1.1 0.7 0.3 0.7Heat 0.1 0.2 0.5 0.5 2.6 4.7 6.5 0.1 0.2 2.3 4.5 25.1 6.0 3.4 9.6Hydrogen - - - - 0.0 0.2 0.4 - - 0.1 n.a. n.a. 21.5 7.5 n.a.Renewables - 3.9 3.7 3.6 3.7 4.2 5.0 1.3 1.1 1.7 -0.4 0.5 1.4 1.6 1.2
Electricity generation(TWh) Shares (%) CAGR (%)
1990/ 2013/ 2020/ 2030/ 2013/1980 1990 2000 2013 2020 2030 2040 1990 2013 2040 2013 2020 2030 2040 2040
Total 573 836 1,049 1,038 1,116 1,188 1,200 100 100 100 0.9 1.0 0.6 0.1 0.5Coal 55 116 229 337 318 337 325 14 32 27 4.7 -0.8 0.6 -0.4 -0.1Oil 265 237 135 150 67 57 53 28 14 4.4 -2.0 -10.9 -1.6 -0.7 -3.8Natural gas 81 179 256 402 343 430 452 21 39 38 3.6 -2.2 2.3 0.5 0.4Nuclear 83 202 322 9.3 209 156 132 24 0.9 11 -12.5 56.0 -2.8 -1.7 10.3Hydro 88 89 87 78 94 94 94 11 7.5 7.9 -0.6 2.7 0.0 0.0 0.7Geothermal 0.9 1.7 3.3 2.6 4.3 8.7 10 0.2 0.2 0.9 1.8 7.4 7.4 1.7 5.2Solar, wind, etc. - 0.0 0.5 19 32 51 73 0.0 1.9 6.1 53.6 7.5 4.7 3.7 5.0Biomass and waste - 11 16 41 48 54 61 1.3 3.9 5.0 6.0 2.5 1.1 1.1 1.5
Energy and economic indicatorsCAGR (%)
1990/ 2013/ 2020/ 2030/ 2013/1980 1990 2000 2013 2020 2030 2040 2013 2020 2030 2040 2040
GDP ($2010 billion) 2,894 4,553 5,093 5,656 6,547 7,566 8,369 0.9 2.1 1.5 1.0 1.5Population (million) 117 124 127 127 125 120 114 0.1 -0.2 -0.4 -0.5 -0.4CO2 emissions*2 (Mt) 916 1,070 1,196 1,234 1,120 1,105 1,034 0.6 -1.4 -0.1 -0.7 -0.7GDP per capita ($2010 thousand) 25 37 40 44 52 63 73 0.8 2.3 1.9 1.6 1.9Primary energy consump. per capita (toe) 3.0 3.6 4.1 3.6 3.8 3.8 3.8 0.0 0.7 0.2 0.0 0.3Primary energy consumption per GDP*3 119 96 102 80 72 61 52 -0.8 -1.6 -1.7 -1.6 -1.6CO2 emissions per GDP*2, *4 317 235 235 218 171 146 124 -0.3 -3.4 -1.6 -1.7 -2.1CO2 per primary energy consumption*2, *5 2.7 2.4 2.3 2.7 2.4 2.4 2.4 0.5 -1.9 0.1 -0.1 -0.5Automobile ownership (million) 38 58 72 77 77 74 71 1.2 0.0 -0.4 -0.4 -0.3Automobile ownership rates*6 325 467 571 601 611 613 623 1.1 0.2 0.0 0.2 0.1*1 Trade of electricity and heat are not shown, *2 Excludes emission reduction by CCS, *3 toe/$2010 million,*4 t/$2010 million, *5 t/toe, *6 Vehicles per 1,000 people
IEEJ:February 2016 © IEEJ2016
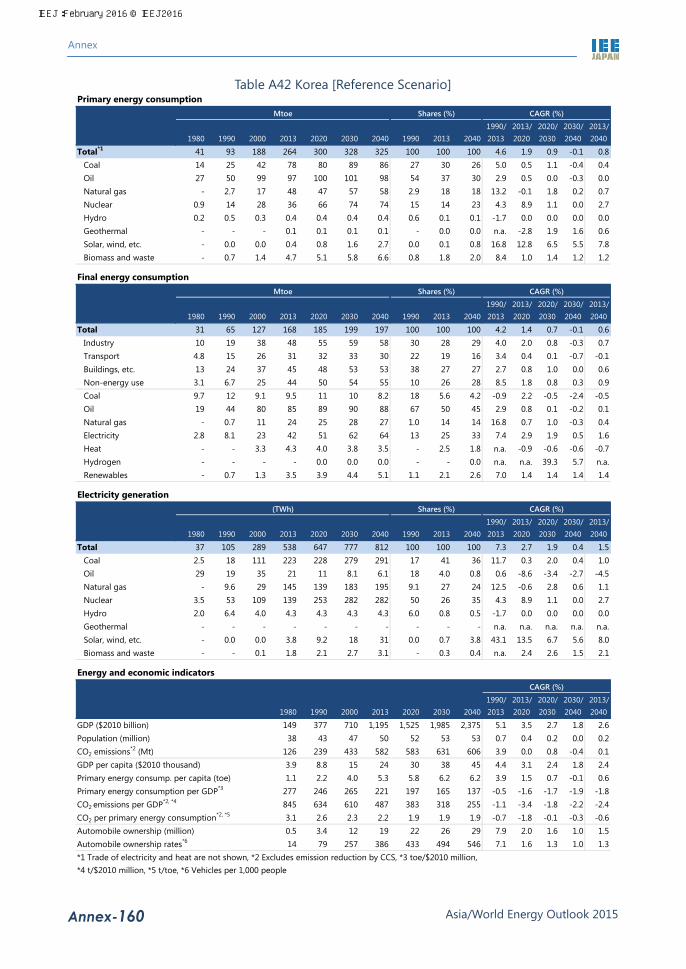
Annex
Asia/World Energy Outlook 2015 Annex-160
Table A42 Korea [Reference Scenario] Primary energy consumption
Mtoe Shares (%) CAGR (%)
1990/ 2013/ 2020/ 2030/ 2013/1980 1990 2000 2013 2020 2030 2040 1990 2013 2040 2013 2020 2030 2040 2040
Total*1 41 93 188 264 300 328 325 100 100 100 4.6 1.9 0.9 -0.1 0.8Coal 14 25 42 78 80 89 86 27 30 26 5.0 0.5 1.1 -0.4 0.4Oil 27 50 99 97 100 101 98 54 37 30 2.9 0.5 0.0 -0.3 0.0Natural gas - 2.7 17 48 47 57 58 2.9 18 18 13.2 -0.1 1.8 0.2 0.7Nuclear 0.9 14 28 36 66 74 74 15 14 23 4.3 8.9 1.1 0.0 2.7Hydro 0.2 0.5 0.3 0.4 0.4 0.4 0.4 0.6 0.1 0.1 -1.7 0.0 0.0 0.0 0.0Geothermal - - - 0.1 0.1 0.1 0.1 - 0.0 0.0 n.a. -2.8 1.9 1.6 0.6Solar, wind, etc. - 0.0 0.0 0.4 0.8 1.6 2.7 0.0 0.1 0.8 16.8 12.8 6.5 5.5 7.8Biomass and waste - 0.7 1.4 4.7 5.1 5.8 6.6 0.8 1.8 2.0 8.4 1.0 1.4 1.2 1.2
Final energy consumptionMtoe Shares (%) CAGR (%)
1990/ 2013/ 2020/ 2030/ 2013/1980 1990 2000 2013 2020 2030 2040 1990 2013 2040 2013 2020 2030 2040 2040
Total 31 65 127 168 185 199 197 100 100 100 4.2 1.4 0.7 -0.1 0.6Industry 10 19 38 48 55 59 58 30 28 29 4.0 2.0 0.8 -0.3 0.7Transport 4.8 15 26 31 32 33 30 22 19 16 3.4 0.4 0.1 -0.7 -0.1Buildings, etc. 13 24 37 45 48 53 53 38 27 27 2.7 0.8 1.0 0.0 0.6Non-energy use 3.1 6.7 25 44 50 54 55 10 26 28 8.5 1.8 0.8 0.3 0.9Coal 9.7 12 9.1 9.5 11 10 8.2 18 5.6 4.2 -0.9 2.2 -0.5 -2.4 -0.5Oil 19 44 80 85 89 90 88 67 50 45 2.9 0.8 0.1 -0.2 0.1Natural gas - 0.7 11 24 25 28 27 1.0 14 14 16.8 0.7 1.0 -0.3 0.4Electricity 2.8 8.1 23 42 51 62 64 13 25 33 7.4 2.9 1.9 0.5 1.6Heat - - 3.3 4.3 4.0 3.8 3.5 - 2.5 1.8 n.a. -0.9 -0.6 -0.6 -0.7Hydrogen - - - - 0.0 0.0 0.0 - - 0.0 n.a. n.a. 39.3 5.7 n.a.Renewables - 0.7 1.3 3.5 3.9 4.4 5.1 1.1 2.1 2.6 7.0 1.4 1.4 1.4 1.4
Electricity generation(TWh) Shares (%) CAGR (%)
1990/ 2013/ 2020/ 2030/ 2013/1980 1990 2000 2013 2020 2030 2040 1990 2013 2040 2013 2020 2030 2040 2040
Total 37 105 289 538 647 777 812 100 100 100 7.3 2.7 1.9 0.4 1.5Coal 2.5 18 111 223 228 279 291 17 41 36 11.7 0.3 2.0 0.4 1.0Oil 29 19 35 21 11 8.1 6.1 18 4.0 0.8 0.6 -8.6 -3.4 -2.7 -4.5Natural gas - 9.6 29 145 139 183 195 9.1 27 24 12.5 -0.6 2.8 0.6 1.1Nuclear 3.5 53 109 139 253 282 282 50 26 35 4.3 8.9 1.1 0.0 2.7Hydro 2.0 6.4 4.0 4.3 4.3 4.3 4.3 6.0 0.8 0.5 -1.7 0.0 0.0 0.0 0.0Geothermal - - - - - - - - - - n.a. n.a. n.a. n.a. n.a.Solar, wind, etc. - 0.0 0.0 3.8 9.2 18 31 0.0 0.7 3.8 43.1 13.5 6.7 5.6 8.0Biomass and waste - - 0.1 1.8 2.1 2.7 3.1 - 0.3 0.4 n.a. 2.4 2.6 1.5 2.1
Energy and economic indicatorsCAGR (%)
1990/ 2013/ 2020/ 2030/ 2013/1980 1990 2000 2013 2020 2030 2040 2013 2020 2030 2040 2040
GDP ($2010 billion) 149 377 710 1,195 1,525 1,985 2,375 5.1 3.5 2.7 1.8 2.6Population (million) 38 43 47 50 52 53 53 0.7 0.4 0.2 0.0 0.2CO2 emissions*2 (Mt) 126 239 433 582 583 631 606 3.9 0.0 0.8 -0.4 0.1GDP per capita ($2010 thousand) 3.9 8.8 15 24 30 38 45 4.4 3.1 2.4 1.8 2.4Primary energy consump. per capita (toe) 1.1 2.2 4.0 5.3 5.8 6.2 6.2 3.9 1.5 0.7 -0.1 0.6Primary energy consumption per GDP*3 277 246 265 221 197 165 137 -0.5 -1.6 -1.7 -1.9 -1.8CO2 emissions per GDP*2, *4 845 634 610 487 383 318 255 -1.1 -3.4 -1.8 -2.2 -2.4CO2 per primary energy consumption*2, *5 3.1 2.6 2.3 2.2 1.9 1.9 1.9 -0.7 -1.8 -0.1 -0.3 -0.6Automobile ownership (million) 0.5 3.4 12 19 22 26 29 7.9 2.0 1.6 1.0 1.5Automobile ownership rates*6 14 79 257 386 433 494 546 7.1 1.6 1.3 1.0 1.3*1 Trade of electricity and heat are not shown, *2 Excludes emission reduction by CCS, *3 toe/$2010 million,*4 t/$2010 million, *5 t/toe, *6 Vehicles per 1,000 people
IEEJ:February 2016 © IEEJ2016

Annex
Asia/World Energy Outlook 2015 Annex-161
Table A43 Chinese Taipei [Reference Scenario] Primary energy consumption
Mtoe Shares (%) CAGR (%)
1990/ 2013/ 2020/ 2030/ 2013/1980 1990 2000 2013 2020 2030 2040 1990 2013 2040 2013 2020 2030 2040 2040
Total*1 28 48 85 109 120 126 128 100 100 100 3.6 1.4 0.5 0.1 0.6Coal 3.9 11 30 40 40 40 39 24 37 30 5.7 -0.1 -0.1 -0.3 -0.2Oil 20 26 38 42 46 47 47 54 39 36 2.1 1.4 0.3 -0.2 0.4Natural gas 1.6 1.4 5.6 13 19 27 30 2.9 12 23 10.2 5.7 3.3 1.0 3.1Nuclear 2.1 8.6 10 11 11 8.2 8.2 18 10.0 6.4 1.0 0.0 -2.7 0.0 -1.0Hydro 0.3 0.5 0.4 0.5 0.5 0.5 0.5 1.1 0.4 0.4 -0.7 0.0 0.0 0.0 0.0Geothermal - 0.0 - - - - - 0.0 - - -100 n.a. n.a. n.a. n.a.Solar, wind, etc. - 0.0 0.1 0.2 0.5 0.7 1.1 0.0 0.2 0.8 12.1 10.7 3.6 3.9 5.5Biomass and waste - - 0.6 1.7 2.1 2.9 3.3 - 1.5 2.6 n.a. 3.5 3.2 1.3 2.6
Final energy consumptionMtoe Shares (%) CAGR (%)
1990/ 2013/ 2020/ 2030/ 2013/1980 1990 2000 2013 2020 2030 2040 1990 2013 2040 2013 2020 2030 2040 2040
Total 19 29 49 68 75 81 82 100 100 100 3.7 1.6 0.7 0.2 0.7Industry 10 12 19 23 26 27 28 42 34 34 2.8 1.5 0.7 0.2 0.7Transport 2.9 6.6 12 12 13 14 13 22 18 16 2.6 1.1 0.4 -0.2 0.3Buildings, etc. 3.6 6.5 10 12 13 14 14 22 17 17 2.5 1.5 0.5 0.1 0.6Non-energy use 2.0 4.0 7.8 21 24 26 27 14 31 33 7.5 2.0 0.9 0.4 1.0Coal 2.2 3.6 5.0 8.0 8.2 8.9 9.2 12 12 11 3.5 0.4 0.8 0.4 0.5Oil 12 18 28 37 42 43 43 62 55 52 3.1 1.7 0.3 -0.1 0.5Natural gas 1.4 0.9 1.6 2.5 2.8 3.4 3.8 3.0 3.7 4.7 4.7 1.7 1.8 1.3 1.6Electricity 3.2 6.6 14 19 22 25 26 22 29 31 4.8 1.7 1.1 0.5 1.1Heat - - - - - - - - - - n.a. n.a. n.a. n.a. n.a.Hydrogen - - - - - - - - - - n.a. n.a. n.a. n.a. n.a.Renewables - 0.0 0.1 0.3 0.5 0.5 0.6 0.1 0.5 0.7 13.6 4.3 1.5 1.2 2.1
Electricity generation(TWh) Shares (%) CAGR (%)
1990/ 2013/ 2020/ 2030/ 2013/1980 1990 2000 2013 2020 2030 2040 1990 2013 2040 2013 2020 2030 2040 2040
Total 43 88 181 249 280 311 327 100 100 100 4.6 1.7 1.1 0.5 1.0Coal 6.0 24 88 123 120 115 110 28 49 34 7.3 -0.4 -0.4 -0.4 -0.4Oil 26 23 30 7.5 5.7 4.7 4.3 26 3.0 1.3 -4.8 -4.0 -1.9 -0.8 -2.0Natural gas - 1.2 17 66 98 141 157 1.4 27 48 18.8 5.8 3.7 1.1 3.3Nuclear 8.2 33 39 42 42 32 32 37 17 9.7 1.0 0.0 -2.7 0.0 -1.0Hydro 2.9 6.4 4.6 5.4 5.4 5.4 5.4 7.2 2.2 1.7 -0.7 0.0 0.0 0.0 0.0Geothermal - 0.0 - - - - - 0.0 - - -100 n.a. n.a. n.a. n.a.Solar, wind, etc. - - 0.0 1.7 4.4 6.7 10 - 0.7 3.2 n.a. 14.9 4.3 4.5 7.1Biomass and waste - - 1.7 3.5 5.2 7.3 8.3 - 1.4 2.6 n.a. 5.7 3.5 1.3 3.2
Energy and economic indicatorsCAGR (%)
1990/ 2013/ 2020/ 2030/ 2013/1980 1990 2000 2013 2020 2030 2040 2013 2020 2030 2040 2040
GDP ($2010 billion) 80 167 305 482 636 790 900 4.7 4.0 2.2 1.3 2.3Population (million) 18 20 22 23 23 23 22 0.6 0.0 -0.1 -0.4 -0.2CO2 emissions*2 (Mt) 74 115 225 255 272 285 282 3.5 0.9 0.5 -0.1 0.4GDP per capita ($2010 thousand) 4.5 8.2 14 21 27 34 40 4.1 4.0 2.3 1.7 2.5Primary energy consump. per capita (toe) 1.6 2.3 3.8 4.6 5.1 5.4 5.7 3.0 1.3 0.7 0.5 0.8Primary energy consumption per GDP*3 349 286 278 226 188 160 142 -1.0 -2.6 -1.6 -1.2 -1.7CO2 emissions per GDP*2, *4 931 691 736 529 428 361 313 -1.2 -3.0 -1.7 -1.4 -1.9CO2 per primary energy consumption*2, *5 2.7 2.4 2.6 2.3 2.3 2.3 2.2 -0.1 -0.4 -0.1 -0.3 -0.2Automobile ownership (million) 0.5 2.9 5.5 7.3 8.1 8.9 9.3 4.1 1.5 1.0 0.4 0.9Automobile ownership rates*6 27 141 249 313 346 386 417 3.5 1.5 1.1 0.8 1.1*1 Trade of electricity and heat are not shown, *2 Excludes emission reduction by CCS, *3 toe/$2010 million,*4 t/$2010 million, *5 t/toe, *6 Vehicles per 1,000 people
IEEJ:February 2016 © IEEJ2016

Annex
Asia/World Energy Outlook 2015 Annex-162
Table A44 ASEAN [Reference Scenario] Primary energy consumption
Mtoe Shares (%) CAGR (%)
1990/ 2013/ 2020/ 2030/ 2013/1980 1990 2000 2013 2020 2030 2040 1990 2013 2040 2013 2020 2030 2040 2040
Total*1 142 233 380 587 776 1,035 1,327 100 100 100 4.1 4.1 2.9 2.5 3.1Coal 3.6 13 32 91 131 197 280 5.4 16 21 9.0 5.2 4.2 3.6 4.2Oil 58 88 153 209 256 333 422 38 36 32 3.8 2.9 2.7 2.4 2.6Natural gas 8.6 30 74 133 175 236 305 13 23 23 6.7 4.0 3.0 2.6 3.1Nuclear - - - - - 14 35 - - 2.6 n.a. n.a. n.a. 9.3 n.a.Hydro 0.8 2.3 4.1 9.4 12 16 18 1.0 1.6 1.4 6.2 3.7 2.5 1.4 2.4Geothermal 1.8 6.6 18 24 67 85 96 2.8 4.2 7.3 5.8 15.5 2.4 1.2 5.2Solar, wind, etc. - - - 0.1 0.4 0.8 1.4 - 0.0 0.1 n.a. 16.2 7.2 5.6 8.9Biomass and waste 70 93 99 118 133 150 164 40 20 12 1.0 1.7 1.2 0.9 1.2
Final energy consumptionMtoe Shares (%) CAGR (%)
1990/ 2013/ 2020/ 2030/ 2013/1980 1990 2000 2013 2020 2030 2040 1990 2013 2040 2013 2020 2030 2040 2040
Total 112 173 271 425 532 701 897 100 100 100 4.0 3.3 2.8 2.5 2.8Industry 22 43 76 116 153 212 279 25 27 31 4.5 4.0 3.3 2.8 3.3Transport 17 32 62 112 140 189 250 19 26 28 5.5 3.3 3.0 2.8 3.0Buildings, etc. 71 87 113 143 171 212 261 50 34 29 2.2 2.5 2.2 2.1 2.2Non-energy use 2.4 11 21 53 68 87 106 6.3 13 12 7.1 3.4 2.6 2.0 2.6Coal 2.1 6.0 13 27 34 44 54 3.5 6.4 6.0 6.7 3.4 2.6 2.0 2.6Oil 41 67 123 194 243 319 407 38 46 45 4.8 3.3 2.8 2.5 2.8Natural gas 2.5 7.5 17 40 56 80 106 4.4 9.4 12 7.5 4.9 3.6 2.9 3.7Electricity 4.7 11 28 61 87 137 201 6.4 14 22 7.7 5.2 4.6 3.9 4.5Heat - - - - - - - - - - n.a. n.a. n.a. n.a. n.a.Hydrogen - - - - - - - - - - n.a. n.a. n.a. n.a. n.a.Renewables 62 82 90 103 111 121 129 47 24 14 1.0 1.2 0.9 0.6 0.9
Electricity generation(TWh) Shares (%) CAGR (%)
1990/ 2013/ 2020/ 2030/ 2013/1980 1990 2000 2013 2020 2030 2040 1990 2013 2040 2013 2020 2030 2040 2040
Total 62 154 370 786 1,117 1,738 2,538 100 100 100 7.3 5.1 4.5 3.9 4.4Coal 3.0 28 79 255 383 639 1,003 18 32 40 10.1 6.0 5.3 4.6 5.2Oil 47 66 72 43 38 37 36 43 5.5 1.4 -1.8 -1.9 -0.1 -0.3 -0.7Natural gas 0.7 26 154 349 480 720 1,025 17 44 40 11.9 4.7 4.1 3.6 4.1Nuclear - - - - - 55 133 - - 5.2 n.a. n.a. n.a. 9.3 n.a.Hydro 9.8 27 47 109 141 181 209 18 14 8.2 6.2 3.7 2.5 1.4 2.4Geothermal 2.1 6.6 16 19 46 58 65 4.3 2.4 2.6 4.7 13.5 2.3 1.2 4.7Solar, wind, etc. - - - 1.7 4.9 9.8 17 - 0.2 0.7 n.a. 16.2 7.2 5.6 8.9Biomass and waste - 0.6 1.0 10 24 38 50 0.4 1.3 2.0 13.0 13.5 4.6 2.6 6.1
Energy and economic indicatorsCAGR (%)
1990/ 2013/ 2020/ 2030/ 2013/1980 1990 2000 2013 2020 2030 2040 2013 2020 2030 2040 2040
GDP ($2010 billion) 405 703 1,137 2,190 3,097 4,848 7,019 5.1 5.1 4.6 3.8 4.4Population (million) 345 427 503 594 640 693 732 1.4 1.1 0.8 0.5 0.8CO2 emissions*2 (Mt) 205 362 710 1,162 1,519 2,102 2,814 5.2 3.9 3.3 3.0 3.3GDP per capita ($2010 thousand) 1.2 1.6 2.3 3.7 4.8 7.0 9.6 3.6 4.0 3.7 3.2 3.6Primary energy consump. per capita (toe) 0.4 0.5 0.8 1.0 1.2 1.5 1.8 2.6 3.0 2.1 2.0 2.3Primary energy consumption per GDP*3 352 332 334 268 251 214 189 -0.9 -0.9 -1.6 -1.2 -1.3CO2 emissions per GDP*2, *4 507 515 624 531 491 434 401 0.1 -1.1 -1.2 -0.8 -1.0CO2 per primary energy consumption*2, *5 1.4 1.6 1.9 2.0 2.0 2.0 2.1 1.1 -0.2 0.4 0.4 0.3Automobile ownership (million) 4.4 10 21 52 70 98 133 7.4 4.4 3.4 3.2 3.6Automobile ownership rates*6 13 24 41 87 110 141 182 5.9 3.3 2.5 2.6 2.8*1 Trade of electricity and heat are not shown, *2 Excludes emission reduction by CCS, *3 toe/$2010 million,*4 t/$2010 million, *5 t/toe, *6 Vehicles per 1,000 people
IEEJ:February 2016 © IEEJ2016
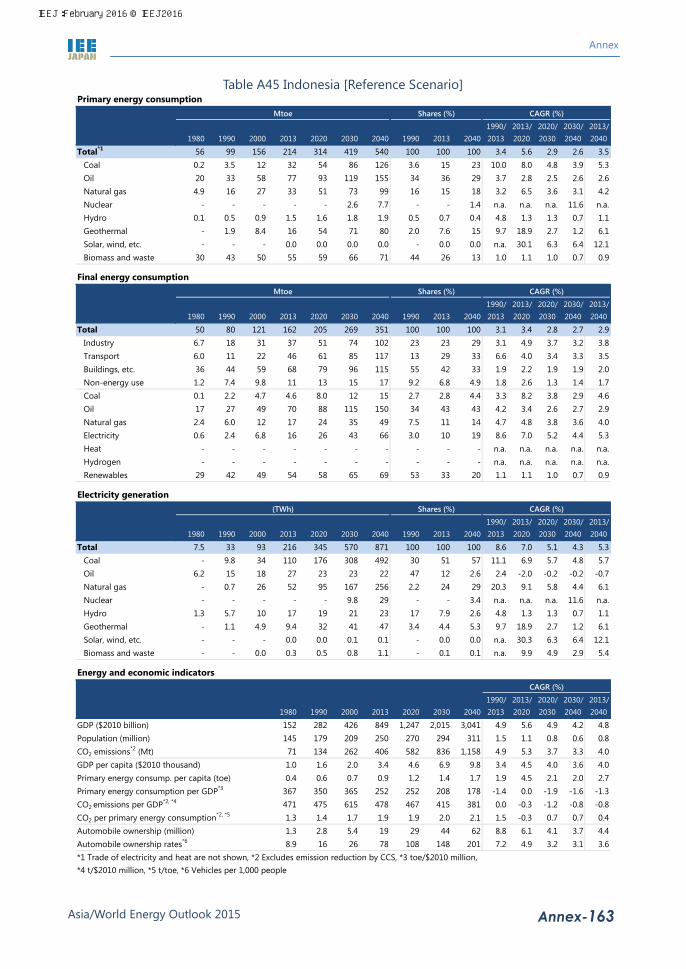
Annex
Asia/World Energy Outlook 2015 Annex-163
Table A45 Indonesia [Reference Scenario] Primary energy consumption
Mtoe Shares (%) CAGR (%)
1990/ 2013/ 2020/ 2030/ 2013/1980 1990 2000 2013 2020 2030 2040 1990 2013 2040 2013 2020 2030 2040 2040
Total*1 56 99 156 214 314 419 540 100 100 100 3.4 5.6 2.9 2.6 3.5Coal 0.2 3.5 12 32 54 86 126 3.6 15 23 10.0 8.0 4.8 3.9 5.3Oil 20 33 58 77 93 119 155 34 36 29 3.7 2.8 2.5 2.6 2.6Natural gas 4.9 16 27 33 51 73 99 16 15 18 3.2 6.5 3.6 3.1 4.2Nuclear - - - - - 2.6 7.7 - - 1.4 n.a. n.a. n.a. 11.6 n.a.Hydro 0.1 0.5 0.9 1.5 1.6 1.8 1.9 0.5 0.7 0.4 4.8 1.3 1.3 0.7 1.1Geothermal - 1.9 8.4 16 54 71 80 2.0 7.6 15 9.7 18.9 2.7 1.2 6.1Solar, wind, etc. - - - 0.0 0.0 0.0 0.0 - 0.0 0.0 n.a. 30.1 6.3 6.4 12.1Biomass and waste 30 43 50 55 59 66 71 44 26 13 1.0 1.1 1.0 0.7 0.9
Final energy consumptionMtoe Shares (%) CAGR (%)
1990/ 2013/ 2020/ 2030/ 2013/1980 1990 2000 2013 2020 2030 2040 1990 2013 2040 2013 2020 2030 2040 2040
Total 50 80 121 162 205 269 351 100 100 100 3.1 3.4 2.8 2.7 2.9Industry 6.7 18 31 37 51 74 102 23 23 29 3.1 4.9 3.7 3.2 3.8Transport 6.0 11 22 46 61 85 117 13 29 33 6.6 4.0 3.4 3.3 3.5Buildings, etc. 36 44 59 68 79 96 115 55 42 33 1.9 2.2 1.9 1.9 2.0Non-energy use 1.2 7.4 9.8 11 13 15 17 9.2 6.8 4.9 1.8 2.6 1.3 1.4 1.7Coal 0.1 2.2 4.7 4.6 8.0 12 15 2.7 2.8 4.4 3.3 8.2 3.8 2.9 4.6Oil 17 27 49 70 88 115 150 34 43 43 4.2 3.4 2.6 2.7 2.9Natural gas 2.4 6.0 12 17 24 35 49 7.5 11 14 4.7 4.8 3.8 3.6 4.0Electricity 0.6 2.4 6.8 16 26 43 66 3.0 10 19 8.6 7.0 5.2 4.4 5.3Heat - - - - - - - - - - n.a. n.a. n.a. n.a. n.a.Hydrogen - - - - - - - - - - n.a. n.a. n.a. n.a. n.a.Renewables 29 42 49 54 58 65 69 53 33 20 1.1 1.1 1.0 0.7 0.9
Electricity generation(TWh) Shares (%) CAGR (%)
1990/ 2013/ 2020/ 2030/ 2013/1980 1990 2000 2013 2020 2030 2040 1990 2013 2040 2013 2020 2030 2040 2040
Total 7.5 33 93 216 345 570 871 100 100 100 8.6 7.0 5.1 4.3 5.3Coal - 9.8 34 110 176 308 492 30 51 57 11.1 6.9 5.7 4.8 5.7Oil 6.2 15 18 27 23 23 22 47 12 2.6 2.4 -2.0 -0.2 -0.2 -0.7Natural gas - 0.7 26 52 95 167 256 2.2 24 29 20.3 9.1 5.8 4.4 6.1Nuclear - - - - - 9.8 29 - - 3.4 n.a. n.a. n.a. 11.6 n.a.Hydro 1.3 5.7 10 17 19 21 23 17 7.9 2.6 4.8 1.3 1.3 0.7 1.1Geothermal - 1.1 4.9 9.4 32 41 47 3.4 4.4 5.3 9.7 18.9 2.7 1.2 6.1Solar, wind, etc. - - - 0.0 0.0 0.1 0.1 - 0.0 0.0 n.a. 30.3 6.3 6.4 12.1Biomass and waste - - 0.0 0.3 0.5 0.8 1.1 - 0.1 0.1 n.a. 9.9 4.9 2.9 5.4
Energy and economic indicatorsCAGR (%)
1990/ 2013/ 2020/ 2030/ 2013/1980 1990 2000 2013 2020 2030 2040 2013 2020 2030 2040 2040
GDP ($2010 billion) 152 282 426 849 1,247 2,015 3,041 4.9 5.6 4.9 4.2 4.8Population (million) 145 179 209 250 270 294 311 1.5 1.1 0.8 0.6 0.8CO2 emissions*2 (Mt) 71 134 262 406 582 836 1,158 4.9 5.3 3.7 3.3 4.0GDP per capita ($2010 thousand) 1.0 1.6 2.0 3.4 4.6 6.9 9.8 3.4 4.5 4.0 3.6 4.0Primary energy consump. per capita (toe) 0.4 0.6 0.7 0.9 1.2 1.4 1.7 1.9 4.5 2.1 2.0 2.7Primary energy consumption per GDP*3 367 350 365 252 252 208 178 -1.4 0.0 -1.9 -1.6 -1.3CO2 emissions per GDP*2, *4 471 475 615 478 467 415 381 0.0 -0.3 -1.2 -0.8 -0.8CO2 per primary energy consumption*2, *5 1.3 1.4 1.7 1.9 1.9 2.0 2.1 1.5 -0.3 0.7 0.7 0.4Automobile ownership (million) 1.3 2.8 5.4 19 29 44 62 8.8 6.1 4.1 3.7 4.4Automobile ownership rates*6 8.9 16 26 78 108 148 201 7.2 4.9 3.2 3.1 3.6*1 Trade of electricity and heat are not shown, *2 Excludes emission reduction by CCS, *3 toe/$2010 million,*4 t/$2010 million, *5 t/toe, *6 Vehicles per 1,000 people
IEEJ:February 2016 © IEEJ2016
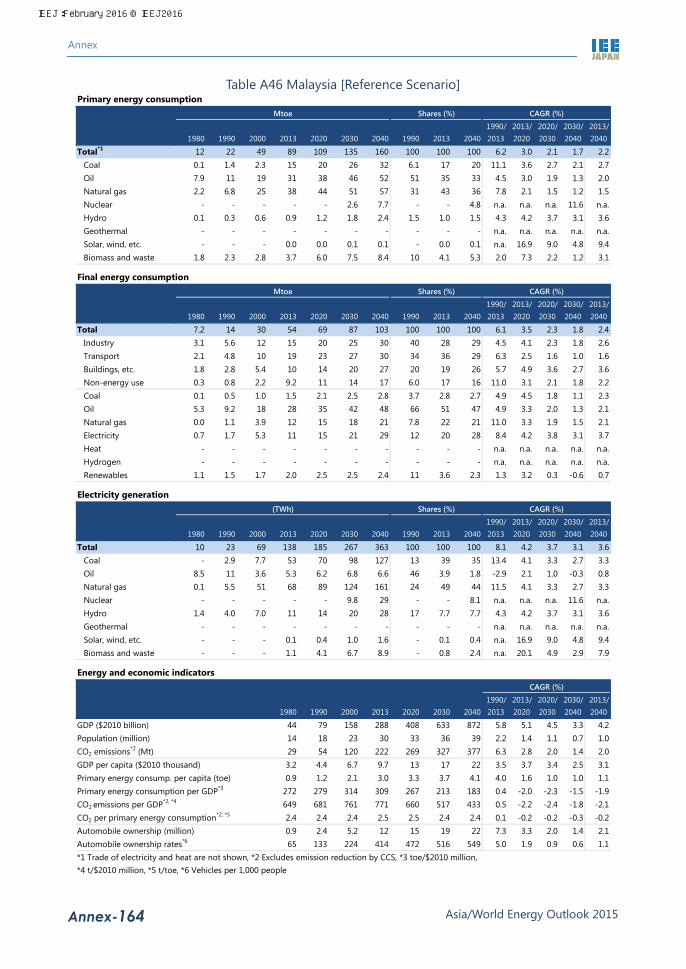
Annex
Asia/World Energy Outlook 2015 Annex-164
Table A46 Malaysia [Reference Scenario] Primary energy consumption
Mtoe Shares (%) CAGR (%)
1990/ 2013/ 2020/ 2030/ 2013/1980 1990 2000 2013 2020 2030 2040 1990 2013 2040 2013 2020 2030 2040 2040
Total*1 12 22 49 89 109 135 160 100 100 100 6.2 3.0 2.1 1.7 2.2Coal 0.1 1.4 2.3 15 20 26 32 6.1 17 20 11.1 3.6 2.7 2.1 2.7Oil 7.9 11 19 31 38 46 52 51 35 33 4.5 3.0 1.9 1.3 2.0Natural gas 2.2 6.8 25 38 44 51 57 31 43 36 7.8 2.1 1.5 1.2 1.5Nuclear - - - - - 2.6 7.7 - - 4.8 n.a. n.a. n.a. 11.6 n.a.Hydro 0.1 0.3 0.6 0.9 1.2 1.8 2.4 1.5 1.0 1.5 4.3 4.2 3.7 3.1 3.6Geothermal - - - - - - - - - - n.a. n.a. n.a. n.a. n.a.Solar, wind, etc. - - - 0.0 0.0 0.1 0.1 - 0.0 0.1 n.a. 16.9 9.0 4.8 9.4Biomass and waste 1.8 2.3 2.8 3.7 6.0 7.5 8.4 10 4.1 5.3 2.0 7.3 2.2 1.2 3.1
Final energy consumptionMtoe Shares (%) CAGR (%)
1990/ 2013/ 2020/ 2030/ 2013/1980 1990 2000 2013 2020 2030 2040 1990 2013 2040 2013 2020 2030 2040 2040
Total 7.2 14 30 54 69 87 103 100 100 100 6.1 3.5 2.3 1.8 2.4Industry 3.1 5.6 12 15 20 25 30 40 28 29 4.5 4.1 2.3 1.8 2.6Transport 2.1 4.8 10 19 23 27 30 34 36 29 6.3 2.5 1.6 1.0 1.6Buildings, etc. 1.8 2.8 5.4 10 14 20 27 20 19 26 5.7 4.9 3.6 2.7 3.6Non-energy use 0.3 0.8 2.2 9.2 11 14 17 6.0 17 16 11.0 3.1 2.1 1.8 2.2Coal 0.1 0.5 1.0 1.5 2.1 2.5 2.8 3.7 2.8 2.7 4.9 4.5 1.8 1.1 2.3Oil 5.3 9.2 18 28 35 42 48 66 51 47 4.9 3.3 2.0 1.3 2.1Natural gas 0.0 1.1 3.9 12 15 18 21 7.8 22 21 11.0 3.3 1.9 1.5 2.1Electricity 0.7 1.7 5.3 11 15 21 29 12 20 28 8.4 4.2 3.8 3.1 3.7Heat - - - - - - - - - - n.a. n.a. n.a. n.a. n.a.Hydrogen - - - - - - - - - - n.a. n.a. n.a. n.a. n.a.Renewables 1.1 1.5 1.7 2.0 2.5 2.5 2.4 11 3.6 2.3 1.3 3.2 0.3 -0.6 0.7
Electricity generation(TWh) Shares (%) CAGR (%)
1990/ 2013/ 2020/ 2030/ 2013/1980 1990 2000 2013 2020 2030 2040 1990 2013 2040 2013 2020 2030 2040 2040
Total 10 23 69 138 185 267 363 100 100 100 8.1 4.2 3.7 3.1 3.6Coal - 2.9 7.7 53 70 98 127 13 39 35 13.4 4.1 3.3 2.7 3.3Oil 8.5 11 3.6 5.3 6.2 6.8 6.6 46 3.9 1.8 -2.9 2.1 1.0 -0.3 0.8Natural gas 0.1 5.5 51 68 89 124 161 24 49 44 11.5 4.1 3.3 2.7 3.3Nuclear - - - - - 9.8 29 - - 8.1 n.a. n.a. n.a. 11.6 n.a.Hydro 1.4 4.0 7.0 11 14 20 28 17 7.7 7.7 4.3 4.2 3.7 3.1 3.6Geothermal - - - - - - - - - - n.a. n.a. n.a. n.a. n.a.Solar, wind, etc. - - - 0.1 0.4 1.0 1.6 - 0.1 0.4 n.a. 16.9 9.0 4.8 9.4Biomass and waste - - - 1.1 4.1 6.7 8.9 - 0.8 2.4 n.a. 20.1 4.9 2.9 7.9
Energy and economic indicatorsCAGR (%)
1990/ 2013/ 2020/ 2030/ 2013/1980 1990 2000 2013 2020 2030 2040 2013 2020 2030 2040 2040
GDP ($2010 billion) 44 79 158 288 408 633 872 5.8 5.1 4.5 3.3 4.2Population (million) 14 18 23 30 33 36 39 2.2 1.4 1.1 0.7 1.0CO2 emissions*2 (Mt) 29 54 120 222 269 327 377 6.3 2.8 2.0 1.4 2.0GDP per capita ($2010 thousand) 3.2 4.4 6.7 9.7 13 17 22 3.5 3.7 3.4 2.5 3.1Primary energy consump. per capita (toe) 0.9 1.2 2.1 3.0 3.3 3.7 4.1 4.0 1.6 1.0 1.0 1.1Primary energy consumption per GDP*3 272 279 314 309 267 213 183 0.4 -2.0 -2.3 -1.5 -1.9CO2 emissions per GDP*2, *4 649 681 761 771 660 517 433 0.5 -2.2 -2.4 -1.8 -2.1CO2 per primary energy consumption*2, *5 2.4 2.4 2.4 2.5 2.5 2.4 2.4 0.1 -0.2 -0.2 -0.3 -0.2Automobile ownership (million) 0.9 2.4 5.2 12 15 19 22 7.3 3.3 2.0 1.4 2.1Automobile ownership rates*6 65 133 224 414 472 516 549 5.0 1.9 0.9 0.6 1.1*1 Trade of electricity and heat are not shown, *2 Excludes emission reduction by CCS, *3 toe/$2010 million,*4 t/$2010 million, *5 t/toe, *6 Vehicles per 1,000 people
IEEJ:February 2016 © IEEJ2016

Annex
Asia/World Energy Outlook 2015 Annex-165
Table A47 Myanmar [Reference Scenario] Primary energy consumption
Mtoe Shares (%) CAGR (%)
1990/ 2013/ 2020/ 2030/ 2013/1980 1990 2000 2013 2020 2030 2040 1990 2013 2040 2013 2020 2030 2040 2040
Total*1 9.4 11 13 17 20 26 33 100 100 100 1.9 2.7 2.5 2.5 2.6Coal 0.2 0.1 0.3 0.4 0.7 1.4 2.3 0.6 2.2 7.1 7.7 10.5 6.7 5.0 7.0Oil 1.3 0.7 2.0 2.8 3.7 5.6 8.7 6.8 17 27 6.0 4.3 4.2 4.5 4.3Natural gas 0.3 0.8 1.2 1.8 3.4 5.6 8.0 7.1 11 24 3.9 9.1 5.2 3.6 5.6Nuclear - - - - - - - - - - n.a. n.a. n.a. n.a. n.a.Hydro 0.1 0.1 0.2 0.8 0.9 1.3 1.7 1.0 4.6 5.2 9.1 3.0 3.0 3.0 3.0Geothermal - - - - - - - - - - n.a. n.a. n.a. n.a. n.a.Solar, wind, etc. - - - - 0.0 0.0 0.0 - - 0.1 n.a. n.a. 6.0 6.3 n.a.Biomass and waste 7.6 9.0 9.2 11 11 12 12 84 65 37 0.8 0.5 0.4 0.3 0.4
Final energy consumptionMtoe Shares (%) CAGR (%)
1990/ 2013/ 2020/ 2030/ 2013/1980 1990 2000 2013 2020 2030 2040 1990 2013 2040 2013 2020 2030 2040 2040
Total 8.4 9.4 11 15 17 22 28 100 100 100 2.1 2.0 2.2 2.4 2.2Industry 0.6 0.4 1.2 1.9 2.6 4.0 6.2 4.2 12 23 7.1 4.7 4.5 4.4 4.5Transport 0.6 0.4 1.2 1.4 2.0 3.5 6.0 4.7 9.0 22 5.0 5.7 5.7 5.5 5.6Buildings, etc. 7.0 8.5 9.1 12 13 14 15 90 77 55 1.4 1.0 0.9 0.9 0.9Non-energy use 0.1 0.1 0.1 0.3 0.3 0.3 0.3 1.0 1.7 1.2 4.5 1.0 1.0 1.0 1.0Coal 0.1 0.1 0.3 0.2 0.3 0.5 0.7 0.5 1.6 2.5 7.1 3.9 3.9 3.9 3.9Oil 1.2 0.6 1.5 2.7 3.6 5.5 8.6 6.2 18 31 6.9 4.2 4.3 4.6 4.4Natural gas 0.1 0.2 0.3 0.8 1.0 1.4 1.9 2.4 5.1 6.8 5.5 3.5 3.4 3.1 3.3Electricity 0.1 0.1 0.3 0.7 1.4 2.6 4.4 1.6 4.9 16 7.3 9.2 6.6 5.3 6.7Heat - - - - - - - - - - n.a. n.a. n.a. n.a. n.a.Hydrogen - - - - - - - - - - n.a. n.a. n.a. n.a. n.a.Renewables 6.9 8.4 9.0 11 11 12 12 89 71 44 1.1 0.5 0.4 0.3 0.4
Electricity generation(TWh) Shares (%) CAGR (%)
1990/ 2013/ 2020/ 2030/ 2013/1980 1990 2000 2013 2020 2030 2040 1990 2013 2040 2013 2020 2030 2040 2040
Total 1.5 2.5 5.1 12 22 40 65 100 100 100 7.1 8.9 6.3 5.0 6.5Coal 0.0 0.0 - 0.5 1.8 4.2 7.6 1.6 4.3 12 11.7 19.6 8.9 6.0 10.5Oil 0.5 0.3 0.7 0.1 0.1 0.1 0.1 11 0.5 0.1 -6.7 0.0 0.0 0.0 0.0Natural gas 0.2 1.0 2.5 2.4 8.7 21 37 39 21 57 4.1 19.9 9.0 6.0 10.6Nuclear - - - - - - - - - - n.a. n.a. n.a. n.a. n.a.Hydro 0.8 1.2 1.9 8.9 11 15 20 48 75 31 9.1 3.0 3.0 3.0 3.0Geothermal - - - - - - - - - - n.a. n.a. n.a. n.a. n.a.Solar, wind, etc. - - - - 0.1 0.2 0.3 - - 0.5 n.a. n.a. 6.0 6.3 n.a.Biomass and waste - - - - - - - - - - n.a. n.a. n.a. n.a. n.a.
Energy and economic indicatorsCAGR (%)
1990/ 2013/ 2020/ 2030/ 2013/1980 1990 2000 2013 2020 2030 2040 2013 2020 2030 2040 2040
GDP ($2010 billion) 5.9 6.7 13 51 87 156 248 9.2 8.0 6.0 4.8 6.1Population (million) 34 42 48 53 57 61 63 1.0 0.9 0.7 0.4 0.6CO2 emissions*2 (Mt) 5.2 4.1 9.9 14 22 35 54 5.4 6.8 5.0 4.3 5.2GDP per capita ($2010 thousand) 0.2 0.2 0.3 1.0 1.5 2.6 3.9 8.1 7.1 5.3 4.3 5.4Primary energy consump. per capita (toe) 0.3 0.3 0.3 0.3 0.4 0.4 0.5 0.9 1.9 1.8 2.1 1.9Primary energy consumption per GDP*3 1,603 1,599 964 327 230 164 132 -6.7 -4.9 -3.3 -2.2 -3.3CO2 emissions per GDP*2, *4 891 608 744 269 249 226 217 -3.5 -1.1 -0.9 -0.4 -0.8CO2 per primary energy consumption*2, *5 0.6 0.4 0.8 0.8 1.1 1.4 1.6 3.4 4.0 2.5 1.8 2.6Automobile ownership (million) 0.1 0.1 0.3 0.5 0.9 1.8 3.4 9.3 7.4 7.2 6.9 7.2Automobile ownership rates*6 2.2 1.6 5.2 10.0 15 29 54 8.2 6.5 6.5 6.5 6.5*1 Trade of electricity and heat are not shown, *2 Excludes emission reduction by CCS, *3 toe/$2010 million,*4 t/$2010 million, *5 t/toe, *6 Vehicles per 1,000 people
IEEJ:February 2016 © IEEJ2016

Annex
Asia/World Energy Outlook 2015 Annex-166
Table A48 Philippines [Reference Scenario] Primary energy consumption
Mtoe Shares (%) CAGR (%)
1990/ 2013/ 2020/ 2030/ 2013/1980 1990 2000 2013 2020 2030 2040 1990 2013 2040 2013 2020 2030 2040 2040
Total*1 22 29 40 45 58 76 99 100 100 100 1.9 3.7 2.8 2.6 3.0Coal 0.5 1.5 5.2 11 13 19 27 5.3 24 28 8.9 2.3 4.2 3.5 3.5Oil 10 11 16 14 19 26 34 38 30 35 1.0 4.7 3.2 2.9 3.5Natural gas - - 0.0 2.9 4.6 7.4 11 - 6.5 11 n.a. 6.7 4.9 3.8 4.9Nuclear - - - - - - - - - - n.a. n.a. n.a. n.a. n.a.Hydro 0.3 0.5 0.7 0.9 1.0 1.0 1.0 1.8 1.9 1.0 2.2 1.9 0.0 0.0 0.5Geothermal 1.8 4.7 10.0 8.3 13 14 16 16 19 16 2.5 6.1 1.4 1.2 2.5Solar, wind, etc. - - - 0.0 0.0 0.0 0.0 - 0.0 0.0 n.a. 14.6 6.2 4.0 7.5Biomass and waste 9.4 11 8.1 8.2 8.0 8.4 9.3 39 18 9.4 -1.3 -0.4 0.5 1.1 0.5
Final energy consumptionMtoe Shares (%) CAGR (%)
1990/ 2013/ 2020/ 2030/ 2013/1980 1990 2000 2013 2020 2030 2040 1990 2013 2040 2013 2020 2030 2040 2040
Total 17 20 24 26 33 44 57 100 100 100 1.2 3.4 2.9 2.8 3.0Industry 3.4 4.7 5.3 6.9 8.6 11 14 24 27 25 1.7 3.2 2.6 2.4 2.7Transport 3.5 4.5 8.1 8.8 12 17 24 23 34 42 2.9 4.4 3.7 3.4 3.8Buildings, etc. 9.4 10 10 9.8 12 15 19 52 38 32 -0.2 2.6 2.3 2.3 2.4Non-energy use 0.3 0.2 0.3 0.3 0.4 0.6 0.8 1.2 1.2 1.4 1.4 4.4 3.4 3.1 3.6Coal 0.2 0.6 0.8 2.1 1.8 1.4 1.1 3.1 8.3 1.9 5.6 -2.3 -2.3 -2.8 -2.5Oil 7.0 8.1 13 12 17 24 32 41 47 56 1.8 4.8 3.4 3.0 3.7Natural gas - - - 0.1 0.5 1.0 1.5 - 0.2 2.6 n.a. 33.0 7.8 4.4 12.5Electricity 1.5 1.8 3.1 5.3 7.3 11 15 9.3 21 26 4.7 4.7 3.9 3.3 3.9Heat - - - - - - - - - - n.a. n.a. n.a. n.a. n.a.Hydrogen - - - - - - - - - - n.a. n.a. n.a. n.a. n.a.Renewables 7.8 9.1 6.9 6.1 6.1 6.7 7.7 46 24 13 -1.7 0.1 0.9 1.4 0.9
Electricity generation(TWh) Shares (%) CAGR (%)
1990/ 2013/ 2020/ 2030/ 2013/1980 1990 2000 2013 2020 2030 2040 1990 2013 2040 2013 2020 2030 2040 2040
Total 18 26 45 75 104 150 206 100 100 100 4.7 4.7 3.8 3.2 3.8Coal 0.2 1.9 17 32 47 76 112 7.3 43 54 13.0 5.5 5.0 3.9 4.7Oil 12 12 9.2 4.5 4.1 3.6 3.1 47 6.0 1.5 -4.3 -1.2 -1.3 -1.5 -1.3Natural gas - - 0.0 19 26 41 59 - 25 29 n.a. 4.8 4.6 3.7 4.3Nuclear - - - - - - - - - - n.a. n.a. n.a. n.a. n.a.Hydro 3.5 6.1 7.8 10 11 11 11 23 13 5.5 2.2 1.9 0.0 0.0 0.5Geothermal 2.1 5.5 12 9.6 15 17 19 21 13 9.2 2.5 6.1 1.4 1.2 2.5Solar, wind, etc. - - - 0.1 0.2 0.3 0.5 - 0.1 0.2 n.a. 14.6 6.2 4.0 7.5Biomass and waste - 0.4 - 0.2 0.4 0.7 0.9 1.6 0.3 0.4 -3.0 10.0 4.9 2.9 5.4
Energy and economic indicatorsCAGR (%)
1990/ 2013/ 2020/ 2030/ 2013/1980 1990 2000 2013 2020 2030 2040 2013 2020 2030 2040 2040
GDP ($2010 billion) 80 95 125 237 360 563 838 4.1 6.2 4.6 4.0 4.8Population (million) 47 62 78 98 109 125 138 2.0 1.5 1.3 1.0 1.3CO2 emissions*2 (Mt) 33 39 69 90 117 171 235 3.8 3.8 3.8 3.3 3.6GDP per capita ($2010 thousand) 1.7 1.5 1.6 2.4 3.3 4.5 6.1 2.0 4.6 3.2 3.0 3.5Primary energy consump. per capita (toe) 0.5 0.5 0.5 0.5 0.5 0.6 0.7 -0.1 2.1 1.5 1.6 1.7Primary energy consumption per GDP*3 280 304 319 188 160 135 118 -2.1 -2.3 -1.7 -1.4 -1.7CO2 emissions per GDP*2, *4 414 409 550 382 326 303 281 -0.3 -2.2 -0.7 -0.7 -1.1CO2 per primary energy consumption*2, *5 1.5 1.3 1.7 2.0 2.0 2.2 2.4 1.8 0.1 0.9 0.6 0.6Automobile ownership (million) 0.9 1.2 2.4 3.4 5.1 8.6 14 4.6 6.0 5.4 5.1 5.4Automobile ownership rates*6 18 20 31 35 47 69 103 2.5 4.4 4.0 4.0 4.1*1 Trade of electricity and heat are not shown, *2 Excludes emission reduction by CCS, *3 toe/$2010 million,*4 t/$2010 million, *5 t/toe, *6 Vehicles per 1,000 people
IEEJ:February 2016 © IEEJ2016
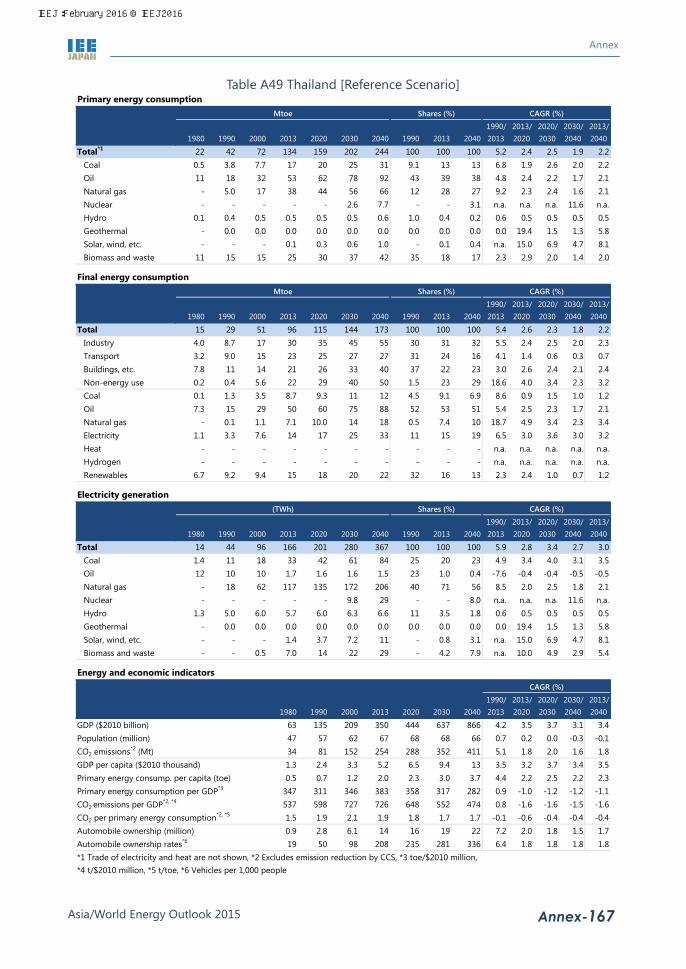
Annex
Asia/World Energy Outlook 2015 Annex-167
Table A49 Thailand [Reference Scenario] Primary energy consumption
Mtoe Shares (%) CAGR (%)
1990/ 2013/ 2020/ 2030/ 2013/1980 1990 2000 2013 2020 2030 2040 1990 2013 2040 2013 2020 2030 2040 2040
Total*1 22 42 72 134 159 202 244 100 100 100 5.2 2.4 2.5 1.9 2.2Coal 0.5 3.8 7.7 17 20 25 31 9.1 13 13 6.8 1.9 2.6 2.0 2.2Oil 11 18 32 53 62 78 92 43 39 38 4.8 2.4 2.2 1.7 2.1Natural gas - 5.0 17 38 44 56 66 12 28 27 9.2 2.3 2.4 1.6 2.1Nuclear - - - - - 2.6 7.7 - - 3.1 n.a. n.a. n.a. 11.6 n.a.Hydro 0.1 0.4 0.5 0.5 0.5 0.5 0.6 1.0 0.4 0.2 0.6 0.5 0.5 0.5 0.5Geothermal - 0.0 0.0 0.0 0.0 0.0 0.0 0.0 0.0 0.0 0.0 19.4 1.5 1.3 5.8Solar, wind, etc. - - - 0.1 0.3 0.6 1.0 - 0.1 0.4 n.a. 15.0 6.9 4.7 8.1Biomass and waste 11 15 15 25 30 37 42 35 18 17 2.3 2.9 2.0 1.4 2.0
Final energy consumptionMtoe Shares (%) CAGR (%)
1990/ 2013/ 2020/ 2030/ 2013/1980 1990 2000 2013 2020 2030 2040 1990 2013 2040 2013 2020 2030 2040 2040
Total 15 29 51 96 115 144 173 100 100 100 5.4 2.6 2.3 1.8 2.2Industry 4.0 8.7 17 30 35 45 55 30 31 32 5.5 2.4 2.5 2.0 2.3Transport 3.2 9.0 15 23 25 27 27 31 24 16 4.1 1.4 0.6 0.3 0.7Buildings, etc. 7.8 11 14 21 26 33 40 37 22 23 3.0 2.6 2.4 2.1 2.4Non-energy use 0.2 0.4 5.6 22 29 40 50 1.5 23 29 18.6 4.0 3.4 2.3 3.2Coal 0.1 1.3 3.5 8.7 9.3 11 12 4.5 9.1 6.9 8.6 0.9 1.5 1.0 1.2Oil 7.3 15 29 50 60 75 88 52 53 51 5.4 2.5 2.3 1.7 2.1Natural gas - 0.1 1.1 7.1 10.0 14 18 0.5 7.4 10 18.7 4.9 3.4 2.3 3.4Electricity 1.1 3.3 7.6 14 17 25 33 11 15 19 6.5 3.0 3.6 3.0 3.2Heat - - - - - - - - - - n.a. n.a. n.a. n.a. n.a.Hydrogen - - - - - - - - - - n.a. n.a. n.a. n.a. n.a.Renewables 6.7 9.2 9.4 15 18 20 22 32 16 13 2.3 2.4 1.0 0.7 1.2
Electricity generation(TWh) Shares (%) CAGR (%)
1990/ 2013/ 2020/ 2030/ 2013/1980 1990 2000 2013 2020 2030 2040 1990 2013 2040 2013 2020 2030 2040 2040
Total 14 44 96 166 201 280 367 100 100 100 5.9 2.8 3.4 2.7 3.0Coal 1.4 11 18 33 42 61 84 25 20 23 4.9 3.4 4.0 3.1 3.5Oil 12 10 10 1.7 1.6 1.6 1.5 23 1.0 0.4 -7.6 -0.4 -0.4 -0.5 -0.5Natural gas - 18 62 117 135 172 206 40 71 56 8.5 2.0 2.5 1.8 2.1Nuclear - - - - - 9.8 29 - - 8.0 n.a. n.a. n.a. 11.6 n.a.Hydro 1.3 5.0 6.0 5.7 6.0 6.3 6.6 11 3.5 1.8 0.6 0.5 0.5 0.5 0.5Geothermal - 0.0 0.0 0.0 0.0 0.0 0.0 0.0 0.0 0.0 0.0 19.4 1.5 1.3 5.8Solar, wind, etc. - - - 1.4 3.7 7.2 11 - 0.8 3.1 n.a. 15.0 6.9 4.7 8.1Biomass and waste - - 0.5 7.0 14 22 29 - 4.2 7.9 n.a. 10.0 4.9 2.9 5.4
Energy and economic indicatorsCAGR (%)
1990/ 2013/ 2020/ 2030/ 2013/1980 1990 2000 2013 2020 2030 2040 2013 2020 2030 2040 2040
GDP ($2010 billion) 63 135 209 350 444 637 866 4.2 3.5 3.7 3.1 3.4Population (million) 47 57 62 67 68 68 66 0.7 0.2 0.0 -0.3 -0.1CO2 emissions*2 (Mt) 34 81 152 254 288 352 411 5.1 1.8 2.0 1.6 1.8GDP per capita ($2010 thousand) 1.3 2.4 3.3 5.2 6.5 9.4 13 3.5 3.2 3.7 3.4 3.5Primary energy consump. per capita (toe) 0.5 0.7 1.2 2.0 2.3 3.0 3.7 4.4 2.2 2.5 2.2 2.3Primary energy consumption per GDP*3 347 311 346 383 358 317 282 0.9 -1.0 -1.2 -1.2 -1.1CO2 emissions per GDP*2, *4 537 598 727 726 648 552 474 0.8 -1.6 -1.6 -1.5 -1.6CO2 per primary energy consumption*2, *5 1.5 1.9 2.1 1.9 1.8 1.7 1.7 -0.1 -0.6 -0.4 -0.4 -0.4Automobile ownership (million) 0.9 2.8 6.1 14 16 19 22 7.2 2.0 1.8 1.5 1.7Automobile ownership rates*6 19 50 98 208 235 281 336 6.4 1.8 1.8 1.8 1.8*1 Trade of electricity and heat are not shown, *2 Excludes emission reduction by CCS, *3 toe/$2010 million,*4 t/$2010 million, *5 t/toe, *6 Vehicles per 1,000 people
IEEJ:February 2016 © IEEJ2016

Annex
Asia/World Energy Outlook 2015 Annex-168
Table A50 Viet Nam [Reference Scenario] Primary energy consumption
Mtoe Shares (%) CAGR (%)
1990/ 2013/ 2020/ 2030/ 2013/1980 1990 2000 2013 2020 2030 2040 1990 2013 2040 2013 2020 2030 2040 2040
Total*1 14 18 29 60 83 136 206 100 100 100 5.4 4.7 5.1 4.2 4.7Coal 2.3 2.2 4.4 16 23 38 61 12 26 30 8.9 5.8 5.0 4.8 5.2Oil 1.8 2.7 7.8 16 21 37 56 15 26 27 7.9 4.4 5.7 4.4 4.9Natural gas - 0.0 1.1 8.4 15 29 49 0.0 14 24 41.9 8.8 6.7 5.4 6.7Nuclear - - - - - 6.6 12 - - 5.7 n.a. n.a. n.a. 5.9 n.a.Hydro 0.1 0.5 1.3 4.9 6.9 9.2 10 2.6 8.2 5.0 10.8 5.0 2.9 1.2 2.8Geothermal - - - - - - - - - - n.a. n.a. n.a. n.a. n.a.Solar, wind, etc. - - - 0.0 0.0 0.0 0.1 - 0.0 0.1 n.a. 15.1 8.2 9.0 10.2Biomass and waste 10 12 14 15 16 16 17 70 25 8.2 0.9 0.6 0.4 0.3 0.4
Final energy consumptionMtoe Shares (%) CAGR (%)
1990/ 2013/ 2020/ 2030/ 2013/1980 1990 2000 2013 2020 2030 2040 1990 2013 2040 2013 2020 2030 2040 2040
Total 13 16 25 51 68 105 151 100 100 100 5.2 4.1 4.5 3.7 4.1Industry 3.8 4.5 7.9 19 28 44 63 28 38 42 6.5 5.2 4.8 3.6 4.4Transport 0.6 1.4 3.5 10 14 26 42 8.6 20 27 9.2 4.5 6.4 4.7 5.3Buildings, etc. 8.6 10 14 19 23 31 41 63 38 27 2.9 2.7 2.7 3.0 2.8Non-energy use 0.0 0.0 0.1 1.7 2.4 3.9 5.8 0.2 3.3 3.9 19.6 4.8 5.3 4.0 4.7Coal 1.5 1.3 3.2 9.7 12 17 22 8.3 19 14 9.0 3.7 3.2 2.4 3.0Oil 1.7 2.3 6.5 16 21 37 57 15 31 37 8.7 4.3 5.6 4.4 4.8Natural gas - - 0.0 1.3 3.1 7.0 11 - 2.6 7.0 n.a. 12.5 8.5 4.2 7.9Electricity 0.2 0.5 1.9 9.8 16 29 47 3.3 19 31 13.5 7.0 6.1 5.0 5.9Heat - - - - - - - - - - n.a. n.a. n.a. n.a. n.a.Hydrogen - - - - - - - - - - n.a. n.a. n.a. n.a. n.a.Renewables 9.7 12 13 14 15 15 16 74 28 11 0.8 0.6 0.4 0.3 0.4
Electricity generation(TWh) Shares (%) CAGR (%)
1990/ 2013/ 2020/ 2030/ 2013/1980 1990 2000 2013 2020 2030 2040 1990 2013 2040 2013 2020 2030 2040 2040
Total 3.6 8.7 27 127 201 361 587 100 100 100 12.4 6.8 6.0 5.0 5.8Coal 1.4 2.0 3.1 25 46 92 179 23 20 31 11.6 9.0 7.3 6.9 7.6Oil 0.7 1.3 4.5 2.3 2.3 2.3 2.3 15 1.8 0.4 2.4 0.0 0.0 0.0 0.0Natural gas - 0.0 4.4 43 73 134 239 0.1 34 41 47.1 8.0 6.3 5.9 6.6Nuclear - - - - - 25 45 - - 7.6 n.a. n.a. n.a. 5.9 n.a.Hydro 1.5 5.4 15 57 80 107 120 62 45 21 10.8 5.0 2.9 1.2 2.8Geothermal - - - - - - - - - - n.a. n.a. n.a. n.a. n.a.Solar, wind, etc. - - - 0.1 0.2 0.5 1.2 - 0.1 0.2 n.a. 15.1 8.2 9.0 10.2Biomass and waste - - - 0.1 0.1 0.2 0.2 - 0.0 0.0 n.a. 9.0 4.9 2.9 5.2
Energy and economic indicatorsCAGR (%)
1990/ 2013/ 2020/ 2030/ 2013/1980 1990 2000 2013 2020 2030 2040 2013 2020 2030 2040 2040
GDP ($2010 billion) 17 29 61 137 205 388 631 6.9 6.0 6.6 5.0 5.8Population (million) 54 66 78 90 96 103 108 1.3 1.0 0.7 0.4 0.7CO2 emissions*2 (Mt) 15 17 43 125 185 319 512 9.0 5.9 5.6 4.8 5.4GDP per capita ($2010 thousand) 0.3 0.4 0.8 1.5 2.1 3.8 5.8 5.5 4.9 5.8 4.5 5.1Primary energy consump. per capita (toe) 0.3 0.3 0.4 0.7 0.9 1.3 1.9 4.0 3.6 4.4 3.8 4.0Primary energy consumption per GDP*3 851 606 470 439 403 352 327 -1.4 -1.2 -1.3 -0.7 -1.1CO2 emissions per GDP*2, *4 860 579 711 911 905 824 811 2.0 -0.1 -0.9 -0.1 -0.4CO2 per primary energy consumption*2, *5 1.0 1.0 1.5 2.1 2.2 2.3 2.5 3.4 1.1 0.4 0.6 0.7Automobile ownership (million) 0.2 0.2 0.4 1.3 2.2 4.5 8.1 9.1 7.9 7.5 6.1 7.1Automobile ownership rates*6 2.9 2.6 4.8 14 22 43 75 7.6 6.8 6.8 5.7 6.4*1 Trade of electricity and heat are not shown, *2 Excludes emission reduction by CCS, *3 toe/$2010 million,*4 t/$2010 million, *5 t/toe, *6 Vehicles per 1,000 people
IEEJ:February 2016 © IEEJ2016
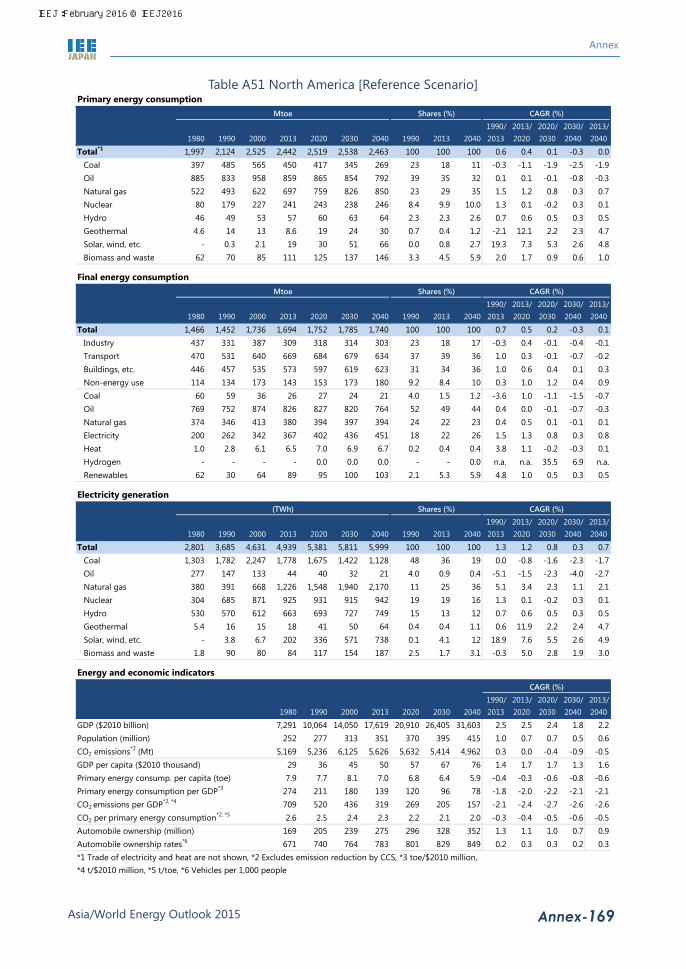
Annex
Asia/World Energy Outlook 2015 Annex-169
Table A51 North America [Reference Scenario] Primary energy consumption
Mtoe Shares (%) CAGR (%)
1990/ 2013/ 2020/ 2030/ 2013/1980 1990 2000 2013 2020 2030 2040 1990 2013 2040 2013 2020 2030 2040 2040
Total*1 1,997 2,124 2,525 2,442 2,519 2,538 2,463 100 100 100 0.6 0.4 0.1 -0.3 0.0Coal 397 485 565 450 417 345 269 23 18 11 -0.3 -1.1 -1.9 -2.5 -1.9Oil 885 833 958 859 865 854 792 39 35 32 0.1 0.1 -0.1 -0.8 -0.3Natural gas 522 493 622 697 759 826 850 23 29 35 1.5 1.2 0.8 0.3 0.7Nuclear 80 179 227 241 243 238 246 8.4 9.9 10.0 1.3 0.1 -0.2 0.3 0.1Hydro 46 49 53 57 60 63 64 2.3 2.3 2.6 0.7 0.6 0.5 0.3 0.5Geothermal 4.6 14 13 8.6 19 24 30 0.7 0.4 1.2 -2.1 12.1 2.2 2.3 4.7Solar, wind, etc. - 0.3 2.1 19 30 51 66 0.0 0.8 2.7 19.3 7.3 5.3 2.6 4.8Biomass and waste 62 70 85 111 125 137 146 3.3 4.5 5.9 2.0 1.7 0.9 0.6 1.0
Final energy consumptionMtoe Shares (%) CAGR (%)
1990/ 2013/ 2020/ 2030/ 2013/1980 1990 2000 2013 2020 2030 2040 1990 2013 2040 2013 2020 2030 2040 2040
Total 1,466 1,452 1,736 1,694 1,752 1,785 1,740 100 100 100 0.7 0.5 0.2 -0.3 0.1Industry 437 331 387 309 318 314 303 23 18 17 -0.3 0.4 -0.1 -0.4 -0.1Transport 470 531 640 669 684 679 634 37 39 36 1.0 0.3 -0.1 -0.7 -0.2Buildings, etc. 446 457 535 573 597 619 623 31 34 36 1.0 0.6 0.4 0.1 0.3Non-energy use 114 134 173 143 153 173 180 9.2 8.4 10 0.3 1.0 1.2 0.4 0.9Coal 60 59 36 26 27 24 21 4.0 1.5 1.2 -3.6 1.0 -1.1 -1.5 -0.7Oil 769 752 874 826 827 820 764 52 49 44 0.4 0.0 -0.1 -0.7 -0.3Natural gas 374 346 413 380 394 397 394 24 22 23 0.4 0.5 0.1 -0.1 0.1Electricity 200 262 342 367 402 436 451 18 22 26 1.5 1.3 0.8 0.3 0.8Heat 1.0 2.8 6.1 6.5 7.0 6.9 6.7 0.2 0.4 0.4 3.8 1.1 -0.2 -0.3 0.1Hydrogen - - - - 0.0 0.0 0.0 - - 0.0 n.a. n.a. 35.5 6.9 n.a.Renewables 62 30 64 89 95 100 103 2.1 5.3 5.9 4.8 1.0 0.5 0.3 0.5
Electricity generation(TWh) Shares (%) CAGR (%)
1990/ 2013/ 2020/ 2030/ 2013/1980 1990 2000 2013 2020 2030 2040 1990 2013 2040 2013 2020 2030 2040 2040
Total 2,801 3,685 4,631 4,939 5,381 5,811 5,999 100 100 100 1.3 1.2 0.8 0.3 0.7Coal 1,303 1,782 2,247 1,778 1,675 1,422 1,128 48 36 19 0.0 -0.8 -1.6 -2.3 -1.7Oil 277 147 133 44 40 32 21 4.0 0.9 0.4 -5.1 -1.5 -2.3 -4.0 -2.7Natural gas 380 391 668 1,226 1,548 1,940 2,170 11 25 36 5.1 3.4 2.3 1.1 2.1Nuclear 304 685 871 925 931 915 942 19 19 16 1.3 0.1 -0.2 0.3 0.1Hydro 530 570 612 663 693 727 749 15 13 12 0.7 0.6 0.5 0.3 0.5Geothermal 5.4 16 15 18 41 50 64 0.4 0.4 1.1 0.6 11.9 2.2 2.4 4.7Solar, wind, etc. - 3.8 6.7 202 336 571 738 0.1 4.1 12 18.9 7.6 5.5 2.6 4.9Biomass and waste 1.8 90 80 84 117 154 187 2.5 1.7 3.1 -0.3 5.0 2.8 1.9 3.0
Energy and economic indicatorsCAGR (%)
1990/ 2013/ 2020/ 2030/ 2013/1980 1990 2000 2013 2020 2030 2040 2013 2020 2030 2040 2040
GDP ($2010 billion) 7,291 10,064 14,050 17,619 20,910 26,405 31,603 2.5 2.5 2.4 1.8 2.2Population (million) 252 277 313 351 370 395 415 1.0 0.7 0.7 0.5 0.6CO2 emissions*2 (Mt) 5,169 5,236 6,125 5,626 5,632 5,414 4,962 0.3 0.0 -0.4 -0.9 -0.5GDP per capita ($2010 thousand) 29 36 45 50 57 67 76 1.4 1.7 1.7 1.3 1.6Primary energy consump. per capita (toe) 7.9 7.7 8.1 7.0 6.8 6.4 5.9 -0.4 -0.3 -0.6 -0.8 -0.6Primary energy consumption per GDP*3 274 211 180 139 120 96 78 -1.8 -2.0 -2.2 -2.1 -2.1CO2 emissions per GDP*2, *4 709 520 436 319 269 205 157 -2.1 -2.4 -2.7 -2.6 -2.6CO2 per primary energy consumption*2, *5 2.6 2.5 2.4 2.3 2.2 2.1 2.0 -0.3 -0.4 -0.5 -0.6 -0.5Automobile ownership (million) 169 205 239 275 296 328 352 1.3 1.1 1.0 0.7 0.9Automobile ownership rates*6 671 740 764 783 801 829 849 0.2 0.3 0.3 0.2 0.3*1 Trade of electricity and heat are not shown, *2 Excludes emission reduction by CCS, *3 toe/$2010 million,*4 t/$2010 million, *5 t/toe, *6 Vehicles per 1,000 people
IEEJ:February 2016 © IEEJ2016
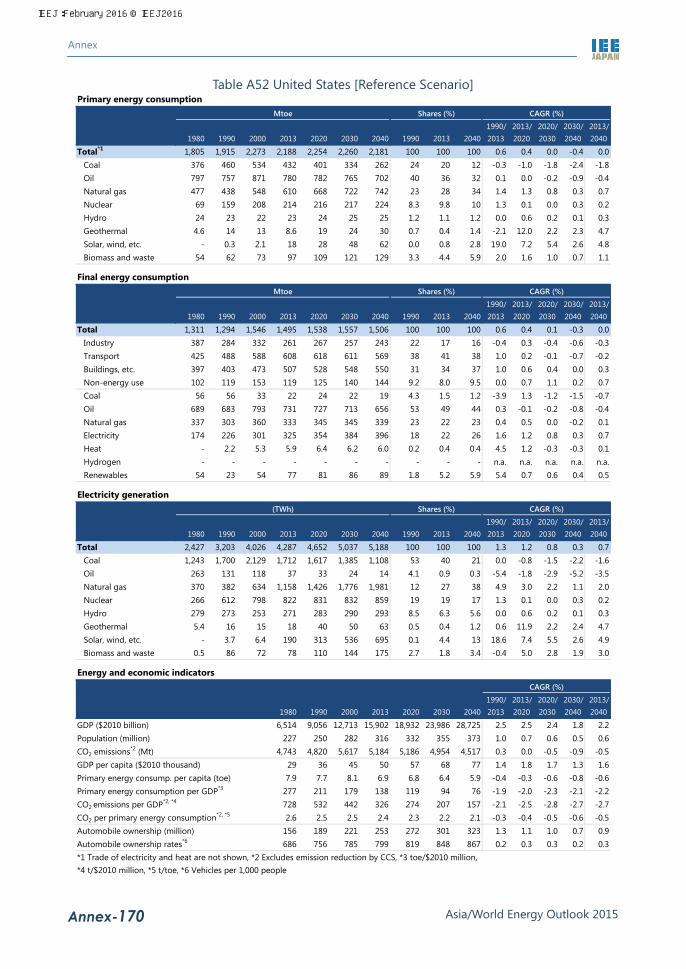
Annex
Asia/World Energy Outlook 2015 Annex-170
Table A52 United States [Reference Scenario] Primary energy consumption
Mtoe Shares (%) CAGR (%)
1990/ 2013/ 2020/ 2030/ 2013/1980 1990 2000 2013 2020 2030 2040 1990 2013 2040 2013 2020 2030 2040 2040
Total*1 1,805 1,915 2,273 2,188 2,254 2,260 2,181 100 100 100 0.6 0.4 0.0 -0.4 0.0Coal 376 460 534 432 401 334 262 24 20 12 -0.3 -1.0 -1.8 -2.4 -1.8Oil 797 757 871 780 782 765 702 40 36 32 0.1 0.0 -0.2 -0.9 -0.4Natural gas 477 438 548 610 668 722 742 23 28 34 1.4 1.3 0.8 0.3 0.7Nuclear 69 159 208 214 216 217 224 8.3 9.8 10 1.3 0.1 0.0 0.3 0.2Hydro 24 23 22 23 24 25 25 1.2 1.1 1.2 0.0 0.6 0.2 0.1 0.3Geothermal 4.6 14 13 8.6 19 24 30 0.7 0.4 1.4 -2.1 12.0 2.2 2.3 4.7Solar, wind, etc. - 0.3 2.1 18 28 48 62 0.0 0.8 2.8 19.0 7.2 5.4 2.6 4.8Biomass and waste 54 62 73 97 109 121 129 3.3 4.4 5.9 2.0 1.6 1.0 0.7 1.1
Final energy consumptionMtoe Shares (%) CAGR (%)
1990/ 2013/ 2020/ 2030/ 2013/1980 1990 2000 2013 2020 2030 2040 1990 2013 2040 2013 2020 2030 2040 2040
Total 1,311 1,294 1,546 1,495 1,538 1,557 1,506 100 100 100 0.6 0.4 0.1 -0.3 0.0Industry 387 284 332 261 267 257 243 22 17 16 -0.4 0.3 -0.4 -0.6 -0.3Transport 425 488 588 608 618 611 569 38 41 38 1.0 0.2 -0.1 -0.7 -0.2Buildings, etc. 397 403 473 507 528 548 550 31 34 37 1.0 0.6 0.4 0.0 0.3Non-energy use 102 119 153 119 125 140 144 9.2 8.0 9.5 0.0 0.7 1.1 0.2 0.7Coal 56 56 33 22 24 22 19 4.3 1.5 1.2 -3.9 1.3 -1.2 -1.5 -0.7Oil 689 683 793 731 727 713 656 53 49 44 0.3 -0.1 -0.2 -0.8 -0.4Natural gas 337 303 360 333 345 345 339 23 22 23 0.4 0.5 0.0 -0.2 0.1Electricity 174 226 301 325 354 384 396 18 22 26 1.6 1.2 0.8 0.3 0.7Heat - 2.2 5.3 5.9 6.4 6.2 6.0 0.2 0.4 0.4 4.5 1.2 -0.3 -0.3 0.1Hydrogen - - - - - - - - - - n.a. n.a. n.a. n.a. n.a.Renewables 54 23 54 77 81 86 89 1.8 5.2 5.9 5.4 0.7 0.6 0.4 0.5
Electricity generation(TWh) Shares (%) CAGR (%)
1990/ 2013/ 2020/ 2030/ 2013/1980 1990 2000 2013 2020 2030 2040 1990 2013 2040 2013 2020 2030 2040 2040
Total 2,427 3,203 4,026 4,287 4,652 5,037 5,188 100 100 100 1.3 1.2 0.8 0.3 0.7Coal 1,243 1,700 2,129 1,712 1,617 1,385 1,108 53 40 21 0.0 -0.8 -1.5 -2.2 -1.6Oil 263 131 118 37 33 24 14 4.1 0.9 0.3 -5.4 -1.8 -2.9 -5.2 -3.5Natural gas 370 382 634 1,158 1,426 1,776 1,981 12 27 38 4.9 3.0 2.2 1.1 2.0Nuclear 266 612 798 822 831 832 859 19 19 17 1.3 0.1 0.0 0.3 0.2Hydro 279 273 253 271 283 290 293 8.5 6.3 5.6 0.0 0.6 0.2 0.1 0.3Geothermal 5.4 16 15 18 40 50 63 0.5 0.4 1.2 0.6 11.9 2.2 2.4 4.7Solar, wind, etc. - 3.7 6.4 190 313 536 695 0.1 4.4 13 18.6 7.4 5.5 2.6 4.9Biomass and waste 0.5 86 72 78 110 144 175 2.7 1.8 3.4 -0.4 5.0 2.8 1.9 3.0
Energy and economic indicatorsCAGR (%)
1990/ 2013/ 2020/ 2030/ 2013/1980 1990 2000 2013 2020 2030 2040 2013 2020 2030 2040 2040
GDP ($2010 billion) 6,514 9,056 12,713 15,902 18,932 23,986 28,725 2.5 2.5 2.4 1.8 2.2Population (million) 227 250 282 316 332 355 373 1.0 0.7 0.6 0.5 0.6CO2 emissions*2 (Mt) 4,743 4,820 5,617 5,184 5,186 4,954 4,517 0.3 0.0 -0.5 -0.9 -0.5GDP per capita ($2010 thousand) 29 36 45 50 57 68 77 1.4 1.8 1.7 1.3 1.6Primary energy consump. per capita (toe) 7.9 7.7 8.1 6.9 6.8 6.4 5.9 -0.4 -0.3 -0.6 -0.8 -0.6Primary energy consumption per GDP*3 277 211 179 138 119 94 76 -1.9 -2.0 -2.3 -2.1 -2.2CO2 emissions per GDP*2, *4 728 532 442 326 274 207 157 -2.1 -2.5 -2.8 -2.7 -2.7CO2 per primary energy consumption*2, *5 2.6 2.5 2.5 2.4 2.3 2.2 2.1 -0.3 -0.4 -0.5 -0.6 -0.5Automobile ownership (million) 156 189 221 253 272 301 323 1.3 1.1 1.0 0.7 0.9Automobile ownership rates*6 686 756 785 799 819 848 867 0.2 0.3 0.3 0.2 0.3*1 Trade of electricity and heat are not shown, *2 Excludes emission reduction by CCS, *3 toe/$2010 million,*4 t/$2010 million, *5 t/toe, *6 Vehicles per 1,000 people
IEEJ:February 2016 © IEEJ2016

Annex
Asia/World Energy Outlook 2015 Annex-171
Table A53 Latin America [Reference Scenario] Primary energy consumption
Mtoe Shares (%) CAGR (%)
1990/ 2013/ 2020/ 2030/ 2013/1980 1990 2000 2013 2020 2030 2040 1990 2013 2040 2013 2020 2030 2040 2040
Total*1 383 464 594 849 964 1,194 1,381 100 100 100 2.7 1.8 2.2 1.5 1.8Coal 13 20 27 43 45 60 74 4.4 5.0 5.3 3.3 0.6 3.1 2.0 2.0Oil 223 237 303 390 416 476 506 51 46 37 2.2 0.9 1.4 0.6 1.0Natural gas 48 72 112 199 235 328 411 16 23 30 4.5 2.4 3.4 2.3 2.7Nuclear 0.6 3.2 5.3 8.5 12 14 17 0.7 1.0 1.2 4.3 4.4 2.2 1.8 2.6Hydro 19 33 50 63 69 78 86 7.2 7.4 6.2 2.8 1.4 1.1 1.0 1.2Geothermal 1.2 5.1 6.3 6.6 19 28 41 1.1 0.8 3.0 1.1 16.7 3.6 4.1 7.0Solar, wind, etc. - 0.0 0.2 2.0 4.1 6.7 11 0.0 0.2 0.8 22.8 11.1 4.9 4.7 6.4Biomass and waste 79 92 89 137 163 203 235 20 16 17 1.7 2.5 2.2 1.5 2.0
Final energy consumptionMtoe Shares (%) CAGR (%)
1990/ 2013/ 2020/ 2030/ 2013/1980 1990 2000 2013 2020 2030 2040 1990 2013 2040 2013 2020 2030 2040 2040
Total 288 344 449 610 685 841 963 100 100 100 2.5 1.7 2.1 1.4 1.7Industry 98 115 148 199 220 279 335 33 33 35 2.4 1.5 2.4 1.9 2.0Transport 85 103 141 216 252 312 346 30 35 36 3.3 2.2 2.2 1.0 1.8Buildings, etc. 89 101 120 154 169 202 230 29 25 24 1.9 1.3 1.8 1.3 1.5Non-energy use 16 26 41 40 45 49 52 7.5 6.6 5.4 2.0 1.4 0.9 0.6 0.9Coal 6.1 8.5 11 17 15 16 16 2.5 2.7 1.7 2.9 -1.6 0.6 0.5 0.0Oil 159 179 241 307 340 403 436 52 50 45 2.4 1.5 1.7 0.8 1.3Natural gas 27 38 54 77 88 111 135 11 13 14 3.1 2.0 2.4 1.9 2.1Electricity 27 44 70 109 127 172 214 13 18 22 4.0 2.2 3.1 2.2 2.5Heat - - - - - - - - - - n.a. n.a. n.a. n.a. n.a.Hydrogen - - - - - - - - - - n.a. n.a. n.a. n.a. n.a.Renewables 69 74 74 101 115 140 161 22 16 17 1.3 2.0 1.9 1.4 1.8
Electricity generation(TWh) Shares (%) CAGR (%)
1990/ 2013/ 2020/ 2030/ 2013/1980 1990 2000 2013 2020 2030 2040 1990 2013 2040 2013 2020 2030 2040 2040
Total 380 623 1,003 1,553 1,787 2,377 2,937 100 100 100 4.0 2.0 2.9 2.1 2.4Coal 7.8 23 44 99 131 207 275 3.8 6.4 9.3 6.5 4.1 4.7 2.9 3.9Oil 111 128 194 210 174 164 150 21 14 5.1 2.2 -2.6 -0.6 -0.9 -1.2Natural gas 35 60 138 398 475 815 1,136 9.6 26 39 8.6 2.6 5.5 3.4 4.0Nuclear 2.3 12 20 33 44 55 66 2.0 2.1 2.2 4.3 4.4 2.2 1.8 2.6Hydro 218 386 584 730 806 903 1,002 62 47 34 2.8 1.4 1.1 1.0 1.2Geothermal 1.4 5.9 7.8 10 23 33 49 1.0 0.6 1.7 2.3 12.6 3.6 4.0 6.0Solar, wind, etc. - 0.0 0.3 14 38 61 89 0.0 0.9 3.0 47.1 14.8 5.0 3.8 7.0Biomass and waste 3.9 7.6 14 59 95 138 172 1.2 3.8 5.8 9.3 7.1 3.9 2.2 4.1
Energy and economic indicatorsCAGR (%)
1990/ 2013/ 2020/ 2030/ 2013/1980 1990 2000 2013 2020 2030 2040 2013 2020 2030 2040 2040
GDP ($2010 billion) 2,407 2,764 3,744 5,691 6,515 8,993 11,569 3.2 2.0 3.3 2.6 2.7Population (million) 360 441 521 611 656 710 749 1.4 1.0 0.8 0.5 0.8CO2 emissions*2 (Mt) 801 905 1,187 1,718 1,881 2,333 2,664 2.8 1.3 2.2 1.3 1.6GDP per capita ($2010 thousand) 6.7 6.3 7.2 9.3 9.9 13 15 1.7 0.9 2.5 2.0 1.9Primary energy consump. per capita (toe) 1.1 1.1 1.1 1.4 1.5 1.7 1.8 1.2 0.8 1.4 0.9 1.1Primary energy consumption per GDP*3 159 168 159 149 148 133 119 -0.5 -0.1 -1.1 -1.1 -0.8CO2 emissions per GDP*2, *4 333 327 317 302 289 259 230 -0.4 -0.6 -1.1 -1.2 -1.0CO2 per primary energy consumption*2, *5 2.1 2.0 2.0 2.0 2.0 2.0 1.9 0.2 -0.5 0.0 -0.1 -0.2Automobile ownership (million) 28 38 55 114 141 191 227 4.8 3.1 3.0 1.8 2.6Automobile ownership rates*6 79 87 105 187 215 269 303 3.4 2.1 2.2 1.2 1.8*1 Trade of electricity and heat are not shown, *2 Excludes emission reduction by CCS, *3 toe/$2010 million,*4 t/$2010 million, *5 t/toe, *6 Vehicles per 1,000 people
IEEJ:February 2016 © IEEJ2016
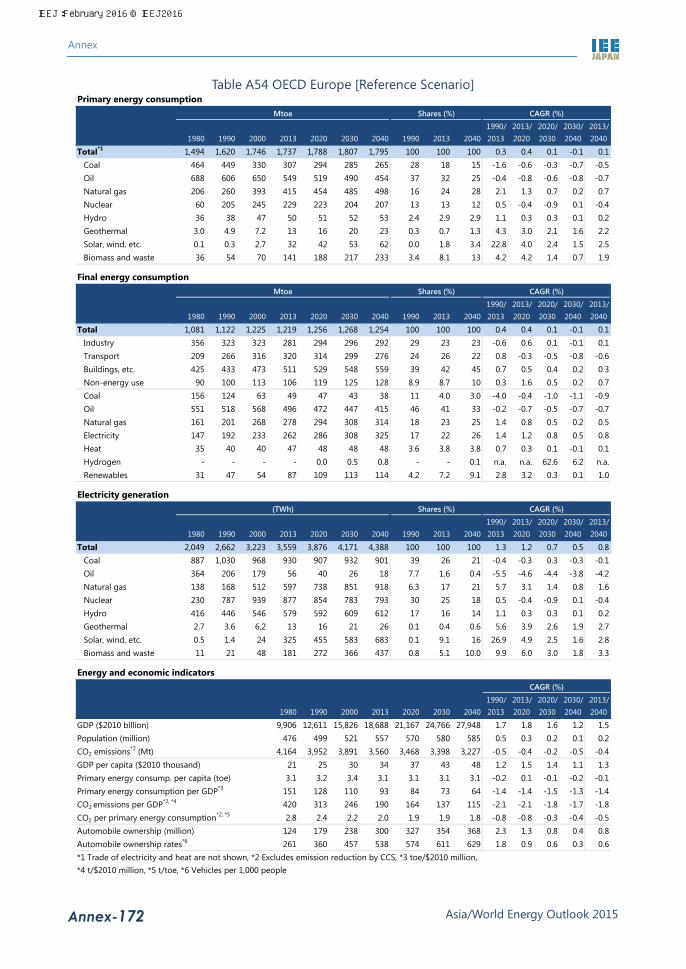
Annex
Asia/World Energy Outlook 2015 Annex-172
Table A54 OECD Europe [Reference Scenario] Primary energy consumption
Mtoe Shares (%) CAGR (%)
1990/ 2013/ 2020/ 2030/ 2013/1980 1990 2000 2013 2020 2030 2040 1990 2013 2040 2013 2020 2030 2040 2040
Total*1 1,494 1,620 1,746 1,737 1,788 1,807 1,795 100 100 100 0.3 0.4 0.1 -0.1 0.1Coal 464 449 330 307 294 285 265 28 18 15 -1.6 -0.6 -0.3 -0.7 -0.5Oil 688 606 650 549 519 490 454 37 32 25 -0.4 -0.8 -0.6 -0.8 -0.7Natural gas 206 260 393 415 454 485 498 16 24 28 2.1 1.3 0.7 0.2 0.7Nuclear 60 205 245 229 223 204 207 13 13 12 0.5 -0.4 -0.9 0.1 -0.4Hydro 36 38 47 50 51 52 53 2.4 2.9 2.9 1.1 0.3 0.3 0.1 0.2Geothermal 3.0 4.9 7.2 13 16 20 23 0.3 0.7 1.3 4.3 3.0 2.1 1.6 2.2Solar, wind, etc. 0.1 0.3 2.7 32 42 53 62 0.0 1.8 3.4 22.8 4.0 2.4 1.5 2.5Biomass and waste 36 54 70 141 188 217 233 3.4 8.1 13 4.2 4.2 1.4 0.7 1.9
Final energy consumptionMtoe Shares (%) CAGR (%)
1990/ 2013/ 2020/ 2030/ 2013/1980 1990 2000 2013 2020 2030 2040 1990 2013 2040 2013 2020 2030 2040 2040
Total 1,081 1,122 1,225 1,219 1,256 1,268 1,254 100 100 100 0.4 0.4 0.1 -0.1 0.1Industry 356 323 323 281 294 296 292 29 23 23 -0.6 0.6 0.1 -0.1 0.1Transport 209 266 316 320 314 299 276 24 26 22 0.8 -0.3 -0.5 -0.8 -0.6Buildings, etc. 425 433 473 511 529 548 559 39 42 45 0.7 0.5 0.4 0.2 0.3Non-energy use 90 100 113 106 119 125 128 8.9 8.7 10 0.3 1.6 0.5 0.2 0.7Coal 156 124 63 49 47 43 38 11 4.0 3.0 -4.0 -0.4 -1.0 -1.1 -0.9Oil 551 518 568 496 472 447 415 46 41 33 -0.2 -0.7 -0.5 -0.7 -0.7Natural gas 161 201 268 278 294 308 314 18 23 25 1.4 0.8 0.5 0.2 0.5Electricity 147 192 233 262 286 308 325 17 22 26 1.4 1.2 0.8 0.5 0.8Heat 35 40 40 47 48 48 48 3.6 3.8 3.8 0.7 0.3 0.1 -0.1 0.1Hydrogen - - - - 0.0 0.5 0.8 - - 0.1 n.a. n.a. 62.6 6.2 n.a.Renewables 31 47 54 87 109 113 114 4.2 7.2 9.1 2.8 3.2 0.3 0.1 1.0
Electricity generation(TWh) Shares (%) CAGR (%)
1990/ 2013/ 2020/ 2030/ 2013/1980 1990 2000 2013 2020 2030 2040 1990 2013 2040 2013 2020 2030 2040 2040
Total 2,049 2,662 3,223 3,559 3,876 4,171 4,388 100 100 100 1.3 1.2 0.7 0.5 0.8Coal 887 1,030 968 930 907 932 901 39 26 21 -0.4 -0.3 0.3 -0.3 -0.1Oil 364 206 179 56 40 26 18 7.7 1.6 0.4 -5.5 -4.6 -4.4 -3.8 -4.2Natural gas 138 168 512 597 738 851 918 6.3 17 21 5.7 3.1 1.4 0.8 1.6Nuclear 230 787 939 877 854 783 793 30 25 18 0.5 -0.4 -0.9 0.1 -0.4Hydro 416 446 546 579 592 609 612 17 16 14 1.1 0.3 0.3 0.1 0.2Geothermal 2.7 3.6 6.2 13 16 21 26 0.1 0.4 0.6 5.6 3.9 2.6 1.9 2.7Solar, wind, etc. 0.5 1.4 24 325 455 583 683 0.1 9.1 16 26.9 4.9 2.5 1.6 2.8Biomass and waste 11 21 48 181 272 366 437 0.8 5.1 10.0 9.9 6.0 3.0 1.8 3.3
Energy and economic indicatorsCAGR (%)
1990/ 2013/ 2020/ 2030/ 2013/1980 1990 2000 2013 2020 2030 2040 2013 2020 2030 2040 2040
GDP ($2010 billion) 9,906 12,611 15,826 18,688 21,167 24,766 27,948 1.7 1.8 1.6 1.2 1.5Population (million) 476 499 521 557 570 580 585 0.5 0.3 0.2 0.1 0.2CO2 emissions*2 (Mt) 4,164 3,952 3,891 3,560 3,468 3,398 3,227 -0.5 -0.4 -0.2 -0.5 -0.4GDP per capita ($2010 thousand) 21 25 30 34 37 43 48 1.2 1.5 1.4 1.1 1.3Primary energy consump. per capita (toe) 3.1 3.2 3.4 3.1 3.1 3.1 3.1 -0.2 0.1 -0.1 -0.2 -0.1Primary energy consumption per GDP*3 151 128 110 93 84 73 64 -1.4 -1.4 -1.5 -1.3 -1.4CO2 emissions per GDP*2, *4 420 313 246 190 164 137 115 -2.1 -2.1 -1.8 -1.7 -1.8CO2 per primary energy consumption*2, *5 2.8 2.4 2.2 2.0 1.9 1.9 1.8 -0.8 -0.8 -0.3 -0.4 -0.5Automobile ownership (million) 124 179 238 300 327 354 368 2.3 1.3 0.8 0.4 0.8Automobile ownership rates*6 261 360 457 538 574 611 629 1.8 0.9 0.6 0.3 0.6*1 Trade of electricity and heat are not shown, *2 Excludes emission reduction by CCS, *3 toe/$2010 million,*4 t/$2010 million, *5 t/toe, *6 Vehicles per 1,000 people
IEEJ:February 2016 © IEEJ2016

Annex
Asia/World Energy Outlook 2015 Annex-173
Table A55 Non-OECD Europe [Reference Scenario] Primary energy consumption
Mtoe Shares (%) CAGR (%)
1990/ 2013/ 2020/ 2030/ 2013/1980 1990 2000 2013 2020 2030 2040 1990 2013 2040 2013 2020 2030 2040 2040
Total*1 1,241 1,537 1,003 1,156 1,185 1,266 1,323 100 100 100 -1.2 0.4 0.7 0.4 0.5Coal 362 367 209 219 210 198 192 24 19 15 -2.2 -0.7 -0.6 -0.3 -0.5Oil 464 468 203 242 248 260 262 30 21 20 -2.8 0.3 0.5 0.1 0.3Natural gas 355 603 489 569 579 615 641 39 49 48 -0.2 0.2 0.6 0.4 0.4Nuclear 21 59 64 75 89 124 142 3.9 6.4 11 1.0 2.6 3.4 1.4 2.4Hydro 20 23 24 27 28 29 30 1.5 2.4 2.3 0.7 0.4 0.3 0.3 0.4Geothermal - 0.0 0.1 0.5 1.3 1.7 1.9 0.0 0.0 0.1 14.6 13.7 2.1 1.5 4.8Solar, wind, etc. - - 0.0 1.0 1.8 4.0 7.6 - 0.1 0.6 n.a. 8.8 8.2 6.5 7.7Biomass and waste 21 17 16 22 28 34 45 1.1 1.9 3.4 1.0 3.6 2.1 2.8 2.8
Final energy consumptionMtoe Shares (%) CAGR (%)
1990/ 2013/ 2020/ 2030/ 2013/1980 1990 2000 2013 2020 2030 2040 1990 2013 2040 2013 2020 2030 2040 2040
Total 869 1,073 654 704 757 838 896 100 100 100 -1.8 1.0 1.0 0.7 0.9Industry 394 396 206 203 211 254 287 37 29 32 -2.9 0.6 1.8 1.3 1.3Transport 107 172 110 144 155 170 178 16 20 20 -0.8 1.0 0.9 0.5 0.8Buildings, etc. 301 439 288 272 296 314 326 41 39 36 -2.1 1.2 0.6 0.4 0.7Non-energy use 67 66 49 85 94 101 104 6.2 12 12 1.1 1.5 0.7 0.4 0.8Coal 152 114 37 40 43 46 48 11 5.7 5.4 -4.4 0.9 0.8 0.4 0.7Oil 310 280 146 194 199 213 217 26 28 24 -1.6 0.4 0.7 0.2 0.4Natural gas 215 261 201 209 235 260 280 24 30 31 -1.0 1.7 1.0 0.7 1.1Electricity 95 126 87 108 115 136 157 12 15 18 -0.7 0.8 1.8 1.4 1.4Heat 78 279 172 139 149 166 176 26 20 20 -3.0 1.0 1.1 0.6 0.9Hydrogen - - - - - - - - - - n.a. n.a. n.a. n.a. n.a.Renewables 21 13 12 15 16 17 17 1.2 2.1 1.9 0.6 1.4 0.1 0.0 0.4
Electricity generation(TWh) Shares (%) CAGR (%)
1990/ 2013/ 2020/ 2030/ 2013/1980 1990 2000 2013 2020 2030 2040 1990 2013 2040 2013 2020 2030 2040 2040
Total 1,461 1,894 1,432 1,740 1,827 2,156 2,465 100 100 100 -0.4 0.7 1.7 1.3 1.3Coal 471 429 338 413 402 396 414 23 24 17 -0.2 -0.4 -0.2 0.4 0.0Oil 357 256 70 18 17 17 16 14 1.0 0.6 -10.9 -0.5 -0.5 -0.5 -0.5Natural gas 295 715 504 694 709 863 1,015 38 40 41 -0.1 0.3 2.0 1.6 1.4Nuclear 79 226 242 284 340 474 543 12 16 22 1.0 2.6 3.4 1.4 2.4Hydro 232 267 274 316 326 337 348 14 18 14 0.7 0.4 0.3 0.3 0.4Geothermal - 0.0 0.1 0.4 1.4 1.7 2.0 0.0 0.0 0.1 12.8 17.3 2.3 1.6 5.7Solar, wind, etc. - - 0.0 11 20 45 86 - 0.6 3.5 n.a. 9.6 8.5 6.7 8.1Biomass and waste 27 0.0 2.6 4.8 12 23 41 0.0 0.3 1.7 22.1 14.3 6.4 6.2 8.3
Energy and economic indicatorsCAGR (%)
1990/ 2013/ 2020/ 2030/ 2013/1980 1990 2000 2013 2020 2030 2040 2013 2020 2030 2040 2040
GDP ($2010 billion) 1,769 2,168 1,509 2,705 2,958 4,019 5,121 1.0 1.3 3.1 2.5 2.4Population (million) 319 344 341 342 347 347 342 0.0 0.2 0.0 -0.2 0.0CO2 emissions*2 (Mt) 3,497 4,123 2,462 2,720 2,698 2,757 2,794 -1.8 -0.1 0.2 0.1 0.1GDP per capita ($2010 thousand) 5.5 6.3 4.4 7.9 8.5 12 15 1.0 1.0 3.1 2.6 2.4Primary energy consump. per capita (toe) 3.9 4.5 2.9 3.4 3.4 3.6 3.9 -1.2 0.1 0.7 0.6 0.5Primary energy consumption per GDP*3 702 709 665 427 400 315 258 -2.2 -0.9 -2.4 -2.0 -1.8CO2 emissions per GDP*2, *4 1,977 1,902 1,632 1,005 912 686 546 -2.7 -1.4 -2.8 -2.3 -2.2CO2 per primary energy consumption*2, *5 2.8 2.7 2.5 2.4 2.3 2.2 2.1 -0.6 -0.5 -0.4 -0.3 -0.4Automobile ownership (million) 22 32 47 92 104 121 132 4.7 1.7 1.5 0.9 1.3Automobile ownership rates*6 69 93 137 270 300 348 385 4.8 1.5 1.5 1.0 1.3*1 Trade of electricity and heat are not shown, *2 Excludes emission reduction by CCS, *3 toe/$2010 million,*4 t/$2010 million, *5 t/toe, *6 Vehicles per 1,000 people
IEEJ:February 2016 © IEEJ2016

Annex
Asia/World Energy Outlook 2015 Annex-174
Table A56 European Union [Reference Scenario] Primary energy consumption
Mtoe Shares (%) CAGR (%)
1990/ 2013/ 2020/ 2030/ 2013/1980 1990 2000 2013 2020 2030 2040 1990 2013 2040 2013 2020 2030 2040 2040
Total*1 n.a. 1,645 1,692 1,626 1,674 1,693 1,682 100 100 100 -0.1 0.4 0.1 -0.1 0.1Coal n.a. 456 321 286 273 266 247 28 18 15 -2.0 -0.7 -0.3 -0.8 -0.5Oil n.a. 606 623 513 489 463 430 37 32 26 -0.7 -0.7 -0.5 -0.8 -0.7Natural gas n.a. 297 396 387 420 449 461 18 24 27 1.2 1.2 0.7 0.2 0.7Nuclear n.a. 207 246 229 223 204 205 13 14 12 0.4 -0.4 -0.9 0.1 -0.4Hydro n.a. 25 31 32 32 33 33 1.5 2.0 2.0 1.1 0.3 0.2 0.0 0.1Geothermal n.a. 3.2 4.6 5.9 7.2 8.2 9.2 0.2 0.4 0.5 2.7 2.9 1.3 1.1 1.6Solar, wind, etc. n.a. 0.3 2.4 31 41 53 64 0.0 1.9 3.8 23.2 4.2 2.7 1.8 2.7Biomass and waste n.a. 47 66 140 186 213 230 2.8 8.6 14 4.9 4.1 1.4 0.8 1.8
Final energy consumptionMtoe Shares (%) CAGR (%)
1990/ 2013/ 2020/ 2030/ 2013/1980 1990 2000 2013 2020 2030 2040 1990 2013 2040 2013 2020 2030 2040 2040
Total n.a. 1,130 1,176 1,139 1,176 1,190 1,179 100 100 100 0.0 0.5 0.1 -0.1 0.1Industry n.a. 343 308 258 270 274 273 30 23 23 -1.2 0.7 0.2 -0.1 0.2Transport n.a. 259 304 303 300 286 263 23 27 22 0.7 -0.1 -0.5 -0.8 -0.5Buildings, etc. n.a. 429 453 478 494 513 523 38 42 44 0.5 0.5 0.4 0.2 0.3Non-energy use n.a. 99 111 100 111 117 120 8.7 8.8 10 0.1 1.6 0.5 0.2 0.7Coal n.a. 122 52 38 37 34 31 11 3.4 2.6 -4.9 -0.4 -0.9 -1.0 -0.8Oil n.a. 503 540 463 444 422 392 45 41 33 -0.4 -0.6 -0.5 -0.7 -0.6Natural gas n.a. 226 272 266 280 294 299 20 23 25 0.7 0.8 0.5 0.2 0.4Electricity n.a. 186 218 238 259 280 296 16 21 25 1.1 1.2 0.8 0.5 0.8Heat n.a. 54 45 48 49 50 50 4.8 4.2 4.2 -0.5 0.4 0.1 0.0 0.1Hydrogen n.a. - - - n.a. n.a. n.a. - - n.a. n.a. n.a. n.a. n.a. n.a.Renewables n.a. 39 49 85 107 110 111 3.5 7.5 9.4 3.5 3.3 0.3 0.1 1.0
Electricity generation(TWh) Shares (%) CAGR (%)
1990/ 2013/ 2020/ 2030/ 2013/1980 1990 2000 2013 2020 2030 2040 1990 2013 2040 2013 2020 2030 2040 2040
Total n.a. 2,576 3,005 3,230 3,511 3,806 4,041 100 100 100 1.0 1.2 0.8 0.6 0.8Coal n.a. 1,050 968 905 883 909 876 41 28 22 -0.6 -0.3 0.3 -0.4 -0.1Oil n.a. 224 181 61 46 32 23 8.7 1.9 0.6 -5.5 -4.0 -3.7 -3.0 -3.5Natural gas n.a. 193 480 507 617 724 793 7.5 16 20 4.3 2.8 1.6 0.9 1.7Nuclear n.a. 795 945 877 854 782 788 31 27 19 0.4 -0.4 -0.9 0.1 -0.4Hydro n.a. 290 356 371 378 384 384 11 11 9.5 1.1 0.3 0.2 0.0 0.1Geothermal n.a. 3.2 4.8 5.9 7.4 8.4 9.3 0.1 0.2 0.2 2.7 3.1 1.3 1.1 1.7Solar, wind, etc. n.a. 1.3 24 324 457 602 728 0.1 10 18 27.1 5.0 2.8 1.9 3.0Biomass and waste n.a. 20 46 178 269 363 439 0.8 5.5 11 10.1 6.1 3.1 1.9 3.4
Energy and economic indicatorsCAGR (%)
1990/ 2013/ 2020/ 2030/ 2013/1980 1990 2000 2013 2020 2030 2040 2013 2020 2030 2040 2040
GDP ($2010 billion) n.a. 11,862 14,721 17,159 19,411 22,767 25,759 1.6 1.8 1.6 1.2 1.5Population (million) n.a. 478 488 507 516 523 526 0.3 0.3 0.1 0.0 0.1CO2 emissions*2 (Mt) n.a. 4,068 3,783 3,320 3,239 3,184 3,023 -0.9 -0.4 -0.2 -0.5 -0.3GDP per capita ($2010 thousand) n.a. 25 30 34 38 44 49 1.4 1.5 1.5 1.2 1.4Primary energy consump. per capita (toe) n.a. 3.4 3.5 3.2 3.2 3.2 3.2 -0.3 0.2 0.0 -0.1 0.0Primary energy consumption per GDP*3 n.a. 139 115 95 86 74 65 -1.6 -1.3 -1.5 -1.3 -1.4CO2 emissions per GDP*2, *4 n.a. 343 257 193 167 140 117 -2.5 -2.1 -1.8 -1.7 -1.8CO2 per primary energy consumption*2, *5 n.a. 2.5 2.2 2.0 1.9 1.9 1.8 -0.8 -0.8 -0.3 -0.5 -0.5Automobile ownership (million) n.a. 177 235 294 319 345 358 2.2 1.2 0.8 0.4 0.7Automobile ownership rates*6 n.a. 371 482 580 619 660 681 2.0 0.9 0.6 0.3 0.6*1 Trade of electricity and heat are not shown, *2 Excludes emission reduction by CCS, *3 toe/$2010 million,*4 t/$2010 million, *5 t/toe, *6 Vehicles per 1,000 people
IEEJ:February 2016 © IEEJ2016
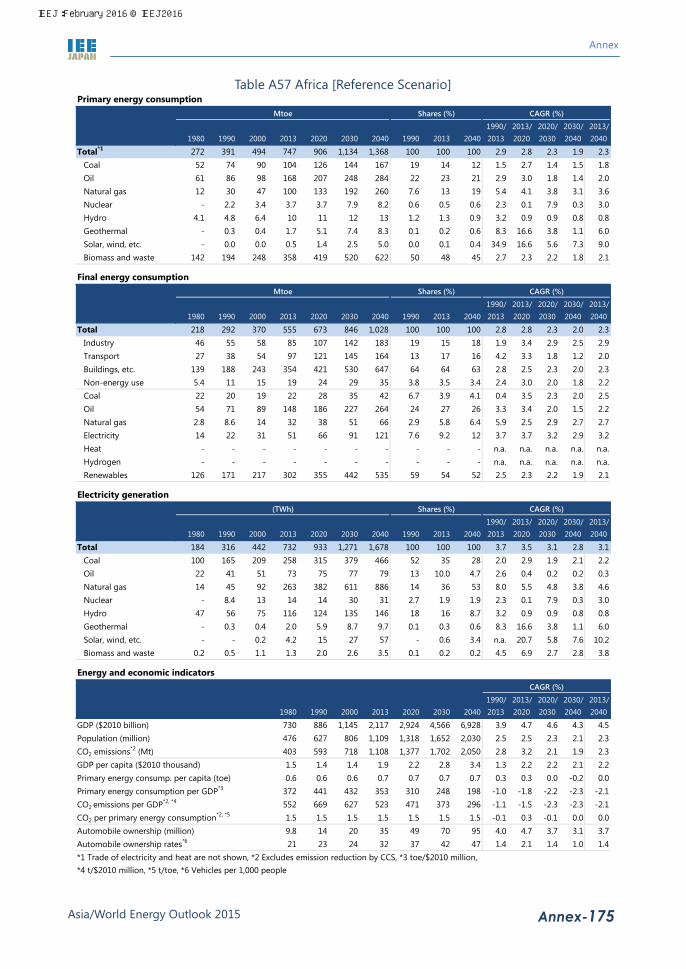
Annex
Asia/World Energy Outlook 2015 Annex-175
Table A57 Africa [Reference Scenario] Primary energy consumption
Mtoe Shares (%) CAGR (%)
1990/ 2013/ 2020/ 2030/ 2013/1980 1990 2000 2013 2020 2030 2040 1990 2013 2040 2013 2020 2030 2040 2040
Total*1 272 391 494 747 906 1,134 1,368 100 100 100 2.9 2.8 2.3 1.9 2.3Coal 52 74 90 104 126 144 167 19 14 12 1.5 2.7 1.4 1.5 1.8Oil 61 86 98 168 207 248 284 22 23 21 2.9 3.0 1.8 1.4 2.0Natural gas 12 30 47 100 133 192 260 7.6 13 19 5.4 4.1 3.8 3.1 3.6Nuclear - 2.2 3.4 3.7 3.7 7.9 8.2 0.6 0.5 0.6 2.3 0.1 7.9 0.3 3.0Hydro 4.1 4.8 6.4 10 11 12 13 1.2 1.3 0.9 3.2 0.9 0.9 0.8 0.8Geothermal - 0.3 0.4 1.7 5.1 7.4 8.3 0.1 0.2 0.6 8.3 16.6 3.8 1.1 6.0Solar, wind, etc. - 0.0 0.0 0.5 1.4 2.5 5.0 0.0 0.1 0.4 34.9 16.6 5.6 7.3 9.0Biomass and waste 142 194 248 358 419 520 622 50 48 45 2.7 2.3 2.2 1.8 2.1
Final energy consumptionMtoe Shares (%) CAGR (%)
1990/ 2013/ 2020/ 2030/ 2013/1980 1990 2000 2013 2020 2030 2040 1990 2013 2040 2013 2020 2030 2040 2040
Total 218 292 370 555 673 846 1,028 100 100 100 2.8 2.8 2.3 2.0 2.3Industry 46 55 58 85 107 142 183 19 15 18 1.9 3.4 2.9 2.5 2.9Transport 27 38 54 97 121 145 164 13 17 16 4.2 3.3 1.8 1.2 2.0Buildings, etc. 139 188 243 354 421 530 647 64 64 63 2.8 2.5 2.3 2.0 2.3Non-energy use 5.4 11 15 19 24 29 35 3.8 3.5 3.4 2.4 3.0 2.0 1.8 2.2Coal 22 20 19 22 28 35 42 6.7 3.9 4.1 0.4 3.5 2.3 2.0 2.5Oil 54 71 89 148 186 227 264 24 27 26 3.3 3.4 2.0 1.5 2.2Natural gas 2.8 8.6 14 32 38 51 66 2.9 5.8 6.4 5.9 2.5 2.9 2.7 2.7Electricity 14 22 31 51 66 91 121 7.6 9.2 12 3.7 3.7 3.2 2.9 3.2Heat - - - - - - - - - - n.a. n.a. n.a. n.a. n.a.Hydrogen - - - - - - - - - - n.a. n.a. n.a. n.a. n.a.Renewables 126 171 217 302 355 442 535 59 54 52 2.5 2.3 2.2 1.9 2.1
Electricity generation(TWh) Shares (%) CAGR (%)
1990/ 2013/ 2020/ 2030/ 2013/1980 1990 2000 2013 2020 2030 2040 1990 2013 2040 2013 2020 2030 2040 2040
Total 184 316 442 732 933 1,271 1,678 100 100 100 3.7 3.5 3.1 2.8 3.1Coal 100 165 209 258 315 379 466 52 35 28 2.0 2.9 1.9 2.1 2.2Oil 22 41 51 73 75 77 79 13 10.0 4.7 2.6 0.4 0.2 0.2 0.3Natural gas 14 45 92 263 382 611 886 14 36 53 8.0 5.5 4.8 3.8 4.6Nuclear - 8.4 13 14 14 30 31 2.7 1.9 1.9 2.3 0.1 7.9 0.3 3.0Hydro 47 56 75 116 124 135 146 18 16 8.7 3.2 0.9 0.9 0.8 0.8Geothermal - 0.3 0.4 2.0 5.9 8.7 9.7 0.1 0.3 0.6 8.3 16.6 3.8 1.1 6.0Solar, wind, etc. - - 0.2 4.2 15 27 57 - 0.6 3.4 n.a. 20.7 5.8 7.6 10.2Biomass and waste 0.2 0.5 1.1 1.3 2.0 2.6 3.5 0.1 0.2 0.2 4.5 6.9 2.7 2.8 3.8
Energy and economic indicatorsCAGR (%)
1990/ 2013/ 2020/ 2030/ 2013/1980 1990 2000 2013 2020 2030 2040 2013 2020 2030 2040 2040
GDP ($2010 billion) 730 886 1,145 2,117 2,924 4,566 6,928 3.9 4.7 4.6 4.3 4.5Population (million) 476 627 806 1,109 1,318 1,652 2,030 2.5 2.5 2.3 2.1 2.3CO2 emissions*2 (Mt) 403 593 718 1,108 1,377 1,702 2,050 2.8 3.2 2.1 1.9 2.3GDP per capita ($2010 thousand) 1.5 1.4 1.4 1.9 2.2 2.8 3.4 1.3 2.2 2.2 2.1 2.2Primary energy consump. per capita (toe) 0.6 0.6 0.6 0.7 0.7 0.7 0.7 0.3 0.3 0.0 -0.2 0.0Primary energy consumption per GDP*3 372 441 432 353 310 248 198 -1.0 -1.8 -2.2 -2.3 -2.1CO2 emissions per GDP*2, *4 552 669 627 523 471 373 296 -1.1 -1.5 -2.3 -2.3 -2.1CO2 per primary energy consumption*2, *5 1.5 1.5 1.5 1.5 1.5 1.5 1.5 -0.1 0.3 -0.1 0.0 0.0Automobile ownership (million) 9.8 14 20 35 49 70 95 4.0 4.7 3.7 3.1 3.7Automobile ownership rates*6 21 23 24 32 37 42 47 1.4 2.1 1.4 1.0 1.4*1 Trade of electricity and heat are not shown, *2 Excludes emission reduction by CCS, *3 toe/$2010 million,*4 t/$2010 million, *5 t/toe, *6 Vehicles per 1,000 people
IEEJ:February 2016 © IEEJ2016
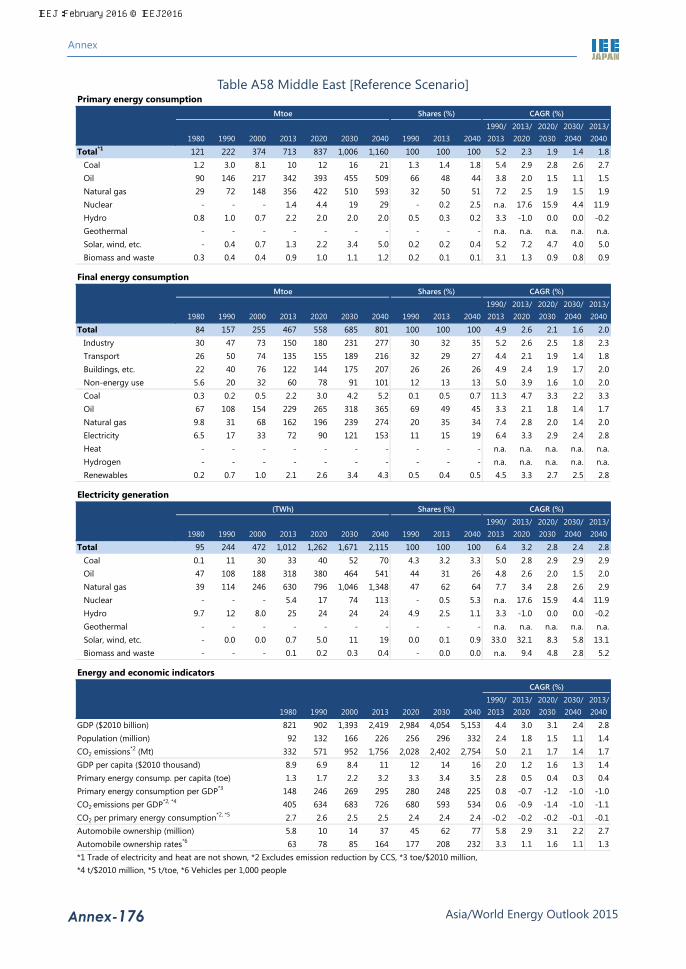
Annex
Asia/World Energy Outlook 2015 Annex-176
Table A58 Middle East [Reference Scenario] Primary energy consumption
Mtoe Shares (%) CAGR (%)
1990/ 2013/ 2020/ 2030/ 2013/1980 1990 2000 2013 2020 2030 2040 1990 2013 2040 2013 2020 2030 2040 2040
Total*1 121 222 374 713 837 1,006 1,160 100 100 100 5.2 2.3 1.9 1.4 1.8Coal 1.2 3.0 8.1 10 12 16 21 1.3 1.4 1.8 5.4 2.9 2.8 2.6 2.7Oil 90 146 217 342 393 455 509 66 48 44 3.8 2.0 1.5 1.1 1.5Natural gas 29 72 148 356 422 510 593 32 50 51 7.2 2.5 1.9 1.5 1.9Nuclear - - - 1.4 4.4 19 29 - 0.2 2.5 n.a. 17.6 15.9 4.4 11.9Hydro 0.8 1.0 0.7 2.2 2.0 2.0 2.0 0.5 0.3 0.2 3.3 -1.0 0.0 0.0 -0.2Geothermal - - - - - - - - - - n.a. n.a. n.a. n.a. n.a.Solar, wind, etc. - 0.4 0.7 1.3 2.2 3.4 5.0 0.2 0.2 0.4 5.2 7.2 4.7 4.0 5.0Biomass and waste 0.3 0.4 0.4 0.9 1.0 1.1 1.2 0.2 0.1 0.1 3.1 1.3 0.9 0.8 0.9
Final energy consumptionMtoe Shares (%) CAGR (%)
1990/ 2013/ 2020/ 2030/ 2013/1980 1990 2000 2013 2020 2030 2040 1990 2013 2040 2013 2020 2030 2040 2040
Total 84 157 255 467 558 685 801 100 100 100 4.9 2.6 2.1 1.6 2.0Industry 30 47 73 150 180 231 277 30 32 35 5.2 2.6 2.5 1.8 2.3Transport 26 50 74 135 155 189 216 32 29 27 4.4 2.1 1.9 1.4 1.8Buildings, etc. 22 40 76 122 144 175 207 26 26 26 4.9 2.4 1.9 1.7 2.0Non-energy use 5.6 20 32 60 78 91 101 12 13 13 5.0 3.9 1.6 1.0 2.0Coal 0.3 0.2 0.5 2.2 3.0 4.2 5.2 0.1 0.5 0.7 11.3 4.7 3.3 2.2 3.3Oil 67 108 154 229 265 318 365 69 49 45 3.3 2.1 1.8 1.4 1.7Natural gas 9.8 31 68 162 196 239 274 20 35 34 7.4 2.8 2.0 1.4 2.0Electricity 6.5 17 33 72 90 121 153 11 15 19 6.4 3.3 2.9 2.4 2.8Heat - - - - - - - - - - n.a. n.a. n.a. n.a. n.a.Hydrogen - - - - - - - - - - n.a. n.a. n.a. n.a. n.a.Renewables 0.2 0.7 1.0 2.1 2.6 3.4 4.3 0.5 0.4 0.5 4.5 3.3 2.7 2.5 2.8
Electricity generation(TWh) Shares (%) CAGR (%)
1990/ 2013/ 2020/ 2030/ 2013/1980 1990 2000 2013 2020 2030 2040 1990 2013 2040 2013 2020 2030 2040 2040
Total 95 244 472 1,012 1,262 1,671 2,115 100 100 100 6.4 3.2 2.8 2.4 2.8Coal 0.1 11 30 33 40 52 70 4.3 3.2 3.3 5.0 2.8 2.9 2.9 2.9Oil 47 108 188 318 380 464 541 44 31 26 4.8 2.6 2.0 1.5 2.0Natural gas 39 114 246 630 796 1,046 1,348 47 62 64 7.7 3.4 2.8 2.6 2.9Nuclear - - - 5.4 17 74 113 - 0.5 5.3 n.a. 17.6 15.9 4.4 11.9Hydro 9.7 12 8.0 25 24 24 24 4.9 2.5 1.1 3.3 -1.0 0.0 0.0 -0.2Geothermal - - - - - - - - - - n.a. n.a. n.a. n.a. n.a.Solar, wind, etc. - 0.0 0.0 0.7 5.0 11 19 0.0 0.1 0.9 33.0 32.1 8.3 5.8 13.1Biomass and waste - - - 0.1 0.2 0.3 0.4 - 0.0 0.0 n.a. 9.4 4.8 2.8 5.2
Energy and economic indicatorsCAGR (%)
1990/ 2013/ 2020/ 2030/ 2013/1980 1990 2000 2013 2020 2030 2040 2013 2020 2030 2040 2040
GDP ($2010 billion) 821 902 1,393 2,419 2,984 4,054 5,153 4.4 3.0 3.1 2.4 2.8Population (million) 92 132 166 226 256 296 332 2.4 1.8 1.5 1.1 1.4CO2 emissions*2 (Mt) 332 571 952 1,756 2,028 2,402 2,754 5.0 2.1 1.7 1.4 1.7GDP per capita ($2010 thousand) 8.9 6.9 8.4 11 12 14 16 2.0 1.2 1.6 1.3 1.4Primary energy consump. per capita (toe) 1.3 1.7 2.2 3.2 3.3 3.4 3.5 2.8 0.5 0.4 0.3 0.4Primary energy consumption per GDP*3 148 246 269 295 280 248 225 0.8 -0.7 -1.2 -1.0 -1.0CO2 emissions per GDP*2, *4 405 634 683 726 680 593 534 0.6 -0.9 -1.4 -1.0 -1.1CO2 per primary energy consumption*2, *5 2.7 2.6 2.5 2.5 2.4 2.4 2.4 -0.2 -0.2 -0.2 -0.1 -0.1Automobile ownership (million) 5.8 10 14 37 45 62 77 5.8 2.9 3.1 2.2 2.7Automobile ownership rates*6 63 78 85 164 177 208 232 3.3 1.1 1.6 1.1 1.3*1 Trade of electricity and heat are not shown, *2 Excludes emission reduction by CCS, *3 toe/$2010 million,*4 t/$2010 million, *5 t/toe, *6 Vehicles per 1,000 people
IEEJ:February 2016 © IEEJ2016

Annex
Asia/World Energy Outlook 2015 Annex-177
Table A59 Oceania [Reference Scenario] Primary energy consumption
Mtoe Shares (%) CAGR (%)
1990/ 2013/ 2020/ 2030/ 2013/1980 1990 2000 2013 2020 2030 2040 1990 2013 2040 2013 2020 2030 2040 2040
Total*1 79 99 125 149 162 169 172 100 100 100 1.8 1.2 0.4 0.2 0.5Coal 28 36 49 47 48 47 45 37 32 26 1.1 0.3 -0.2 -0.6 -0.2Oil 34 35 40 52 57 61 63 35 35 37 1.8 1.3 0.7 0.3 0.7Natural gas 8.3 19 24 34 36 36 37 19 23 21 2.6 0.8 0.2 0.1 0.3Nuclear - - - - - - - - - - n.a. n.a. n.a. n.a. n.a.Hydro 2.7 3.2 3.5 3.5 3.6 4.1 4.4 3.2 2.4 2.6 0.4 0.3 1.2 0.9 0.8Geothermal 1.0 1.5 1.9 4.2 7.3 7.6 8.0 1.5 2.9 4.6 4.7 8.0 0.4 0.5 2.4Solar, wind, etc. 0.0 0.1 0.1 1.5 2.8 4.8 7.2 0.1 1.0 4.2 11.3 9.8 5.4 4.2 6.1Biomass and waste 4.1 4.7 6.1 6.2 7.0 7.6 8.1 4.8 4.2 4.7 1.2 1.8 0.9 0.6 1.0
Final energy consumptionMtoe Shares (%) CAGR (%)
1990/ 2013/ 2020/ 2030/ 2013/1980 1990 2000 2013 2020 2030 2040 1990 2013 2040 2013 2020 2030 2040 2040
Total 54 66 83 94 105 114 120 100 100 100 1.5 1.6 0.8 0.5 0.9Industry 20 23 28 29 33 35 36 35 31 30 1.1 1.5 0.6 0.3 0.7Transport 19 24 30 36 39 42 44 36 38 36 1.7 1.2 0.7 0.4 0.7Buildings, etc. 11 15 19 23 26 29 32 22 25 27 1.9 1.8 1.2 0.9 1.2Non-energy use 3.1 4.6 6.1 5.9 7.4 8.1 8.4 6.9 6.3 7.0 1.1 3.2 1.0 0.4 1.3Coal 5.3 5.2 4.7 3.9 4.9 5.5 5.9 7.9 4.2 4.9 -1.2 3.3 1.1 0.7 1.5Oil 31 33 40 47 52 57 59 50 50 49 1.6 1.4 0.8 0.4 0.8Natural gas 5.4 10 14 16 17 18 18 16 17 15 1.8 1.3 0.5 0.2 0.6Electricity 8.5 14 18 21 24 27 29 20 22 24 1.9 1.7 1.2 1.0 1.2Heat - - - - - - - - - - n.a. n.a. n.a. n.a. n.a.Hydrogen - - - - - - - - - - n.a. n.a. n.a. n.a. n.a.Renewables 4.0 4.1 5.6 6.1 6.8 7.2 7.4 6.2 6.5 6.2 1.7 1.5 0.7 0.3 0.8
Electricity generation(TWh) Shares (%) CAGR (%)
1990/ 2013/ 2020/ 2030/ 2013/1980 1990 2000 2013 2020 2030 2040 1990 2013 2040 2013 2020 2030 2040 2040
Total 118 187 249 292 329 370 408 100 100 100 2.0 1.7 1.2 1.0 1.2Coal 70 122 176 164 173 179 177 65 56 44 1.3 0.8 0.4 -0.1 0.3Oil 5.2 3.6 1.8 3.4 2.8 2.6 1.8 1.9 1.2 0.4 -0.2 -2.7 -1.0 -3.6 -2.4Natural gas 8.7 20 26 62 68 75 80 11 21 20 5.0 1.4 0.9 0.8 1.0Nuclear - - - - - - - - - - n.a. n.a. n.a. n.a. n.a.Hydro 32 37 41 41 42 47 52 20 14 13 0.4 0.3 1.2 0.9 0.8Geothermal 1.2 2.1 2.9 6.4 11 12 12 1.1 2.2 3.0 4.9 8.4 0.3 0.5 2.4Solar, wind, etc. - 0.1 0.3 13 28 51 79 0.0 4.5 19 25.8 11.6 6.0 4.5 6.9Biomass and waste 0.7 1.3 1.7 2.6 3.2 4.0 4.9 0.7 0.9 1.2 3.2 3.1 2.2 2.1 2.4
Energy and economic indicatorsCAGR (%)
1990/ 2013/ 2020/ 2030/ 2013/1980 1990 2000 2013 2020 2030 2040 2013 2020 2030 2040 2040
GDP ($2010 billion) 524 719 993 1,447 1,769 2,206 2,598 3.1 2.9 2.2 1.7 2.2Population (million) 18 20 23 28 30 33 36 1.3 1.3 1.0 0.8 1.0CO2 emissions*2 (Mt) 227 281 357 410 428 437 433 1.7 0.6 0.2 -0.1 0.2GDP per capita ($2010 thousand) 29 35 43 52 59 66 72 1.7 1.6 1.2 0.8 1.2Primary energy consump. per capita (toe) 4.4 4.9 5.4 5.4 5.4 5.1 4.8 0.4 -0.1 -0.6 -0.6 -0.5Primary energy consumption per GDP*3 150 138 126 103 91 77 66 -1.3 -1.7 -1.7 -1.4 -1.6CO2 emissions per GDP*2, *4 433 390 360 283 242 198 167 -1.4 -2.2 -2.0 -1.7 -1.9CO2 per primary energy consumption*2, *5 2.9 2.8 2.9 2.8 2.7 2.6 2.5 -0.1 -0.5 -0.2 -0.3 -0.3Automobile ownership (million) 8.8 12 15 20 22 25 27 2.3 1.8 1.2 0.8 1.2Automobile ownership rates*6 495 567 644 711 737 754 755 1.0 0.5 0.2 0.0 0.2*1 Trade of electricity and heat are not shown, *2 Excludes emission reduction by CCS, *3 toe/$2010 million,*4 t/$2010 million, *5 t/toe, *6 Vehicles per 1,000 people
IEEJ:February 2016 © IEEJ2016

Annex
Asia/World Energy Outlook 2015 Annex-178
Table A60 OECD [Reference Scenario] Primary energy consumption
Mtoe Shares (%) CAGR (%)
1990/ 2013/ 2020/ 2030/ 2013/1980 1990 2000 2013 2020 2030 2040 1990 2013 2040 2013 2020 2030 2040 2040
Total*1 4,060 4,511 5,274 5,276 5,520 5,627 5,558 100 100 100 0.7 0.6 0.2 -0.1 0.2Coal 966 1,078 1,094 1,022 978 916 818 24 19 15 -0.2 -0.6 -0.6 -1.1 -0.8Oil 1,938 1,861 2,103 1,874 1,848 1,803 1,692 41 36 30 0.0 -0.2 -0.2 -0.6 -0.4Natural gas 778 843 1,156 1,365 1,477 1,612 1,662 19 26 30 2.1 1.1 0.9 0.3 0.7Nuclear 162 451 586 511 589 560 563 10 9.7 10 0.5 2.0 -0.5 0.1 0.4Hydro 94 102 115 122 127 132 135 2.3 2.3 2.4 0.8 0.6 0.4 0.2 0.4Geothermal 10 27 30 32 59 77 99 0.6 0.6 1.8 0.8 9.2 2.7 2.6 4.3Solar, wind, etc. 0.1 1.9 5.8 55 81 118 149 0.0 1.0 2.7 15.7 5.7 3.9 2.4 3.8Biomass and waste 111 147 182 293 359 406 436 3.3 5.6 7.9 3.0 2.9 1.2 0.7 1.5
Final energy consumptionMtoe Shares (%) CAGR (%)
1990/ 2013/ 2020/ 2030/ 2013/1980 1990 2000 2013 2020 2030 2040 1990 2013 2040 2013 2020 2030 2040 2040
Total 2,937 3,099 3,631 3,631 3,783 3,867 3,819 100 100 100 0.7 0.6 0.2 -0.1 0.2Industry 940 826 908 794 839 851 843 27 22 22 -0.2 0.8 0.1 -0.1 0.2Transport 781 938 1,143 1,189 1,215 1,202 1,133 30 33 30 1.0 0.3 -0.1 -0.6 -0.2Buildings, etc. 972 1,044 1,209 1,305 1,358 1,415 1,434 34 36 38 1.0 0.6 0.4 0.1 0.4Non-energy use 243 290 370 343 371 400 409 9.3 9.5 11 0.7 1.1 0.7 0.2 0.7Coal 259 234 140 119 122 113 101 7.6 3.3 2.6 -2.9 0.4 -0.8 -1.2 -0.6Oil 1,570 1,586 1,840 1,705 1,700 1,669 1,571 51 47 41 0.3 0.0 -0.2 -0.6 -0.3Natural gas 559 589 746 745 783 808 811 19 21 21 1.0 0.7 0.3 0.0 0.3Electricity 408 550 714 800 882 968 1,018 18 22 27 1.6 1.4 0.9 0.5 0.9Heat 36 43 50 58 61 64 65 1.4 1.6 1.7 1.3 0.8 0.3 0.2 0.4Hydrogen - - - - 0.0 0.7 1.3 - - 0.0 n.a. n.a. 36.4 6.6 n.a.Renewables 105 97 140 203 233 244 252 3.1 5.6 6.6 3.3 2.0 0.5 0.3 0.8
Electricity generation(TWh) Shares (%) CAGR (%)
1990/ 2013/ 2020/ 2030/ 2013/1980 1990 2000 2013 2020 2030 2040 1990 2013 2040 2013 2020 2030 2040 2040
Total 5,656 7,608 9,685 10,736 11,789 12,883 13,513 100 100 100 1.5 1.3 0.9 0.5 0.9Coal 2,319 3,082 3,759 3,493 3,390 3,281 3,004 41 33 22 0.5 -0.4 -0.3 -0.9 -0.6Oil 980 676 580 328 191 141 108 8.9 3.1 0.8 -3.1 -7.4 -3.0 -2.6 -4.0Natural gas 618 782 1,543 2,608 3,054 3,769 4,178 10 24 31 5.4 2.3 2.1 1.0 1.8Nuclear 621 1,729 2,249 1,962 2,259 2,149 2,162 23 18 16 0.5 2.0 -0.5 0.1 0.4Hydro 1,093 1,182 1,341 1,413 1,476 1,535 1,569 16 13 12 0.8 0.6 0.4 0.2 0.4Geothermal 11 29 33 46 87 113 146 0.4 0.4 1.1 2.1 9.5 2.6 2.6 4.4Solar, wind, etc. 0.5 5.2 32 568 877 1,298 1,636 0.1 5.3 12 22.7 6.4 4.0 2.3 4.0Biomass and waste 13 124 148 317 454 595 710 1.6 2.9 5.3 4.2 5.3 2.8 1.8 3.0
Energy and economic indicatorsCAGR (%)
1990/ 2013/ 2020/ 2030/ 2013/1980 1990 2000 2013 2020 2030 2040 2013 2020 2030 2040 2040
GDP ($2010 billion) 21,337 29,024 37,701 46,008 53,678 65,412 76,233 2.0 2.2 2.0 1.5 1.9Population (million) 982 1,062 1,150 1,254 1,299 1,348 1,380 0.7 0.5 0.4 0.2 0.4CO2 emissions*2 (Mt) 10,863 11,096 12,396 11,975 11,898 11,753 11,118 0.3 -0.1 -0.1 -0.6 -0.3GDP per capita ($2010 thousand) 22 27 33 37 41 49 55 1.3 1.7 1.6 1.3 1.5Primary energy consump. per capita (toe) 4.1 4.2 4.6 4.2 4.2 4.2 4.0 0.0 0.1 -0.2 -0.4 -0.2Primary energy consumption per GDP*3 190 155 140 115 103 86 73 -1.3 -1.5 -1.8 -1.6 -1.7CO2 emissions per GDP*2, *4 509 382 329 260 222 180 146 -1.7 -2.3 -2.1 -2.1 -2.1CO2 per primary energy consumption*2, *5 2.7 2.5 2.4 2.3 2.2 2.1 2.0 -0.3 -0.7 -0.3 -0.4 -0.5Automobile ownership (million) 347 468 593 729 795 871 922 1.9 1.3 0.9 0.6 0.9Automobile ownership rates*6 353 441 516 581 612 646 668 1.2 0.7 0.5 0.3 0.5*1 Trade of electricity and heat are not shown, *2 Excludes emission reduction by CCS, *3 toe/$2010 million,*4 t/$2010 million, *5 t/toe, *6 Vehicles per 1,000 people
IEEJ:February 2016 © IEEJ2016

Annex
Asia/World Energy Outlook 2015 Annex-179
Table A61 Non-OECD [Reference Scenario] Primary energy consumption
Mtoe Shares (%) CAGR (%)
1990/ 2013/ 2020/ 2030/ 2013/1980 1990 2000 2013 2020 2030 2040 1990 2013 2040 2013 2020 2030 2040 2040
Total*1 2,966 4,055 4,509 7,925 9,251 11,055 12,796 100 100 100 3.0 2.2 1.8 1.5 1.8Coal 818 1,143 1,248 2,905 3,165 3,451 3,759 28 37 29 4.1 1.2 0.9 0.9 1.0Oil 986 1,169 1,283 1,982 2,340 2,811 3,230 29 25 25 2.3 2.4 1.9 1.4 1.8Natural gas 454 820 911 1,536 1,873 2,462 3,044 20 19 24 2.8 2.9 2.8 2.1 2.6Nuclear 24 74 89 135 255 421 563 1.8 1.7 4.4 2.6 9.5 5.1 3.0 5.4Hydro 54 83 110 204 242 270 299 2.0 2.6 2.3 4.0 2.5 1.1 1.0 1.4Geothermal 2.2 7.6 22 35 87 113 129 0.2 0.4 1.0 6.8 14.2 2.6 1.3 5.0Solar, wind, etc. - 0.5 2.1 40 64 102 152 0.0 0.5 1.2 21.3 6.8 4.8 4.0 5.0Biomass and waste 630 758 843 1,084 1,221 1,420 1,612 19 14 13 1.6 1.7 1.5 1.3 1.5
Final energy consumptionMtoe Shares (%) CAGR (%)
1990/ 2013/ 2020/ 2030/ 2013/1980 1990 2000 2013 2020 2030 2040 1990 2013 2040 2013 2020 2030 2040 2040
Total 2,259 2,980 3,180 5,188 6,091 7,339 8,564 100 100 100 2.4 2.3 1.9 1.6 1.9Industry 832 981 987 1,830 2,091 2,460 2,835 33 35 33 2.7 1.9 1.6 1.4 1.6Transport 289 435 549 1,009 1,233 1,560 1,847 15 19 22 3.7 2.9 2.4 1.7 2.3Buildings, etc. 1,028 1,377 1,396 1,894 2,211 2,655 3,119 46 37 36 1.4 2.2 1.8 1.6 1.9Non-energy use 111 187 249 456 556 664 763 6.3 8.8 8.9 3.9 2.9 1.8 1.4 1.9Coal 451 532 438 835 885 887 893 18 16 10 2.0 0.8 0.0 0.1 0.2Oil 697 819 1,013 1,644 1,986 2,439 2,847 27 32 33 3.1 2.7 2.1 1.6 2.1Natural gas 256 355 375 655 821 1,073 1,328 12 13 16 2.7 3.3 2.7 2.2 2.7Electricity 178 283 377 876 1,105 1,478 1,873 9.5 17 22 5.0 3.4 2.9 2.4 2.9Heat 85 293 198 216 238 261 274 9.8 4.2 3.2 -1.3 1.4 1.0 0.5 0.9Hydrogen - - - - - - - - - - n.a. n.a. n.a. n.a. n.a.Renewables 593 699 779 961 1,056 1,200 1,349 23 19 16 1.4 1.4 1.3 1.2 1.3
Electricity generation(TWh) Shares (%) CAGR (%)
1990/ 2013/ 2020/ 2030/ 2013/1980 1990 2000 2013 2020 2030 2040 1990 2013 2040 2013 2020 2030 2040 2040
Total 2,628 4,218 5,741 12,571 15,625 20,663 25,996 100 100 100 4.9 3.2 2.8 2.3 2.7Coal 817 1,342 2,243 6,120 7,037 8,798 10,684 32 49 41 6.8 2.0 2.3 2.0 2.1Oil 678 636 625 700 757 850 924 15 5.6 3.6 0.4 1.1 1.2 0.8 1.0Natural gas 381 979 1,210 2,467 3,284 5,046 7,027 23 20 27 4.1 4.2 4.4 3.4 4.0Nuclear 93 283 341 516 977 1,612 2,159 6.7 4.1 8.3 2.6 9.5 5.1 3.0 5.4Hydro 624 963 1,279 2,377 2,817 3,144 3,478 23 19 13 4.0 2.5 1.1 1.0 1.4Geothermal 2.6 7.8 19 26 63 81 93 0.2 0.2 0.4 5.3 13.7 2.5 1.4 4.9Solar, wind, etc. - 0.0 3.1 221 449 759 1,143 0.0 1.8 4.4 44.8 10.7 5.4 4.2 6.3Biomass and waste 31 7.7 21 145 240 372 488 0.2 1.2 1.9 13.6 7.5 4.5 2.7 4.6
Energy and economic indicatorsCAGR (%)
1990/ 2013/ 2020/ 2030/ 2013/1980 1990 2000 2013 2020 2030 2040 2013 2020 2030 2040 2040
GDP ($2010 billion) 6,444 8,490 11,654 24,534 33,461 52,623 76,047 4.7 4.5 4.6 3.8 4.3Population (million) 3,453 4,209 4,943 5,860 6,386 7,071 7,688 1.4 1.2 1.0 0.8 1.0CO2 emissions*2 (Mt) 7,000 9,484 10,284 19,859 22,489 26,137 29,732 3.3 1.8 1.5 1.3 1.5GDP per capita ($2010 thousand) 1.9 2.0 2.4 4.2 5.2 7.4 9.9 3.2 3.3 3.6 2.9 3.2Primary energy consump. per capita (toe) 0.9 1.0 0.9 1.4 1.4 1.6 1.7 1.5 1.0 0.8 0.6 0.8Primary energy consumption per GDP*3 460 478 387 323 276 210 168 -1.7 -2.2 -2.7 -2.2 -2.4CO2 emissions per GDP*2, *4 1,086 1,117 882 809 672 497 391 -1.4 -2.6 -3.0 -2.4 -2.7CO2 per primary energy consumption*2, *5 2.4 2.3 2.3 2.5 2.4 2.4 2.3 0.3 -0.4 -0.3 -0.2 -0.3Automobile ownership (million) 69 109 173 467 654 931 1,220 6.5 4.9 3.6 2.7 3.6Automobile ownership rates*6 20 26 35 80 102 132 159 5.0 3.7 2.5 1.9 2.6*1 Trade of electricity and heat are not shown, *2 Excludes emission reduction by CCS, *3 toe/$2010 million,*4 t/$2010 million, *5 t/toe, *6 Vehicles per 1,000 people
IEEJ:February 2016 © IEEJ2016
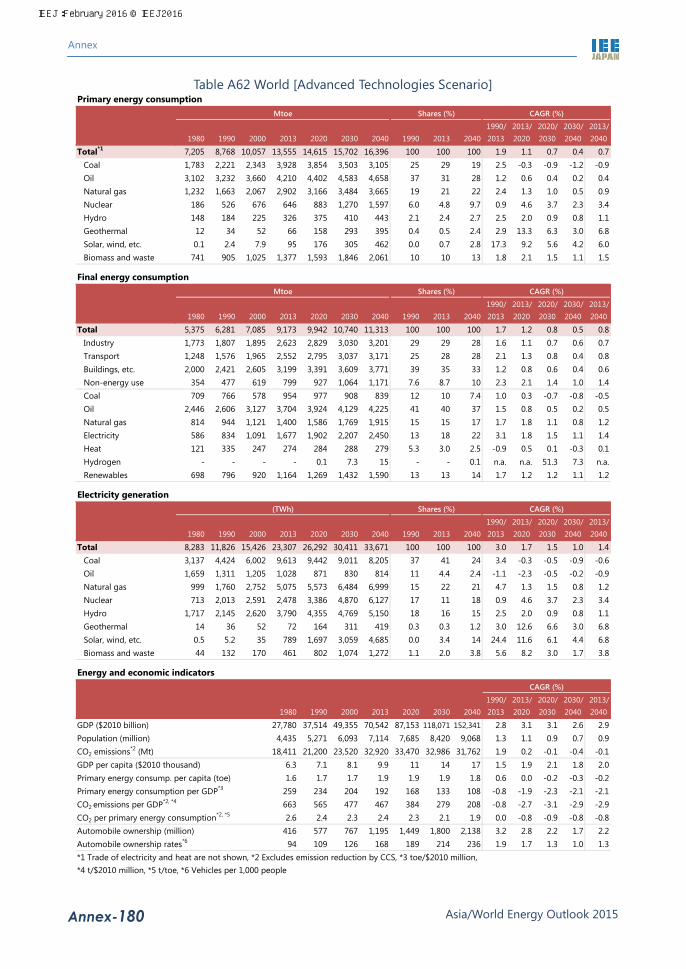
Annex
Asia/World Energy Outlook 2015 Annex-180
Table A62 World [Advanced Technologies Scenario] Primary energy consumption
Mtoe Shares (%) CAGR (%)
1990/ 2013/ 2020/ 2030/ 2013/1980 1990 2000 2013 2020 2030 2040 1990 2013 2040 2013 2020 2030 2040 2040
Total*1 7,205 8,768 10,057 13,555 14,615 15,702 16,396 100 100 100 1.9 1.1 0.7 0.4 0.7Coal 1,783 2,221 2,343 3,928 3,854 3,503 3,105 25 29 19 2.5 -0.3 -0.9 -1.2 -0.9Oil 3,102 3,232 3,660 4,210 4,402 4,583 4,658 37 31 28 1.2 0.6 0.4 0.2 0.4Natural gas 1,232 1,663 2,067 2,902 3,166 3,484 3,665 19 21 22 2.4 1.3 1.0 0.5 0.9Nuclear 186 526 676 646 883 1,270 1,597 6.0 4.8 9.7 0.9 4.6 3.7 2.3 3.4Hydro 148 184 225 326 375 410 443 2.1 2.4 2.7 2.5 2.0 0.9 0.8 1.1Geothermal 12 34 52 66 158 293 395 0.4 0.5 2.4 2.9 13.3 6.3 3.0 6.8Solar, wind, etc. 0.1 2.4 7.9 95 176 305 462 0.0 0.7 2.8 17.3 9.2 5.6 4.2 6.0Biomass and waste 741 905 1,025 1,377 1,593 1,846 2,061 10 10 13 1.8 2.1 1.5 1.1 1.5
Final energy consumptionMtoe Shares (%) CAGR (%)
1990/ 2013/ 2020/ 2030/ 2013/1980 1990 2000 2013 2020 2030 2040 1990 2013 2040 2013 2020 2030 2040 2040
Total 5,375 6,281 7,085 9,173 9,942 10,740 11,313 100 100 100 1.7 1.2 0.8 0.5 0.8Industry 1,773 1,807 1,895 2,623 2,829 3,030 3,201 29 29 28 1.6 1.1 0.7 0.6 0.7Transport 1,248 1,576 1,965 2,552 2,795 3,037 3,171 25 28 28 2.1 1.3 0.8 0.4 0.8Buildings, etc. 2,000 2,421 2,605 3,199 3,391 3,609 3,771 39 35 33 1.2 0.8 0.6 0.4 0.6Non-energy use 354 477 619 799 927 1,064 1,171 7.6 8.7 10 2.3 2.1 1.4 1.0 1.4Coal 709 766 578 954 977 908 839 12 10 7.4 1.0 0.3 -0.7 -0.8 -0.5Oil 2,446 2,606 3,127 3,704 3,924 4,129 4,225 41 40 37 1.5 0.8 0.5 0.2 0.5Natural gas 814 944 1,121 1,400 1,586 1,769 1,915 15 15 17 1.7 1.8 1.1 0.8 1.2Electricity 586 834 1,091 1,677 1,902 2,207 2,450 13 18 22 3.1 1.8 1.5 1.1 1.4Heat 121 335 247 274 284 288 279 5.3 3.0 2.5 -0.9 0.5 0.1 -0.3 0.1Hydrogen - - - - 0.1 7.3 15 - - 0.1 n.a. n.a. 51.3 7.3 n.a.Renewables 698 796 920 1,164 1,269 1,432 1,590 13 13 14 1.7 1.2 1.2 1.1 1.2
Electricity generation(TWh) Shares (%) CAGR (%)
1990/ 2013/ 2020/ 2030/ 2013/1980 1990 2000 2013 2020 2030 2040 1990 2013 2040 2013 2020 2030 2040 2040
Total 8,283 11,826 15,426 23,307 26,292 30,411 33,671 100 100 100 3.0 1.7 1.5 1.0 1.4Coal 3,137 4,424 6,002 9,613 9,442 9,011 8,205 37 41 24 3.4 -0.3 -0.5 -0.9 -0.6Oil 1,659 1,311 1,205 1,028 871 830 814 11 4.4 2.4 -1.1 -2.3 -0.5 -0.2 -0.9Natural gas 999 1,760 2,752 5,075 5,573 6,484 6,999 15 22 21 4.7 1.3 1.5 0.8 1.2Nuclear 713 2,013 2,591 2,478 3,386 4,870 6,127 17 11 18 0.9 4.6 3.7 2.3 3.4Hydro 1,717 2,145 2,620 3,790 4,355 4,769 5,150 18 16 15 2.5 2.0 0.9 0.8 1.1Geothermal 14 36 52 72 164 311 419 0.3 0.3 1.2 3.0 12.6 6.6 3.0 6.8Solar, wind, etc. 0.5 5.2 35 789 1,697 3,059 4,685 0.0 3.4 14 24.4 11.6 6.1 4.4 6.8Biomass and waste 44 132 170 461 802 1,074 1,272 1.1 2.0 3.8 5.6 8.2 3.0 1.7 3.8
Energy and economic indicatorsCAGR (%)
1990/ 2013/ 2020/ 2030/ 2013/1980 1990 2000 2013 2020 2030 2040 2013 2020 2030 2040 2040
GDP ($2010 billion) 27,780 37,514 49,355 70,542 87,153 118,071 152,341 2.8 3.1 3.1 2.6 2.9Population (million) 4,435 5,271 6,093 7,114 7,685 8,420 9,068 1.3 1.1 0.9 0.7 0.9CO2 emissions*2 (Mt) 18,411 21,200 23,520 32,920 33,470 32,986 31,762 1.9 0.2 -0.1 -0.4 -0.1GDP per capita ($2010 thousand) 6.3 7.1 8.1 9.9 11 14 17 1.5 1.9 2.1 1.8 2.0Primary energy consump. per capita (toe) 1.6 1.7 1.7 1.9 1.9 1.9 1.8 0.6 0.0 -0.2 -0.3 -0.2Primary energy consumption per GDP*3 259 234 204 192 168 133 108 -0.8 -1.9 -2.3 -2.1 -2.1CO2 emissions per GDP*2, *4 663 565 477 467 384 279 208 -0.8 -2.7 -3.1 -2.9 -2.9CO2 per primary energy consumption*2, *5 2.6 2.4 2.3 2.4 2.3 2.1 1.9 0.0 -0.8 -0.9 -0.8 -0.8Automobile ownership (million) 416 577 767 1,195 1,449 1,800 2,138 3.2 2.8 2.2 1.7 2.2Automobile ownership rates*6 94 109 126 168 189 214 236 1.9 1.7 1.3 1.0 1.3*1 Trade of electricity and heat are not shown, *2 Excludes emission reduction by CCS, *3 toe/$2010 million,*4 t/$2010 million, *5 t/toe, *6 Vehicles per 1,000 people
IEEJ:February 2016 © IEEJ2016

Annex
Asia/World Energy Outlook 2015 Annex-181
Table A63 Asia [Advanced Technologies Scenario] Primary energy consumption
Mtoe Shares (%) CAGR (%)
1990/ 2013/ 2020/ 2030/ 2013/1980 1990 2000 2013 2020 2030 2040 1990 2013 2040 2013 2020 2030 2040 2040
Total*1 1,440 2,110 2,920 5,409 6,213 6,961 7,534 100 100 100 4.2 2.0 1.1 0.8 1.2Coal 466 786 1,063 2,747 2,832 2,692 2,460 37 51 33 5.6 0.4 -0.5 -0.9 -0.4Oil 477 618 917 1,254 1,434 1,623 1,778 29 23 24 3.1 1.9 1.3 0.9 1.3Natural gas 51 116 232 532 684 943 1,149 5.5 9.8 15 6.9 3.7 3.3 2.0 2.9Nuclear 25 77 132 89 292 520 760 3.6 1.6 10 0.6 18.6 5.9 3.9 8.3Hydro 20 32 41 113 152 173 195 1.5 2.1 2.6 5.7 4.2 1.3 1.2 2.0Geothermal 2.6 8.2 23 31 83 148 199 0.4 0.6 2.6 6.0 14.8 6.0 3.0 7.1Solar, wind, etc. - 1.2 2.1 38 74 135 206 0.1 0.7 2.7 16.1 9.8 6.2 4.3 6.4Biomass and waste 397 472 510 602 659 721 781 22 11 10 1.1 1.3 0.9 0.8 1.0
Final energy consumptionMtoe Shares (%) CAGR (%)
1990/ 2013/ 2020/ 2030/ 2013/1980 1990 2000 2013 2020 2030 2040 1990 2013 2040 2013 2020 2030 2040 2040
Total 1,136 1,572 2,039 3,476 3,979 4,490 4,940 100 100 100 3.5 1.9 1.2 1.0 1.3Industry 390 518 672 1,367 1,524 1,622 1,715 33 39 35 4.3 1.6 0.6 0.6 0.8Transport 126 190 325 581 701 853 987 12 17 20 5.0 2.7 2.0 1.5 2.0Buildings, etc. 567 748 852 1,188 1,346 1,526 1,676 48 34 34 2.0 1.8 1.3 0.9 1.3Non-energy use 54 116 190 340 408 489 564 7.4 9.8 11 4.8 2.6 1.8 1.4 1.9Coal 308 435 408 795 817 755 693 28 23 14 2.7 0.4 -0.8 -0.9 -0.5Oil 327 464 742 1,102 1,301 1,491 1,646 30 32 33 3.8 2.4 1.4 1.0 1.5Natural gas 21 47 89 248 329 464 599 3.0 7.1 12 7.5 4.1 3.5 2.6 3.3Electricity 88 156 278 686 855 1,065 1,236 9.9 20 25 6.7 3.2 2.2 1.5 2.2Heat 7.5 14 30 82 93 97 96 0.9 2.4 1.9 7.9 1.8 0.4 -0.1 0.6Hydrogen - - - - 0.1 0.8 2.7 - - 0.1 n.a. n.a. 28.5 13.1 n.a.Renewables 386 456 493 562 584 619 668 29 16 14 0.9 0.6 0.6 0.8 0.6
Electricity generation(TWh) Shares (%) CAGR (%)
1990/ 2013/ 2020/ 2030/ 2013/1980 1990 2000 2013 2020 2030 2040 1990 2013 2040 2013 2020 2030 2040 2040
Total 1,196 2,215 3,974 9,481 11,701 14,446 16,649 100 100 100 6.5 3.1 2.1 1.4 2.1Coal 298 862 1,990 5,939 6,292 6,582 6,385 39 63 38 8.8 0.8 0.5 -0.3 0.3Oil 476 422 386 306 199 176 156 19 3.2 0.9 -1.4 -6.0 -1.2 -1.2 -2.5Natural gas 90 247 567 1,206 1,444 2,072 2,571 11 13 15 7.1 2.6 3.7 2.2 2.8Nuclear 97 294 505 340 1,122 1,995 2,916 13 3.6 18 0.6 18.6 5.9 3.9 8.3Hydro 232 370 481 1,319 1,763 2,014 2,266 17 14 14 5.7 4.2 1.3 1.2 2.0Geothermal 3.0 8.4 20 22 54 97 130 0.4 0.2 0.8 4.2 14.0 5.9 3.0 6.8Solar, wind, etc. - 0.0 3.0 219 591 1,173 1,816 0.0 2.3 11 44.7 15.2 7.1 4.5 8.1Biomass and waste 0.0 11 22 129 236 337 409 0.5 1.4 2.5 11.1 8.9 3.7 1.9 4.4
Energy and economic indicatorsCAGR (%)
1990/ 2013/ 2020/ 2030/ 2013/1980 1990 2000 2013 2020 2030 2040 2013 2020 2030 2040 2040
GDP ($2010 billion) 4,333 7,400 10,696 19,855 27,926 43,063 61,421 4.4 5.0 4.4 3.6 4.3Population (million) 2,442 2,931 3,401 3,890 4,137 4,406 4,579 1.2 0.9 0.6 0.4 0.6CO2 emissions*2 (Mt) 3,269 4,920 6,989 14,936 15,977 16,376 16,195 4.9 1.0 0.2 -0.1 0.3GDP per capita ($2010 thousand) 1.8 2.5 3.1 5.1 6.7 9.8 13 3.1 4.1 3.8 3.2 3.6Primary energy consump. per capita (toe) 0.6 0.7 0.9 1.4 1.5 1.6 1.6 2.9 1.1 0.5 0.4 0.6Primary energy consumption per GDP*3 332 285 273 272 222 162 123 -0.2 -2.9 -3.1 -2.7 -2.9CO2 emissions per GDP*2, *4 754 665 653 752 572 380 264 0.5 -3.8 -4.0 -3.6 -3.8CO2 per primary energy consumption*2, *5 2.3 2.3 2.4 2.8 2.6 2.4 2.1 0.7 -1.0 -0.9 -0.9 -0.9Automobile ownership (million) 48 86 140 322 463 650 861 5.9 5.3 3.4 2.8 3.7Automobile ownership rates*6 19 29 41 83 112 148 188 4.6 4.4 2.8 2.4 3.1*1 Trade of electricity and heat are not shown, *2 Excludes emission reduction by CCS, *3 toe/$2010 million,*4 t/$2010 million, *5 t/toe, *6 Vehicles per 1,000 people
IEEJ:February 2016 © IEEJ2016

Annex
Asia/World Energy Outlook 2015 Annex-182
Table A64 China [Advanced Technologies Scenario] Primary energy consumption
Mtoe Shares (%) CAGR (%)
1990/ 2013/ 2020/ 2030/ 2013/1980 1990 2000 2013 2020 2030 2040 1990 2013 2040 2013 2020 2030 2040 2040
Total*1 598 871 1,161 3,022 3,367 3,547 3,533 100 100 100 5.6 1.6 0.5 0.0 0.6Coal 313 528 691 2,045 2,038 1,834 1,515 61 68 43 6.1 0.0 -1.0 -1.9 -1.1Oil 89 119 221 478 572 638 678 14 16 19 6.2 2.6 1.1 0.6 1.3Natural gas 12 13 21 140 253 400 491 1.5 4.6 14 11.0 8.8 4.7 2.1 4.8Nuclear - - 4.4 29 117 236 355 - 1.0 10 n.a. 22.1 7.2 4.2 9.7Hydro 5.0 11 19 78 107 115 122 1.3 2.6 3.5 8.9 4.6 0.7 0.6 1.7Geothermal - - 1.7 4.5 6.4 8.7 10 - 0.1 0.3 n.a. 5.1 3.2 1.6 3.1Solar, wind, etc. - 0.0 1.0 32 56 93 136 0.0 1.1 3.9 34.9 8.2 5.2 3.9 5.5Biomass and waste 180 200 203 216 219 224 227 23 7.1 6.4 0.3 0.2 0.2 0.1 0.2
Final energy consumptionMtoe Shares (%) CAGR (%)
1990/ 2013/ 2020/ 2030/ 2013/1980 1990 2000 2013 2020 2030 2040 1990 2013 2040 2013 2020 2030 2040 2040
Total 494 664 815 1,814 2,046 2,202 2,277 100 100 100 4.5 1.7 0.7 0.3 0.8Industry 188 244 329 878 933 907 867 37 48 38 5.7 0.9 -0.3 -0.4 0.0Transport 24 33 88 245 309 378 433 5.0 14 19 9.1 3.3 2.0 1.4 2.1Buildings, etc. 272 344 337 548 627 709 740 52 30 33 2.0 2.0 1.2 0.4 1.1Non-energy use 10 43 62 143 176 208 236 6.5 7.9 10 5.4 3.0 1.7 1.3 1.9Coal 220 318 304 603 594 509 425 48 33 19 2.8 -0.2 -1.5 -1.8 -1.3Oil 59 85 181 435 526 590 628 13 24 28 7.4 2.8 1.2 0.6 1.4Natural gas 6.4 8.9 12 94 145 228 308 1.3 5.2 14 10.8 6.4 4.6 3.0 4.5Electricity 21 39 89 386 484 575 610 5.9 21 27 10.5 3.3 1.7 0.6 1.7Heat 7.4 13 25 76 85 87 83 2.0 4.2 3.7 7.9 1.6 0.2 -0.4 0.3Hydrogen - - - - - - 1.2 - - 0.1 n.a. n.a. n.a. n.a. n.a.Renewables 180 200 204 220 212 213 222 30 12 9.7 0.4 -0.5 0.0 0.4 0.0
Electricity generation(TWh) Shares (%) CAGR (%)
1990/ 2013/ 2020/ 2030/ 2013/1980 1990 2000 2013 2020 2030 2040 1990 2013 2040 2013 2020 2030 2040 2040
Total 301 621 1,356 5,422 6,681 7,848 8,224 100 100 100 9.9 3.0 1.6 0.5 1.6Coal 159 441 1,061 4,090 4,189 4,223 3,636 71 75 44 10.2 0.3 0.1 -1.5 -0.4Oil 82 50 47 6.6 6.5 6.3 6.2 8.1 0.1 0.1 -8.5 -0.3 -0.2 -0.2 -0.2Natural gas 0.7 2.8 5.8 99 301 534 603 0.4 1.8 7.3 16.9 17.2 5.9 1.2 6.9Nuclear - - 17 112 451 906 1,362 - 2.1 17 n.a. 22.1 7.2 4.2 9.7Hydro 58 127 222 909 1,247 1,337 1,418 20 17 17 8.9 4.6 0.7 0.6 1.7Geothermal - 0.1 0.1 0.1 0.3 0.4 0.5 0.0 0.0 0.0 2.9 15.0 3.7 2.6 6.1Solar, wind, etc. - 0.0 0.6 155 390 697 1,019 0.0 2.9 12 51.5 14.1 6.0 3.9 7.2Biomass and waste - - 2.4 50 96 144 179 - 0.9 2.2 n.a. 9.8 4.1 2.1 4.8
Energy and economic indicatorsCAGR (%)
1990/ 2013/ 2020/ 2030/ 2013/1980 1990 2000 2013 2020 2030 2040 2013 2020 2030 2040 2040
GDP ($2010 billion) 334 811 2,189 7,513 11,641 19,762 29,180 10.2 6.5 5.4 4.0 5.2Population (million) 981 1,135 1,263 1,357 1,398 1,410 1,389 0.8 0.4 0.1 -0.1 0.1CO2 emissions*2 (Mt) 1,505 2,339 3,258 9,437 9,857 9,502 8,493 6.3 0.6 -0.4 -1.1 -0.4GDP per capita ($2010 thousand) 0.3 0.7 1.7 5.5 8.3 14 21 9.3 6.0 5.3 4.1 5.1Primary energy consump. per capita (toe) 0.6 0.8 0.9 2.2 2.4 2.5 2.5 4.7 1.1 0.4 0.1 0.5Primary energy consumption per GDP*3 1,790 1,073 530 402 289 179 121 -4.2 -4.6 -4.7 -3.9 -4.3CO2 emissions per GDP*2, *4 4,505 2,882 1,489 1,256 847 481 291 -3.5 -5.5 -5.5 -4.9 -5.3CO2 per primary energy consumption*2, *5 2.5 2.7 2.8 3.1 2.9 2.7 2.4 0.7 -0.9 -0.9 -1.1 -1.0Automobile ownership (million) 1.2 5.3 16 127 217 309 398 14.8 8.0 3.6 2.6 4.3Automobile ownership rates*6 1.2 4.7 12 93 155 219 286 13.9 7.5 3.5 2.7 4.2*1 Trade of electricity and heat are not shown, *2 Excludes emission reduction by CCS, *3 toe/$2010 million,*4 t/$2010 million, *5 t/toe, *6 Vehicles per 1,000 people
IEEJ:February 2016 © IEEJ2016

Annex
Asia/World Energy Outlook 2015 Annex-183
Table A65 India [Advanced Technologies Scenario] Primary energy consumption
Mtoe Shares (%) CAGR (%)
1990/ 2013/ 2020/ 2030/ 2013/1980 1990 2000 2013 2020 2030 2040 1990 2013 2040 2013 2020 2030 2040 2040
Total*1 200 307 441 775 987 1,259 1,582 100 100 100 4.1 3.5 2.5 2.3 2.7Coal 45 94 146 341 416 445 513 31 44 32 5.8 2.9 0.7 1.4 1.5Oil 33 61 112 176 241 324 396 20 23 25 4.7 4.6 3.0 2.0 3.0Natural gas 1.3 11 23 44 68 112 174 3.4 5.7 11 6.4 6.3 5.1 4.5 5.2Nuclear 0.8 1.6 4.4 8.9 21 90 154 0.5 1.2 9.7 7.8 13.1 15.6 5.5 11.1Hydro 4.0 6.2 6.4 12 16 23 32 2.0 1.6 2.0 3.0 3.8 3.8 3.4 3.6Geothermal - - - - - - - - - - n.a. n.a. n.a. n.a. n.a.Solar, wind, etc. - 0.0 0.2 3.6 12 30 49 0.0 0.5 3.1 29.0 19.0 9.5 4.9 10.1Biomass and waste 116 133 149 188 212 233 264 44 24 17 1.5 1.7 1.0 1.2 1.3
Final energy consumptionMtoe Shares (%) CAGR (%)
1990/ 2013/ 2020/ 2030/ 2013/1980 1990 2000 2013 2020 2030 2040 1990 2013 2040 2013 2020 2030 2040 2040
Total 174 243 315 528 667 842 1,049 100 100 100 3.4 3.4 2.4 2.2 2.6Industry 42 67 83 179 228 288 359 27 34 34 4.4 3.5 2.4 2.2 2.6Transport 17 21 32 75 107 152 189 8.6 14 18 5.7 5.2 3.6 2.2 3.5Buildings, etc. 110 142 173 238 283 332 405 59 45 39 2.3 2.5 1.6 2.0 2.0Non-energy use 5.7 13 27 36 48 70 96 5.5 6.9 9.1 4.5 4.2 3.7 3.2 3.6Coal 25 39 35 103 122 133 150 16 20 14 4.3 2.4 0.8 1.2 1.4Oil 27 50 94 150 214 295 366 21 28 35 4.9 5.2 3.3 2.2 3.4Natural gas 0.7 5.6 9.7 27 35 51 71 2.3 5.0 6.8 7.0 4.2 3.7 3.4 3.7Electricity 7.8 18 32 77 112 172 250 7.6 14 24 6.4 5.5 4.4 3.8 4.5Heat - - - - - - - - - - n.a. n.a. n.a. n.a. n.a.Hydrogen - - - - 0.0 0.1 0.3 - - 0.0 n.a. n.a. 50.1 9.8 n.a.Renewables 114 130 144 172 184 192 212 54 32 20 1.2 1.0 0.4 1.0 0.8
Electricity generation(TWh) Shares (%) CAGR (%)
1990/ 2013/ 2020/ 2030/ 2013/1980 1990 2000 2013 2020 2030 2040 1990 2013 2040 2013 2020 2030 2040 2040
Total 120 293 570 1,193 1,718 2,591 3,715 100 100 100 6.3 5.3 4.2 3.7 4.3Coal 61 192 390 869 1,114 1,248 1,535 65 73 41 6.8 3.6 1.1 2.1 2.1Oil 8.8 13 29 23 23 21 18 4.5 1.9 0.5 2.4 0.0 -1.0 -1.5 -0.9Natural gas 0.6 10.0 56 65 134 290 545 3.4 5.5 15 8.5 10.9 8.0 6.5 8.2Nuclear 3.0 6.1 17 34 81 347 591 2.1 2.9 16 7.8 13.1 15.6 5.5 11.1Hydro 47 72 74 142 184 267 373 24 12 10 3.0 3.8 3.8 3.4 3.6Geothermal - - - - - - - - - - n.a. n.a. n.a. n.a. n.a.Solar, wind, etc. - 0.0 1.7 37 138 349 569 0.0 3.1 15 35.9 20.7 9.7 5.0 10.6Biomass and waste - - 1.3 23 44 68 85 - 1.9 2.3 n.a. 9.5 4.4 2.4 5.0
Energy and economic indicatorsCAGR (%)
1990/ 2013/ 2020/ 2030/ 2013/1980 1990 2000 2013 2020 2030 2040 2013 2020 2030 2040 2040
GDP ($2010 billion) 279 479 825 2,039 3,391 6,462 11,298 6.5 7.5 6.7 5.7 6.5Population (million) 699 869 1,042 1,252 1,359 1,495 1,599 1.6 1.2 1.0 0.7 0.9CO2 emissions*2 (Mt) 265 546 901 1,894 2,409 2,820 3,377 5.6 3.5 1.6 1.8 2.2GDP per capita ($2010 thousand) 0.4 0.6 0.8 1.6 2.5 4.3 7.1 4.8 6.3 5.6 5.0 5.6Primary energy consump. per capita (toe) 0.3 0.4 0.4 0.6 0.7 0.8 1.0 2.5 2.3 1.5 1.6 1.8Primary energy consumption per GDP*3 718 640 535 380 291 195 140 -2.2 -3.8 -3.9 -3.2 -3.6CO2 emissions per GDP*2, *4 950 1,139 1,092 929 710 436 299 -0.9 -3.8 -4.8 -3.7 -4.1CO2 per primary energy consumption*2, *5 1.3 1.8 2.0 2.4 2.4 2.2 2.1 1.4 0.0 -0.9 -0.5 -0.5Automobile ownership (million) 1.7 4.3 9.4 32 59 119 200 9.2 8.9 7.3 5.3 7.0Automobile ownership rates*6 2.4 5.0 9.0 26 43 80 125 7.4 7.6 6.3 4.6 6.0*1 Trade of electricity and heat are not shown, *2 Excludes emission reduction by CCS, *3 toe/$2010 million,*4 t/$2010 million, *5 t/toe, *6 Vehicles per 1,000 people
IEEJ:February 2016 © IEEJ2016
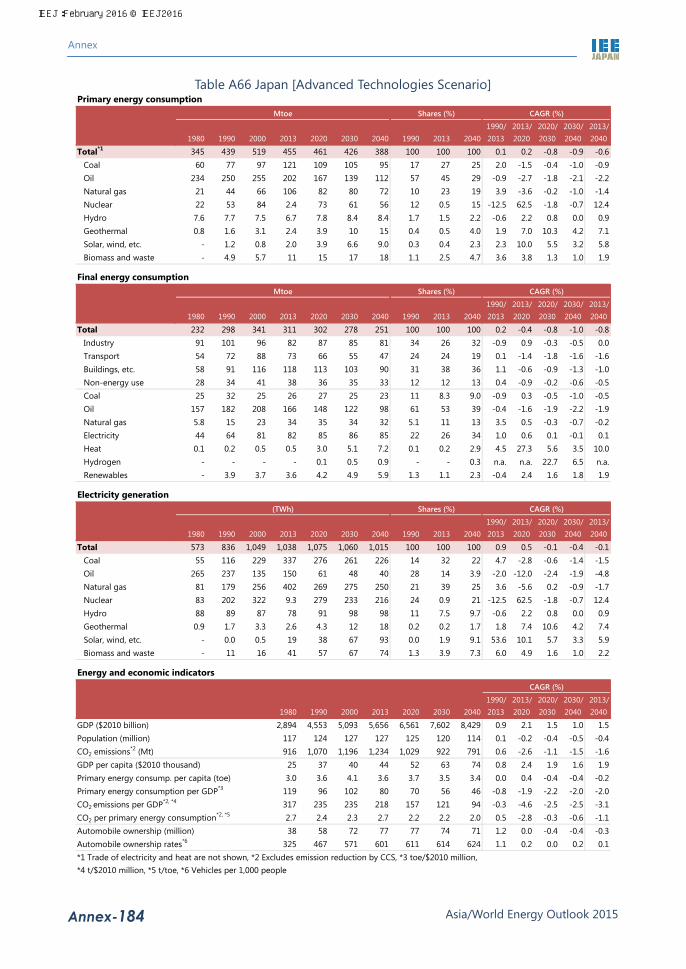
Annex
Asia/World Energy Outlook 2015 Annex-184
Table A66 Japan [Advanced Technologies Scenario] Primary energy consumption
Mtoe Shares (%) CAGR (%)
1990/ 2013/ 2020/ 2030/ 2013/1980 1990 2000 2013 2020 2030 2040 1990 2013 2040 2013 2020 2030 2040 2040
Total*1 345 439 519 455 461 426 388 100 100 100 0.1 0.2 -0.8 -0.9 -0.6Coal 60 77 97 121 109 105 95 17 27 25 2.0 -1.5 -0.4 -1.0 -0.9Oil 234 250 255 202 167 139 112 57 45 29 -0.9 -2.7 -1.8 -2.1 -2.2Natural gas 21 44 66 106 82 80 72 10 23 19 3.9 -3.6 -0.2 -1.0 -1.4Nuclear 22 53 84 2.4 73 61 56 12 0.5 15 -12.5 62.5 -1.8 -0.7 12.4Hydro 7.6 7.7 7.5 6.7 7.8 8.4 8.4 1.7 1.5 2.2 -0.6 2.2 0.8 0.0 0.9Geothermal 0.8 1.6 3.1 2.4 3.9 10 15 0.4 0.5 4.0 1.9 7.0 10.3 4.2 7.1Solar, wind, etc. - 1.2 0.8 2.0 3.9 6.6 9.0 0.3 0.4 2.3 2.3 10.0 5.5 3.2 5.8Biomass and waste - 4.9 5.7 11 15 17 18 1.1 2.5 4.7 3.6 3.8 1.3 1.0 1.9
Final energy consumptionMtoe Shares (%) CAGR (%)
1990/ 2013/ 2020/ 2030/ 2013/1980 1990 2000 2013 2020 2030 2040 1990 2013 2040 2013 2020 2030 2040 2040
Total 232 298 341 311 302 278 251 100 100 100 0.2 -0.4 -0.8 -1.0 -0.8Industry 91 101 96 82 87 85 81 34 26 32 -0.9 0.9 -0.3 -0.5 0.0Transport 54 72 88 73 66 55 47 24 24 19 0.1 -1.4 -1.8 -1.6 -1.6Buildings, etc. 58 91 116 118 113 103 90 31 38 36 1.1 -0.6 -0.9 -1.3 -1.0Non-energy use 28 34 41 38 36 35 33 12 12 13 0.4 -0.9 -0.2 -0.6 -0.5Coal 25 32 25 26 27 25 23 11 8.3 9.0 -0.9 0.3 -0.5 -1.0 -0.5Oil 157 182 208 166 148 122 98 61 53 39 -0.4 -1.6 -1.9 -2.2 -1.9Natural gas 5.8 15 23 34 35 34 32 5.1 11 13 3.5 0.5 -0.3 -0.7 -0.2Electricity 44 64 81 82 85 86 85 22 26 34 1.0 0.6 0.1 -0.1 0.1Heat 0.1 0.2 0.5 0.5 3.0 5.1 7.2 0.1 0.2 2.9 4.5 27.3 5.6 3.5 10.0Hydrogen - - - - 0.1 0.5 0.9 - - 0.3 n.a. n.a. 22.7 6.5 n.a.Renewables - 3.9 3.7 3.6 4.2 4.9 5.9 1.3 1.1 2.3 -0.4 2.4 1.6 1.8 1.9
Electricity generation(TWh) Shares (%) CAGR (%)
1990/ 2013/ 2020/ 2030/ 2013/1980 1990 2000 2013 2020 2030 2040 1990 2013 2040 2013 2020 2030 2040 2040
Total 573 836 1,049 1,038 1,075 1,060 1,015 100 100 100 0.9 0.5 -0.1 -0.4 -0.1Coal 55 116 229 337 276 261 226 14 32 22 4.7 -2.8 -0.6 -1.4 -1.5Oil 265 237 135 150 61 48 40 28 14 3.9 -2.0 -12.0 -2.4 -1.9 -4.8Natural gas 81 179 256 402 269 275 250 21 39 25 3.6 -5.6 0.2 -0.9 -1.7Nuclear 83 202 322 9.3 279 233 216 24 0.9 21 -12.5 62.5 -1.8 -0.7 12.4Hydro 88 89 87 78 91 98 98 11 7.5 9.7 -0.6 2.2 0.8 0.0 0.9Geothermal 0.9 1.7 3.3 2.6 4.3 12 18 0.2 0.2 1.7 1.8 7.4 10.6 4.2 7.4Solar, wind, etc. - 0.0 0.5 19 38 67 93 0.0 1.9 9.1 53.6 10.1 5.7 3.3 5.9Biomass and waste - 11 16 41 57 67 74 1.3 3.9 7.3 6.0 4.9 1.6 1.0 2.2
Energy and economic indicatorsCAGR (%)
1990/ 2013/ 2020/ 2030/ 2013/1980 1990 2000 2013 2020 2030 2040 2013 2020 2030 2040 2040
GDP ($2010 billion) 2,894 4,553 5,093 5,656 6,561 7,602 8,429 0.9 2.1 1.5 1.0 1.5Population (million) 117 124 127 127 125 120 114 0.1 -0.2 -0.4 -0.5 -0.4CO2 emissions*2 (Mt) 916 1,070 1,196 1,234 1,029 922 791 0.6 -2.6 -1.1 -1.5 -1.6GDP per capita ($2010 thousand) 25 37 40 44 52 63 74 0.8 2.4 1.9 1.6 1.9Primary energy consump. per capita (toe) 3.0 3.6 4.1 3.6 3.7 3.5 3.4 0.0 0.4 -0.4 -0.4 -0.2Primary energy consumption per GDP*3 119 96 102 80 70 56 46 -0.8 -1.9 -2.2 -2.0 -2.0CO2 emissions per GDP*2, *4 317 235 235 218 157 121 94 -0.3 -4.6 -2.5 -2.5 -3.1CO2 per primary energy consumption*2, *5 2.7 2.4 2.3 2.7 2.2 2.2 2.0 0.5 -2.8 -0.3 -0.6 -1.1Automobile ownership (million) 38 58 72 77 77 74 71 1.2 0.0 -0.4 -0.4 -0.3Automobile ownership rates*6 325 467 571 601 611 614 624 1.1 0.2 0.0 0.2 0.1*1 Trade of electricity and heat are not shown, *2 Excludes emission reduction by CCS, *3 toe/$2010 million,*4 t/$2010 million, *5 t/toe, *6 Vehicles per 1,000 people
IEEJ:February 2016 © IEEJ2016

Annex
Asia/World Energy Outlook 2015 Annex-185
Table A67 ASEAN [Advanced Technologies Scenario] Primary energy consumption
Mtoe Shares (%) CAGR (%)
1990/ 2013/ 2020/ 2030/ 2013/1980 1990 2000 2013 2020 2030 2040 1990 2013 2040 2013 2020 2030 2040 2040
Total*1 142 233 380 587 755 1,004 1,268 100 100 100 4.1 3.7 2.9 2.4 2.9Coal 3.6 13 32 91 121 164 212 5.4 16 17 9.0 4.1 3.1 2.6 3.2Oil 58 88 153 209 251 312 377 38 36 30 3.8 2.6 2.2 1.9 2.2Natural gas 8.6 30 74 133 158 197 238 13 23 19 6.7 2.5 2.2 1.9 2.2Nuclear - - - - 2.0 27 73 - - 5.8 n.a. n.a. 29.7 10.5 n.a.Hydro 0.8 2.3 4.1 9.4 12 16 19 1.0 1.6 1.5 6.2 3.8 2.6 1.7 2.6Geothermal 1.8 6.6 18 24 72 128 172 2.8 4.2 14 5.8 16.7 5.9 3.0 7.5Solar, wind, etc. - - - 0.1 0.6 1.5 3.3 - 0.0 0.3 n.a. 22.7 9.3 8.2 12.2Biomass and waste 70 93 99 118 137 155 169 40 20 13 1.0 2.1 1.3 0.8 1.3
Final energy consumptionMtoe Shares (%) CAGR (%)
1990/ 2013/ 2020/ 2030/ 2013/1980 1990 2000 2013 2020 2030 2040 1990 2013 2040 2013 2020 2030 2040 2040
Total 112 173 271 425 516 656 811 100 100 100 4.0 2.8 2.4 2.1 2.4Industry 22 43 76 116 146 196 251 25 27 31 4.5 3.4 2.9 2.5 2.9Transport 17 32 62 112 135 174 217 19 26 27 5.5 2.8 2.5 2.3 2.5Buildings, etc. 71 87 113 143 166 200 237 50 34 29 2.2 2.2 1.8 1.7 1.9Non-energy use 2.4 11 21 53 67 87 106 6.3 13 13 7.1 3.4 2.6 2.0 2.6Coal 2.1 6.0 13 27 33 41 48 3.5 6.4 5.9 6.7 2.9 2.2 1.5 2.1Oil 41 67 123 194 237 298 362 38 46 45 4.8 3.0 2.3 2.0 2.3Natural gas 2.5 7.5 17 40 51 70 92 4.4 9.4 11 7.5 3.4 3.3 2.8 3.1Electricity 4.7 11 28 61 82 124 176 6.4 14 22 7.7 4.3 4.1 3.6 4.0Heat - - - - - - - - - - n.a. n.a. n.a. n.a. n.a.Hydrogen - - - - - - - - - - n.a. n.a. n.a. n.a. n.a.Renewables 62 82 90 103 112 124 133 47 24 16 1.0 1.3 1.0 0.7 1.0
Electricity generation(TWh) Shares (%) CAGR (%)
1990/ 2013/ 2020/ 2030/ 2013/1980 1990 2000 2013 2020 2030 2040 1990 2013 2040 2013 2020 2030 2040 2040
Total 62 154 370 786 1,048 1,562 2,211 100 100 100 7.3 4.2 4.1 3.5 3.9Coal 3.0 28 79 255 348 519 733 18 32 33 10.1 4.6 4.1 3.5 4.0Oil 47 66 72 43 37 36 35 43 5.5 1.6 -1.8 -2.1 -0.2 -0.5 -0.8Natural gas 0.7 26 154 349 426 572 739 17 44 33 11.9 2.9 3.0 2.6 2.8Nuclear - - - - 7.7 104 280 - - 13 n.a. n.a. 29.7 10.5 n.a.Hydro 9.8 27 47 109 142 184 219 18 14 9.9 6.2 3.8 2.6 1.7 2.6Geothermal 2.1 6.6 16 19 49 84 110 4.3 2.4 5.0 4.7 14.6 5.4 2.8 6.7Solar, wind, etc. - - - 1.7 7.1 17 38 - 0.2 1.7 n.a. 22.7 9.3 8.2 12.2Biomass and waste - 0.6 1.0 10 30 46 57 0.4 1.3 2.6 13.0 16.8 4.4 2.1 6.6
Energy and economic indicatorsCAGR (%)
1990/ 2013/ 2020/ 2030/ 2013/1980 1990 2000 2013 2020 2030 2040 2013 2020 2030 2040 2040
GDP ($2010 billion) 405 703 1,137 2,190 3,097 4,848 7,019 5.1 5.1 4.6 3.8 4.4Population (million) 345 427 503 594 640 693 732 1.4 1.1 0.8 0.5 0.8CO2 emissions*2 (Mt) 205 362 710 1,162 1,424 1,816 2,247 5.2 2.9 2.5 2.1 2.5GDP per capita ($2010 thousand) 1.2 1.6 2.3 3.7 4.8 7.0 9.6 3.6 4.0 3.7 3.2 3.6Primary energy consump. per capita (toe) 0.4 0.5 0.8 1.0 1.2 1.4 1.7 2.6 2.6 2.1 1.8 2.1Primary energy consumption per GDP*3 352 332 334 268 244 207 181 -0.9 -1.3 -1.6 -1.4 -1.5CO2 emissions per GDP*2, *4 507 515 624 531 460 375 320 0.1 -2.0 -2.0 -1.6 -1.9CO2 per primary energy consumption*2, *5 1.4 1.6 1.9 2.0 1.9 1.8 1.8 1.1 -0.7 -0.4 -0.2 -0.4Automobile ownership (million) 4.4 10 21 52 70 96 130 7.4 4.3 3.3 3.0 3.4Automobile ownership rates*6 13 24 41 87 109 139 177 5.9 3.2 2.4 2.5 2.6*1 Trade of electricity and heat are not shown, *2 Excludes emission reduction by CCS, *3 toe/$2010 million,*4 t/$2010 million, *5 t/toe, *6 Vehicles per 1,000 people
IEEJ:February 2016 © IEEJ2016

Annex
Asia/World Energy Outlook 2015 Annex-186
Table A68 United States [Advanced Technologies Scenario] Primary energy consumption
Mtoe Shares (%) CAGR (%)
1990/ 2013/ 2020/ 2030/ 2013/1980 1990 2000 2013 2020 2030 2040 1990 2013 2040 2013 2020 2030 2040 2040
Total*1 1,805 1,915 2,273 2,188 2,130 1,988 1,755 100 100 100 0.6 -0.4 -0.7 -1.2 -0.8Coal 376 460 534 432 348 238 128 24 20 7.3 -0.3 -3.1 -3.7 -6.0 -4.4Oil 797 757 871 780 739 641 523 40 36 30 0.1 -0.8 -1.4 -2.0 -1.5Natural gas 477 438 548 610 626 595 492 23 28 28 1.4 0.4 -0.5 -1.9 -0.8Nuclear 69 159 208 214 216 223 252 8.3 9.8 14 1.3 0.1 0.3 1.2 0.6Hydro 24 23 22 23 24 25 25 1.2 1.1 1.4 0.0 0.6 0.2 0.1 0.3Geothermal 4.6 14 13 8.6 21 44 56 0.7 0.4 3.2 -2.1 13.9 7.4 2.4 7.1Solar, wind, etc. - 0.3 2.1 18 37 73 118 0.0 0.8 6.7 19.0 11.1 7.1 5.0 7.3Biomass and waste 54 62 73 97 113 145 157 3.3 4.4 9.0 2.0 2.2 2.5 0.8 1.8
Final energy consumptionMtoe Shares (%) CAGR (%)
1990/ 2013/ 2020/ 2030/ 2013/1980 1990 2000 2013 2020 2030 2040 1990 2013 2040 2013 2020 2030 2040 2040
Total 1,311 1,294 1,546 1,495 1,467 1,380 1,228 100 100 100 0.6 -0.3 -0.6 -1.2 -0.7Industry 387 284 332 261 256 232 203 22 17 16 -0.4 -0.3 -1.0 -1.3 -0.9Transport 425 488 588 608 594 551 477 38 41 39 1.0 -0.3 -0.8 -1.4 -0.9Buildings, etc. 397 403 473 507 491 457 405 31 34 33 1.0 -0.5 -0.7 -1.2 -0.8Non-energy use 102 119 153 119 125 140 144 9.2 8.0 12 0.0 0.7 1.1 0.2 0.7Coal 56 56 33 22 24 20 16 4.3 1.5 1.3 -3.9 0.9 -1.7 -2.3 -1.3Oil 689 683 793 731 688 597 487 53 49 40 0.3 -0.9 -1.4 -2.0 -1.5Natural gas 337 303 360 333 338 312 276 23 22 23 0.4 0.2 -0.8 -1.2 -0.7Electricity 174 226 301 325 330 337 323 18 22 26 1.6 0.2 0.2 -0.4 0.0Heat - 2.2 5.3 5.9 6.2 5.7 5.1 0.2 0.4 0.4 4.5 0.7 -0.8 -1.0 -0.5Hydrogen - - - - 0.0 4.5 8.4 - - 0.7 n.a. n.a. 67.8 6.4 n.a.Renewables 54 23 54 77 80 104 112 1.8 5.2 9.1 5.4 0.4 2.7 0.7 1.4
Electricity generation(TWh) Shares (%) CAGR (%)
1990/ 2013/ 2020/ 2030/ 2013/1980 1990 2000 2013 2020 2030 2040 1990 2013 2040 2013 2020 2030 2040 2040
Total 2,427 3,203 4,026 4,287 4,354 4,465 4,310 100 100 100 1.3 0.2 0.3 -0.4 0.0Coal 1,243 1,700 2,129 1,712 1,395 967 489 53 40 11 0.0 -2.9 -3.6 -6.6 -4.5Oil 263 131 118 37 28 17 6.3 4.1 0.9 0.1 -5.4 -3.8 -5.0 -9.4 -6.3Natural gas 370 382 634 1,158 1,230 1,241 877 12 27 20 4.9 0.9 0.1 -3.4 -1.0Nuclear 266 612 798 822 830 855 965 19 19 22 1.3 0.1 0.3 1.2 0.6Hydro 279 273 253 271 283 290 293 8.5 6.3 6.8 0.0 0.6 0.2 0.1 0.3Geothermal 5.4 16 15 18 46 94 119 0.5 0.4 2.8 0.6 13.8 7.5 2.4 7.1Solar, wind, etc. - 3.7 6.4 190 410 834 1,370 0.1 4.4 32 18.6 11.6 7.4 5.1 7.6Biomass and waste 0.5 86 72 78 132 167 192 2.7 1.8 4.5 -0.4 7.8 2.3 1.4 3.4
Energy and economic indicatorsCAGR (%)
1990/ 2013/ 2020/ 2030/ 2013/1980 1990 2000 2013 2020 2030 2040 2013 2020 2030 2040 2040
GDP ($2010 billion) 6,514 9,056 12,713 15,902 18,932 23,986 28,725 2.5 2.5 2.4 1.8 2.2Population (million) 227 250 282 316 332 355 373 1.0 0.7 0.6 0.5 0.6CO2 emissions*2 (Mt) 4,743 4,820 5,617 5,184 4,744 3,893 2,848 0.3 -1.3 -2.0 -3.1 -2.2GDP per capita ($2010 thousand) 29 36 45 50 57 68 77 1.4 1.8 1.7 1.3 1.6Primary energy consump. per capita (toe) 7.9 7.7 8.1 6.9 6.4 5.6 4.7 -0.4 -1.1 -1.3 -1.7 -1.4Primary energy consumption per GDP*3 277 211 179 138 113 83 61 -1.9 -2.8 -3.0 -3.0 -3.0CO2 emissions per GDP*2, *4 728 532 442 326 251 162 99 -2.1 -3.7 -4.3 -4.8 -4.3CO2 per primary energy consumption*2, *5 2.6 2.5 2.5 2.4 2.2 2.0 1.6 -0.3 -0.9 -1.3 -1.9 -1.4Automobile ownership (million) 156 189 221 253 272 301 323 1.3 1.1 1.0 0.7 0.9Automobile ownership rates*6 686 756 785 799 819 848 867 0.2 0.3 0.3 0.2 0.3*1 Trade of electricity and heat are not shown, *2 Excludes emission reduction by CCS, *3 toe/$2010 million,*4 t/$2010 million, *5 t/toe, *6 Vehicles per 1,000 people
IEEJ:February 2016 © IEEJ2016

Annex
Asia/World Energy Outlook 2015 Annex-187
Table A69 European Union [Advanced Technologies Scenario] Primary energy consumption
Mtoe Shares (%) CAGR (%)
1990/ 2013/ 2020/ 2030/ 2013/1980 1990 2000 2013 2020 2030 2040 1990 2013 2040 2013 2020 2030 2040 2040
Total*1 n.a. 1,645 1,692 1,626 1,578 1,471 1,324 100 100 100 -0.1 -0.4 -0.7 -1.0 -0.8Coal n.a. 456 321 286 232 168 127 28 18 9.6 -2.0 -3.0 -3.1 -2.7 -3.0Oil n.a. 606 623 513 463 395 326 37 32 25 -0.7 -1.5 -1.6 -1.9 -1.7Natural gas n.a. 297 396 387 378 336 282 18 24 21 1.2 -0.3 -1.2 -1.7 -1.2Nuclear n.a. 207 246 229 233 263 255 13 14 19 0.4 0.3 1.2 -0.3 0.4Hydro n.a. 25 31 32 32 33 33 1.5 2.0 2.5 1.1 0.3 0.2 0.0 0.1Geothermal n.a. 3.2 4.6 5.9 7.3 10 12 0.2 0.4 0.9 2.7 3.1 3.5 1.3 2.6Solar, wind, etc. n.a. 0.3 2.4 31 47 64 80 0.0 1.9 6.0 23.2 6.3 3.0 2.3 3.6Biomass and waste n.a. 47 66 140 183 199 205 2.8 8.6 15 4.9 3.9 0.8 0.3 1.4
Final energy consumptionMtoe Shares (%) CAGR (%)
1990/ 2013/ 2020/ 2030/ 2013/1980 1990 2000 2013 2020 2030 2040 1990 2013 2040 2013 2020 2030 2040 2040
Total n.a. 1,130 1,176 1,139 1,109 1,017 904 100 100 100 0.0 -0.4 -0.9 -1.2 -0.9Industry n.a. 343 308 258 261 252 236 30 23 26 -1.2 0.2 -0.3 -0.6 -0.3Transport n.a. 259 304 303 290 250 207 23 27 23 0.7 -0.6 -1.5 -1.9 -1.4Buildings, etc. n.a. 429 453 478 447 398 341 38 42 38 0.5 -1.0 -1.1 -1.5 -1.2Non-energy use n.a. 99 111 100 111 117 120 8.7 8.8 13 0.1 1.6 0.5 0.2 0.7Coal n.a. 122 52 38 35 29 23 11 3.4 2.6 -4.9 -1.2 -1.8 -2.1 -1.8Oil n.a. 503 540 463 420 359 296 45 41 33 -0.4 -1.4 -1.6 -1.9 -1.7Natural gas n.a. 226 272 266 262 244 215 20 23 24 0.7 -0.2 -0.7 -1.2 -0.8Electricity n.a. 186 218 238 246 246 239 16 21 26 1.1 0.5 0.0 -0.3 0.0Heat n.a. 54 45 48 45 41 36 4.8 4.2 3.9 -0.5 -0.8 -1.1 -1.4 -1.1Hydrogen n.a. - - - n.a. n.a. n.a. - - n.a. n.a. n.a. n.a. n.a. n.a.Renewables n.a. 39 49 85 100 98 95 3.5 7.5 11 3.5 2.4 -0.2 -0.3 0.4
Electricity generation(TWh) Shares (%) CAGR (%)
1990/ 2013/ 2020/ 2030/ 2013/1980 1990 2000 2013 2020 2030 2040 1990 2013 2040 2013 2020 2030 2040 2040
Total n.a. 2,576 3,005 3,230 3,349 3,394 3,344 100 100 100 1.0 0.5 0.1 -0.1 0.1Coal n.a. 1,050 968 905 715 493 355 41 28 11 -0.6 -3.3 -3.6 -3.2 -3.4Oil n.a. 224 181 61 39 21 12 8.7 1.9 0.4 -5.5 -6.1 -6.1 -5.4 -5.9Natural gas n.a. 193 480 507 498 386 267 7.5 16 8.0 4.3 -0.3 -2.5 -3.6 -2.4Nuclear n.a. 795 945 877 893 1,010 979 31 27 29 0.4 0.3 1.2 -0.3 0.4Hydro n.a. 290 356 371 378 384 384 11 11 11 1.1 0.3 0.2 0.0 0.1Geothermal n.a. 3.2 4.8 5.9 7.5 11 12 0.1 0.2 0.4 2.7 3.4 3.7 1.3 2.7Solar, wind, etc. n.a. 1.3 24 324 533 730 923 0.1 10 28 27.1 7.4 3.2 2.4 4.0Biomass and waste n.a. 20 46 178 285 358 410 0.8 5.5 12 10.1 7.0 2.3 1.3 3.1
Energy and economic indicatorsCAGR (%)
1990/ 2013/ 2020/ 2030/ 2013/1980 1990 2000 2013 2020 2030 2040 2013 2020 2030 2040 2040
GDP ($2010 billion) n.a. 11,862 14,721 17,159 19,411 22,767 25,759 1.6 1.8 1.6 1.2 1.5Population (million) n.a. 478 488 507 516 523 526 0.3 0.3 0.1 0.0 0.1CO2 emissions*2 (Mt) n.a. 4,068 3,783 3,320 2,894 2,318 1,811 -0.9 -1.9 -2.2 -2.4 -2.2GDP per capita ($2010 thousand) n.a. 25 30 34 38 44 49 1.4 1.5 1.5 1.2 1.4Primary energy consump. per capita (toe) n.a. 3.4 3.5 3.2 3.1 2.8 2.5 -0.3 -0.7 -0.8 -1.1 -0.9Primary energy consumption per GDP*3 n.a. 139 115 95 81 65 51 -1.6 -2.2 -2.3 -2.3 -2.2CO2 emissions per GDP*2, *4 n.a. 343 257 193 149 102 70 -2.5 -3.7 -3.7 -3.6 -3.7CO2 per primary energy consumption*2, *5 n.a. 2.5 2.2 2.0 1.8 1.6 1.4 -0.8 -1.5 -1.5 -1.4 -1.5Automobile ownership (million) n.a. 177 235 294 319 345 358 2.2 1.2 0.8 0.4 0.7Automobile ownership rates*6 n.a. 371 482 580 619 660 681 2.0 0.9 0.6 0.3 0.6*1 Trade of electricity and heat are not shown, *2 Excludes emission reduction by CCS, *3 toe/$2010 million,*4 t/$2010 million, *5 t/toe, *6 Vehicles per 1,000 people
IEEJ:February 2016 © IEEJ2016
Annex
Asia/World Energy Outlook 2015 Annex-188
IEEJ:February 2016 © IEEJ2016
Contact :[email protected]