effects of low oil prices - u.s. energy information ... and projected oil prices effects of low oil...
TRANSCRIPT
www.eia.gov U.S. Energy Information Administration Independent Statistics & Analysis
Effects of low oil prices
February 12, 2015 | Washington, DC By Adam Sieminski U.S. Energy Information Administration
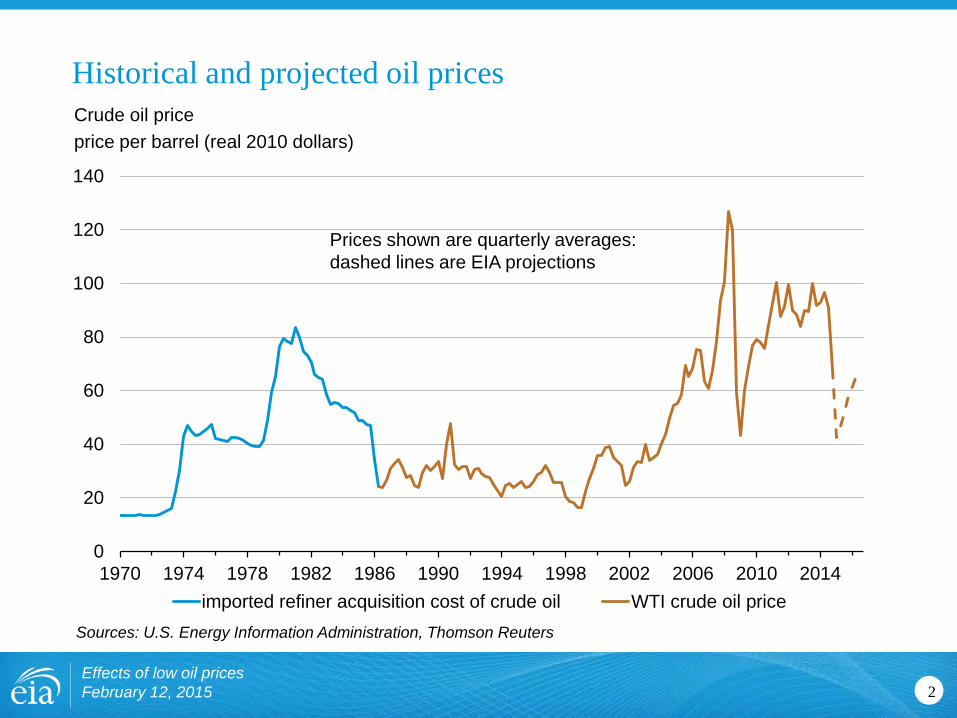
Historical and projected oil prices
Effects of low oil prices February 12, 2015 2
Crude oil price price per barrel (real 2010 dollars)
Sources: U.S. Energy Information Administration, Thomson Reuters
0
20
40
60
80
100
120
140
1970 1974 1978 1982 1986 1990 1994 1998 2002 2006 2010 2014imported refiner acquisition cost of crude oil WTI crude oil price
Prices shown are quarterly averages: dashed lines are EIA projections

Key takeaways Oil prices: EIA’s forecast for Brent averages $58/b in 2015 and $75/b in 2016. The market-implied 95% confidence band for Brent (estimated from WTI futures and options prices) is extremely wide – with a range from $35/b to $100/b across 2015-2016.
Demand: Non-OECD Asia accounts for more than 50% of forecast liquids consumption growth of roughly 1 million b/d both 2015 and 2016; lower demand growth is a major a downside risk to the price forecast
U.S. oil production: Lower-48 oil production in 4Q2015 and 1Q2016 is only slightly above its 4Q2014 level; however, offshore production continues to grow steadily
The economy and consumers: EIA’s energy forecast reflects a U.S. economic growth outlook for 2015-16 that is somewhat stronger than 2013-14 experience.
• Relatively low oil prices and increased energy efficiency Energy expenditures as a share of GDP are forecast at 6.2% in 2015, their lowest level since 2002, reflecting both lower oil prices and energy efficiency.
• Average U.S. household (20,800 miles of vehicle travel) projected gasoline spending is $750 less in 2015 than in 2014, and about $450 less in 2016 than in 2014.
Effects of low oil prices February 12, 2015 3

Brent crude oil prices were relatively stable through the first half of 2014; increased oil supply and lower global economic growth expectations lowered prices from July 2014 to January 2015
Effects of low oil prices February 12, 2015
dollars per barrel
Source: EIA, Bloomberg
4
40
50
60
70
80
90
100
110
120
Jan-2014 Apr-2014 Jul-2014 Oct-2014 Jan-2015
Brent front month futures…
Potential disruption in Russian oil/gas exports
Potential disruption in Iraq oil production
Lowered global economic growth expectations for 2014 and 2015
Increased U.S. production and uncertainty over OPEC future production quotas
November OPEC meeting resulted in no production quota changes
Lowered risk of oil supply outages in Iraq
Stable demand and supply outlooks
Higher, sustained Libyan oil production

Oil prices rise from mid-2015 through mid-2016 in EIA’s forecast – however, the market-implied confidence band is very wide
Effects of low oil prices February 12, 2015 5
WTI price dollars per barrel
Source: EIA, Short-Term Energy Outlook, February 2015
0
25
50
75
100
125
150
Jan Apr Jul Oct Jan Apr Jul Oct Jan Apr Jul Oct Jan Apr Jul Oct
Historical Spot Price
STEO Forecast
NYMEX Futures Price
2013 2014 2015 2016
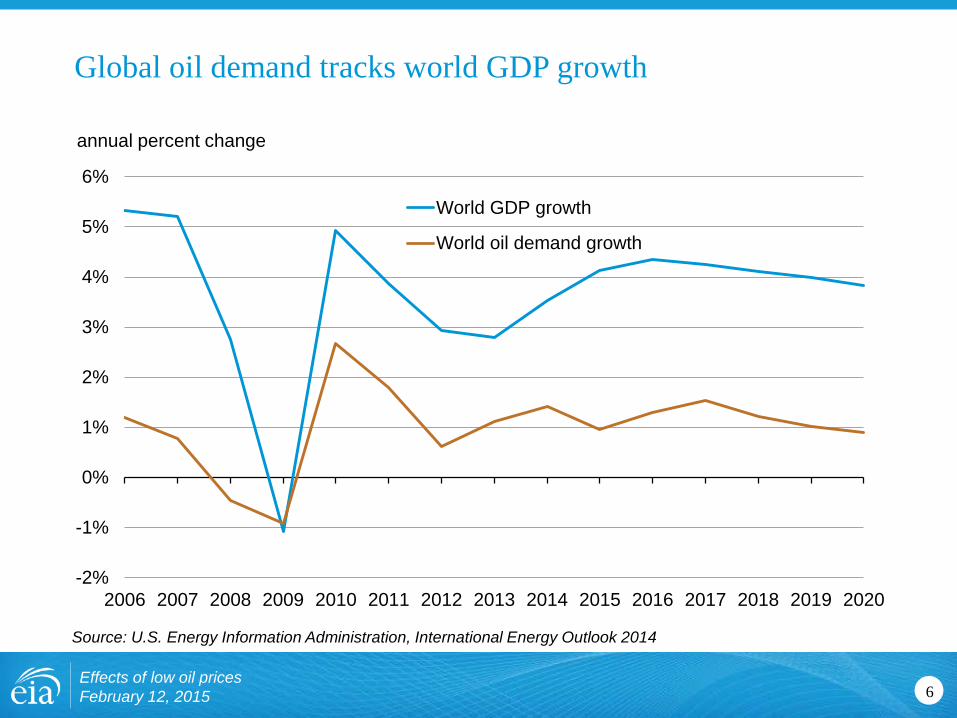
Global oil demand tracks world GDP growth
Effects of low oil prices February 12, 2015 6
annual percent change
Source: U.S. Energy Information Administration, International Energy Outlook 2014
-2%
-1%
0%
1%
2%
3%
4%
5%
6%
2006 2007 2008 2009 2010 2011 2012 2013 2014 2015 2016 2017 2018 2019 2020
World GDP growth
World oil demand growth

Global liquids consumption growth is forecast at 1.0 million bbl/d in both 2015 and 2016
Effects of low oil prices February 12, 2015
Forecast
-2
-1
0
1
2
3
4
5
6
7
8
76
78
80
82
84
86
88
90
92
94
96
2008 2009 2010 2011 2012 2013 2014 2015 2016
Change in U.S. consumption (right axis)Change in China consumption (right axis)Change in other consumption (right axis)Total world consumption (left axis)
Source: EIA, Short-Term Energy Outlook, February 2015
World liquid fuels consumption million barrels per day
annual change million barrels per day
7

Effects of low oil prices February 12, 2015
U.S. gasoline demand to increase by about 1% in 2015
8
-4%
-3%
-2%
-1%
0%
1%
2%
3%
4%
5%
year over year quarterly U.S. gasoline demand growth
2010 2013 2012 2011 2015 2014 2016
forecast
percent change
Source: U.S. Energy Information Administration, February Short-Term Energy Outlook

dollars per barrel thousand barrels per day
Sources: Department of Mineral Resources, State of North Dakota, Bloomberg
Effects of low oil prices February 12, 2015
Experience during the 2008-09 suggests only a modest shale oil production response to a short-term decline in oil prices
0
40
80
120
160
200
240
280
0
20
40
60
80
100
120
140
Jan-08 Jul-08 Jan-09 Jul-09 Jan-10
ND Production WTI
9

North American oil production growth slows with lower oil prices but remains the main driver of global production growth
Effects of low oil prices February 12, 2015
-0.5
0.0
0.5
1.0
1.5
2.0
2014 2015 2016OPEC countries North America Russia and Caspian Sea
Latin America North Sea Other Non-OPEC
Forecast
World crude oil and liquid fuels production growth million barrels per day
Source: EIA, Short-Term Energy Outlook, February 2015
10
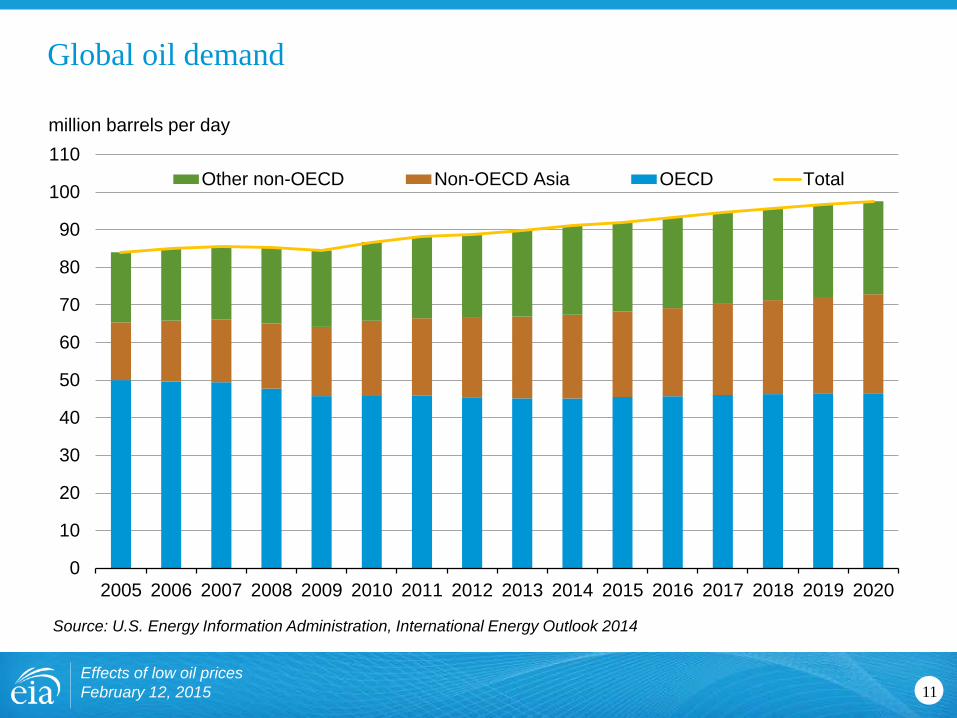
Global oil demand
Effects of low oil prices February 12, 2015 11
million barrels per day
Source: U.S. Energy Information Administration, International Energy Outlook 2014
0
10
20
30
40
50
60
70
80
90
100
110
2005 2006 2007 2008 2009 2010 2011 2012 2013 2014 2015 2016 2017 2018 2019 2020
Other non-OECD Non-OECD Asia OECD Total

Effects of low oil prices February 12, 2015
Source: EIA, International Monetary Fund (IMF), individual country investment authorities
Gov’t deficits, high reliance on oil revenue, and asset coverage of gov’t spending are indicators of geopolitical stress exposure
more risk
less risk
0
5
10
15
20
25
30
35
40
45
asset coverage (months of 2013 gov’t spending)
Algeria
Angola
Ecuador
Iraq Libya
Nigeria
Qatar
Saudi Arabia
Venezuela
Russia
20
30
40
50
60
70
80
90
100
-20 -10 0 10 20
oil revenue (% of total gov’t revenue)
gov’t budget deficit/surplus (% of GDP)
more risk
less risk
12

Various events could lead to changes in global supply or demand that could push future crude oil prices higher or lower than the STEO forecast
Effects of low oil prices February 12, 2015
Increase Prices
Decrease Prices
Event Social unrest in Venezuela leads to supply disruptions
ISIL disrupts Iraqi exports
Iranian sanctions are tightened
Social unrest in oil-dependent countries leads to supply disruptions
OPEC cuts output more than projected
World economic growth is lower than projected (e.g., China)
Saudi Arabia keeps production at 9.6-9.7 million bbl/d in 2016
Reduction in unplanned production outages
Iranian sanctions are lifted
13
Lower oil prices are expected to provide an immediate boost to the economy • Starting from a base price of roughly $100 per barrel, a $10 drop in oil
prices sustained for four quarters is estimated to raise real GDP by about 0.22% above baseline; if the drop in oil prices is sustained for a second year, the level of real GDP in that year averages 0.34% above baseline
• Estimated GDP impacts presented above are roughly scalable for drops of $20 or $30 per barrel; in the latter case the average level of GDP in the second year would be roughly 1% above baseline.
• If oil prices drop and then return to previous levels, GDP begins to return as well; the speed in which GDP adjusts depends on the oil price trajectory
• Estimated percentage impacts of an oil price drop on consumer prices and unemployment are generally smaller than impacts on GDP, and also tend to decrease in the second year as increased demand puts pressure on prices of other goods
Effects of low oil prices February 12, 2015 14
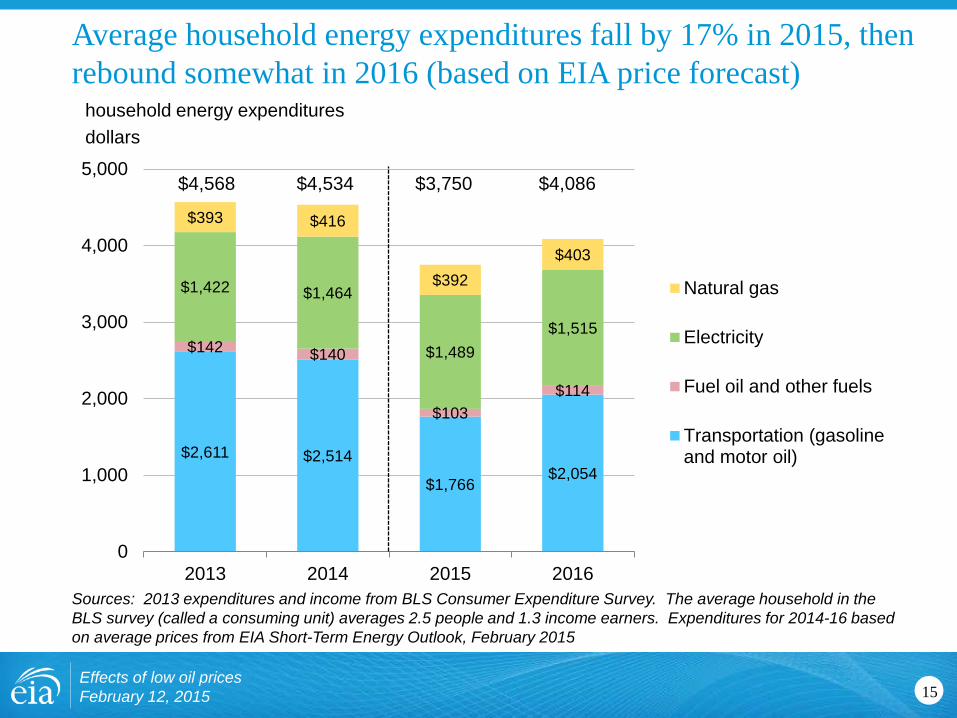
household energy expenditures dollars
Sources: 2013 expenditures and income from BLS Consumer Expenditure Survey. The average household in the BLS survey (called a consuming unit) averages 2.5 people and 1.3 income earners. Expenditures for 2014-16 based on average prices from EIA Short-Term Energy Outlook, February 2015
15
Average household energy expenditures fall by 17% in 2015, then rebound somewhat in 2016 (based on EIA price forecast)
$2,611 $2,514
$1,766 $2,054
$142 $140
$103 $114
$1,422 $1,464
$1,489 $1,515
$393 $416
$392 $403
0
1,000
2,000
3,000
4,000
5,000
2013 2014 2015 2016
Natural gas
Electricity
Fuel oil and other fuels
Transportation (gasolineand motor oil)
$4,568 $4,534 $3,750 $4,086
Effects of low oil prices February 12, 2015
Long-term scenarios Our preliminary analysis contrasts a sustained lower price case (LPC), real prices in the neighborhood of $70 per barrel through 2040, with a higher price case (HPC) where real prices rise steadily towards $150 per barrel in 2040.
• While temporarily lower oil prices are expected to have only a small impact on the level of domestic oil production through 2020, projected long-term U.S. crude oil production in the LPC is well below the HPC outlook
• Projected U.S. net dependence on imported oil in 2040 widens from about 15% in the HPC to 35-40% in the LPC
• Projected natural gas supply growth is much lower in the LPC than in the HPC, reflecting both lower coproduction supply and lower demand for LNG exports
• Sustained lower world oil prices significantly affects the economics of U.S. LNG exports; in the LPC there are no new liquefaction plant starts beyond those already under construction
• Energy-related carbon dioxide emissions in 2040 are roughly 200 MMT above their projected HPC level in the LPC
Effects of low oil prices February 12, 2015 16


Supplemental Slides
18 Effects of low oil prices February 12, 2015

U.S. regional refinery capacity and complexity
19 Effects of low oil prices February 12, 2015
Note: As of January 1, 2014, there were 133 operating refineries with atmospheric crude oil distillation units (ACDU) totaling capacity of 18.9 million barrels per stream day. Heavy capacity denotes refineries with coking capacity; light capacity denotes refineries without coking capacity. Source: U.S. Energy Information Administration
West Coast million barrels per day
Rocky Mountain million barrels per day
Midwest million barrels per day
Gulf Coast million barrels per day
East Coast million barrels per day
1.0 0.4
No coker Withcoker
1.2
2.9
No coker Withcoker
0.3
0.4
No coker Withcoker
1.0
2.0
No coker Withcoker
1.9
7.8
No coker Withcoker
Refineries with a coker Refineries with no coker
Refinery Designation

Effects of low oil prices February 12, 2015
Projected U.S. Refinery Projects Through 2019
20
Crude Capacity Changes Unit Capacities in Thousands of Barrels per Day
State Company Location Expected Completion Heavy Medium Light Sour Light
Sweet Total
OH Marathon Canton 2014 25 25
ND Calumet / MDU Resources Dickinson 2014 20 20
KY Marathon Catlettsburg 2015 35 35
IL Marathon Robinson 2016 30 30
OH Husky Lima 2017 40 (40) 0
KS NCRA McPherson 2018 30 (15) 15
70 0 0 55 125
PADD 2
State Company Location Expected Completion Heavy Medium Light
Sour Light Sweet Total
TX Calumet San Antonio 2014 3 3
TX Flint Hills Corpus Christi 2014 (30) 30 0
LA Marathon Garyville 2014 10 5 5 20
TX Delek Tyler 2015 12 12
TX Valero Energy Corpus Christi 2015 70 70
TX Valero Energy Houston 2015 90 90
TX Valero Energy McKee 2015 25 25
TX Marathon Galveston Bay 2015 (25) 25 0 10 (20) (25) 255 220
PADD 3
Source: Turner, Mason & Company

Effects of low oil prices February 12, 2015
Projected U.S. Refinery Projects Through 2019
21
Crude Capacity Changes Unit Capacities in Thousands of Barrels per Day
State Company Location Expected Completion Heavy Medium Light Sour Light Sweet Total
NJ Axeon Specialty Paulsboro 2014 (35) 35 0
(35) 0 0 35 0
PADD 1
State Company Location Expected Completion Heavy Medium Light Sour Light Sweet Total
UT Tesoro Salt Lake City 2015 4 4
UT HollyFrontier Woods Cross 2015 14 14
MT Calumet Great Falls 2015 10 10
UT HollyFrontier Woods Cross 2017 15 15
MT CHS Laurel 2019 25 25
10 0 0 58 68
PADD 4
Source: Turner, Mason & Company
State Company Location Expected Completion Heavy Medium Light Sour Light Sweet Total
CA Chevron Richmond 2017 20 (20) 0
AK AIDEA Mustang 2018 3 3
20 (17) 0 0 3
PADD 5
Effects of low oil prices February 12, 2015 22
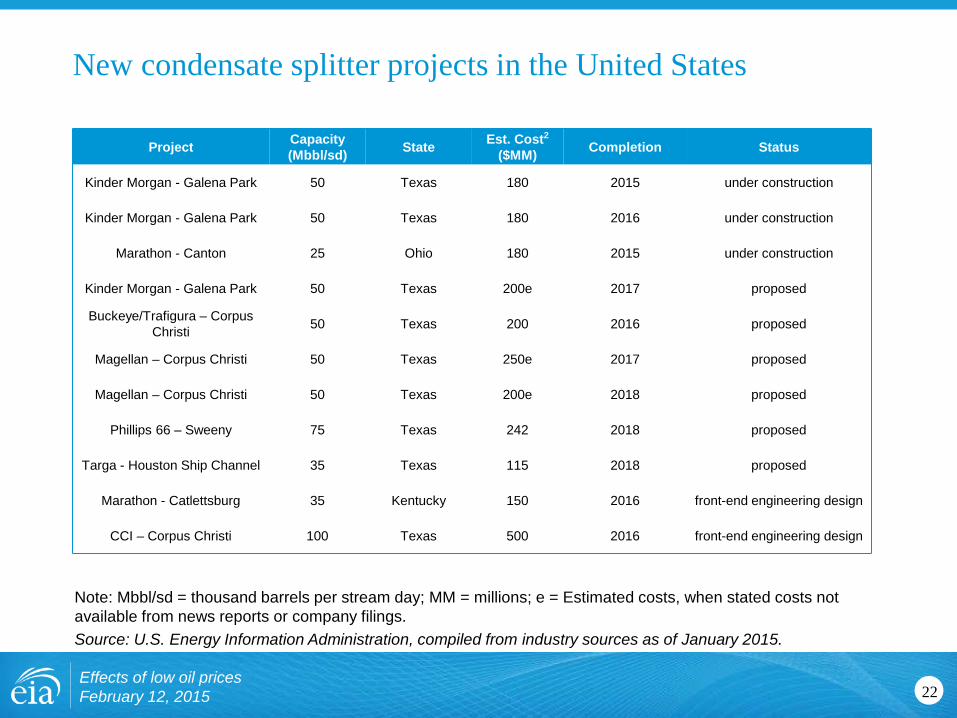
Note: Mbbl/sd = thousand barrels per stream day; MM = millions; e = Estimated costs, when stated costs not available from news reports or company filings. Source: U.S. Energy Information Administration, compiled from industry sources as of January 2015.
New condensate splitter projects in the United States
Project Capacity (Mbbl/sd) State Est. Cost2
($MM) Completion Status
Kinder Morgan - Galena Park 50 Texas 180 2015 under construction
Kinder Morgan - Galena Park 50 Texas 180 2016 under construction
Marathon - Canton 25 Ohio 180 2015 under construction
Kinder Morgan - Galena Park 50 Texas 200e 2017 proposed
Buckeye/Trafigura – Corpus Christi 50 Texas 200 2016 proposed
Magellan – Corpus Christi 50 Texas 250e 2017 proposed
Magellan – Corpus Christi 50 Texas 200e 2018 proposed
Phillips 66 – Sweeny 75 Texas 242 2018 proposed
Targa - Houston Ship Channel 35 Texas 115 2018 proposed
Marathon - Catlettsburg 35 Kentucky 150 2016 front-end engineering design
CCI – Corpus Christi 100 Texas 500 2016 front-end engineering design

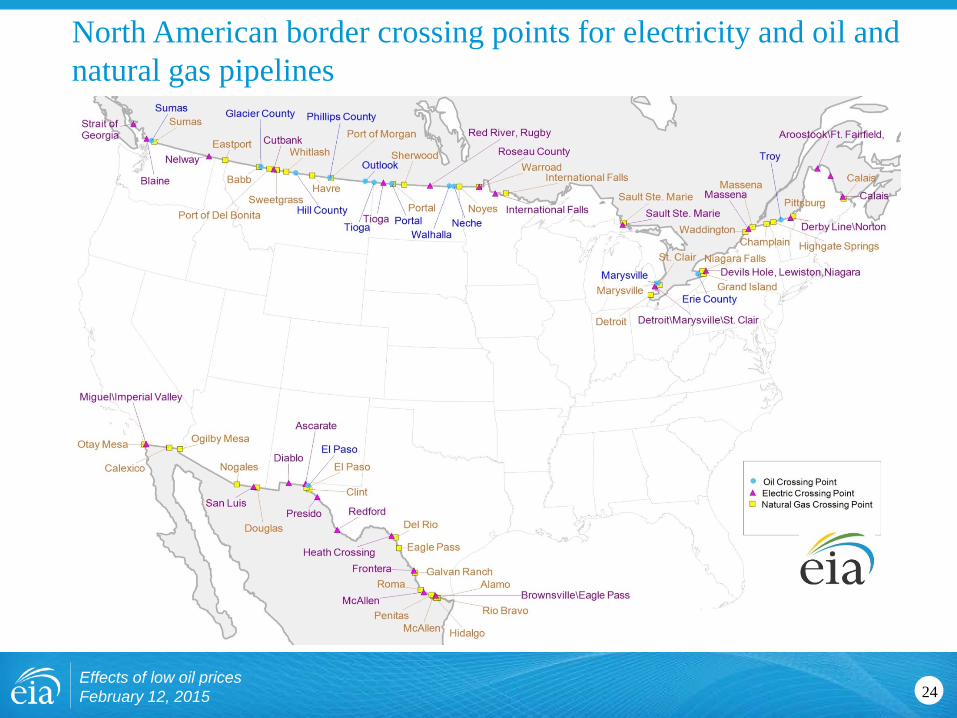
Tri-lateral cooperation: Canada, Mexico, & United States memorandum of understanding signed 12/15/2014 1) Reconciliation of import and export information on energy flows. The working group would develop a cross reference for terminology and a table of conversion factors across the three countries. EIA would propose subcategories of+ crude oil, refined products, natural gas and electricity.
2) GIS mapping. The working group would establish a standard format, sourcing protocols and a mechanism for file/data sharing. Each party would provide its public map layers to each partner, while asking them to provide theirs. It would then be up to each party to decide if and how they want to display the information they receive from the other parties.
3) Outlooks for crossborder flows of fuels. EIA would propose that we begin by sharing information among the three partners regarding recent historical data and outlooks for cross border flows of oil, natural gas, and electricity. The information exchange would also provide some brief information on broader energy measures -- production and consumption of the energy commodities – as well as information on some of the key outlook drivers – economic and population growth.
Effects of low oil prices February 12, 2015 23
Effects of low oil prices February 12, 2015
North American border crossing points for electricity and oil and natural gas pipelines
24

dollars per barrel index value
Source: EIA, Bloomberg
Effects of low oil prices February 12, 2015
Oil and currency markets reflect expectations for lower global economic growth
25
76
78
80
82
84
86
88
90
92
94
96
30
40
50
60
70
80
90
100
110
120
130
Jan-14 Mar-14 May-14 Jul-14 Sep-14 Nov-14 Jan-15
Brent front month price U.S. dollar index
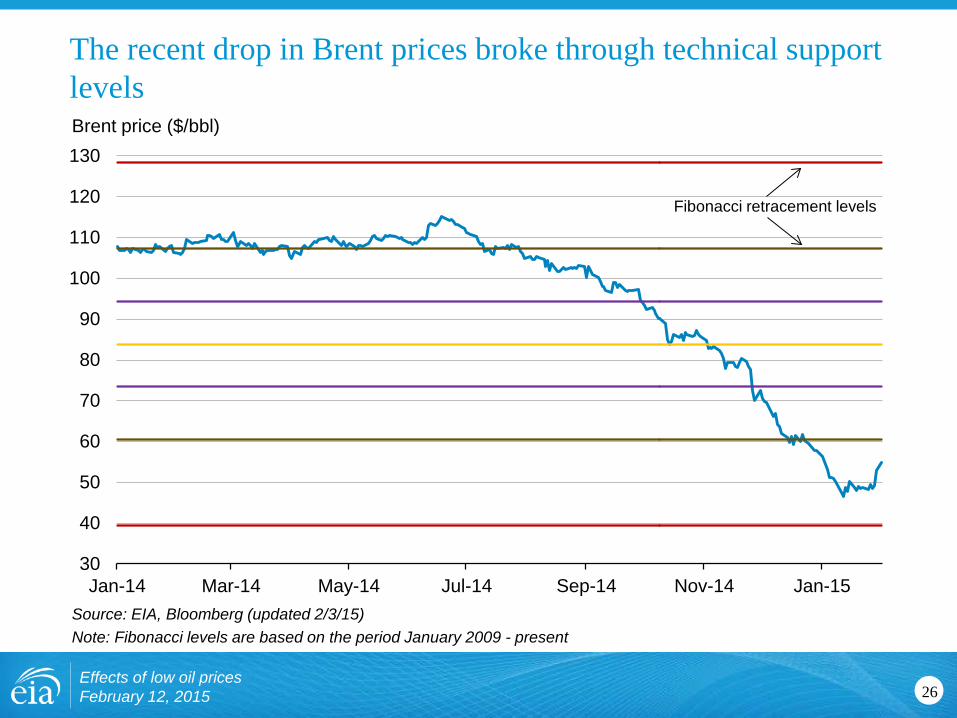
The recent drop in Brent prices broke through technical support levels
Effects of low oil prices February 12, 2015
Brent price ($/bbl)
Source: EIA, Bloomberg (updated 2/3/15) Note: Fibonacci levels are based on the period January 2009 - present
26
30
40
50
60
70
80
90
100
110
120
130
Jan-14 Mar-14 May-14 Jul-14 Sep-14 Nov-14 Jan-15
Fibonacci retracement levels
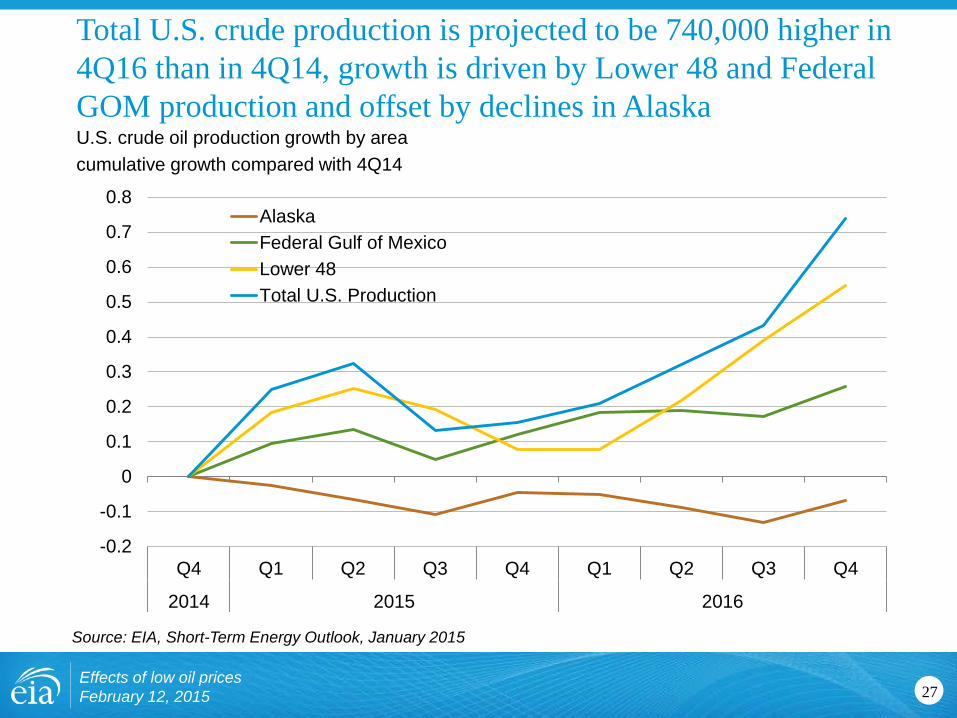
U.S. crude oil production growth by area cumulative growth compared with 4Q14
Source: EIA, Short-Term Energy Outlook, January 2015
Effects of low oil prices February 12, 2015
Total U.S. crude production is projected to be 740,000 higher in 4Q16 than in 4Q14, growth is driven by Lower 48 and Federal GOM production and offset by declines in Alaska
-0.2
-0.1
0
0.1
0.2
0.3
0.4
0.5
0.6
0.7
0.8
Q4 Q1 Q2 Q3 Q4 Q1 Q2 Q3 Q4
2014 2015 2016
AlaskaFederal Gulf of MexicoLower 48Total U.S. Production
27

Henry Hub spot prices are expected to average $3.05/million Btu in 2015 and $3.47/million Btu in 2016
28
Source: EIA, Short-Term Energy Outlook, February 2015
0
1
2
3
4
5
6
7
Jan Apr Jul Oct Jan Apr Jul Oct Jan Apr Jul Oct Jan Apr Jul Oct
Historical Spot PriceSTEO ForecastNYMEX Futures Price95% NYMEX futures price confidence interval
2013 2014 2015 2016
Henry Hub spot price dollars per million Btu
Effects of low oil prices February 12, 2015

Natural gas production is expected to increase by 2.4 bcf/day in 2015 and by 1.8 bcf/day in 2016
Effects of low oil prices February 12, 2015
Source: EIA, Short-Term Energy Outlook, February 2015
-2-1012345678
2013 2014 2015 20166062646668707274767880
Federal Gulf of Mexico production (right axis)U.S. non-Gulf of Mexico production (right axis)U.S. net imports (right axis)Total marketed production (left axis)Marketed production forecast (left axis)
U.S. natural gas production and imports billion cubic feet per day
annual change billion cubic feet per day
29

Natural gas consumption billion cubic feet per day
annual change billion cubic feet per day
Effects of low oil prices February 12, 2015
Industrial and power sectors drive natural gas consumption growth in the forecast
-3-2-1012345678
2013 2014 2015 20160
102030405060708090
100110
Electric power (right axis) Residential and comm. (right axis)Industrial (right axis) Other (right axis)Total consumption (left axis) Consumption forecast (left axis)
Source: EIA, Short-Term Energy Outlook, February 2015
30

For more information
Effects of low oil prices February 12, 2015 31
U.S. Energy Information Administration home page | www.eia.gov
Annual Energy Outlook | www.eia.gov/aeo
Short-Term Energy Outlook | www.eia.gov/steo
International Energy Outlook | www.eia.gov/ieo
Monthly Energy Review | www.eia.gov/mer
Today in Energy | www.eia.gov/todayinenergy
State Energy Profiles | http://www.eia.gov/state
Drilling Productivity Report | http://www.eia.gov/petroleum/drilling/