askari ar2010 (final version)
TRANSCRIPT
Annual Report for the year ended December 31, 2010
Banking...made easy
Contents
04 19 Years of Banking06 Vision & Mission 08 Products & Services12 Corporate Philosophy16 Corporate Information 17 Directors’ Profile20 Board Committees21 Management Committees24 Notice of 19th Annual General Meeting28 Management 29 Organogram30 Risk Management Framework 31 Entity Ratings 32 Corporate Social Responsibility 34 President’s Message 36 Information Technology Initiatives38 Value Added Statement 39 Our Network 40 Financial Review 42 Financial Calendar 43 Share & Debt Information 44 Horizontal & Vertical Analysis46 Six Years Performance 48 Directors’ Report
Unconsolidated Financial Statements ofAskari Bank Limited
63 Statement of Compliance 65 Review Report to the Members 66 Auditors’ Report to the Members 68 Unconsolidated Statement of Financial Position 69 Unconsolidated Profit and Loss Account 70 Unconsolidated Statement of Other Comprehensive Income71 Unconsolidated Cash Flow Statement 72 Unconsolidated Statement of Changes in Equity 73 Notes to the Unconsolidated Financial Statements
Consolidated Financial Statements ofAskari Bank Limited and its Subsidiaries
133 Auditors’ Report to the Members 134 Consolidated Statement of Financial Position 135 Consolidated Profit and Loss Account 136 Consolidated Statement of Other Comprehensive Income137 Consolidated Cash Flow Statement 138 Consolidated Statement of Changes in Equity 139 Notes to the Consolidated Financial Statements
191 Pattern of Shareholding 192 Correspondent Network 194 Branch Network 202 Statement of Financial Position in US dollars 203 Profit and Loss Account in US dollars 204 Glossary of Financial & Banking Terms207 Form of Proxy

1
With disciplined technological
advancements, we are aiming to
unlock the value of time, unlock
the value of our systems, allowing
and enabling multi-opportunities,
multi-tasking, multi-benefits and
multi-success.

2

3
Bankinganytime, anywhere...
4
19 Years of banking
Askari Bank was incorporated in Pakistan on October 9, 1991, as a public limited company. It commenced operations on April 1, 1992, and is principally engaged in the business of banking, as defined in the Banking Companies Ordinance, 1962. The Bank is listed on Karachi, Lahore and Islamabad Stock Exchanges.
Askari Bank has since expanded into a network of 235 branches / sub-branches, including 31 dedicated Islamic banking branches, and a wholesale bank branch in Bahrain.
A shared network of 4,401 online ATMs covering all major cities in Pakistan supports the delivery channels for customer service. As at December 31, 2010, the Bank had equity of Rs. 16.0 billion and total assets of Rs. 314.7 billion, with 885,764 banking customers, serviced by our 6,442 employees.
Askari Investment Management Limited and Askari Securities Limited are subsidiaries of Askari Bank engaged in managing mutual funds and share brokerage, respectively.

55

6
Vision & Mission
Our visionTo be the bank of first choice in the region
Our missionTo be the leading bank in Pakistan with an international presence,
delivering quality service through innovative technology and
effective human resource management in a modern and
progressive organizational culture of meritocracy, maintaining
high ethical and professional standards, while providing enhanced
value to all our stakeholders, and contributing to society
7
Our thinking Creating opportunities with innovation and technology
Our vision to be the bank of first choice in the region demands continuous strive for creation of business oppor-tunities with innovation while main-taining our core values to meet our commitment to all our stakeholders.
The range of our products aims to serve our diverse customer base that comprises of corporates, SMEs, individual savers, households and, farmers. At the same time, our people are constantly engaged in assessing customer needs and market dynamics to realign our products and priori-ties to attain brand recognition and competitive edge. We are continuously reviewing and reshaping our portfolio of businesses by investing in higher growth areas, extending and developing our core competencies and moving out of weak and non–core segments.
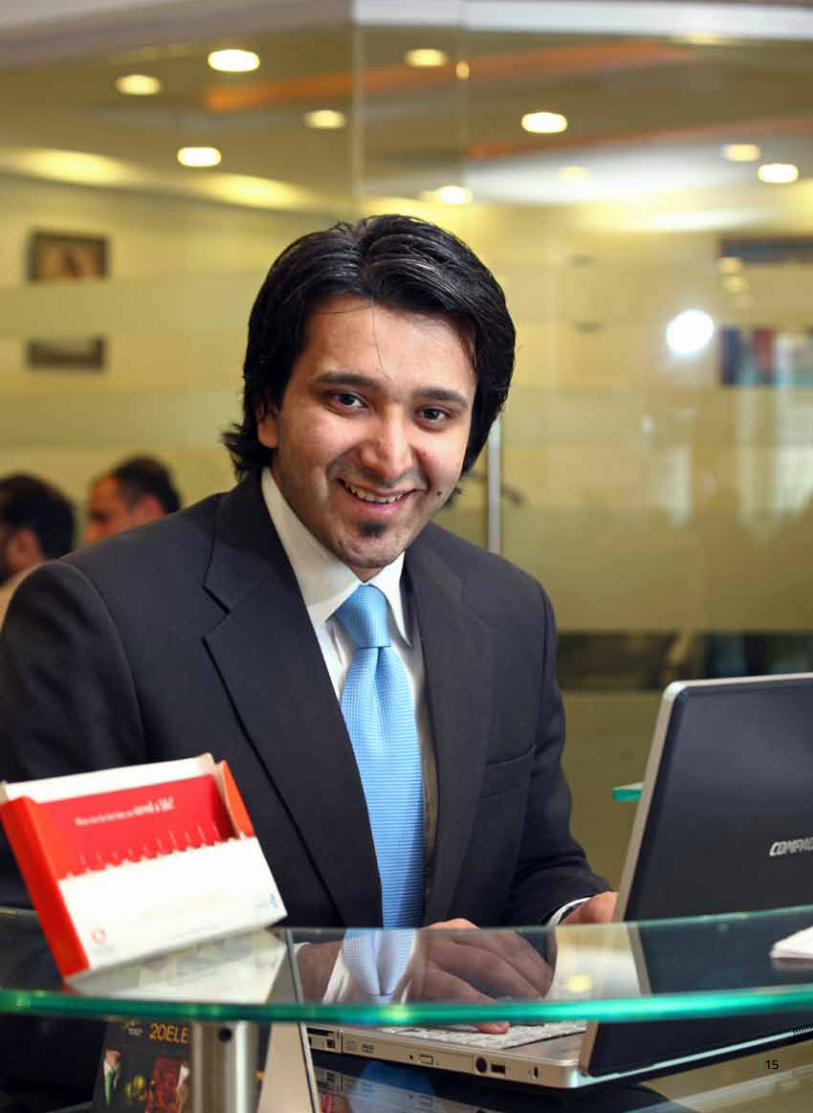
Technology has played a pivotal role in meeting customer expectations, particularly with respect to speed and quality of service. We have fully auto-mated transaction–processing systems for back–office support. Our branch network is connected on–line real–time and our customers have access to off–site as well as on–site ATMs, all over Pakistan and internationally. Our phone and internet banking facilities allows customers to enjoy routine banking service from anywhere, any-time in the world. We also pioneered an e–commerce venture in Pakistan. Our mobile ATMs are the first in Pakistan.
To further strengthen and enhance our technology platform, the Bank is in the process of replacing the exist-ing technology with a comprehensive state-of-the-art technology solutions. This process is in the advanced stage and upon complete implementation, this initiative will greatly improve our product delivery and service abilities.
Our valuesIntegrity is the most valued standard in whatever we do. We understand that our commitment to satisfy custom-ers’ needs must be fulfilled within a professional and ethical framework. We subscribe to a culture of high ethical standards, based on the development of right attitudes. The intrinsic values, which are the corner stones of our corporate behaviour, are:
• Commitment• Integrity• Fairness• Teamwork• Service
Our customersKnowing our customers and their needs is the key to our business suc-cess. Our products and services are as diverse as our market segments. Our client relationship managers are well equipped and well trained to provide the most efficient and personalized service to the customers. Askari Bank is proud of its pioneering role in provid-ing the most modern and technologi-cally advanced services to its 885,764 relationships.
Our investorsWe believe that the bottom line of any business is creating shareholder value. To gain their trust and confidence, we believe in providing our investors timely, regular and reliable information on our activities, structure, financial situation, and performance.
Our regulatorsWe firmly believe in regulatory disci-pline and harmony of our corporate objectives with regulatory framework. Our business methodologies are de-signed to ensure compliance with the directives of all our regulators.
Our employeesWe strongly believe that the interests of the Bank and the employees are inseparable. At Askari we try to create a ‘we’ culture where there is mutual trust and respect for each other. We encourage ownership behaviour so that everyone feels responsible for the performance and reputation of the Bank. We are committed to develop and enhance each employee’s skills and capabilities through extensive in–house and external training programs and job rotations. In order to ensure meritoc-racy, our appraisal system is purely performance based.
Our communitiesWe fully recognize our corporate social responsibility and our contributions to different areas of the social sector are aimed to help improve the quality of life in our Country.
CommitmentCustomers
Passionate about our customers’ suc-cess, delighting them with the quality of our service
TeamworkEmployees
Caring for our people and helping them to grow
ServiceCommunities
Dedication towards social development and improvement in quality of life
FairnessRegulators
Exemplary compli-ance, governance and business ethics
IntegrityInvestors
A distinctive invest-ment, delivering outstanding perfor-mance, return and value
8
Products & Services
Jan 01
Branch Banking
Through a widespread branch network in all major cities, towns and cantonments, made up of conventional, corporate, consumer, Islamic, as well as agricultural banking service branches, we aim to provide our customers with a wide array of offer-ings catering to all their banking needs.
Deposit Multiplier AccountDesigned for individual investors / savers who aim to invest their funds for a longer term and for relatively higher returns. This is a term deposit for a ten years tenure and offers a competitive rate of return payable on maturity. This product is ideal for investors / savers who wish to start saving for their future today.
Mahana Bachat AccountAskari Mahana Bachat Account is a term deposit designed for individuals with a short to medium term investment appetite. It offers customers the option of investing for one to three years tenures and has been designed keeping in view savings needs of customers who want profit on a monthly basis. With competitive rates of return paid monthly on the 1st of every month and the option of getting a financing facility of up to 90 percent, the Askari Mahana Bachat Account caters to your saving needs without blocking your funds for a longer duration.
Paishgi Munafa AccountAskari Paishgi Munafa Account is a unique term deposit designed to meet the immediate financial needs of individual investors / savers who want to invest their funds for a medium term. The most significant feature of this product is that the cus-tomer receives the entire profit upfront at the time of placing the deposit in a way that the investors / savers can fulfill your financial needs of today without depleting your savings.
Value Plus Deposit AccountAskari Bank Value Plus Rupee Deposit Accounts offers value and flexibility. This product promises greater financial freedom and security, in an un-matched way. Now customers can open a “Value Plus Account” while enjoying the flexibility of a normal checking account.
Investment CertificatesAskari Bank’s Investment Certificates provide the added security, investment and monthly return to the customers. These certificates are negotiable and can be transferred to third party. Investment Certificates are available for a 3 months period and profit is payable on monthly basis through pre-printed tear-off coupons.
Rupee Traveler ChequesAskari Bank offers customers a widely accepted “Rupee Traveler Cheques”, which eliminates all fi-nancial risks while traveling. It is a safe and secure way to make payments nationwide.
Roshan Mustaqbil DepositThe Askari Roshan Mustaqbil Deposit is a saving plan created for individual investors/savers who wish to invest now for a regular return at a later stage while keeping their principal intact. Custom-ers can invest a substantial amount without having to block their entire savings like a regular term deposits. With Askari Roshan Mustaqbil Deposit customers can invest in the form of monthly deposits for a period of five years and get paid back the same monthly deposit amount every month for the next five years while receiving their principal amount in full at the end of the ten years. This way customers can double their investment in a period of ten years.
Bancassurance Bancassurance is the latest addition to our product profile. The Bank now offers innovative banking solutions with a touch of insurance in it by fusion of Banking, Wealth Management and Insur-ance Products. In partnership with M/s Eastern Federal Union (EFU) Life, the Bank is positioned to offer our valued customers with value added life insurance and wealth management products tai-lored to suit their long term financial requirements and protection plans through select branches. As an extended feature of bancassurance, the Bank has also pioneered a co-brand credit card ‘Askari EFU Life co-Brand Credit Card’. This feature offers benefits such as cash back facility, standing charge option, reward points for each retail transaction conducted and much more.
9
Corporate and Investment Banking
At Askari Bank, we understand the unique busi-ness requirements of our corporate and institu-tional clients, and accordingly the Bank’s dedicated Corporate and Investment Banking Group (CIBG) strives to meet their expectations through provi-sion of customized and relationship based banking approach.
Corporate BankingThe Corporate Banking works on a long-term rela-tionship based business model to provide a single point within the bank for meeting all business requirements of its corporate and institutional customers, including public sector enterprises, with the primary objective of enhancing customer service.
Dedicated relationship managers for each of our corporate client ensure customer satisfaction, which remains top priority. Our relationship ori-ented outlook focuses upon providing a complete array of tailored financing solutions, that are prac-tical and cost effective, some of which include:
• Working Capital Facilities • Term Loans • Structured Trade Finance Facilities • Letters of Guarantee • Letters of Credit • Fund Transfers / Remittances • Bill Discounting • Export Financing • Receivable Discounting
Investment BankingThe Investment Banking at Askari focuses on origination and execution of a full range of financial advisory and capital raising services to corporate and institutional clients as well as actively managing the Bank’s proprietary investments in the local equity and debt capital markets.
Whether a company is seeking to access the local or cross border syndications and debt capital markets, project financing needs, advisory services related to M&A or the local equity capital markets for raising capital, Askari Bank’s CIBG is well positioned to provide due assistance. We can create and tailor the right structured solutions for business needs in order to enhance shareholders’ wealth and market competitiveness
Investment Banking offers various and tailored financial solutions including debt syndications, project finance and advisory services, debt placements through capital markets as well as structured trade finance facilities.
Consumer Banking
Askari Bank's consumer finance is focused on en-hancing retail portfolio through new and improved initiatives and products. Special attention is given to business opportunities involving strategic al-liances to earn sustainable returns, with greater emphasis on secured form of consumer lending and an aim to increase product offerings while im-proving and maintaining quality of asset portfolio.
Ask4Car It is a product for vehicle financing for both new and used vehicles at affordable and competitive mark-up, easy processing without any hidden costs.
Personal FinanceWith unmatched financing features in terms of loan amount, payback period and most afford-able monthly installments, Askari Bank’s personal finance makes sure that you get the most out of your loan; the product tenure ranges from one to five years and is designed primarily for salaried individuals.
Mortgage FinanceWhether you plan to construct a house, buy a constructed house, or renovate your home, Askari mortgage finance enables you to pursue your goal without any problems. Mortgage is a premium home financing product for customers aged between 23 – 65 years belonging to the upper, upper middle and middle income groups, residing in the urban areas of Pakistan
Visa Debit CardAskari Visa Debit Card enables customers’ access to convenient banking services; now you can manage your account, withdraw cash, make purchases and transfer your funds through Askari Visa Debit Card, which also offers the convenience of a credit card without the hassle of monthly bills and interest charges. No minimum balance requirements for issuance or retention of the VISA debit card. An eligible customer may apply for any of the debit cards i.e. classic or gold.
Master Credit CardAskari Bank offers a competitive suite of silver, gold and platinum Master Credit cards focusing on providing superior services, travel privileges, and shopping pleasures. It also offers reward points and transactional alerts through SMS as enhanced security feature.

10
Products & Services contd.
Agricultural Banking
Agricultural banking products and services are specifically designed for Pakistan’s crop farming, other farming and rural business segment. Such products and services, some of which are listed below, offer improved and efficient delivery and control mechanism for meeting increased demand for credit by the farmers in easy, accessible and affordable manner.
• Kissan Ever Green Finance• Kissan Tractor Finance• Kissan Livestock Development Finance• Kissan Farm Mechanization Finance• Kissan Aabpashi Finance
Islamic Banking
With the help of Shariah advisor and professional bankers, Askari Islamic banking provides Riba free and Sharia’a Compliant solutions to various customer segments through a modest branch network in major cities of Pakistan. It offers following main products:
Ijarah Vehicle FinanceIjarah is a rental agreement, under which the usufructs of an asset is transferred to the client on agreed terms and conditions. It is a Sharia’a compliant mode of finance, adopted by Askari Islamic Banking to meet the vehicle financing needs of its Islamic customers.
Home MusharkahAskari Islamic Banking offers Sharia’a compliant home financing to purchase, construct, improve and transfer of the property under the concept of Diminishing Musharakah. This means being able to cope with other financial commitment, while still having money left over for extras and unexpected expenses.
Alternate Delivery Channels
Internet (I-NET) BankingOur I-Net banking assures convenient banking from the comfort of your home. Now, customers are no longer required to wait in long and worrisome queues to request a financial transaction, 24/7 balance inquiry, statement of accounts, fund transfer, utility bill payment etc.
Call CenterThe Bank’s Call Center provides a single point of contact for all of its customers, yet offer unique and individualized services on real time information for its time-conscious customers; it is operated 24/7 and service customers for providing information of products & services, handling inquiries, attending requests.
Auto Teller Machine (ATM)Askari Bank is a member of two electronic ATM inter-bank connectivity platforms i.e., MNET and 1-link. Through this shared network of online 4,401 ATMs including Askari Bank’s 233 dedicated ATMs covering all major cities in Pakistan supports the delivery channels for customer service. It provides services of e-banking and payment system products.
* Above referred products and services are subject to various terms and conditions. Further details about the products listed above or additional offerings of Askari Bank, any of our branches (contact information given on page 194 to 201) may be contacted or telephone calls can be made 0800-00078 or our website www.askaribank.com.pk may be visited.

11

12
Corporate Philosophy
Corporate Objectives
• To achieve sustained growth and profitability in all areas of banking business.
• To build and sustain a high performance culture, with a continuous improvement focus.
• To develop a customer–service oriented culture with special emphasis on customer care and convenience.
• To build an enabling environment, where employees are motivated to contribute to their full potential.
• To effectively manage and mitigate all kinds of risks inherent in the banking business.
• To optimize use of technology to ensure cost–effective operations, strengthened controls, efficient management information system, enhanced delivery capability, and high service standards.
• To manage the Bank’s portfolio of businesses to achieve strong and sustainable shareholder returns and to continuously build shareholder value.
• To deliver timely solutions that best meet the customers’ financial needs.
• To explore new avenues for growth and profitability.
Strategic Planning• To comprehensively plan for the future
to ensure sustained growth and profitability.
• To facilitate alignment of the Vision, Mission, Corporate Objectives with the corporate goals and objectives.
• To provide strategic initiatives and solutions for projects, products, policies and procedures.
• To provide strategic solutions to strengthen weak areas and to counter threats to profits.
• To identify strategic initiatives and opportunities for profit.
• To create and leverage strategic assets and capabilities for competitive advantage.
13
Statement of Ethics& Business Practices
Askari Bank seeks to maintain high standards of service and ethics enabling it to be perceived as impartial, ethical, and independent. In order to achieve these objectives, following principles of ethics and conduct are mandatory for all employees of the Bank:
• Render, with integrity, a responsible and effective service of high quality which is accessible by all customers, present and prospective.
• Not abuse the authority that he or she has been assigned as an employee of the Bank, in dealings with customers and other employees.
• Act judiciously, fairly and impartially with all customers when exercising any discretion in the performance of duties;
• Exercise powers conferred on them in a responsible manner particularly by:
– performing all their duties impartially without favouring any customer and without regard to status, sex, race, religion, political beliefs or aspirations;
– acting honestly, respectfully, transparently and in an accountable manner;
– treating all persons with equal consideration and objectivity;
– using any discretion vested in them judiciously, sensibly, impartially and reasonably.
• Refrain from divulging any information received in the course of their work and duties unless the performance of duty or the needs of justice require otherwise;
• Refrain from making wrong declaration to the Bank, other employees or customers.
• Resist and report any offers of bribes or other corruption ema-nating from any source.
• In their private life behave in a manner, which does not bring discredit to or impair the dignity or reputation of the Bank.
• Seek to attain the highest pos-sible standards of performance; interpersonal relationships and exercise care for others in em-ployment related activities.
• Take official decisions and enforce policies of the Bank within the ambit of law of the land faithfully and impartially.
• Respect and comply with the statement of ethics and business practices, if they have reason to believe that a violation of this Statement, laws or regulations has occurred or is about to occur, report the matter to the Bank’s management.
Corporate Culture
The Bank recognizes employees’ behaviour and interaction with oth-ers as a vital part of their duties. In order to achieve the desired level of performance and corporate objec-tives, preservation of congenial and professional working environment is encouraged. Askari Bank seeks to cre-ate an environment where all persons are treated equitably and with respect, where person’s rights are respected and where efforts of staff are encour-aged and their achievements given due recognition.
Professionalism
Professionalism embraces the neces-sary skills, qualification and knowledge to undertake tasks in a competent manner. Bank employees are expected to carry out their responsibilities in a professional manner at all times. They must conduct financial or other obliga-tions in a prudent manner and should avoid situations that could reflect unfavorably on themselves, Bank or its customers.
Customer Relationship
Knowing our customers and their needs is the key to our business success. Fairness, truthfulness and transparency governs our customer relationships in determining the trans-actional terms, conditions, rights and obligations. Employees should seek to understand customers’ financial circumstances and needs to be able to provide them with most suitable prod-ucts and services. All employees must ensure that any advice given to a cus-tomer is honest and fairly expressed and restricted to only those services or products where the Bank has the relevant expertise and authority.
Maintaining Confidentiality
Bank employees have a duty to safeguard confidential information, which may come to their possession during their day-to-day work. Respect for customers’ private affairs, merits the same care as does the protec-tion of the Bank’s own affairs or other interests. This duty of confidentiality involves not divulging information to third parties unless required by statu-tory authorities / law.
14
Conflict of Interest
Circumstances should be avoided in which personal interest conflicts, or may appear to conflict, with the interest of the Bank or its customers. Circumstances may arise where an employee, his / her spouse or family member directly or indirectly hold a business interest which conflicts or may conflict with the Bank’s interest. In order to ensure that the Bank makes objective decisions, employee must declare in advance such interest to the management. Any involvement in an outside activity or any external position held by an employee:
• must not give rise to any real or apparent conflict with a customer’s interest;
• must not adversely reflect on the Bank; and
• must not interfere with an employee’s job performance.
Employees must not negotiate or contract on behalf of the Bank with an enterprise in which they have a direct or indirect interest.
Employees on the payroll of Askari Bank must not undertake any other employment, whether part time, temporary or other, or act as consultant, director or partner of another enterprise except with the prior permission of the Bank. Customer Due Diligence (CDD)
CDD is the process to ensure that the Bank is not used for any unlawful transactions. This is achieved by obtaining sufficient information about the customers to reasonably satisfy as to their reputation, standing and the nature of their business activities. Effective use of CDD discourages money laundering, which uses banks as vehicles to disguise or “launder” the proceeds of criminal activities. All employees, particularly working in the customer service areas, must establish the identity of every new customer from reliable identifying documents.
For existing customers, they must remain vigilant and aware of:
• activities not consistent with customer’s business;
• unusual characteristics or activities;
• attempts to avoid reporting or record keeping requirement; and
• unusual or erratic movement of funds.
Personal Investments
Employees must ensure that no conflict of interest arises between their personal transactions and corporate and customer responsibilities. Employ-ees must never attempt to use their position to obtain an advantage to buy and sell investments. Employees shall not, at any time, carry out:
• short sales of marketable securi-ties or currencies or any other form of trading which is specula-tive in nature in their own account or for the account of their spouse or family members.
• trading in shares, securities or currencies which involve improper use of unpublished price sensitive information for personal benefit.
Relations with Regulators
Relationship with regulators is one of the most important relations, which Askari Bank maintains with the aim of developing mutual confidence and trust. All employees must comply in letter and spirit, with legal and regula-tory requirements applicable to the activities in which the Bank is engaged. Relationship with competitors
Except in situations where the Bank is participating in a transaction with other bank(s), no employee shall have any agreement, understanding or arrangement with any competitor with respect to pricing of services, profit rates and / or marketing policies, which may adversely affect the Bank’s business.
Gifts and entertainment
Gifts, business entertainment or other benefits from a customer or a supplier / vendor, which appear or may appear to compromise commercial relation-ships must not be accepted by the employees. In the event that a gift must be ac-cepted for reason of customer’s insist-ence and sensitivity of relationship, such gifts must be surrendered to the Bank along with reasons of accept-ance. Under no circumstances an employee shall either directly or indirectly accept any amount of money, however small, as gift, gratuity, subscription or reward from any employee of the Bank, cus-tomer, supplier or vendor. Customers who wish to express grati-tude for the services of Askari Bank should be requested to send a letter of appreciation. Political Activities
No employee of the Bank shall con-tribute or lend money or items of any value to any of the political candidates or parties. This also includes using Bank’s facilities, equipment, personnel etc. for the purpose. However, they shall be free to participate in politi-cal process as concerned individuals through means of voting. In case of an employee considering assuming any public office, prior specific informa-tion with all related reasons must be provided to the Bank for approval. Fraud, theft or illegal activities
Employees are expected to remain alert and vigilant with respect to frauds, thefts or illegal activities com-mitted within the Bank premises.
Harassment at workplace
Employees must avoid any behaviours that can be termed as harassment, offensive, threatening or disturbing to other employees.
Corporate Philosophy contd.
15
16
Corporate Information
Board of Directors
Lt. Gen. Nadeem TajChairmanExecutive Director
Lt. Gen. (R) Imtiaz HussainExecutive Director
Maj. Gen. (R) Saeed Ahmed KhanExecutive Director
Mr. Zafar Alam Khan SumbalExecutive Director
Mr. Muhammad Riyazul HaqueNon-Executive Independent Director
Mr. Shahid MahmudNon-Executive Independent Director
Mr. Ali Noormahomed Rattansey, FCANon-Executive Independent Director
Dr. Bashir Ahmad KhanNon-Executive Independent Director
Mr. Wazir Ali Khoja(NIT Nominee)Non-Executive Independent Director
Mr. M. R. MehkariPresident & Chief Executive
Audit CommitteeDr. Bashir Ahmad KhanChairman
Mr. Ali Noormahomed Rattansey, FCA
Mr. Wazir Ali Khoja
Company SecretaryMr. M. A. Ghazali Marghoob, FCA
Chief Financial OfficerMr. Saleem Anwar, FCA
AuditorsKPMG Taseer Hadi & CoChartered Accountants
Legal AdvisorsRizvi, Isa, Afridi & Angell
Shariah AdvisorDr. Muhammad Tahir Mansoori
Registered / Head OfficeAWT Plaza, The Mall,P.O. Box No. 1084Rawalpindi-46000,Pakistan.Tel: (92 51) 9063000Fax: (92 51) 9272455E-mail: [email protected]: www.askaribank.com.pk
Registrar and Share Transfer OfficeTHK Associates (Private) LimitedGround Floor, State Life Building No. 3,Dr. Ziauddin Ahmad Road, P.O. Box: 8533Karachi-75530Tel: (92 21) 5689021, 5686658, 5685681Fax: (92 21) 5655595UAN: (92 21) 111 000 322
Entity RatingsLong Term: AAShort Term: A1 +by PACRA
17
Directors’ Profile
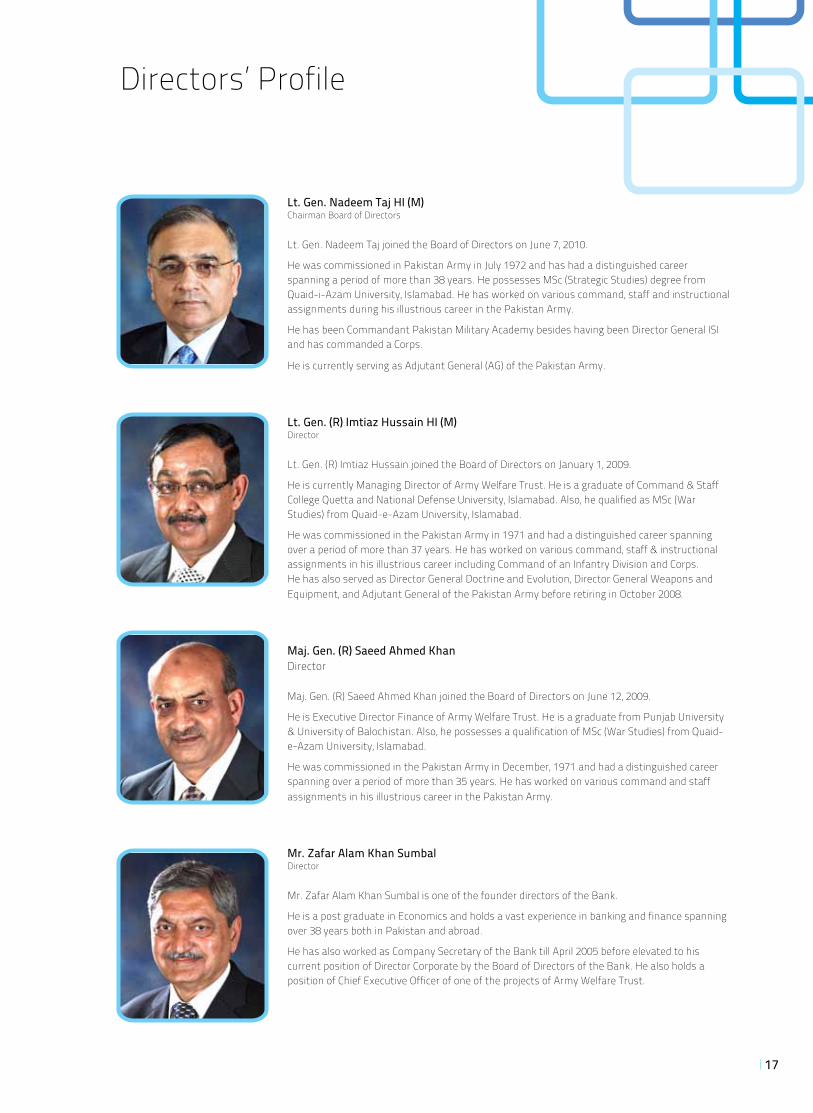
Lt. Gen. Nadeem Taj HI (M)Chairman Board of Directors
Lt. Gen. Nadeem Taj joined the Board of Directors on June 7, 2010.
He was commissioned in Pakistan Army in July 1972 and has had a distinguished career spanning a period of more than 38 years. He possesses MSc (Strategic Studies) degree from Quaid-i-Azam University, Islamabad. He has worked on various command, staff and instructional assignments during his illustrious career in the Pakistan Army.
He has been Commandant Pakistan Military Academy besides having been Director General ISI and has commanded a Corps.
He is currently serving as Adjutant General (AG) of the Pakistan Army.
Lt. Gen. (R) Imtiaz Hussain HI (M) Director
Lt. Gen. (R) Imtiaz Hussain joined the Board of Directors on January 1, 2009.
He is currently Managing Director of Army Welfare Trust. He is a graduate of Command & Staff College Quetta and National Defense University, Islamabad. Also, he qualified as MSc (War Studies) from Quaid-e-Azam University, Islamabad.
He was commissioned in the Pakistan Army in 1971 and had a distinguished career spanning over a period of more than 37 years. He has worked on various command, staff & instructional assignments in his illustrious career including Command of an Infantry Division and Corps. He has also served as Director General Doctrine and Evolution, Director General Weapons and Equipment, and Adjutant General of the Pakistan Army before retiring in October 2008.
Maj. Gen. (R) Saeed Ahmed KhanDirector
Maj. Gen. (R) Saeed Ahmed Khan joined the Board of Directors on June 12, 2009.
He is Executive Director Finance of Army Welfare Trust. He is a graduate from Punjab University & University of Balochistan. Also, he possesses a qualification of MSc (War Studies) from Quaid-e-Azam University, Islamabad.
He was commissioned in the Pakistan Army in December, 1971 and had a distinguished career spanning over a period of more than 35 years. He has worked on various command and staff assignments in his illustrious career in the Pakistan Army.
Mr. Zafar Alam Khan SumbalDirector
Mr. Zafar Alam Khan Sumbal is one of the founder directors of the Bank.
He is a post graduate in Economics and holds a vast experience in banking and finance spanning over 38 years both in Pakistan and abroad.
He has also worked as Company Secretary of the Bank till April 2005 before elevated to his current position of Director Corporate by the Board of Directors of the Bank. He also holds a position of Chief Executive Officer of one of the projects of Army Welfare Trust.
18
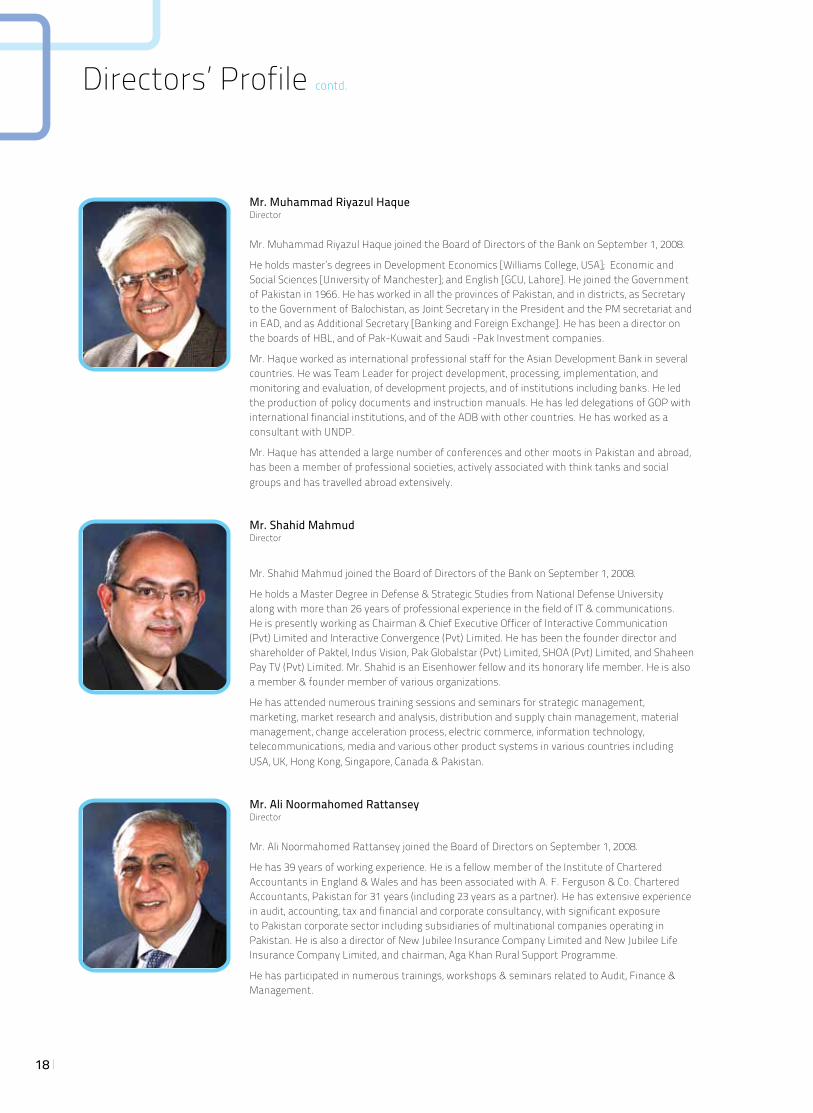
Mr. Muhammad Riyazul HaqueDirector
Mr. Muhammad Riyazul Haque joined the Board of Directors of the Bank on September 1, 2008.
He holds master’s degrees in Development Economics [Williams College, USA]; Economic and Social Sciences [University of Manchester]; and English [GCU, Lahore]. He joined the Government of Pakistan in 1966. He has worked in all the provinces of Pakistan, and in districts, as Secretary to the Government of Balochistan, as Joint Secretary in the President and the PM secretariat and in EAD, and as Additional Secretary [Banking and Foreign Exchange]. He has been a director on the boards of HBL, and of Pak-Kuwait and Saudi -Pak Investment companies.
Mr. Haque worked as international professional staff for the Asian Development Bank in several countries. He was Team Leader for project development, processing, implementation, and monitoring and evaluation, of development projects, and of institutions including banks. He led the production of policy documents and instruction manuals. He has led delegations of GOP with international financial institutions, and of the ADB with other countries. He has worked as a consultant with UNDP.
Mr. Haque has attended a large number of conferences and other moots in Pakistan and abroad, has been a member of professional societies, actively associated with think tanks and social groups and has travelled abroad extensively.
Mr. Shahid MahmudDirector
Mr. Shahid Mahmud joined the Board of Directors of the Bank on September 1, 2008.
He holds a Master Degree in Defense & Strategic Studies from National Defense University along with more than 26 years of professional experience in the field of IT & communications. He is presently working as Chairman & Chief Executive Officer of Interactive Communication (Pvt) Limited and Interactive Convergence (Pvt) Limited. He has been the founder director and shareholder of Paktel, Indus Vision, Pak Globalstar (Pvt) Limited, SHOA (Pvt) Limited, and Shaheen Pay TV (Pvt) Limited. Mr. Shahid is an Eisenhower fellow and its honorary life member. He is also a member & founder member of various organizations.
He has attended numerous training sessions and seminars for strategic management, marketing, market research and analysis, distribution and supply chain management, material management, change acceleration process, electric commerce, information technology, telecommunications, media and various other product systems in various countries including USA, UK, Hong Kong, Singapore, Canada & Pakistan.
Mr. Ali Noormahomed RattanseyDirector
Mr. Ali Noormahomed Rattansey joined the Board of Directors on September 1, 2008.
He has 39 years of working experience. He is a fellow member of the Institute of Chartered Accountants in England & Wales and has been associated with A. F. Ferguson & Co. Chartered Accountants, Pakistan for 31 years (including 23 years as a partner). He has extensive experience in audit, accounting, tax and financial and corporate consultancy, with significant exposure to Pakistan corporate sector including subsidiaries of multinational companies operating in Pakistan. He is also a director of New Jubilee Insurance Company Limited and New Jubilee Life Insurance Company Limited, and chairman, Aga Khan Rural Support Programme.
He has participated in numerous trainings, workshops & seminars related to Audit, Finance & Management.
Directors’ Profile contd.
19
Dr. Bashir Ahmad KhanDirector
Dr. Bashir Ahmad Khan joined the Board of Directors on March 28, 2008.
He has more than 20 years of academic and professional experience and is presently working as professor of finance and head of department of business studies at Forman Christian (FC) College. He taught at the Suleman Dawood School of Business at Lahore University of Management Sciences (LUMS) for 18 years, where he was also associate dean of executive education. He has played a key role in the launch of both customer-specific and open enrolment executive education programs for various institutions & companies. His current responsibilities include strategic and financial planning, budgeting, human resource management, and business development. He has been a financial and management consultant for various commercial and non-commercial organizations. He has also been on the Policy Board of the Securities & Exchange Commission of Pakistan and a member of the board of Askari Investment Management Limited, a subsidiary of Askari Bank.
Mr. Wazir Ali KhojaDirector
Mr Wazir Ali Khoja, Chairman and Managing Director National Investment Trust (NIT) is a seasoned banker with more than 32 years of professional experience in the field of banking, finance and mutual fund industry.
Mr Khoja is a commerce graduate from the University of Sindh. He started his career from MCB Bank in 1965 as branch manager and worked up his way to become Senior Executive Vice President in 1996. His main area of expertise has been project finance, equity market operations and treasury affairs. Besides, he was also responsible for HR, Retail Products and Sports Division. By virtue of his proactive leadership, management skills and teamwork approach he had successfully turned MCB branches located in Sindh into profit during his tenure as General Manager. As Head of Sports Division at MCB, Mr. Khoja contributed in identifying and grooming young sporting talent to compete internationally in cricket, hockey and football. He also holds the position as member Governing Body of Pakistan Cricket Board (PCB). Mr. Khoja also served as Deputy Managing Director of NIT during 1994-95. Presently he is member on the Boards of prestigious institutions including Sui Southern Gas Co., Sui Northern Gas Co., Bank Al Habib, Habib Metropolitan Bank, Shell Pakistan, Fauji Fertilizer Company and Pak Telecom Mobile.
Mr. Muhammad Rafiquddin Mehkari President & Chief Executive
Mr. M. R. Mehkari with 40 years of international and domestic banking experience and currently serving Askari Bank in the position of the President and Chief Executive. He is one of the pioneer members of Askari Bank.
In 1971, he started his career with UBL and in December 1974, joined the erstwhile BCCI and served at National Bank of Oman, a subsidiary of BCCI, till 1992. He carries extensive experience in all banking dimensions including operations, treasury, fund management and investment banking, in international and domestic banks.
He joined State Bank of Pakistan on secondment and served as Director, Exchange Policy Department from April 2000 to April 2004, where he took major initiatives like liberalizing Foreign Exchange Regime etc. He was also a member of Corporate Management Team and Monetary & Exchange Rate Policy Committee at State Bank of Pakistan. Mr. Mehkari is also a member on the board of Askari Investment Management Limited, a subsidiary of Askari Bank.
He participated in various courses and seminars on foreign exchange exposure & treasury management, money market and other banking areas of operations in Pakistan and abroad.
20
Board Committees
Executive Committee (EC)
Composition:
• Lt. Gen. (R) Imtiaz Hussain Chairman
• Maj. Gen. (R) Saeed Ahmad Khan• Mr Zafar Alam Khan Sumbal• Mr Shahid Mahmud• Mr M R Mehkari President & CE
Terms of Reference:
The key functions of the EC are overseeing all operational, financial and administrative aspects of the Bank’s business and in this regard, formulating, reviewing and/or revising policies including defining powers of the President & CE and/or other officials of the Bank and issuing directives for implementation thereof. Considering / approving such other matters which are beyond the established limits of the President & CE. Considering, approving, appointing and promoting executives in certain senior cadre and suspending, terminating their services with the consent/ recommendation of the President & CE.
13 EC meetings were held during 2010.
Audit Committee (AC)
Composition:
• Dr Bashir Ahmad Khan Chairman
• Mr Ali Noormahomed Rattansey• Mr Wazir Ali Khoja
Terms of Reference:
AC is responsible for setting appropriate measures to safeguard the Bank’s assets and in this regard determining effectiveness and efficiency of internal control systems; reviewing and recommending to the Board for approval of financial statements, statement on internal control, related party transactions and recommend appointment of external auditors. It is also mandated to receive, review and present to the Board, management letters issued by the external auditors; consider internal audit reports and report findings to the Board that require its attention; ensuring effective coordination between internal and external auditors. It is also responsible to reviewing scope of internal audit function. Determination and monitoring compliance to statutory / regulatory requirements and best practices
of corporate governance and taking up any other matter on the directions of the Board are also within its scope.
4 AC meetings were held during 2010.
Risk Management Committee (RMC)
Composition:
• Mr Zafar Alam Khan Sumbal Chairman
• Mr Wazir Ali Khoja• Mr M R Mehkari President & CE
Terms of Reference:
The main function of RMC is to review risk management strategies for identification, assessment, reporting, monitoring and controlling of risks ensuring that the risk management framework remains fully compliant with the regulatory requirements; development of risk management policies and parameters; approval and monitoring of limits in respect of credit, market, operation and other risks; carrying surveillance function on behalf of the Board and reporting to the Board matters requiring its attention; ensuring that the risk management function of the Bank is adequately resourced possessing required skill set to effectively perform its duties; reviewing periodic reports submitted to the SBP; and ensuring that the RMC is abreast of changing risk management techniques through organizing regular training programs for RMC members.
4 RMC meetings were held during 2010.
Human Resource Committee (HRC)
Composition:
• Mr Zafar Alam Khan Sumbal Chairman
• Dr Bashir Ahmad Khan
Terms of Reference:
The key functions of HRC are to review and recommend to the Board human resource policies of the Bank, HR annual budgets and monitor variances; review of succession plan of senior management ensuring that all such position remain filled; reviewing employee training need assessment including training program organized / conducted for the Bank’s employees; ensure adequacy of Bank’s staff at all levels through regular review of staff strengths; perform any other task as per the directives of the Board.
3 HRC meetings were held during 2010.

21
Management Committee (ManCom)
Composition:
• President & CE Chairman
• Group Head – Commercial Banking• Group Head – Corporate & Investment Banking• Group Head - Operations• Group Head – Marketing & Strategic Planning • Chief Information Officer• Global Treasurer• Chief Financial Officer• Country Head - Human Resource• Country Head - Compliance & Data• Country Head - Consumer Banking Services• Chief Credit Officer• Executive Incharge – President Support• Country Head - Risk Management • Regional General Managers, North, Central & South
Terms of Reference:
ManCom’s primary responsibility is to ensure develop-ment, monitoring and management of effective govern-ance throughout the Bank and in its wholly owned subsidiaries. It is responsible to set strategic direction of the Bank including its down the line communication within the Bank; developing business plans ensuring that these are aligned to strategic plan and monitor-ing of performance thereagainst. It is also mandated to ensure the health of operations and adequacy of returns of all business activities of the Bank.
Asset Liability Management Committee (ALCO)
Composition:
• President & CE Chairman
• Group Head – Commercial Banking• Group Head – Marketing & Strategic Planning • Group Head – Corporate & Investment Banking• Global Treasurer• Chief Financial Officer• Chief Credit Officer• Country Head - Risk Management• Country Head - International Banking• Regional General Managers, North, Central & South
Terms of Reference:
ALCO is responsible for review and monitoring the liquidity management of the Bank, interest rate sce-narios, market and foreign currency risks, by applying various techniques including stress testing and gap analysis, while considering external environment (eco-nomic forecasts etc.) and ensuring that these remain fully compliant with the regulatory requirements. ALCO also ensures that corrective / remedial measures, where necessary, are initiated. It is also responsible to review and approval new products, periodical declaration of de-posit rates, setting targets, and monitoring performance thereagainst. It is also mandated to review performance of capital market activities within the Bank.
Management Committees
21
22
Administrative Committee (AdmnCom)
Composition:
• Group Head - Operations Chairman
• Country Head - International Banking• Country Head – Electronic Technology • Country Head – Human Resource • Country Head - Establishment
Terms of Reference:
AdmnCom is responsible for review, recommendation and approval of acquisition / disposal of operating assets. It also reviews and monitors progress of opening of new branches. It is also responsible to review and approve schedule of bank charges on various banking services offered by the Bank.
Information Technology Steering Committee (ITSC)
Composition:
• President & Chief Executive Chairman
• Group Head – Commercial Banking• Group Head – Corporate & Investment Banking• Group Head - Operations• Group Head – Marketing & Strategic
Planning • Chief Information Officer• Chief Financial Officer• Country Head - Consumer Banking Services• Country Head - Electronic Technology• Country Head - Risk Management• Country Head - Audit & Inspection• Executive Incharge – President Support
Terms of Reference:
IT Steering Committee’s primary responsibility is to develop IT strategic plan including identifying high level risks and devising mitigation strategies; forecast future IT projects / requirements in line with business growth and provide necessary support & guidance; ensuring that all IT processes / establishments remain compliant with relevant IT standards including those of the SBP. It is also responsible to monitor IT governance structure, exercise oversight and ensure policies are developed to meet IT related organizational objectives.
Disciplinary Action Committee (DAC)
Composition:
• Executive In-charge - President Support Chairman
• Country Head - Human Resource • Country Head - Compliance & Data • Country Head - Legal Affairs • Senior Executive - Operations
Terms of Reference:
This Committee is mainly responsible for initiating and enforcing disciplinary action proceedings against Bank employees who are found involved in fraud / forgery and other serious offences / instances of misconduct, and take appropriate decisions as per the staff service rules of the Bank.
Head Office Credit Committee (HOCC)
Composition:
• President & Chief Executive Chairman
• Group Head – Commercial Banking• Group Head – Corporate & Investment Banking• Group Head - Operations• Group Head – Marketing & Strategic Planning • Chief Credit Officer• Country Head - Special Asset Management
Terms of Reference:
HOCC is mainly responsible for review and approval of credit strategy; review of risk appetite and tolerance limits; approval of credit / investment proposals; review of classified advances portfolio and watch-list accounts and initiate necessary corrective measures. It is also delegated with the powers to develop / maintain and approve the credit approval authority structure within the Bank to ensure smooth functioning. Various analysis & reviews on credit risk conducted by Risk Management Division of the Bank are also presented in the HOCC for review and monitoring health of Bank’s credit portfolio.
Management Committees contd.

23
24
Notice of 19th Annual General Meeting
Notice is hereby given that the 19th Annual General Meeting of the shareholders of Askari Bank Limited (the Bank) will be held on Tuesday, March 29, 2011 at 10:00 am at Blue Lagoon Complex opposite outward gate of Pearl Continental Hotel, Rawalpindi, to transact the following business:
Ordinary Business:
1. To confirm the minutes of the 18th Annual General Meeting held on March 30, 2010.
2. To receive, consider and adopt the financial statements for the year ended December 31, 2010 together with the Directors’ and Auditors’ Reports thereon.
3. To appoint the auditors of the Bank for the year ending December 31, 2011 and to fix their remuneration.
4. To elect ten (10) Directors as fixed by the Board in accordance with the provisions of Section 178 of the Companies Ordinance, 1984 for a period of three years in place of the following retiring directors namely:
• Lt.Gen.NadeemTaj• Lt.Gen.(R)ImtiazHussain• Maj.Gen.(R)SaeedAhmedKhan• Mr.ZafarAlamKhanSumbal• Dr.BashirAhmadKhan• Mr.AliNoormahomedRattansey• Mr.ShahidMahmud• Mr.MuhammadRiyazulHaque• Mr.WazirAliKhoja-NITnominee
Special Business:
5. To consider and if deemed fit, pass the following resolutions with or without modification(s):
Resolved thati) a sum of Rs. 642,744 thousand out of the general reserve
as at December 31, 2010 be capitalized and be applied to the issue of 64,274,394 ordinary shares of Rs.10 each allotted as fully paid bonus shares to the members whose names appear in the register of members as at the close of business on March 22, 2011 in the proportion of 10 shares for every hundred shares held that is 10 percent.
ii) the bonus shares shall rank pari passu in all respects with the existing shares.
iii) the sale proceeds of fraction shares entitled to members shall be donated to any recognized charitable institution, for which purpose the fractions shall be consolidated into whole shares and sold through stock market.
iv) the President and Chief Executive and Company Secretary of the Bank be and are hereby authorized and empowered to give effect to this resolution and to do or cause to be done all acts, deeds and things that may be necessary or required for the issue, allotment and distribution of bonus shares.
6. To consider and if deemed fit, approve and adopt the amendment in the Article 106 of the Articles of Association of the Bank and to pass the following ‘Special Resolutions’ with or without modification(s):
“Resolved that pursuant to Section 28 of the Companies Ordinance, 1984 the Articles of Association of the Bank be altered in the following manner:
Article 106 of the Articles of Association of the Bank be deleted and in its place the following new Article be substituted:
Remuneration Payable to Directors of the Company for attending Board Meetings shall not exceed Rs. 50,000 and remuneration payable to Directors of the Company for attending meetings of Board Committees shall not exceed Rs. 25,000 and a Director who performs extra service or a full time Director shall receive such remuneration (whether by way of salary, commission, participation in profits, allowance and perquisites etc, or partly in one way and partly in another) as the members may fix and the Company may also pay any Director all such reasonable expenses as may be incurred in attending and returning from Board meetings or meetings of Board Committees or which he may otherwise incur in or about the business of the Company.
Resolved Further that the President and Chief Executive and Company Secretary of the Bank be and are hereby authorized either singly or jointly, to take all steps necessary, ancillary and incidental for registering and amending the Articles of Association of the Company as stated above, including but not limited to filing of all the requisite statutory forms and all other documents as may be required to be filed with the Companies Registration Office, Securities and Exchange Commission of Pakistan and the State Bank of Pakistan and any other document or instrument including any amendments or substitutions to any of the foregoing as may be required in respect of the amendment in the Articles of Association.”
7. To consider and if deemed fit pass the following ‘Special Resolutions’ under section 208 of the Companies Ordinance, 1984 with or without modification(s):
“Resolved that the Chief Executive Officer and Company Secretary of the Bank be and are hereby authorized to take all necessary steps to make long term investment in the share capital of Askari General Insurance Company Limited by way of subscription of 25% right issue of shares amounting to Rs. 12,735,860 and subscription of additional shares amounting to Rs. 5,548,390 from unsubscribed portion of Right Issue of shares in accordance with the provisions of section 208 of the Companies Ordinance, 1984 and to disinvest such investments as and when considered appropriate.
Further Resolved that the Chief Executive Officer and Company Secretary of the Bank be and are hereby authorized either singly or jointly, to take all necessary
and the Listing Regulations of the Stock Exchanges and has read the relevant provisions contained therein; and (c) a declaration in accordance with clause (iii) and (iv) of the Code to the effect that he/she is not serving as a Director of more than ten listed companies; and he/she is a registered National Tax Payer (except where he/she is a non-resident), that he/she has not been convicted by a court of competent jurisdiction as defaulter in payment of any loan to a banking company, a development financial institution or a non-banking financial institution.
ii) A specified affidavit as prescribed in the State Bank of Pakistan [SBP] BPRD Circular No. 12 dated June 2, 2000 together with prescribed Questionnaire in accordance with Prudential Regulation No. G-1 and the ‘Fit and Proper Test’ for the appointment of Directors in terms of SBP BPD Circular No. 13 dated May 17, 2004 along-with two recent photographs and a copy of CNIC (Passport in case of foreign national). Copies of SBP circulars / annexures may be obtained from SBP website or from the office of the Company Secretary of the Bank. SBP circulars / annexures also list various persons who are not eligible to become director of a Bank. Any person with these anomalies is considered undesirable; and against the public interest in terms of SBP BPRD Circular No. 12 dated June 02, 2000.
4. A member entitled to attend and vote at the meeting is entitled to appoint a proxy to attend and vote for him/her. No person shall act as a proxy, who is not a member of the Bank except that Government of Pakistan [GoP] or SBP or corporate entity may appoint a person who is not a member.
5. The instrument appointing a proxy should be signed by the member or his/her attorney duly authorized in writing. If the member is a corporate entity (other than GoP and SBP), its common seal should be affixed on the instrument.
6. The instrument appointing a proxy, together with Power of Attorney, if any, under which it is signed or a notarially certified copy thereof, should be deposited, with the Company Secretary, Askari Bank Limited, 1st Floor, AWT Plaza, The Mall, P.O.Box No. 1084, Rawalpindi not less than 48 hours before the time of holding the meeting.
7. If a member appoints more than one proxy, and more than one instrument of proxy is deposited by a member, all such instruments of proxy shall be rendered invalid.
steps to make investment (s) of up to Rs. 400 million as Seed /Core Capital in the open - end mutual funds / collective investments schemes to be launched by Askari Investment Management Limited (AIML) in future from time to time.
Further Resolved that the Board of Directors of Askari Bank Limited be and is hereby authorized to evaluate and approve above Seed / Core Capital investments to be made by the Bank in any particular open - end mutual fund to be launched by AIML in future.
Resolved Further that the President and Chief Executive and Company Secretary of the Bank be and are hereby authorized either singly or jointly, to complete any or all necessary required corporate and legal formalities for the completion of the transactions.”
8. To consider any other business as may be placed before the meeting with the permission of the Chair.
By Order of the Board
Rawalpindi M. A. Ghazali Marghoob March 7, 2011 Company Secretary
Notes
1. The statement under section 160(1)(b) & (c) of the Companies Ordinance, 1984 setting forth all material facts concerning the special business to be transacted at the meeting is annexed.
2. The Share Transfer books of the Bank will remain closed from March 23 to March 29, 2011 (both days inclusive). Transfers received at M/s THK Associates (Private) Limited, Ground Floor, State Life Building # 3, Dr. Ziauddin Ahmad Road, Karachi-75530, the Registrar and Share Transfer Office of the Bank at the close of the business on March 22, 2011 will be treated in time for purpose of the entitlement of bonus shares (B-15) to the transferees.
3. Any person who seeks to contest the election of directors shall file the following with the Bank at its registered office not later than fourteen days before the day of the above said meeting:
i) His/her intention to offer himself/herself for election of Directors in terms of Section 178 (3) of the Companies Ordinance, 1984, [the Ordinance] together with (a) consent on Form 28 as prescribed by the Companies (Provisions and Forms) Rules, 1985 (b) a declaration with consent to act as Director in the prescribed form under clause (ii) of the Code of Corporate Governance [the Code] to the effect that he/she is aware of duties and powers of Directors as mentioned in the Ordinance, the Memorandum and Articles of Association of the Bank
25
26
Notice of 19th Annual General Meeting contd.
8. The proxy form shall be witnessed by two persons whose names, addresses and CNIC numbers shall be mentioned on the form.
9. Attested copies of the CNIC or passport of the beneficial owners and the proxy shall be furnished with the proxy form.
10. The proxy shall produce his / her original CNIC or original passport at the time of meeting.
11. In case of GoP / SBP / corporate entity, the Board of Directors’ resolution / power of attorney with specimen signature shall be submitted along with proxy form to the Bank.
Statement Under Section 160(1) (b) & (c) of the Companies Ordinance, 1984
This statement sets out the material facts pertaining to the special business to be transacted at the 19th Annual General Meeting of the Bank to be held on March 29, 2011.
Item No. 4 of the Notice – Election of directorsTerm of office of the present Directors of the Bank will expire on March 29, 2011. The Board of Directors of the Bank will be re-constituted for a fresh term of three years by electing ten (10) Directors including one (1) nominee Director of NIT.
Item No. 5 of the Notice – Issue of Bonus SharesThe Directors are of the view that the reserves / profits are adequate for the capitalization of a sum of Rs. 642,744 thousand for issue of the proposed 10 % bonus shares and in this regard compliance has been made under Rule 6 of the Companies (Issue of Capital) Rules, 1996. Auditors’ certificate in respect of adequacy of reserves has also been obtained.
Item No. 6 of the Notice – Amendment in the ArticleThe Directors of the Bank have proposed amendment in Article 106 of the Articles of Association primarily to extend the remuneration payable to Directors for attending Board of Directors meetings and Board Committees meetings from the present amount of Rs. 25,000 to Rs. 50,000 and Rs. 5,000 to Rs. 25,000 respectively. The increase in remuneration is recommended in light of increase in work load and further to bring their remuneration in terms with practice in other banks.
Comparison of Article 106 of the Articles of Association before and after the proposed change is as follows:
Interest of the Directors and their relativesThe Directors of the Bank and their relatives have no interest in the proposed amendments in the Articles of Association of the Bank except to the extent of the proposed remuneration payable for attending meetings.
Item No. 7 of the Notice – Investment to be made by the Bank in Askari General Insurance Company Limited (AGICO) The Bank intends to make long term investment in the share capital of Askari General Insurance Company Limited (AGICO) for an amount of up to Rs. 25.50 million by way of subscription of 25 % right issue amounting to Rs. 12.75 million and subscription of additional shares amounting to Rs. 5.55 million from unsubscribed portion of Right Issue and to disinvest such investments as and when considered appropriate.
AGICO was incorporated in 1995 under the Companies Ordinance, 1984 as a public limited company and commenced its business in the same year. AGICO is sponsored by Army Welfare Trust and is an associated undertaking of the Bank. AGICO’s shares are listed on all three stock exchanges of Pakistan.
ExistingRemuneration Payable to the directors of the Company for attending Board Meetings shall not exceed Rs. 25,000 and remuneration payable to Directors of the Company for attending meetings of Board’s sub-committee shall not exceed Rs. 5,000 and a Director who perform extra service or a full time Director shall receive such remu-neration (whether by way of salary, commission, partici-pation in profits, allowance and perquisites etc, or partly in one way and partly in an-other) as the members may fix and the Company may also pay any Director all such reasonable expenses as may be incurred in attending and returning from the meetings of Directors or committees or Directors or which he may otherwise incur in or about the business of the Com-pany.
ProposedRemuneration Payable to Directors of the Company for attending Board Meetings shall not exceed Rs. 50,000 and remuneration payable to Directors of the Company for attending meetings of Board Committees shall not exceed Rs. 25,000 and a Director who performs extra service or a full time Director shall receive such remuneration (whether by way of salary, commission, participation in profits, allowance and perquisites etc, or partly in one way and partly in another) as the members may fix and the Company may also pay any Director all such reasonable expenses as may be incurred in attending and returning from Board meetings or meetings of Board Committees or which he may otherwise incur in or about the business of the Company.
Following are material facts about the proposed Special Resolution:
(i) Name of the Investee Company Askari General Insurance Company Limited
(ii) Nature, amount and extent of investment Long term investment in the share capital of Askari General Insurance Company Limited (AGICO) by way of subscription of 25% right issue of shares amounting to Rs. 12,735,860 and subscription of additional shares amounting to Rs. 5,548,390 from unsubscribed portion of right issue of shares and to disinvest such investments as and when considered appropriate
(iii) Average market price of the shares intended to be Rs. 10.86 purchased during preceding six months (on the basis of KSE data since July 1 to December 31, 2010).
(iv) Break-up value of shares intended to be purchased on Year ended (YE) December 31, 2009 (Audited) Rs. 13.17 the basis of last audited financial statements Half year ended June 30, 2010 (Unaudited) Rs. 14.05
(v) Price at which shares will be purchased At par value (i.e Rs.10/- each)
(vi) Earning / (loss) per share [E/(L)PS] of AGICO in YE 2007 YE 2008 YE 2009 last three years Rs. 2.54 Re. 0.33 Rs. (1.35)
(vii) Source of funds from where shares will be purchased Surplus funds
(viii) Period for which investment will be made As a long-term investment
(ix) Purpose of Investment Equity in associated concern
(x) Benefits likely to accrue to the Bank and the Investment income shareholders from the proposed investments
(xi) Interest of Directors and their relatives in AGICO Nil
Askari Investment Management Limited (AIML)AIML is a wholly owned subsidiary of Askari Bank Limited which is licensed as a non-banking finance company (NBFC) to undertake asset management and investment advisory services under the Non Banking Finance Companies (Establishment and Regulation) Rules, 2003.
Pursuant to Regulation No. 44 of the Non-Banking Finance Companies and Notified Entities Regulations, 2008 (Regulations), the Asset Management Company is required to arrange a minimum amount of investment which is subject to certain restrictions under these Regulations. Askari Bank Limited, in order to ensure successful launch of the new funds of AIML, intends to make Seed/Core capital investments of up to Rs. 400 million in such open-end mutual funds/collective investment schemes to be launched by AIML from time to time in future.
AIML is currently managing five open-end mutual funds/collective investment schemes. Launch of new funds by AIML will increase its product platter and is expected to help in further expanding its business by capturing the market shares and thereby adding value to AIML and the Bank.
Inspection of DocumentsCopies of Memorandum and Articles of Association of the Bank, Statement under Section 160(1)(b) & (c) of the Companies Ordinance, 1984, Annual and Quarterly financial statements as the case may and other related information/documents of the Bank and the investee companies which may be inspected/procured during business hours on any working day at the Registered Office of the Bank from the date of publication of this notice till conclusion of the Annual General Meeting.
27
28
Management
Head Office
M. R. Mehkari President & Chief Executive
Ejaz Ahmed KhanGroup Head, Commercial Banking
Tahir AzizGroup Head, Corporate & Investment Banking
S. Suhail Rizvi Group Head, Operations
Javed IqbalChief Information Officer
Rehan Mir Global Treasurer
Khalid Mohammad Khan Country Head, Compliance & Data
Khawaja Shaukat IqbalCountry Head, Special Asset Management
Hashim Khan Hoti Country Head, Islamic Banking Services
M. Farooq Abid TungCountry Head, Agriculture & Rural Business
Saleem Anwar Chief Financial Officer
Mohammad Munir Ahmed Country Head, Electronic Technology
Lubna Azam Chief Credit Officer
Mian Shaukat Ali Arif Sirhindi Country Head, Consumer Banking Services
Zahid Mahmood ChaudhryCountry Head, Human Resource
Israr Ahmed Executive Incharge, President Support Office & Acting Group Head Marketing & Strategic Planning
Farrukh Iqbal KhanCountry Head, Audit & Inspection
Adil ZaidiCountry Head, International Banking
Zehra KhalikdinaActing Country Head, Risk Management
Masood Qadir Country Head, Credit Administration
Brig. (R) Muhammad IfzalCountry Head, Establishment
Hassan Aziz Rana Head Legal Affairs
M. Ahmed Ghazali MarghoobCompany Secretary
Mr. Zulfiqar Ali KhanCountry Head, Corporate & Commercial Leasing
Azhar Ahmad SahibzadaActing Chief Information Security Officer
Regions/Areas/ W.B. Branch
North Region
Haseeb Saulat Regional General Manager
Tariq Mahmud KhanArea Manager, Rawalpindi – I
Inamullah Khan Niazi Area Manager, Azad Kashmir
Mohammad Tayyab KhanArea Manager, Islamabad
Tanveer Afzal Khan Area Manager, Peshawar
Syed Tauqir Haider RizviArea Manager, Rawalpindi – II
Central Region
Tahir Yaqoob BhattiRegional General Manager
Sajjad Ali SheikhArea Manager, Multan
Saulat Hameed Area Manager, Lahore – II
Ejaz Musarrat SiddiquiArea Manager, Lahore – I
Mushtaq AhmedArea Manager, Gujranwala
Tariq WaheedArea Manager, Faisalabad
Adnan AsgharArea Manager, Sahiwal
South Region
Khurshid ZafarRegional General Manager
Saif-ur-Rehman Khan Area Manager, Karachi – III
Niaz Mohammad Area Manager, Hyderabad
Qazi A.M. Khalid Area Manager, Karachi -I
Mirajuddin AzizArea Manager, Karachi – II
Hasan Raza KariArea Manager, Karachi – IV
Saleem Sohail ButtArea Manager, Quetta
Wholesale Bank Branch, Bahrain
Khurram Dar Branch Manager
29
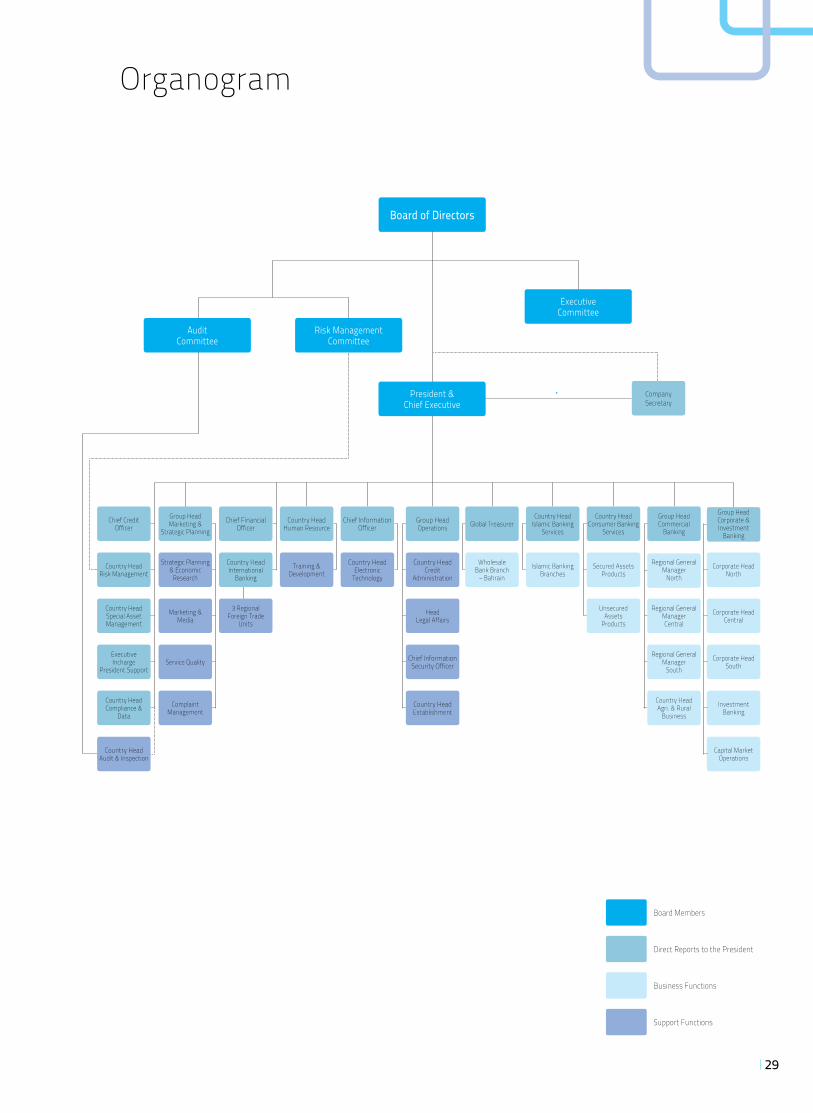
Organogram
Board Members
Direct Reports to the President
Business Functions
Support Functions
Country HeadConsumer Banking
Services
Chief Financial Officer
Country HeadInternational
Banking
Group HeadCorporate & Investment
Banking
Company Secretary
Group HeadMarketing &
Strategic Planning
Chief CreditOfficer
Country HeadRisk Management
Country HeadSpecial Asset Management
ExecutiveIncharge
President Support
Country HeadCompliance &
Data
Country HeadHuman Resource
Chief Information Officer
Group HeadOperations
Corporate HeadNorth
Corporate HeadCentral
Corporate HeadSouth
InvestmentBanking
Capital Market Operations
3 RegionalForeign Trade
Units
Strategic Planning & Economic
Research
Marketing &Media
Service Quality
Complaint Management
Training & Development
Country HeadElectronic
Technology
Country HeadCredit
Administration
HeadLegal Affairs
Chief InformationSecurity Officer
Country HeadEstablishment
Board of Directors
Audit Committee
President &Chief Executive
ExecutiveCommittee
Audit Committee
Audit Committee
Risk ManagementCommittee
AuditCommittee
Country HeadAudit & Inspection
Secured AssetsProducts
UnsecuredAssets
Products
Group HeadCommercial
Banking
Regional GeneralManager
North
Regional GeneralManagerCentral
Regional GeneralManager
South
Country HeadAgri. & Rural
Business
Country HeadIslamic Banking
Services
Islamic Banking Branches
Global Treasurer
WholesaleBank Branch
– Bahrain
30
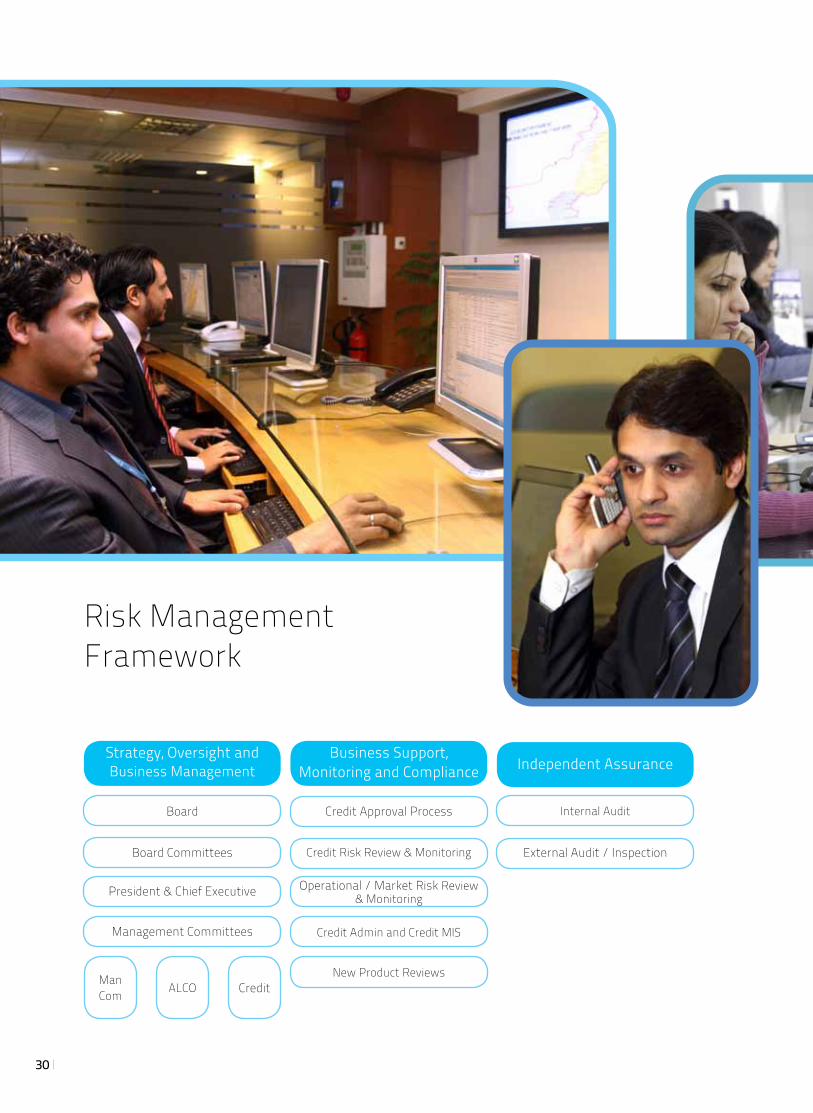
Risk ManagementFramework
Strategy, Oversight andBusiness Management
Board
Board Committees
President & Chief Executive
Management Committees
Internal Audit
External Audit / Inspection
Independent Assurance
Credit Risk Review & Monitoring
Operational / Market Risk Review& Monitoring
Credit Admin and Credit MIS
New Product Reviews
Business Support,Monitoring and Compliance
Credit Approval Process
ManCom
ALCO Credit
31
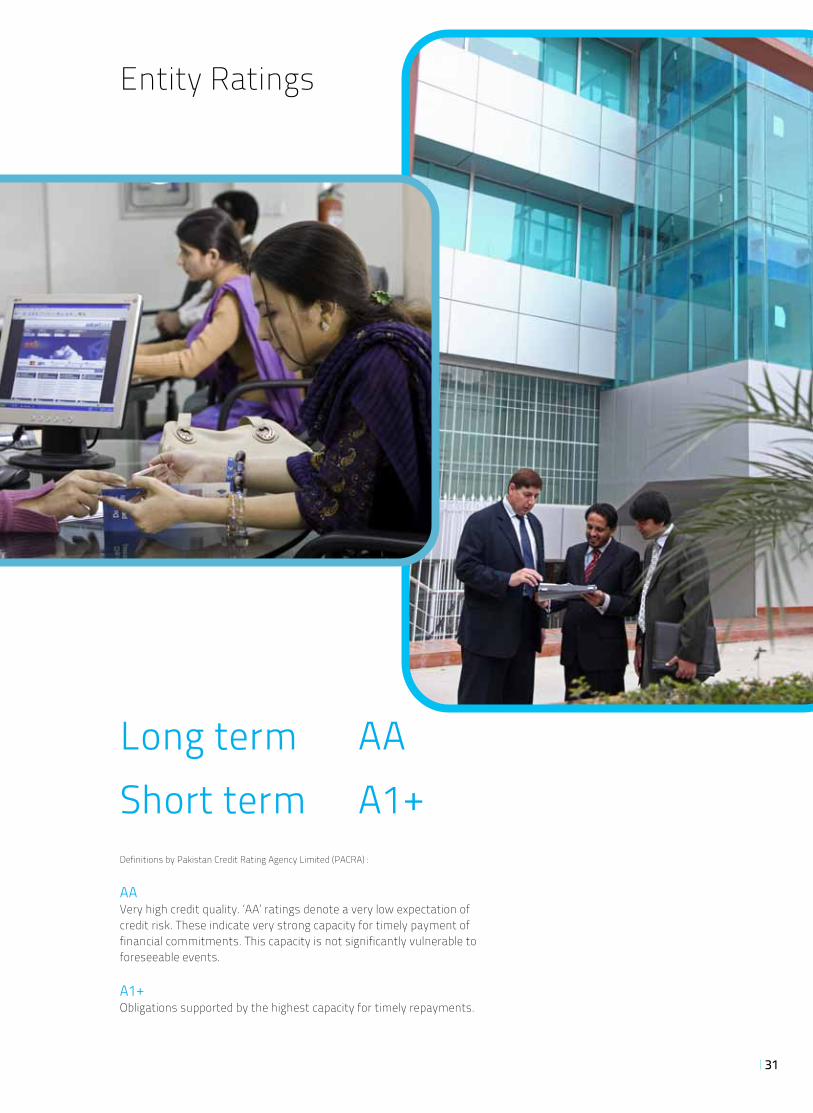
Entity Ratings
Long term AAShort term A1+Definitions by Pakistan Credit Rating Agency Limited (PACRA) :
AAVery high credit quality. ‘AA’ ratings denote a very low expectation of credit risk. These indicate very strong capacity for timely payment of financial commitments. This capacity is not significantly vulnerable to foreseeable events.
A1+Obligations supported by the highest capacity for timely repayments.
32
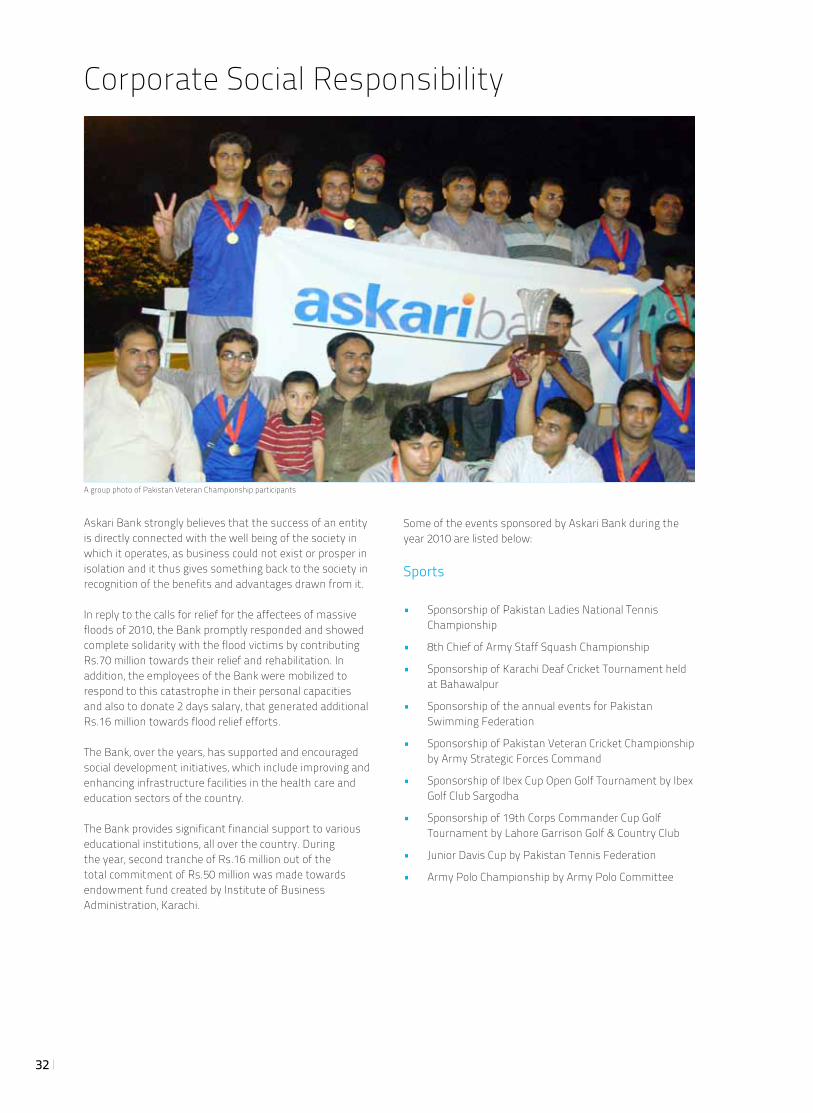
Corporate Social Responsibility
Askari Bank strongly believes that the success of an entity is directly connected with the well being of the society in which it operates, as business could not exist or prosper in isolation and it thus gives something back to the society in recognition of the benefits and advantages drawn from it.
In reply to the calls for relief for the affectees of massive floods of 2010, the Bank promptly responded and showed complete solidarity with the flood victims by contributing Rs.70 million towards their relief and rehabilitation. In addition, the employees of the Bank were mobilized to respond to this catastrophe in their personal capacities and also to donate 2 days salary, that generated additional Rs.16 million towards flood relief efforts.
The Bank, over the years, has supported and encouraged social development initiatives, which include improving and enhancing infrastructure facilities in the health care and education sectors of the country.
The Bank provides significant financial support to various educational institutions, all over the country. During the year, second tranche of Rs.16 million out of the total commitment of Rs.50 million was made towards endowment fund created by Institute of Business Administration, Karachi.
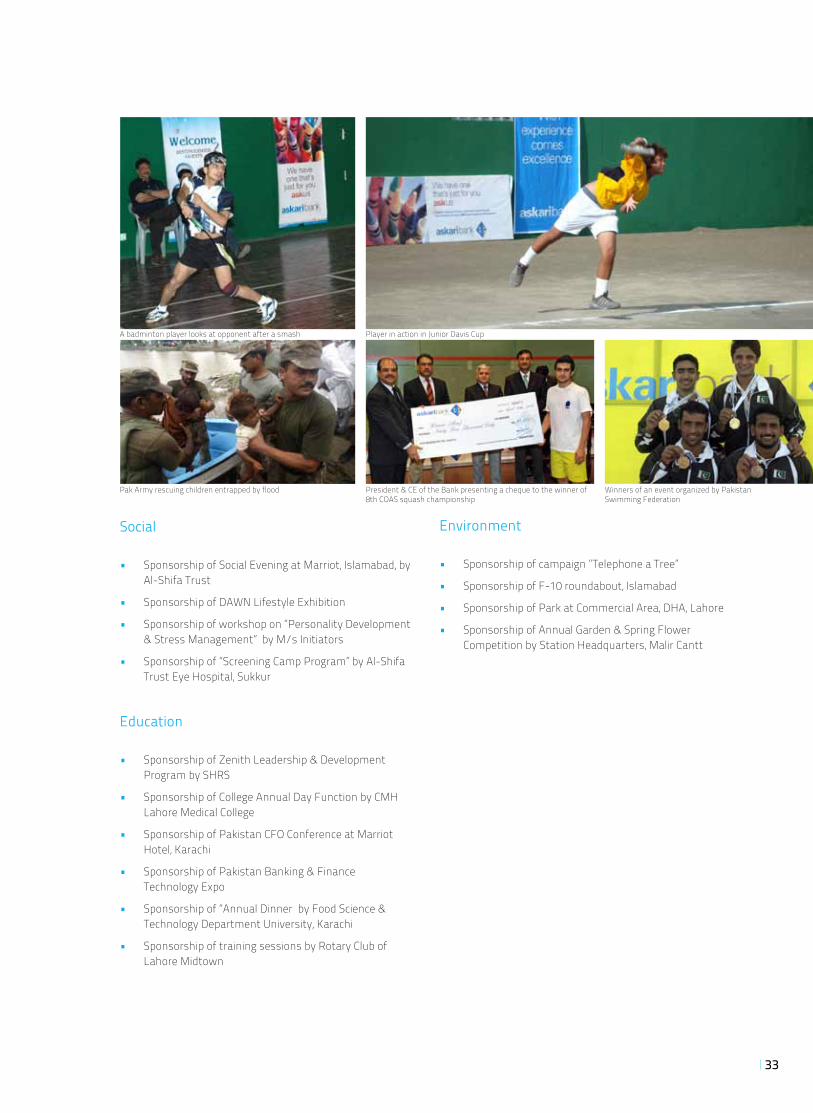
Some of the events sponsored by Askari Bank during the year 2010 are listed below:
Sports
• Sponsorship of Pakistan Ladies National Tennis Championship
• 8th Chief of Army Staff Squash Championship
• Sponsorship of Karachi Deaf Cricket Tournament held at Bahawalpur
• Sponsorship of the annual events for Pakistan Swimming Federation
• Sponsorship of Pakistan Veteran Cricket Championship by Army Strategic Forces Command
• Sponsorship of Ibex Cup Open Golf Tournament by Ibex Golf Club Sargodha
• Sponsorship of 19th Corps Commander Cup Golf Tournament by Lahore Garrison Golf & Country Club
• Junior Davis Cup by Pakistan Tennis Federation
• Army Polo Championship by Army Polo Committee
A group photo of Pakistan Veteran Championship participants
33
Social
• Sponsorship of Social Evening at Marriot, Islamabad, by Al-Shifa Trust
• Sponsorship of DAWN Lifestyle Exhibition
• Sponsorship of workshop on “Personality Development & Stress Management” by M/s Initiators
• Sponsorship of “Screening Camp Program” by Al-Shifa Trust Eye Hospital, Sukkur
Education
• Sponsorship of Zenith Leadership & Development Program by SHRS
• Sponsorship of College Annual Day Function by CMH Lahore Medical College
• Sponsorship of Pakistan CFO Conference at Marriot Hotel, Karachi
• Sponsorship of Pakistan Banking & Finance Technology Expo
• Sponsorship of “Annual Dinner by Food Science & Technology Department University, Karachi
• Sponsorship of training sessions by Rotary Club of Lahore Midtown
Environment
• Sponsorship of campaign “Telephone a Tree”
• Sponsorship of F-10 roundabout, Islamabad
• Sponsorship of Park at Commercial Area, DHA, Lahore
• Sponsorship of Annual Garden & Spring Flower Competition by Station Headquarters, Malir Cantt
Pak Army rescuing children entrapped by flood President & CE of the Bank presenting a cheque to the winner of 8th COAS squash championship
Player in action in Junior Davis CupA badminton player looks at opponent after a smash
Winners of an event organized by Pakistan Swimming Federation
34
President’s Message
Growing fiscal pressure on monetary manage-ment and the disruption caused by massive floods augmented the risks to macroeconomic price and stability of Pakistan’s economy during 2010. Power outages, inflationary pressures and the resulting rise in the costs of inputs continued to weigh heavily on the producing sectors, par-ticularly on industrial growth, and in turn on the financial services industry.
Askari Bank’s balance sheet registered a strong growth of 24% during 2010, to Rs.315 billion, from Rs.254 billion at end 2009. This growth was pur-sued as part of our strategy to generate revenues to off-set the loss of earnings caused by rising non-performing loans, which peaked at 12.8 per-cent of the gross advances at the close of 2010. In this situation, expeditious recovery from classified accounts and improvement in problem accounts pose great challenges and have been assigned top priority for the ensuing year.
During 2010, the amalgamation of the erstwhile Askari Leasing Limited with and into the Askari Bank Limited was successfully completed and has resulted in an expansion of our customer reach and proposition.
The core principle of our business philosophy is to understand our customers’ financial needs in the current environment and to offer them the right products and services backed by innovative technology-based solutions to support them in their financial success. As part of our strategy, we continued to strive for the best in offering technology-based solutions, which would also help us strengthen our control environment. The implementation of our technology initiatives made significant progress during 2010 and the core banking software, flexcube – a software of the Oracle Financial Services Software Limited, is running live in our 19 branches. It is planned for expansion to our entire branch network includ-ing our 31 dedicated Islamic banking branches. In addition, the Bank’s data warehouse has become operational and is being fine-tuned in order to provide the management with accurate, real time information, enabling them to make prudent and timely decisions. In order to house our new technology initiatives, which mostly operate in a centralized environment, the Bank has made significant investments in infrastructure. A new premises was acquired in Islamabad and has been customized with high availability and data
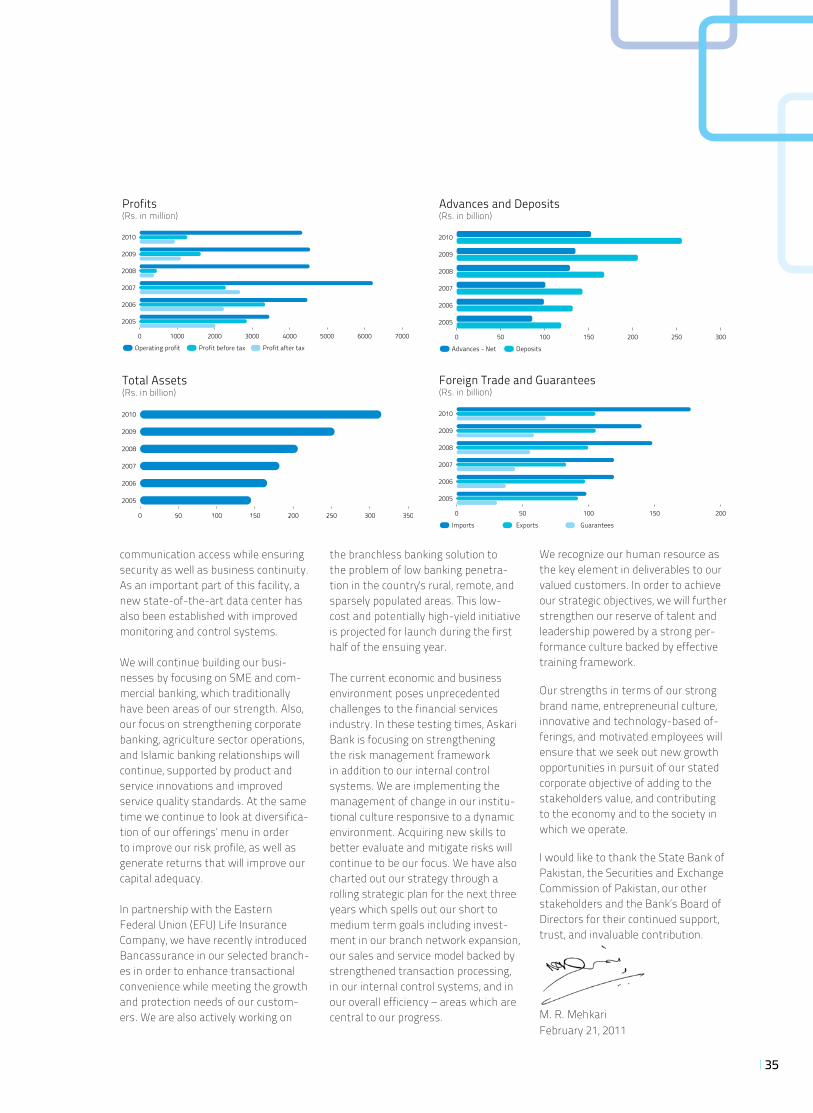
35
communication access while ensuring security as well as business continuity. As an important part of this facility, a new state-of-the-art data center has also been established with improved monitoring and control systems.
We will continue building our busi-nesses by focusing on SME and com-mercial banking, which traditionally have been areas of our strength. Also, our focus on strengthening corporate banking, agriculture sector operations, and Islamic banking relationships will continue, supported by product and service innovations and improved service quality standards. At the same time we continue to look at diversifica-tion of our offerings’ menu in order to improve our risk profile, as well as generate returns that will improve our capital adequacy.
In partnership with the Eastern Federal Union (EFU) Life Insurance Company, we have recently introduced Bancassurance in our selected branch-es in order to enhance transactional convenience while meeting the growth and protection needs of our custom-ers. We are also actively working on
the branchless banking solution to the problem of low banking penetra-tion in the country's rural, remote, and sparsely populated areas. This low-cost and potentially high-yield initiative is projected for launch during the first half of the ensuing year.
The current economic and business environment poses unprecedented challenges to the financial services industry. In these testing times, Askari Bank is focusing on strengthening the risk management framework in addition to our internal control systems. We are implementing the management of change in our institu-tional culture responsive to a dynamic environment. Acquiring new skills to better evaluate and mitigate risks will continue to be our focus. We have also charted out our strategy through a rolling strategic plan for the next three years which spells out our short to medium term goals including invest-ment in our branch network expansion, our sales and service model backed by strengthened transaction processing, in our internal control systems, and in our overall efficiency – areas which are central to our progress.
We recognize our human resource as the key element in deliverables to our valued customers. In order to achieve our strategic objectives, we will further strengthen our reserve of talent and leadership powered by a strong per-formance culture backed by effective training framework.
Our strengths in terms of our strong brand name, entrepreneurial culture, innovative and technology-based of-ferings, and motivated employees will ensure that we seek out new growth opportunities in pursuit of our stated corporate objective of adding to the stakeholders value, and contributing to the economy and to the society in which we operate.
I would like to thank the State Bank of Pakistan, the Securities and Exchange Commission of Pakistan, our other stakeholders and the Bank’s Board of Directors for their continued support, trust, and invaluable contribution.
M. R. MehkariFebruary 21, 2011
Profits(Rs. in million)
Operating profit Profit before tax Profit after tax
0 1000 2000 3000 4000 5000 6000 7000
2010
2009
2008
2007
2006
2005
Total Assets(Rs. in billion)
2010
2009
2008
2007
2006
2005
Advances and Deposits(Rs. in billion)
Advances - Net Deposits
0 50 100 150 200 250 300
2010
2009
2008
2007
2006
2005
Foreign Trade and Guarantees(Rs. in billion)
Imports Exports Guarantees
0 50 100 150 200
2010
2009
2008
2007
2006
2005
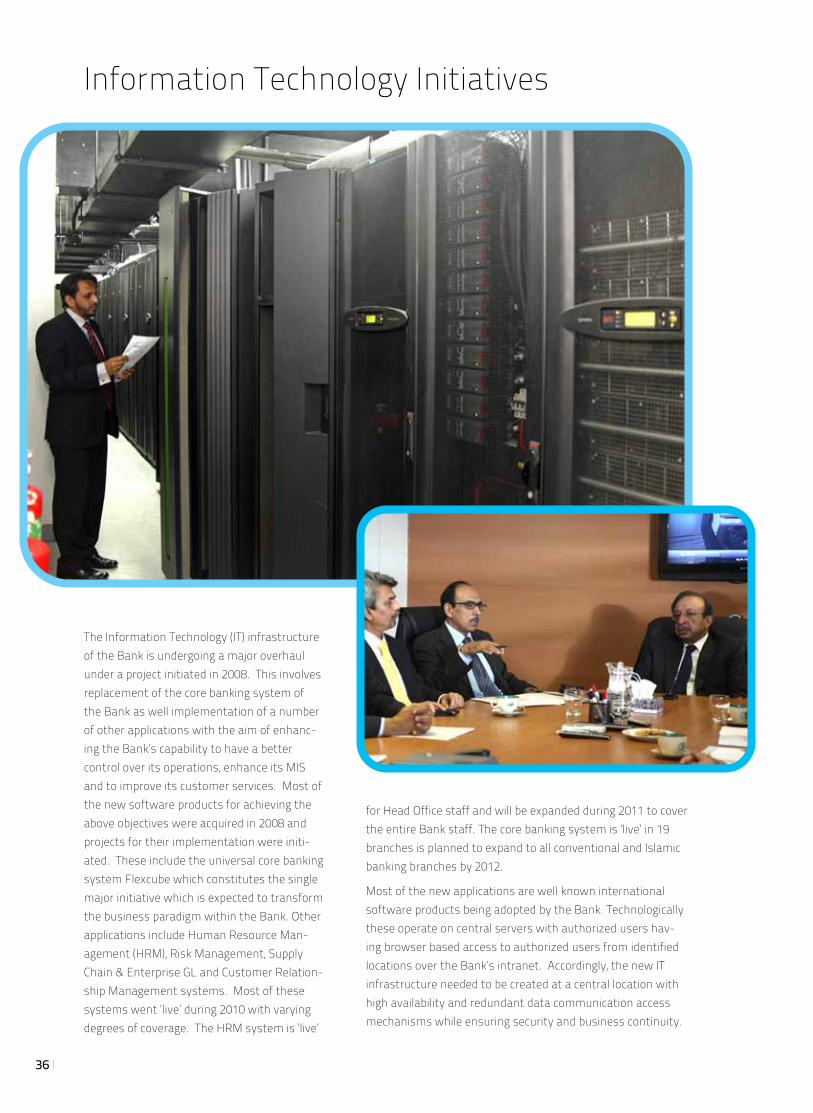
36
Information Technology Initiatives
The Information Technology (IT) infrastructure of the Bank is undergoing a major overhaul under a project initiated in 2008. This involves replacement of the core banking system of the Bank as well implementation of a number of other applications with the aim of enhanc-ing the Bank’s capability to have a better control over its operations, enhance its MIS and to improve its customer services. Most of the new software products for achieving the above objectives were acquired in 2008 and projects for their implementation were initi-ated. These include the universal core banking system Flexcube which constitutes the single major initiative which is expected to transform the business paradigm within the Bank. Other applications include Human Resource Man-agement (HRM), Risk Management, Supply Chain & Enterprise GL and Customer Relation-ship Management systems. Most of these systems went ‘live’ during 2010 with varying degrees of coverage. The HRM system is ‘live’
for Head Office staff and will be expanded during 2011 to cover the entire Bank staff. The core banking system is ‘live’ in 19 branches is planned to expand to all conventional and Islamic banking branches by 2012.
Most of the new applications are well known international software products being adopted by the Bank. Technologically these operate on central servers with authorized users hav-ing browser based access to authorized users from identified locations over the Bank’s intranet. Accordingly, the new IT infrastructure needed to be created at a central location with high availability and redundant data communication access mechanisms while ensuring security and business continuity.
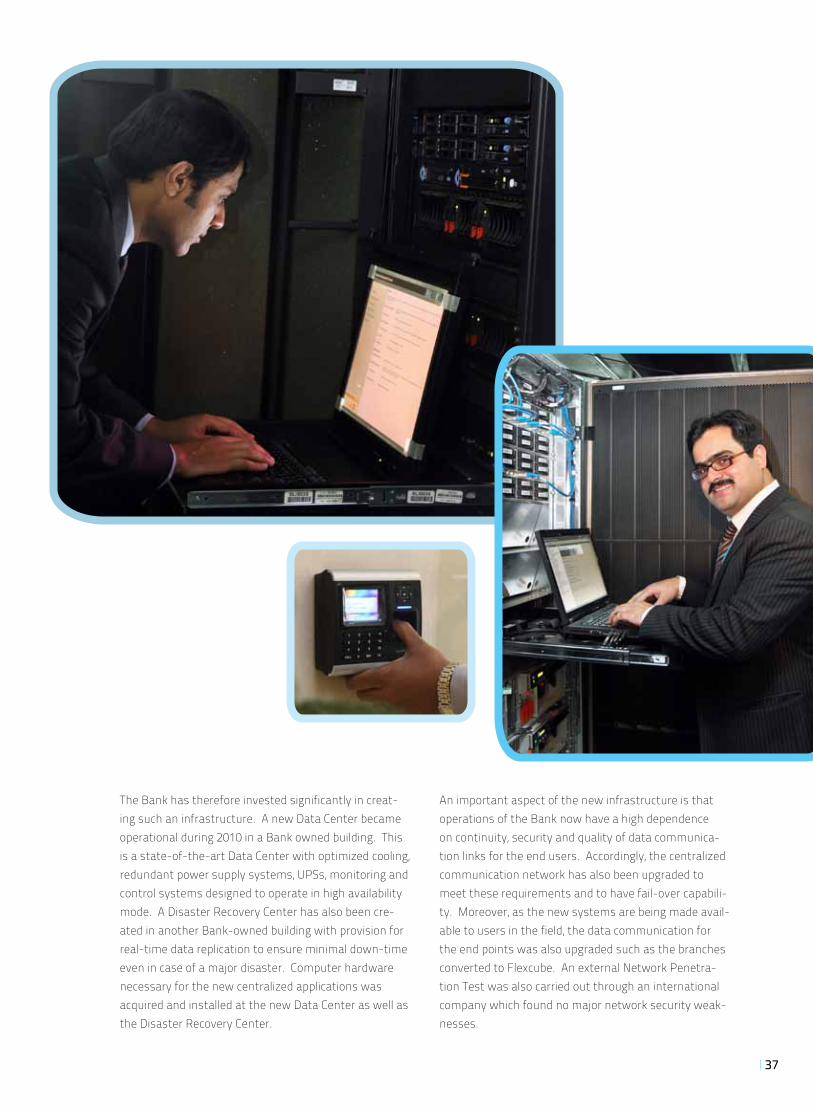
37
The Bank has therefore invested significantly in creat-ing such an infrastructure. A new Data Center became operational during 2010 in a Bank owned building. This is a state-of-the-art Data Center with optimized cooling, redundant power supply systems, UPSs, monitoring and control systems designed to operate in high availability mode. A Disaster Recovery Center has also been cre-ated in another Bank-owned building with provision for real-time data replication to ensure minimal down-time even in case of a major disaster. Computer hardware necessary for the new centralized applications was acquired and installed at the new Data Center as well as the Disaster Recovery Center.
An important aspect of the new infrastructure is that operations of the Bank now have a high dependence on continuity, security and quality of data communica-tion links for the end users. Accordingly, the centralized communication network has also been upgraded to meet these requirements and to have fail-over capabili-ty. Moreover, as the new systems are being made avail-able to users in the field, the data communication for the end points was also upgraded such as the branches converted to Flexcube. An external Network Penetra-tion Test was also carried out through an international company which found no major network security weak-nesses.
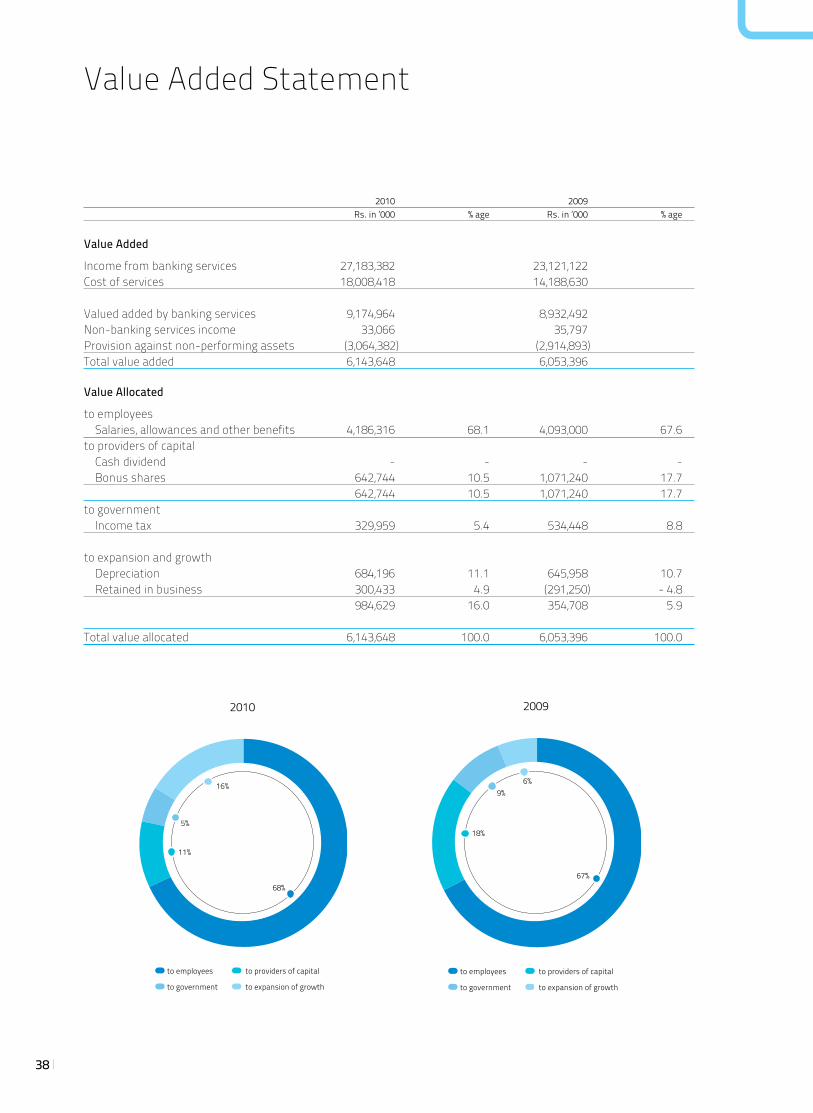
38
Value Added Statement
2010 2009 Rs. in ‘000 % age Rs. in ‘000 % age
Value Added
Income from banking services 27,183,382 23,121,122 Cost of services 18,008,418 14,188,630 Valued added by banking services 9,174,964 8,932,492 Non-banking services income 33,066 35,797 Provision against non-performing assets (3,064,382) (2,914,893) Total value added 6,143,648 6,053,396
Value Allocated
to employees Salaries, allowances and other benefits 4,186,316 68.1 4,093,000 67.6 to providers of capital Cash dividend - - - - Bonus shares 642,744 10.5 1,071,240 17.7 642,744 10.5 1,071,240 17.7 to government Income tax 329,959 5.4 534,448 8.8 to expansion and growth Depreciation 684,196 11.1 645,958 10.7 Retained in business 300,433 4.9 (291,250) - 4.8 984,629 16.0 354,708 5.9 Total value allocated 6,143,648 100.0 6,053,396 100.0
to employees to providers of capital
to government to expansion of growth
2010
5%
16%
68%
11%
to employees to providers of capital
to government to expansion of growth
2009
9%6%
67%
18%
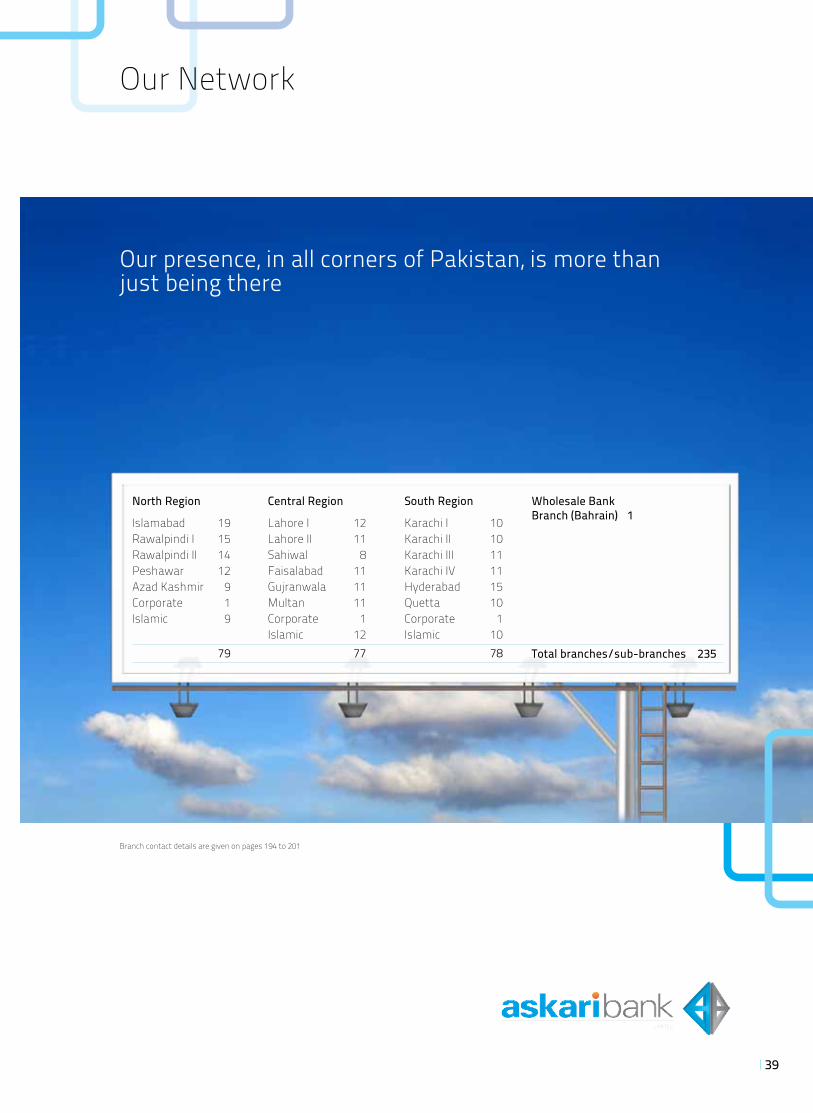
39
Our Network
North Region
Islamabad 19Rawalpindi I 15Rawalpindi II 14Peshawar 12Azad Kashmir 9Corporate 1Islamic 9
79
Central Region
Lahore I 12Lahore II 11Sahiwal 8Faisalabad 11Gujranwala 11Multan 11Corporate 1Islamic 12 77
South Region
Karachi I 10Karachi II 10Karachi III 11Karachi IV 11Hyderabad 15Quetta 10Corporate 1Islamic 10 78
Our presence, in all corners of Pakistan, is more than just being there
Branch contact details are given on pages 194 to 201
Wholesale Bank Branch (Bahrain) 1
Total branches/sub-branches 235
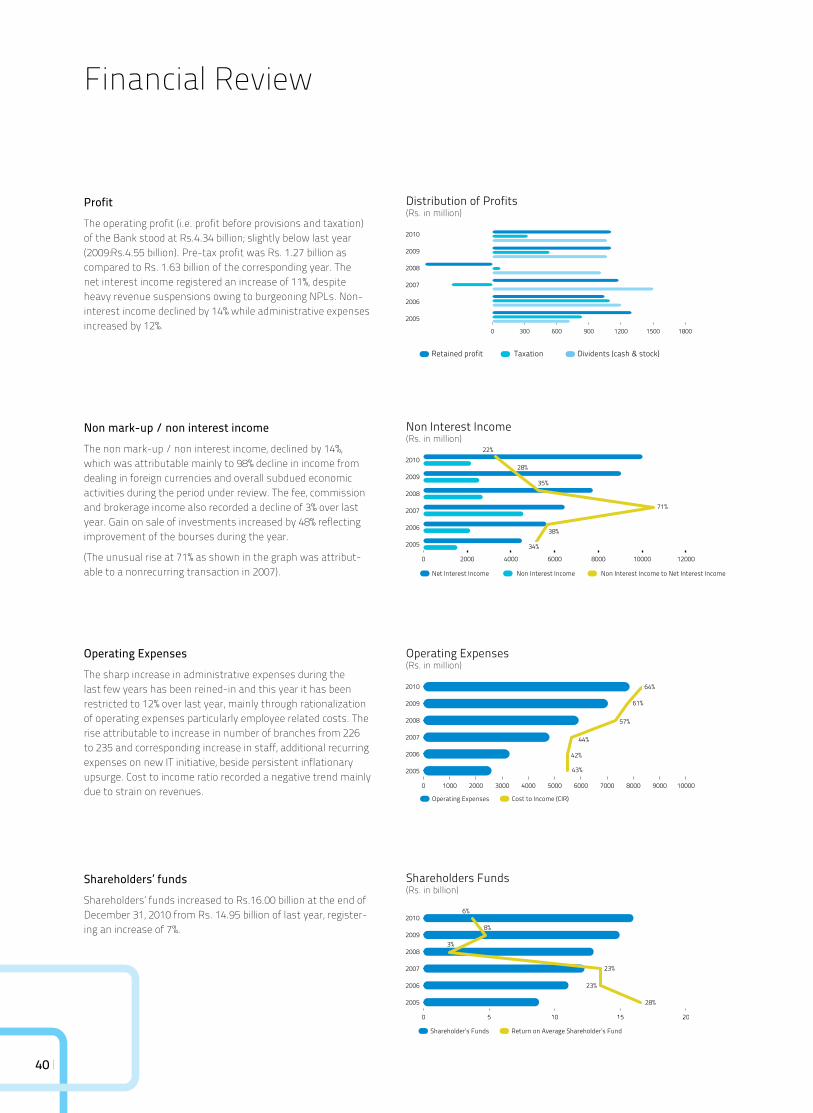
40
Financial Review
ProfitThe operating profit (i.e. profit before provisions and taxation) of the Bank stood at Rs.4.34 billion; slightly below last year (2009:Rs.4.55 billion). Pre-tax profit was Rs. 1.27 billion as compared to Rs. 1.63 billion of the corresponding year. The net interest income registered an increase of 11%, despite heavy revenue suspensions owing to burgeoning NPLs. Non-interest income declined by 14% while administrative expenses increased by 12%.
Non mark-up / non interest incomeThe non mark-up / non interest income, declined by 14%, which was attributable mainly to 98% decline in income from dealing in foreign currencies and overall subdued economic activities during the period under review. The fee, commission and brokerage income also recorded a decline of 3% over last year. Gain on sale of investments increased by 48% reflecting improvement of the bourses during the year.
(The unusual rise at 71% as shown in the graph was attribut-able to a nonrecurring transaction in 2007).
Operating ExpensesThe sharp increase in administrative expenses during the last few years has been reined-in and this year it has been restricted to 12% over last year, mainly through rationalization of operating expenses particularly employee related costs. The rise attributable to increase in number of branches from 226 to 235 and corresponding increase in staff, additional recurring expenses on new IT initiative, beside persistent inflationary upsurge. Cost to income ratio recorded a negative trend mainly due to strain on revenues.
Shareholders’ fundsShareholders’ funds increased to Rs.16.00 billion at the end of December 31, 2010 from Rs. 14.95 billion of last year, register-ing an increase of 7%.
Shareholders Funds(Rs. in billion)
2010
28%
23%
23%
3%
8%
6%
2009
2008
2007
2006
2005
Shareholder’s Funds Return on Average Shareholder’s Fund
Distribution of Profits(Rs. in million)
0 300 600 900 1200 1500 1800
2010
2009
2008
2007
2006
2005
Retained profit Taxation Dividents (cash & stock)
Non Interest Income(Rs. in million)
Net Interest Income Non Interest Income Non Interest Income to Net Interest Income
0 2000 4000 6000 8000 10000 12000
2010
2009
2008
2007
2006
2005 34%
38%
71%
35%
28%
22%
Operating Expenses(Rs. in million)
Operating Expenses Cost to Income (CIR)
0 1000 2000 3000 4000 5000 6000 7000 8000 9000 10000
2010
2009
2008
2007
2006
2005
64%
61%
57%
44%
42%
43%
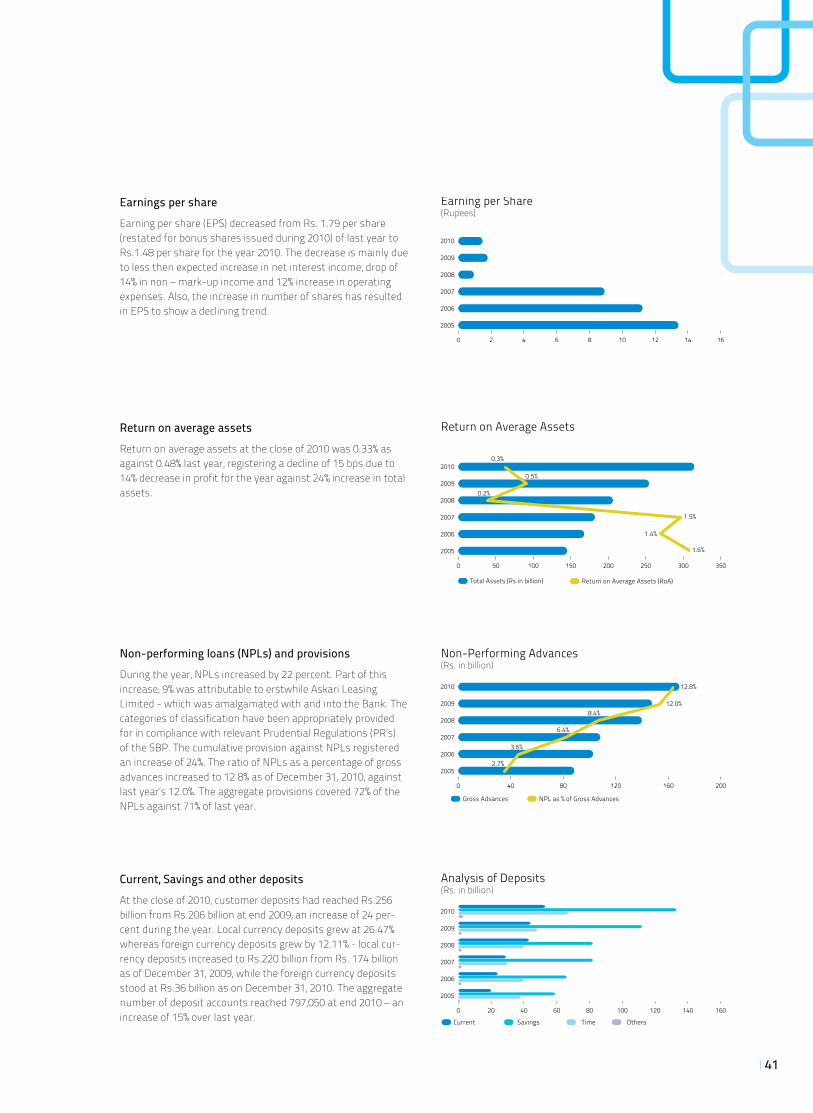
41
Non-performing loans (NPLs) and provisionsDuring the year, NPLs increased by 22 percent. Part of this increase, 9% was attributable to erstwhile Askari Leasing Limited - which was amalgamated with and into the Bank. The categories of classification have been appropriately provided for in compliance with relevant Prudential Regulations (PR’s) of the SBP. The cumulative provision against NPLs registered an increase of 24%. The ratio of NPLs as a percentage of gross advances increased to 12.8% as of December 31, 2010, against last year’s 12.0%. The aggregate provisions covered 72% of the NPLs against 71% of last year.
Current, Savings and other depositsAt the close of 2010, customer deposits had reached Rs.256 billion from Rs.206 billion at end 2009, an increase of 24 per-cent during the year. Local currency deposits grew at 26.47% whereas foreign currency deposits grew by 12.11% - local cur-rency deposits increased to Rs.220 billion from Rs. 174 billion as of December 31, 2009, while the foreign currency deposits stood at Rs.36 billion as on December 31, 2010. The aggregate number of deposit accounts reached 797,050 at end 2010 – an increase of 15% over last year.
Earnings per shareEarning per share (EPS) decreased from Rs. 1.79 per share (restated for bonus shares issued during 2010) of last year to Rs.1.48 per share for the year 2010. The decrease is mainly due to less then expected increase in net interest income, drop of 14% in non – mark-up income and 12% increase in operating expenses. Also, the increase in number of shares has resulted in EPS to show a declining trend.
Return on average assetsReturn on average assets at the close of 2010 was 0.33% as against 0.48% last year, registering a decline of 15 bps due to 14% decrease in profit for the year against 24% increase in total assets.
Non-Performing Advances(Rs. in billion)
2010 12.8%
12.0% 8.4%
6.4%
3.6%
2.7%
2009
2008
2007
2006
2005
Gross Advances NPL as % of Gross Advances
Analysis of Deposits(Rs. in billion)
Current Savings Time Others
0 20 40 60 80 100 120 140 160
2010
2009
2008
2007
2006
2005
Earning per Share(Rupees)
2010
2009
2008
2007
2006
2005
Return on Average Assets
2010
1.6%
1.4%
1.5%
0.2%
0.5%
0.3%
2009
2008
2007
2006
2005
Total Assets (Rs in billion) Return on Average Assets (RoA)
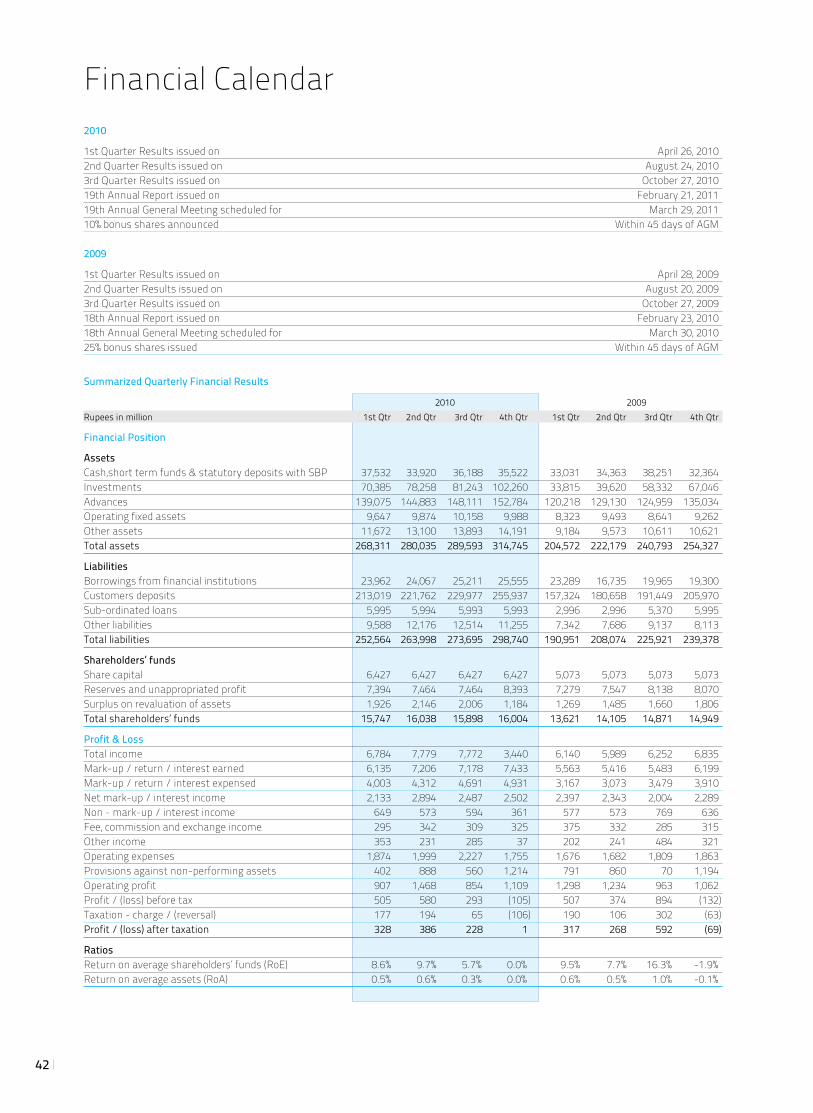
42
Financial Calendar2010
1st Quarter Results issued on April 26, 20102nd Quarter Results issued on August 24, 20103rd Quarter Results issued on October 27, 201019th Annual Report issued on February 21, 201119th Annual General Meeting scheduled for March 29, 201110% bonus shares announced Within 45 days of AGM 2009
1st Quarter Results issued on April 28, 20092nd Quarter Results issued on August 20, 20093rd Quarter Results issued on October 27, 200918th Annual Report issued on February 23, 201018th Annual General Meeting scheduled for March 30, 201025% bonus shares issued Within 45 days of AGM
Summarized Quarterly Financial Results
2010 2009 Rupees in million 1st Qtr 2nd Qtr 3rd Qtr 4th Qtr 1st Qtr 2nd Qtr 3rd Qtr 4th Qtr
Financial Position
Assets Cash,short term funds & statutory deposits with SBP 37,532 33,920 36,188 35,522 33,031 34,363 38,251 32,364 Investments 70,385 78,258 81,243 102,260 33,815 39,620 58,332 67,046 Advances 139,075 144,883 148,111 152,784 120,218 129,130 124,959 135,034 Operating fixed assets 9,647 9,874 10,158 9,988 8,323 9,493 8,641 9,262 Other assets 11,672 13,100 13,893 14,191 9,184 9,573 10,611 10,621 Total assets 268,311 280,035 289,593 314,745 204,572 222,179 240,793 254,327
Liabilities Borrowings from financial institutions 23,962 24,067 25,211 25,555 23,289 16,735 19,965 19,300 Customers deposits 213,019 221,762 229,977 255,937 157,324 180,658 191,449 205,970 Sub-ordinated loans 5,995 5,994 5,993 5,993 2,996 2,996 5,370 5,995 Other liabilities 9,588 12,176 12,514 11,255 7,342 7,686 9,137 8,113 Total liabilities 252,564 263,998 273,695 298,740 190,951 208,074 225,921 239,378
Shareholders’ funds Share capital 6,427 6,427 6,427 6,427 5,073 5,073 5,073 5,073 Reserves and unappropriated profit 7,394 7,464 7,464 8,393 7,279 7,547 8,138 8,070 Surplus on revaluation of assets 1,926 2,146 2,006 1,184 1,269 1,485 1,660 1,806 Total shareholders’ funds 15,747 16,038 15,898 16,004 13,621 14,105 14,871 14,949
Profit & Loss Total income 6,784 7,779 7,772 3,440 6,140 5,989 6,252 6,835 Mark-up / return / interest earned 6,135 7,206 7,178 7,433 5,563 5,416 5,483 6,199 Mark-up / return / interest expensed 4,003 4,312 4,691 4,931 3,167 3,073 3,479 3,910 Net mark-up / interest income 2,133 2,894 2,487 2,502 2,397 2,343 2,004 2,289 Non - mark-up / interest income 649 573 594 361 577 573 769 636 Fee, commission and exchange income 295 342 309 325 375 332 285 315 Other income 353 231 285 37 202 241 484 321 Operating expenses 1,874 1,999 2,227 1,755 1,676 1,682 1,809 1,863 Provisions against non-performing assets 402 888 560 1,214 791 860 70 1,194 Operating profit 907 1,468 854 1,109 1,298 1,234 963 1,062 Profit / (loss) before tax 505 580 293 (105) 507 374 894 (132)Taxation - charge / (reversal) 177 194 65 (106) 190 106 302 (63)Profit / (loss) after taxation 328 386 228 1 317 268 592 (69)
Ratios Return on average shareholders’ funds (RoE) 8.6% 9.7% 5.7% 0.0% 9.5% 7.7% 16.3% -1.9%Return on average assets (RoA) 0.5% 0.6% 0.3% 0.0% 0.6% 0.5% 1.0% -0.1%
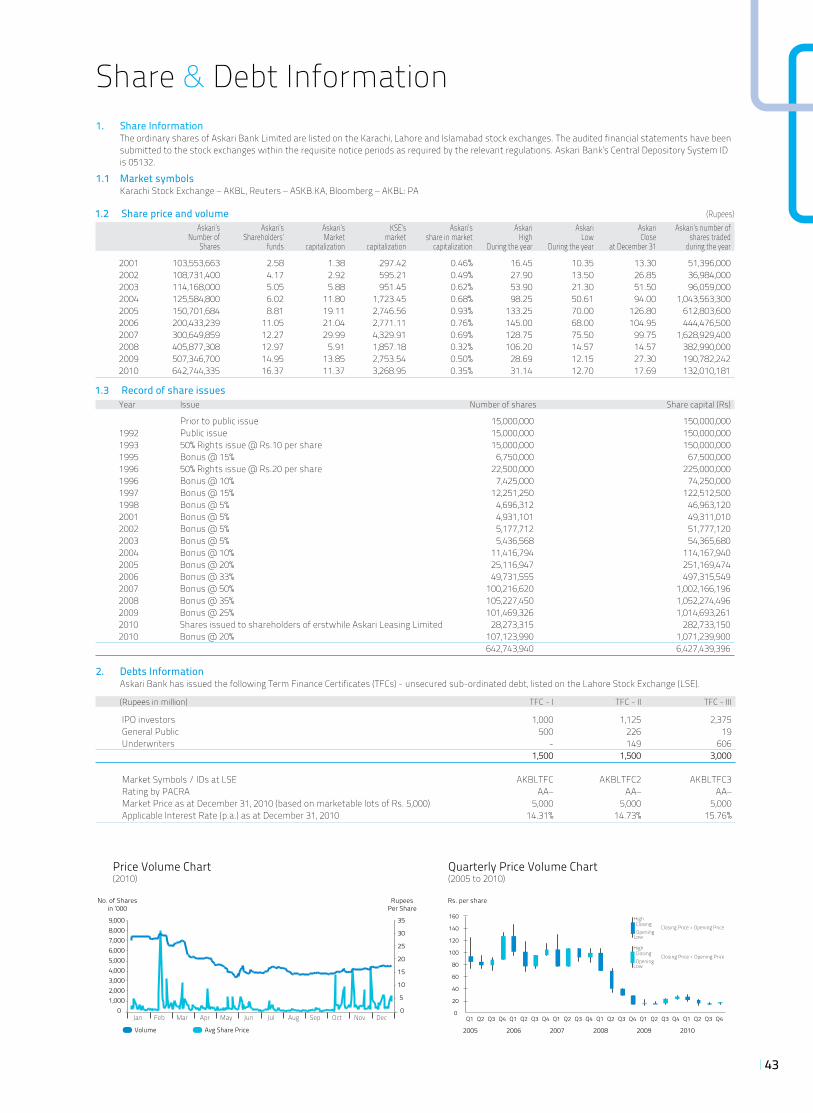
Share & Debt Information
1.2 Share price and volume (Rupees) Askari’s Askari’s Askari’s KSE’s Askari’s Askari Askari Askari Askari’s number of Number of Shareholders’ Market market share in market High Low Close shares traded Shares funds capitalization capitalization capitalization During the year During the year at December 31 during the year
2001 103,553,663 2.58 1.38 297.42 0.46% 16.45 10.35 13.30 51,396,000 2002 108,731,400 4.17 2.92 595.21 0.49% 27.90 13.50 26.85 36,984,000 2003 114,168,000 5.05 5.88 951.45 0.62% 53.90 21.30 51.50 96,059,000 2004 125,584,800 6.02 11.80 1,723.45 0.68% 98.25 50.61 94.00 1,043,563,300 2005 150,701,684 8.81 19.11 2,746.56 0.93% 133.25 70.00 126.80 612,803,600 2006 200,433,239 11.05 21.04 2,771.11 0.76% 145.00 68.00 104.95 444,476,500 2007 300,649,859 12.27 29.99 4,329.91 0.69% 128.75 75.50 99.75 1,628,929,400 2008 405,877,308 12.97 5.91 1,857.18 0.32% 106.20 14.57 14.57 382,990,000 2009 507,346,700 14.95 13.85 2,753.54 0.50% 28.69 12.15 27.30 190,782,242 2010 642,744,335 16.37 11.37 3,268.95 0.35% 31.14 12.70 17.69 132,010,181
1.3 Record of share issues Year Issue Number of shares Share capital (Rs)
Prior to public issue 15,000,000 150,000,000 1992 Public issue 15,000,000 150,000,000 1993 50% Rights issue @ Rs.10 per share 15,000,000 150,000,000 1995 Bonus @ 15% 6,750,000 67,500,000 1996 50% Rights issue @ Rs.20 per share 22,500,000 225,000,000 1996 Bonus @ 10% 7,425,000 74,250,000 1997 Bonus @ 15% 12,251,250 122,512,500 1998 Bonus @ 5% 4,696,312 46,963,120 2001 Bonus @ 5% 4,931,101 49,311,010 2002 Bonus @ 5% 5,177,712 51,777,120 2003 Bonus @ 5% 5,436,568 54,365,680 2004 Bonus @ 10% 11,416,794 114,167,940 2005 Bonus @ 20% 25,116,947 251,169,474 2006 Bonus @ 33% 49,731,555 497,315,549 2007 Bonus @ 50% 100,216,620 1,002,166,196 2008 Bonus @ 35% 105,227,450 1,052,274,496 2009 Bonus @ 25% 101,469,326 1,014,693,261 2010 Shares issued to shareholders of erstwhile Askari Leasing Limited 28,273,315 282,733,150 2010 Bonus @ 20% 107,123,990 1,071,239,900 642,743,940 6,427,439,396
2. Debts Information Askari Bank has issued the following Term Finance Certificates (TFCs) - unsecured sub-ordinated debt, listed on the Lahore Stock Exchange (LSE).
(Rupees in million) TFC - I TFC - II TFC - III
IPO investors 1,000 1,125 2,375 General Public 500 226 19 Underwriters - 149 606 1,500 1,500 3,000 Market Symbols / IDs at LSE AKBLTFC AKBLTFC2 AKBLTFC3 Rating by PACRA AA– AA– AA– Market Price as at December 31, 2010 (based on marketable lots of Rs. 5,000) 5,000 5,000 5,000 Applicable Interest Rate (p.a.) as at December 31, 2010 14.31% 14.73% 15.76%
1. Share Information The ordinary shares of Askari Bank Limited are listed on the Karachi, Lahore and Islamabad stock exchanges. The audited financial statements have been
submitted to the stock exchanges within the requisite notice periods as required by the relevant regulations. Askari Bank’s Central Depository System ID is 05132.
1.1 Market symbols Karachi Stock Exchange – AKBL, Reuters – ASKB.KA, Bloomberg – AKBL: PA
Price Volume Chart(2010)
Volume Avg Share Price
0
5
10
15
20
25
30
35
0 1,000 2,000 3,000 4,000 5,000 6,000 7,000 8,000 9,000
No. of Sharesin ‘000
RupeesPer Share
Jan Feb Mar Apr May Jun Jul Aug Sep Oct Nov Dec
Quarterly Price Volume Chart(2005 to 2010)
0
20
40
60
80
100
120
140
160
Q1
2005
Q2
Q3
Q4
Q1
2006
Q2
Q3
Q4
Q1
2007
Q2
Q3
Q4
Q1
2008
Q2
Q3
Q4
Q1
2009
Q2
Q3
Q4
Q1
2010
Q2
Q3
Q4
HighClosingOpening
Closing Price > Opening Price
Low
Closing Price < Opening Price
HighClosingOpening
Low
Rs. per share
43
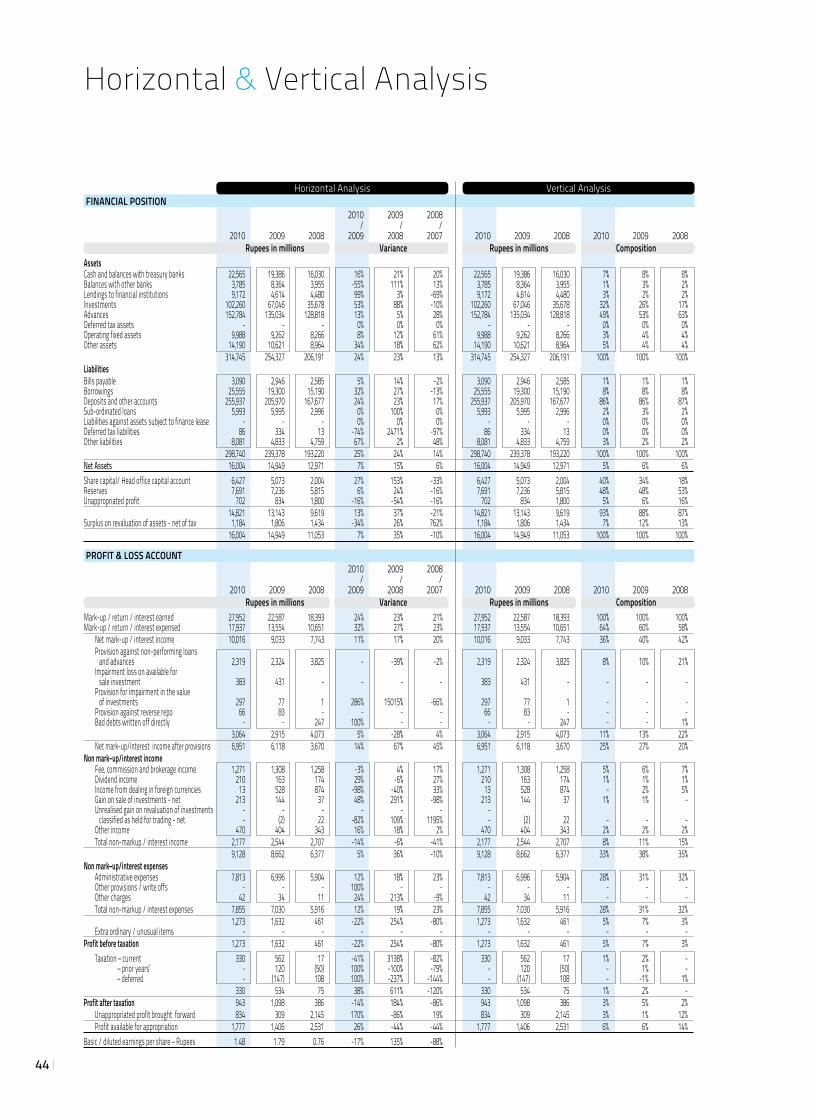
Horizontal & Vertical Analysis
FINANCIAL POSITION 2010 2009 2008 / / / 2010 2009 2008 2009 2008 2007 2010 2009 2008 2010 2009 2008 Rupees in millions Variance Rupees in millions Composition AssetsCash and balances with treasury banks 22,565 19,386 16,030 16% 21% 20% 22,565 19,386 16,030 7% 8% 8%Balances with other banks 3,785 8,364 3,955 -55% 111% 13% 3,785 8,364 3,955 1% 3% 2%Lendings to financial institutions 9,172 4,614 4,480 99% 3% -69% 9,172 4,614 4,480 3% 2% 2%Investments 102,260 67,046 35,678 53% 88% -10% 102,260 67,046 35,678 32% 26% 17%Advances 152,784 135,034 128,818 13% 5% 28% 152,784 135,034 128,818 49% 53% 63%Deferred tax assets - - - 0% 0% 0% - - - 0% 0% 0% Operating fixed assets 9,988 9,262 8,266 8% 12% 61% 9,988 9,262 8,266 3% 4% 4%Other assets 14,190 10,621 8,964 34% 18% 62% 14,190 10,621 8,964 5% 4% 4% 314,745 254,327 206,191 24% 23% 13% 314,745 254,327 206,191 100% 100% 100%LiabilitiesBills payable 3,090 2,946 2,585 5% 14% -2% 3,090 2,946 2,585 1% 1% 1%Borrowings 25,555 19,300 15,190 32% 27% -13% 25,555 19,300 15,190 8% 8% 8%Deposits and other accounts 255,937 205,970 167,677 24% 23% 17% 255,937 205,970 167,677 86% 86% 87%Sub-ordinated loans 5,993 5,995 2,996 0% 100% 0% 5,993 5,995 2,996 2% 3% 2%Liabilities against assets subject to finance lease - - - 0% 0% 0% - - - 0% 0% 0%Deferred tax liabilities 86 334 13 -74% 2471% -97% 86 334 13 0% 0% 0%Other liabilities 8,081 4,833 4,759 67% 2% 48% 8,081 4,833 4,759 3% 2% 2% 298,740 239,378 193,220 25% 24% 14% 298,740 239,378 193,220 100% 100% 100%Net Assets 16,004 14,949 12,971 7% 15% 6% 16,004 14,949 12,971 5% 6% 6%Share capital/ Head office capital account 6,427 5,073 2,004 27% 153% -33% 6,427 5,073 2,004 40% 34% 18%Reserves 7,691 7,236 5,815 6% 24% -16% 7,691 7,236 5,815 48% 48% 53%Unappropriated profit 702 834 1,800 -16% -54% -16% 702 834 1,800 5% 6% 16% 14,821 13,143 9,619 13% 37% -21% 14,821 13,143 9,619 93% 88% 87%Surplus on revaluation of assets - net of tax 1,184 1,806 1,434 -34% 26% 762% 1,184 1,806 1,434 7% 12% 13% 16,004 14,949 11,053 7% 35% -10% 16,004 14,949 11,053 100% 100% 100%
PROFIT & LOSS ACCOUNT 2010 2009 2008 / / / 2010 2009 2008 2009 2008 2007 2010 2009 2008 2010 2009 2008 Rupees in millions Variance Rupees in millions Composition Mark-up / return / interest earned 27,952 22,587 18,393 24% 23% 21% 27,952 22,587 18,393 100% 100% 100%Mark-up / return / interest expensed 17,937 13,554 10,651 32% 27% 23% 17,937 13,554 10,651 64% 60% 58% Net mark-up / interest income 10,016 9,033 7,743 11% 17% 20% 10,016 9,033 7,743 36% 40% 42% Provision against non-performing loans and advances 2,319 2,324 3,825 - -39% -2% 2,319 2,324 3,825 8% 10% 21% Impairment loss on available for sale investment 383 431 - - - - 383 431 - - - - Provision for impairment in the value of investments 297 77 1 286% 15015% -66% 297 77 1 - - - Provision against reverse repo 66 83 - - - - 66 83 - - - - Bad debts written off directly - - 247 100% - - - - 247 - - 1% 3,064 2,915 4,073 5% -28% 4% 3,064 2,915 4,073 11% 13% 22% Net mark-up/interest income after provisions 6,951 6,118 3,670 14% 67% 45% 6,951 6,118 3,670 25% 27% 20%Non mark–up/interest income Fee, commission and brokerage income 1,271 1,308 1,258 -3% 4% 17% 1,271 1,308 1,258 5% 6% 7% Dividend income 210 163 174 29% -6% 27% 210 163 174 1% 1% 1% Income from dealing in foreign currencies 13 528 874 -98% -40% 33% 13 528 874 - 2% 5% Gain on sale of investments - net 213 144 37 48% 291% -98% 213 144 37 1% 1% - Unrealised gain on revaluation of investments - - - - - - - classified as held for trading - net - (2) 22 -82% 109% 1195% - (2) 22 - - - Other income 470 404 343 16% 18% 2% 470 404 343 2% 2% 2% Total non-markup / interest income 2,177 2,544 2,707 -14% -6% -41% 2,177 2,544 2,707 8% 11% 15% 9,128 8,662 6,377 5% 36% -10% 9,128 8,662 6,377 33% 38% 35%Non mark–up/interest expenses Administrative expenses 7,813 6,996 5,904 12% 18% 23% 7,813 6,996 5,904 28% 31% 32% Other provisions / write offs - - - 100% - - - - - - - - Other charges 42 34 11 24% 213% -9% 42 34 11 - - - Total non-markup / interest expenses 7,855 7,030 5,916 12% 19% 23% 7,855 7,030 5,916 28% 31% 32% 1,273 1,632 461 -22% 254% -80% 1,273 1,632 461 5% 7% 3% Extra ordinary / unusual items - - - - - - - - - - - -Profit before taxation 1,273 1,632 461 -22% 254% -80% 1,273 1,632 461 5% 7% 3% Taxation – current 330 562 17 -41% 3138% -82% 330 562 17 1% 2% - – prior years’ - 120 (50) 100% -100% -79% - 120 (50) - 1% - – deferred - (147) 108 100% -237% -144% - (147) 108 - -1% 1% 330 534 75 38% 611% -120% 330 534 75 1% 2% -Profit after taxation 943 1,098 386 -14% 184% -86% 943 1,098 386 3% 5% 2% Unappropriated profit brought forward 834 309 2,145 170% -86% 19% 834 309 2,145 3% 1% 12% Profit available for appropriation 1,777 1,406 2,531 26% -44% -44% 1,777 1,406 2,531 6% 6% 14%Basic / diluted earnings per share – Rupees 1.48 1.79 0.76 -17% 135% -88%
Horizontal Analysis Vertical Analysis
44
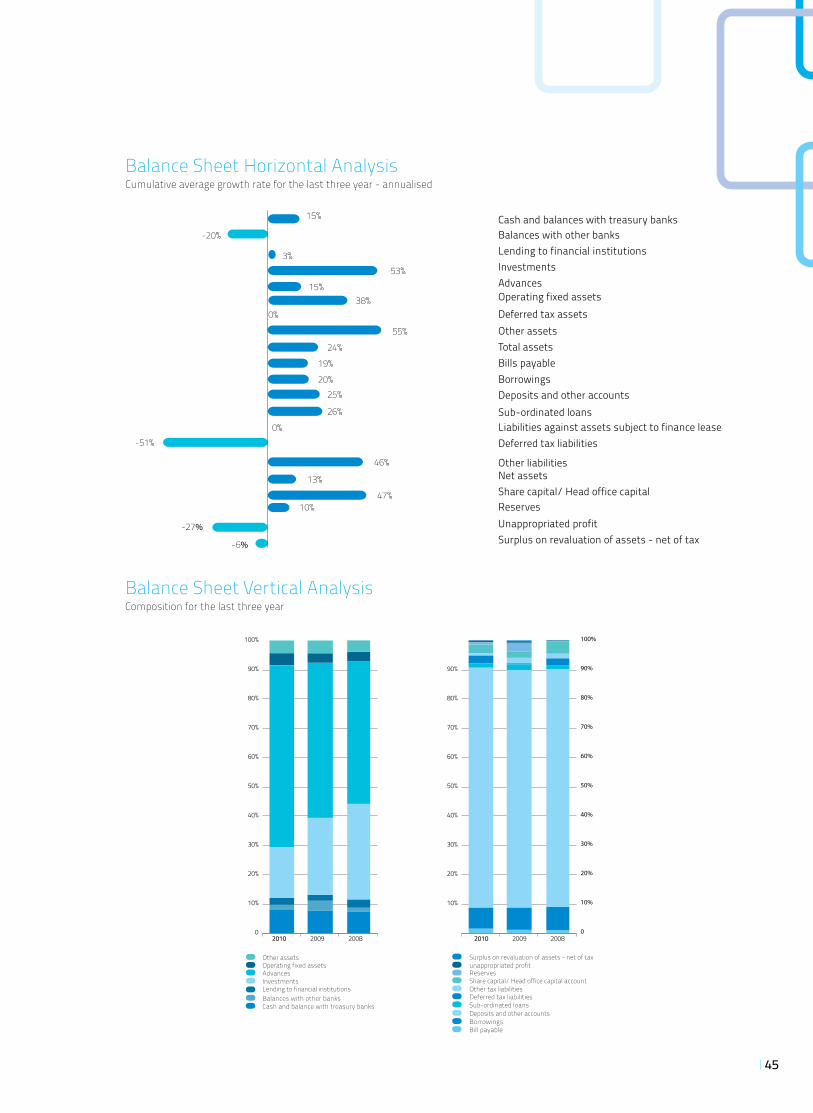
45
Surplus on revaluation of assets - net of taxUnappropriated profitReservesShare capital/ Head office capitalNet assetsOther liabilities
Deferred tax liabilitiesLiabilities against assets subject to finance leaseSub-ordinated loansDeposits and other accountsBorrowingsBills payableTotal assetsOther assetsDeferred tax assetsOperating fixed assetsAdvancesInvestmentsLending to financial institutionsBalances with other banksCash and balances with treasury banks
10%
0%
3%
15%
24%
47%
13%
46%
-51%
-27%
-6%
0%
26%
25%20%
19%
55%
38%15%
53%
-20%
Balance Sheet Horizontal AnalysisCumulative average growth rate for the last three year - annualised
Balance Sheet Vertical AnalysisComposition for the last three year
100%
90%
80%
70%
60%
50%
40%
30%
20%
10%
90%
80%
70%
60%
50%
40%
30%
20%
10%
0
100%
90%
80%
70%
60%
50%
40%
30%
20%
10%
0
Cash and balance with treasury banksBalances with other banks
Operating fixed assetsOther assets
Lending to financial institutionsInvestmentsAdvances
Bill payableBorrowings
Other tax liabilitiesShare capital/ Head office capital account
Deposits and other accountsSub-ordinated loansDeferred tax liabilities
unappropriated profitSurplus on revaluation of assets - net of tax
Reserves
2010 2009 2008 2010 2009 2008
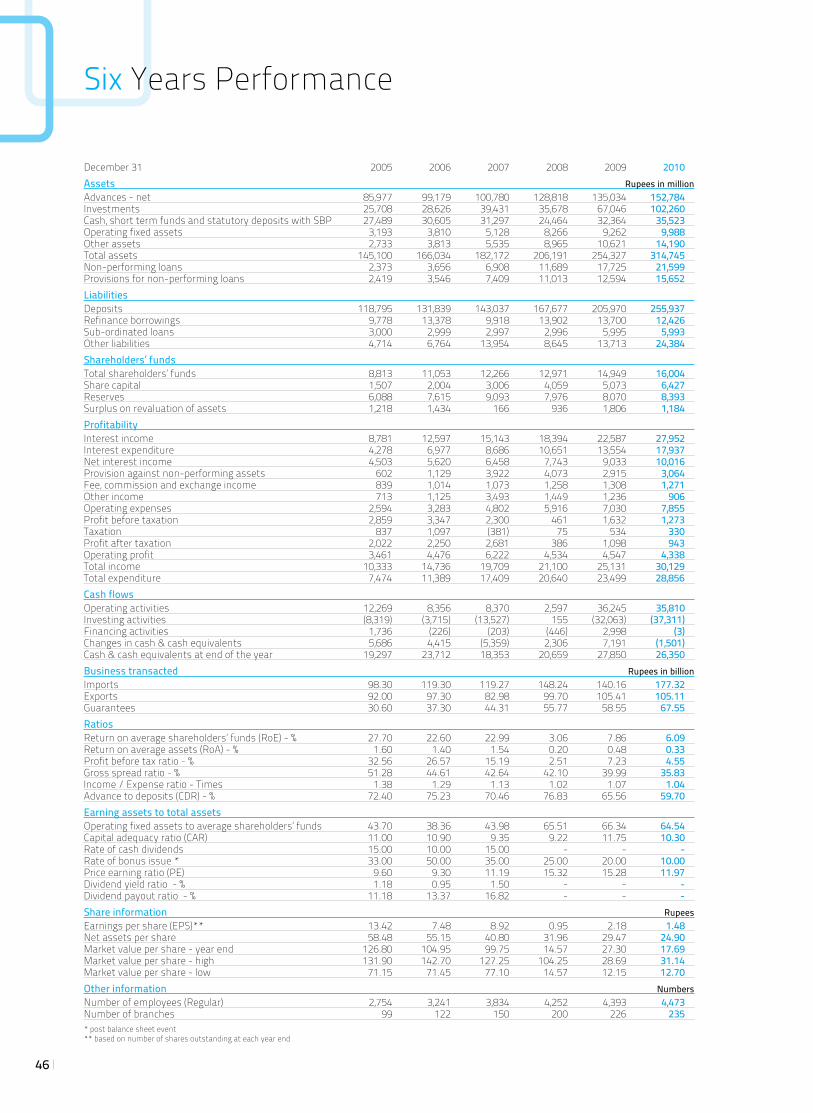
Six Years Performance
December 31 2005 2006 2007 2008 2009 2010Assets Rupees in million Advances - net 85,977 99,179 100,780 128,818 135,034 152,784 Investments 25,708 28,626 39,431 35,678 67,046 102,260 Cash, short term funds and statutory deposits with SBP 27,489 30,605 31,297 24,464 32,364 35,523 Operating fixed assets 3,193 3,810 5,128 8,266 9,262 9,988 Other assets 2,733 3,813 5,535 8,965 10,621 14,190 Total assets 145,100 166,034 182,172 206,191 254,327 314,745 Non-performing loans 2,373 3,656 6,908 11,689 17,725 21,599 Provisions for non-performing loans 2,419 3,546 7,409 11,013 12,594 15,652 Liabilities Deposits 118,795 131,839 143,037 167,677 205,970 255,937 Refinance borrowings 9,778 13,378 9,918 13,902 13,700 12,426 Sub-ordinated loans 3,000 2,999 2,997 2,996 5,995 5,993 Other liabilities 4,714 6,764 13,954 8,645 13,713 24,384 Shareholders’ funds Total shareholders’ funds 8,813 11,053 12,266 12,971 14,949 16,004 Share capital 1,507 2,004 3,006 4,059 5,073 6,427 Reserves 6,088 7,615 9,093 7,976 8,070 8,393 Surplus on revaluation of assets 1,218 1,434 166 936 1,806 1,184 Profitability Interest income 8,781 12,597 15,143 18,394 22,587 27,952 Interest expenditure 4,278 6,977 8,686 10,651 13,554 17,937 Net interest income 4,503 5,620 6,458 7,743 9,033 10,016 Provision against non-performing assets 602 1,129 3,922 4,073 2,915 3,064 Fee, commission and exchange income 839 1,014 1,073 1,258 1,308 1,271 Other income 713 1,125 3,493 1,449 1,236 906 Operating expenses 2,594 3,283 4,802 5,916 7,030 7,855 Profit before taxation 2,859 3,347 2,300 461 1,632 1,273 Taxation 837 1,097 (381) 75 534 330 Profit after taxation 2,022 2,250 2,681 386 1,098 943 Operating profit 3,461 4,476 6,222 4,534 4,547 4,338 Total income 10,333 14,736 19,709 21,100 25,131 30,129 Total expenditure 7,474 11,389 17,409 20,640 23,499 28,856 Cash flows Operating activities 12,269 8,356 8,370 2,597 36,245 35,810 Investing activities (8,319) (3,715) (13,527) 155 (32,063) (37,311)Financing activities 1,736 (226) (203) (446) 2,998 (3)Changes in cash & cash equivalents 5,686 4,415 (5,359) 2,306 7,191 (1,501)Cash & cash equivalents at end of the year 19,297 23,712 18,353 20,659 27,850 26,350 Business transacted Rupees in billionImports 98.30 119.30 119.27 148.24 140.16 177.32 Exports 92.00 97.30 82.98 99.70 105.41 105.11 Guarantees 30.60 37.30 44.31 55.77 58.55 67.55 Ratios Return on average shareholders’ funds (RoE) - % 27.70 22.60 22.99 3.06 7.86 6.09 Return on average assets (RoA) - % 1.60 1.40 1.54 0.20 0.48 0.33 Profit before tax ratio - % 32.56 26.57 15.19 2.51 7.23 4.55 Gross spread ratio - % 51.28 44.61 42.64 42.10 39.99 35.83 Income / Expense ratio - Times 1.38 1.29 1.13 1.02 1.07 1.04 Advance to deposits (CDR) - % 72.40 75.23 70.46 76.83 65.56 59.70 Earning assets to total assets Operating fixed assets to average shareholders’ funds 43.70 38.36 43.98 65.51 66.34 64.54 Capital adequacy ratio (CAR) 11.00 10.90 9.35 9.22 11.75 10.30 Rate of cash dividends 15.00 10.00 15.00 - - - Rate of bonus issue * 33.00 50.00 35.00 25.00 20.00 10.00 Price earning ratio (PE) 9.60 9.30 11.19 15.32 15.28 11.97 Dividend yield ratio - % 1.18 0.95 1.50 - - - Dividend payout ratio - % 11.18 13.37 16.82 - - - Share information Rupees Earnings per share (EPS)** 13.42 7.48 8.92 0.95 2.18 1.48 Net assets per share 58.48 55.15 40.80 31.96 29.47 24.90 Market value per share - year end 126.80 104.95 99.75 14.57 27.30 17.69 Market value per share - high 131.90 142.70 127.25 104.25 28.69 31.14 Market value per share - low 71.15 71.45 77.10 14.57 12.15 12.70 Other information Numbers Number of employees (Regular) 2,754 3,241 3,834 4,252 4,393 4,473 Number of branches 99 122 150 200 226 235 * post balance sheet event ** based on number of shares outstanding at each year end
46

47
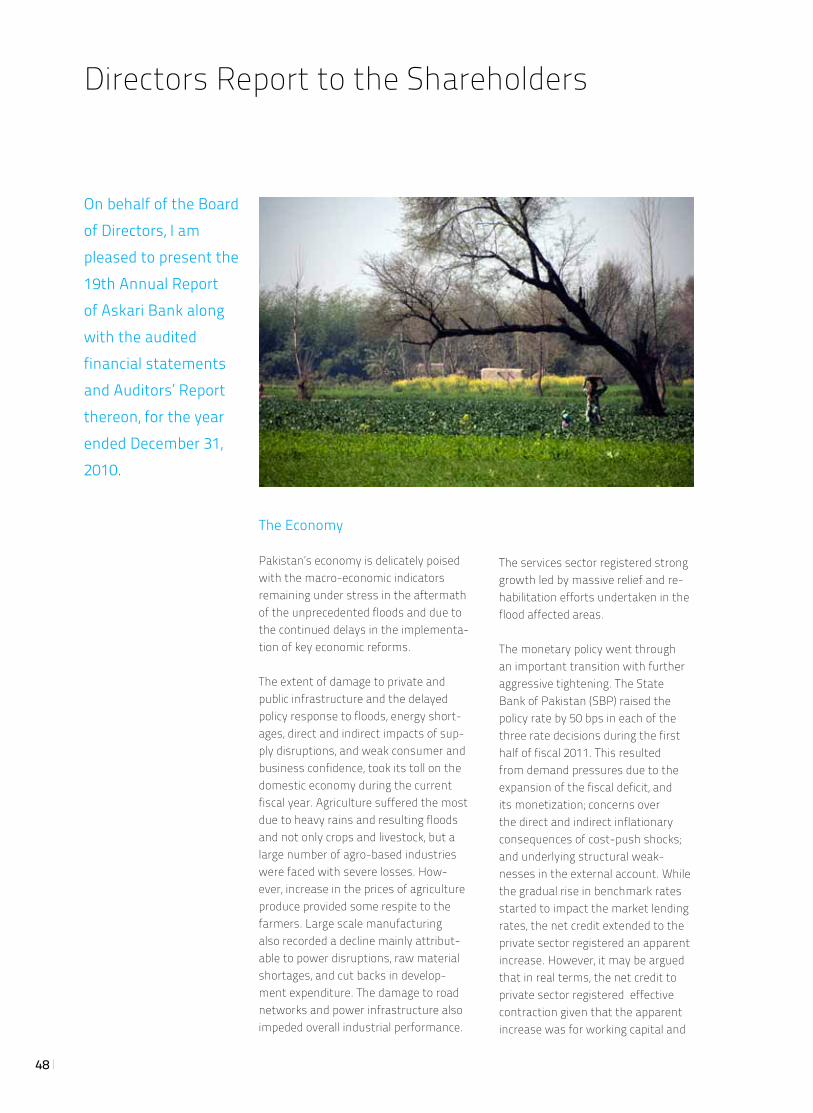
48
Directors Report to the Shareholders
The Economy
Pakistan’s economy is delicately poised with the macro-economic indicators remaining under stress in the aftermath of the unprecedented floods and due to the continued delays in the implementa-tion of key economic reforms.
The extent of damage to private and public infrastructure and the delayed policy response to floods, energy short-ages, direct and indirect impacts of sup-ply disruptions, and weak consumer and business confidence, took its toll on the domestic economy during the current fiscal year. Agriculture suffered the most due to heavy rains and resulting floods and not only crops and livestock, but a large number of agro-based industries were faced with severe losses. How-ever, increase in the prices of agriculture produce provided some respite to the farmers. Large scale manufacturing also recorded a decline mainly attribut-able to power disruptions, raw material shortages, and cut backs in develop-ment expenditure. The damage to road networks and power infrastructure also impeded overall industrial performance.
The services sector registered strong growth led by massive relief and re-habilitation efforts undertaken in the flood affected areas.
The monetary policy went through an important transition with further aggressive tightening. The State Bank of Pakistan (SBP) raised the policy rate by 50 bps in each of the three rate decisions during the first half of fiscal 2011. This resulted from demand pressures due to the expansion of the fiscal deficit, and its monetization; concerns over the direct and indirect inflationary consequences of cost-push shocks; and underlying structural weak-nesses in the external account. While the gradual rise in benchmark rates started to impact the market lending rates, the net credit extended to the private sector registered an apparent increase. However, it may be argued that in real terms, the net credit to private sector registered effective contraction given that the apparent increase was for working capital and
On behalf of the Board of Directors, I am pleased to present the 19th Annual Report of Askari Bank along with the audited financial statements and Auditors’ Report thereon, for the year ended December 31, 2010.
49
that input costs have increased for many industries. The combina-tion of increasing non-performing loans and high risk adjusted returns on government paper reflect clear crowding out of most private sector activities. In the money markets, primary market activity remained dominated by T-Bills. Also during the year, two successful auctions of Ijarah Sukuk attracted a lot of interest with acceptance of Rs.89 billion against the targeted Rs.80 billion. The deposit base of the banking system registered growth due to large inflows of remittances and sharp rise in government bor-rowings from the SBP. The banking sector spreads averaged at 7.46 percent for 2010, compared to 7.47 percent in 2009, decline of a mere 1bp. Although spreads in 2010 have remained flat, an uptick in month-wise data has been witnessed each month since June 2010, as lend-ing rates trod upwards to adjust for rising KIBOR and discount rate, while deposit rates eased off. The Government reprioritized its spending pattern and scaled down development expenditures to create space for flood relief and poverty alleviation activities. However, col-lections continue to slide both in tax and non-tax revenues.
Pakistan’s current account deficit registered contraction as a result of significant export growth, sustained inflows of workers’ remittances, and private and official grants for flood relief. The financial account surplus, on the other hand, declined sharply and a large part of this decline was the result of a sharp fall in other investments despite the emergency loan for flood relief given by the IMF. The lower capital and finan-
cial account surpluses resulted in the decline of the overall external account compared to last year. Nevertheless, the overall surplus did help in shoring up country’s foreign exchange reserves that reached US dollars 16.9 billion by end November 2010. This also kept the exchange rate relatively stable which depreci-ated by 0.35 percent during Jul-Nov period of fiscal 2011 compared to 2.6 percent in the same period last year.
The external sector had a mixed effect on local industry. Export demand declined for cement, phar-maceutical, and electric fans, as Pa-kistani manufacturers lost ground in some of the export markets that had been captured in the past two years. However, a gradual demand recovery in the United States and Europe provided a boost to the leather and textile sector with the export receipts of the latter grow-ing largely as a result of the sharp increase in the price of cotton. Un-like last year, when the sharp fall in imports improved trade account, the deterioration recorded during fiscal 2011 is due primarily to an increase in the import bill which outpaced the rise in export earnings.
Recent estimates suggest that GDP growth is likely to be within the range of 2 to 3 percent, a sharp de-cline from 4.1 percent seen in fiscal 2010. Given that the major issues of expenditure management and rev-enue shortfalls largely remain unad-dressed, fiscal performance remains a source of concern. There is a need for urgent reforms in the taxation system for broadening the tax base, including the implementation of much debated Reformed General
Sales Tax (RGST) and improved tax governance; and blocking leakages in the revenue collection system. This would allow for a lowering of the average tax rate in the economy in order to improve competitive-ness. Increased fiscal resources are necessary for economic stability as well as in order to increase develop-ment spending in the social sectors, including health, education, and poverty alleviation. The Government is faced with considerable pressure to increase social sector spending and to build infrastructure, even as the cost of the anti-militancy campaign continues to mount. Broadening the tax base is inescap-able in order to provide the needed essential services and public goods.
Operating Results of the Bank
Your Bank’s operating profit (before provisions against non-performing assets and taxation) for full year 2010 stood at Rs.4.34 billion against Rs.4.55 billion of last year – a de-cline of 4.6 percent. During the year under review, net total revenues increased by 5.4 percent despite substantial increase in suspension of revenues against non-perform-ing loans. Non mark-up income declined by 14.4 percent reflecting slow down of trading business, eroding margins on trade finance and lesser arbitrage opportunities in the foreign exchange. Adminis-trative expenses increased by 11.7 percent mainly due to additional expenses on branches opened/ upgraded during the year, and an increase in the recurring cost of the Bank’s major investment in infor-mation technology. The profit before tax registered a decline of 22.0
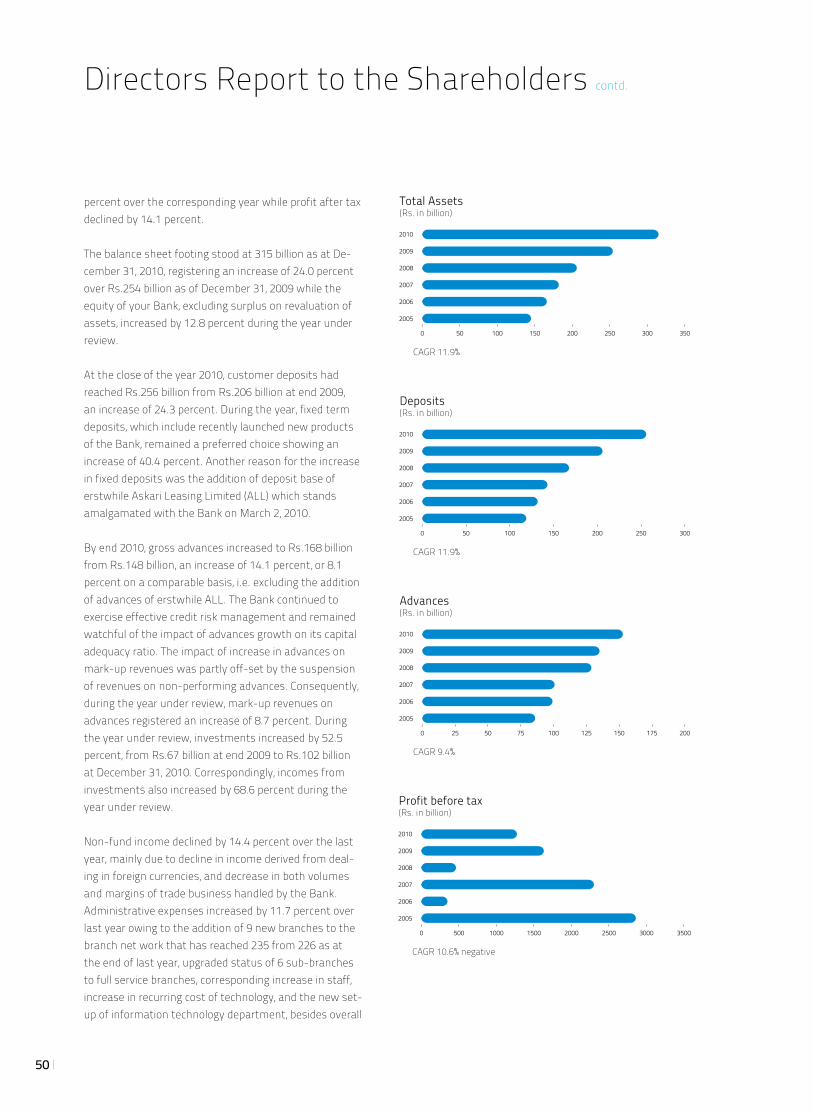
50
percent over the corresponding year while profit after tax declined by 14.1 percent.
The balance sheet footing stood at 315 billion as at De-cember 31, 2010, registering an increase of 24.0 percent over Rs.254 billion as of December 31, 2009 while the equity of your Bank, excluding surplus on revaluation of assets, increased by 12.8 percent during the year under review.
At the close of the year 2010, customer deposits had reached Rs.256 billion from Rs.206 billion at end 2009, an increase of 24.3 percent. During the year, fixed term deposits, which include recently launched new products of the Bank, remained a preferred choice showing an increase of 40.4 percent. Another reason for the increase in fixed deposits was the addition of deposit base of erstwhile Askari Leasing Limited (ALL) which stands amalgamated with the Bank on March 2, 2010.
By end 2010, gross advances increased to Rs.168 billion from Rs.148 billion, an increase of 14.1 percent, or 8.1 percent on a comparable basis, i.e. excluding the addition of advances of erstwhile ALL. The Bank continued to exercise effective credit risk management and remained watchful of the impact of advances growth on its capital adequacy ratio. The impact of increase in advances on mark-up revenues was partly off-set by the suspension of revenues on non-performing advances. Consequently, during the year under review, mark-up revenues on advances registered an increase of 8.7 percent. During the year under review, investments increased by 52.5 percent, from Rs.67 billion at end 2009 to Rs.102 billion at December 31, 2010. Correspondingly, incomes from investments also increased by 68.6 percent during the year under review.
Non-fund income declined by 14.4 percent over the last year, mainly due to decline in income derived from deal-ing in foreign currencies, and decrease in both volumes and margins of trade business handled by the Bank. Administrative expenses increased by 11.7 percent over last year owing to the addition of 9 new branches to the branch net work that has reached 235 from 226 as at the end of last year, upgraded status of 6 sub-branches to full service branches, corresponding increase in staff, increase in recurring cost of technology, and the new set-up of information technology department, besides overall
Directors Report to the Shareholders contd.
Advances(Rs. in billion)
0 25 50 75 100 125 150 175 200
2010
2009
2008
2007
2006
2005
CAGR 9.4%
Deposits(Rs. in billion)
0 50 100 150 200 250 300
2010
2009
2008
2007
2006
2005
CAGR 11.9%
Profit before tax(Rs. in billion)
0 500 1000 1500 2000 2500 3000 3500
2010
2009
2008
2007
2006
2005
CAGR 10.6% negative
Total Assets(Rs. in billion)
0 50 100 150 200 250 300 350
2010
2009
2008
2007
2006
2005
CAGR 11.9%
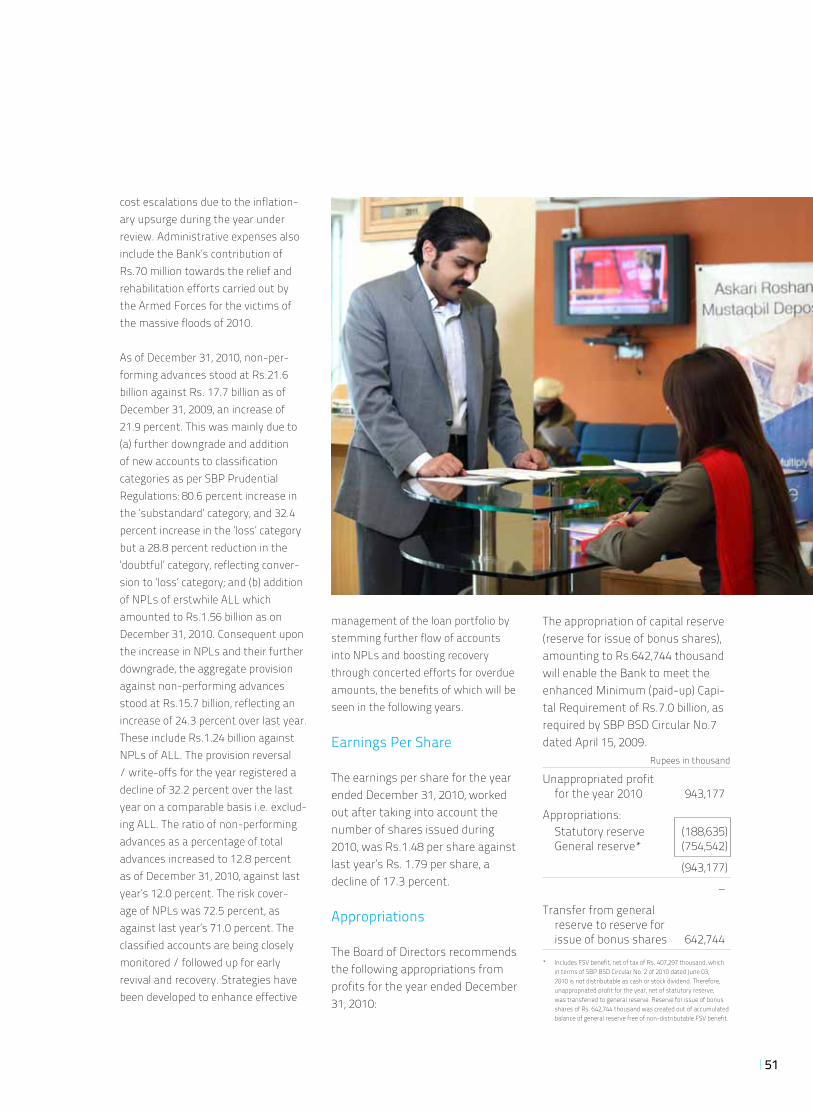
51
cost escalations due to the inflation-ary upsurge during the year under review. Administrative expenses also include the Bank’s contribution of Rs.70 million towards the relief and rehabilitation efforts carried out by the Armed Forces for the victims of the massive floods of 2010.
As of December 31, 2010, non-per-forming advances stood at Rs.21.6 billion against Rs. 17.7 billion as of December 31, 2009, an increase of 21.9 percent. This was mainly due to (a) further downgrade and addition of new accounts to classification categories as per SBP Prudential Regulations: 80.6 percent increase in the ‘substandard’ category, and 32.4 percent increase in the ‘loss’ category but a 28.8 percent reduction in the ‘doubtful’ category, reflecting conver-sion to ‘loss’ category; and (b) addition of NPLs of erstwhile ALL which amounted to Rs.1.56 billion as on December 31, 2010. Consequent upon the increase in NPLs and their further downgrade, the aggregate provision against non-performing advances stood at Rs.15.7 billion, reflecting an increase of 24.3 percent over last year. These include Rs.1.24 billion against NPLs of ALL. The provision reversal / write-offs for the year registered a decline of 32.2 percent over the last year on a comparable basis i.e. exclud-ing ALL. The ratio of non-performing advances as a percentage of total advances increased to 12.8 percent as of December 31, 2010, against last year’s 12.0 percent. The risk cover-age of NPLs was 72.5 percent, as against last year’s 71.0 percent. The classified accounts are being closely monitored / followed up for early revival and recovery. Strategies have been developed to enhance effective
management of the loan portfolio by stemming further flow of accounts into NPLs and boosting recovery through concerted efforts for overdue amounts, the benefits of which will be seen in the following years.
Earnings Per Share
The earnings per share for the year ended December 31, 2010, worked out after taking into account the number of shares issued during 2010, was Rs.1.48 per share against last year’s Rs. 1.79 per share, adecline of 17.3 percent.
Appropriations
The Board of Directors recommends the following appropriations from profits for the year ended December 31, 2010:
The appropriation of capital reserve (reserve for issue of bonus shares), amounting to Rs.642,744 thousand will enable the Bank to meet the enhanced Minimum (paid-up) Capi-tal Requirement of Rs.7.0 billion, as required by SBP BSD Circular No.7 dated April 15, 2009. Rupees in thousand
Unappropriated profit for the year 2010 943,177
Appropriations: Statutory reserve (188,635) General reserve* (754,542)
(943,177)
–
Transfer from general reserve to reserve for issue of bonus shares 642,744
* Includes FSV benefit, net of tax of Rs. 407,297 thousand, which in terms of SBP BSD Circular No. 2 of 2010 dated June 03, 2010 is not distributable as cash or stock dividend. Therefore, unappropriated profit for the year, net of statutory reserve, was transferred to general reserve. Reserve for issue of bonus shares of Rs. 642,744 thousand was created out of accumulated balance of general reserve free of non-distributable FSV benefit.
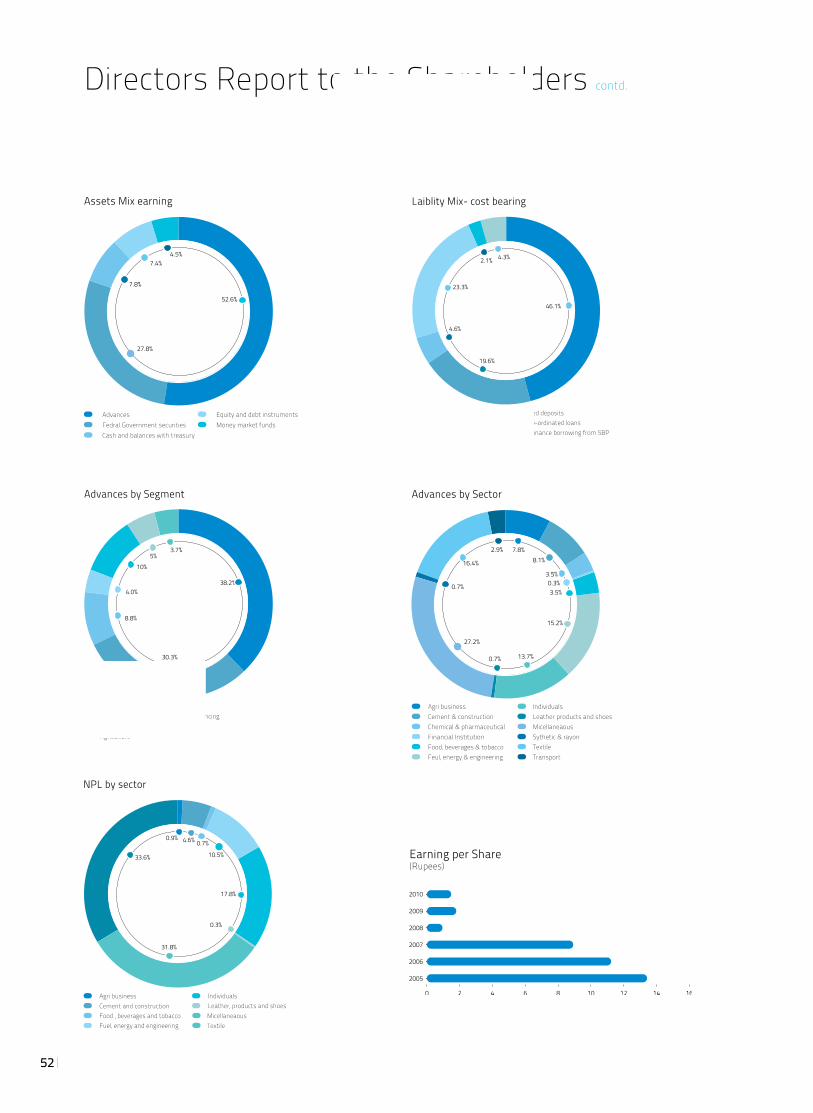
Directors Report to the Shareholders contd.
Laiblity Mix- cost bearing
4.3%
46.1%
19.6%
4.6%
23.3%
2.1%
Savings depositsCurrent accountsRepo and other borrowing
Fixed depositsSub-ordinated loansRefinance borrowing from SBP
Earning per Share(Rupees)
2010
2009
2008
2007
2006
2005
Advances by Sector
7.8%8.1%
15.2%
13.7%
0.3%3.5%
3.5%
0.7%
27.2%
0.7%
16.4%
2.9%
Agri businessCement & constructionChemical & pharmaceuticalFinancial InstitutionFood, beverages & tobaccoFeul, energy & engineering
IndividualsLeather products and shoesMicellaneaousSythetic & rayonTextileTransport
Advances by Segment
38.2%
30.3%
8.8%
4.0%
10%
3.7%5%
CorporateCommercialSMEAgriculture
ConsumerComodify FinancingSelf loans
NPL by sector
17.8%
0.3%
31.8%
33.6%
0.9% 4.6% 0.7%
10.5%
Agri businessCement and constructionFood , beverages and tobaccoFuel, energy and engineering
IndividualsLeather, products and shoesMicellaneaousTextile
Assets Mix earning
4.5%
52.6%
27.8%
7.8%
7.4%
AdvancesFedral Government securitiesCash and balances with treasury
Equity and debt instrumentsMoney market funds
52
53
real-time data replication to ensure minimal down-time even in case of a major disaster. Computer hard-ware necessary for the new central-ized applications was acquired and installed at the new Data Center as well as at the disaster recovery center. The Bank has also initiated an exercise with the objective of aligning new softwares’ capabilities with business and operations for optimal utilization of the core bank-ing software, and extensive training programs for existing and potential users of the core banking software.
Risk Management Framework
The Risk management function is fundamental to the business of banking and is an essential ele-ment of our banking strategy. Your Bank has been pursuing a holistic approach towards implementa-tion of effective risk management framework and has been engaged
Technology
The technology infrastructure of the Bank is undergoing a major over-haul under a project that involves replacement of the core banking system as well implementation of a number of other applications, aimed at enhancing the Bank’s capability to improve its customer services and product offerings, backed by improved control over operations and enhanced MIS. The core banking system, Flexcube, which constitutes our major initiative, is ‘live’ in 19 branches and is planned for expan-sion to all conventional branches. This software is also planned for Islamic banking branches in 2012. Other applications include human resource management, risk man-agement, supply chain manage-ment & enterprise GL, and customer relationship management systems. Most of these systems went ‘live’ during 2010 with varying degrees of coverage. As most of the new appli-cations operate on central servers, the new IT infrastructure needed to be created at a central location with high availability and redundant data communication access mecha-nisms while ensuring security and business continuity. The Bank has therefore invested significantly in creating such an infrastructure. A new Data Center became opera-tional during 2010 in a Bank-owned building specifically designed to house technology infrastructure and facilities. This is a state-of-the-art data center with optimized cooling reserve / backup redundant power supply systems, UPSs, and monitor-ing and control systems designed to operate in a high availability mode. A disaster recovery center has also been created in another Bank-owned premises with provision for
in extensive and detailed evaluation and assessment of its risk man-agement framework in all areas of banking activity.
The Bank has in place a risk man-agement framework encompassing risk policies and limits structure, risk appetite, risk infrastructure and risk measurement methodologies and tools. The Bank has established a comprehensive operational risk management framework based on appropriate risk management architecture, which assesses and measures the operational risks arising from systems, people, and processes. The Bank has strength-ened its risk management abilities to proactively manage market, credit and operational risks, by creating an awareness of risk culture through training sessions; every employee is a risk manager at his workplace and can appreciate the basic concepts of risk based capital structure of the Bank.
54
Directors Report to the Shareholders contd.
The Bank is exposed to various financial risks. In order to counter those risks, the concept of value at risk (VaR) and credit risk rating methodologies are in place. The latter enables us to determine prob-ability of default (PD) and quantify expected credit loss as required by Basel II. Credit risk is further controlled by a system of limits by counterparty, by type of facilities / transactions, geographic area, and internal credit rating, thus dispers-ing risk and avoiding concentration in a particular area.
At present, a standardized ap-proach is used for capital allocation for credit risk and market risks while operational risk required
capital allocation is based on the basic indicators approach. Efforts are underway to move towards advanced approaches of Basel-II and necessary tools and techniques are in development and testing phases. The Bank is at an advanced stage of implementing Credit Risk Environment Administration Man-agement (CREAM®) and Reveleus® risk management software that will enable the Bank to automate credit approval and risk rating system processes, as well as assists with implementing Basel II Foundation Internal Risk Based (FIRB) approach for managing credit risk and VAR model for market risk.
Human Resource
Your Bank fully recognizes its committed and competent human resource as the primary asset in providing value addition to its other stakeholders. Human resource functions are accordingly continu-ously modernized and reviewed in accordance with our strategic direction and objectives. During the year under review, human resource strategies were aligned with the prevalent economic and business conditions and were focused on employee rationalization, and cau-tious recruitment and promotion techniques in order to maximize employee output. Also during the year, with the amalgamation of ALL,
55
Board of Directors and the manage-ment. While the Board recognizes its responsibility as envisaged in the relevant regulations, the manage-ment of the Bank ensures the establishment and maintenance of adequate and effective systems of internal control in compliance with the applicable laws and regulations and responsive to the Bank’s own internal concerns. It is also respon-sible for assessing the effectiveness of internal controls and reporting thereon.
The management ensures the efficiency and effectiveness of the internal control system by identi-fying control objectives, devising and reviewing appropriate policies and procedures, and establish-ing relevant control procedures. Significant policies and procedural manuals are already in place. Poli-cies and procedures are periodically reviewed and revised, and necessary amendments and updates intro-duced. Preparation of new policies and manuals is in progress.
The management is also cognizant of its responsibility of putting a sys-tem in place for the authentication of transactions, strengthening of control environment, and identify-ing areas requiring improvement and devising appropriate remedial action on a timely basis. A complete revamp of its existing IT platform, as stated above, is one of the major moves in this direction. The internal control system in the Bank is de-signed to minimize the risk of failure and to keep such failure within tolerable limits as these cannot be eliminated completely. Only reason-able and not absolute assurance can be provided against material misstatement or loss.
a comprehensive plan was rolled out for employee transfer / job rotations at various departments / divisions to gain & benefit from knowledge and skills cross function-ally.
The first phase of PeopleSoft system software was successfully implemented which has partially integrated and automated human resource functions and processes. This web-based system provides expanded online services for staff on human resource related matters. The advance modules of the system automate many processes relating to selection and recruitment, train-ing and development, performance management, and career and suc-cession planning.
During the year under review, the training & development team of the Bank continued its pursuit for quality training to the Bank’s staff in line with the training policy. Train-ing goals were determined in light of the well-defined training need assessments (TNA) procedures, as envisaged in the overall strategic plan of the Bank. Our in-house training facilities conducted a record number of 526 courses, workshops, and skill development clinics in the disciplines of service and attitude, management and communication, IT, credit and finance, international trade, domestic banking operations, risk management, and on other subjects including a series of leader-ship development programs for senior management of the Bank.
Statement on Internal Controls
Internal controls contribute to ef-fective management by the Bank’s
The Bank is in the process of adopt-ing an internationally accepted internal control framework, as envisaged under the SBP Guidelines on Internal Controls. The Bank has devised a well-defined and compre-hensive internal control program roadmap with specified stages as suggested by the SBP. In accord-ance with this program, the Bank has completed detailed documenta-tion of the existing processes and controls, together with a compre-hensive gap analysis of the control design. This will be followed by a detailed remediation and testing plans which are currently being worked at. After completion of these plans, the Bank will undertake complete implementation of initia-tives to remove the gaps in a timely manner.
During the year 2010, the Bank strived to ensure that an effective and efficient internal control system is implemented, that no material compromise is made in implement-ing the desired control procedures, and that a suitable environment is maintained in general. However, the process of identification, evalua-tion, and management of significant risks is an ongoing process, which the Bank actively and vigilantly pursues.
Credit Rating
A bank’s credit rating reflects its ability to protect its relative stand-ing in the sector by competing effectively in the increasingly com-petitive environment in the banking sector and assumes its ability to take all measures necessary for the purpose.
56
Directors Report to the Shareholders contd.
Branch Network
Your Bank is fully aware that its branch network has direct implica-tions on the services that it provides to its valued customers. During the year, your bank opened 9 new conventional banking branches. Also, 6 sub-branches were upgraded and were assigned the status of full service branches to cater for the need of the market in which these operate. We now offer services through a network of 235 branches, including a wholesale bank branch in Bahrain. Through this branch network, we are able to offer our wide range of products and services to our valued customers. Given the current economic conditions, your Bank will be emphasizing on the consolidation of recent expansion and operations. Future expansion will be gradual and incremental.
Islamic Banking
Your Bank’s dedicated Islamic bank-ing branch network has reached 29 full service branches and 2 sub-branches, distributed over 15 cities including federal and provincial capitals and other large cities. Our Islamic banking offerings are purely on Sharia’a basis and special care is exercised to ensure that there is no mixing of funds between conven-tional and Islamic banking.
During the year under review, our Islamic banking business posted a net loss amounting to Rs.372 million, mainly due to increase in non-performing assets and the re-sulting revenue suspension, and the full-year impact of the operating ex-penses of 11 new branches opened last year. On the balance sheet side customer deposits increased by
Askari Bank has been assigned the long term rating of ‘AA’ and short term rating of ‘A1+’ by the Pakistan Credit Rating Agency (Pvt) Limited (PACRA). The ratings reflect the Bank’s strong capital structure sup-ported by sound profitability. Taking note of the fast changing banking dynamics, the management has put in place a well-conceived strategy to improve the Bank’s performance and ensuring its strong stand-ing within the sector including, as detailed earlier, the strengthening of its risk management framework.
According to PACRA “these ratings reflect sustained ability of revenue growth from core operations while maintaining a low risk profile and also dynamic as well as an efficient fund deployment strategy. Going forward, given the strong tech-nological platform and enhanced geographical outreach, the Bank is well positioned to maintain its com-petitive edge despite an increasingly competitive operation environ-ment.”
Capital Adequacy
As of December 31, 2010, your Bank’s capital adequacy ratio (CAR) stood at 10.3 percent against last year’s 11.8 percent, while the SBP’s minimum prescribed requirement stands at 10.0 percent. The reduc-tion in CAR is mainly due to growth of risk assets during the year under review and also due to scheduled maturities of sub-ordinated debt issued by the Bank. The Bank will continue with aggressive profiling of risk assets; and, creating awareness amongst risk-takers in the Bank to be cognizant of the risk adjusted return, when making decisions that involves risks.
24.2 percent, from Rs. 7.46 Billion, as at December 31, 2009 to Rs. 9.26 billion as at 31st December, 2010. The increase in deposits was backed by improvement in the deposit mix as the focus of our Islamic banking remained on relatively low cost core deposits on a Sharia’a Compliant basis. Islamic finance and invest-ments portfolios increased by 6.72 percent from Rs. 8.19 Billion, as at 31st December, 2009 to Rs. 8.74 Bil-lion, as at 31st December, 2010. In-vestment portfolios include recently issued Government of Pakistan Guaranteed Sharia’a Compliant Ijara Sukuk instruments.
Going forward, with recovery efforts against non-performing accounts already initiated and starting to yield results; number of branches which after completing incubation period are likely to increase contri-bution towards Sharia’a compliant earnings; and an increased focus on automation and improvement in Sharia’a compliant areas of busi-ness, the management is hopeful for a turnaround in our Islamic banking operations in the ensuing year.
Askari Investment Management Limited (AIML)
Askari Investment Management Limited (AIML) is the first sub-sidiary of the Bank and is regulated under the Non-Banking Finance Companies (NBFC) Rules 2003 and Notified Entities Regulation, 2007, and licensed by the Securities and Exchange Commission of Pakistan (SECP). The primary business of AIML is to launch and manage mu-tual funds investments. However, AIML also offers advisory services to institutional clients.
57
58
Directors Report to the Shareholders contd.
AIML currently manages five open-end funds, 1) Askari Income Fund (AIF), size Rs. 1,283 million (2009: Rs. 2,096 million); 2) Askari Asset Allocation Fund, size Rs. 160 mil-lion (2009:Rs. 253 million); 3) Askari Islamic Income Fund, size Rs. 227 million (2009: Rs.197 million); 4) Askari Islamic Asset Allocation Fund, size Rs. 121 million (2009: Rs. 111 million); and 5) Askari Sovereign Cash Fund, size Rs. 2,354 million (2009: Rs. 1,095 million).
Consolidated financial statements of the Bank and AIML for the year ended December 31, 2010 are in-cluded in this annual report.
Askari Securities Limited (ASL)
The Bank has a controlling interest in Askari Securities Limited (ASL) by virtue of 74 percent shares of ASL.
ASL is an incorporated public limited company and a corporate member of Islamabad Stock Exchange (Guar-antee) Limited, engaged principally in share brokerage, and investment advisory and consultancy services. The performance of ASL during 2010 was subdued mainly due to adverse market sentiments prevailing during most of the year. With improving investor confidence evident at the bourses, we believe that it will show better results in the following years. Consolidated financial statements of the Bank and ASL for the year ended December 31, 2010 are in-cluded in this annual report.
Merger of Erstwhile Askari Leasing Limited (ALL)
The process of amalgamation of erstwhile Askari leasing Limited (ALL) with and into the Bank, which was initiated in 2009 was completed on the effective date of amalgama-tion i.e., March 3, 2010. As a result the entire assets & liabilities of the erstwhile ALL have been merged into the Bank as on that date, in consideration for the issue of 28.273 million shares of the Bank to the shareholders of formerly ALL and accordingly being reflected in the annexed financial statements of the Bank. Also, as a result of amalga-mation, the authorized capital of the Bank has increased to Rs.13 billion from Rs.12 billion as on December 31, 2009.
The amalgamation has brought economies of scale and customers of ALL now enjoy a comprehen-sive range of commercial banking products. The Bank has also been benefited by the addition of leasing in its product offerings.
Awards and Recognition
During the year, the Annual Report of the Bank for the year 2009 won the 3rd prize of “The Best Annual Report” for the financial sector, instituted jointly by The Institute of Chartered Accountants of Pakistan and The Institute of Cost and Man-agement Accountants of Pakistan. We are thankful for this recognition of our efforts by these esteemed professional organizations.
Pattern of Shareholding
The pattern of shareholding at the close of December 31, 2010 is included in this report.
Corporate and Financial Reporting Framework:
• Thefinancialstatements,prepared by the management of the Bank, present fairly its state of affairs, the results of its operations, and changes in equity and cash flows.
• ProperbooksofaccountsoftheBank have been maintained.
• Accountingpolicieshavebeenconsistently applied in prepara-tion of these financial state-ments except as stated in the notes to the financial state-ments and accounting esti-mates are based on reasonable and prudent judgment.
• InternationalAccountingStandards, as applicable to banking companies in Pakistan, have been followed in prepara-tion of these financial state-ments.
• Thesystemofinternalcontrol,which is in place, is being con-tinuously reviewed by the in-ternal audit department as are other such procedures. Such review processes will continue and any weakness in controls will be removed.
• TheBoardofDirectorsissatis-fied with the Bank’s ability to continue as a going concern.
• Therehavebeennomate-rial departures from the best practices of corporate govern-ance as detailed in the Listing Regulation No.37 of the Karachi
59
Stock Exchange (Guarantee) Limited.
• Keyoperatingdataandfinan-cial data for the last six years, in summarized form, is included in this annual report.
• Therearenostatutorypay-ments on account of taxes, duties, levies and charges which are outstanding as of December 31, 2010, except as disclosed in the annexed finan-cial statements.
• Thefollowingisthevalueofinvestment as at December 31, 2010:
- Provident Fund Rs. 1,529 million, based on un-audited financial statements (2009: Rs. 1,446 million)
- Gratuity Fund Rs. 671 million, based on un-audited financial statements (2009: Rs. 499 mil-lion )
• During2010,sevenmeetingsof the Board of Directors were held. Attendance by each Direc-tor was as follows:
Lt. Gen. Javed Zia 2(outgoing Chairman)
Lt. Gen. Nadeem Taj 4(incoming Chairman)
Lt. Gen. (R) Imtiaz Hussain 7
Maj. Gen. (R) Saeed Ahmed Khan 6
Mr. Zafar Alam Khan Sumbal 7
Mr. Muhammad Riyazul Haque 5
Mr. Shahid Mahmud 6
Mr. Ali Noormahomad Rattansey 4
Dr. Bashir Ahmad Khan 4
Mr. Tariq Iqbal Khan 2(Retired/NIT nominee)
Mr. Wazir Ali Khoja 3(NIT nominee)
Mr. M. R. Mehkari 7(President & Chief Executive)
Auditors
The Auditors, M/s KPMG Taseer Hadi & Co, Chartered Accounts have completed their assignment for the year ended December 31, 2010 and shall retire at the conclusion of the 19th Annual General Meeting. Upon recommendation of the Audit Committee, the Board recommends appointment of M/s KPMG Taseer Hadi & Co., Chartered Accountants, as the auditors for the year 2011.
Events After the Date of Statement of Financial Position
There have not been any material events that occurred subsequent to the date of the Statement of Financial Position that require ad-justments to the enclosed financial statements.
Prospects for 2011
With Pakistan’s opting for IMF sta-bilization program, there are signs of stability in some economic funda-mentals such as foreign exchange reserves. Exports are growing, are remittances. The key challenge for Pakistan’s economy and policy makers is to ensure consolida-tion of economic stability through continued expenditure restraint, and improvement in the fiscal regime through a higher tax to GDP ratio, resolution of the energy crisis, control of the inflationary pres-sures, and, the continued enhance-ment of the competitiveness of our exports. The risks to the economy include the uncertainty on the security situation, the war on terror, and uncertainty about the tough economic decisions required. Within the Pakistani banking sector the ris-
ing trend of NPLs is a major cause of concern. Continued weakness in world economic growth, particularly in the economies of the major trad-ing partners of Pakistan, remains a constraint in our growth potential. There are no easy answers. Given the challenges on hand, 2011 would therefore be a year of consolidation and economic stabilization.
Acknowledgments
On behalf of the Board of the Bank, I like to express my sincere apprecia-tion to the State Bank of Pakistan and other regulatory bodies for their guidance and support; to the shareholders, and the customers of the Bank, for their patronage and business; and to the employees of the Bank for their continued dedica-tion and hard work.
For & on behalf of the Board.
Lt Gen Nadeem TajChairman
RawalpindiFebruary 21, 2011

60

61
Unconsolidated Financial Statements of
Askari Bank LimitedFor the year ended December 31, 2010

62
This page is intentially left blank
63
Statement of ComplianceWith the Code of Corporate Governance for the year ended December 31, 2010
This statement is being presented to comply with the Prudential Regulation No. XXIX, responsibilities of the Board of Directors, issued vide BSD Circular No.15, dated June 13, 2002 and the Code of Corporate Governance as contained in Listing Regulations of the stock exchanges where the Bank’s shares are listed for the purpose of establishing a framework of good governance, whereby a listed company is managed in compliance with the best practices of corporate governance.
The Bank has applied the principles contained in the Code in the following manner:
1. The Bank encourages representation of non-executive independent directors and directors representing minority interests on its Board of Directors. At present the Board includes 5 non-executive Directors of which 1 non-executive independent Director represent minority shareholding.
2. The Directors have confirmed that none of them is serving as a director in more than ten listed companies, including Askari Bank Limited, except Mr. Wazir Ali Khoja who has been exempted for the purpose of this clause by the Securities & Exchange Commission of Pakistan.
3. All Directors are resident directors of the Bank and registered as taxpayers and none of them has defaulted in payment of any loan to a banking company, a DFI or an NBFC or, being a member of a stock exchange, has been declared as a defaulter by that stock exchange.
4. During the year two casual vacancies occurred on the Board, which were filled within the prescribed period.
5. The Bank has prepared a statement of ethics and business practices, which has been signed by all the directors and employees of the Bank.
6. The Board has developed a vision / mission statement, overall corporate strategy and significant policies of the Bank. A complete record of particulars of significant policies along with the dates on which they were approved or amended has been maintained.
7. All the powers of the Board have been duly exercised and decisions on material transactions, including appointment and determination of remuneration and terms and conditions of employment of the President and Chief Executive Officer, have been taken by the Board.
8. The meetings of the Board were presided over by the Chairman and the Board met at least once in every quarter. Written notices of the Board meetings, along with agenda and working papers, were circulated at least seven days before the meetings except in the case of two meetings where the agenda was circulated 6 days before the date of the meeting. The minutes of the meetings were appropriately recorded and circulated.
9. The Board members participated in orientation courses to apprise them of their duties and responsibilities.
10. The Board of Directors of the Bank has subsequent to the year end approved the appointment of Head of Internal Audit.
11. The Directors’ Report for this year has been prepared in compliance with the requirements of the Code and fully describes the salient matters required to be disclosed.
12. The financial statements of the Bank were duly endorsed by the Chief Executive Officer and the Chief Financial Officer before approval of the Board.
13. The Directors, Chief Executive Officer and executives do not hold any interest in the shares of the Bank other than that disclosed in the pattern of shareholding.
14. The Bank has complied with all the corporate and financial reporting requirements of the Code of Corporate Governance.
64
15. The Board has formed an Audit Committee. It comprises of 3 members. All members are non-executive independent Directors including the Chairman of the Committee.
16. The meetings of the Audit Committee were held in every quarter prior to approval of interim and final results of the Bank as required by the Code. The terms of reference of the Committee were fully complied with.
17. The Board has set-up an effective internal audit function on a full time basis.
18. The statutory auditors of the Bank have confirmed that they have been given a satisfactory rating under the quality control review program of the Institute of Chartered Accountants of Pakistan, that they or any of the partners of the firm, their spouses and minor children do not hold shares of the Bank and that the firm and all its partners are in compliance with International Federation of Accountants (IFAC) guidelines on code of ethics, as adopted by Institute of Chartered Accountants of Pakistan.
19. The statutory auditors or the persons associated with them have not been appointed to provide other services except in accordance with the Listing Regulations and the auditors have confirmed that they have observed IFAC guidelines in this regard.
20. All material information required under the relevant rules have been provided to the stock exchanges and to the Securities & Exchange Commission of Pakistan within the prescribed time limit.
21. All related party transactions entered during the year were at arm’s length basis and these have been placed before the Audit Committee and the Board of Directors. These transactions are duly reviewed and approved by the Audit Committee and Board of Directors.
22. We confirm that all other material principles contained in the Code have been complied with.
For and on behalf of the Board
Rawalpindi Lt. Gen. Nadeem TajFebruary 21, 2011 Chairman
65
Review Report to the MembersOn Statement of Compliance with Best Practices of Code of Corporate Governance
We have reviewed the Statement of Compliance with the best practices (“the Statement”) contained in the Code of Corporate Governance prepared by the Board of Directors of Askari Bank Limited, (“the Bank”) to comply with Regulation G-1 of the Prudential Regulations for Corporate/ Commercial Banking issued by the State Bank of Pakistan, Listing Regulation No. 35 of Karachi Stock Exchange (Guarantee) Limited, Listing Regulation No. 35 of Lahore Stock Exchange (Guarantee) Limited and Chapter XI of the Listing Regulations of Islamabad Stock Exchange (Guarantee) Limited, where the Bank is listed.
The responsibility for compliance with the Code of Corporate Governance is that of the Board of Directors of the Bank. Our responsibility is to review, to the extent where such compliance can be objectively verified, whether the Statement of Compliance reflects the status of the Bank’s compliance with the provisions of the Code of Corporate Governance and report if it does not. A review is limited primarily to inquiries of the Bank’s personnel and review of various documents prepared by the Bank to comply with the Code.
As part of our audit of financial statements we are required to obtain an understanding of the accounting and internal control systems sufficient to plan the audit and develop an effective audit approach. We are not required to consider whether the Board’s statement covers all risks or controls, or to form an opinion on the effectiveness of such internal control, the Bank’s corporate governance procedures and risks.
Further, Sub-Regulation (xiii a) of Listing Regulation 35 notified by the Karachi Stock Exchange (Guarantee) Limited vide circular KSE/ N-269 dated January 19, 2009 requires the Bank to place before the Board of Director for their consideration and approval related party transactions, distinguishing between transactions carried out on terms equivalent to those that prevail in arm’s length transactions and transactions which are not executed at arm’s length price recording proper justification for using such alternative pricing mechanism. Further, all such transactions are also required to be separately placed before the Audit Committee. We are only required and have ensured compliance of requirement to the extent of approval of related party transactions by the Board of Directors and placement of such transactions before the Audit Committee. We have not carried out any procedure to determine whether the related party transactions were undertaken at arm’s length price or not.
Based on our review, nothing has come to our attention which causes us to believe that the Statement does not appropriately reflect the Bank’s compliance, in all material respects, with the best practices contained in the Code of Corporate Governance as applicable to the Bank for the year ended December 31, 2010.
Islamabad KPMG Taseer Hadi & Co.February 21, 2011 Chartered Accountants
Engagement Partner
Muhammad Rehan Chughtai
KPMG Taseer Hadi & Co., a Partnership firm registered in Pakistanand a member firm of the KPMG network of independent memberfirms affiliated with KPMG International Cooperative(“KPMG International”), a Swiss entity.
KPMG Taseer Hadi & Co.Chartered AccountantsSixth Floor, State Life Building No. 5Jinnah Avenue, Blue AreaIslamabad, Pakistan
Telephone + 92 (51) 282 3558 + 92 (51) 282 5956Fax + 92 (51) 282 2671Internet www.kpmg.com.pk
66
We have audited the annexed unconsolidated statement of financial position of Askari Bank Limited (“the Bank”) as at December 31, 2010 and the related unconsolidated profit and loss account, unconsolidated statement of comprehensive income, unconsolidated cash flow statement and statement of changes in equity together with the notes forming part thereof (here-in-after referred to as the ‘financial statements’) for the year then ended, in which are incorporated the unaudited certified returns from the branches except for 20 branches which have been audited by us and one branch audited by auditors abroad and we state that we have obtained all the information and explanations which, to the best of our knowledge and belief, were necessary for the purposes of our audit.
It is the responsibility of the Bank’s management to establish and maintain a system of internal control, and prepare and present the above said statements in conformity with the approved accounting standards and the requirements of the Banking Companies Ordinance, 1962 (LVII of 1962), and the Companies Ordinance, 1984 (XLVII of 1984). Our responsibility is to express an opinion on these statements based on our audit.
We conducted our audit in accordance with the International Standards on Auditing as applicable in Pakistan. These standards require that we plan and perform the audit to obtain reasonable assurance about whether the financial statements are free of any material misstatement. An audit includes examining, on a test basis, evidence supporting the amounts and disclosures in the financial statements. An audit also includes assessing the accounting policies and significant estimates made by management, as well as, evaluating the overall presentation of the financial statements. We believe that our audit provides a reasonable basis for our opinion and, after due verification, which in the case of loans and advances covered more than 60% of the total loans and advances of the Bank, we report that:
a) in our opinion, proper books of account have been kept by the Bank as required by the Companies Ordinance, 1984 (XLVII of 1984), and the returns referred to above received from the branches have been found adequate for the purposes of our audit;
b) in our opinion:
i) the unconsolidated statement of financial position and unconsolidated profit and loss account together with the notes thereon have been drawn up in conformity with the Banking Companies Ordinance, 1962 (LVII of 1962) and the Companies Ordinance, 1984 (XLVII of 1984), and are in agreement with the books of account and are further in accordance with accounting policies consistently applied;
Auditors’ Report to the Members
KPMG Taseer Hadi & Co., a Partnership firm registered in Pakistanand a member firm of the KPMG network of independent memberfirms affiliated with KPMG International Cooperative(“KPMG International”), a Swiss entity.
KPMG Taseer Hadi & Co.Chartered AccountantsSixth Floor, State Life Building No. 5Jinnah Avenue, Blue AreaIslamabad, Pakistan
Telephone + 92 (51) 282 3558 + 92 (51) 282 5956Fax + 92 (51) 282 2671Internet www.kpmg.com.pk
67
ii) the expenditure incurred during the year was for the purpose of the Bank’s business; and
iii) the business conducted, investments made and the expenditure incurred during the year were in accordance with the objects of the Bank and the transactions of the Bank which have come to our notice have been within the powers of the Bank;
c) in our opinion and to the best of our information and according to the explanations given to us, the unconsolidated statement of financial position, unconsolidated profit and loss account, unconsolidated statement of comprehensive income, unconsolidated cash flow statement and statement of changes in equity together with the notes forming part thereof conform with approved accounting standards as applicable in Pakistan, and give the information required by the Banking Companies Ordinance, 1962 (LVII of 1962) and the Companies Ordinance, 1984 (XLVII of 1984), in the manner so required and respectively give a true and fair view of the state of the Bank’s affairs as at December 31, 2010 and its true balance of the profit, its changes in equity and cash flows for the year then ended; and
d) in our opinion, Zakat deductible at source under the Zakat and Ushr Ordinance, 1980 (XVIII of 1980), was deducted by the Bank and deposited in the Central Zakat Fund established under section 7 of that Ordinance.
The financial statements of the Bank for the year ended December 31, 2009 were audited by another firm of chartered accountants who had expressed an unqualified opinion thereon vide their report dated February 23, 2010.
Islamabad KPMG Taseer Hadi & Co.February 21, 2011 Chartered Accountants
Engagement Partner Muhammad Rehan Chughtai
KPMG Taseer Hadi & Co.
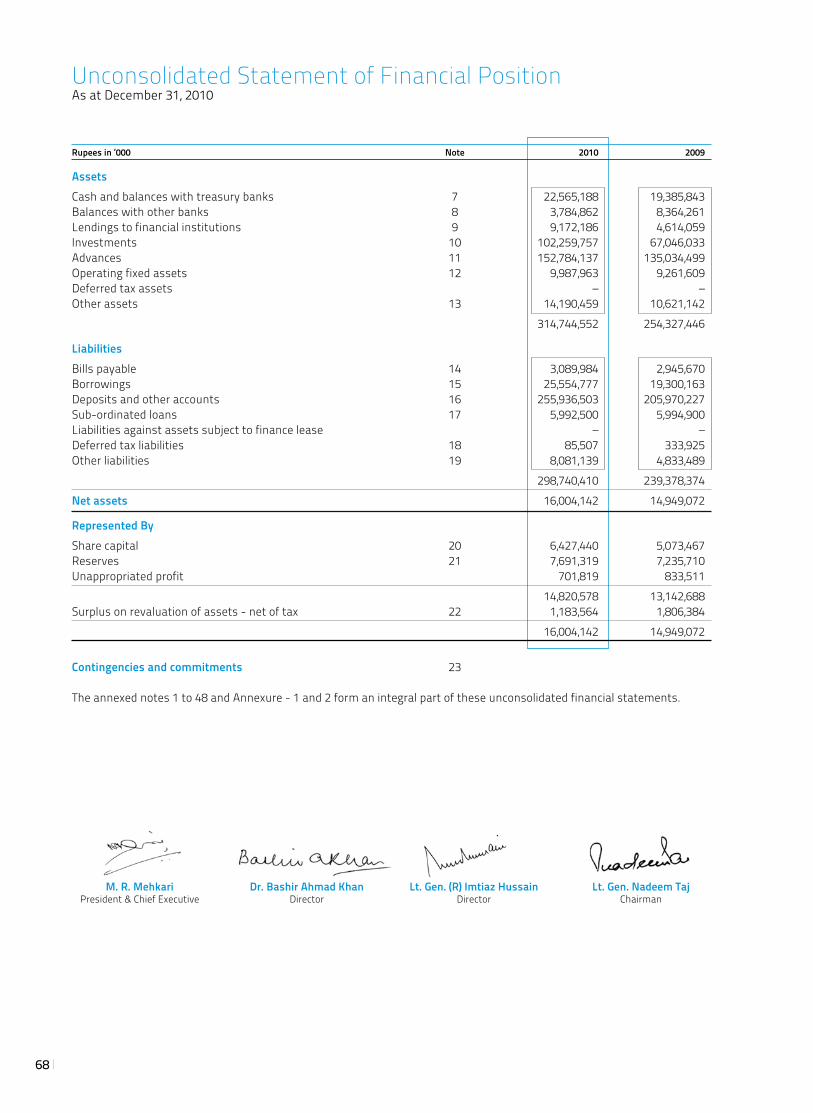
68
Rupees in ‘000 Note 2010 2009
AssetsCash and balances with treasury banks 7 22,565,188 19,385,843 Balances with other banks 8 3,784,862 8,364,261 Lendings to financial institutions 9 9,172,186 4,614,059 Investments 10 102,259,757 67,046,033 Advances 11 152,784,137 135,034,499 Operating fixed assets 12 9,987,963 9,261,609 Deferred tax assets – – Other assets 13 14,190,459 10,621,142 314,744,552 254,327,446
LiabilitiesBills payable 14 3,089,984 2,945,670 Borrowings 15 25,554,777 19,300,163 Deposits and other accounts 16 255,936,503 205,970,227 Sub-ordinated loans 17 5,992,500 5,994,900 Liabilities against assets subject to finance lease – – Deferred tax liabilities 18 85,507 333,925 Other liabilities 19 8,081,139 4,833,489 298,740,410 239,378,374 Net assets 16,004,142 14,949,072
Represented ByShare capital 20 6,427,440 5,073,467 Reserves 21 7,691,319 7,235,710 Unappropriated profit 701,819 833,511 14,820,578 13,142,688 Surplus on revaluation of assets - net of tax 22 1,183,564 1,806,384 16,004,142 14,949,072
Contingencies and commitments 23
The annexed notes 1 to 48 and Annexure - 1 and 2 form an integral part of these unconsolidated financial statements.
Unconsolidated Statement of Financial PositionAs at December 31, 2010
M. R. Mehkari Dr. Bashir Ahmad Khan Lt. Gen. (R) Imtiaz Hussain Lt. Gen. Nadeem Taj President & Chief Executive Director Director Chairman
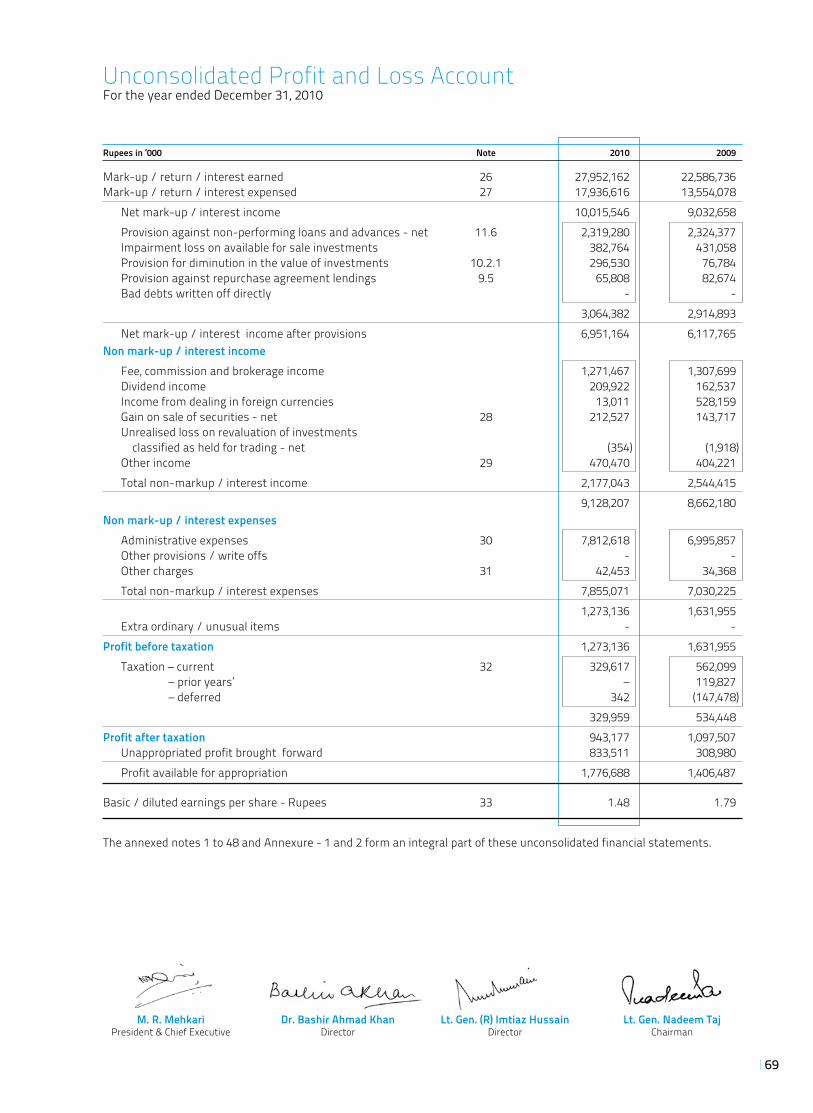
69
Rupees in ‘000 Note 2010 2009
Mark-up / return / interest earned 26 27,952,162 22,586,736 Mark-up / return / interest expensed 27 17,936,616 13,554,078 Net mark-up / interest income 10,015,546 9,032,658 Provision against non-performing loans and advances - net 11.6 2,319,280 2,324,377 Impairment loss on available for sale investments 382,764 431,058 Provision for diminution in the value of investments 10.2.1 296,530 76,784 Provision against repurchase agreement lendings 9.5 65,808 82,674 Bad debts written off directly - - 3,064,382 2,914,893 Net mark-up / interest income after provisions 6,951,164 6,117,765 Non mark-up / interest income Fee, commission and brokerage income 1,271,467 1,307,699 Dividend income 209,922 162,537 Income from dealing in foreign currencies 13,011 528,159 Gain on sale of securities - net 28 212,527 143,717 Unrealised loss on revaluation of investments classified as held for trading - net (354) (1,918) Other income 29 470,470 404,221 Total non-markup / interest income 2,177,043 2,544,415 9,128,207 8,662,180 Non mark-up / interest expenses Administrative expenses 30 7,812,618 6,995,857 Other provisions / write offs - - Other charges 31 42,453 34,368 Total non-markup / interest expenses 7,855,071 7,030,225 1,273,136 1,631,955 Extra ordinary / unusual items - - Profit before taxation 1,273,136 1,631,955 Taxation – current 32 329,617 562,099 – prior years’ – 119,827 – deferred 342 (147,478) 329,959 534,448 Profit after taxation 943,177 1,097,507 Unappropriated profit brought forward 833,511 308,980 Profit available for appropriation 1,776,688 1,406,487
Basic / diluted earnings per share - Rupees 33 1.48 1.79
The annexed notes 1 to 48 and Annexure - 1 and 2 form an integral part of these unconsolidated financial statements.
Unconsolidated Profit and Loss AccountFor the year ended December 31, 2010
M. R. Mehkari Dr. Bashir Ahmad Khan Lt. Gen. (R) Imtiaz Hussain Lt. Gen. Nadeem Taj President & Chief Executive Director Director Chairman
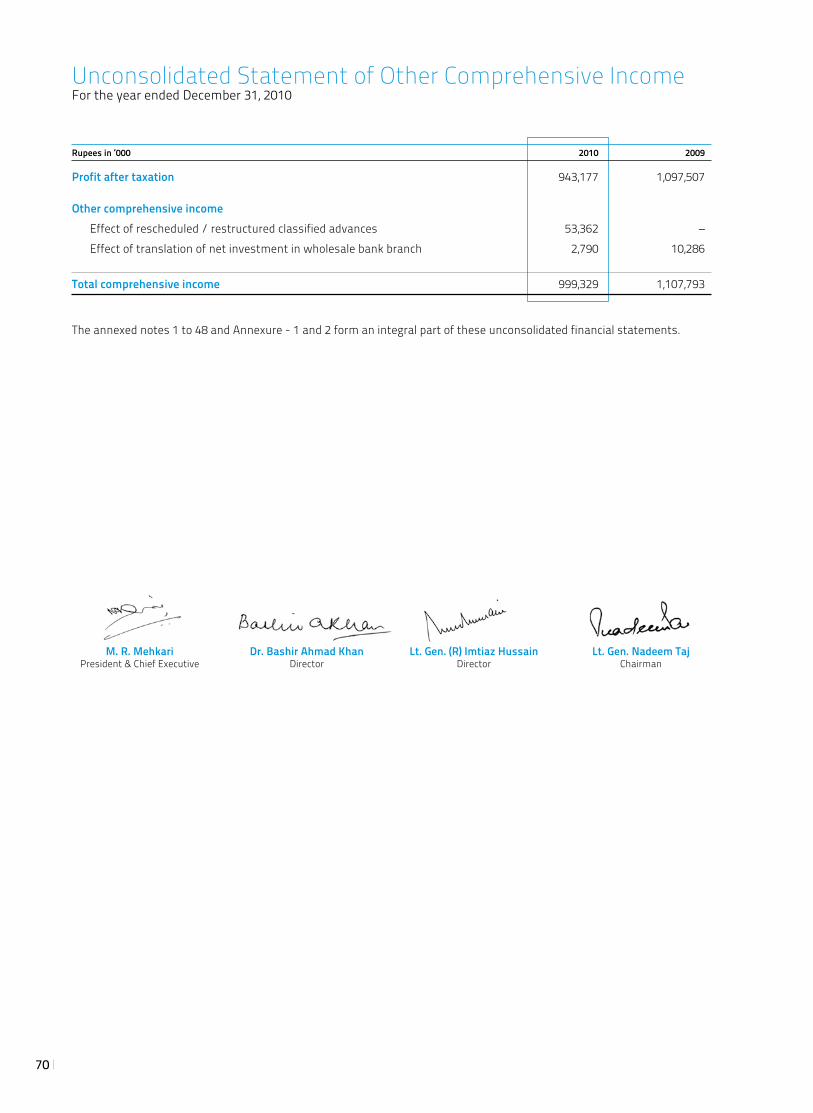
70
Rupees in ‘000 2010 2009
Profit after taxation 943,177 1,097,507
Other comprehensive income Effect of rescheduled / restructured classified advances 53,362 – Effect of translation of net investment in wholesale bank branch 2,790 10,286
Total comprehensive income 999,329 1,107,793
The annexed notes 1 to 48 and Annexure - 1 and 2 form an integral part of these unconsolidated financial statements.
Unconsolidated Statement of Other Comprehensive IncomeFor the year ended December 31, 2010
M. R. Mehkari Dr. Bashir Ahmad Khan Lt. Gen. (R) Imtiaz Hussain Lt. Gen. Nadeem Taj President & Chief Executive Director Director Chairman
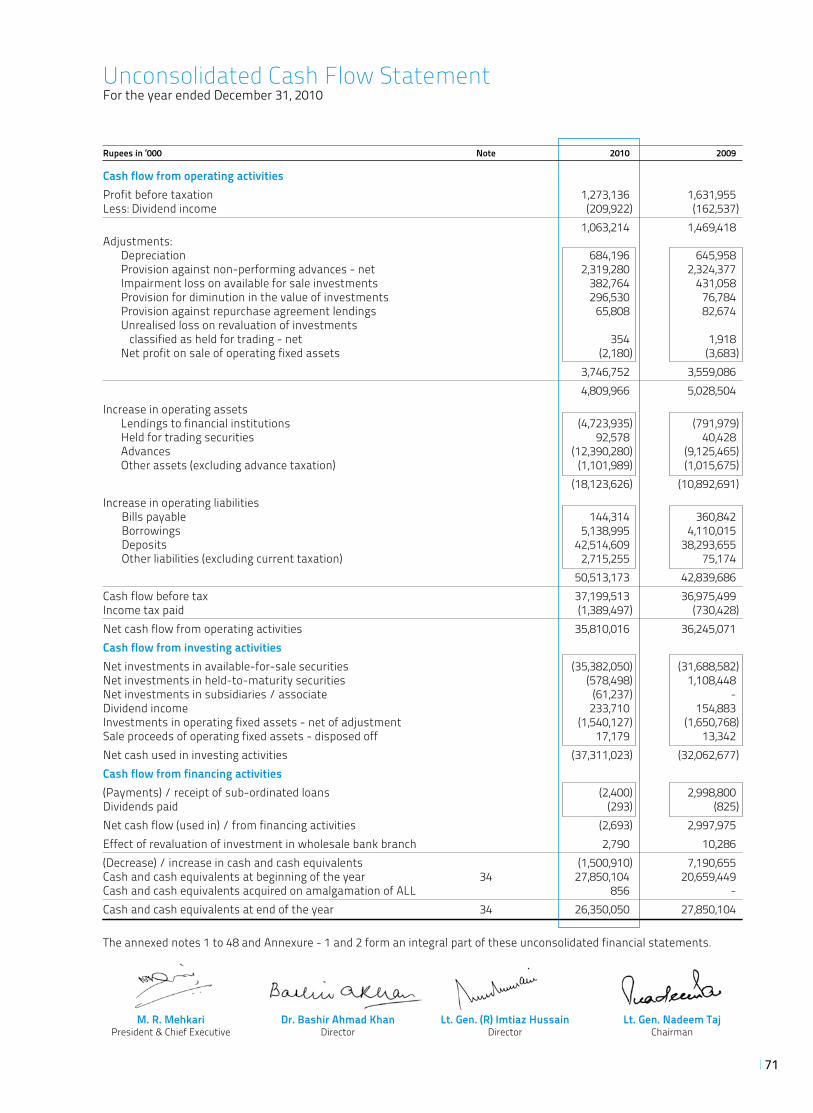
71
Rupees in ‘000 Note 2010 2009
Cash flow from operating activities Profit before taxation 1,273,136 1,631,955 Less: Dividend income (209,922) (162,537) 1,063,214 1,469,418 Adjustments: Depreciation 684,196 645,958 Provision against non-performing advances - net 2,319,280 2,324,377 Impairment loss on available for sale investments 382,764 431,058 Provision for diminution in the value of investments 296,530 76,784 Provision against repurchase agreement lendings 65,808 82,674 Unrealised loss on revaluation of investments classified as held for trading - net 354 1,918 Net profit on sale of operating fixed assets (2,180) (3,683) 3,746,752 3,559,086 4,809,966 5,028,504 Increase in operating assets Lendings to financial institutions (4,723,935) (791,979) Held for trading securities 92,578 40,428 Advances (12,390,280) (9,125,465) Other assets (excluding advance taxation) (1,101,989) (1,015,675) (18,123,626) (10,892,691)Increase in operating liabilities Bills payable 144,314 360,842 Borrowings 5,138,995 4,110,015 Deposits 42,514,609 38,293,655 Other liabilities (excluding current taxation) 2,715,255 75,174 50,513,173 42,839,686 Cash flow before tax 37,199,513 36,975,499 Income tax paid (1,389,497) (730,428)Net cash flow from operating activities 35,810,016 36,245,071 Cash flow from investing activities Net investments in available-for-sale securities (35,382,050) (31,688,582)Net investments in held-to-maturity securities (578,498) 1,108,448 Net investments in subsidiaries / associate (61,237) - Dividend income 233,710 154,883 Investments in operating fixed assets - net of adjustment (1,540,127) (1,650,768)Sale proceeds of operating fixed assets - disposed off 17,179 13,342 Net cash used in investing activities (37,311,023) (32,062,677)Cash flow from financing activities (Payments) / receipt of sub-ordinated loans (2,400) 2,998,800 Dividends paid (293) (825)Net cash flow (used in) / from financing activities (2,693) 2,997,975 Effect of revaluation of investment in wholesale bank branch 2,790 10,286 (Decrease) / increase in cash and cash equivalents (1,500,910) 7,190,655 Cash and cash equivalents at beginning of the year 34 27,850,104 20,659,449 Cash and cash equivalents acquired on amalgamation of ALL 856 - Cash and cash equivalents at end of the year 34 26,350,050 27,850,104
The annexed notes 1 to 48 and Annexure - 1 and 2 form an integral part of these unconsolidated financial statements.
Unconsolidated Cash Flow StatementFor the year ended December 31, 2010
M. R. Mehkari Dr. Bashir Ahmad Khan Lt. Gen. (R) Imtiaz Hussain Lt. Gen. Nadeem Taj President & Chief Executive Director Director Chairman
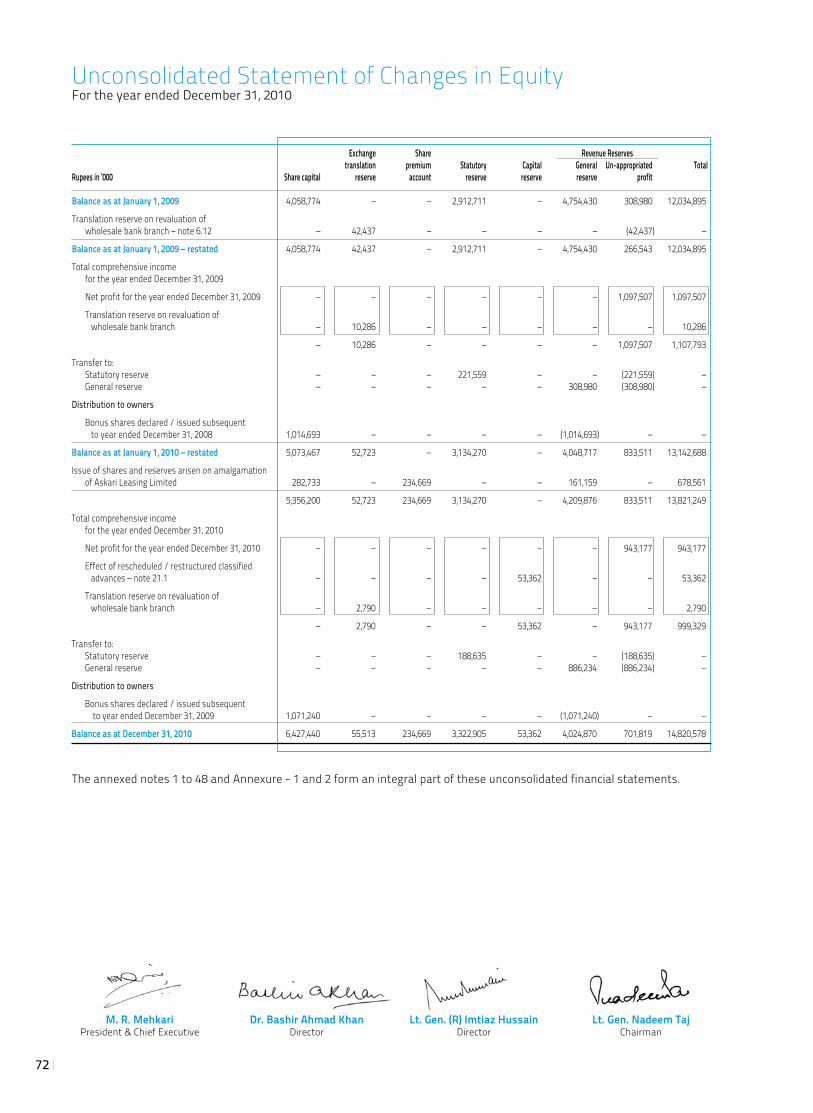
72
Exchange Share Revenue Reserves translation premium Statutory Capital General Un-appropriated TotalRupees in ‘000 Share capital reserve account reserve reserve reserve profit Balance as at January 1, 2009 4,058,774 – – 2,912,711 – 4,754,430 308,980 12,034,895
Translation reserve on revaluation of wholesale bank branch – note 6.12 – 42,437 – – – – (42,437) –
Balance as at January 1, 2009 – restated 4,058,774 42,437 – 2,912,711 – 4,754,430 266,543 12,034,895
Total comprehensive income for the year ended December 31, 2009
Net profit for the year ended December 31, 2009 – – – – – – 1,097,507 1,097,507
Translation reserve on revaluation of wholesale bank branch – 10,286 – – – – – 10,286
– 10,286 – – – – 1,097,507 1,107,793
Transfer to: Statutory reserve – – – 221,559 – – (221,559) – General reserve – – – – – 308,980 (308,980) –
Distribution to owners
Bonus shares declared / issued subsequent to year ended December 31, 2008 1,014,693 – – – – (1,014,693) – –
Balance as at January 1, 2010 – restated 5,073,467 52,723 – 3,134,270 – 4,048,717 833,511 13,142,688
Issue of shares and reserves arisen on amalgamation of Askari Leasing Limited 282,733 – 234,669 – – 161,159 – 678,561
5,356,200 52,723 234,669 3,134,270 – 4,209,876 833,511 13,821,249
Total comprehensive income for the year ended December 31, 2010
Net profit for the year ended December 31, 2010 – – – – – – 943,177 943,177
Effect of rescheduled / restructured classified advances – note 21.1 – – – – 53,362 – – 53,362
Translation reserve on revaluation of wholesale bank branch – 2,790 – – – – – 2,790
– 2,790 – – 53,362 – 943,177 999,329
Transfer to: Statutory reserve – – – 188,635 – – (188,635) – General reserve – – – – – 886,234 (886,234) –
Distribution to owners
Bonus shares declared / issued subsequent to year ended December 31, 2009 1,071,240 – – – – (1,071,240) – –
Balance as at December 31, 2010 6,427,440 55,513 234,669 3,322,905 53,362 4,024,870 701,819 14,820,578
The annexed notes 1 to 48 and Annexure - 1 and 2 form an integral part of these unconsolidated financial statements.
Unconsolidated Statement of Changes in EquityFor the year ended December 31, 2010
M. R. Mehkari Dr. Bashir Ahmad Khan Lt. Gen. (R) Imtiaz Hussain Lt. Gen. Nadeem Taj President & Chief Executive Director Director Chairman
73
Notes to the Unconsolidated Financial StatementsFor the year ended December 31, 2010
1. STATUS AND NATURE OF BUSINESS Askari Bank Limited (the Bank) was incorporated in Pakistan on October 09, 1991 as a Public Limited Company and
is listed on the Karachi, Lahore and Islamabad Stock Exchanges. The registered office of the Bank is situated at AWT Plaza, The Mall, Rawalpindi.
The Bank obtained its business commencement certificate on February 26, 1992 and started operations from April 01, 1992. Army Welfare Trust directly and indirectly holds a significant portion of the Bank’s share capital at the year end. The Bank has 235 branches (2009: 226 branches); 234 in Pakistan and Azad Jammu and Kashmir, including 31 (2009: 31) Islamic Banking branches, 16 (2009: 22) sub-branches and a wholesale bank branch in the Kingdom of Bahrain.
The Bank is a scheduled commercial bank and is principally engaged in the business of banking as defined in the Banking Companies Ordinance, 1962.
2. BUSINESS COMBINATION The amalgamation of formerly Askari Leasing Limited (ALL) with and into the Bank, was completed during the first
quarter of 2010, whereby the entire undertaking of ALL, including all properties, assets, liabilities, rights and obligations of ALL as at March 2, 2010 were amalgamated with and vest in the Bank in consideration for issue of 28.273 million fully paid ordinary shares to the shareholders of ALL which rank pari passu with the existing shares of the Bank.
ALL was incorporated in Pakistan as a public limited company on August 1, 1993 and was granted certificate of commencement of business on November 3, 1993. ALL was listed on Karachi, Lahore and Islamabad Stock Exchanges and principally engaged in the business of leasing. On the date of amalgamation, AWT held 57.66% of ALL’s share capital.
3. BASIS OF PRESENTATION3.1 These unconsolidated financial statements have been presented in accordance with the requirements of format
prescribed by the State Bank of Pakistan’s BSD Circular No 4 dated February 17, 2006.
3.2 In accordance with the directives of the Federal Government regarding shifting of the banking system to Islamic modes, the State Bank of Pakistan (SBP) has issued various circulars from time to time. One permissible form of trade related mode of financing comprises of purchase of goods by the Bank from its customers and resale to them at appropriate mark-up in price on a deferred payment basis. The purchases and sales arising under these arrangements are not reflected in these unconsolidated financial statements as such but are restricted to the amount of facilities actually utilized and the appropriate portion of mark-up thereon.
3.3 The financial results of the Islamic banking branches have been consolidated in these unconsolidated financial statements for reporting purposes, after eliminating material inter-branch transactions / balances. Key figures of the Islamic banking branches are disclosed in Annexure-2 to these unconsolidated financial statements.
3.4 Items included in the unconsolidated financial statements are measured using the currency of the primary economic environment in which the Bank operates. The unconsolidated financial statements are presented in Pak. Rupee, which is the Bank’s functional currency. Figures have been rounded off to the nearest thousand of rupees unless otherwise stated.
4. STATEMENT OF COMPLIANCE These unconsolidated financial statements have been prepared in accordance with the approved accounting standards
as applicable in Pakistan and the requirements of the Companies Ordinance, 1984 and the Banking Companies Ordinance, 1962. Approved accounting standards comprise of such International Financial Reporting Standards (IFRS) issued by the International Accounting Standard Board (IASB) and Islamic Financial Accounting Standards issued by the Institute of Chartered Accountants of Pakistan as are notified under the Companies Ordinance, 1984, provisions of and directives issued under the Companies Ordinance, 1984 and the Banking Companies Ordinance, 1962 or directives issued by the Securities and Exchange Commission of Pakistan and the State Bank of Pakistan. In case requirements differ, the provisions or directives of the Companies Ordinance, 1984, the Banking Companies Ordinance, 1962 or the requirements of the said directives shall prevail.
International Accounting Standard 39, “Financial Instruments: Recognition and Measurement”, International Accounting Standard 40, “Investment Property” and International Financial Reporting Standard 7, ”Financial Instruments: Disclosure” are not applicable to banking companies in Pakistan. Accordingly, the requirements of these Standards have not been considered in the preparation of these unconsolidated financial statements. However, investments have been classified and valued in accordance with the requirements prescribed by the State Bank of Pakistan through various circulars.
In addition, Securities and Exchange Commission of Pakistan (SECP) has notified the Islamic Financial Accounting Standard (IFAS) 1 - Murabaha issued by the Institute of Chartered Accountant of Pakistan. IFAS 1 was effective for financial periods beginning on or after January 1, 2006. The IFAS 1 has not been adopted by standalone Islamic
74
branches of conventional banks pending resolution of certain issues e.g. invoicing of goods, recording of inventories, concurrent application with other approved accounting standards in place for conventional banks, etc. Pakistan Banks’ Association and Modarba Association of Pakistan have taken up the issue with SBP and SECP.
Standards, interpretations and amendments to published approved standards that are not yet effective The following standards, amendments and interpretations of approved accounting standards are effective for
accounting periods beginning on or after January 1, 2011:
- Amendment to IAS 32 Financial Instruments: Presentation – Classification of Rights Issues (effective for annual periods beginning on or after February 01, 2010). The IASB amended IAS 32 to allow rights, options or warrants to acquire a fixed number of the entity’s own equity instruments for a fixed amount of any currency to be classified as equity instruments provided the entity offers the rights, options or warrants pro rata to all of its existing owners of the same class of its own non-derivative equity instruments. This interpretation has no impact on the Bank’s unconsolidated financial statements.
- IFRIC 19 Extinguishing Financial Liabilities with Equity Instruments (effective for annual periods beginning on or after July 01, 2010). This interpretation provides guidance on the accounting for debt for equity swaps. This interpretation has no impact on Bank’s unconsolidated financial statements.
- IAS 24 Related Party Disclosures (revised 2009 – effective for annual periods beginning on or after January 01, 2011). The revision amends the definition of a related party and modifies certain related party disclosure requirements for government-related entities. The amendment would result in certain changes in disclosures.
- Amendments to IFRIC 14 IAS 19 – The Limit on a Defined Benefit Assets, Minimum Funding Requirements and their Interaction (effective for annual periods beginning on or after January 01, 2011). These amendments remove unintended consequences arising from the treatment of prepayments where there is a minimum funding requirement. These amendments result in prepayments of contributions in certain circumstances being recognised as an asset rather than an expense. This amendment is not likely to have any impact on Bank’s unconsolidated financial statements.
- Improvements to IFRSs 2010 – In May 2010, the IASB issued improvements to IFRSs 2010, which comprise of 11 amendments to 7 standards. Effective dates, early application and transitional requirements are addressed on a standard by standard basis. The majority of amendments are effective for annual periods beginning on or after January 1, 2011. The amendments include list of events or transactions that require disclosure in the interim unconsolidated financial statements and fair value of award credits under the customer loyalty programmes to take into account the amount of discounts or incentives that otherwise would be offered to customers that have not earned the award credits. Certain of these amendments will result in increased disclosures in the unconsolidated financial statements.
- Amendments to IAS 12 – deferred tax on investment property (effective for annual periods beginning on or after January 1, 2012). The 2010 amendment provides an exception to the measurement principle in respect of investment property measured using the fair value model in accordance with IAS 40 Investment Property. The amendment has no impact on unconsolidated financial statements of the Bank.
5. BASIS OF MEASUREMENT These unconsolidated financial statements have been prepared under the historical cost convention as modified for
certain investments which are carried at fair value and freehold and leasehold land which are shown at revalued amounts.
Use of critical accounting estimates and judgments The preparation of unconsolidated financial statements in conformity with approved accounting standards as applicable
in Pakistan requires the use of certain accounting estimates. It also requires management to exercise its judgment in the process of applying the Bank’s accounting policies. The Bank uses estimates and assumptions concerning the future. The resulting accounting estimate will, by definition, seldom equal the related actual results. Estimates and judgments are continually evaluated and are based on historical experience and other factors, including expectations of future events that are believed to be reasonable under the circumstances. The areas involving a higher degree of judgment or complexity, or areas where assumptions and estimates are significant to the financial statements are as follow:
i) classification of investments (note 6.5) ii) provision against investments (note 6.5), advances (note 6.6) and other assets (note 6.8) iii) valuation and impairment of available for sale securities (note 6.5) iv) useful life of property and equipments, revaluation of land (note 6.7) v) taxation (note 6.9) vi) staff retirement benefits (note 6.10)
Notes to the Unconsolidated Financial StatementsFor the year ended December 31, 2010
75
6. SUMMARY OF SIGNIFICANT ACCOUNTING POLICIES
6.1 Amalgamation of entity under common control is accounted for by applying Predecessor Value Method.6.2 SBP vide BSD circular letter No. 7 of 2010 dated April 20, 2010 has clarified that two statement approach shall be
adopted in the preparation of quarterly, half yearly and annual financial statements as mentioned in the revised IAS-1 “Presentation of Financial Statements”. Accordingly, the Bank has presented Profit and Loss account and Statement of Comprehensive Income separately in these unconsolidated financial statements. Further in accordance with this circular, the Bank has opted not to present the changes in fair value of available for sale securities in Statement of Comprehensive Income and accordingly such changes are included in surplus / (deficit) on revaluation of available for sale securities.
6.3 Cash and cash equivalents Cash and cash equivalents comprise of cash and balances with treasury banks, balances with other banks and call
money lendings.
6.4 Sale and repurchase agreements Securities sold under repurchase agreement (repo) are retained in the unconsolidated financial statements as
investments and a liability for consideration received is included in borrowings. Conversely, consideration for securities purchased under resale agreement (reverse repo) are included in lendings to financial institutions. The difference between sale and repurchase / purchase and resale price is recognised as mark-up / return expensed and earned on a time proportion basis as the case may be. Repo and reverse repo balances are reflected under borrowings from and lendings to financial institutions respectively.
6.5 Investments Investments are classified as follows:
Held for trading These represent securities acquired with the intention to trade by taking advantage of short-term market / interest rate
movements. These are marked to market and surplus / deficit arising on revaluation of ‘held for trading’ investments is taken to profit and loss account in accordance with the requirements prescribed by the State Bank of Pakistan through various circulars.
Available for sale These represent securities which do not fall under ‘held for trading’ or ‘held to maturity’ categories. In accordance
with the requirements of the State Bank of Pakistan’s BSD Circular No. 20 dated August 04, 2000, available for sale securities for which ready quotations are available on Reuters Page (PKRV) or Stock Exchanges are valued at market value and the resulting surplus / deficit is kept in a separate account and is shown below the shareholders’ equity in the unconsolidated statement of financial position. Where the decline in prices of available for sale securities is significant or prolonged, it is considered impaired and included in profit and loss account. Foreign securities are carried at fair value, based on their current bid prices in active markets.
Unquoted equity securities are valued at the lower of cost and break-up value. Break-up value of equity securities is calculated with reference to the net assets of the investee as per the latest audited unconsolidated financial statements. Investments in other unquoted securities are valued at cost less impairment losses, if any.
Held to maturity These represent securities acquired with the intention and ability to hold them upto maturity. These are carried at
amortized cost less impairment, if any, in accordance with the requirements prescribed by the State Bank of Pakistan through various circulars.
Investment in subsidiaries and associate Investments in subsidiaries and associate are carried at cost less impairment, if any.
All purchases and sale of investment that require delivery within the time frame established by regulations or market convention are recognized at the trade date, which is the date the Bank commits to purchase or sell the investments.
6.6 Advances Advances are stated net of provisions for non-performing advances. Provision for advances is determined in
accordance with the requirements of the Prudential Regulations issued by the State Bank of Pakistan from time to time. In addition, a general provision is maintained for advances other than consumer advances as per details given in note 11.6.3.
The provisions against non-performing advances are charged to the profit and loss account. Advances are written off when there is no realistic prospect of recovery.
76
The State Bank of Pakistan has notified for adoption of “Islamic Financial Accounting Standard 2 Ijarah” (IFAS-2) which is applicable for accounting period beginning on or after January 01, 2009. Consequent to the adoption of IFAS-2, such Ijarahs booked on or after January 01, 2009 are stated at cost less accumulated depreciation and impairment if any, and are shown under advances.
Leases where the Bank transfers substantially all the risks and rewards incidental to ownership of an asset to the lessee are classified as finance leases. A receivable is recognised at an amount equal to the present value of the lease payments including any guaranteed residual value. Finance lease receivables are included in advances to the customers.
The rentals received / receivable on above Ijarahs are recorded as income / revenue. Depreciation on Ijarah assets is charged to profit and loss account by applying the straight line method whereby the depreciable value of Ijarah assets is written off over the Ijarah period. The Bank charges depreciation from the date of delivery of respective assets to Mustajir upto the date of maturity / termination of Ijarah agreement.
6.7 Capital work-in-progress, operating fixed assets and depreciation
Capital work-in-progress Capital work-in-progress is stated at cost less impairment loss, if any.
Owned assets Fixed assets are stated at cost less impairment losses and accumulated depreciation except for freehold / leasehold
land. Land is carried at revalued amounts which is not depreciated.
Land is revalued by professionally qualified valuers with sufficient regularity to ensure that the net carrying amount does not differ materially from their fair value. Surplus / (deficit) arising on revaluation of fixed assets is credited/ (debited) to the surplus on revaluation of assets account and is shown below the shareholders’ equity in the unconsolidated statement of financial position. Except to the extent actually realised on disposal of land which are revalued, the surplus on revaluation of land shall not be applied to set-off or reduce any deficit or loss, whether past, current or future, or in any manner applied, adjusted or treated so as to add to the income, profit or surplus of the Bank or utilized directly or indirectly by way of dividend or bonus.
Depreciation is computed over the estimated useful lives of the related assets at the rates set out in note 12.2. The cost of assets is depreciated on the diminishing balance method, except for vehicles, carpets, renovations and other assets which are depreciated on a straight line basis. Depreciation is charged for the full month on purchase / acquisition of an asset while no depreciation is charged in the month of disposal of an asset. Maintenance and normal repairs are charged to profit and loss account as and when incurred. Major renewals and improvements are capitalized. Gains and losses on disposal of operating fixed assets are taken to the profit and loss account.
In making estimates of the depreciation, the management uses method which reflects the pattern in which economic benefits are expected to be consumed by the Bank. The method applied is reviewed at each financial year end and if there is a change in the expected pattern of consumption of future economic benefits embodied in the assets, the method would be changed to reflect the change in pattern. Such change is accounted for as change in accounting estimates in accordance with International Accounting Standard - 8, ‘Accounting Policies, Changes in Accounting Estimates and Errors’.
6.8 Impairment The carrying amount of the Bank’s assets are reviewed at the date of unconsolidated statement of financial position
to determine whether there is any indication of impairment. If such indications exist, the asset’s recoverable amount is estimated in order to determine the extent of the impairment loss, if any. Impairment loss is recognised as expense in the unconsolidated profit and loss account. An impairment loss is reversed only to the extent that the asset’s carrying amount does not exceed the carrying amount that would have been determined, net of depreciation or amortisation, if no impairment loss had been recognised.
6.9 Taxation Income tax on the profit or loss for the year comprises current and deferred tax. Income tax is recognised in the
unconsolidated profit and loss account, except to the extent that it relates to items recognised directly in equity or below equity / other comprehensive income, in which case it is recognised in equity or below equity / other comprehensive income.
Current Provision for current tax is the expected tax payable on the taxable profit for the year using tax rates applicable at the
date of unconsolidated statement of financial position and any adjustment to tax payable for previous years.
Notes to the Unconsolidated Financial StatementsFor the year ended December 31, 2010
77
Deferred Deferred tax is provided for by using the balance sheet liability method, providing for temporary differences between
the carrying amounts of assets and liabilities for financial reporting purposes and the amount used for taxation purposes. The amount of deferred tax provided is based on the expected manner of realization or settlement of the carrying amount of assets and liabilities using tax rates enacted or substantially enacted at the date of unconsolidated statement of financial position, expected to be applicable at the time of its reversal. A deferred tax asset is recognised only to the extent that it is probable that the future taxable profit will be available and credits can be utilized. Deferred tax assets are reduced to the extent it is no longer probable that the related tax benefit will be realised.
Deferred tax, on revaluation of investments, if any, is recognised as an adjustment to surplus / (deficit) arising on such revaluation.
6.10 Staff retirement benefits Defined benefit plan
The Bank operates an approved funded gratuity scheme for all its regular employees. Contributions are made in accordance with the actuarial recommendation. The actuarial valuation is carried out periodically using “Projected Unit Credit Method”. The actuarial gains / losses in excess of corridor limit (10% of higher of present value of obligation and fair value of plan assets) are recognized over the expected remaining working life of its employees.
Defined contribution plan The Bank operates a recognised provident fund scheme for all its regular employees for which equal monthly
contributions are made both by the Bank and by the employees at the rate of 8.33% of the basic salary of the employee. Compensated absences The Bank grants compensated absences to all its regular employees. Liability for unfunded scheme is recognized
on the basis of actuarial valuation using the “Projected Unit Credit Method”. Provision for the year is charged to unconsolidated profit and loss account. The amount recognised in the unconsolidated statement of financial position represents the present value of defined benefit obligations.
6.11 Revenue recognition Mark-up / interest on advances and return on investments is recognised on accrual basis except on classified
advances and investments which is recognized on receipt basis. Mark-up / interest on rescheduled / restructured advances and investments is recognised as permitted by the regulations of the State Bank of Pakistan or overseas regulatory authority of the country where branch operates, except where in the opinion of the management it would not be prudent to do so.
Fees, commission and brokerage income is recognised at the time of performance of service.
Dividend income is recognised when Bank’s right to receive the income is established.
Gains and losses on sale of investments are included in income currently.
6.12 Foreign currencies Foreign currency transactions Foreign currency transactions are translated into Pak. Rupee at the exchange rates prevailing on the date of transaction.
Monetary assets and liabilities in foreign currencies are translated to Pak. Rupee at the exchange rates prevailing at the date of unconsolidated statement of financial position. Outstanding foreign bills purchased are valued at the rates applicable to the remaining maturities. Exchange gains and losses are included in unconsolidated profit and loss account currently.
Foreign operation The assets and liabilities of wholesale bank branch are translated to Pak. Rupee at exchange rates prevailing at the
date of unconsolidated statement of financial position. The results of foreign operations are translated at the average rate of exchange for the year.
Translation gains and losses Translation gains and losses were previously included in the unconsolidated profit and loss account, however, now
translation gains and losses arising on revaluation of net investment in foreign operations are taken to equity under “Exchange Translation Reserve” and on disposal are recognised in unconsolidated profit and loss account. Accordingly, comparative figures have been restated.
78
Notes to the Unconsolidated Financial StatementsFor the year ended December 31, 2010
Commitments Commitments for outstanding forward foreign exchange contracts are valued at the rates applicable to the remaining
maturities. Contingent liabilities / commitments for letters of credits and letters of guarantees denominated in foreign currencies are translated into Pak. Rupee at the rates of exchange ruling on the date of unconsolidated statement of financial position.
6.13 Provisions Provisions are recognised when there are present, legal or constructive obligations as a result of past events, it is
probable that an out flow of resources embodying economic benefits will be required to settle the obligation and a reliable estimate of the amounts can be made. Provision for guarantee claims and other off balance sheet obligations is recognized when intimated and reasonable certainty exists to settle the obligations. Expected recoveries are recognized by debiting customer accounts. Charge to unconsolidated profit and loss account is stated net off expected recoveries.
6.14 Off-setting Financial assets and financial liabilities are only set-off and the net amount is reported in the unconsolidated financial
statements when there is a legally enforceable right to set-off the recognised amount and the Bank intends either to settle on a net basis, or to realise the assets and to settle the liabilities simultaneously.
6.15 Appropriations subsequent to the date of unconsolidated statement of financial position Appropriations subsequent to year end are recognised during the year in which those appropriations are made.
6.16 Segment reporting A segment is a distinguishable component of the Bank that is engaged in providing products or services (business
segment) or in providing product or services within a particular economic environment (geographical segment), which is subject to risks and rewards that are different from those of other segments. The Bank’s primary format of reporting is based on business segments.
6.16.1 Business segment Corporate financing Corporate financing includes corporate and investment banking activities such as mergers and acquisition, underwriting,
privatization, securitisation, IPO’s related activities and secondary private placements. Trading and Sales Trading and sales includes the Bank’s treasury and money market activities classified as held for trading. Retail Banking Retail banking segment provides services to small borrowers and include loans, deposits and other transactions with
retail customers and credit card business. Commercial Banking Commercial banking segment provides services related to project finance, export finance, trade finance, leasing, lending,
guarantees, bills of exchange and deposits from corporate customers. Payment and settlement Payment and settlement includes income from payments and collections, funds transfer, clearing and
settlement. Agency services Agency services include income from rent of lockers provided to customers. Sub-ordinated loans It represents Term Finance Certificates issued by the Bank.
6.16.2 Geographical segments The Bank operates in two geographic regions; Pakistan and the Middle East.
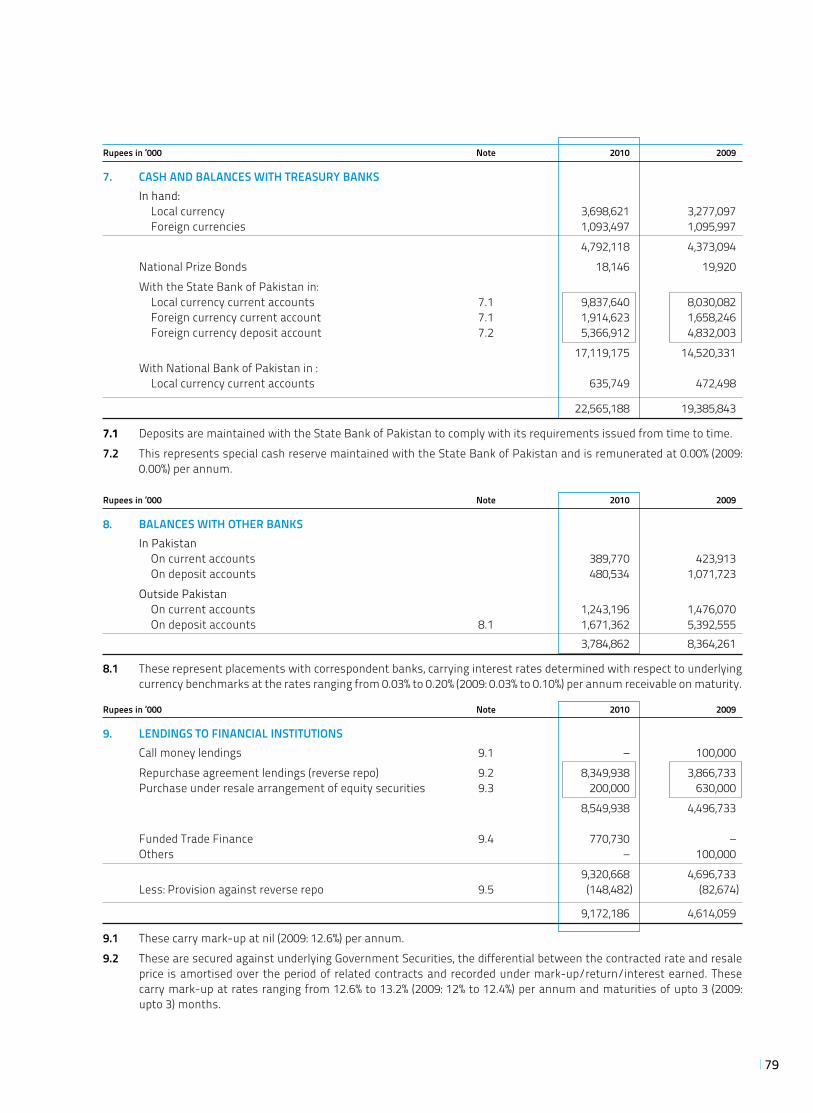
79
Rupees in ‘000 Note 2010 2009
7. CASH AND BALANCES WITH TREASURY BANKS In hand: Local currency 3,698,621 3,277,097 Foreign currencies 1,093,497 1,095,997 4,792,118 4,373,094 National Prize Bonds 18,146 19,920 With the State Bank of Pakistan in: Local currency current accounts 7.1 9,837,640 8,030,082 Foreign currency current account 7.1 1,914,623 1,658,246 Foreign currency deposit account 7.2 5,366,912 4,832,003 17,119,175 14,520,331 With National Bank of Pakistan in : Local currency current accounts 635,749 472,498
22,565,188 19,385,843
7.1 Deposits are maintained with the State Bank of Pakistan to comply with its requirements issued from time to time. 7.2 This represents special cash reserve maintained with the State Bank of Pakistan and is remunerated at 0.00% (2009:
0.00%) per annum.
Rupees in ‘000 Note 2010 2009
8. BALANCES WITH OTHER BANKS In Pakistan On current accounts 389,770 423,913 On deposit accounts 480,534 1,071,723 Outside Pakistan On current accounts 1,243,196 1,476,070 On deposit accounts 8.1 1,671,362 5,392,555 3,784,862 8,364,261
8.1 These represent placements with correspondent banks, carrying interest rates determined with respect to underlying currency benchmarks at the rates ranging from 0.03% to 0.20% (2009: 0.03% to 0.10%) per annum receivable on maturity.
Rupees in ‘000 Note 2010 2009
9. LENDINGS TO FINANCIAL INSTITUTIONS Call money lendings 9.1 – 100,000 Repurchase agreement lendings (reverse repo) 9.2 8,349,938 3,866,733 Purchase under resale arrangement of equity securities 9.3 200,000 630,000 8,549,938 4,496,733
Funded Trade Finance 9.4 770,730 – Others – 100,000 9,320,668 4,696,733 Less: Provision against reverse repo 9.5 (148,482) (82,674)
9,172,186 4,614,059
9.1 These carry mark-up at nil (2009: 12.6%) per annum.9.2 These are secured against underlying Government Securities, the differential between the contracted rate and resale
price is amortised over the period of related contracts and recorded under mark-up/return/interest earned. These carry mark-up at rates ranging from 12.6% to 13.2% (2009: 12% to 12.4%) per annum and maturities of upto 3 (2009: upto 3) months.
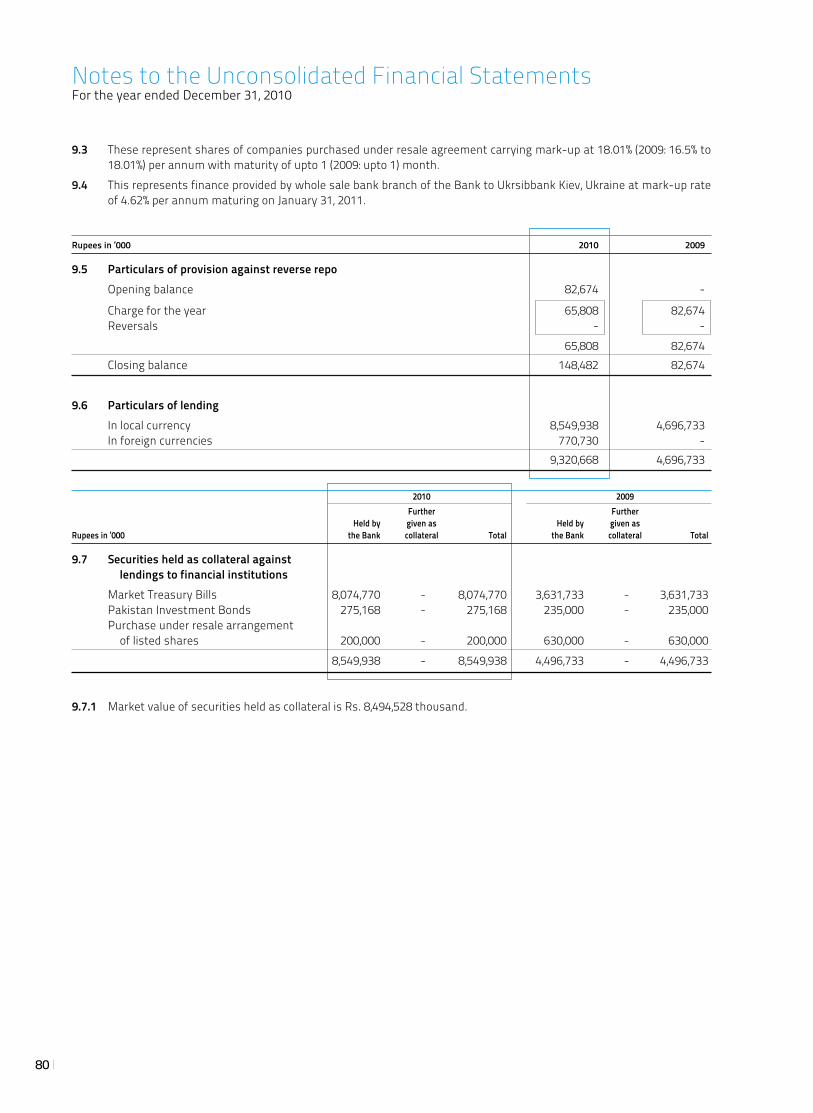
80
9.3 These represent shares of companies purchased under resale agreement carrying mark-up at 18.01% (2009: 16.5% to 18.01%) per annum with maturity of upto 1 (2009: upto 1) month.
9.4 This represents finance provided by whole sale bank branch of the Bank to Ukrsibbank Kiev, Ukraine at mark-up rate of 4.62% per annum maturing on January 31, 2011.
Rupees in ‘000 2010 2009
9.5 Particulars of provision against reverse repo Opening balance 82,674 -
Charge for the year 65,808 82,674 Reversals - - 65,808 82,674 Closing balance 148,482 82,674
9.6 Particulars of lending In local currency 8,549,938 4,696,733 In foreign currencies 770,730 - 9,320,668 4,696,733
2010 2009 Further Further Held by given as Held by given asRupees in ‘000 the Bank collateral Total the Bank collateral Total
9.7 Securities held as collateral against lendings to financial institutions Market Treasury Bills 8,074,770 - 8,074,770 3,631,733 - 3,631,733 Pakistan Investment Bonds 275,168 - 275,168 235,000 - 235,000 Purchase under resale arrangement of listed shares 200,000 - 200,000 630,000 - 630,000 8,549,938 - 8,549,938 4,496,733 - 4,496,733
9.7.1 Market value of securities held as collateral is Rs. 8,494,528 thousand.
Notes to the Unconsolidated Financial StatementsFor the year ended December 31, 2010
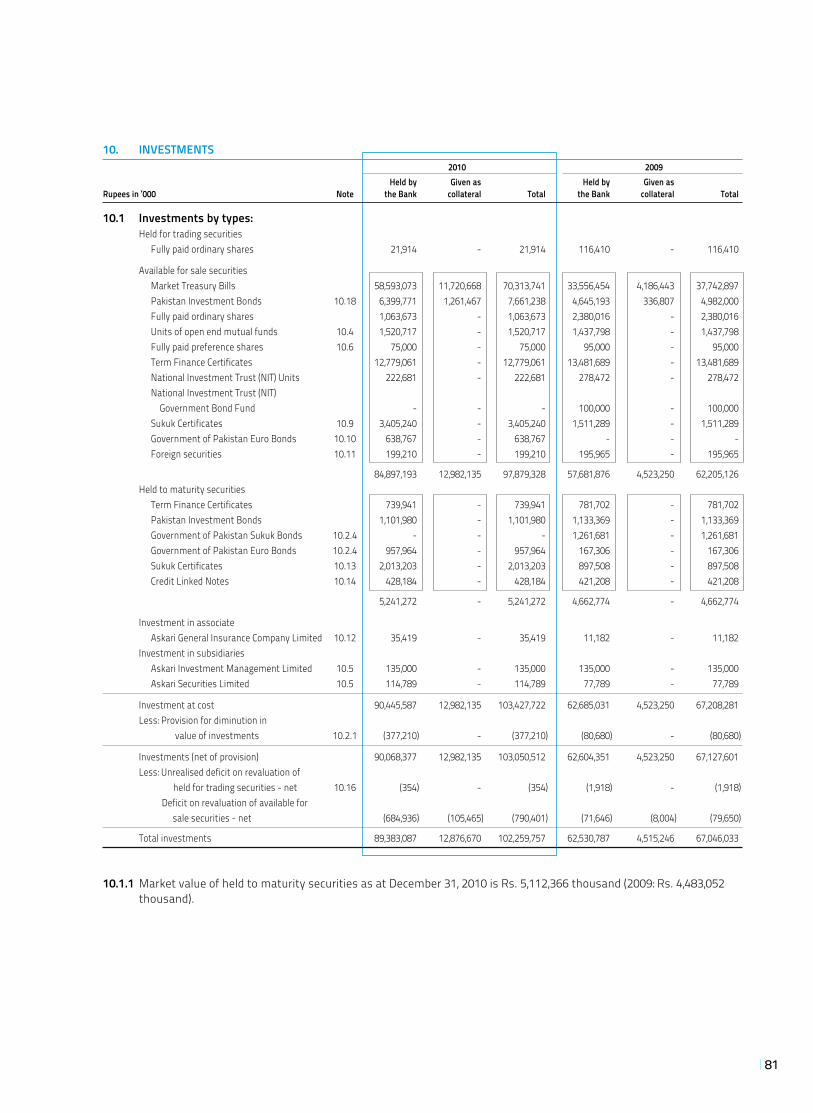
81
10. INVESTMENTS 2010 2009 Held by Given as Held by Given asRupees in ‘000 Note the Bank collateral Total the Bank collateral Total
10.1 Investments by types: Held for trading securities Fully paid ordinary shares 21,914 - 21,914 116,410 - 116,410
Available for sale securities Market Treasury Bills 58,593,073 11,720,668 70,313,741 33,556,454 4,186,443 37,742,897 Pakistan Investment Bonds 10.18 6,399,771 1,261,467 7,661,238 4,645,193 336,807 4,982,000 Fully paid ordinary shares 1,063,673 - 1,063,673 2,380,016 - 2,380,016 Units of open end mutual funds 10.4 1,520,717 - 1,520,717 1,437,798 - 1,437,798 Fully paid preference shares 10.6 75,000 - 75,000 95,000 - 95,000 Term Finance Certificates 12,779,061 - 12,779,061 13,481,689 - 13,481,689 National Investment Trust (NIT) Units 222,681 - 222,681 278,472 - 278,472 National Investment Trust (NIT) Government Bond Fund - - - 100,000 - 100,000 Sukuk Certificates 10.9 3,405,240 - 3,405,240 1,511,289 - 1,511,289 Government of Pakistan Euro Bonds 10.10 638,767 - 638,767 - - - Foreign securities 10.11 199,210 - 199,210 195,965 - 195,965
84,897,193 12,982,135 97,879,328 57,681,876 4,523,250 62,205,126 Held to maturity securities Term Finance Certificates 739,941 - 739,941 781,702 - 781,702 Pakistan Investment Bonds 1,101,980 - 1,101,980 1,133,369 - 1,133,369 Government of Pakistan Sukuk Bonds 10.2.4 - - - 1,261,681 - 1,261,681 Government of Pakistan Euro Bonds 10.2.4 957,964 - 957,964 167,306 - 167,306 Sukuk Certificates 10.13 2,013,203 - 2,013,203 897,508 - 897,508 Credit Linked Notes 10.14 428,184 - 428,184 421,208 - 421,208
5,241,272 - 5,241,272 4,662,774 - 4,662,774
Investment in associate Askari General Insurance Company Limited 10.12 35,419 - 35,419 11,182 - 11,182 Investment in subsidiaries Askari Investment Management Limited 10.5 135,000 - 135,000 135,000 - 135,000 Askari Securities Limited 10.5 114,789 - 114,789 77,789 - 77,789
Investment at cost 90,445,587 12,982,135 103,427,722 62,685,031 4,523,250 67,208,281 Less: Provision for diminution in value of investments 10.2.1 (377,210) - (377,210) (80,680) - (80,680)
Investments (net of provision) 90,068,377 12,982,135 103,050,512 62,604,351 4,523,250 67,127,601 Less: Unrealised deficit on revaluation of held for trading securities - net 10.16 (354) - (354) (1,918) - (1,918) Deficit on revaluation of available for sale securities - net (684,936) (105,465) (790,401) (71,646) (8,004) (79,650)
Total investments 89,383,087 12,876,670 102,259,757 62,530,787 4,515,246 67,046,033
10.1.1 Market value of held to maturity securities as at December 31, 2010 is Rs. 5,112,366 thousand (2009: Rs. 4,483,052 thousand).
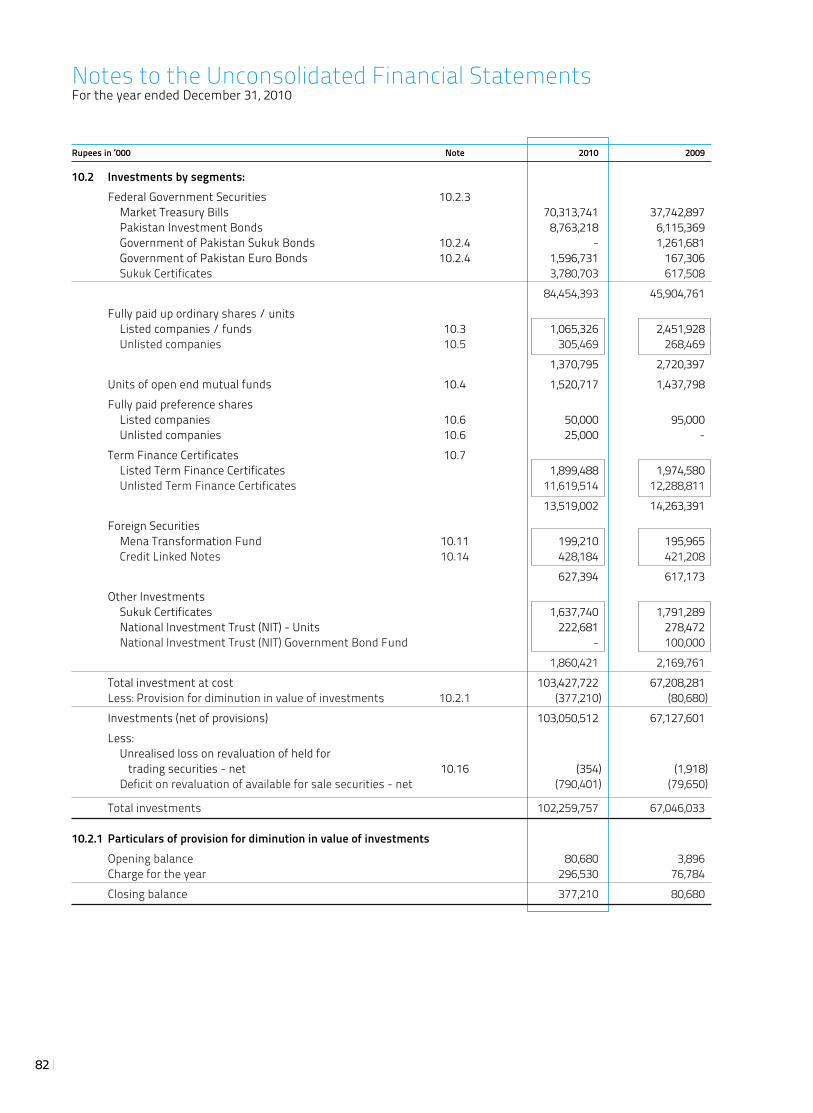
82
Rupees in ‘000 Note 2010 2009
10.2 Investments by segments: Federal Government Securities 10.2.3 Market Treasury Bills 70,313,741 37,742,897 Pakistan Investment Bonds 8,763,218 6,115,369 Government of Pakistan Sukuk Bonds 10.2.4 - 1,261,681 Government of Pakistan Euro Bonds 10.2.4 1,596,731 167,306 Sukuk Certificates 3,780,703 617,508 84,454,393 45,904,761 Fully paid up ordinary shares / units Listed companies / funds 10.3 1,065,326 2,451,928 Unlisted companies 10.5 305,469 268,469 1,370,795 2,720,397 Units of open end mutual funds 10.4 1,520,717 1,437,798 Fully paid preference shares Listed companies 10.6 50,000 95,000 Unlisted companies 10.6 25,000 - Term Finance Certificates 10.7 Listed Term Finance Certificates 1,899,488 1,974,580 Unlisted Term Finance Certificates 11,619,514 12,288,811 13,519,002 14,263,391 Foreign Securities Mena Transformation Fund 10.11 199,210 195,965 Credit Linked Notes 10.14 428,184 421,208 627,394 617,173 Other Investments Sukuk Certificates 1,637,740 1,791,289 National Investment Trust (NIT) - Units 222,681 278,472 National Investment Trust (NIT) Government Bond Fund - 100,000 1,860,421 2,169,761 Total investment at cost 103,427,722 67,208,281 Less: Provision for diminution in value of investments 10.2.1 (377,210) (80,680) Investments (net of provisions) 103,050,512 67,127,601 Less: Unrealised loss on revaluation of held for trading securities - net 10.16 (354) (1,918) Deficit on revaluation of available for sale securities - net (790,401) (79,650)
Total investments 102,259,757 67,046,033
10.2.1 Particulars of provision for diminution in value of investments Opening balance 80,680 3,896 Charge for the year 296,530 76,784 Closing balance 377,210 80,680
Notes to the Unconsolidated Financial StatementsFor the year ended December 31, 2010
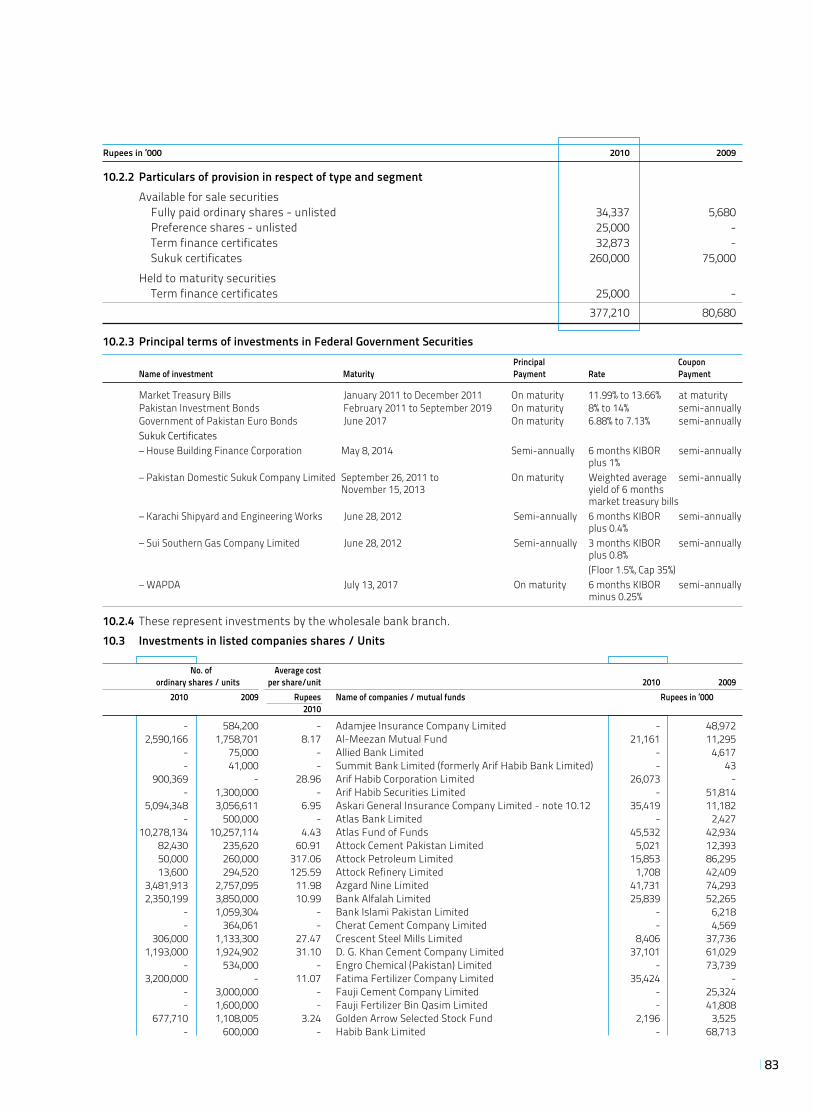
83
10.3 Investments in listed companies shares / Units No. of Average cost ordinary shares / units per share/unit 2010 2009 2010 2009 Rupees Name of companies / mutual funds Rupees in ‘000 2010
- 584,200 - Adamjee Insurance Company Limited - 48,972 2,590,166 1,758,701 8.17 Al-Meezan Mutual Fund 21,161 11,295 - 75,000 - Allied Bank Limited - 4,617 - 41,000 - Summit Bank Limited (formerly Arif Habib Bank Limited) - 43 900,369 - 28.96 Arif Habib Corporation Limited 26,073 - - 1,300,000 - Arif Habib Securities Limited - 51,814 5,094,348 3,056,611 6.95 Askari General Insurance Company Limited - note 10.12 35,419 11,182 - 500,000 - Atlas Bank Limited - 2,427 10,278,134 10,257,114 4.43 Atlas Fund of Funds 45,532 42,934 82,430 235,620 60.91 Attock Cement Pakistan Limited 5,021 12,393 50,000 260,000 317.06 Attock Petroleum Limited 15,853 86,295 13,600 294,520 125.59 Attock Refinery Limited 1,708 42,409 3,481,913 2,757,095 11.98 Azgard Nine Limited 41,731 74,293 2,350,199 3,850,000 10.99 Bank Alfalah Limited 25,839 52,265 - 1,059,304 - Bank Islami Pakistan Limited - 6,218 - 364,061 - Cherat Cement Company Limited - 4,569 306,000 1,133,300 27.47 Crescent Steel Mills Limited 8,406 37,736 1,193,000 1,924,902 31.10 D. G. Khan Cement Company Limited 37,101 61,029 - 534,000 - Engro Chemical (Pakistan) Limited - 73,739 3,200,000 - 11.07 Fatima Fertilizer Company Limited 35,424 - - 3,000,000 - Fauji Cement Company Limited - 25,324 - 1,600,000 - Fauji Fertilizer Bin Qasim Limited - 41,808 677,710 1,108,005 3.24 Golden Arrow Selected Stock Fund 2,196 3,525 - 600,000 - Habib Bank Limited - 68,713
10.2.3 Principal terms of investments in Federal Government Securities Principal Coupon Name of investment Maturity Payment Rate Payment
Market Treasury Bills January 2011 to December 2011 On maturity 11.99% to 13.66% at maturity Pakistan Investment Bonds February 2011 to September 2019 On maturity 8% to 14% semi-annually Government of Pakistan Euro Bonds June 2017 On maturity 6.88% to 7.13% semi-annually Sukuk Certificates – House Building Finance Corporation May 8, 2014 Semi-annually 6 months KIBOR semi-annually plus 1% – Pakistan Domestic Sukuk Company Limited September 26, 2011 to On maturity Weighted average semi-annually November 15, 2013 yield of 6 months market treasury bills – Karachi Shipyard and Engineering Works June 28, 2012 Semi-annually 6 months KIBOR semi-annually plus 0.4% – Sui Southern Gas Company Limited June 28, 2012 Semi-annually 3 months KIBOR semi-annually plus 0.8% (Floor 1.5%, Cap 35%) – WAPDA July 13, 2017 On maturity 6 months KIBOR semi-annually minus 0.25%
10.2.4 These represent investments by the wholesale bank branch.
Rupees in ‘000 2010 2009
10.2.2 Particulars of provision in respect of type and segment Available for sale securities Fully paid ordinary shares - unlisted 34,337 5,680 Preference shares - unlisted 25,000 - Term finance certificates 32,873 - Sukuk certificates 260,000 75,000 Held to maturity securities Term finance certificates 25,000 - 377,210 80,680
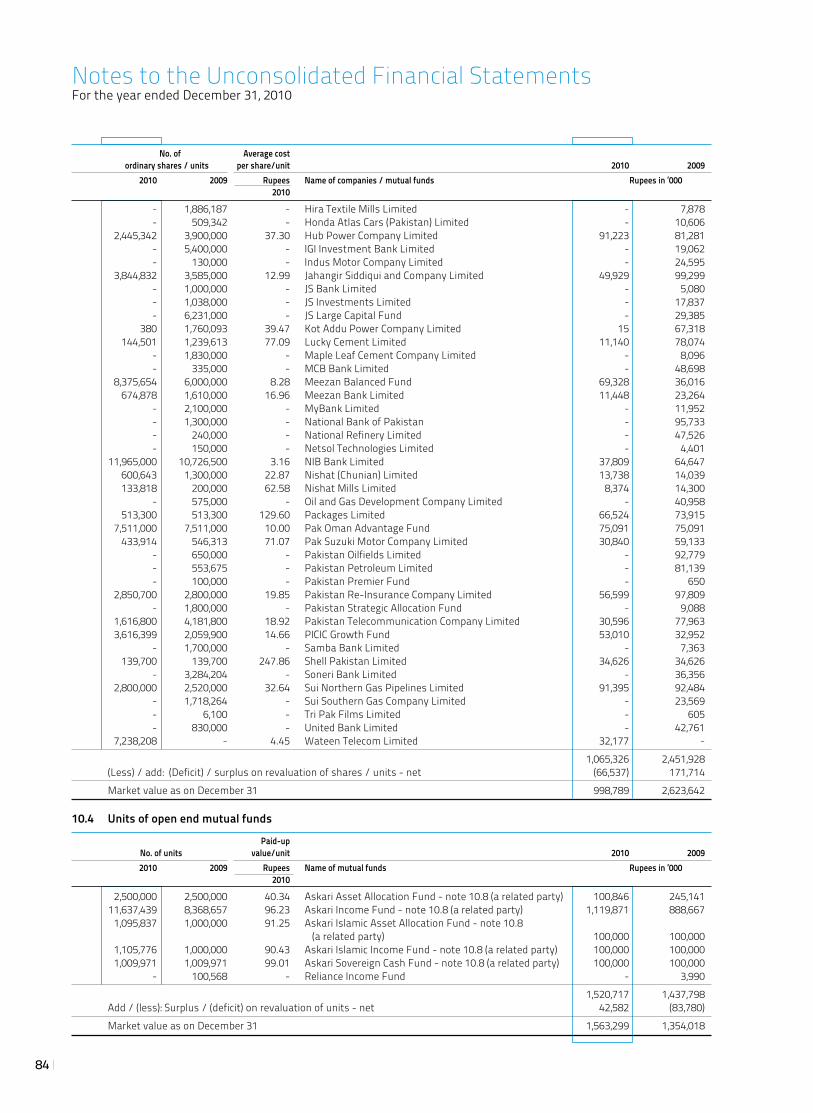
84
No. of Average cost ordinary shares / units per share/unit 2010 2009 2010 2009 Rupees Name of companies / mutual funds Rupees in ‘000 2010
- 1,886,187 - Hira Textile Mills Limited - 7,878 - 509,342 - Honda Atlas Cars (Pakistan) Limited - 10,606 2,445,342 3,900,000 37.30 Hub Power Company Limited 91,223 81,281 - 5,400,000 - IGI Investment Bank Limited - 19,062 - 130,000 - Indus Motor Company Limited - 24,595 3,844,832 3,585,000 12.99 Jahangir Siddiqui and Company Limited 49,929 99,299 - 1,000,000 - JS Bank Limited - 5,080 - 1,038,000 - JS Investments Limited - 17,837 - 6,231,000 - JS Large Capital Fund - 29,385 380 1,760,093 39.47 Kot Addu Power Company Limited 15 67,318 144,501 1,239,613 77.09 Lucky Cement Limited 11,140 78,074 - 1,830,000 - Maple Leaf Cement Company Limited - 8,096 - 335,000 - MCB Bank Limited - 48,698 8,375,654 6,000,000 8.28 Meezan Balanced Fund 69,328 36,016 674,878 1,610,000 16.96 Meezan Bank Limited 11,448 23,264 - 2,100,000 - MyBank Limited - 11,952 - 1,300,000 - National Bank of Pakistan - 95,733 - 240,000 - National Refinery Limited - 47,526 - 150,000 - Netsol Technologies Limited - 4,401 11,965,000 10,726,500 3.16 NIB Bank Limited 37,809 64,647 600,643 1,300,000 22.87 Nishat (Chunian) Limited 13,738 14,039 133,818 200,000 62.58 Nishat Mills Limited 8,374 14,300 - 575,000 - Oil and Gas Development Company Limited - 40,958 513,300 513,300 129.60 Packages Limited 66,524 73,915 7,511,000 7,511,000 10.00 Pak Oman Advantage Fund 75,091 75,091 433,914 546,313 71.07 Pak Suzuki Motor Company Limited 30,840 59,133 - 650,000 - Pakistan Oilfields Limited - 92,779 - 553,675 - Pakistan Petroleum Limited - 81,139 - 100,000 - Pakistan Premier Fund - 650 2,850,700 2,800,000 19.85 Pakistan Re-Insurance Company Limited 56,599 97,809 - 1,800,000 - Pakistan Strategic Allocation Fund - 9,088 1,616,800 4,181,800 18.92 Pakistan Telecommunication Company Limited 30,596 77,963 3,616,399 2,059,900 14.66 PICIC Growth Fund 53,010 32,952 - 1,700,000 - Samba Bank Limited - 7,363 139,700 139,700 247.86 Shell Pakistan Limited 34,626 34,626 - 3,284,204 - Soneri Bank Limited - 36,356 2,800,000 2,520,000 32.64 Sui Northern Gas Pipelines Limited 91,395 92,484 - 1,718,264 - Sui Southern Gas Company Limited - 23,569 - 6,100 - Tri Pak Films Limited - 605 - 830,000 - United Bank Limited - 42,761 7,238,208 - 4.45 Wateen Telecom Limited 32,177 -
1,065,326 2,451,928 (Less) / add: (Deficit) / surplus on revaluation of shares / units - net (66,537) 171,714
Market value as on December 31 998,789 2,623,642
10.4 Units of open end mutual funds
Paid-up No. of units value/unit 2010 2009 2010 2009 Rupees Name of mutual funds Rupees in ‘000 2010
2,500,000 2,500,000 40.34 Askari Asset Allocation Fund - note 10.8 (a related party) 100,846 245,141 11,637,439 8,368,657 96.23 Askari Income Fund - note 10.8 (a related party) 1,119,871 888,667 1,095,837 1,000,000 91.25 Askari Islamic Asset Allocation Fund - note 10.8 (a related party) 100,000 100,000 1,105,776 1,000,000 90.43 Askari Islamic Income Fund - note 10.8 (a related party) 100,000 100,000 1,009,971 1,009,971 99.01 Askari Sovereign Cash Fund - note 10.8 (a related party) 100,000 100,000 - 100,568 - Reliance Income Fund - 3,990
1,520,717 1,437,798 Add / (less): Surplus / (deficit) on revaluation of units - net 42,582 (83,780)
Market value as on December 31 1,563,299 1,354,018
Notes to the Unconsolidated Financial StatementsFor the year ended December 31, 2010
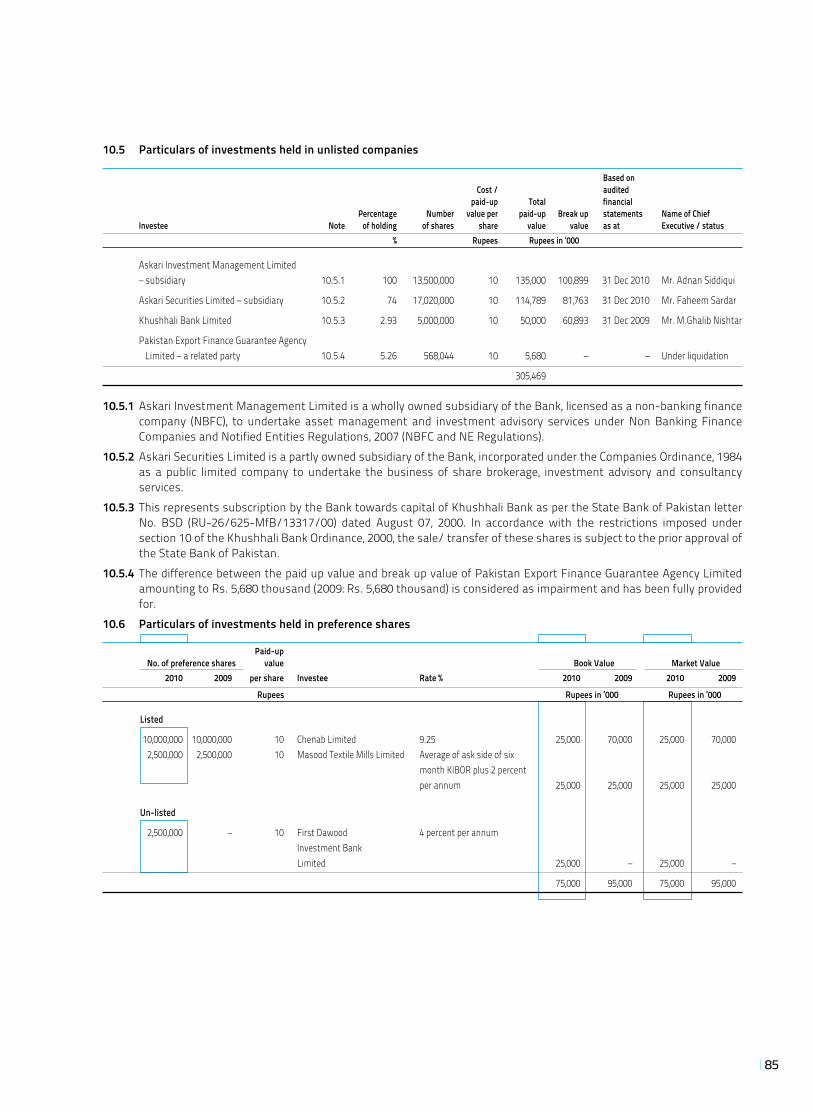
85
10.5 Particulars of investments held in unlisted companies
Based on Cost / audited paid-up Total financial Percentage Number value per paid-up Break up statements Name of Chief Investee Note of holding of shares share value value as at Executive / status % Rupees Rupees in ‘000
Askari Investment Management Limited – subsidiary 10.5.1 100 13,500,000 10 135,000 100,899 31 Dec 2010 Mr. Adnan Siddiqui
Askari Securities Limited – subsidiary 10.5.2 74 17,020,000 10 114,789 81,763 31 Dec 2010 Mr. Faheem Sardar
Khushhali Bank Limited 10.5.3 2.93 5,000,000 10 50,000 60,893 31 Dec 2009 Mr. M.Ghalib Nishtar
Pakistan Export Finance Guarantee Agency Limited – a related party 10.5.4 5.26 568,044 10 5,680 – – Under liquidation
305,469
10.5.1 Askari Investment Management Limited is a wholly owned subsidiary of the Bank, licensed as a non-banking finance company (NBFC), to undertake asset management and investment advisory services under Non Banking Finance Companies and Notified Entities Regulations, 2007 (NBFC and NE Regulations).
10.5.2 Askari Securities Limited is a partly owned subsidiary of the Bank, incorporated under the Companies Ordinance, 1984 as a public limited company to undertake the business of share brokerage, investment advisory and consultancy services.
10.5.3 This represents subscription by the Bank towards capital of Khushhali Bank as per the State Bank of Pakistan letter No. BSD (RU-26/625-MfB/13317/00) dated August 07, 2000. In accordance with the restrictions imposed under section 10 of the Khushhali Bank Ordinance, 2000, the sale/ transfer of these shares is subject to the prior approval of the State Bank of Pakistan.
10.5.4 The difference between the paid up value and break up value of Pakistan Export Finance Guarantee Agency Limited amounting to Rs. 5,680 thousand (2009: Rs. 5,680 thousand) is considered as impairment and has been fully provided for.
10.6 Particulars of investments held in preference shares
Paid-up No. of preference shares value Book Value Market Value 2010 2009 per share Investee Rate % 2010 2009 2010 2009
Rupees Rupees in ‘000 Rupees in ‘000
Listed
10,000,000 10,000,000 10 Chenab Limited 9.25 25,000 70,000 25,000 70,000 2,500,000 2,500,000 10 Masood Textile Mills Limited Average of ask side of six month KIBOR plus 2 percent per annum 25,000 25,000 25,000 25,000
Un-listed
2,500,000 – 10 First Dawood 4 percent per annum Investment Bank Limited 25,000 – 25,000 –
75,000 95,000 75,000 95,000
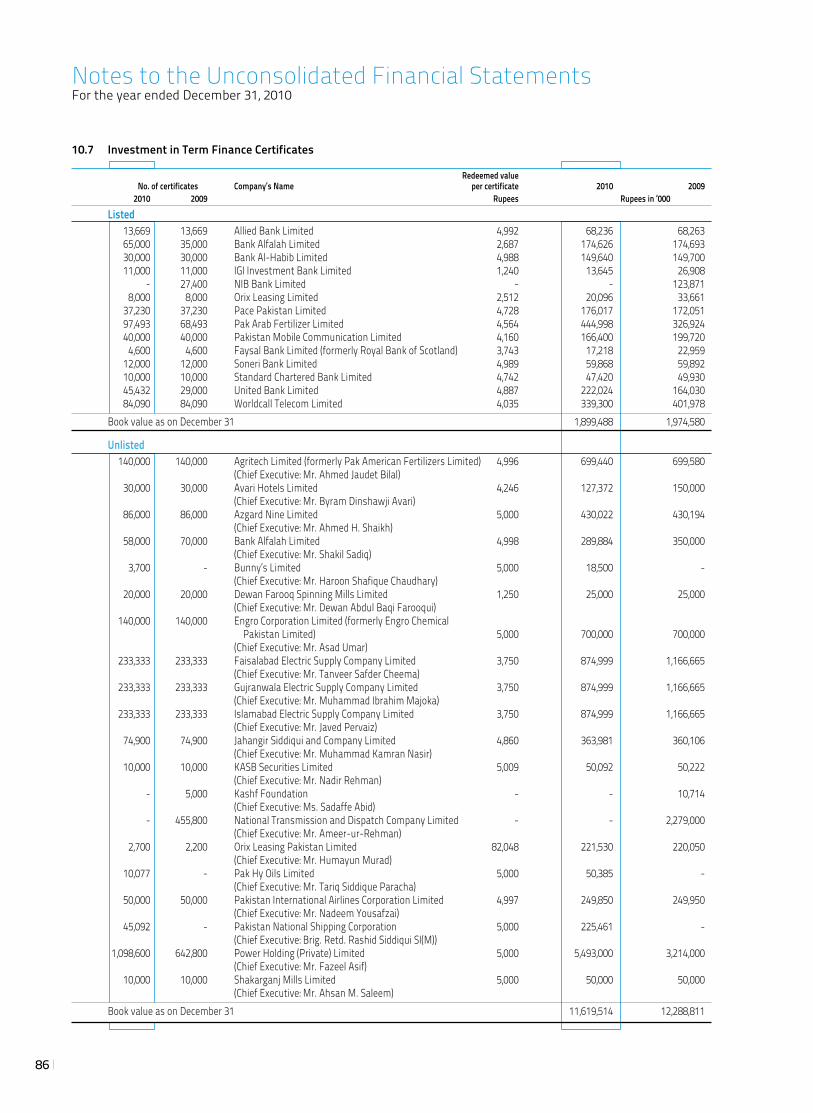
86
10.7 Investment in Term Finance Certificates
Redeemed value No. of certificates Company’s Name per certificate 2010 2009 2010 2009 Rupees Rupees in ‘000
Listed 13,669 13,669 Allied Bank Limited 4,992 68,236 68,263 65,000 35,000 Bank Alfalah Limited 2,687 174,626 174,693 30,000 30,000 Bank Al-Habib Limited 4,988 149,640 149,700 11,000 11,000 IGI Investment Bank Limited 1,240 13,645 26,908 - 27,400 NIB Bank Limited - - 123,871 8,000 8,000 Orix Leasing Limited 2,512 20,096 33,661 37,230 37,230 Pace Pakistan Limited 4,728 176,017 172,051 97,493 68,493 Pak Arab Fertilizer Limited 4,564 444,998 326,924 40,000 40,000 Pakistan Mobile Communication Limited 4,160 166,400 199,720 4,600 4,600 Faysal Bank Limited (formerly Royal Bank of Scotland) 3,743 17,218 22,959 12,000 12,000 Soneri Bank Limited 4,989 59,868 59,892 10,000 10,000 Standard Chartered Bank Limited 4,742 47,420 49,930 45,432 29,000 United Bank Limited 4,887 222,024 164,030 84,090 84,090 Worldcall Telecom Limited 4,035 339,300 401,978 Book value as on December 31 1,899,488 1,974,580
Unlisted 140,000 140,000 Agritech Limited (formerly Pak American Fertilizers Limited) 4,996 699,440 699,580 (Chief Executive: Mr. Ahmed Jaudet Bilal) 30,000 30,000 Avari Hotels Limited 4,246 127,372 150,000 (Chief Executive: Mr. Byram Dinshawji Avari) 86,000 86,000 Azgard Nine Limited 5,000 430,022 430,194 (Chief Executive: Mr. Ahmed H. Shaikh) 58,000 70,000 Bank Alfalah Limited 4,998 289,884 350,000 (Chief Executive: Mr. Shakil Sadiq) 3,700 - Bunny’s Limited 5,000 18,500 - (Chief Executive: Mr. Haroon Shafique Chaudhary) 20,000 20,000 Dewan Farooq Spinning Mills Limited 1,250 25,000 25,000 (Chief Executive: Mr. Dewan Abdul Baqi Farooqui) 140,000 140,000 Engro Corporation Limited (formerly Engro Chemical Pakistan Limited) 5,000 700,000 700,000 (Chief Executive: Mr. Asad Umar) 233,333 233,333 Faisalabad Electric Supply Company Limited 3,750 874,999 1,166,665 (Chief Executive: Mr. Tanveer Safder Cheema) 233,333 233,333 Gujranwala Electric Supply Company Limited 3,750 874,999 1,166,665 (Chief Executive: Mr. Muhammad Ibrahim Majoka) 233,333 233,333 Islamabad Electric Supply Company Limited 3,750 874,999 1,166,665 (Chief Executive: Mr. Javed Pervaiz) 74,900 74,900 Jahangir Siddiqui and Company Limited 4,860 363,981 360,106 (Chief Executive: Mr. Muhammad Kamran Nasir) 10,000 10,000 KASB Securities Limited 5,009 50,092 50,222 (Chief Executive: Mr. Nadir Rehman) - 5,000 Kashf Foundation - - 10,714 (Chief Executive: Ms. Sadaffe Abid) - 455,800 National Transmission and Dispatch Company Limited - - 2,279,000 (Chief Executive: Mr. Ameer-ur-Rehman) 2,700 2,200 Orix Leasing Pakistan Limited 82,048 221,530 220,050 (Chief Executive: Mr. Humayun Murad) 10,077 - Pak Hy Oils Limited 5,000 50,385 - (Chief Executive: Mr. Tariq Siddique Paracha) 50,000 50,000 Pakistan International Airlines Corporation Limited 4,997 249,850 249,950 (Chief Executive: Mr. Nadeem Yousafzai) 45,092 - Pakistan National Shipping Corporation 5,000 225,461 - (Chief Executive: Brig. Retd. Rashid Siddiqui SI(M)) 1,098,600 642,800 Power Holding (Private) Limited 5,000 5,493,000 3,214,000 (Chief Executive: Mr. Fazeel Asif) 10,000 10,000 Shakarganj Mills Limited 5,000 50,000 50,000 (Chief Executive: Mr. Ahsan M. Saleem) Book value as on December 31 11,619,514 12,288,811
Notes to the Unconsolidated Financial StatementsFor the year ended December 31, 2010
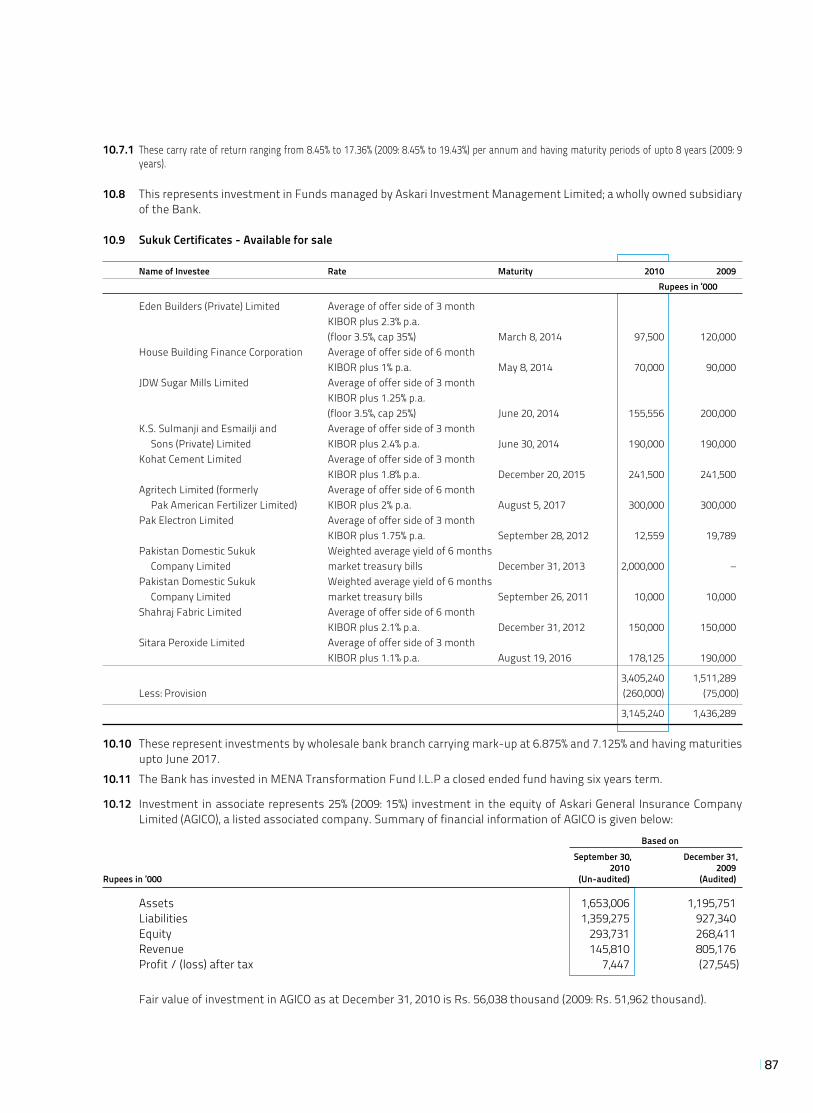
87
10.7.1 These carry rate of return ranging from 8.45% to 17.36% (2009: 8.45% to 19.43%) per annum and having maturity periods of upto 8 years (2009: 9 years).
10.8 This represents investment in Funds managed by Askari Investment Management Limited; a wholly owned subsidiary of the Bank.
10.9 Sukuk Certificates - Available for sale
Name of Investee Rate Maturity 2010 2009 Rupees in ‘000
Eden Builders (Private) Limited Average of offer side of 3 month KIBOR plus 2.3% p.a. (floor 3.5%, cap 35%) March 8, 2014 97,500 120,000 House Building Finance Corporation Average of offer side of 6 month KIBOR plus 1% p.a. May 8, 2014 70,000 90,000 JDW Sugar Mills Limited Average of offer side of 3 month KIBOR plus 1.25% p.a. (floor 3.5%, cap 25%) June 20, 2014 155,556 200,000 K.S. Sulmanji and Esmailji and Average of offer side of 3 month Sons (Private) Limited KIBOR plus 2.4% p.a. June 30, 2014 190,000 190,000 Kohat Cement Limited Average of offer side of 3 month KIBOR plus 1.8% p.a. December 20, 2015 241,500 241,500 Agritech Limited (formerly Average of offer side of 6 month Pak American Fertilizer Limited) KIBOR plus 2% p.a. August 5, 2017 300,000 300,000 Pak Electron Limited Average of offer side of 3 month KIBOR plus 1.75% p.a. September 28, 2012 12,559 19,789 Pakistan Domestic Sukuk Weighted average yield of 6 months Company Limited market treasury bills December 31, 2013 2,000,000 – Pakistan Domestic Sukuk Weighted average yield of 6 months Company Limited market treasury bills September 26, 2011 10,000 10,000 Shahraj Fabric Limited Average of offer side of 6 month KIBOR plus 2.1% p.a. December 31, 2012 150,000 150,000 Sitara Peroxide Limited Average of offer side of 3 month KIBOR plus 1.1% p.a. August 19, 2016 178,125 190,000
3,405,240 1,511,289 Less: Provision (260,000) (75,000)
3,145,240 1,436,289
10.10 These represent investments by wholesale bank branch carrying mark-up at 6.875% and 7.125% and having maturities upto June 2017.
10.11 The Bank has invested in MENA Transformation Fund I.L.P a closed ended fund having six years term.
10.12 Investment in associate represents 25% (2009: 15%) investment in the equity of Askari General Insurance Company Limited (AGICO), a listed associated company. Summary of financial information of AGICO is given below:
Based on September 30, December 31, 2010 2009Rupees in ‘000 (Un-audited) (Audited)
Assets 1,653,006 1,195,751 Liabilities 1,359,275 927,340 Equity 293,731 268,411 Revenue 145,810 805,176 Profit / (loss) after tax 7,447 (27,545)
Fair value of investment in AGICO as at December 31, 2010 is Rs. 56,038 thousand (2009: Rs. 51,962 thousand).
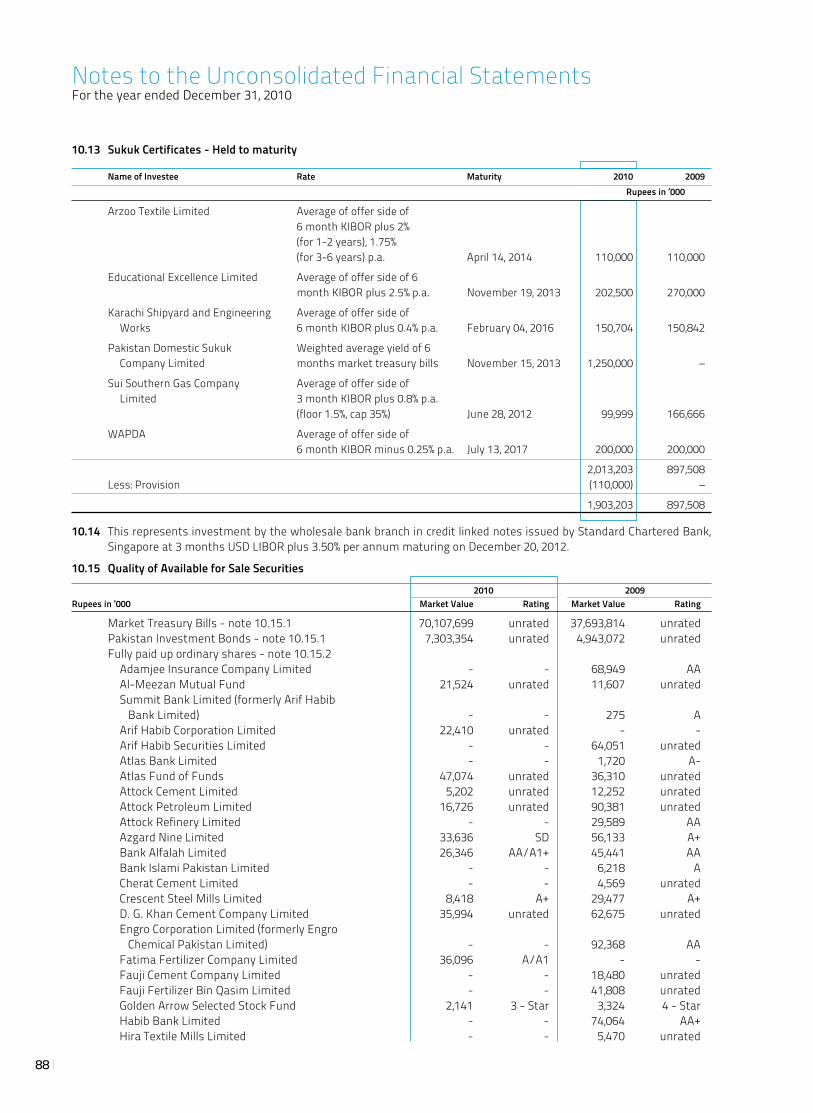
88
10.13 Sukuk Certificates - Held to maturity
Name of Investee Rate Maturity 2010 2009 Rupees in ‘000
Arzoo Textile Limited Average of offer side of 6 month KIBOR plus 2% (for 1-2 years), 1.75% (for 3-6 years) p.a. April 14, 2014 110,000 110,000
Educational Excellence Limited Average of offer side of 6 month KIBOR plus 2.5% p.a. November 19, 2013 202,500 270,000
Karachi Shipyard and Engineering Average of offer side of Works 6 month KIBOR plus 0.4% p.a. February 04, 2016 150,704 150,842
Pakistan Domestic Sukuk Weighted average yield of 6 Company Limited months market treasury bills November 15, 2013 1,250,000 –
Sui Southern Gas Company Average of offer side of Limited 3 month KIBOR plus 0.8% p.a. (floor 1.5%, cap 35%) June 28, 2012 99,999 166,666
WAPDA Average of offer side of 6 month KIBOR minus 0.25% p.a. July 13, 2017 200,000 200,000
2,013,203 897,508 Less: Provision (110,000) –
1,903,203 897,508
10.14 This represents investment by the wholesale bank branch in credit linked notes issued by Standard Chartered Bank, Singapore at 3 months USD LIBOR plus 3.50% per annum maturing on December 20, 2012.
10.15 Quality of Available for Sale Securities
2010 2009Rupees in ‘000 Market Value Rating Market Value Rating
Market Treasury Bills - note 10.15.1 70,107,699 unrated 37,693,814 unrated Pakistan Investment Bonds - note 10.15.1 7,303,354 unrated 4,943,072 unrated Fully paid up ordinary shares - note 10.15.2 Adamjee Insurance Company Limited - - 68,949 AA Al-Meezan Mutual Fund 21,524 unrated 11,607 unrated Summit Bank Limited (formerly Arif Habib Bank Limited) - - 275 A Arif Habib Corporation Limited 22,410 unrated - - Arif Habib Securities Limited - - 64,051 unrated Atlas Bank Limited - - 1,720 A- Atlas Fund of Funds 47,074 unrated 36,310 unrated Attock Cement Limited 5,202 unrated 12,252 unrated Attock Petroleum Limited 16,726 unrated 90,381 unrated Attock Refinery Limited - - 29,589 AA Azgard Nine Limited 33,636 SD 56,133 A+ Bank Alfalah Limited 26,346 AA/A1+ 45,441 AA Bank Islami Pakistan Limited - - 6,218 A Cherat Cement Limited - - 4,569 unrated Crescent Steel Mills Limited 8,418 A+ 29,477 A+ D. G. Khan Cement Company Limited 35,994 unrated 62,675 unrated Engro Corporation Limited (formerly Engro Chemical Pakistan Limited) - - 92,368 AA Fatima Fertilizer Company Limited 36,096 A/A1 - - Fauji Cement Company Limited - - 18,480 unrated Fauji Fertilizer Bin Qasim Limited - - 41,808 unrated Golden Arrow Selected Stock Fund 2,141 3 - Star 3,324 4 - Star Habib Bank Limited - - 74,064 AA+ Hira Textile Mills Limited - - 5,470 unrated
Notes to the Unconsolidated Financial StatementsFor the year ended December 31, 2010
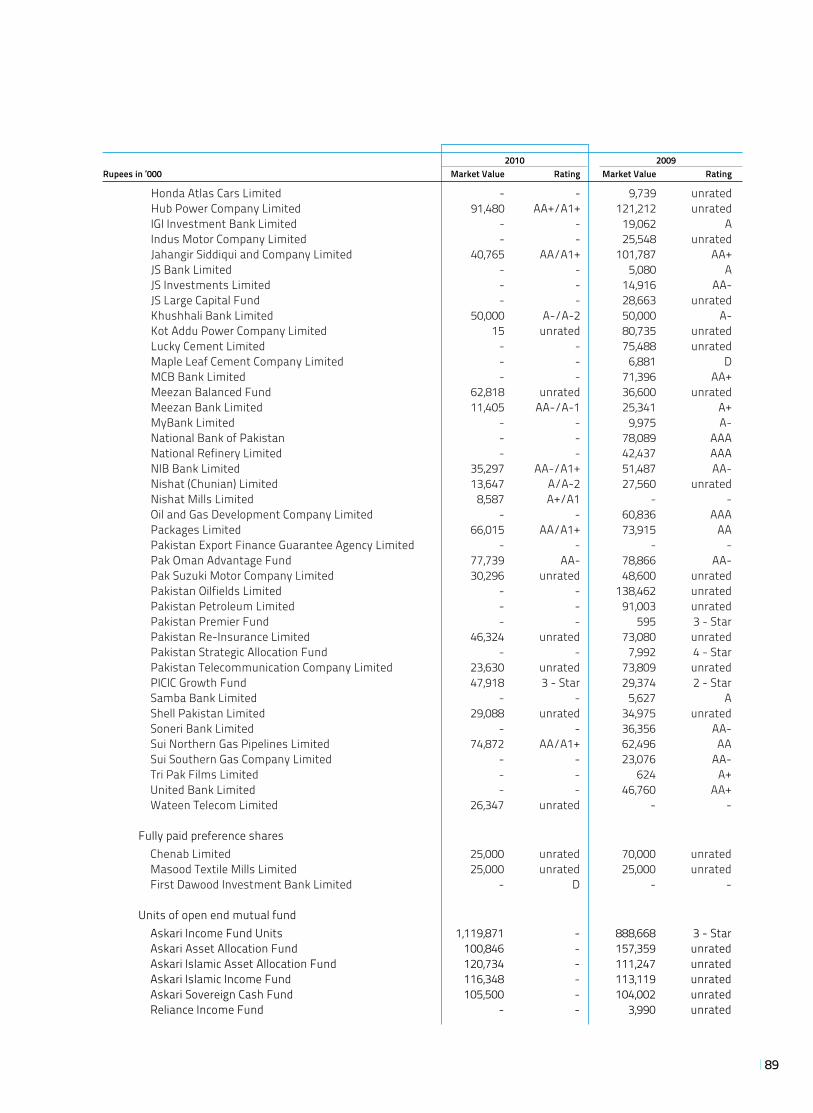
89
2010 2009Rupees in ‘000 Market Value Rating Market Value Rating
Honda Atlas Cars Limited - - 9,739 unrated Hub Power Company Limited 91,480 AA+/A1+ 121,212 unrated IGI Investment Bank Limited - - 19,062 A Indus Motor Company Limited - - 25,548 unrated Jahangir Siddiqui and Company Limited 40,765 AA/A1+ 101,787 AA+ JS Bank Limited - - 5,080 A JS Investments Limited - - 14,916 AA- JS Large Capital Fund - - 28,663 unrated Khushhali Bank Limited 50,000 A-/A-2 50,000 A- Kot Addu Power Company Limited 15 unrated 80,735 unrated Lucky Cement Limited - - 75,488 unrated Maple Leaf Cement Company Limited - - 6,881 D MCB Bank Limited - - 71,396 AA+ Meezan Balanced Fund 62,818 unrated 36,600 unrated Meezan Bank Limited 11,405 AA-/A-1 25,341 A+ MyBank Limited - - 9,975 A- National Bank of Pakistan - - 78,089 AAA National Refinery Limited - - 42,437 AAA NIB Bank Limited 35,297 AA-/A1+ 51,487 AA- Nishat (Chunian) Limited 13,647 A/A-2 27,560 unrated Nishat Mills Limited 8,587 A+/A1 - - Oil and Gas Development Company Limited - - 60,836 AAA Packages Limited 66,015 AA/A1+ 73,915 AA Pakistan Export Finance Guarantee Agency Limited - - - - Pak Oman Advantage Fund 77,739 AA- 78,866 AA- Pak Suzuki Motor Company Limited 30,296 unrated 48,600 unrated Pakistan Oilfields Limited - - 138,462 unrated Pakistan Petroleum Limited - - 91,003 unrated Pakistan Premier Fund - - 595 3 - Star Pakistan Re-Insurance Limited 46,324 unrated 73,080 unrated Pakistan Strategic Allocation Fund - - 7,992 4 - Star Pakistan Telecommunication Company Limited 23,630 unrated 73,809 unrated PICIC Growth Fund 47,918 3 - Star 29,374 2 - Star Samba Bank Limited - - 5,627 A Shell Pakistan Limited 29,088 unrated 34,975 unrated Soneri Bank Limited - - 36,356 AA- Sui Northern Gas Pipelines Limited 74,872 AA/A1+ 62,496 AA Sui Southern Gas Company Limited - - 23,076 AA- Tri Pak Films Limited - - 624 A+ United Bank Limited - - 46,760 AA+ Wateen Telecom Limited 26,347 unrated - -
Fully paid preference shares Chenab Limited 25,000 unrated 70,000 unrated Masood Textile Mills Limited 25,000 unrated 25,000 unrated First Dawood Investment Bank Limited - D - -
Units of open end mutual fund Askari Income Fund Units 1,119,871 - 888,668 3 - Star Askari Asset Allocation Fund 100,846 - 157,359 unrated Askari Islamic Asset Allocation Fund 120,734 - 111,247 unrated Askari Islamic Income Fund 116,348 - 113,119 unrated Askari Sovereign Cash Fund 105,500 - 104,002 unrated Reliance Income Fund - - 3,990 unrated
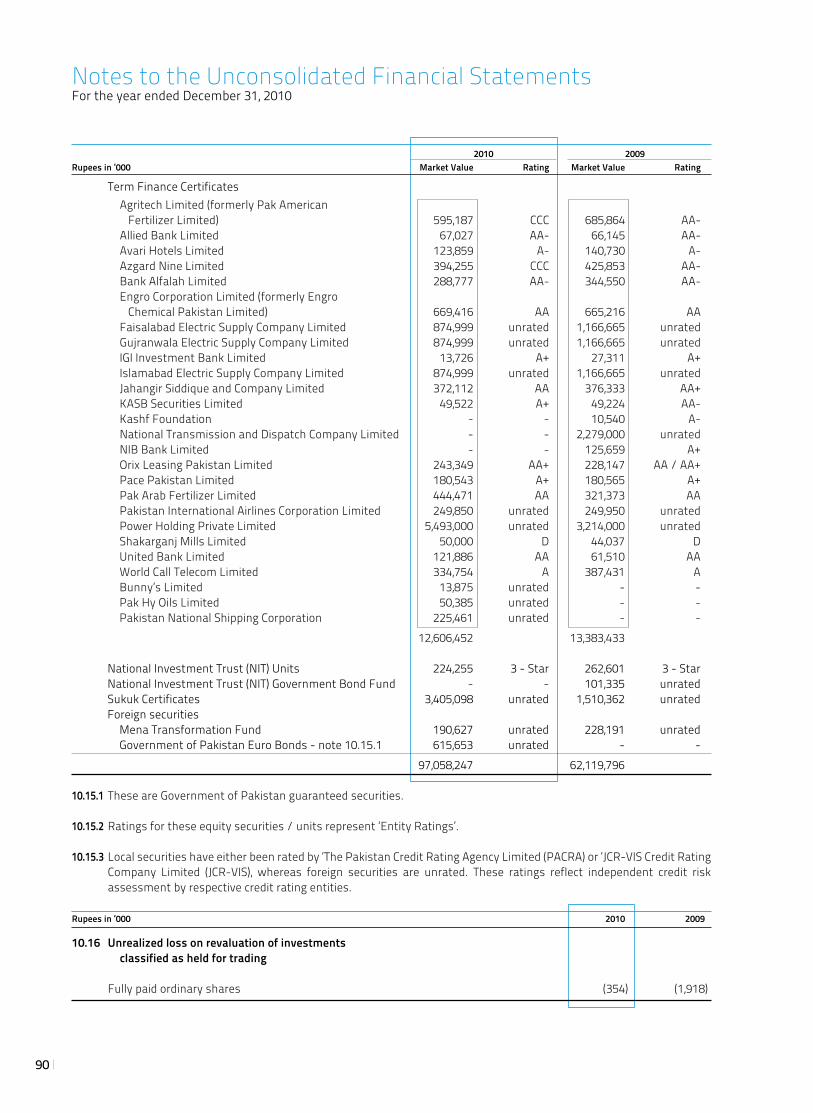
90
2010 2009Rupees in ‘000 Market Value Rating Market Value Rating
Term Finance Certificates Agritech Limited (formerly Pak American Fertilizer Limited) 595,187 CCC 685,864 AA- Allied Bank Limited 67,027 AA- 66,145 AA- Avari Hotels Limited 123,859 A- 140,730 A- Azgard Nine Limited 394,255 CCC 425,853 AA- Bank Alfalah Limited 288,777 AA- 344,550 AA- Engro Corporation Limited (formerly Engro Chemical Pakistan Limited) 669,416 AA 665,216 AA Faisalabad Electric Supply Company Limited 874,999 unrated 1,166,665 unrated Gujranwala Electric Supply Company Limited 874,999 unrated 1,166,665 unrated IGI Investment Bank Limited 13,726 A+ 27,311 A+ Islamabad Electric Supply Company Limited 874,999 unrated 1,166,665 unrated Jahangir Siddique and Company Limited 372,112 AA 376,333 AA+ KASB Securities Limited 49,522 A+ 49,224 AA- Kashf Foundation - - 10,540 A- National Transmission and Dispatch Company Limited - - 2,279,000 unrated NIB Bank Limited - - 125,659 A+ Orix Leasing Pakistan Limited 243,349 AA+ 228,147 AA / AA+ Pace Pakistan Limited 180,543 A+ 180,565 A+ Pak Arab Fertilizer Limited 444,471 AA 321,373 AA Pakistan International Airlines Corporation Limited 249,850 unrated 249,950 unrated Power Holding Private Limited 5,493,000 unrated 3,214,000 unrated Shakarganj Mills Limited 50,000 D 44,037 D United Bank Limited 121,886 AA 61,510 AA World Call Telecom Limited 334,754 A 387,431 A Bunny’s Limited 13,875 unrated - - Pak Hy Oils Limited 50,385 unrated - - Pakistan National Shipping Corporation 225,461 unrated - - 12,606,452 13,383,433 National Investment Trust (NIT) Units 224,255 3 - Star 262,601 3 - Star National Investment Trust (NIT) Government Bond Fund - - 101,335 unrated Sukuk Certificates 3,405,098 unrated 1,510,362 unrated Foreign securities Mena Transformation Fund 190,627 unrated 228,191 unrated Government of Pakistan Euro Bonds - note 10.15.1 615,653 unrated - - 97,058,247 62,119,796
10.15.1 These are Government of Pakistan guaranteed securities.
10.15.2 Ratings for these equity securities / units represent ‘Entity Ratings’.
10.15.3 Local securities have either been rated by ‘The Pakistan Credit Rating Agency Limited (PACRA) or ‘JCR-VIS Credit Rating Company Limited (JCR-VIS), whereas foreign securities are unrated. These ratings reflect independent credit risk assessment by respective credit rating entities.
Rupees in ‘000 2010 2009
10.16 Unrealized loss on revaluation of investments classified as held for trading
Fully paid ordinary shares (354) (1,918)
Notes to the Unconsolidated Financial StatementsFor the year ended December 31, 2010
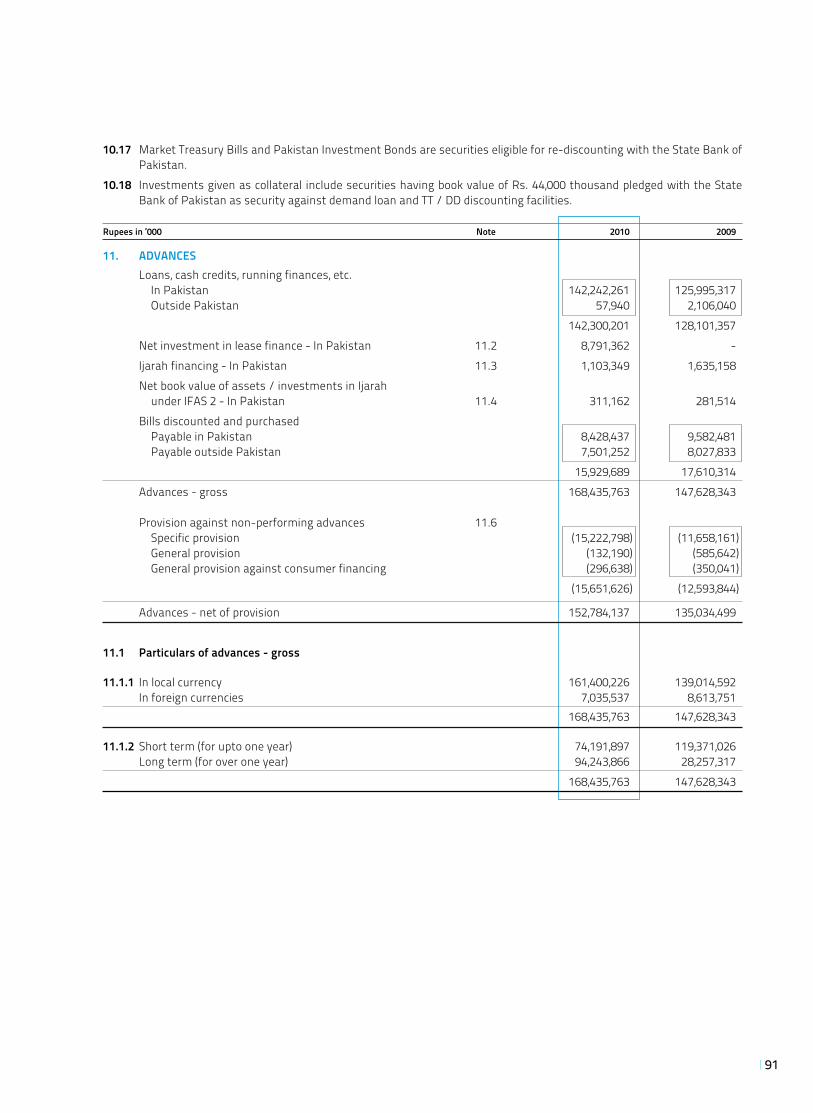
91
10.17 Market Treasury Bills and Pakistan Investment Bonds are securities eligible for re-discounting with the State Bank of Pakistan.
10.18 Investments given as collateral include securities having book value of Rs. 44,000 thousand pledged with the State Bank of Pakistan as security against demand loan and TT / DD discounting facilities.
Rupees in ‘000 Note 2010 2009
11. ADVANCES Loans, cash credits, running finances, etc. In Pakistan 142,242,261 125,995,317 Outside Pakistan 57,940 2,106,040 142,300,201 128,101,357 Net investment in lease finance - In Pakistan 11.2 8,791,362 - Ijarah financing - In Pakistan 11.3 1,103,349 1,635,158 Net book value of assets / investments in Ijarah under IFAS 2 - In Pakistan 11.4 311,162 281,514 Bills discounted and purchased Payable in Pakistan 8,428,437 9,582,481 Payable outside Pakistan 7,501,252 8,027,833 15,929,689 17,610,314 Advances - gross 168,435,763 147,628,343 Provision against non-performing advances 11.6 Specific provision (15,222,798) (11,658,161) General provision (132,190) (585,642) General provision against consumer financing (296,638) (350,041) (15,651,626) (12,593,844)
Advances - net of provision 152,784,137 135,034,499
11.1 Particulars of advances - gross
11.1.1 In local currency 161,400,226 139,014,592 In foreign currencies 7,035,537 8,613,751 168,435,763 147,628,343
11.1.2 Short term (for upto one year) 74,191,897 119,371,026 Long term (for over one year) 94,243,866 28,257,317 168,435,763 147,628,343
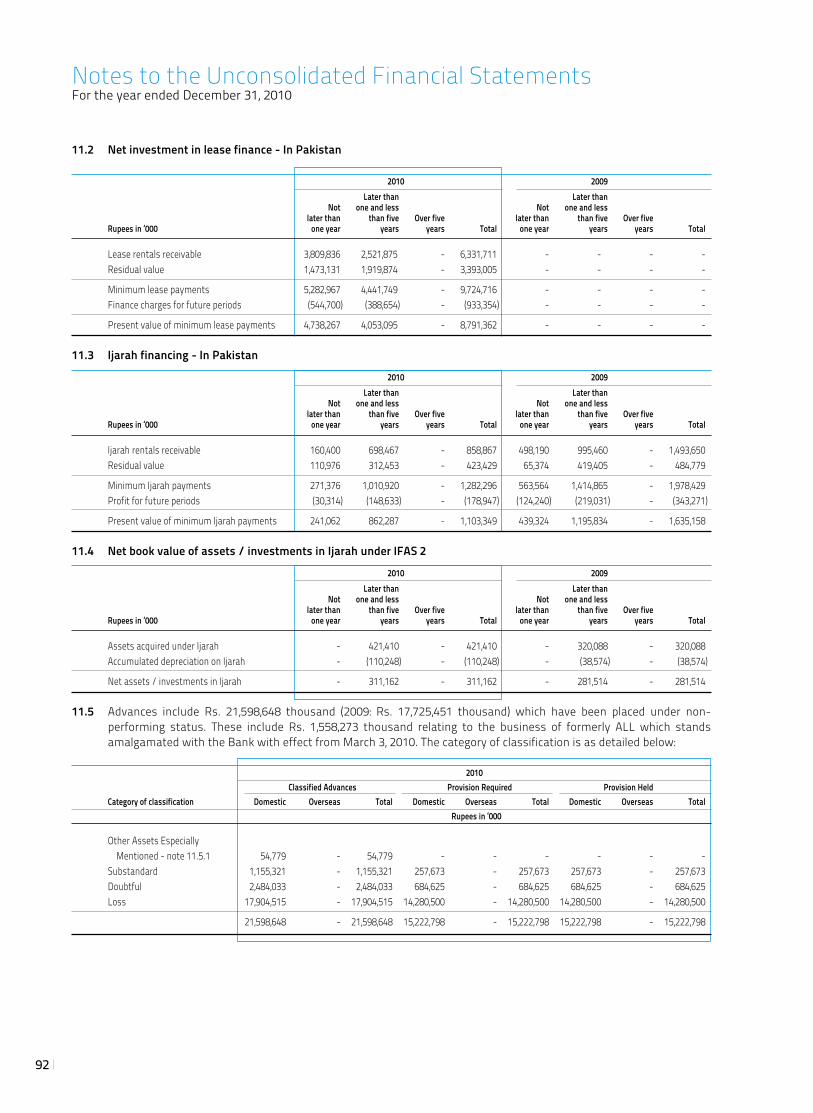
92
11.2 Net investment in lease finance - In Pakistan
2010 2009 Later than Later than Not one and less Not one and less later than than five Over five later than than five Over five Rupees in ‘000 one year years years Total one year years years Total
Lease rentals receivable 3,809,836 2,521,875 - 6,331,711 - - - - Residual value 1,473,131 1,919,874 - 3,393,005 - - - -
Minimum lease payments 5,282,967 4,441,749 - 9,724,716 - - - - Finance charges for future periods (544,700) (388,654) - (933,354) - - - -
Present value of minimum lease payments 4,738,267 4,053,095 - 8,791,362 - - - -
11.3 Ijarah financing - In Pakistan
2010 2009 Later than Later than Not one and less Not one and less later than than five Over five later than than five Over five Rupees in ‘000 one year years years Total one year years years Total
Ijarah rentals receivable 160,400 698,467 - 858,867 498,190 995,460 - 1,493,650 Residual value 110,976 312,453 - 423,429 65,374 419,405 - 484,779
Minimum Ijarah payments 271,376 1,010,920 - 1,282,296 563,564 1,414,865 - 1,978,429 Profit for future periods (30,314) (148,633) - (178,947) (124,240) (219,031) - (343,271)
Present value of minimum Ijarah payments 241,062 862,287 - 1,103,349 439,324 1,195,834 - 1,635,158
11.4 Net book value of assets / investments in Ijarah under IFAS 2
2010 2009 Later than Later than Not one and less Not one and less later than than five Over five later than than five Over five Rupees in ‘000 one year years years Total one year years years Total
Assets acquired under Ijarah - 421,410 - 421,410 - 320,088 - 320,088 Accumulated depreciation on Ijarah - (110,248) - (110,248) - (38,574) - (38,574)
Net assets / investments in Ijarah - 311,162 - 311,162 - 281,514 - 281,514
11.5 Advances include Rs. 21,598,648 thousand (2009: Rs. 17,725,451 thousand) which have been placed under non-performing status. These include Rs. 1,558,273 thousand relating to the business of formerly ALL which stands amalgamated with the Bank with effect from March 3, 2010. The category of classification is as detailed below:
2010 Classified Advances Provision Required Provision Held Category of classification Domestic Overseas Total Domestic Overseas Total Domestic Overseas Total Rupees in ‘000
Other Assets Especially Mentioned - note 11.5.1 54,779 - 54,779 - - - - - - Substandard 1,155,321 - 1,155,321 257,673 - 257,673 257,673 - 257,673 Doubtful 2,484,033 - 2,484,033 684,625 - 684,625 684,625 - 684,625 Loss 17,904,515 - 17,904,515 14,280,500 - 14,280,500 14,280,500 - 14,280,500
21,598,648 - 21,598,648 15,222,798 - 15,222,798 15,222,798 - 15,222,798
Notes to the Unconsolidated Financial StatementsFor the year ended December 31, 2010
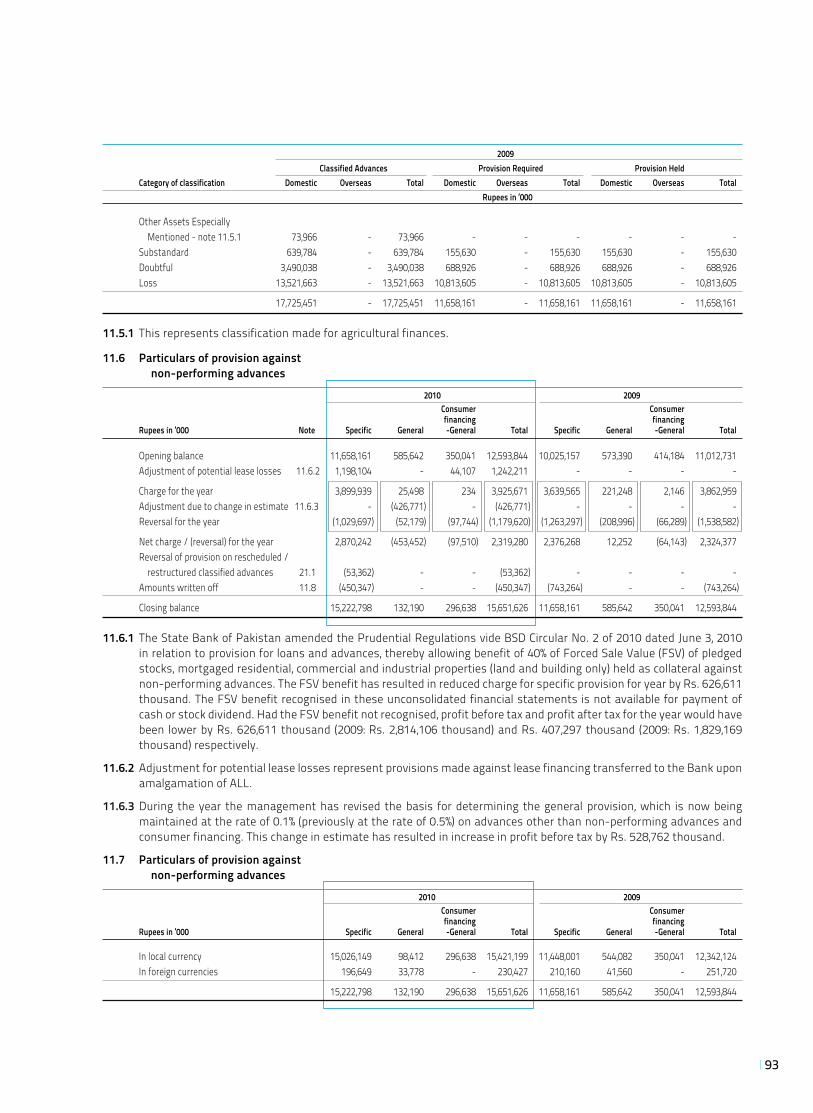
93
2009 Classified Advances Provision Required Provision Held Category of classification Domestic Overseas Total Domestic Overseas Total Domestic Overseas Total Rupees in ‘000
Other Assets Especially Mentioned - note 11.5.1 73,966 - 73,966 - - - - - - Substandard 639,784 - 639,784 155,630 - 155,630 155,630 - 155,630 Doubtful 3,490,038 - 3,490,038 688,926 - 688,926 688,926 - 688,926 Loss 13,521,663 - 13,521,663 10,813,605 - 10,813,605 10,813,605 - 10,813,605
17,725,451 - 17,725,451 11,658,161 - 11,658,161 11,658,161 - 11,658,161
11.5.1 This represents classification made for agricultural finances.
11.6 Particulars of provision against non-performing advances
2010 2009 Consumer Consumer financing financing Rupees in ‘000 Note Specific General -General Total Specific General -General Total Opening balance 11,658,161 585,642 350,041 12,593,844 10,025,157 573,390 414,184 11,012,731 Adjustment of potential lease losses 11.6.2 1,198,104 - 44,107 1,242,211 - - - -
Charge for the year 3,899,939 25,498 234 3,925,671 3,639,565 221,248 2,146 3,862,959 Adjustment due to change in estimate 11.6.3 - (426,771) - (426,771) - - - - Reversal for the year (1,029,697) (52,179) (97,744) (1,179,620) (1,263,297) (208,996) (66,289) (1,538,582)
Net charge / (reversal) for the year 2,870,242 (453,452) (97,510) 2,319,280 2,376,268 12,252 (64,143) 2,324,377 Reversal of provision on rescheduled / restructured classified advances 21.1 (53,362) - - (53,362) - - - - Amounts written off 11.8 (450,347) - - (450,347) (743,264) - - (743,264)
Closing balance 15,222,798 132,190 296,638 15,651,626 11,658,161 585,642 350,041 12,593,844
11.6.1 The State Bank of Pakistan amended the Prudential Regulations vide BSD Circular No. 2 of 2010 dated June 3, 2010 in relation to provision for loans and advances, thereby allowing benefit of 40% of Forced Sale Value (FSV) of pledged stocks, mortgaged residential, commercial and industrial properties (land and building only) held as collateral against non-performing advances. The FSV benefit has resulted in reduced charge for specific provision for year by Rs. 626,611 thousand. The FSV benefit recognised in these unconsolidated financial statements is not available for payment of cash or stock dividend. Had the FSV benefit not recognised, profit before tax and profit after tax for the year would have been lower by Rs. 626,611 thousand (2009: Rs. 2,814,106 thousand) and Rs. 407,297 thousand (2009: Rs. 1,829,169 thousand) respectively.
11.6.2 Adjustment for potential lease losses represent provisions made against lease financing transferred to the Bank upon amalgamation of ALL.
11.6.3 During the year the management has revised the basis for determining the general provision, which is now being maintained at the rate of 0.1% (previously at the rate of 0.5%) on advances other than non-performing advances and consumer financing. This change in estimate has resulted in increase in profit before tax by Rs. 528,762 thousand.
11.7 Particulars of provision against non-performing advances
2010 2009 Consumer Consumer financing financing Rupees in ‘000 Specific General -General Total Specific General -General Total
In local currency 15,026,149 98,412 296,638 15,421,199 11,448,001 544,082 350,041 12,342,124 In foreign currencies 196,649 33,778 - 230,427 210,160 41,560 - 251,720
15,222,798 132,190 296,638 15,651,626 11,658,161 585,642 350,041 12,593,844
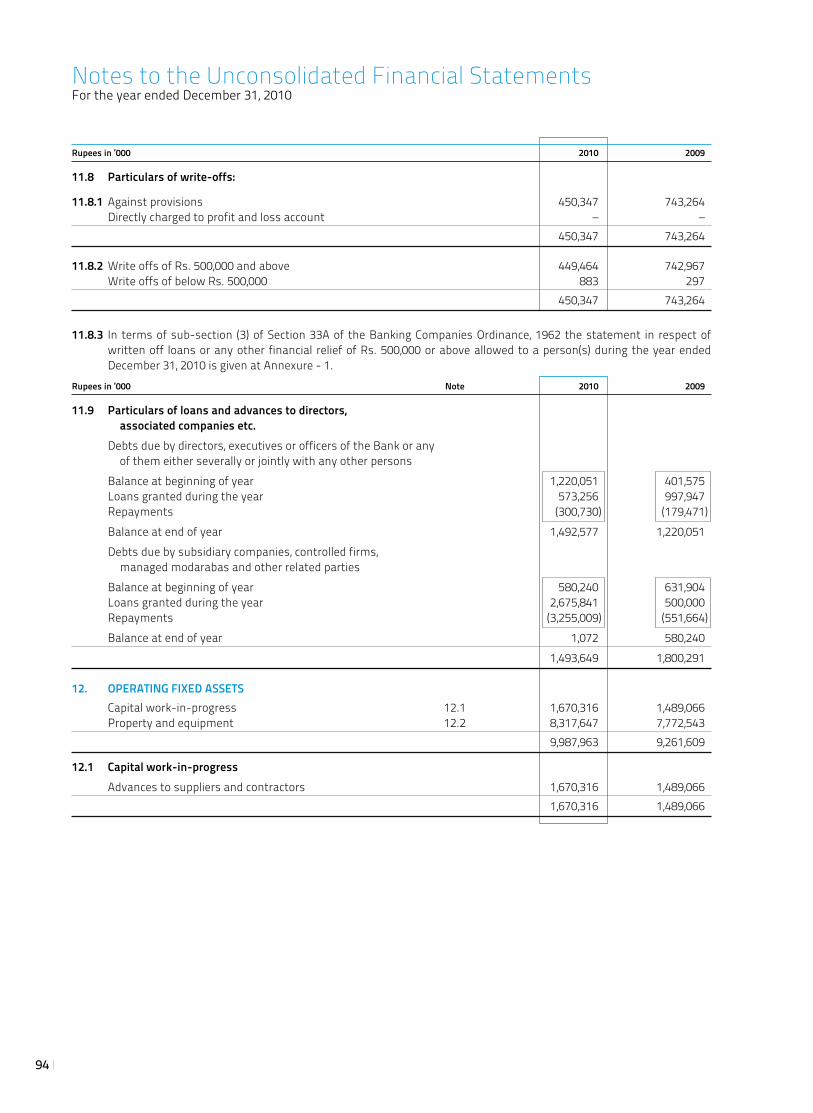
94
Rupees in ‘000 2010 2009
11.8 Particulars of write-offs:
11.8.1 Against provisions 450,347 743,264 Directly charged to profit and loss account – – 450,347 743,264
11.8.2 Write offs of Rs. 500,000 and above 449,464 742,967 Write offs of below Rs. 500,000 883 297 450,347 743,264
11.8.3 In terms of sub-section (3) of Section 33A of the Banking Companies Ordinance, 1962 the statement in respect of written off loans or any other financial relief of Rs. 500,000 or above allowed to a person(s) during the year ended December 31, 2010 is given at Annexure - 1.
Rupees in ‘000 Note 2010 2009
11.9 Particulars of loans and advances to directors, associated companies etc. Debts due by directors, executives or officers of the Bank or any of them either severally or jointly with any other persons Balance at beginning of year 1,220,051 401,575 Loans granted during the year 573,256 997,947 Repayments (300,730) (179,471) Balance at end of year 1,492,577 1,220,051 Debts due by subsidiary companies, controlled firms, managed modarabas and other related parties Balance at beginning of year 580,240 631,904 Loans granted during the year 2,675,841 500,000 Repayments (3,255,009) (551,664) Balance at end of year 1,072 580,240 1,493,649 1,800,291
12. OPERATING FIXED ASSETS Capital work-in-progress 12.1 1,670,316 1,489,066 Property and equipment 12.2 8,317,647 7,772,543 9,987,963 9,261,609
12.1 Capital work-in-progress Advances to suppliers and contractors 1,670,316 1,489,066 1,670,316 1,489,066
Notes to the Unconsolidated Financial StatementsFor the year ended December 31, 2010
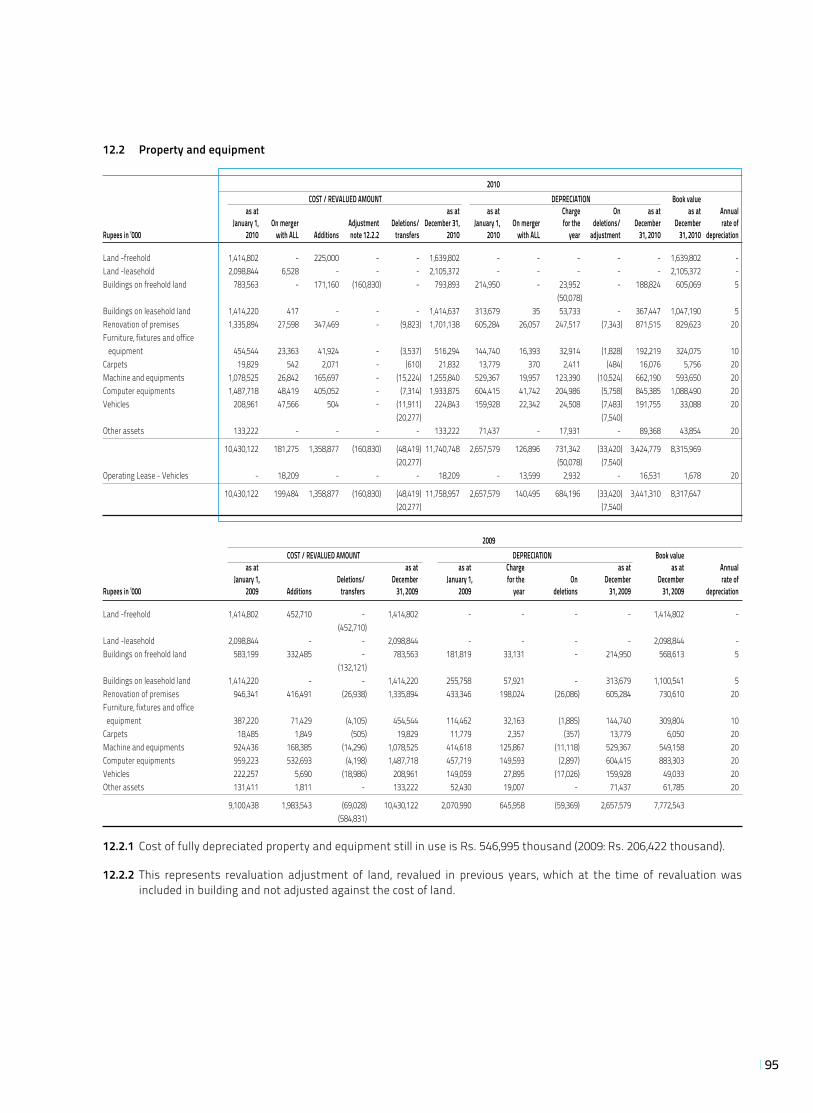
95
12.2 Property and equipment
2010 COST / REVALUED AMOUNT DEPRECIATION Book value as at as at as at Charge On as at as at Annual January 1, On merger Adjustment Deletions/ December 31, January 1, On merger for the deletions/ December December rate ofRupees in ‘000 2010 with ALL Additions note 12.2.2 transfers 2010 2010 with ALL year adjustment 31, 2010 31, 2010 depreciation
Land -freehold 1,414,802 - 225,000 - - 1,639,802 - - - - - 1,639,802 -Land -leasehold 2,098,844 6,528 - - - 2,105,372 - - - - - 2,105,372 -Buildings on freehold land 783,563 - 171,160 (160,830) - 793,893 214,950 - 23,952 - 188,824 605,069 5 (50,078) Buildings on leasehold land 1,414,220 417 - - - 1,414,637 313,679 35 53,733 - 367,447 1,047,190 5Renovation of premises 1,335,894 27,598 347,469 - (9,823) 1,701,138 605,284 26,057 247,517 (7,343) 871,515 829,623 20Furniture, fixtures and office equipment 454,544 23,363 41,924 - (3,537) 516,294 144,740 16,393 32,914 (1,828) 192,219 324,075 10Carpets 19,829 542 2,071 - (610) 21,832 13,779 370 2,411 (484) 16,076 5,756 20Machine and equipments 1,078,525 26,842 165,697 - (15,224) 1,255,840 529,367 19,957 123,390 (10,524) 662,190 593,650 20Computer equipments 1,487,718 48,419 405,052 - (7,314) 1,933,875 604,415 41,742 204,986 (5,758) 845,385 1,088,490 20Vehicles 208,961 47,566 504 - (11,911) 224,843 159,928 22,342 24,508 (7,483) 191,755 33,088 20 (20,277) (7,540) Other assets 133,222 - - - - 133,222 71,437 - 17,931 - 89,368 43,854 20
10,430,122 181,275 1,358,877 (160,830) (48,419) 11,740,748 2,657,579 126,896 731,342 (33,420) 3,424,779 8,315,969 (20,277) (50,078) (7,540) Operating Lease - Vehicles - 18,209 - - - 18,209 - 13,599 2,932 - 16,531 1,678 20
10,430,122 199,484 1,358,877 (160,830) (48,419) 11,758,957 2,657,579 140,495 684,196 (33,420) 3,441,310 8,317,647 (20,277) (7,540)
2009 COST / REVALUED AMOUNT DEPRECIATION Book value as at as at as at Charge as at as at Annual January 1, Deletions/ December January 1, for the On December December rate ofRupees in ‘000 2009 Additions transfers 31, 2009 2009 year deletions 31, 2009 31, 2009 depreciation
Land -freehold 1,414,802 452,710 - 1,414,802 - - - - 1,414,802 - (452,710)Land -leasehold 2,098,844 - - 2,098,844 - - - - 2,098,844 -Buildings on freehold land 583,199 332,485 - 783,563 181,819 33,131 - 214,950 568,613 5 (132,121)Buildings on leasehold land 1,414,220 - - 1,414,220 255,758 57,921 - 313,679 1,100,541 5Renovation of premises 946,341 416,491 (26,938) 1,335,894 433,346 198,024 (26,086) 605,284 730,610 20Furniture, fixtures and office equipment 387,220 71,429 (4,105) 454,544 114,462 32,163 (1,885) 144,740 309,804 10Carpets 18,485 1,849 (505) 19,829 11,779 2,357 (357) 13,779 6,050 20Machine and equipments 924,436 168,385 (14,296) 1,078,525 414,618 125,867 (11,118) 529,367 549,158 20Computer equipments 959,223 532,693 (4,198) 1,487,718 457,719 149,593 (2,897) 604,415 883,303 20Vehicles 222,257 5,690 (18,986) 208,961 149,059 27,895 (17,026) 159,928 49,033 20Other assets 131,411 1,811 - 133,222 52,430 19,007 - 71,437 61,785 20
9,100,438 1,983,543 (69,028) 10,430,122 2,070,990 645,958 (59,369) 2,657,579 7,772,543 (584,831)
12.2.1 Cost of fully depreciated property and equipment still in use is Rs. 546,995 thousand (2009: Rs. 206,422 thousand).
12.2.2 This represents revaluation adjustment of land, revalued in previous years, which at the time of revaluation was included in building and not adjusted against the cost of land.
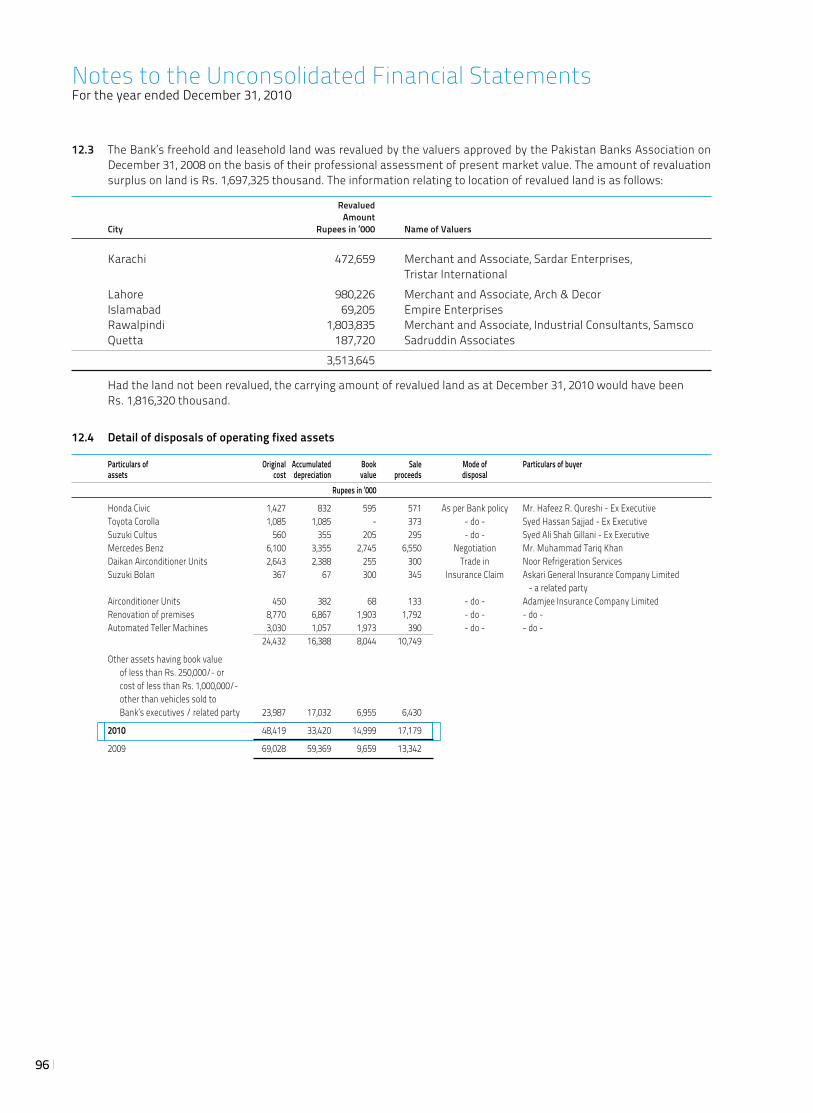
96
12.4 Detail of disposals of operating fixed assets
Particulars of Original Accumulated Book Sale Mode of Particulars of buyer assets cost depreciation value proceeds disposal Rupees in ‘000
Honda Civic 1,427 832 595 571 As per Bank policy Mr. Hafeez R. Qureshi - Ex Executive Toyota Corolla 1,085 1,085 - 373 - do - Syed Hassan Sajjad - Ex Executive Suzuki Cultus 560 355 205 295 - do - Syed Ali Shah Gillani - Ex Executive Mercedes Benz 6,100 3,355 2,745 6,550 Negotiation Mr. Muhammad Tariq Khan Daikan Airconditioner Units 2,643 2,388 255 300 Trade in Noor Refrigeration Services Suzuki Bolan 367 67 300 345 Insurance Claim Askari General Insurance Company Limited
- a related party Airconditioner Units 450 382 68 133 - do - Adamjee Insurance Company Limited Renovation of premises 8,770 6,867 1,903 1,792 - do - - do - Automated Teller Machines 3,030 1,057 1,973 390 - do - - do -
24,432 16,388 8,044 10,749
Other assets having book value of less than Rs. 250,000/- or cost of less than Rs. 1,000,000/- other than vehicles sold to Bank’s executives / related party 23,987 17,032 6,955 6,430
2010 48,419 33,420 14,999 17,179
2009 69,028 59,369 9,659 13,342
12.3 The Bank’s freehold and leasehold land was revalued by the valuers approved by the Pakistan Banks Association on December 31, 2008 on the basis of their professional assessment of present market value. The amount of revaluation surplus on land is Rs. 1,697,325 thousand. The information relating to location of revalued land is as follows:
Revalued Amount City Rupees in ‘000 Name of Valuers Karachi 472,659 Merchant and Associate, Sardar Enterprises,
Tristar International Lahore 980,226 Merchant and Associate, Arch & Decor Islamabad 69,205 Empire Enterprises Rawalpindi 1,803,835 Merchant and Associate, Industrial Consultants, Samsco Quetta 187,720 Sadruddin Associates 3,513,645
Had the land not been revalued, the carrying amount of revalued land as at December 31, 2010 would have been Rs. 1,816,320 thousand.
Notes to the Unconsolidated Financial StatementsFor the year ended December 31, 2010
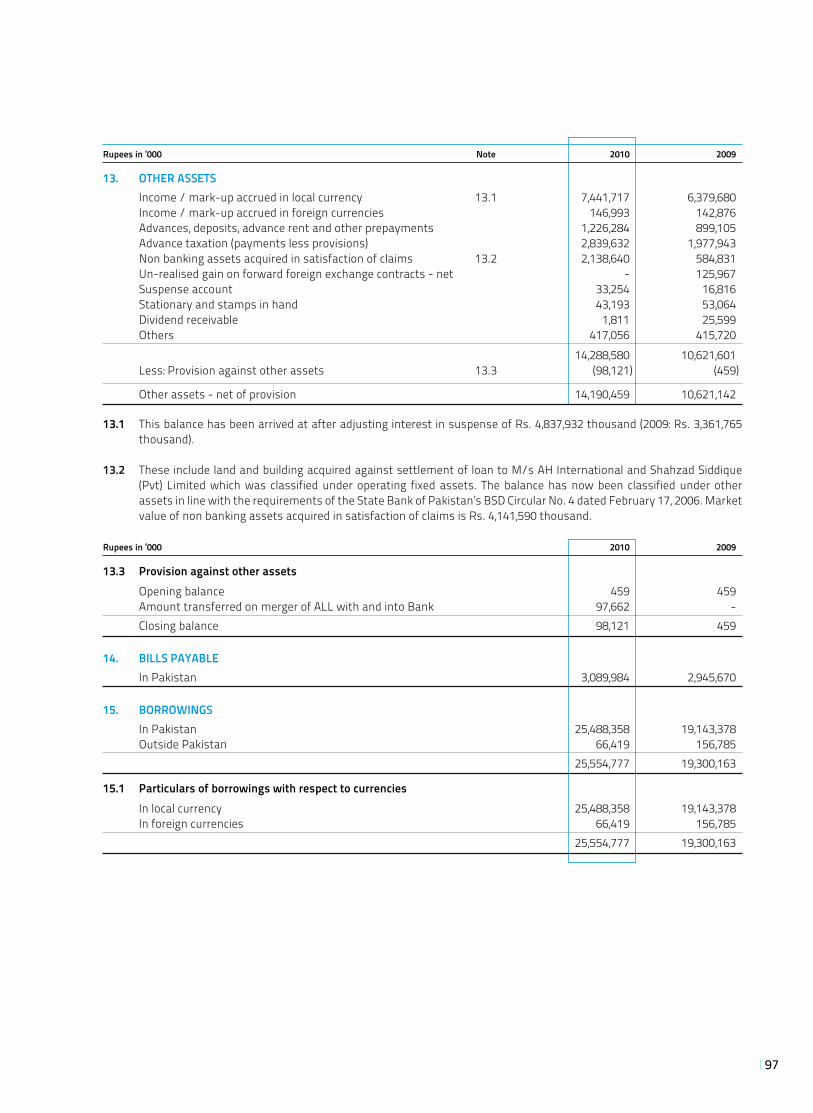
97
Rupees in ‘000 Note 2010 2009
13. OTHER ASSETS Income / mark-up accrued in local currency 13.1 7,441,717 6,379,680 Income / mark-up accrued in foreign currencies 146,993 142,876 Advances, deposits, advance rent and other prepayments 1,226,284 899,105 Advance taxation (payments less provisions) 2,839,632 1,977,943 Non banking assets acquired in satisfaction of claims 13.2 2,138,640 584,831 Un-realised gain on forward foreign exchange contracts - net - 125,967 Suspense account 33,254 16,816 Stationary and stamps in hand 43,193 53,064 Dividend receivable 1,811 25,599 Others 417,056 415,720 14,288,580 10,621,601 Less: Provision against other assets 13.3 (98,121) (459)
Other assets - net of provision 14,190,459 10,621,142
13.1 This balance has been arrived at after adjusting interest in suspense of Rs. 4,837,932 thousand (2009: Rs. 3,361,765 thousand).
13.2 These include land and building acquired against settlement of loan to M/s AH International and Shahzad Siddique (Pvt) Limited which was classified under operating fixed assets. The balance has now been classified under other assets in line with the requirements of the State Bank of Pakistan’s BSD Circular No. 4 dated February 17, 2006. Market value of non banking assets acquired in satisfaction of claims is Rs. 4,141,590 thousand.
Rupees in ‘000 2010 2009
13.3 Provision against other assets Opening balance 459 459 Amount transferred on merger of ALL with and into Bank 97,662 - Closing balance 98,121 459
14. BILLS PAYABLE In Pakistan 3,089,984 2,945,670
15. BORROWINGS In Pakistan 25,488,358 19,143,378 Outside Pakistan 66,419 156,785 25,554,777 19,300,163
15.1 Particulars of borrowings with respect to currencies In local currency 25,488,358 19,143,378 In foreign currencies 66,419 156,785 25,554,777 19,300,163
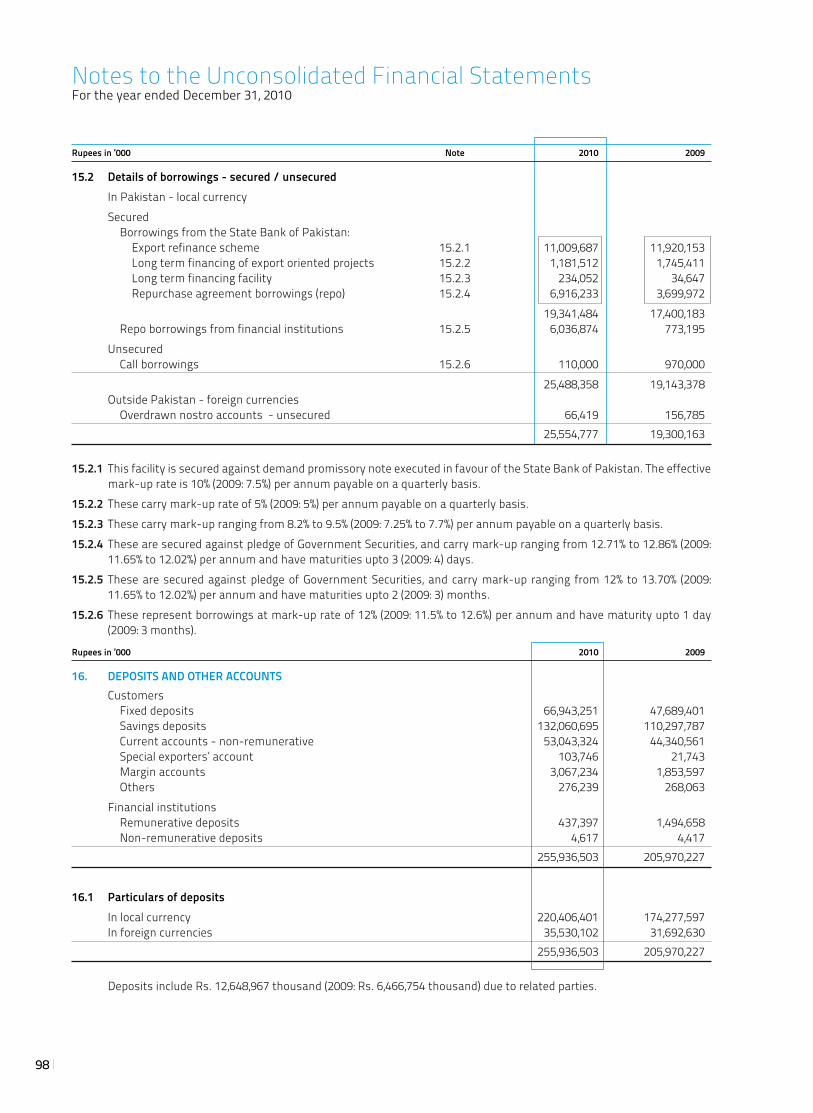
98
Rupees in ‘000 Note 2010 2009
15.2 Details of borrowings - secured / unsecured In Pakistan - local currency Secured Borrowings from the State Bank of Pakistan: Export refinance scheme 15.2.1 11,009,687 11,920,153 Long term financing of export oriented projects 15.2.2 1,181,512 1,745,411 Long term financing facility 15.2.3 234,052 34,647 Repurchase agreement borrowings (repo) 15.2.4 6,916,233 3,699,972 19,341,484 17,400,183 Repo borrowings from financial institutions 15.2.5 6,036,874 773,195 Unsecured Call borrowings 15.2.6 110,000 970,000 25,488,358 19,143,378 Outside Pakistan - foreign currencies Overdrawn nostro accounts - unsecured 66,419 156,785 25,554,777 19,300,163
15.2.1 This facility is secured against demand promissory note executed in favour of the State Bank of Pakistan. The effective mark-up rate is 10% (2009: 7.5%) per annum payable on a quarterly basis.
15.2.2 These carry mark-up rate of 5% (2009: 5%) per annum payable on a quarterly basis.15.2.3 These carry mark-up ranging from 8.2% to 9.5% (2009: 7.25% to 7.7%) per annum payable on a quarterly basis.15.2.4 These are secured against pledge of Government Securities, and carry mark-up ranging from 12.71% to 12.86% (2009:
11.65% to 12.02%) per annum and have maturities upto 3 (2009: 4) days.15.2.5 These are secured against pledge of Government Securities, and carry mark-up ranging from 12% to 13.70% (2009:
11.65% to 12.02%) per annum and have maturities upto 2 (2009: 3) months.15.2.6 These represent borrowings at mark-up rate of 12% (2009: 11.5% to 12.6%) per annum and have maturity upto 1 day
(2009: 3 months).
Rupees in ‘000 2010 2009
16. DEPOSITS AND OTHER ACCOUNTS Customers Fixed deposits 66,943,251 47,689,401 Savings deposits 132,060,695 110,297,787 Current accounts - non-remunerative 53,043,324 44,340,561 Special exporters’ account 103,746 21,743 Margin accounts 3,067,234 1,853,597 Others 276,239 268,063 Financial institutions Remunerative deposits 437,397 1,494,658 Non-remunerative deposits 4,617 4,417 255,936,503 205,970,227
16.1 Particulars of deposits In local currency 220,406,401 174,277,597 In foreign currencies 35,530,102 31,692,630 255,936,503 205,970,227
Deposits include Rs. 12,648,967 thousand (2009: Rs. 6,466,754 thousand) due to related parties.
Notes to the Unconsolidated Financial StatementsFor the year ended December 31, 2010
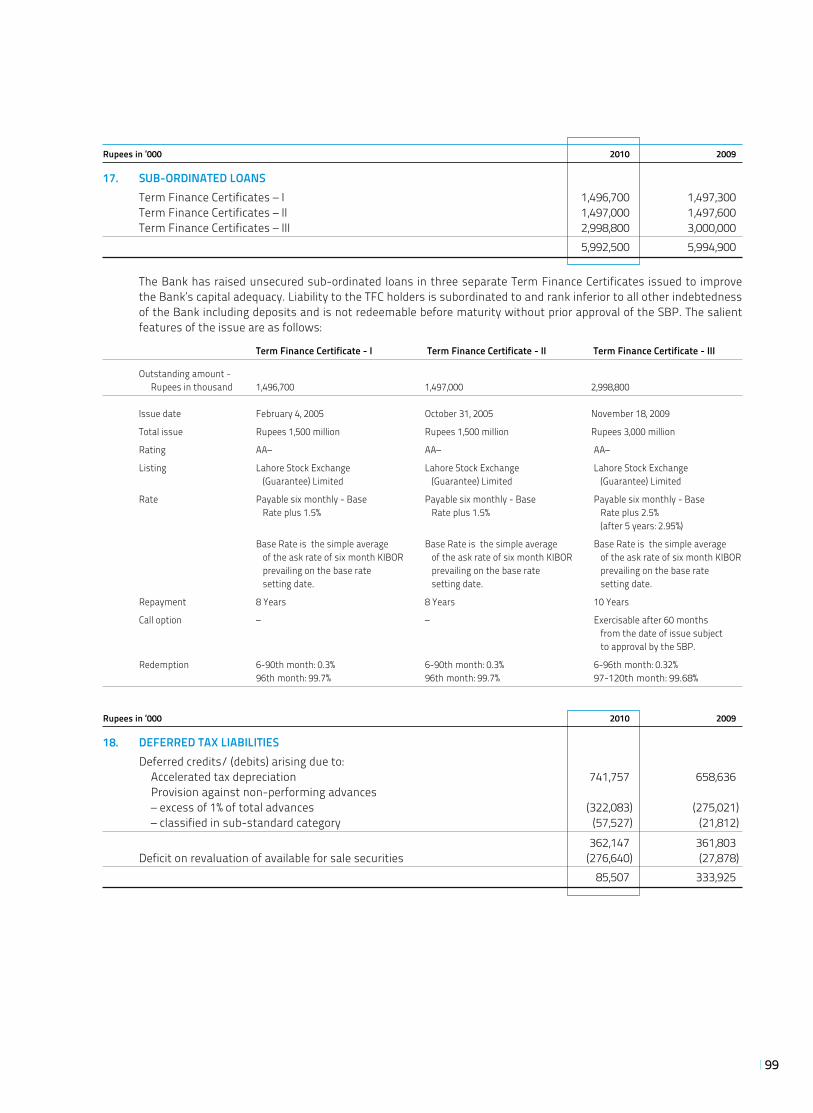
99
Rupees in ‘000 2010 2009
17. SUB-ORDINATED LOANS Term Finance Certificates – I 1,496,700 1,497,300 Term Finance Certificates – II 1,497,000 1,497,600 Term Finance Certificates – III 2,998,800 3,000,000 5,992,500 5,994,900
The Bank has raised unsecured sub-ordinated loans in three separate Term Finance Certificates issued to improve the Bank’s capital adequacy. Liability to the TFC holders is subordinated to and rank inferior to all other indebtedness of the Bank including deposits and is not redeemable before maturity without prior approval of the SBP. The salient features of the issue are as follows:
Term Finance Certificate - I Term Finance Certificate - II Term Finance Certificate - III
Outstanding amount - Rupees in thousand 1,496,700 1,497,000 2,998,800
Issue date February 4, 2005 October 31, 2005 November 18, 2009
Total issue Rupees 1,500 million Rupees 1,500 million Rupees 3,000 million
Rating AA– AA– AA–
Listing Lahore Stock Exchange Lahore Stock Exchange Lahore Stock Exchange (Guarantee) Limited (Guarantee) Limited (Guarantee) Limited
Rate Payable six monthly - Base Payable six monthly - Base Payable six monthly - Base Rate plus 1.5% Rate plus 1.5% Rate plus 2.5% (after 5 years: 2.95%)
Base Rate is the simple average Base Rate is the simple average Base Rate is the simple average of the ask rate of six month KIBOR of the ask rate of six month KIBOR of the ask rate of six month KIBOR prevailing on the base rate prevailing on the base rate prevailing on the base rate setting date. setting date. setting date.
Repayment 8 Years 8 Years 10 Years
Call option – – Exercisable after 60 months from the date of issue subject to approval by the SBP.
Redemption 6-90th month: 0.3% 6-90th month: 0.3% 6-96th month: 0.32% 96th month: 99.7% 96th month: 99.7% 97-120th month: 99.68%
Rupees in ‘000 2010 2009
18. DEFERRED TAX LIABILITIES Deferred credits/ (debits) arising due to: Accelerated tax depreciation 741,757 658,636 Provision against non-performing advances – excess of 1% of total advances (322,083) (275,021) – classified in sub-standard category (57,527) (21,812) 362,147 361,803 Deficit on revaluation of available for sale securities (276,640) (27,878) 85,507 333,925
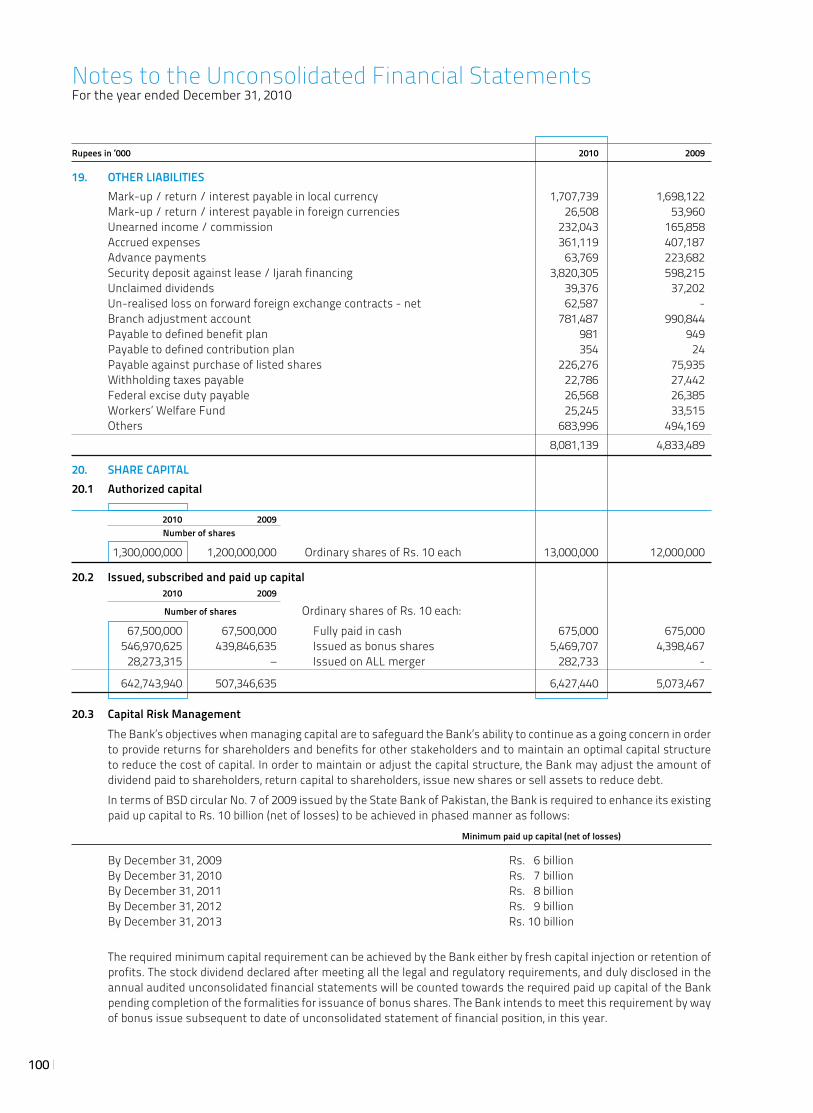
100
Rupees in ‘000 2010 2009
19. OTHER LIABILITIES Mark-up / return / interest payable in local currency 1,707,739 1,698,122 Mark-up / return / interest payable in foreign currencies 26,508 53,960 Unearned income / commission 232,043 165,858 Accrued expenses 361,119 407,187 Advance payments 63,769 223,682 Security deposit against lease / Ijarah financing 3,820,305 598,215 Unclaimed dividends 39,376 37,202 Un-realised loss on forward foreign exchange contracts - net 62,587 - Branch adjustment account 781,487 990,844 Payable to defined benefit plan 981 949 Payable to defined contribution plan 354 24 Payable against purchase of listed shares 226,276 75,935 Withholding taxes payable 22,786 27,442 Federal excise duty payable 26,568 26,385 Workers’ Welfare Fund 25,245 33,515 Others 683,996 494,169 8,081,139 4,833,489
20. SHARE CAPITAL20.1 Authorized capital
2010 2009 Number of shares
1,300,000,000 1,200,000,000 Ordinary shares of Rs. 10 each 13,000,000 12,000,000
20.2 Issued, subscribed and paid up capital 2010 2009
Number of shares Ordinary shares of Rs. 10 each: 67,500,000 67,500,000 Fully paid in cash 675,000 675,000 546,970,625 439,846,635 Issued as bonus shares 5,469,707 4,398,467 28,273,315 – Issued on ALL merger 282,733 -
642,743,940 507,346,635 6,427,440 5,073,467
20.3 Capital Risk Management The Bank’s objectives when managing capital are to safeguard the Bank’s ability to continue as a going concern in order
to provide returns for shareholders and benefits for other stakeholders and to maintain an optimal capital structure to reduce the cost of capital. In order to maintain or adjust the capital structure, the Bank may adjust the amount of dividend paid to shareholders, return capital to shareholders, issue new shares or sell assets to reduce debt.
In terms of BSD circular No. 7 of 2009 issued by the State Bank of Pakistan, the Bank is required to enhance its existing paid up capital to Rs. 10 billion (net of losses) to be achieved in phased manner as follows:
Minimum paid up capital (net of losses)
By December 31, 2009 Rs. 6 billion By December 31, 2010 Rs. 7 billion By December 31, 2011 Rs. 8 billion By December 31, 2012 Rs. 9 billion By December 31, 2013 Rs. 10 billion
The required minimum capital requirement can be achieved by the Bank either by fresh capital injection or retention of profits. The stock dividend declared after meeting all the legal and regulatory requirements, and duly disclosed in the annual audited unconsolidated financial statements will be counted towards the required paid up capital of the Bank pending completion of the formalities for issuance of bonus shares. The Bank intends to meet this requirement by way of bonus issue subsequent to date of unconsolidated statement of financial position, in this year.
Notes to the Unconsolidated Financial StatementsFor the year ended December 31, 2010
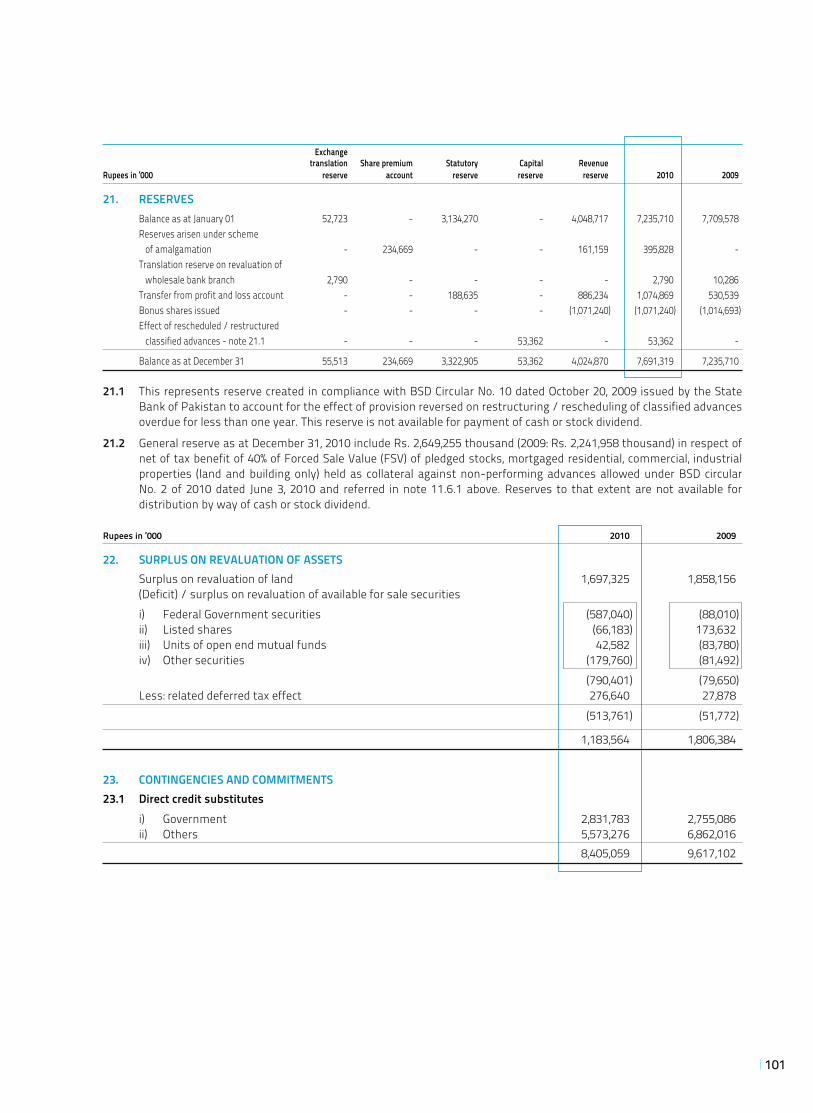
101
Exchange translation Share premium Statutory Capital RevenueRupees in ‘000 reserve account reserve reserve reserve 2010 2009
21. RESERVES Balance as at January 01 52,723 - 3,134,270 - 4,048,717 7,235,710 7,709,578 Reserves arisen under scheme of amalgamation - 234,669 - - 161,159 395,828 - Translation reserve on revaluation of wholesale bank branch 2,790 - - - - 2,790 10,286 Transfer from profit and loss account - - 188,635 - 886,234 1,074,869 530,539 Bonus shares issued - - - - (1,071,240) (1,071,240) (1,014,693) Effect of rescheduled / restructured classified advances - note 21.1 - - - 53,362 - 53,362 -
Balance as at December 31 55,513 234,669 3,322,905 53,362 4,024,870 7,691,319 7,235,710
21.1 This represents reserve created in compliance with BSD Circular No. 10 dated October 20, 2009 issued by the State Bank of Pakistan to account for the effect of provision reversed on restructuring / rescheduling of classified advances overdue for less than one year. This reserve is not available for payment of cash or stock dividend.
21.2 General reserve as at December 31, 2010 include Rs. 2,649,255 thousand (2009: Rs. 2,241,958 thousand) in respect of net of tax benefit of 40% of Forced Sale Value (FSV) of pledged stocks, mortgaged residential, commercial, industrial properties (land and building only) held as collateral against non-performing advances allowed under BSD circular No. 2 of 2010 dated June 3, 2010 and referred in note 11.6.1 above. Reserves to that extent are not available for distribution by way of cash or stock dividend.
Rupees in ‘000 2010 2009
22. SURPLUS ON REVALUATION OF ASSETS Surplus on revaluation of land 1,697,325 1,858,156 (Deficit) / surplus on revaluation of available for sale securities i) Federal Government securities (587,040) (88,010) ii) Listed shares (66,183) 173,632 iii) Units of open end mutual funds 42,582 (83,780) iv) Other securities (179,760) (81,492) (790,401) (79,650) Less: related deferred tax effect 276,640 27,878 (513,761) (51,772)
1,183,564 1,806,384
23. CONTINGENCIES AND COMMITMENTS23.1 Direct credit substitutes i) Government 2,831,783 2,755,086 ii) Others 5,573,276 6,862,016 8,405,059 9,617,102
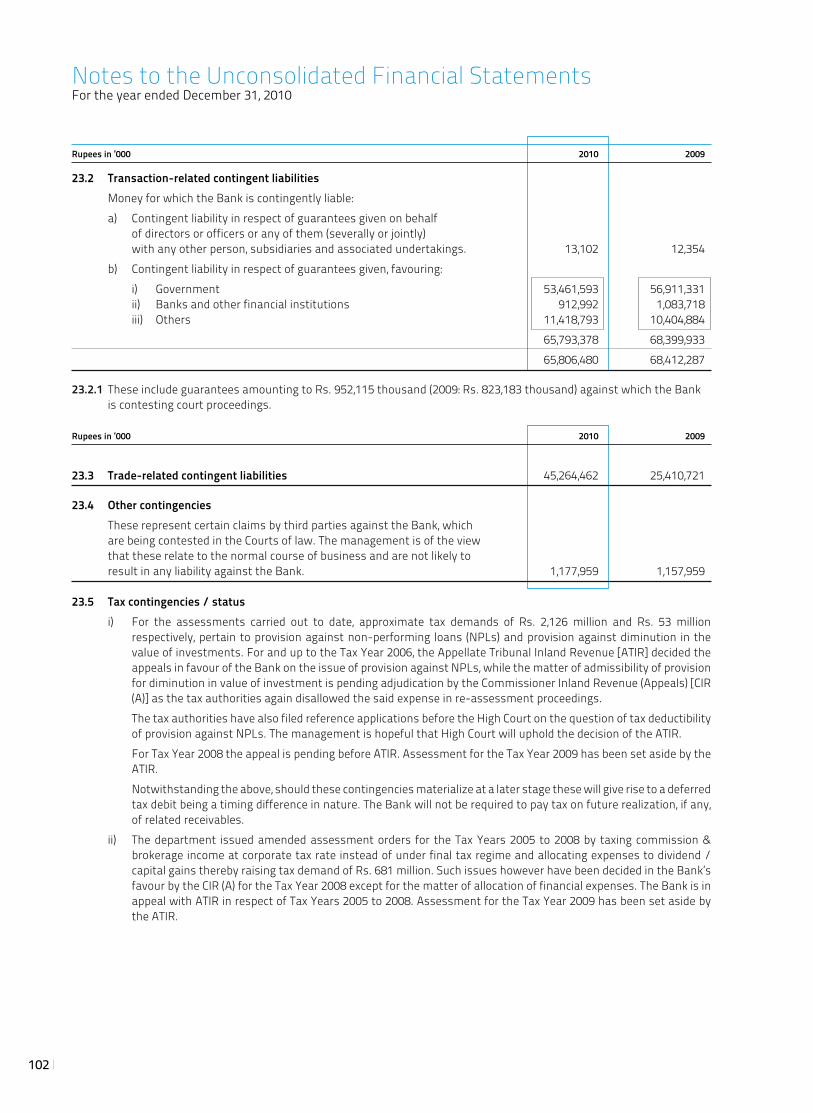
102
Rupees in ‘000 2010 2009
23.2 Transaction-related contingent liabilities Money for which the Bank is contingently liable: a) Contingent liability in respect of guarantees given on behalf of directors or officers or any of them (severally or jointly) with any other person, subsidiaries and associated undertakings. 13,102 12,354 b) Contingent liability in respect of guarantees given, favouring: i) Government 53,461,593 56,911,331 ii) Banks and other financial institutions 912,992 1,083,718 iii) Others 11,418,793 10,404,884 65,793,378 68,399,933 65,806,480 68,412,287
23.2.1 These include guarantees amounting to Rs. 952,115 thousand (2009: Rs. 823,183 thousand) against which the Bank is contesting court proceedings.
Rupees in ‘000 2010 2009
23.3 Trade-related contingent liabilities 45,264,462 25,410,721
23.4 Other contingencies These represent certain claims by third parties against the Bank, which are being contested in the Courts of law. The management is of the view that these relate to the normal course of business and are not likely to result in any liability against the Bank. 1,177,959 1,157,959 23.5 Tax contingencies / status i) For the assessments carried out to date, approximate tax demands of Rs. 2,126 million and Rs. 53 million
respectively, pertain to provision against non-performing loans (NPLs) and provision against diminution in the value of investments. For and up to the Tax Year 2006, the Appellate Tribunal Inland Revenue [ATIR] decided the appeals in favour of the Bank on the issue of provision against NPLs, while the matter of admissibility of provision for diminution in value of investment is pending adjudication by the Commissioner Inland Revenue (Appeals) [CIR (A)] as the tax authorities again disallowed the said expense in re-assessment proceedings.
The tax authorities have also filed reference applications before the High Court on the question of tax deductibility of provision against NPLs. The management is hopeful that High Court will uphold the decision of the ATIR.
For Tax Year 2008 the appeal is pending before ATIR. Assessment for the Tax Year 2009 has been set aside by the ATIR.
Notwithstanding the above, should these contingencies materialize at a later stage these will give rise to a deferred tax debit being a timing difference in nature. The Bank will not be required to pay tax on future realization, if any, of related receivables.
ii) The department issued amended assessment orders for the Tax Years 2005 to 2008 by taxing commission & brokerage income at corporate tax rate instead of under final tax regime and allocating expenses to dividend / capital gains thereby raising tax demand of Rs. 681 million. Such issues however have been decided in the Bank’s favour by the CIR (A) for the Tax Year 2008 except for the matter of allocation of financial expenses. The Bank is in appeal with ATIR in respect of Tax Years 2005 to 2008. Assessment for the Tax Year 2009 has been set aside by the ATIR.
Notes to the Unconsolidated Financial StatementsFor the year ended December 31, 2010
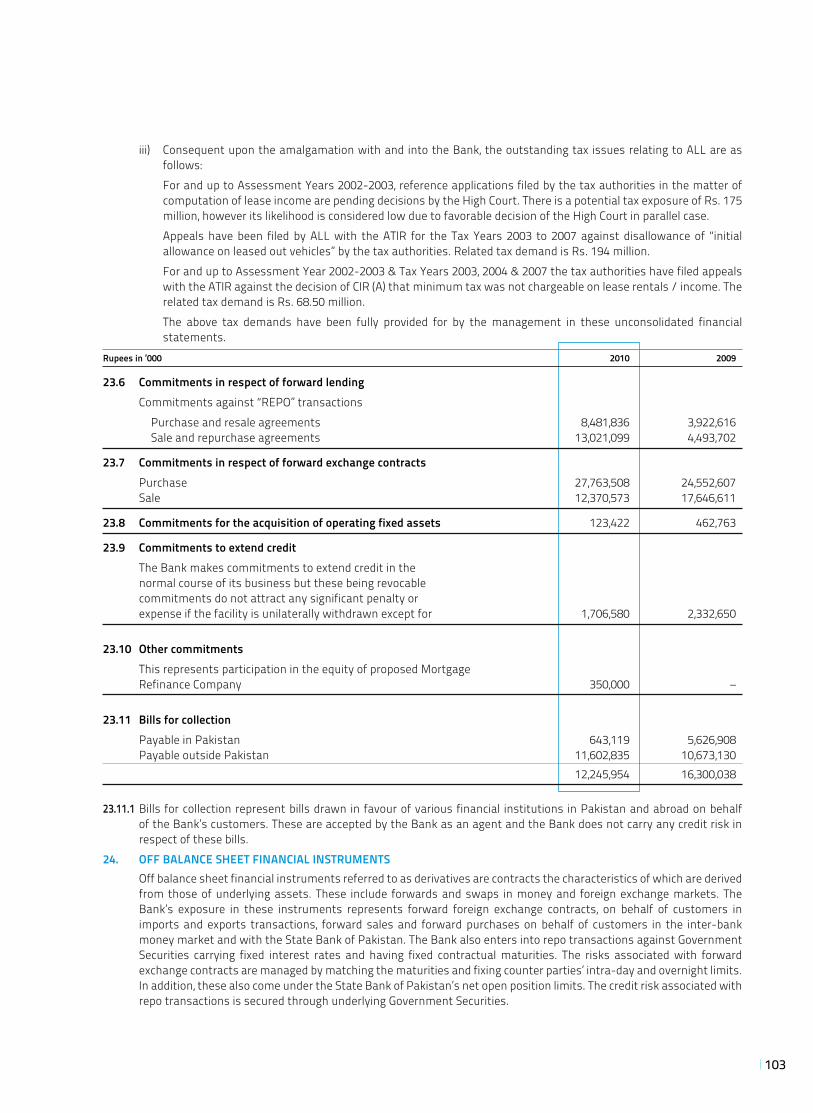
103
iii) Consequent upon the amalgamation with and into the Bank, the outstanding tax issues relating to ALL are as follows:
For and up to Assessment Years 2002-2003, reference applications filed by the tax authorities in the matter of computation of lease income are pending decisions by the High Court. There is a potential tax exposure of Rs. 175 million, however its likelihood is considered low due to favorable decision of the High Court in parallel case.
Appeals have been filed by ALL with the ATIR for the Tax Years 2003 to 2007 against disallowance of “initial allowance on leased out vehicles” by the tax authorities. Related tax demand is Rs. 194 million.
For and up to Assessment Year 2002-2003 & Tax Years 2003, 2004 & 2007 the tax authorities have filed appeals with the ATIR against the decision of CIR (A) that minimum tax was not chargeable on lease rentals / income. The related tax demand is Rs. 68.50 million.
The above tax demands have been fully provided for by the management in these unconsolidated financial statements.
Rupees in ‘000 2010 2009
23.6 Commitments in respect of forward lending Commitments against “REPO” transactions Purchase and resale agreements 8,481,836 3,922,616 Sale and repurchase agreements 13,021,099 4,493,702
23.7 Commitments in respect of forward exchange contracts Purchase 27,763,508 24,552,607 Sale 12,370,573 17,646,611
23.8 Commitments for the acquisition of operating fixed assets 123,422 462,763
23.9 Commitments to extend credit The Bank makes commitments to extend credit in the
normal course of its business but these being revocable commitments do not attract any significant penalty or expense if the facility is unilaterally withdrawn except for 1,706,580 2,332,650
23.10 Other commitments This represents participation in the equity of proposed Mortgage Refinance Company 350,000 –
23.11 Bills for collection Payable in Pakistan 643,119 5,626,908 Payable outside Pakistan 11,602,835 10,673,130 12,245,954 16,300,038
23.11.1 Bills for collection represent bills drawn in favour of various financial institutions in Pakistan and abroad on behalf of the Bank’s customers. These are accepted by the Bank as an agent and the Bank does not carry any credit risk in respect of these bills.
24. OFF BALANCE SHEET FINANCIAL INSTRUMENTS Off balance sheet financial instruments referred to as derivatives are contracts the characteristics of which are derived
from those of underlying assets. These include forwards and swaps in money and foreign exchange markets. The Bank’s exposure in these instruments represents forward foreign exchange contracts, on behalf of customers in imports and exports transactions, forward sales and forward purchases on behalf of customers in the inter-bank money market and with the State Bank of Pakistan. The Bank also enters into repo transactions against Government Securities carrying fixed interest rates and having fixed contractual maturities. The risks associated with forward exchange contracts are managed by matching the maturities and fixing counter parties’ intra-day and overnight limits. In addition, these also come under the State Bank of Pakistan’s net open position limits. The credit risk associated with repo transactions is secured through underlying Government Securities.
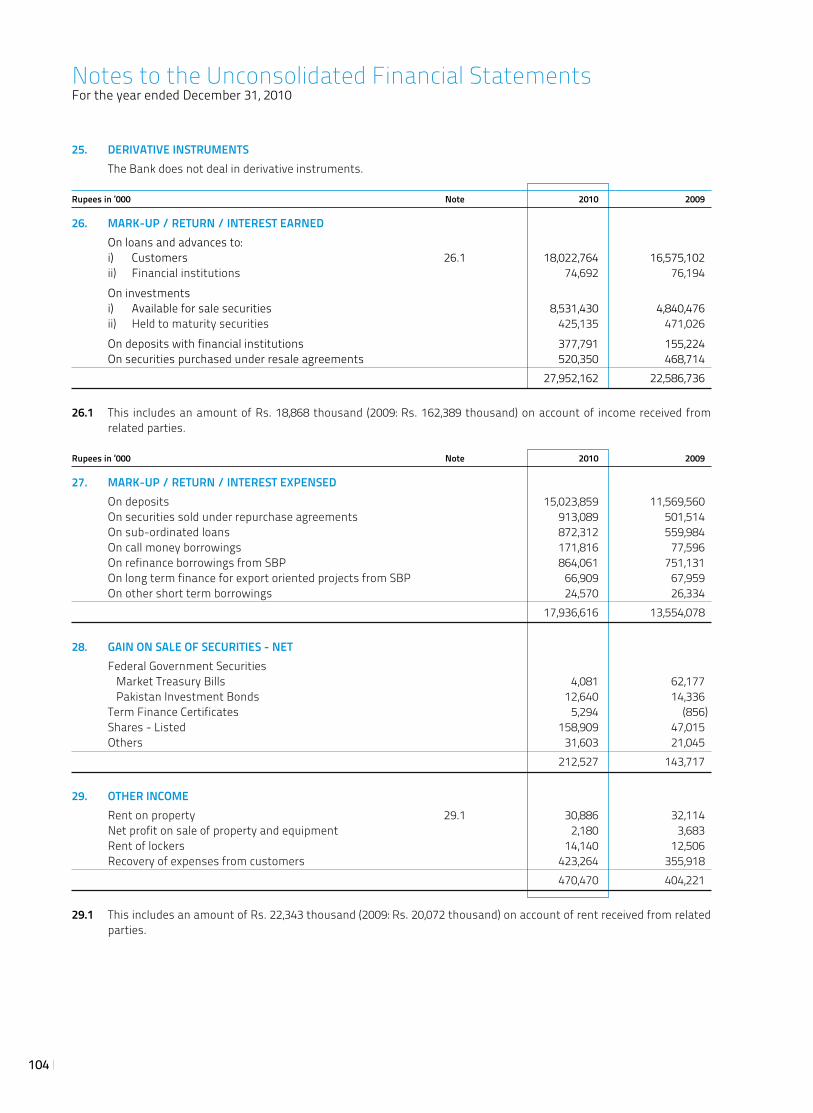
104
25. DERIVATIVE INSTRUMENTS The Bank does not deal in derivative instruments.
Rupees in ‘000 Note 2010 2009
26. MARK-UP / RETURN / INTEREST EARNED On loans and advances to: i) Customers 26.1 18,022,764 16,575,102 ii) Financial institutions 74,692 76,194 On investments i) Available for sale securities 8,531,430 4,840,476 ii) Held to maturity securities 425,135 471,026 On deposits with financial institutions 377,791 155,224 On securities purchased under resale agreements 520,350 468,714 27,952,162 22,586,736
26.1 This includes an amount of Rs. 18,868 thousand (2009: Rs. 162,389 thousand) on account of income received from related parties.
Rupees in ‘000 Note 2010 2009
27. MARK-UP / RETURN / INTEREST EXPENSED On deposits 15,023,859 11,569,560 On securities sold under repurchase agreements 913,089 501,514 On sub-ordinated loans 872,312 559,984 On call money borrowings 171,816 77,596 On refinance borrowings from SBP 864,061 751,131 On long term finance for export oriented projects from SBP 66,909 67,959 On other short term borrowings 24,570 26,334 17,936,616 13,554,078
28. GAIN ON SALE OF SECURITIES - NET Federal Government Securities Market Treasury Bills 4,081 62,177 Pakistan Investment Bonds 12,640 14,336 Term Finance Certificates 5,294 (856) Shares - Listed 158,909 47,015 Others 31,603 21,045 212,527 143,717
29. OTHER INCOME Rent on property 29.1 30,886 32,114 Net profit on sale of property and equipment 2,180 3,683 Rent of lockers 14,140 12,506 Recovery of expenses from customers 423,264 355,918 470,470 404,221
29.1 This includes an amount of Rs. 22,343 thousand (2009: Rs. 20,072 thousand) on account of rent received from related parties.
Notes to the Unconsolidated Financial StatementsFor the year ended December 31, 2010

105
Rupees in ‘000 Note 2010 2009
30. ADMINISTRATIVE EXPENSES Salaries, allowances, etc. 3,898,188 3,848,965 Charge for defined benefit plan 36.3 165,563 136,153 Contribution to defined contribution plan 122,565 107,882 Non-executive directors’ fees, allowances and other expenses 1,070 655 Rent, taxes, insurance, electricity, etc. 957,305 817,629 Legal and professional charges 90,288 70,412 Brokerage and commission 167,246 127,828 Communications 291,466 299,713 Repairs and maintenance 534,869 300,588 Stationery and printing 127,072 114,969 Advertisement and publicity 135,277 71,492 Donations 30.1 86,015 18,000 Auditors’ remuneration 30.2 7,066 7,500 Depreciation 12.2 684,196 645,958 Other expenditure (traveling, security services, etc.) 544,432 428,113 7,812,618 6,995,857
30.1 Donations paid in excess of Rs. 100,000 to a single party during the year are as follows: Institute of Business Administration Karachi 16,000 18,000 Army Miscellaneous Welfare Fund (for flood affectees) 70,015 - 86,015 18,000
30.1.1 Donations were not made to any donee in which the Bank or any of its directors or their spouses had any interest.
Rupees in ‘000 2010 2009
30.2 Auditors’ remuneration Audit fee 2,500 2,500 Fee for the audit of wholesale bank branch 1,811 1,687 Fee for the audit of provident and gratuity funds 109 80 Special certifications, half year review and the audit of consolidated financial statements 1,915 2,714 Out-of-pocket expenses 731 519
7,066 7,500
31. OTHER CHARGES Workers’ Welfare Fund 25,245 33,515 Penalties imposed by the State Bank of Pakistan 17,208 853 42,453 34,368
32. TAXATION For the year Current 329,617 562,099 Deferred 342 (27,651) 329,959 534,448 For prior years Current - 119,827 Deferred - (119,827) - - 329,959 534,448
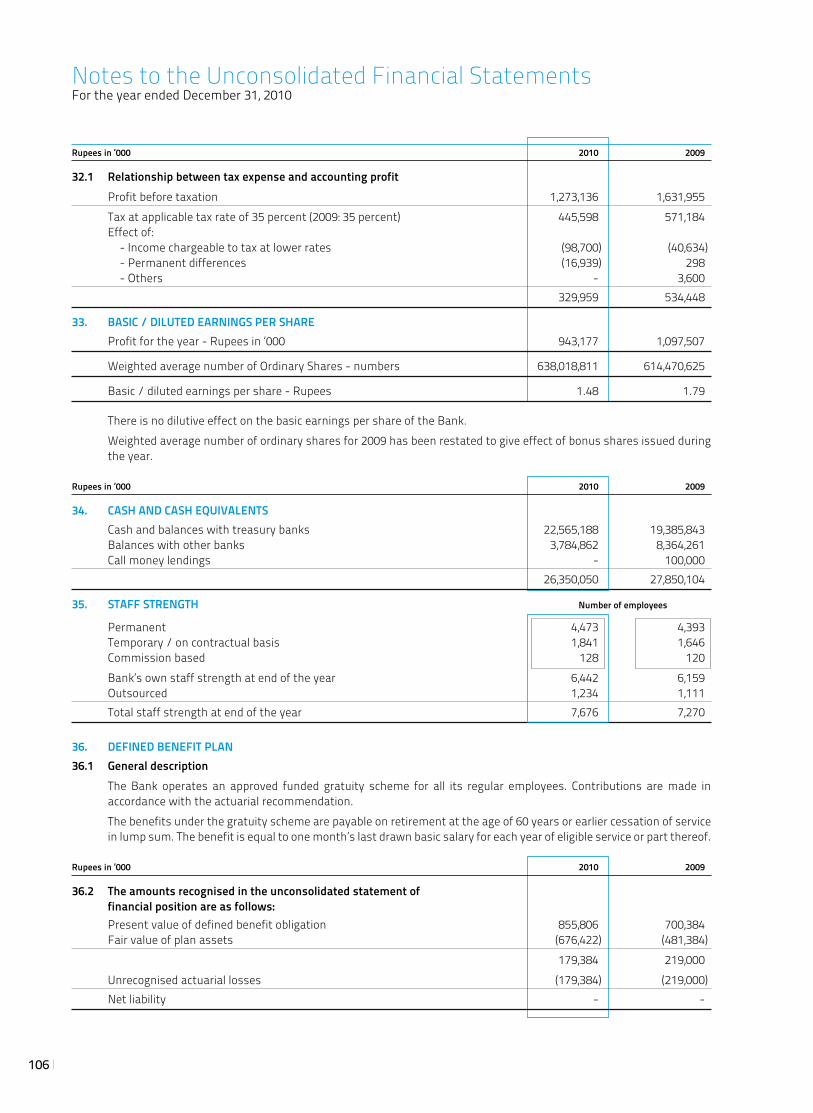
106
Rupees in ‘000 2010 2009
32.1 Relationship between tax expense and accounting profit Profit before taxation 1,273,136 1,631,955 Tax at applicable tax rate of 35 percent (2009: 35 percent) 445,598 571,184 Effect of: - Income chargeable to tax at lower rates (98,700) (40,634) - Permanent differences (16,939) 298 - Others - 3,600 329,959 534,448
33. BASIC / DILUTED EARNINGS PER SHARE Profit for the year - Rupees in ‘000 943,177 1,097,507
Weighted average number of Ordinary Shares - numbers 638,018,811 614,470,625
Basic / diluted earnings per share - Rupees 1.48 1.79
There is no dilutive effect on the basic earnings per share of the Bank. Weighted average number of ordinary shares for 2009 has been restated to give effect of bonus shares issued during
the year.
Rupees in ‘000 2010 2009
34. CASH AND CASH EQUIVALENTS Cash and balances with treasury banks 22,565,188 19,385,843 Balances with other banks 3,784,862 8,364,261 Call money lendings - 100,000 26,350,050 27,850,104
35. STAFF STRENGTH Number of employees
Permanent 4,473 4,393 Temporary / on contractual basis 1,841 1,646 Commission based 128 120 Bank’s own staff strength at end of the year 6,442 6,159 Outsourced 1,234 1,111 Total staff strength at end of the year 7,676 7,270
36. DEFINED BENEFIT PLAN36.1 General description The Bank operates an approved funded gratuity scheme for all its regular employees. Contributions are made in
accordance with the actuarial recommendation. The benefits under the gratuity scheme are payable on retirement at the age of 60 years or earlier cessation of service
in lump sum. The benefit is equal to one month’s last drawn basic salary for each year of eligible service or part thereof.
Rupees in ‘000 2010 2009
36.2 The amounts recognised in the unconsolidated statement of financial position are as follows: Present value of defined benefit obligation 855,806 700,384 Fair value of plan assets (676,422) (481,384) 179,384 219,000 Unrecognised actuarial losses (179,384) (219,000) Net liability - -
Notes to the Unconsolidated Financial StatementsFor the year ended December 31, 2010
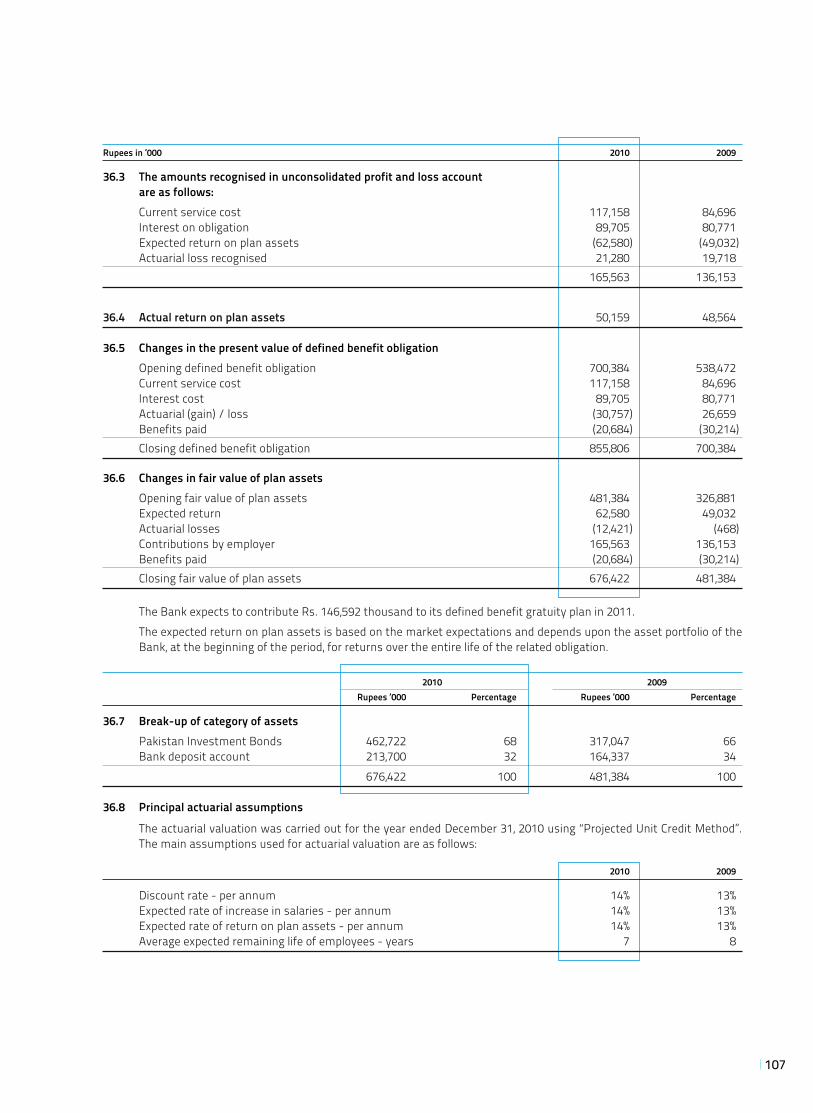
107
Rupees in ‘000 2010 2009
36.3 The amounts recognised in unconsolidated profit and loss account are as follows: Current service cost 117,158 84,696 Interest on obligation 89,705 80,771 Expected return on plan assets (62,580) (49,032) Actuarial loss recognised 21,280 19,718 165,563 136,153
36.4 Actual return on plan assets 50,159 48,564 36.5 Changes in the present value of defined benefit obligation Opening defined benefit obligation 700,384 538,472 Current service cost 117,158 84,696 Interest cost 89,705 80,771 Actuarial (gain) / loss (30,757) 26,659 Benefits paid (20,684) (30,214) Closing defined benefit obligation 855,806 700,384
36.6 Changes in fair value of plan assets Opening fair value of plan assets 481,384 326,881 Expected return 62,580 49,032 Actuarial losses (12,421) (468) Contributions by employer 165,563 136,153 Benefits paid (20,684) (30,214) Closing fair value of plan assets 676,422 481,384
The Bank expects to contribute Rs. 146,592 thousand to its defined benefit gratuity plan in 2011. The expected return on plan assets is based on the market expectations and depends upon the asset portfolio of the
Bank, at the beginning of the period, for returns over the entire life of the related obligation.
2010 2009 Rupees ‘000 Percentage Rupees ‘000 Percentage
36.7 Break-up of category of assets Pakistan Investment Bonds 462,722 68 317,047 66 Bank deposit account 213,700 32 164,337 34 676,422 100 481,384 100
36.8 Principal actuarial assumptions
The actuarial valuation was carried out for the year ended December 31, 2010 using “Projected Unit Credit Method”. The main assumptions used for actuarial valuation are as follows:
2010 2009
Discount rate - per annum 14% 13% Expected rate of increase in salaries - per annum 14% 13% Expected rate of return on plan assets - per annum 14% 13% Average expected remaining life of employees - years 7 8
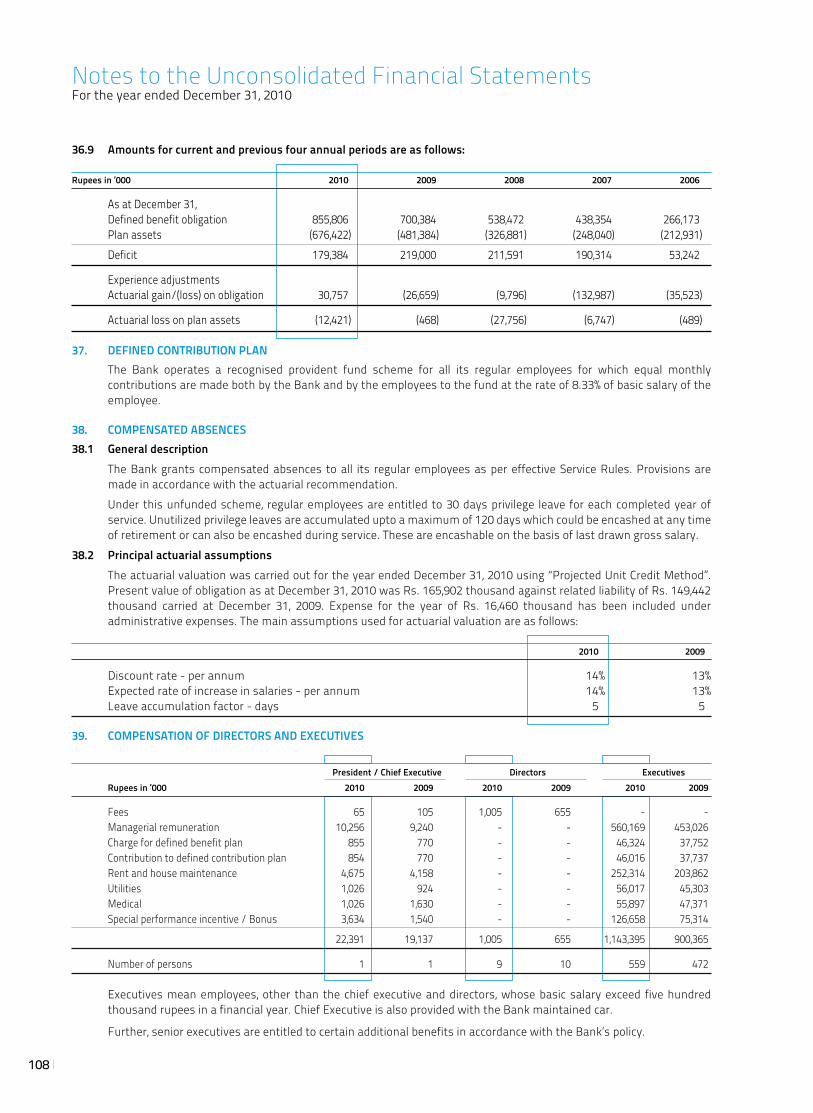
108
36.9 Amounts for current and previous four annual periods are as follows:
Rupees in ‘000 2010 2009 2008 2007 2006
As at December 31, Defined benefit obligation 855,806 700,384 538,472 438,354 266,173 Plan assets (676,422) (481,384) (326,881) (248,040) (212,931) Deficit 179,384 219,000 211,591 190,314 53,242
Experience adjustments Actuarial gain/(loss) on obligation 30,757 (26,659) (9,796) (132,987) (35,523)
Actuarial loss on plan assets (12,421) (468) (27,756) (6,747) (489)
37. DEFINED CONTRIBUTION PLAN The Bank operates a recognised provident fund scheme for all its regular employees for which equal monthly
contributions are made both by the Bank and by the employees to the fund at the rate of 8.33% of basic salary of the employee.
38. COMPENSATED ABSENCES38.1 General description The Bank grants compensated absences to all its regular employees as per effective Service Rules. Provisions are
made in accordance with the actuarial recommendation. Under this unfunded scheme, regular employees are entitled to 30 days privilege leave for each completed year of
service. Unutilized privilege leaves are accumulated upto a maximum of 120 days which could be encashed at any time of retirement or can also be encashed during service. These are encashable on the basis of last drawn gross salary.
38.2 Principal actuarial assumptions The actuarial valuation was carried out for the year ended December 31, 2010 using “Projected Unit Credit Method”.
Present value of obligation as at December 31, 2010 was Rs. 165,902 thousand against related liability of Rs. 149,442 thousand carried at December 31, 2009. Expense for the year of Rs. 16,460 thousand has been included under administrative expenses. The main assumptions used for actuarial valuation are as follows:
2010 2009
Discount rate - per annum 14% 13% Expected rate of increase in salaries - per annum 14% 13% Leave accumulation factor - days 5 5
39. COMPENSATION OF DIRECTORS AND EXECUTIVES
President / Chief Executive Directors Executives Rupees in ‘000 2010 2009 2010 2009 2010 2009
Fees 65 105 1,005 655 - - Managerial remuneration 10,256 9,240 - - 560,169 453,026 Charge for defined benefit plan 855 770 - - 46,324 37,752 Contribution to defined contribution plan 854 770 - - 46,016 37,737 Rent and house maintenance 4,675 4,158 - - 252,314 203,862 Utilities 1,026 924 - - 56,017 45,303 Medical 1,026 1,630 - - 55,897 47,371 Special performance incentive / Bonus 3,634 1,540 - - 126,658 75,314
22,391 19,137 1,005 655 1,143,395 900,365
Number of persons 1 1 9 10 559 472
Executives mean employees, other than the chief executive and directors, whose basic salary exceed five hundred thousand rupees in a financial year. Chief Executive is also provided with the Bank maintained car.
Further, senior executives are entitled to certain additional benefits in accordance with the Bank’s policy.
Notes to the Unconsolidated Financial StatementsFor the year ended December 31, 2010
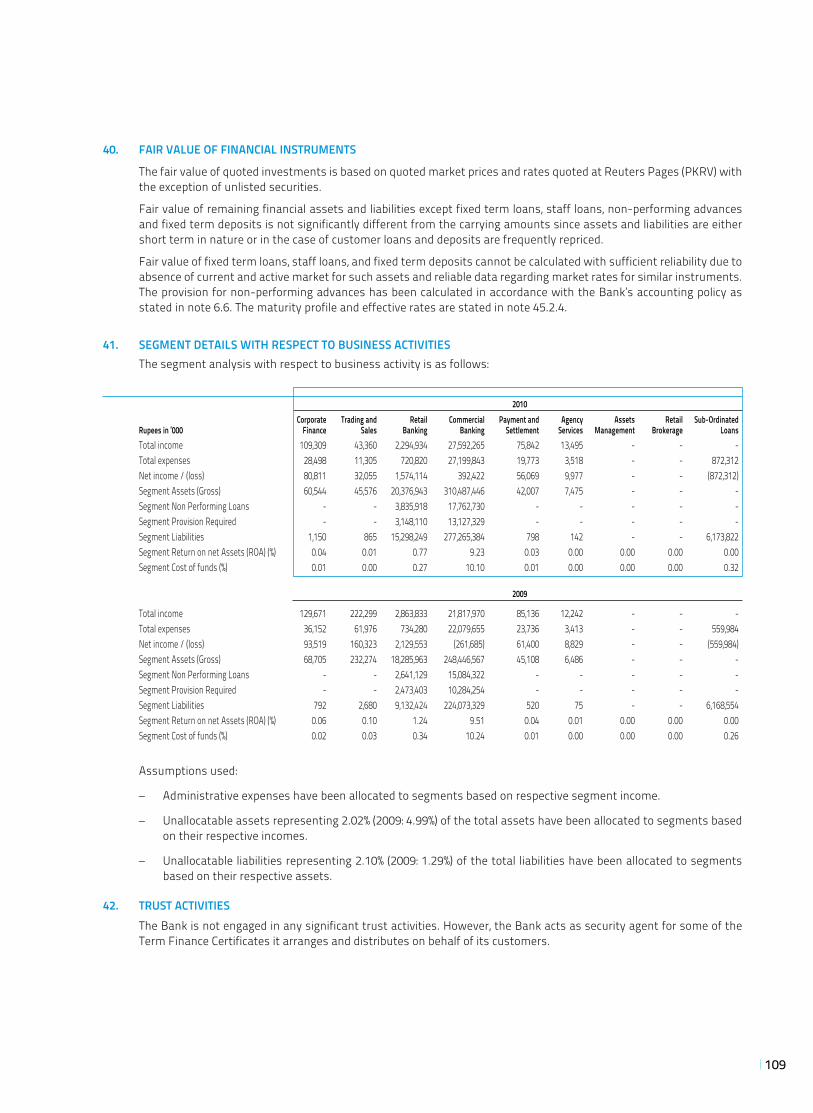
109
40. FAIR VALUE OF FINANCIAL INSTRUMENTS
The fair value of quoted investments is based on quoted market prices and rates quoted at Reuters Pages (PKRV) with the exception of unlisted securities.
Fair value of remaining financial assets and liabilities except fixed term loans, staff loans, non-performing advances and fixed term deposits is not significantly different from the carrying amounts since assets and liabilities are either short term in nature or in the case of customer loans and deposits are frequently repriced.
Fair value of fixed term loans, staff loans, and fixed term deposits cannot be calculated with sufficient reliability due to absence of current and active market for such assets and reliable data regarding market rates for similar instruments. The provision for non-performing advances has been calculated in accordance with the Bank’s accounting policy as stated in note 6.6. The maturity profile and effective rates are stated in note 45.2.4.
41. SEGMENT DETAILS WITH RESPECT TO BUSINESS ACTIVITIES The segment analysis with respect to business activity is as follows:
2010 Corporate Trading and Retail Commercial Payment and Agency Assets Retail Sub-Ordinated Rupees in ‘000 Finance Sales Banking Banking Settlement Services Management Brokerage Loans Total income 109,309 43,360 2,294,934 27,592,265 75,842 13,495 - - - Total expenses 28,498 11,305 720,820 27,199,843 19,773 3,518 - - 872,312 Net income / (loss) 80,811 32,055 1,574,114 392,422 56,069 9,977 - - (872,312) Segment Assets (Gross) 60,544 45,576 20,376,943 310,487,446 42,007 7,475 - - - Segment Non Performing Loans - - 3,835,918 17,762,730 - - - - - Segment Provision Required - - 3,148,110 13,127,329 - - - - - Segment Liabilities 1,150 865 15,298,249 277,265,384 798 142 - - 6,173,822 Segment Return on net Assets (ROA) (%) 0.04 0.01 0.77 9.23 0.03 0.00 0.00 0.00 0.00 Segment Cost of funds (%) 0.01 0.00 0.27 10.10 0.01 0.00 0.00 0.00 0.32 2009
Total income 129,671 222,299 2,863,833 21,817,970 85,136 12,242 - - - Total expenses 36,152 61,976 734,280 22,079,655 23,736 3,413 - - 559,984 Net income / (loss) 93,519 160,323 2,129,553 (261,685) 61,400 8,829 - - (559,984) Segment Assets (Gross) 68,705 232,274 18,285,963 248,446,567 45,108 6,486 - - - Segment Non Performing Loans - - 2,641,129 15,084,322 - - - - - Segment Provision Required - - 2,473,403 10,284,254 - - - - - Segment Liabilities 792 2,680 9,132,424 224,073,329 520 75 - - 6,168,554 Segment Return on net Assets (ROA) (%) 0.06 0.10 1.24 9.51 0.04 0.01 0.00 0.00 0.00 Segment Cost of funds (%) 0.02 0.03 0.34 10.24 0.01 0.00 0.00 0.00 0.26
Assumptions used:
– Administrative expenses have been allocated to segments based on respective segment income.
– Unallocatable assets representing 2.02% (2009: 4.99%) of the total assets have been allocated to segments based on their respective incomes.
– Unallocatable liabilities representing 2.10% (2009: 1.29%) of the total liabilities have been allocated to segments based on their respective assets.
42. TRUST ACTIVITIES The Bank is not engaged in any significant trust activities. However, the Bank acts as security agent for some of the
Term Finance Certificates it arranges and distributes on behalf of its customers.
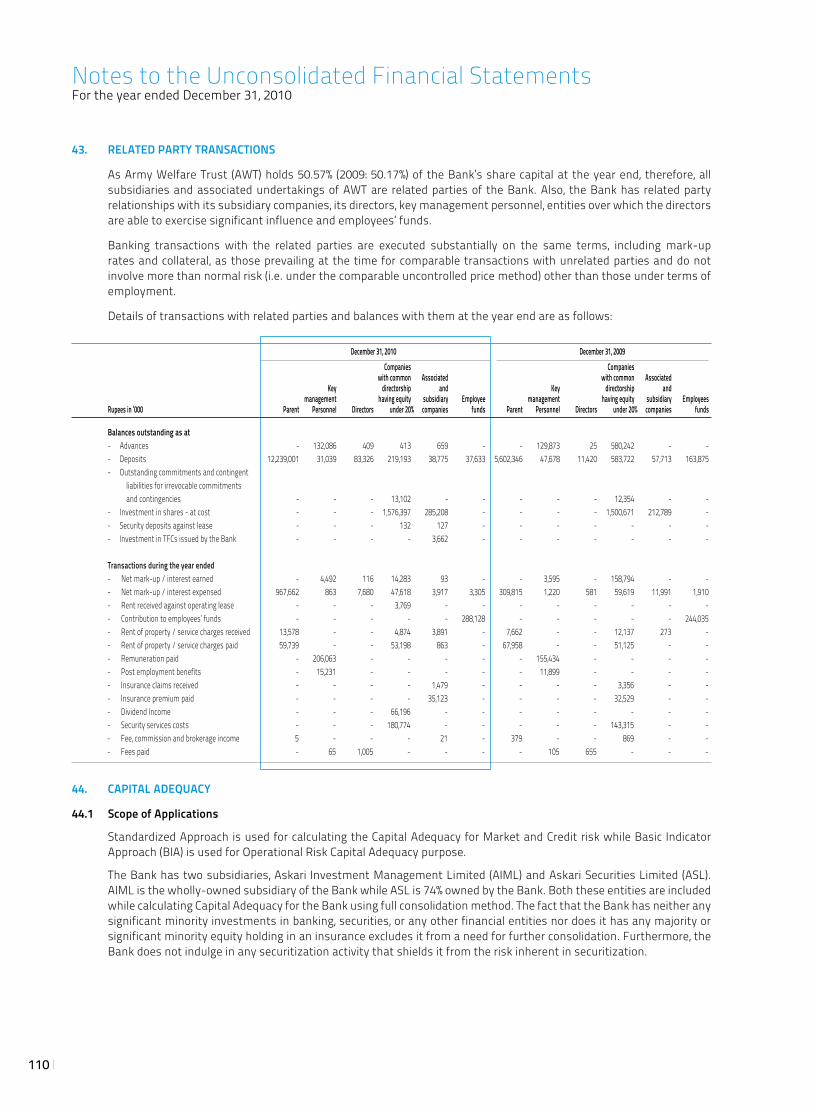
110
43. RELATED PARTY TRANSACTIONS
As Army Welfare Trust (AWT) holds 50.57% (2009: 50.17%) of the Bank’s share capital at the year end, therefore, all subsidiaries and associated undertakings of AWT are related parties of the Bank. Also, the Bank has related party relationships with its subsidiary companies, its directors, key management personnel, entities over which the directors are able to exercise significant influence and employees’ funds.
Banking transactions with the related parties are executed substantially on the same terms, including mark-up rates and collateral, as those prevailing at the time for comparable transactions with unrelated parties and do not involve more than normal risk (i.e. under the comparable uncontrolled price method) other than those under terms of employment.
Details of transactions with related parties and balances with them at the year end are as follows:
December 31, 2010 December 31, 2009 Companies Companies with common Associated with common Associated Key directorship and Key directorship and management having equity subsidiary Employee management having equity subsidiary Employees Rupees in ‘000 Parent Personnel Directors under 20% companies funds Parent Personnel Directors under 20% companies funds
Balances outstanding as at - Advances - 132,086 409 413 659 - - 129,873 25 580,242 - - - Deposits 12,239,001 31,039 83,326 219,193 38,775 37,633 5,602,346 47,678 11,420 583,722 57,713 163,875 - Outstanding commitments and contingent liabilities for irrevocable commitments and contingencies - - - 13,102 - - - - - 12,354 - - - Investment in shares - at cost - - - 1,576,397 285,208 - - - - 1,500,671 212,789 - - Security deposits against lease - - - 132 127 - - - - - - - - Investment in TFCs issued by the Bank - - - - 3,662 - - - - - - - Transactions during the year ended - Net mark-up / interest earned - 4,492 116 14,283 93 - - 3,595 - 158,794 - - - Net mark-up / interest expensed 967,662 863 7,680 47,618 3,917 3,305 309,815 1,220 581 59,619 11,991 1,910 - Rent received against operating lease - - - 3,769 - - - - - - - - - Contribution to employees’ funds - - - - - 288,128 - - - - - 244,035 - Rent of property / service charges received 13,578 - - 4,874 3,891 - 7,662 - - 12,137 273 - - Rent of property / service charges paid 59,739 - - 53,198 863 - 67,958 - - 51,125 - - - Remuneration paid - 206,063 - - - - - 155,434 - - - - - Post employment benefits - 15,231 - - - - - 11,899 - - - - - Insurance claims received - - - - 1,479 - - - - 3,356 - - - Insurance premium paid - - - - 35,123 - - - - 32,529 - - - Dividend Income - - - 66,196 - - - - - - - - - Security services costs - - - 180,774 - - - - - 143,315 - - - Fee, commission and brokerage income 5 - - - 21 - 379 - - 869 - - - Fees paid - 65 1,005 - - - - 105 655 - - -
44. CAPITAL ADEQUACY
44.1 Scope of Applications
Standardized Approach is used for calculating the Capital Adequacy for Market and Credit risk while Basic Indicator Approach (BIA) is used for Operational Risk Capital Adequacy purpose.
The Bank has two subsidiaries, Askari Investment Management Limited (AIML) and Askari Securities Limited (ASL).AIML is the wholly-owned subsidiary of the Bank while ASL is 74% owned by the Bank. Both these entities are included while calculating Capital Adequacy for the Bank using full consolidation method. The fact that the Bank has neither any significant minority investments in banking, securities, or any other financial entities nor does it has any majority or significant minority equity holding in an insurance excludes it from a need for further consolidation. Furthermore, the Bank does not indulge in any securitization activity that shields it from the risk inherent in securitization.
Notes to the Unconsolidated Financial StatementsFor the year ended December 31, 2010
111
44.2 Capital Management The objective of managing capital is to safeguard the Bank’s ability to continue as a going concern, so that it could
continue to provide adequate returns to shareholders by pricing products and services commensurately with the level of risk. It is the policy of the Bank to maintain a strong capital base so as to maintain investor, creditor and market confidence and to sustain future development of the business. The impact of the level of capital on shareholders’ return is also recognised and the Bank recognises the need to maintain a balance between the higher returns that might be possible with greater gearing and the advantages and security afforded by a sound capital position.
Goals of managing capital
The goals of managing capital of the Bank are as follows:
- To be an appropriately capitalised institution, considering the requirements set by the regulators of the banking markets where the Bank operates;
- Maintain strong ratings and to protect the Bank against unexpected events;
- Availability of adequate capital at a reasonable cost so as to enable the Bank to operate adequately and provide reasonable value added for the shareholders and other stakeholders;
Bank’s regulatory capital analysed into three tiers
Tier I capital, which includes fully paid-up capital, share premium, reserves (excluding foreign exchange translation reserve) and unappropriated profits (net of losses) etc. after deductions for certain specified items such as book value of intangibles, 50% of other deductions e.g., majority and significant minority investments in insurance and other financial entities.
Tier II capital, includes sub-ordinated debt subject to a maximum of 50% of total Tier I capital and fulfillment of specified criteria laid down by the State Bank of Pakistan, general provisions for loan losses and capital reserves originated by restructuring of facilities (up to a maximum of 1.25% of total risk weighted assets), reserves on the revaluation of fixed assets and equity investments after deduction of deficit on available for sale investments (up to a maximum of 45 percent), foreign exchange translation reserve etc. 50% of other deductions noted above are also made from Tier II capital.
Tier III supplementary capital, which consists of short term sub-ordinated debt solely for the purpose of meeting a proportion of the capital requirements for market risks. The bank currently does not have any Tier III capital.
The total of Tier II and Tier III capital has to be limited to Tier I capital.
Banking operations are categorised as either trading book or banking book and risk-weighted assets are determined according to specified requirements of the State Bank of Pakistan that seek to reflect the varying levels of risk attached to on-balance sheet and off-balance sheet exposures. The total risk-weighted exposures comprise the credit risk, market risk and operational risk.
On and off-balance sheet assets in the banking book are broken down to various asset classes for calculation of credit risk requirement. External ratings for assets, where available, are applied using the assessments by various External Credit Assesment Institutions (ECAIs) and aligned with appropriate risk buckets. Otherwise, the exposures are treated as unrated and relevant risk weights applied. In addition, there are fixed risk weights for certain types of exposures such as retail portfolio and residential mortgage finance for which external ratings are not applicable. Collaterals if any, are used as credit risk mitigant after applying appropriate haircuts under the Comprehensive Approach. Risk weights notified, are hence applied at adjusted exposures, wherever credit risk mitigation is available. Collaterals used include: Government of Pakistan guarantees, cash, lien on deposits, shares, government securities, bank and corporate guarantees and other debt securities that fall within the definition of eligible collaterals and also fulfill other specified criteria under the relevant capital adequacy guidelines.
The calculation of Capital Adequacy enables the Bank to assess the long-term soundness. As the Bank carries on the business on a wide area network basis, it is critical that it is able to continuously monitor the exposure across the entire organisation and aggregate the risks so as to take an integrated approach / view. There has been no material change in the Bank’s management of capital during the period.
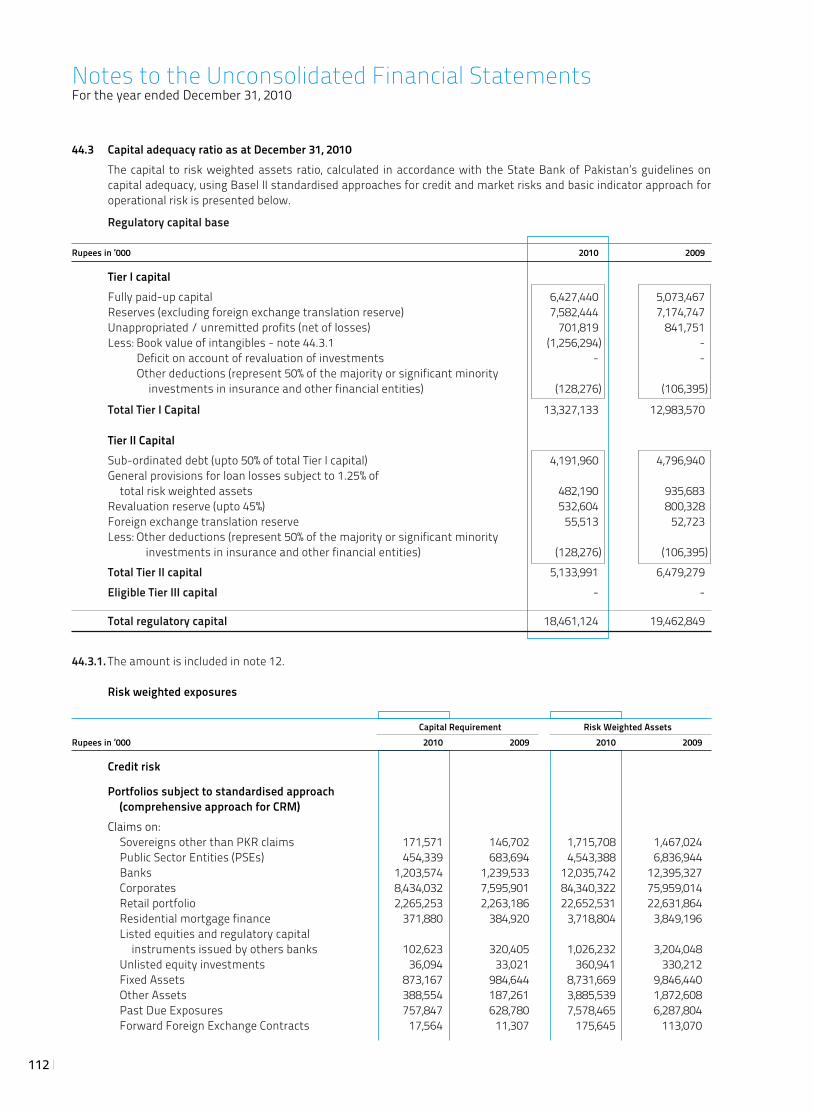
112
44.3 Capital adequacy ratio as at December 31, 2010 The capital to risk weighted assets ratio, calculated in accordance with the State Bank of Pakistan’s guidelines on
capital adequacy, using Basel II standardised approaches for credit and market risks and basic indicator approach for operational risk is presented below.
Regulatory capital base
Rupees in ‘000 2010 2009
Tier I capital Fully paid-up capital 6,427,440 5,073,467 Reserves (excluding foreign exchange translation reserve) 7,582,444 7,174,747 Unappropriated / unremitted profits (net of losses) 701,819 841,751 Less: Book value of intangibles - note 44.3.1 (1,256,294) - Deficit on account of revaluation of investments - - Other deductions (represent 50% of the majority or significant minority investments in insurance and other financial entities) (128,276) (106,395)
Total Tier I Capital 13,327,133 12,983,570 Tier II Capital Sub-ordinated debt (upto 50% of total Tier I capital) 4,191,960 4,796,940 General provisions for loan losses subject to 1.25% of
total risk weighted assets 482,190 935,683 Revaluation reserve (upto 45%) 532,604 800,328 Foreign exchange translation reserve 55,513 52,723 Less: Other deductions (represent 50% of the majority or significant minority investments in insurance and other financial entities) (128,276) (106,395) Total Tier II capital 5,133,991 6,479,279 Eligible Tier III capital - -
Total regulatory capital 18,461,124 19,462,849
44.3.1. The amount is included in note 12. Risk weighted exposures
Capital Requirement Risk Weighted AssetsRupees in ‘000 2010 2009 2010 2009
Credit risk
Portfolios subject to standardised approach (comprehensive approach for CRM) Claims on: Sovereigns other than PKR claims 171,571 146,702 1,715,708 1,467,024 Public Sector Entities (PSEs) 454,339 683,694 4,543,388 6,836,944 Banks 1,203,574 1,239,533 12,035,742 12,395,327 Corporates 8,434,032 7,595,901 84,340,322 75,959,014 Retail portfolio 2,265,253 2,263,186 22,652,531 22,631,864 Residential mortgage finance 371,880 384,920 3,718,804 3,849,196 Listed equities and regulatory capital
instruments issued by others banks 102,623 320,405 1,026,232 3,204,048 Unlisted equity investments 36,094 33,021 360,941 330,212 Fixed Assets 873,167 984,644 8,731,669 9,846,440 Other Assets 388,554 187,261 3,885,539 1,872,608 Past Due Exposures 757,847 628,780 7,578,465 6,287,804 Forward Foreign Exchange Contracts 17,564 11,307 175,645 113,070
Notes to the Unconsolidated Financial StatementsFor the year ended December 31, 2010
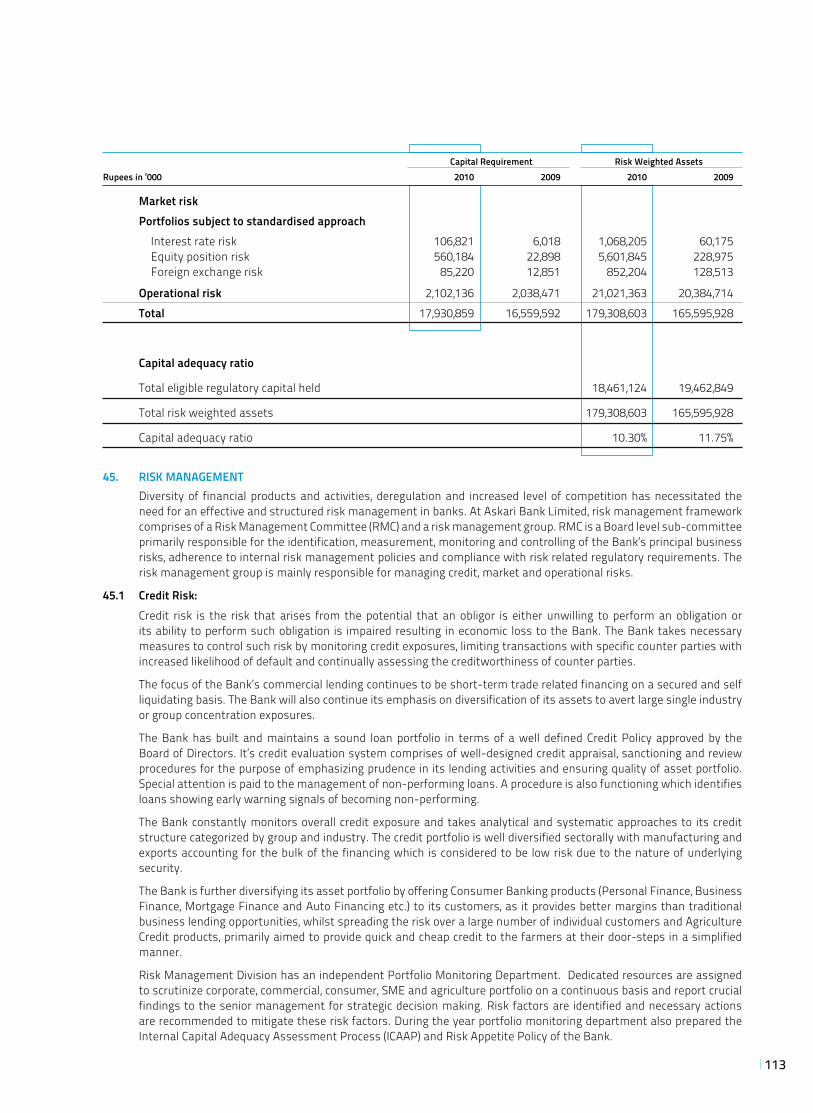
113
Capital Requirement Risk Weighted AssetsRupees in ‘000 2010 2009 2010 2009
Market risk Portfolios subject to standardised approach Interest rate risk 106,821 6,018 1,068,205 60,175 Equity position risk 560,184 22,898 5,601,845 228,975 Foreign exchange risk 85,220 12,851 852,204 128,513
Operational risk 2,102,136 2,038,471 21,021,363 20,384,714 Total 17,930,859 16,559,592 179,308,603 165,595,928
Capital adequacy ratio
Total eligible regulatory capital held 18,461,124 19,462,849
Total risk weighted assets 179,308,603 165,595,928
Capital adequacy ratio 10.30% 11.75%
45. RISK MANAGEMENT Diversity of financial products and activities, deregulation and increased level of competition has necessitated the
need for an effective and structured risk management in banks. At Askari Bank Limited, risk management framework comprises of a Risk Management Committee (RMC) and a risk management group. RMC is a Board level sub-committee primarily responsible for the identification, measurement, monitoring and controlling of the Bank’s principal business risks, adherence to internal risk management policies and compliance with risk related regulatory requirements. The risk management group is mainly responsible for managing credit, market and operational risks.
45.1 Credit Risk: Credit risk is the risk that arises from the potential that an obligor is either unwilling to perform an obligation or
its ability to perform such obligation is impaired resulting in economic loss to the Bank. The Bank takes necessary measures to control such risk by monitoring credit exposures, limiting transactions with specific counter parties with increased likelihood of default and continually assessing the creditworthiness of counter parties.
The focus of the Bank’s commercial lending continues to be short-term trade related financing on a secured and self liquidating basis. The Bank will also continue its emphasis on diversification of its assets to avert large single industry or group concentration exposures.
The Bank has built and maintains a sound loan portfolio in terms of a well defined Credit Policy approved by the Board of Directors. It’s credit evaluation system comprises of well-designed credit appraisal, sanctioning and review procedures for the purpose of emphasizing prudence in its lending activities and ensuring quality of asset portfolio. Special attention is paid to the management of non-performing loans. A procedure is also functioning which identifies loans showing early warning signals of becoming non-performing.
The Bank constantly monitors overall credit exposure and takes analytical and systematic approaches to its credit structure categorized by group and industry. The credit portfolio is well diversified sectorally with manufacturing and exports accounting for the bulk of the financing which is considered to be low risk due to the nature of underlying security.
The Bank is further diversifying its asset portfolio by offering Consumer Banking products (Personal Finance, Business Finance, Mortgage Finance and Auto Financing etc.) to its customers, as it provides better margins than traditional business lending opportunities, whilst spreading the risk over a large number of individual customers and Agriculture Credit products, primarily aimed to provide quick and cheap credit to the farmers at their door-steps in a simplified manner.
Risk Management Division has an independent Portfolio Monitoring Department. Dedicated resources are assigned to scrutinize corporate, commercial, consumer, SME and agriculture portfolio on a continuous basis and report crucial findings to the senior management for strategic decision making. Risk factors are identified and necessary actions are recommended to mitigate these risk factors. During the year portfolio monitoring department also prepared the Internal Capital Adequacy Assessment Process (ICAAP) and Risk Appetite Policy of the Bank.
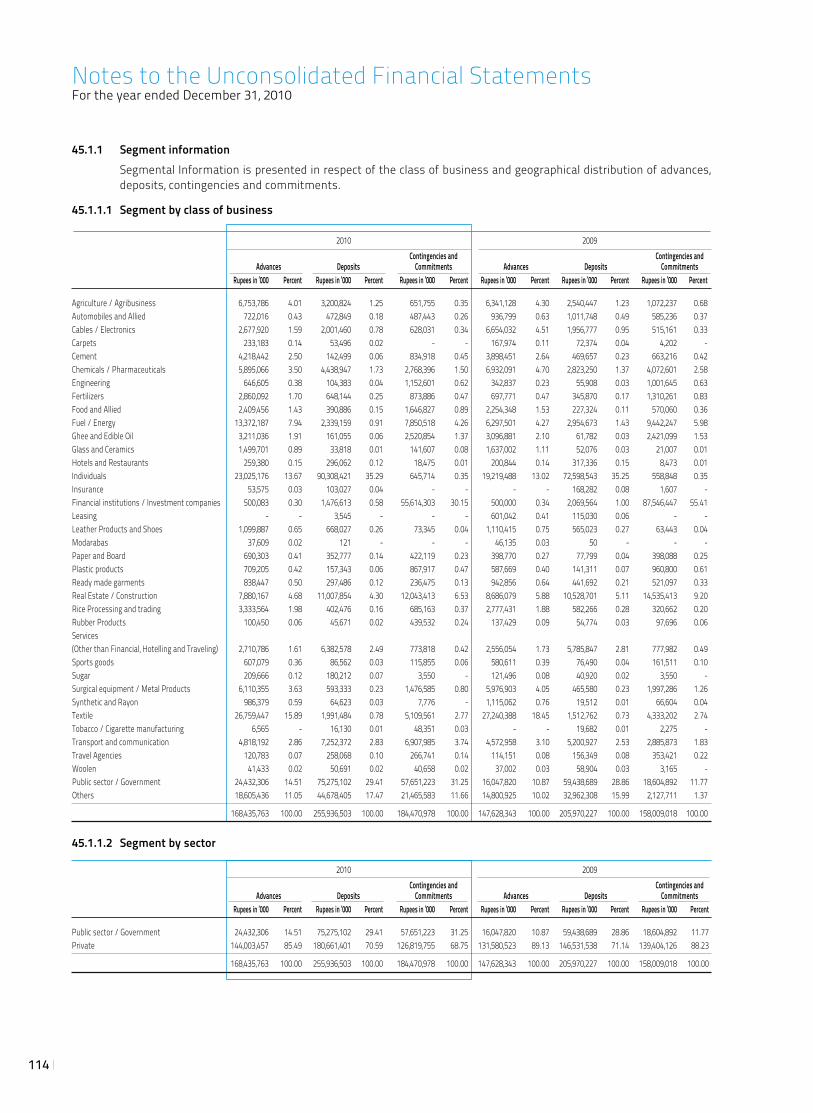
114
45.1.1 Segment information Segmental Information is presented in respect of the class of business and geographical distribution of advances,
deposits, contingencies and commitments.
45.1.1.1 Segment by class of business
2010 2009 Contingencies and Contingencies and Advances Deposits Commitments Advances Deposits Commitments Rupees in ‘000 Percent Rupees in ‘000 Percent Rupees in ‘000 Percent Rupees in ‘000 Percent Rupees in ‘000 Percent Rupees in ‘000 Percent
Agriculture / Agribusiness 6,753,786 4.01 3,200,824 1.25 651,755 0.35 6,341,128 4.30 2,540,447 1.23 1,072,237 0.68 Automobiles and Allied 722,016 0.43 472,849 0.18 487,443 0.26 936,799 0.63 1,011,748 0.49 585,236 0.37 Cables / Electronics 2,677,920 1.59 2,001,460 0.78 628,031 0.34 6,654,032 4.51 1,956,777 0.95 515,161 0.33 Carpets 233,183 0.14 53,496 0.02 - - 167,974 0.11 72,374 0.04 4,202 - Cement 4,218,442 2.50 142,499 0.06 834,918 0.45 3,898,451 2.64 469,657 0.23 663,216 0.42 Chemicals / Pharmaceuticals 5,895,066 3.50 4,438,947 1.73 2,768,396 1.50 6,932,091 4.70 2,823,250 1.37 4,072,601 2.58 Engineering 646,605 0.38 104,383 0.04 1,152,601 0.62 342,837 0.23 55,908 0.03 1,001,645 0.63 Fertilizers 2,860,092 1.70 648,144 0.25 873,886 0.47 697,771 0.47 345,870 0.17 1,310,261 0.83 Food and Allied 2,409,456 1.43 390,886 0.15 1,646,827 0.89 2,254,348 1.53 227,324 0.11 570,060 0.36 Fuel / Energy 13,372,187 7.94 2,339,159 0.91 7,850,518 4.26 6,297,501 4.27 2,954,673 1.43 9,442,247 5.98 Ghee and Edible Oil 3,211,036 1.91 161,055 0.06 2,520,854 1.37 3,096,881 2.10 61,782 0.03 2,421,099 1.53 Glass and Ceramics 1,499,701 0.89 33,818 0.01 141,607 0.08 1,637,002 1.11 52,076 0.03 21,007 0.01 Hotels and Restaurants 259,380 0.15 296,062 0.12 18,475 0.01 200,844 0.14 317,336 0.15 8,473 0.01 Individuals 23,025,176 13.67 90,308,421 35.29 645,714 0.35 19,219,488 13.02 72,598,543 35.25 558,848 0.35 Insurance 53,575 0.03 103,027 0.04 - - - - 168,282 0.08 1,607 - Financial institutions / Investment companies 500,083 0.30 1,476,613 0.58 55,614,303 30.15 500,000 0.34 2,069,564 1.00 87,546,447 55.41 Leasing - - 3,545 - - - 601,042 0.41 115,030 0.06 - - Leather Products and Shoes 1,099,887 0.65 668,027 0.26 73,345 0.04 1,110,415 0.75 565,023 0.27 63,443 0.04 Modarabas 37,609 0.02 121 - - - 46,135 0.03 50 - - - Paper and Board 690,303 0.41 352,777 0.14 422,119 0.23 398,770 0.27 77,799 0.04 398,088 0.25 Plastic products 709,205 0.42 157,343 0.06 867,917 0.47 587,669 0.40 141,311 0.07 960,800 0.61 Ready made garments 838,447 0.50 297,486 0.12 236,475 0.13 942,856 0.64 441,692 0.21 521,097 0.33 Real Estate / Construction 7,880,167 4.68 11,007,854 4.30 12,043,413 6.53 8,686,079 5.88 10,528,701 5.11 14,535,413 9.20 Rice Processing and trading 3,333,564 1.98 402,476 0.16 685,163 0.37 2,777,431 1.88 582,266 0.28 320,662 0.20 Rubber Products 100,450 0.06 45,671 0.02 439,532 0.24 137,429 0.09 54,774 0.03 97,696 0.06 Services (Other than Financial, Hotelling and Traveling) 2,710,786 1.61 6,382,578 2.49 773,818 0.42 2,556,054 1.73 5,785,847 2.81 777,982 0.49 Sports goods 607,079 0.36 86,562 0.03 115,855 0.06 580,611 0.39 76,490 0.04 161,511 0.10 Sugar 209,666 0.12 180,212 0.07 3,550 - 121,496 0.08 40,920 0.02 3,550 -Surgical equipment / Metal Products 6,110,355 3.63 593,333 0.23 1,476,585 0.80 5,976,903 4.05 465,580 0.23 1,997,286 1.26 Synthetic and Rayon 986,379 0.59 64,623 0.03 7,776 - 1,115,062 0.76 19,512 0.01 66,604 0.04 Textile 26,759,447 15.89 1,991,484 0.78 5,109,561 2.77 27,240,388 18.45 1,512,762 0.73 4,333,202 2.74 Tobacco / Cigarette manufacturing 6,565 - 16,130 0.01 48,351 0.03 - - 19,682 0.01 2,275 - Transport and communication 4,818,192 2.86 7,252,372 2.83 6,907,985 3.74 4,572,958 3.10 5,200,927 2.53 2,885,873 1.83 Travel Agencies 120,783 0.07 258,068 0.10 266,741 0.14 114,151 0.08 156,349 0.08 353,421 0.22 Woolen 41,433 0.02 50,691 0.02 40,658 0.02 37,002 0.03 58,904 0.03 3,165 - Public sector / Government 24,432,306 14.51 75,275,102 29.41 57,651,223 31.25 16,047,820 10.87 59,438,689 28.86 18,604,892 11.77 Others 18,605,436 11.05 44,678,405 17.47 21,465,583 11.66 14,800,925 10.02 32,962,308 15.99 2,127,711 1.37
168,435,763 100.00 255,936,503 100.00 184,470,978 100.00 147,628,343 100.00 205,970,227 100.00 158,009,018 100.00
45.1.1.2 Segment by sector
2010 2009 Contingencies and Contingencies and Advances Deposits Commitments Advances Deposits Commitments Rupees in ‘000 Percent Rupees in ‘000 Percent Rupees in ‘000 Percent Rupees in ‘000 Percent Rupees in ‘000 Percent Rupees in ‘000 Percent
Public sector / Government 24,432,306 14.51 75,275,102 29.41 57,651,223 31.25 16,047,820 10.87 59,438,689 28.86 18,604,892 11.77 Private 144,003,457 85.49 180,661,401 70.59 126,819,755 68.75 131,580,523 89.13 146,531,538 71.14 139,404,126 88.23
168,435,763 100.00 255,936,503 100.00 184,470,978 100.00 147,628,343 100.00 205,970,227 100.00 158,009,018 100.00
Notes to the Unconsolidated Financial StatementsFor the year ended December 31, 2010
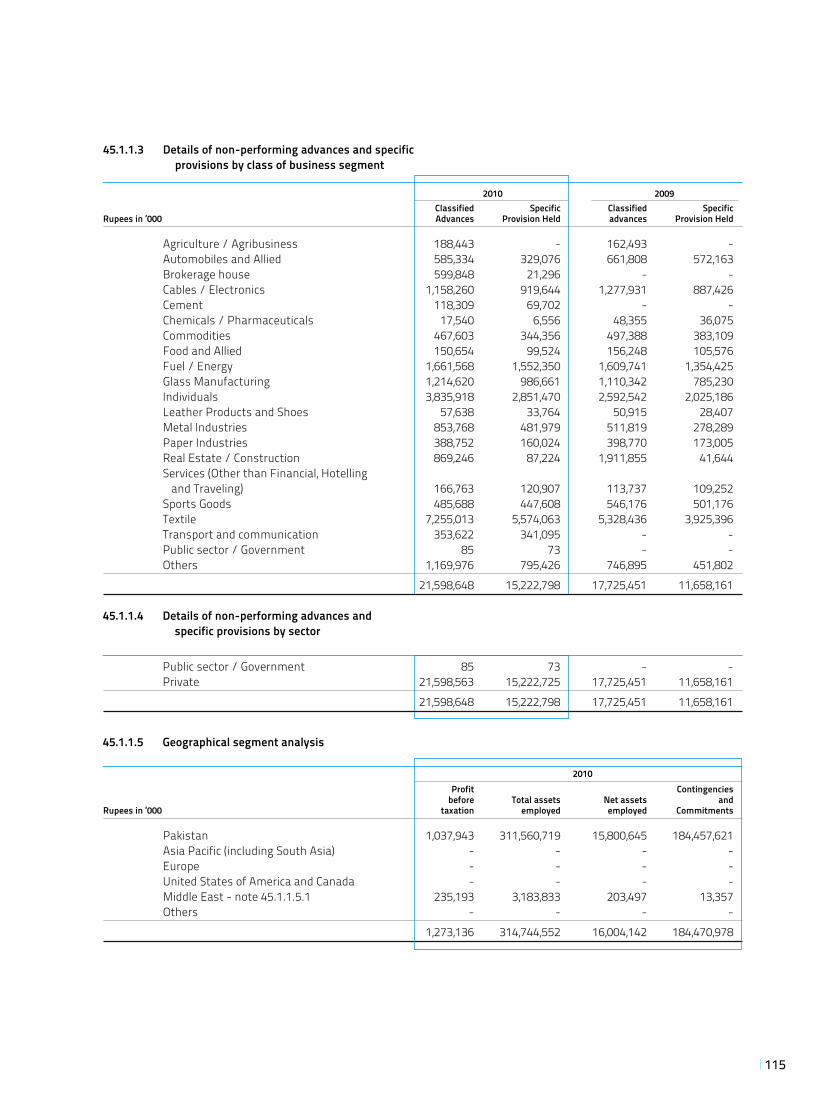
115
45.1.1.3 Details of non-performing advances and specific provisions by class of business segment
2010 2009 Classified Specific Classified Specific Rupees in ‘000 Advances Provision Held advances Provision Held Agriculture / Agribusiness 188,443 - 162,493 - Automobiles and Allied 585,334 329,076 661,808 572,163 Brokerage house 599,848 21,296 - - Cables / Electronics 1,158,260 919,644 1,277,931 887,426 Cement 118,309 69,702 - - Chemicals / Pharmaceuticals 17,540 6,556 48,355 36,075 Commodities 467,603 344,356 497,388 383,109 Food and Allied 150,654 99,524 156,248 105,576 Fuel / Energy 1,661,568 1,552,350 1,609,741 1,354,425 Glass Manufacturing 1,214,620 986,661 1,110,342 785,230 Individuals 3,835,918 2,851,470 2,592,542 2,025,186 Leather Products and Shoes 57,638 33,764 50,915 28,407 Metal Industries 853,768 481,979 511,819 278,289 Paper Industries 388,752 160,024 398,770 173,005 Real Estate / Construction 869,246 87,224 1,911,855 41,644 Services (Other than Financial, Hotelling
and Traveling) 166,763 120,907 113,737 109,252 Sports Goods 485,688 447,608 546,176 501,176 Textile 7,255,013 5,574,063 5,328,436 3,925,396 Transport and communication 353,622 341,095 - - Public sector / Government 85 73 - - Others 1,169,976 795,426 746,895 451,802 21,598,648 15,222,798 17,725,451 11,658,161
45.1.1.4 Details of non-performing advances and specific provisions by sector
Public sector / Government 85 73 - - Private 21,598,563 15,222,725 17,725,451 11,658,161 21,598,648 15,222,798 17,725,451 11,658,161
45.1.1.5 Geographical segment analysis
2010 Profit Contingencies before Total assets Net assets and Rupees in ‘000 taxation employed employed Commitments Pakistan 1,037,943 311,560,719 15,800,645 184,457,621 Asia Pacific (including South Asia) - - - - Europe - - - - United States of America and Canada - - - - Middle East - note 45.1.1.5.1 235,193 3,183,833 203,497 13,357 Others - - - - 1,273,136 314,744,552 16,004,142 184,470,978
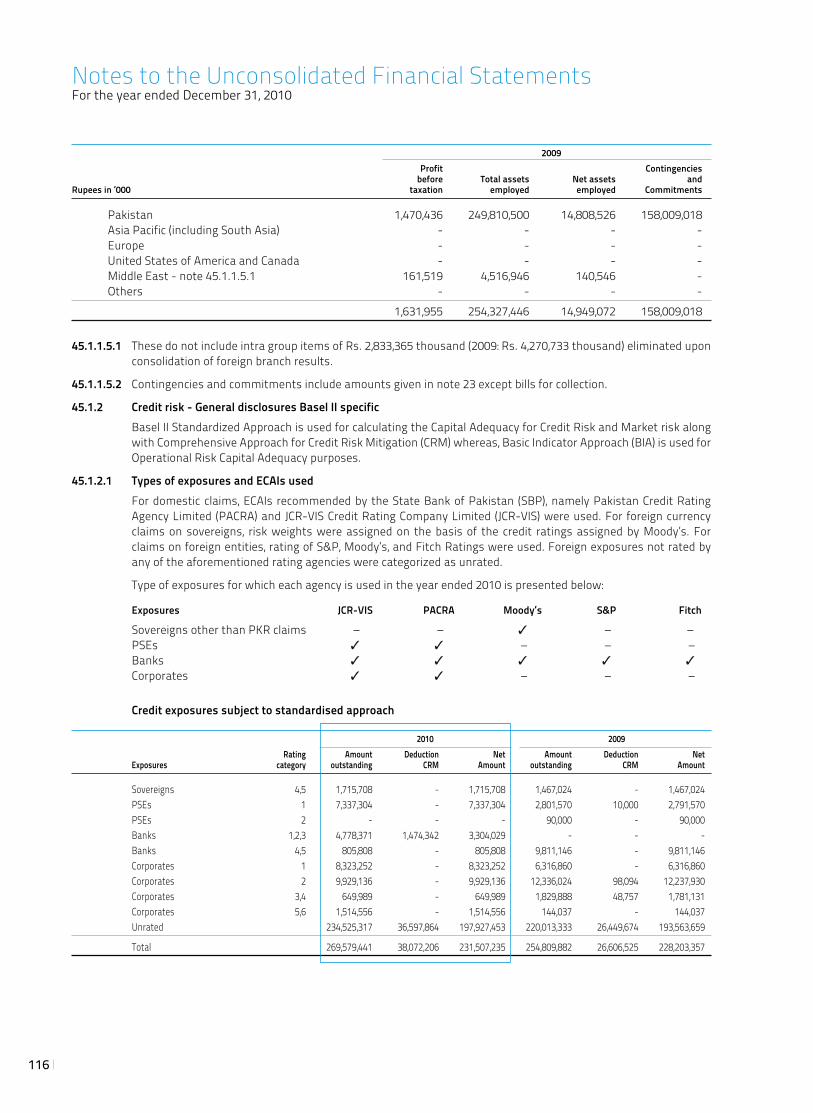
116
2009 Profit Contingencies before Total assets Net assets and Rupees in ‘000 taxation employed employed Commitments Pakistan 1,470,436 249,810,500 14,808,526 158,009,018 Asia Pacific (including South Asia) - - - - Europe - - - - United States of America and Canada - - - - Middle East - note 45.1.1.5.1 161,519 4,516,946 140,546 - Others - - - - 1,631,955 254,327,446 14,949,072 158,009,018
45.1.1.5.1 These do not include intra group items of Rs. 2,833,365 thousand (2009: Rs. 4,270,733 thousand) eliminated upon consolidation of foreign branch results.
45.1.1.5.2 Contingencies and commitments include amounts given in note 23 except bills for collection.
45.1.2 Credit risk - General disclosures Basel II specific Basel II Standardized Approach is used for calculating the Capital Adequacy for Credit Risk and Market risk along
with Comprehensive Approach for Credit Risk Mitigation (CRM) whereas, Basic Indicator Approach (BIA) is used for Operational Risk Capital Adequacy purposes.
45.1.2.1 Types of exposures and ECAIs used For domestic claims, ECAIs recommended by the State Bank of Pakistan (SBP), namely Pakistan Credit Rating
Agency Limited (PACRA) and JCR-VIS Credit Rating Company Limited (JCR-VIS) were used. For foreign currency claims on sovereigns, risk weights were assigned on the basis of the credit ratings assigned by Moody’s. For claims on foreign entities, rating of S&P, Moody’s, and Fitch Ratings were used. Foreign exposures not rated by any of the aforementioned rating agencies were categorized as unrated.
Type of exposures for which each agency is used in the year ended 2010 is presented below:
Exposures JCR-VIS PACRA Moody’s S&P Fitch
Sovereigns other than PKR claims – – 3 – – PSEs 3 3 – – – Banks 3 3 3 3 3
Corporates 3 3 – – –
Credit exposures subject to standardised approach
2010 2009 Rating Amount Deduction Net Amount Deduction Net Exposures category outstanding CRM Amount outstanding CRM Amount
Sovereigns 4,5 1,715,708 - 1,715,708 1,467,024 - 1,467,024 PSEs 1 7,337,304 - 7,337,304 2,801,570 10,000 2,791,570 PSEs 2 - - - 90,000 - 90,000 Banks 1,2,3 4,778,371 1,474,342 3,304,029 - - - Banks 4,5 805,808 - 805,808 9,811,146 - 9,811,146 Corporates 1 8,323,252 - 8,323,252 6,316,860 - 6,316,860 Corporates 2 9,929,136 - 9,929,136 12,336,024 98,094 12,237,930 Corporates 3,4 649,989 - 649,989 1,829,888 48,757 1,781,131 Corporates 5,6 1,514,556 - 1,514,556 144,037 - 144,037 Unrated 234,525,317 36,597,864 197,927,453 220,013,333 26,449,674 193,563,659
Total 269,579,441 38,072,206 231,507,235 254,809,882 26,606,525 228,203,357
Notes to the Unconsolidated Financial StatementsFor the year ended December 31, 2010
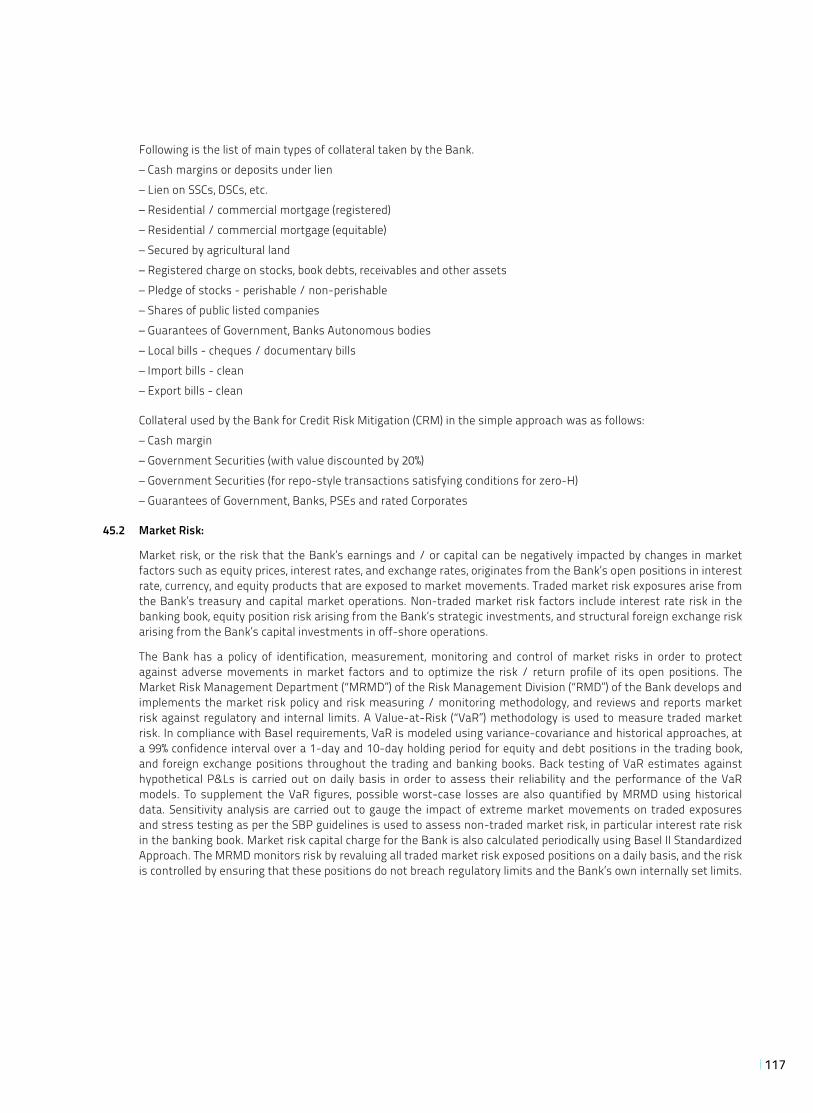
117
Following is the list of main types of collateral taken by the Bank. – Cash margins or deposits under lien – Lien on SSCs, DSCs, etc. – Residential / commercial mortgage (registered) – Residential / commercial mortgage (equitable) – Secured by agricultural land – Registered charge on stocks, book debts, receivables and other assets – Pledge of stocks - perishable / non-perishable – Shares of public listed companies – Guarantees of Government, Banks Autonomous bodies – Local bills - cheques / documentary bills – Import bills - clean – Export bills - clean
Collateral used by the Bank for Credit Risk Mitigation (CRM) in the simple approach was as follows: – Cash margin – Government Securities (with value discounted by 20%) – Government Securities (for repo-style transactions satisfying conditions for zero-H) – Guarantees of Government, Banks, PSEs and rated Corporates
45.2 Market Risk:
Market risk, or the risk that the Bank’s earnings and / or capital can be negatively impacted by changes in market factors such as equity prices, interest rates, and exchange rates, originates from the Bank’s open positions in interest rate, currency, and equity products that are exposed to market movements. Traded market risk exposures arise from the Bank’s treasury and capital market operations. Non-traded market risk factors include interest rate risk in the banking book, equity position risk arising from the Bank’s strategic investments, and structural foreign exchange risk arising from the Bank’s capital investments in off-shore operations.
The Bank has a policy of identification, measurement, monitoring and control of market risks in order to protect against adverse movements in market factors and to optimize the risk / return profile of its open positions. The Market Risk Management Department (“MRMD”) of the Risk Management Division (“RMD”) of the Bank develops and implements the market risk policy and risk measuring / monitoring methodology, and reviews and reports market risk against regulatory and internal limits. A Value-at-Risk (“VaR”) methodology is used to measure traded market risk. In compliance with Basel requirements, VaR is modeled using variance-covariance and historical approaches, at a 99% confidence interval over a 1-day and 10-day holding period for equity and debt positions in the trading book, and foreign exchange positions throughout the trading and banking books. Back testing of VaR estimates against hypothetical P&Ls is carried out on daily basis in order to assess their reliability and the performance of the VaR models. To supplement the VaR figures, possible worst-case losses are also quantified by MRMD using historical data. Sensitivity analysis are carried out to gauge the impact of extreme market movements on traded exposures and stress testing as per the SBP guidelines is used to assess non-traded market risk, in particular interest rate risk in the banking book. Market risk capital charge for the Bank is also calculated periodically using Basel II Standardized Approach. The MRMD monitors risk by revaluing all traded market risk exposed positions on a daily basis, and the risk is controlled by ensuring that these positions do not breach regulatory limits and the Bank’s own internally set limits.
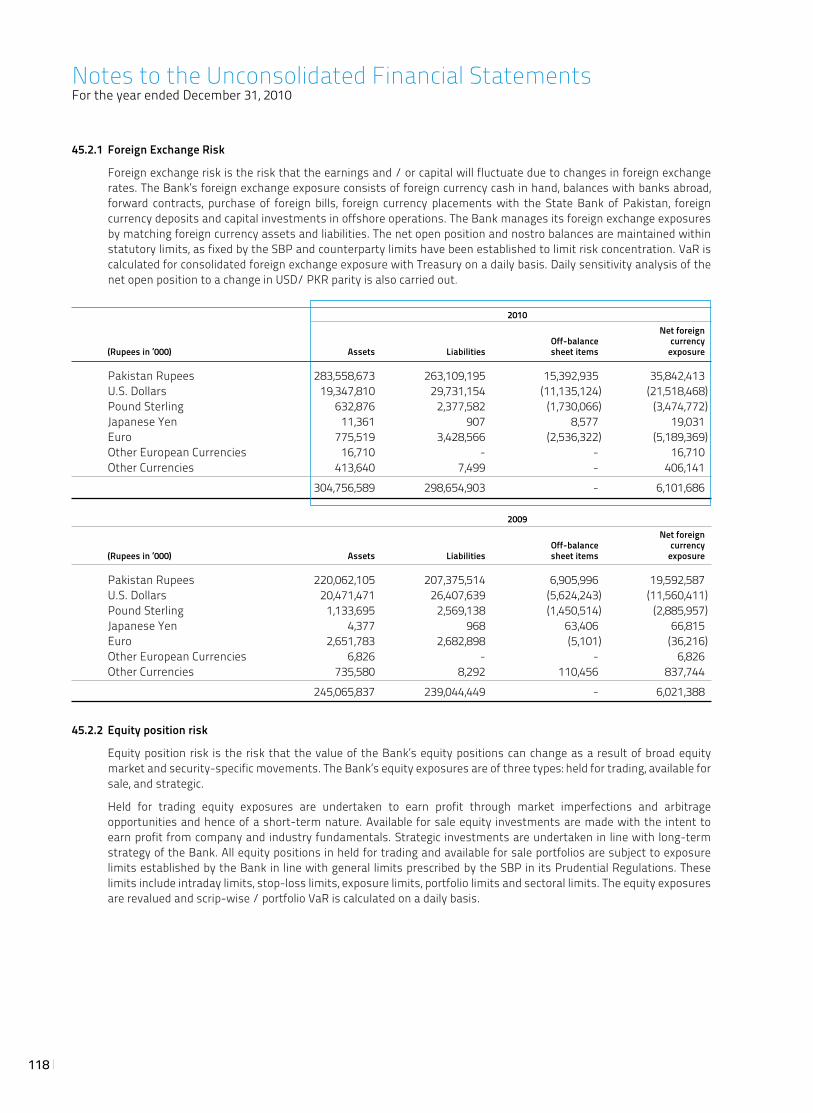
118
45.2.1 Foreign Exchange Risk
Foreign exchange risk is the risk that the earnings and / or capital will fluctuate due to changes in foreign exchange rates. The Bank’s foreign exchange exposure consists of foreign currency cash in hand, balances with banks abroad, forward contracts, purchase of foreign bills, foreign currency placements with the State Bank of Pakistan, foreign currency deposits and capital investments in offshore operations. The Bank manages its foreign exchange exposures by matching foreign currency assets and liabilities. The net open position and nostro balances are maintained within statutory limits, as fixed by the SBP and counterparty limits have been established to limit risk concentration. VaR is calculated for consolidated foreign exchange exposure with Treasury on a daily basis. Daily sensitivity analysis of the net open position to a change in USD/ PKR parity is also carried out.
2010 Net foreign Off-balance currency (Rupees in ‘000) Assets Liabilities sheet items exposure
Pakistan Rupees 283,558,673 263,109,195 15,392,935 35,842,413 U.S. Dollars 19,347,810 29,731,154 (11,135,124) (21,518,468) Pound Sterling 632,876 2,377,582 (1,730,066) (3,474,772) Japanese Yen 11,361 907 8,577 19,031 Euro 775,519 3,428,566 (2,536,322) (5,189,369) Other European Currencies 16,710 - - 16,710 Other Currencies 413,640 7,499 - 406,141 304,756,589 298,654,903 - 6,101,686
2009 Net foreign Off-balance currency (Rupees in ‘000) Assets Liabilities sheet items exposure
Pakistan Rupees 220,062,105 207,375,514 6,905,996 19,592,587 U.S. Dollars 20,471,471 26,407,639 (5,624,243) (11,560,411) Pound Sterling 1,133,695 2,569,138 (1,450,514) (2,885,957) Japanese Yen 4,377 968 63,406 66,815 Euro 2,651,783 2,682,898 (5,101) (36,216) Other European Currencies 6,826 - - 6,826 Other Currencies 735,580 8,292 110,456 837,744 245,065,837 239,044,449 - 6,021,388
45.2.2 Equity position risk
Equity position risk is the risk that the value of the Bank’s equity positions can change as a result of broad equity market and security-specific movements. The Bank’s equity exposures are of three types: held for trading, available for sale, and strategic.
Held for trading equity exposures are undertaken to earn profit through market imperfections and arbitrage opportunities and hence of a short-term nature. Available for sale equity investments are made with the intent to earn profit from company and industry fundamentals. Strategic investments are undertaken in line with long-term strategy of the Bank. All equity positions in held for trading and available for sale portfolios are subject to exposure limits established by the Bank in line with general limits prescribed by the SBP in its Prudential Regulations. These limits include intraday limits, stop-loss limits, exposure limits, portfolio limits and sectoral limits. The equity exposures are revalued and scrip-wise / portfolio VaR is calculated on a daily basis.
Notes to the Unconsolidated Financial StatementsFor the year ended December 31, 2010
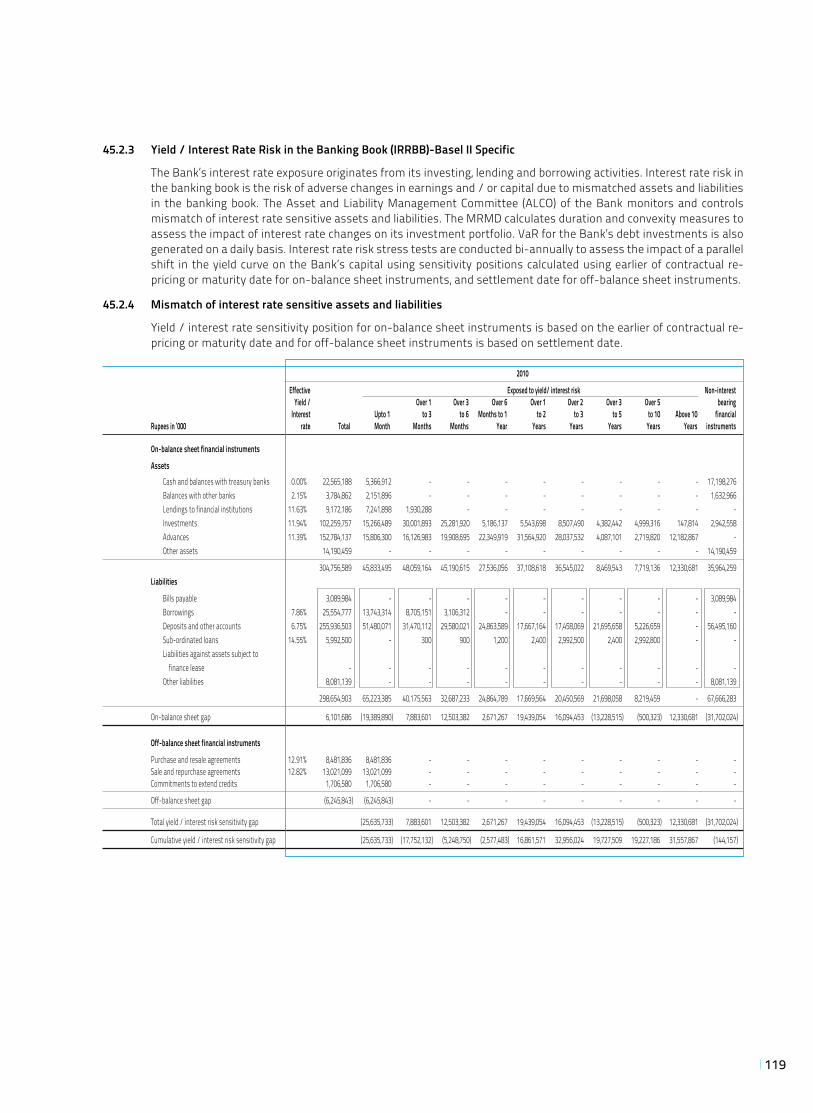
119
45.2.3 Yield / Interest Rate Risk in the Banking Book (IRRBB)-Basel II Specific
The Bank’s interest rate exposure originates from its investing, lending and borrowing activities. Interest rate risk in the banking book is the risk of adverse changes in earnings and / or capital due to mismatched assets and liabilities in the banking book. The Asset and Liability Management Committee (ALCO) of the Bank monitors and controls mismatch of interest rate sensitive assets and liabilities. The MRMD calculates duration and convexity measures to assess the impact of interest rate changes on its investment portfolio. VaR for the Bank’s debt investments is also generated on a daily basis. Interest rate risk stress tests are conducted bi-annually to assess the impact of a parallel shift in the yield curve on the Bank’s capital using sensitivity positions calculated using earlier of contractual re-pricing or maturity date for on-balance sheet instruments, and settlement date for off-balance sheet instruments.
45.2.4 Mismatch of interest rate sensitive assets and liabilities
Yield / interest rate sensitivity position for on-balance sheet instruments is based on the earlier of contractual re-pricing or maturity date and for off-balance sheet instruments is based on settlement date.
2010
Effective Exposed to yield/ interest risk Non-interest Yield / Over 1 Over 3 Over 6 Over 1 Over 2 Over 3 Over 5 bearing Interest Upto 1 to 3 to 6 Months to 1 to 2 to 3 to 5 to 10 Above 10 financial Rupees in ‘000 rate Total Month Months Months Year Years Years Years Years Years instruments
On-balance sheet financial instruments
Assets Cash and balances with treasury banks 0.00% 22,565,188 5,366,912 - - - - - - - - 17,198,276 Balances with other banks 2.15% 3,784,862 2,151,896 - - - - - - - - 1,632,966 Lendings to financial institutions 11.63% 9,172,186 7,241,898 1,930,288 - - - - - - - - Investments 11.94% 102,259,757 15,266,489 30,001,893 25,281,920 5,186,137 5,543,698 8,507,490 4,382,442 4,999,316 147,814 2,942,558 Advances 11.39% 152,784,137 15,806,300 16,126,983 19,908,695 22,349,919 31,564,920 28,037,532 4,087,101 2,719,820 12,182,867 - Other assets 14,190,459 - - - - - - - - - 14,190,459
304,756,589 45,833,495 48,059,164 45,190,615 27,536,056 37,108,618 36,545,022 8,469,543 7,719,136 12,330,681 35,964,259 Liabilities
Bills payable 3,089,984 - - - - - - - - - 3,089,984 Borrowings 7.86% 25,554,777 13,743,314 8,705,151 3,106,312 - - - - - - - Deposits and other accounts 6.75% 255,936,503 51,480,071 31,470,112 29,580,021 24,863,589 17,667,164 17,458,069 21,695,658 5,226,659 - 56,495,160 Sub-ordinated loans 14.55% 5,992,500 - 300 900 1,200 2,400 2,992,500 2,400 2,992,800 - - Liabilities against assets subject to finance lease - - - - - - - - - - - Other liabilities 8,081,139 - - - - - - - - - 8,081,139
298,654,903 65,223,385 40,175,563 32,687,233 24,864,789 17,669,564 20,450,569 21,698,058 8,219,459 - 67,666,283
On-balance sheet gap 6,101,686 (19,389,890) 7,883,601 12,503,382 2,671,267 19,439,054 16,094,453 (13,228,515) (500,323) 12,330,681 (31,702,024)
Off-balance sheet financial instruments
Purchase and resale agreements 12.91% 8,481,836 8,481,836 - - - - - - - - - Sale and repurchase agreements 12.82% 13,021,099 13,021,099 - - - - - - - - - Commitments to extend credits 1,706,580 1,706,580 - - - - - - - - -
Off-balance sheet gap (6,245,843) (6,245,843) - - - - - - - - -
Total yield / interest risk sensitivity gap (25,635,733) 7,883,601 12,503,382 2,671,267 19,439,054 16,094,453 (13,228,515) (500,323) 12,330,681 (31,702,024)
Cumulative yield / interest risk sensitivity gap (25,635,733) (17,752,132) (5,248,750) (2,577,483) 16,861,571 32,956,024 19,727,509 19,227,186 31,557,867 (144,157)
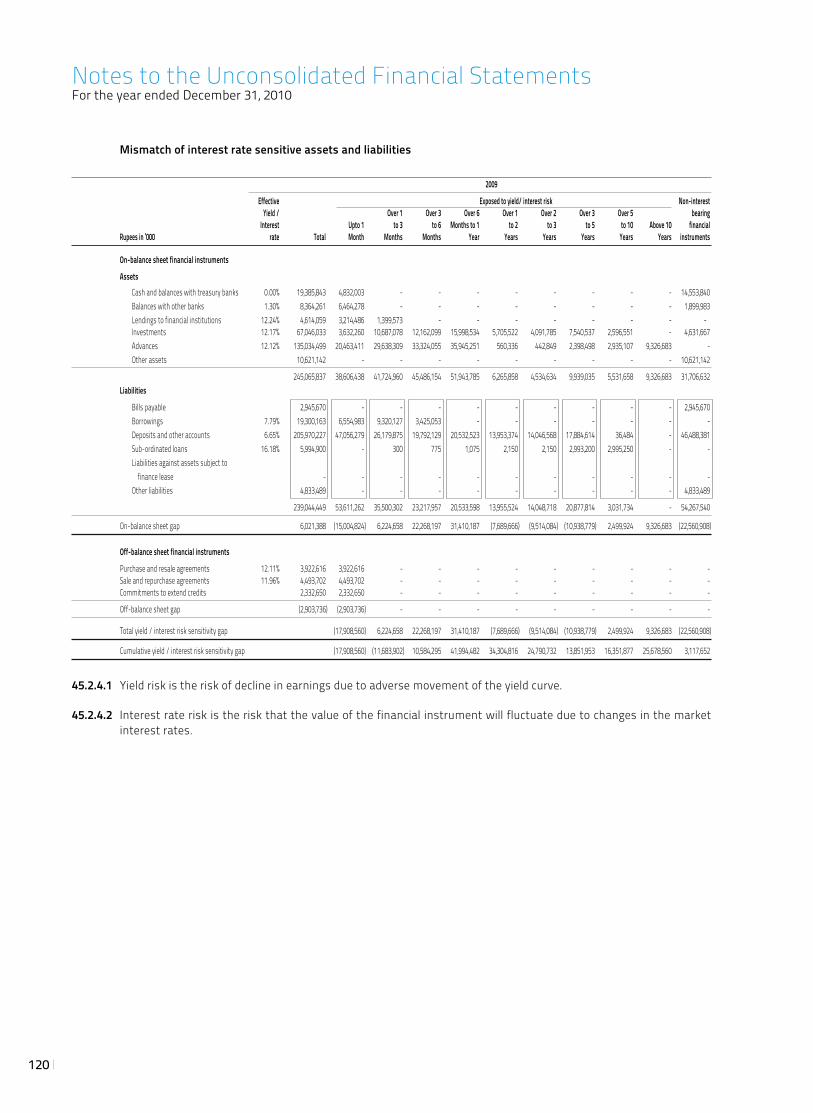
120
Mismatch of interest rate sensitive assets and liabilities
2009
Effective Exposed to yield/ interest risk Non-interest Yield / Over 1 Over 3 Over 6 Over 1 Over 2 Over 3 Over 5 bearing Interest Upto 1 to 3 to 6 Months to 1 to 2 to 3 to 5 to 10 Above 10 financial Rupees in ‘000 rate Total Month Months Months Year Years Years Years Years Years instruments
On-balance sheet financial instruments
Assets Cash and balances with treasury banks 0.00% 19,385,843 4,832,003 - - - - - - - - 14,553,840 Balances with other banks 1.30% 8,364,261 6,464,278 - - - - - - - - 1,899,983 Lendings to financial institutions 12.24% 4,614,059 3,214,486 1,399,573 - - - - - - - -
Investments 12.17% 67,046,033 3,632,260 10,687,078 12,162,099 15,998,534 5,705,522 4,091,785 7,540,537 2,596,551 - 4,631,667 Advances 12.12% 135,034,499 20,463,411 29,638,309 33,324,055 35,945,251 560,336 442,849 2,398,498 2,935,107 9,326,683 - Other assets 10,621,142 - - - - - - - - - 10,621,142
245,065,837 38,606,438 41,724,960 45,486,154 51,943,785 6,265,858 4,534,634 9,939,035 5,531,658 9,326,683 31,706,632 Liabilities
Bills payable 2,945,670 - - - - - - - - - 2,945,670 Borrowings 7.79% 19,300,163 6,554,983 9,320,127 3,425,053 - - - - - - - Deposits and other accounts 6.65% 205,970,227 47,056,279 26,179,875 19,792,129 20,532,523 13,953,374 14,046,568 17,884,614 36,484 - 46,488,381 Sub-ordinated loans 16.18% 5,994,900 - 300 775 1,075 2,150 2,150 2,993,200 2,995,250 - - Liabilities against assets subject to finance lease - - - - - - - - - - - Other liabilities 4,833,489 - - - - - - - - - 4,833,489
239,044,449 53,611,262 35,500,302 23,217,957 20,533,598 13,955,524 14,048,718 20,877,814 3,031,734 - 54,267,540
On-balance sheet gap 6,021,388 (15,004,824) 6,224,658 22,268,197 31,410,187 (7,689,666) (9,514,084) (10,938,779) 2,499,924 9,326,683 (22,560,908)
Off-balance sheet financial instruments
Purchase and resale agreements 12.11% 3,922,616 3,922,616 - - - - - - - - - Sale and repurchase agreements 11.96% 4,493,702 4,493,702 - - - - - - - - - Commitments to extend credits 2,332,650 2,332,650 - - - - - - - - -
Off-balance sheet gap (2,903,736) (2,903,736) - - - - - - - - -
Total yield / interest risk sensitivity gap (17,908,560) 6,224,658 22,268,197 31,410,187 (7,689,666) (9,514,084) (10,938,779) 2,499,924 9,326,683 (22,560,908)
Cumulative yield / interest risk sensitivity gap (17,908,560) (11,683,902) 10,584,295 41,994,482 34,304,816 24,790,732 13,851,953 16,351,877 25,678,560 3,117,652
45.2.4.1 Yield risk is the risk of decline in earnings due to adverse movement of the yield curve.
45.2.4.2 Interest rate risk is the risk that the value of the financial instrument will fluctuate due to changes in the market interest rates.
Notes to the Unconsolidated Financial StatementsFor the year ended December 31, 2010
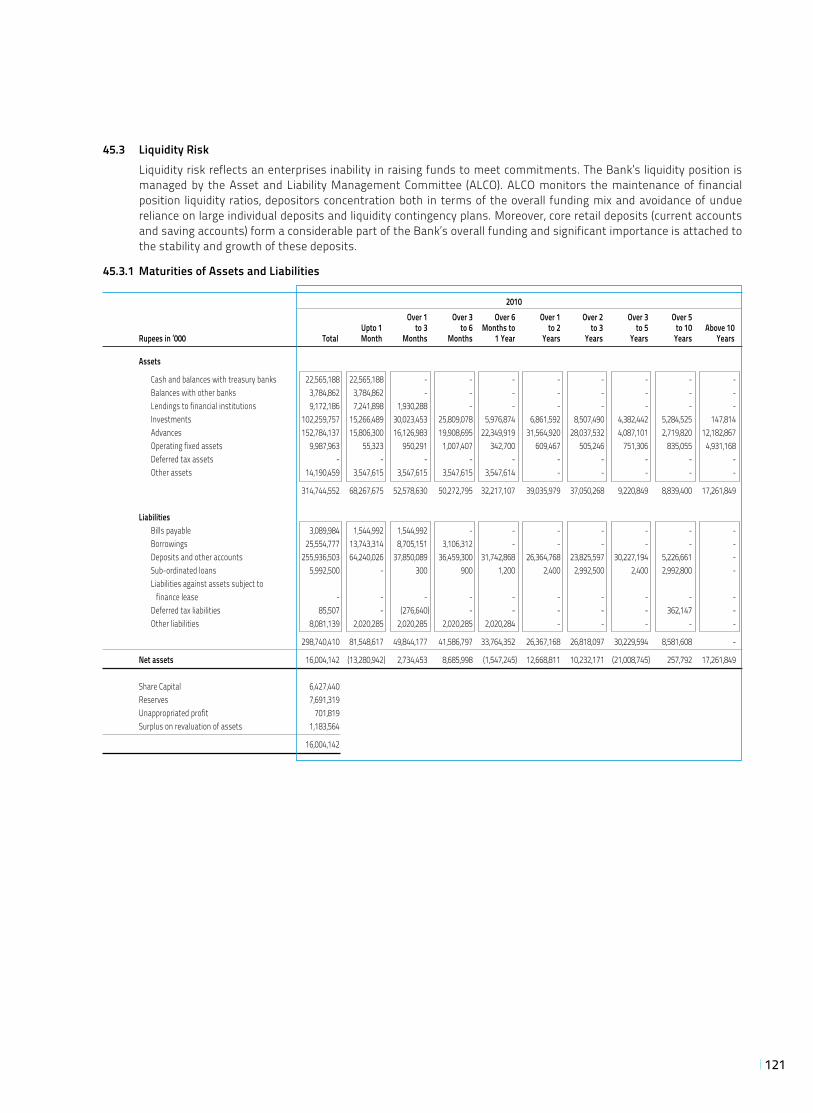
121
45.3 Liquidity Risk Liquidity risk reflects an enterprises inability in raising funds to meet commitments. The Bank’s liquidity position is
managed by the Asset and Liability Management Committee (ALCO). ALCO monitors the maintenance of financial position liquidity ratios, depositors concentration both in terms of the overall funding mix and avoidance of undue reliance on large individual deposits and liquidity contingency plans. Moreover, core retail deposits (current accounts and saving accounts) form a considerable part of the Bank’s overall funding and significant importance is attached to the stability and growth of these deposits.
45.3.1 Maturities of Assets and Liabilities
2010 Over 1 Over 3 Over 6 Over 1 Over 2 Over 3 Over 5 Upto 1 to 3 to 6 Months to to 2 to 3 to 5 to 10 Above 10 Rupees in ‘000 Total Month Months Months 1 Year Years Years Years Years Years
Assets
Cash and balances with treasury banks 22,565,188 22,565,188 - - - - - - - - Balances with other banks 3,784,862 3,784,862 - - - - - - - - Lendings to financial institutions 9,172,186 7,241,898 1,930,288 - - - - - - - Investments 102,259,757 15,266,489 30,023,453 25,809,078 5,976,874 6,861,592 8,507,490 4,382,442 5,284,525 147,814 Advances 152,784,137 15,806,300 16,126,983 19,908,695 22,349,919 31,564,920 28,037,532 4,087,101 2,719,820 12,182,867 Operating fixed assets 9,987,963 55,323 950,291 1,007,407 342,700 609,467 505,246 751,306 835,055 4,931,168 Deferred tax assets - - - - - - - - - - Other assets 14,190,459 3,547,615 3,547,615 3,547,615 3,547,614 - - - - -
314,744,552 68,267,675 52,578,630 50,272,795 32,217,107 39,035,979 37,050,268 9,220,849 8,839,400 17,261,849
Liabilities Bills payable 3,089,984 1,544,992 1,544,992 - - - - - - - Borrowings 25,554,777 13,743,314 8,705,151 3,106,312 - - - - - - Deposits and other accounts 255,936,503 64,240,026 37,850,089 36,459,300 31,742,868 26,364,768 23,825,597 30,227,194 5,226,661 - Sub-ordinated loans 5,992,500 - 300 900 1,200 2,400 2,992,500 2,400 2,992,800 - Liabilities against assets subject to finance lease - - - - - - - - - - Deferred tax liabilities 85,507 - (276,640) - - - - - 362,147 - Other liabilities 8,081,139 2,020,285 2,020,285 2,020,285 2,020,284 - - - - -
298,740,410 81,548,617 49,844,177 41,586,797 33,764,352 26,367,168 26,818,097 30,229,594 8,581,608 -
Net assets 16,004,142 (13,280,942) 2,734,453 8,685,998 (1,547,245) 12,668,811 10,232,171 (21,008,745) 257,792 17,261,849
Share Capital 6,427,440 Reserves 7,691,319 Unappropriated profit 701,819 Surplus on revaluation of assets 1,183,564
16,004,142
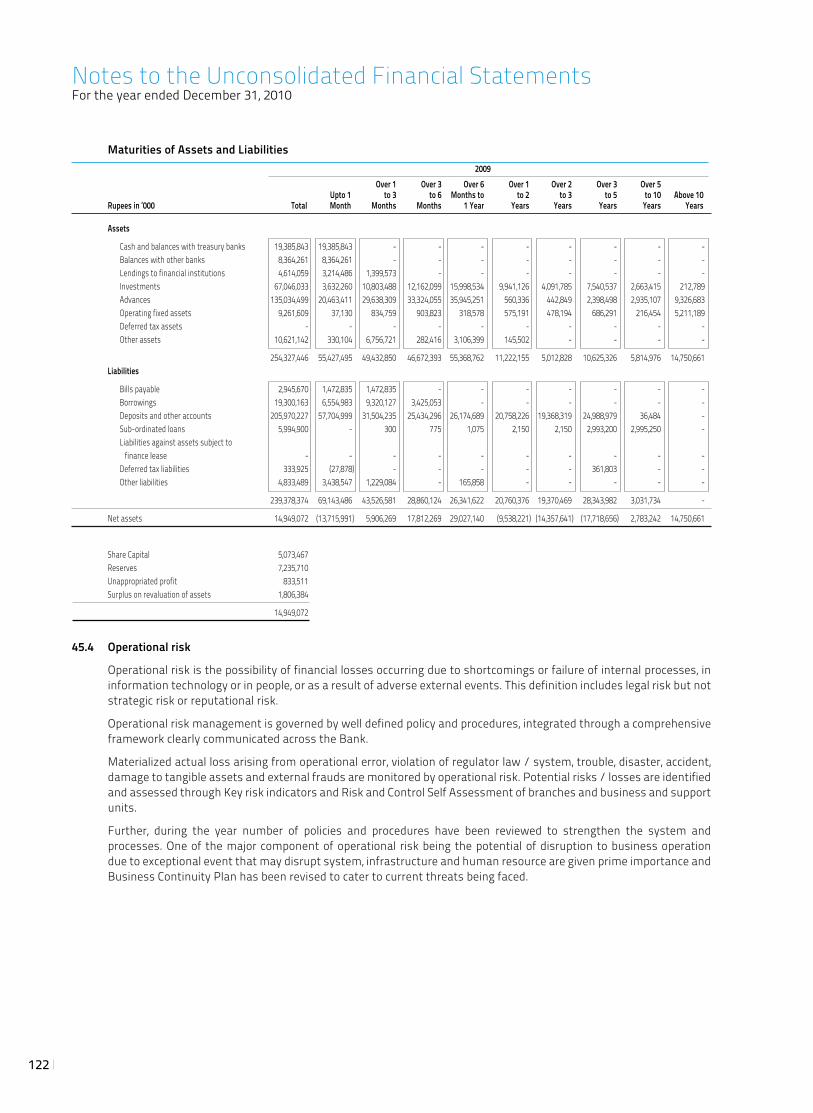
122
Maturities of Assets and Liabilities 2009 Over 1 Over 3 Over 6 Over 1 Over 2 Over 3 Over 5 Upto 1 to 3 to 6 Months to to 2 to 3 to 5 to 10 Above 10 Rupees in ‘000 Total Month Months Months 1 Year Years Years Years Years Years
Assets
Cash and balances with treasury banks 19,385,843 19,385,843 - - - - - - - - Balances with other banks 8,364,261 8,364,261 - - - - - - - - Lendings to financial institutions 4,614,059 3,214,486 1,399,573 - - - - - - - Investments 67,046,033 3,632,260 10,803,488 12,162,099 15,998,534 9,941,126 4,091,785 7,540,537 2,663,415 212,789 Advances 135,034,499 20,463,411 29,638,309 33,324,055 35,945,251 560,336 442,849 2,398,498 2,935,107 9,326,683 Operating fixed assets 9,261,609 37,130 834,759 903,823 318,578 575,191 478,194 686,291 216,454 5,211,189 Deferred tax assets - - - - - - - - - - Other assets 10,621,142 330,104 6,756,721 282,416 3,106,399 145,502 - - - -
254,327,446 55,427,495 49,432,850 46,672,393 55,368,762 11,222,155 5,012,828 10,625,326 5,814,976 14,750,661 Liabilities
Bills payable 2,945,670 1,472,835 1,472,835 - - - - - - - Borrowings 19,300,163 6,554,983 9,320,127 3,425,053 - - - - - - Deposits and other accounts 205,970,227 57,704,999 31,504,235 25,434,296 26,174,689 20,758,226 19,368,319 24,988,979 36,484 - Sub-ordinated loans 5,994,900 - 300 775 1,075 2,150 2,150 2,993,200 2,995,250 - Liabilities against assets subject to finance lease - - - - - - - - - - Deferred tax liabilities 333,925 (27,878) - - - - - 361,803 - - Other liabilities 4,833,489 3,438,547 1,229,084 - 165,858 - - - - -
239,378,374 69,143,486 43,526,581 28,860,124 26,341,622 20,760,376 19,370,469 28,343,982 3,031,734 -
Net assets 14,949,072 (13,715,991) 5,906,269 17,812,269 29,027,140 (9,538,221) (14,357,641) (17,718,656) 2,783,242 14,750,661
Share Capital 5,073,467 Reserves 7,235,710 Unappropriated profit 833,511 Surplus on revaluation of assets 1,806,384
14,949,072
45.4 Operational risk
Operational risk is the possibility of financial losses occurring due to shortcomings or failure of internal processes, in information technology or in people, or as a result of adverse external events. This definition includes legal risk but not strategic risk or reputational risk.
Operational risk management is governed by well defined policy and procedures, integrated through a comprehensive framework clearly communicated across the Bank.
Materialized actual loss arising from operational error, violation of regulator law / system, trouble, disaster, accident, damage to tangible assets and external frauds are monitored by operational risk. Potential risks / losses are identified and assessed through Key risk indicators and Risk and Control Self Assessment of branches and business and support units.
Further, during the year number of policies and procedures have been reviewed to strengthen the system and processes. One of the major component of operational risk being the potential of disruption to business operation due to exceptional event that may disrupt system, infrastructure and human resource are given prime importance and Business Continuity Plan has been revised to cater to current threats being faced.
Notes to the Unconsolidated Financial StatementsFor the year ended December 31, 2010
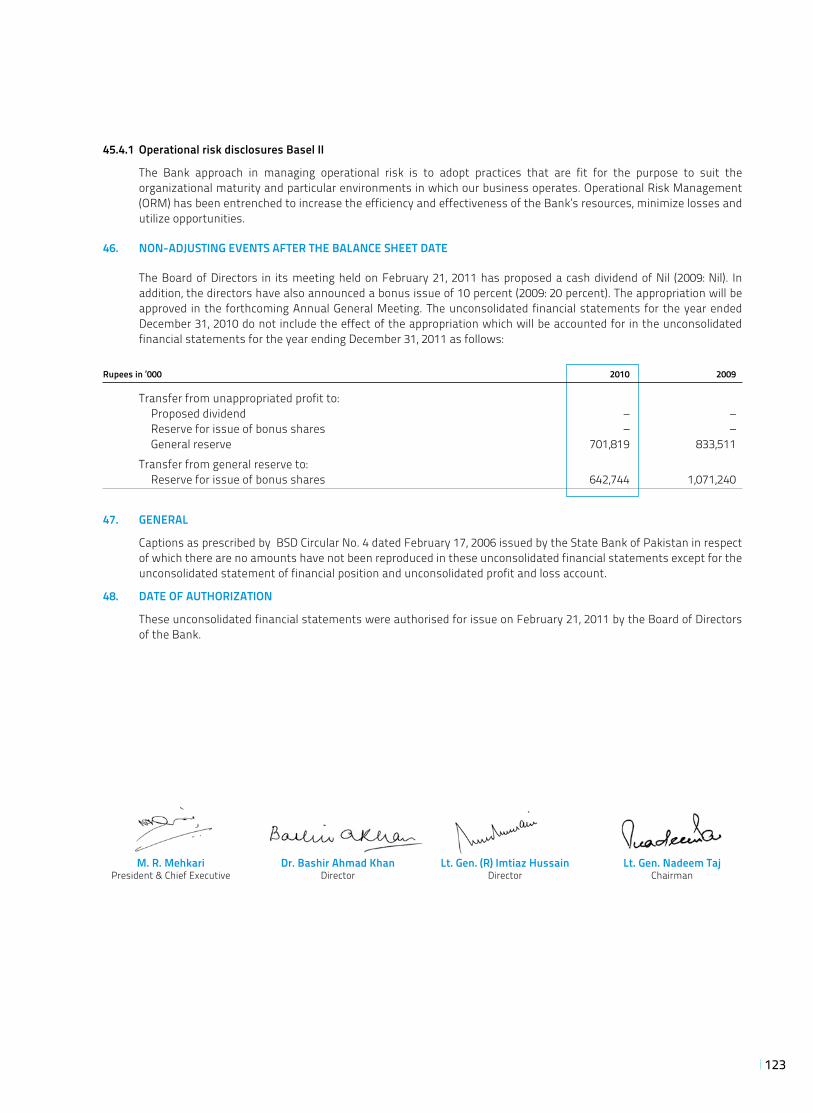
123
M. R. Mehkari Dr. Bashir Ahmad Khan Lt. Gen. (R) Imtiaz Hussain Lt. Gen. Nadeem Taj President & Chief Executive Director Director Chairman
45.4.1 Operational risk disclosures Basel II
The Bank approach in managing operational risk is to adopt practices that are fit for the purpose to suit the organizational maturity and particular environments in which our business operates. Operational Risk Management (ORM) has been entrenched to increase the efficiency and effectiveness of the Bank’s resources, minimize losses and utilize opportunities.
46. NON-ADJUSTING EVENTS AFTER THE BALANCE SHEET DATE
The Board of Directors in its meeting held on February 21, 2011 has proposed a cash dividend of Nil (2009: Nil). In addition, the directors have also announced a bonus issue of 10 percent (2009: 20 percent). The appropriation will be approved in the forthcoming Annual General Meeting. The unconsolidated financial statements for the year ended December 31, 2010 do not include the effect of the appropriation which will be accounted for in the unconsolidated financial statements for the year ending December 31, 2011 as follows:
Rupees in ‘000 2010 2009
Transfer from unappropriated profit to: Proposed dividend – – Reserve for issue of bonus shares – – General reserve 701,819 833,511 Transfer from general reserve to: Reserve for issue of bonus shares 642,744 1,071,240
47. GENERAL
Captions as prescribed by BSD Circular No. 4 dated February 17, 2006 issued by the State Bank of Pakistan in respect of which there are no amounts have not been reproduced in these unconsolidated financial statements except for the unconsolidated statement of financial position and unconsolidated profit and loss account.
48. DATE OF AUTHORIZATION
These unconsolidated financial statements were authorised for issue on February 21, 2011 by the Board of Directors of the Bank.
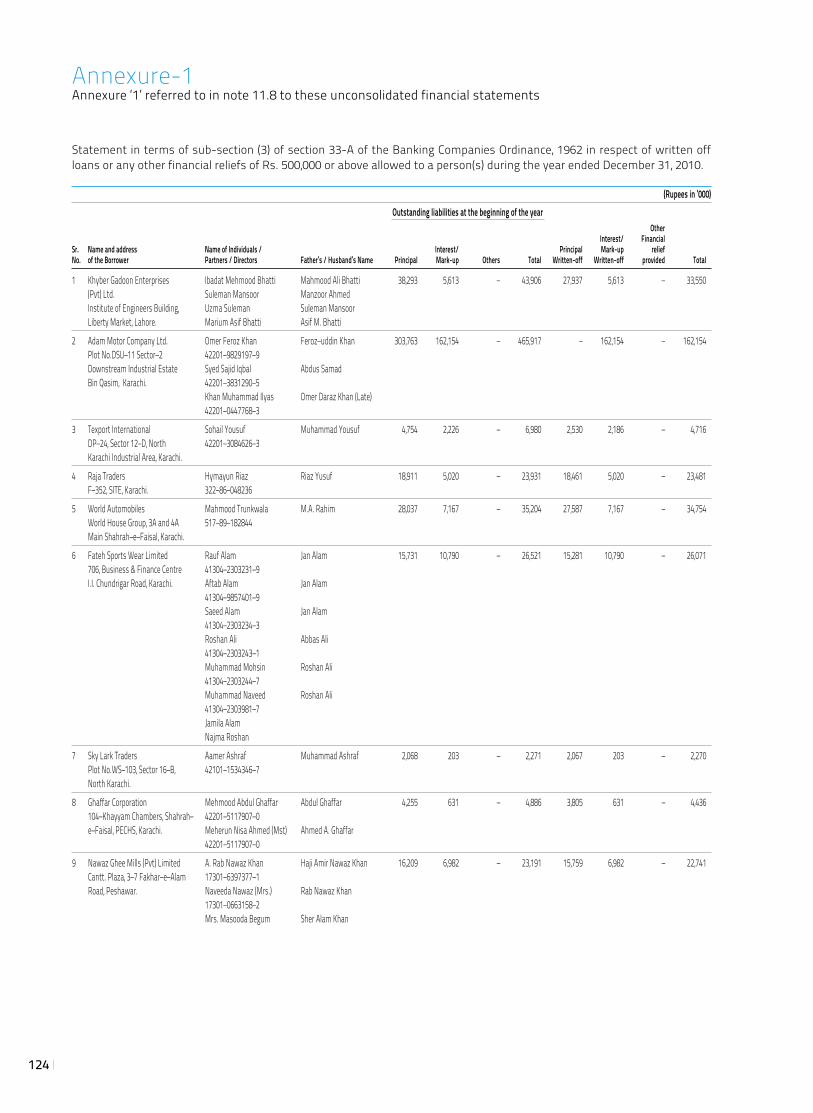
124
Annexure-1Annexure ‘1’ referred to in note 11.8 to these unconsolidated financial statements
Statement in terms of sub-section (3) of section 33-A of the Banking Companies Ordinance, 1962 in respect of written off loans or any other financial reliefs of Rs. 500,000 or above allowed to a person(s) during the year ended December 31, 2010. (Rupees in ‘000) Outstanding liabilities at the beginning of the year Other Interest/ FinancialSr. Name and address Name of Individuals / Interest/ Principal Mark-up reliefNo. of the Borrower Partners / Directors Father’s / Husband’s Name Principal Mark-up Others Total Written-off Written-off provided Total
1 Khyber Gadoon Enterprises Ibadat Mehmood Bhatti Mahmood Ali Bhatti 38,293 5,613 – 43,906 27,937 5,613 – 33,550 (Pvt) Ltd. Suleman Mansoor Manzoor Ahmed Institute of Engineers Building, Uzma Suleman Suleman Mansoor Liberty Market, Lahore. Marium Asif Bhatti Asif M. Bhatti
2 Adam Motor Company Ltd. Omer Feroz Khan Feroz–uddin Khan 303,763 162,154 – 465,917 – 162,154 – 162,154 Plot No.DSU–11 Sector–2 42201–9829197–9 Downstream Industrial Estate Syed Sajid Iqbal Abdus Samad Bin Qasim, Karachi. 42201–3831290–5 Khan Muhammad Ilyas Omer Daraz Khan (Late) 42201–0447768–3
3 Texport International Sohail Yousuf Muhammad Yousuf 4,754 2,226 – 6,980 2,530 2,186 – 4,716 DP–24, Sector 12–D, North 42201–3084626–3 Karachi Industrial Area, Karachi.
4 Raja Traders Hymayun Riaz Riaz Yusuf 18,911 5,020 – 23,931 18,461 5,020 – 23,481 F–352, SITE, Karachi. 322–86–048236
5 World Automobiles Mahmood Trunkwala M.A. Rahim 28,037 7,167 – 35,204 27,587 7,167 – 34,754 World House Group, 3A and 4A 517–89–182844 Main Shahrah–e–Faisal, Karachi.
6 Fateh Sports Wear Limited Rauf Alam Jan Alam 15,731 10,790 – 26,521 15,281 10,790 – 26,071 706, Business & Finance Centre 41304–2303231–9 I.I. Chundrigar Road, Karachi. Aftab Alam Jan Alam 41304–9857401–9 Saeed Alam Jan Alam 41304–2303234–3 Roshan Ali Abbas Ali 41304–2303243–1 Muhammad Mohsin Roshan Ali 41304–2303244–7 Muhammad Naveed Roshan Ali 41304–2303981–7 Jamila Alam Najma Roshan
7 Sky Lark Traders Aamer Ashraf Muhammad Ashraf 2,068 203 – 2,271 2,067 203 – 2,270 Plot No.WS–103, Sector 16–B, 42101–1534346–7 North Karachi.
8 Ghaffar Corporation Mehmood Abdul Ghaffar Abdul Ghaffar 4,255 631 – 4,886 3,805 631 – 4,436 104–Khayyam Chambers, Shahrah– 42201–5117907–0 e–Faisal, PECHS, Karachi. Meherun Nisa Ahmed (Mst) Ahmed A. Ghaffar 42201–5117907–0
9 Nawaz Ghee Mills (Pvt) Limited A. Rab Nawaz Khan Haji Amir Nawaz Khan 16,209 6,982 – 23,191 15,759 6,982 – 22,741 Cantt. Plaza, 3–7 Fakhar–e–Alam 17301–6397377–1 Road, Peshawar. Naveeda Nawaz (Mrs.) Rab Nawaz Khan 17301–0663158–2 Mrs. Masooda Begum Sher Alam Khan
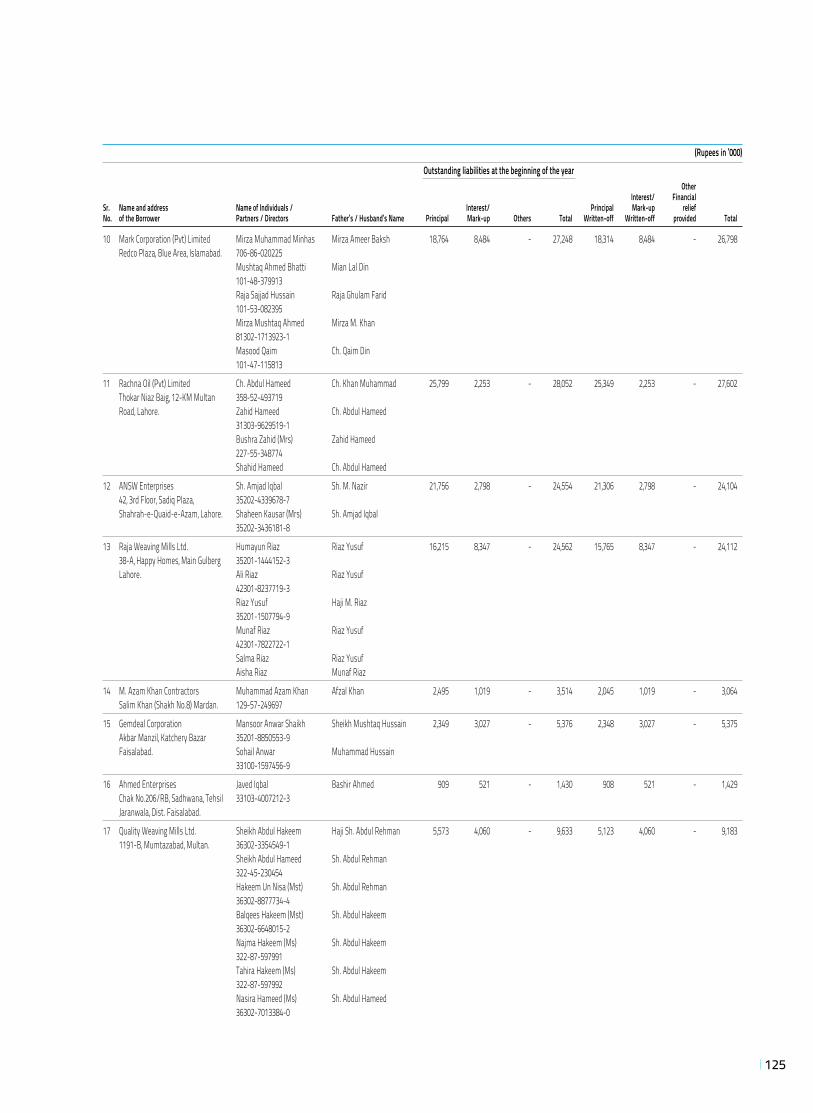
125
(Rupees in ‘000) Outstanding liabilities at the beginning of the year Other Interest/ FinancialSr. Name and address Name of Individuals / Interest/ Principal Mark-up reliefNo. of the Borrower Partners / Directors Father’s / Husband’s Name Principal Mark-up Others Total Written-off Written-off provided Total
10 Mark Corporation (Pvt) Limited Mirza Muhammad Minhas Mirza Ameer Baksh 18,764 8,484 - 27,248 18,314 8,484 - 26,798 Redco Plaza, Blue Area, Islamabad. 706-86-020225 Mushtaq Ahmed Bhatti Mian Lal Din 101-48-379913 Raja Sajjad Hussain Raja Ghulam Farid 101-53-082395 Mirza Mushtaq Ahmed Mirza M. Khan 81302-1713923-1 Masood Qaim Ch. Qaim Din 101-47-115813
11 Rachna Oil (Pvt) Limited Ch. Abdul Hameed Ch. Khan Muhammad 25,799 2,253 - 28,052 25,349 2,253 - 27,602 Thokar Niaz Baig, 12-KM Multan 358-52-493719 Road, Lahore. Zahid Hameed Ch. Abdul Hameed 31303-9629519-1 Bushra Zahid (Mrs) Zahid Hameed 227-55-348774 Shahid Hameed Ch. Abdul Hameed
12 ANSW Enterprises Sh. Amjad Iqbal Sh. M. Nazir 21,756 2,798 - 24,554 21,306 2,798 - 24,104 42, 3rd Floor, Sadiq Plaza, 35202-4339678-7 Shahrah-e-Quaid-e-Azam, Lahore. Shaheen Kausar (Mrs) Sh. Amjad Iqbal 35202-3436181-8
13 Raja Weaving Mills Ltd. Humayun Riaz Riaz Yusuf 16,215 8,347 - 24,562 15,765 8,347 - 24,112 38-A, Happy Homes, Main Gulberg 35201-1444152-3 Lahore. Ali Riaz Riaz Yusuf 42301-8237719-3 Riaz Yusuf Haji M. Riaz 35201-1507794-9 Munaf Riaz Riaz Yusuf 42301-7822722-1 Salma Riaz Riaz Yusuf Aisha Riaz Munaf Riaz
14 M. Azam Khan Contractors Muhammad Azam Khan Afzal Khan 2,495 1,019 - 3,514 2,045 1,019 - 3,064 Salim Khan (Shakh No.8) Mardan. 129-57-249697
15 Gemdeal Corporation Mansoor Anwar Shaikh Sheikh Mushtaq Hussain 2,349 3,027 - 5,376 2,348 3,027 - 5,375 Akbar Manzil, Katchery Bazar 35201-8850553-9 Faisalabad. Sohail Anwar Muhammad Hussain 33100-1597456-9
16 Ahmed Enterprises Javed Iqbal Bashir Ahmed 909 521 - 1,430 908 521 - 1,429 Chak No.206/RB, Sadhwana, Tehsil 33103-4007212-3 Jaranwala, Dist. Faisalabad.
17 Quality Weaving Mills Ltd. Sheikh Abdul Hakeem Haji Sh. Abdul Rehman 5,573 4,060 - 9,633 5,123 4,060 - 9,183 1191-B, Mumtazabad, Multan. 36302-3354549-1 Sheikh Abdul Hameed Sh. Abdul Rehman 322-45-230454 Hakeem Un Nisa (Mst) Sh. Abdul Rehman 36302-8877734-4 Balqees Hakeem (Mst) Sh. Abdul Hakeem 36302-6648015-2 Najma Hakeem (Ms) Sh. Abdul Hakeem 322-87-597991 Tahira Hakeem (Ms) Sh. Abdul Hakeem 322-87-597992 Nasira Hameed (Ms) Sh. Abdul Hameed 36302-7013384-0
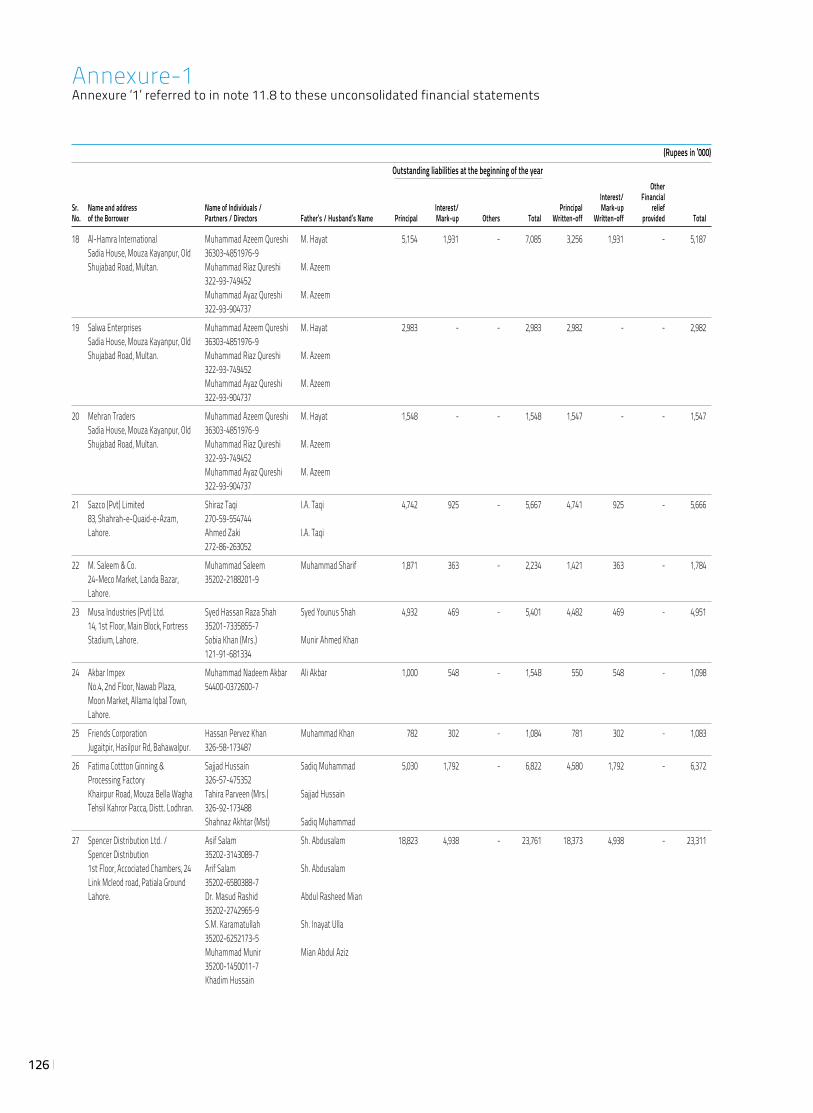
126
(Rupees in ‘000) Outstanding liabilities at the beginning of the year Other Interest/ FinancialSr. Name and address Name of Individuals / Interest/ Principal Mark-up reliefNo. of the Borrower Partners / Directors Father’s / Husband’s Name Principal Mark-up Others Total Written-off Written-off provided Total
18 Al-Hamra International Muhammad Azeem Qureshi M. Hayat 5,154 1,931 - 7,085 3,256 1,931 - 5,187 Sadia House, Mouza Kayanpur, Old 36303-4851976-9 Shujabad Road, Multan. Muhammad Riaz Qureshi M. Azeem 322-93-749452 Muhammad Ayaz Qureshi M. Azeem 322-93-904737
19 Salwa Enterprises Muhammad Azeem Qureshi M. Hayat 2,983 - - 2,983 2,982 - - 2,982 Sadia House, Mouza Kayanpur, Old 36303-4851976-9 Shujabad Road, Multan. Muhammad Riaz Qureshi M. Azeem 322-93-749452 Muhammad Ayaz Qureshi M. Azeem 322-93-904737
20 Mehran Traders Muhammad Azeem Qureshi M. Hayat 1,548 - - 1,548 1,547 - - 1,547 Sadia House, Mouza Kayanpur, Old 36303-4851976-9 Shujabad Road, Multan. Muhammad Riaz Qureshi M. Azeem 322-93-749452 Muhammad Ayaz Qureshi M. Azeem 322-93-904737
21 Sazco (Pvt) Limited Shiraz Taqi I.A. Taqi 4,742 925 - 5,667 4,741 925 - 5,666 83, Shahrah-e-Quaid-e-Azam, 270-59-554744 Lahore. Ahmed Zaki I.A. Taqi 272-86-263052
22 M. Saleem & Co. Muhammad Saleem Muhammad Sharif 1,871 363 - 2,234 1,421 363 - 1,784 24-Meco Market, Landa Bazar, 35202-2188201-9 Lahore.
23 Musa Industries (Pvt) Ltd. Syed Hassan Raza Shah Syed Younus Shah 4,932 469 - 5,401 4,482 469 - 4,951 14, 1st Floor, Main Block, Fortress 35201-7335855-7 Stadium, Lahore. Sobia Khan (Mrs.) Munir Ahmed Khan 121-91-681334
24 Akbar Impex Muhammad Nadeem Akbar Ali Akbar 1,000 548 - 1,548 550 548 - 1,098 No.4, 2nd Floor, Nawab Plaza, 54400-0372600-7 Moon Market, Allama Iqbal Town, Lahore.
25 Friends Corporation Hassan Pervez Khan Muhammad Khan 782 302 - 1,084 781 302 - 1,083 Jugaitpir, Hasilpur Rd, Bahawalpur. 326-58-173487
26 Fatima Cottton Ginning & Sajjad Hussain Sadiq Muhammad 5,030 1,792 - 6,822 4,580 1,792 - 6,372 Processing Factory 326-57-475352 Khairpur Road, Mouza Bella Wagha Tahira Parveen (Mrs.) Sajjad Hussain Tehsil Kahror Pacca, Distt. Lodhran. 326-92-173488 Shahnaz Akhtar (Mst) Sadiq Muhammad
27 Spencer Distribution Ltd. / Asif Salam Sh. Abdusalam 18,823 4,938 - 23,761 18,373 4,938 - 23,311 Spencer Distribution 35202-3143089-7 1st Floor, Accociated Chambers, 24 Arif Salam Sh. Abdusalam Link Mcleod road, Patiala Ground 35202-6580388-7 Lahore. Dr. Masud Rashid Abdul Rasheed Mian 35202-2742965-9 S.M. Karamatullah Sh. Inayat Ulla 35202-6252173-5 Muhammad Munir Mian Abdul Aziz 35200-1450011-7 Khadim Hussain
Annexure-1Annexure ‘1’ referred to in note 11.8 to these unconsolidated financial statements
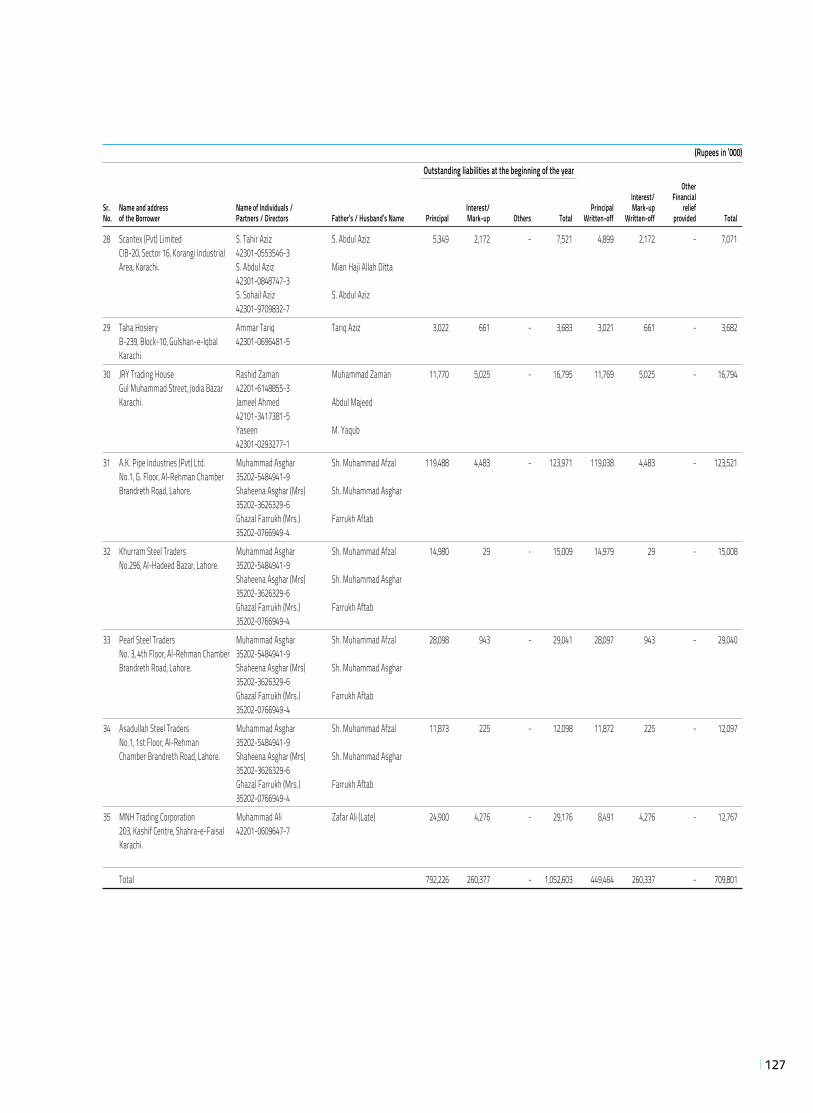
127
(Rupees in ‘000) Outstanding liabilities at the beginning of the year Other Interest/ FinancialSr. Name and address Name of Individuals / Interest/ Principal Mark-up reliefNo. of the Borrower Partners / Directors Father’s / Husband’s Name Principal Mark-up Others Total Written-off Written-off provided Total
28 Scantex (Pvt) Limited S. Tahir Aziz S. Abdul Aziz 5,349 2,172 - 7,521 4,899 2,172 - 7,071 CIB-20, Sector 16, Korangi Industrial 42301-0553546-3 Area, Karachi. S. Abdul Aziz Mian Haji Allah Ditta 42301-0848747-3 S. Sohail Aziz S. Abdul Aziz 42301-9709832-7
29 Taha Hosiery Ammar Tariq Tariq Aziz 3,022 661 - 3,683 3,021 661 - 3,682 B-239, Block-10, Gulshan-e-Iqbal 42301-0696481-5 Karachi.
30 JRY Trading House Rashid Zaman Muhammad Zaman 11,770 5,025 - 16,795 11,769 5,025 - 16,794 Gul Muhammad Street, Jodia Bazar 42201-6148855-3 Karachi. Jameel Ahmed Abdul Majeed 42101-3417381-5 Yaseen M. Yaqub 42301-0293277-1
31 A.K. Pipe Industries (Pvt) Ltd. Muhammad Asghar Sh. Muhammad Afzal 119,488 4,483 - 123,971 119,038 4,483 - 123,521 No.1, G. Floor, Al-Rehman Chamber 35202-5484941-9 Brandreth Road, Lahore. Shaheena Asghar (Mrs) Sh. Muhammad Asghar 35202-3626329-6 Ghazal Farrukh (Mrs.) Farrukh Aftab 35202-0766949-4
32 Khurram Steel Traders Muhammad Asghar Sh. Muhammad Afzal 14,980 29 - 15,009 14,979 29 - 15,008 No.296, Al-Hadeed Bazar, Lahore. 35202-5484941-9 Shaheena Asghar (Mrs) Sh. Muhammad Asghar 35202-3626329-6 Ghazal Farrukh (Mrs.) Farrukh Aftab 35202-0766949-4
33 Pearl Steel Traders Muhammad Asghar Sh. Muhammad Afzal 28,098 943 - 29,041 28,097 943 - 29,040 No. 3, 4th Floor, Al-Rehman Chamber 35202-5484941-9 Brandreth Road, Lahore. Shaheena Asghar (Mrs) Sh. Muhammad Asghar 35202-3626329-6 Ghazal Farrukh (Mrs.) Farrukh Aftab 35202-0766949-4
34 Asadullah Steel Traders Muhammad Asghar Sh. Muhammad Afzal 11,873 225 - 12,098 11,872 225 - 12,097 No.1, 1st Floor, Al-Rehman 35202-5484941-9 Chamber Brandreth Road, Lahore. Shaheena Asghar (Mrs) Sh. Muhammad Asghar 35202-3626329-6 Ghazal Farrukh (Mrs.) Farrukh Aftab 35202-0766949-4
35 MNH Trading Corporation Muhammad Ali Zafar Ali (Late) 24,900 4,276 - 29,176 8,491 4,276 - 12,767 203, Kashif Centre, Shahra-e-Faisal 42201-0609647-7 Karachi.
Total 792,226 260,377 - 1,052,603 449,464 260,337 - 709,801
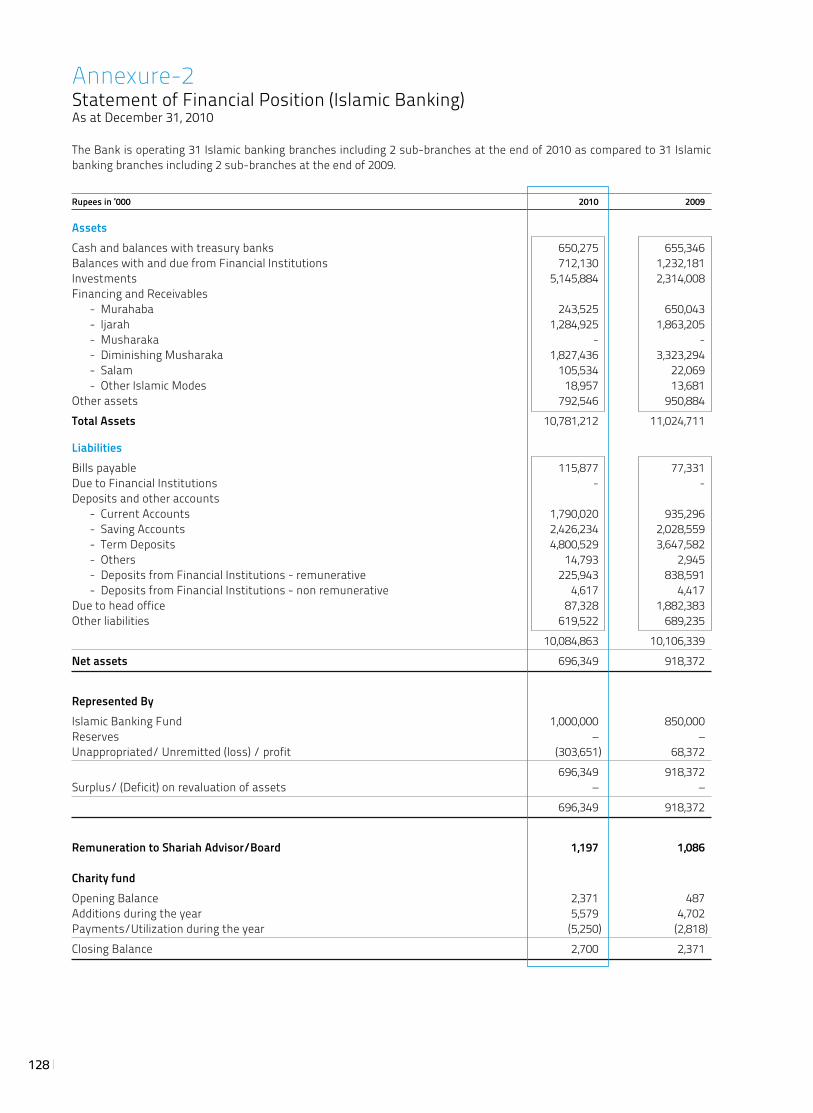
128
Annexure-2Statement of Financial Position (Islamic Banking)As at December 31, 2010
The Bank is operating 31 Islamic banking branches including 2 sub-branches at the end of 2010 as compared to 31 Islamic banking branches including 2 sub-branches at the end of 2009.
Rupees in ‘000 2010 2009
Assets Cash and balances with treasury banks 650,275 655,346 Balances with and due from Financial Institutions 712,130 1,232,181 Investments 5,145,884 2,314,008 Financing and Receivables - Murahaba 243,525 650,043 - Ijarah 1,284,925 1,863,205 - Musharaka - - - Diminishing Musharaka 1,827,436 3,323,294 - Salam 105,534 22,069 - Other Islamic Modes 18,957 13,681 Other assets 792,546 950,884 Total Assets 10,781,212 11,024,711
Liabilities Bills payable 115,877 77,331 Due to Financial Institutions - - Deposits and other accounts - Current Accounts 1,790,020 935,296 - Saving Accounts 2,426,234 2,028,559 - Term Deposits 4,800,529 3,647,582 - Others 14,793 2,945 - Deposits from Financial Institutions - remunerative 225,943 838,591 - Deposits from Financial Institutions - non remunerative 4,617 4,417 Due to head office 87,328 1,882,383 Other liabilities 619,522 689,235 10,084,863 10,106,339 Net assets 696,349 918,372
Represented By Islamic Banking Fund 1,000,000 850,000 Reserves – – Unappropriated/ Unremitted (loss) / profit (303,651) 68,372 696,349 918,372 Surplus/ (Deficit) on revaluation of assets – – 696,349 918,372
Remuneration to Shariah Advisor/Board 1,197 1,086 Charity fund Opening Balance 2,371 487 Additions during the year 5,579 4,702 Payments/Utilization during the year (5,250) (2,818)Closing Balance 2,700 2,371
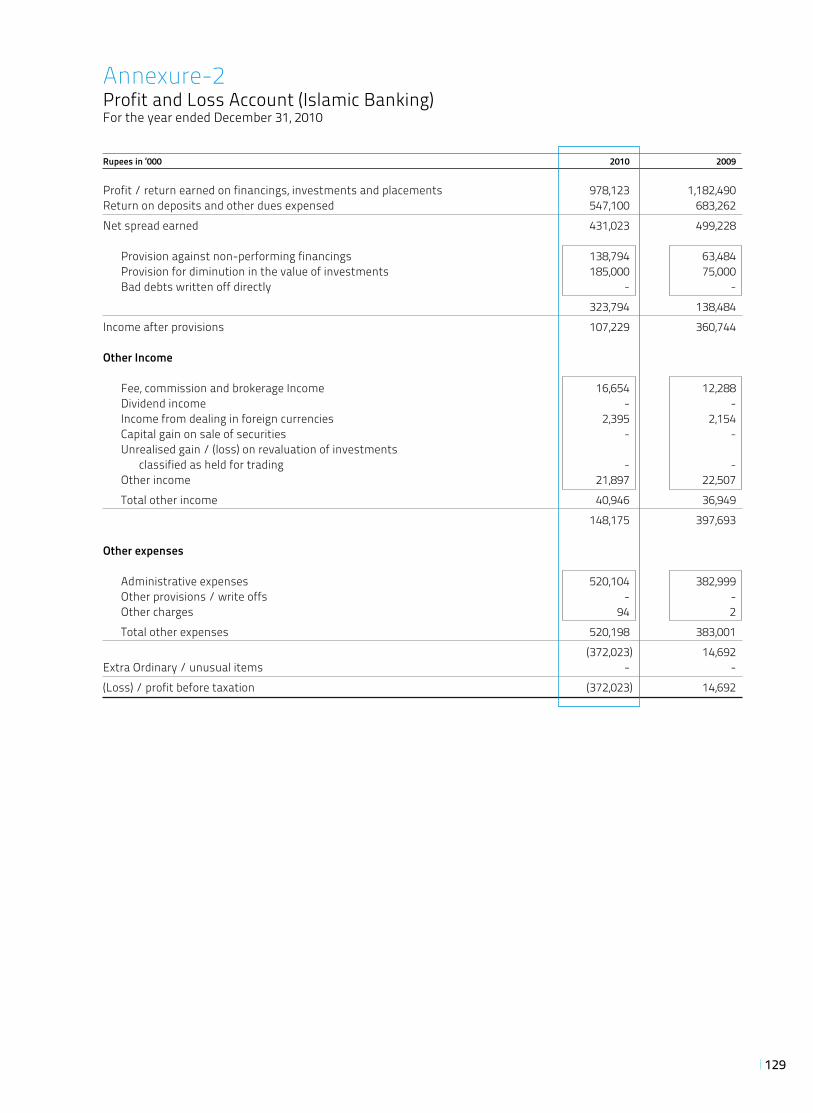
129
Annexure-2Profit and Loss Account (Islamic Banking)For the year ended December 31, 2010
Rupees in ‘000 2010 2009
Profit / return earned on financings, investments and placements 978,123 1,182,490 Return on deposits and other dues expensed 547,100 683,262 Net spread earned 431,023 499,228
Provision against non-performing financings 138,794 63,484 Provision for diminution in the value of investments 185,000 75,000 Bad debts written off directly - - 323,794 138,484 Income after provisions 107,229 360,744
Other Income
Fee, commission and brokerage Income 16,654 12,288 Dividend income - - Income from dealing in foreign currencies 2,395 2,154 Capital gain on sale of securities - - Unrealised gain / (loss) on revaluation of investments classified as held for trading - - Other income 21,897 22,507 Total other income 40,946 36,949 148,175 397,693
Other expenses
Administrative expenses 520,104 382,999 Other provisions / write offs - - Other charges 94 2 Total other expenses 520,198 383,001 (372,023) 14,692 Extra Ordinary / unusual items - - (Loss) / profit before taxation (372,023) 14,692
130
Annexure-2Shariah Advisor’s Report 2010
During 2010, increased emphasis was placed on strengthening the Shariah Compliance framework of the Islamic Banking Services. Numerous initiatives were undertaken, from developing and revising Shariah related manuals, improving processes for Shariah vetting and their methodical implementation. Capacity building to meet the training needs of Islamic Banking Services was also re-enforced.
As per Shariah requirements, special care is continuously taken, on an ongoing basis, to ensure that the funds and products of Islamic Banking are managed separately from the conventional banking side. All funds obtained, invested and shared are in Halal modes and investments, under my supervision as the Shariah Advisor of the Bank.
As Shariah Advisor, I have reviewed each class of transactions conducted during the year. Relevant documentation and procedures adopted in this connection have also been reviewed and vetted by me. In order to facilitate this work Shariah Audit and Shariah Compliance departments are functioning under my supervision.
In my opinion, affairs of Askari Bank Limited - Islamic Banking have been carried out in accordance with rules and principles of Shariah, SBP regulations and guidelines related to Shariah compliance and other rules, as well as with specific fatawa and rulings issued by me, as Shariah Advisor, from time to time.
Besides, the allocation of funds, weightages, profit sharing ratios, profits and charging of losses (if any), relating to PLS accounts conform to the basis vetted by me as the Shariah advisor, in accordance with the Shariah rules and principles.
Any earnings that have been realized from sources, or means, prohibited by Shariah rules and principles have been credited to charity account.
We remain fully committed to contributing to capacity building and promoting the cause of Islamic Banking in Pakistan.
May Allah Almighty bless our efforts!
Dr. Muhammad Tahir Mansoori
Shariah Advisor
131
Consolidated Financial Statements of
Askari Bank LimitedFor the year ended December 31, 2010

132
This page is intentially left blank
133
Auditors’ Report to the Members of Askari Bank Limited
We have audited the annexed consolidated financial statements comprising consolidated statement of financial position of Askari Bank Limited (“the Bank”) as at December 31, 2010 and the related consolidated profit and loss account, consolidated statement of comprehensive income, consolidated cash flow statement and consolidated statement of changes in equity together with the notes forming part thereof, for the year then ended. These financial statements include unaudited certified returns from the branches, except for 20 branches which have been audited by us and 1 branch audited by auditors abroad. The financial statements of one of the subsidiary companies, Askari Securities Limited were audited by another firm of chartered accountants, whose report has been furnished to us and our opinion in so far as it relates to the amounts included for this subsidiary, is based solely on the report of other auditor. Further the consolidated profit and loss account, consolidated statement of comprehensive income, consolidated cash flow statement and consolidated statement of changes in equity include amounts relating to the six months period from 01 January 2010 to 30 June 2010 which have been extracted from the financial statements of Askari Investment Management Limited for the year ended 30 June 2010 which were audited by another firm of chartered accountants, whose report has been furnished to us and our opinion in so far as it relates to the amounts included for this subsidiary, is based solely on the report of other auditor.
These consolidated financial statements are responsibility of the Bank’s management. Our responsibility is to express our opinion on these consolidated financial statements based on our audit.
We conducted our audit in accordance with the auditing standards as applicable in Pakistan. These standards require that we plan and perform the audit to obtain reasonable assurance about whether the above said statements are free of any material misstatement. An audit includes examining, on a test basis, evidence supporting the amounts and disclosures in the above said statements. An audit also includes assessing the accounting policies and significant estimates made by management, as well as, evaluating the overall presentation of the above said statements. We believe that our audit provides a reasonable basis for our opinion.
In our opinion the consolidated financial statements present fairly the financial position of Askari Bank Limited as at December 31, 2010 and the results of its operations, its cash flows and changes in equity for the year then ended in accordance with the approved accounting standards as applicable in Pakistan.
The consolidated financial statements of the Bank for the year ended December 31, 2009 were audited by another firm of chartered accountants who had expressed an unqualified opinion thereon vide their report dated February 23, 2010.
Islamabad KPMG Taseer Hadi & Co.February 21, 2011 Chartered Accountants
Engagement Partner Muhammad Rehan Chughtai
KPMG Taseer Hadi & Co., a Partnership firm registered in Pakistanand a member firm of the KPMG network of independent memberfirms affiliated with KPMG International Cooperative(“KPMG International”), a Swiss entity.
KPMG Taseer Hadi & Co.Chartered AccountantsSixth Floor, State Life Building No. 5Jinnah Avenue, Blue AreaIslamabad, Pakistan
Telephone + 92 (51) 282 3558 + 92 (51) 282 5956Fax + 92 (51) 282 2671Internet www.kpmg.com.pk
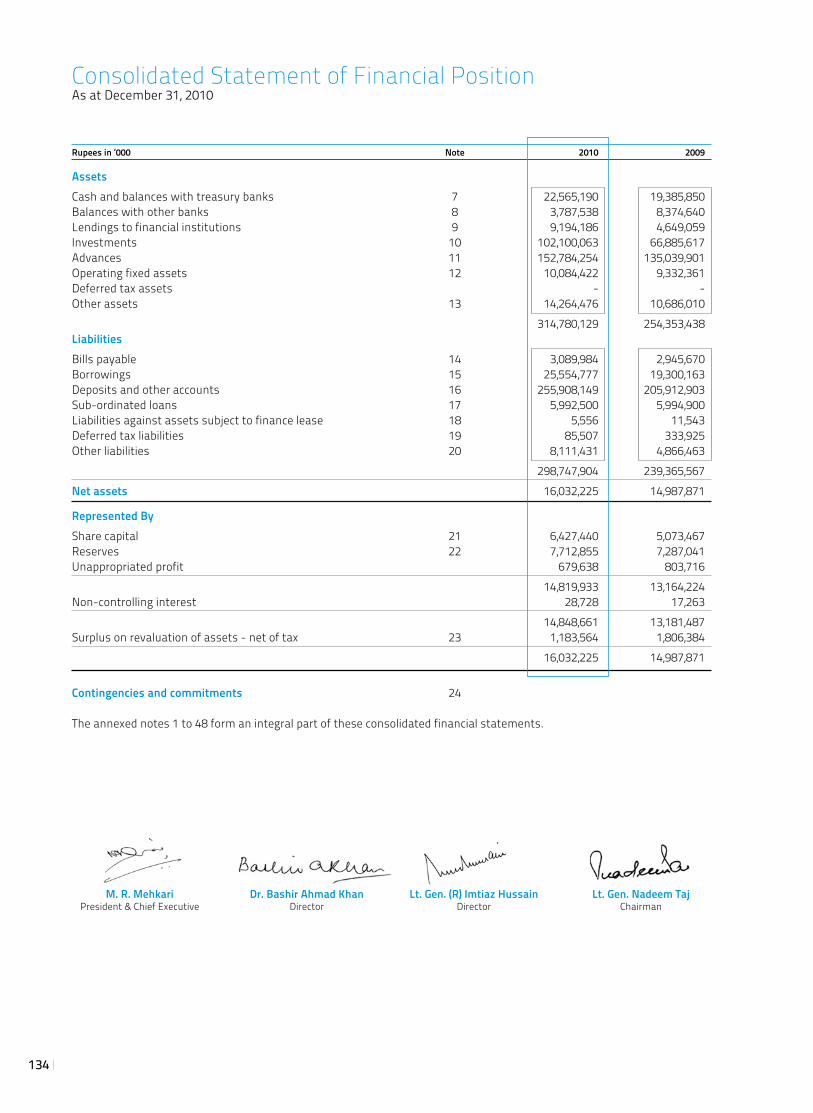
134
Rupees in ‘000 Note 2010 2009
AssetsCash and balances with treasury banks 7 22,565,190 19,385,850 Balances with other banks 8 3,787,538 8,374,640 Lendings to financial institutions 9 9,194,186 4,649,059 Investments 10 102,100,063 66,885,617 Advances 11 152,784,254 135,039,901 Operating fixed assets 12 10,084,422 9,332,361 Deferred tax assets - - Other assets 13 14,264,476 10,686,010 314,780,129 254,353,438 LiabilitiesBills payable 14 3,089,984 2,945,670 Borrowings 15 25,554,777 19,300,163 Deposits and other accounts 16 255,908,149 205,912,903 Sub-ordinated loans 17 5,992,500 5,994,900 Liabilities against assets subject to finance lease 18 5,556 11,543 Deferred tax liabilities 19 85,507 333,925 Other liabilities 20 8,111,431 4,866,463 298,747,904 239,365,567 Net assets 16,032,225 14,987,871
Represented ByShare capital 21 6,427,440 5,073,467 Reserves 22 7,712,855 7,287,041 Unappropriated profit 679,638 803,716 14,819,933 13,164,224 Non-controlling interest 28,728 17,263 14,848,661 13,181,487 Surplus on revaluation of assets - net of tax 23 1,183,564 1,806,384 16,032,225 14,987,871
Contingencies and commitments 24
The annexed notes 1 to 48 form an integral part of these consolidated financial statements.
Consolidated Statement of Financial PositionAs at December 31, 2010
M. R. Mehkari Dr. Bashir Ahmad Khan Lt. Gen. (R) Imtiaz Hussain Lt. Gen. Nadeem Taj President & Chief Executive Director Director Chairman
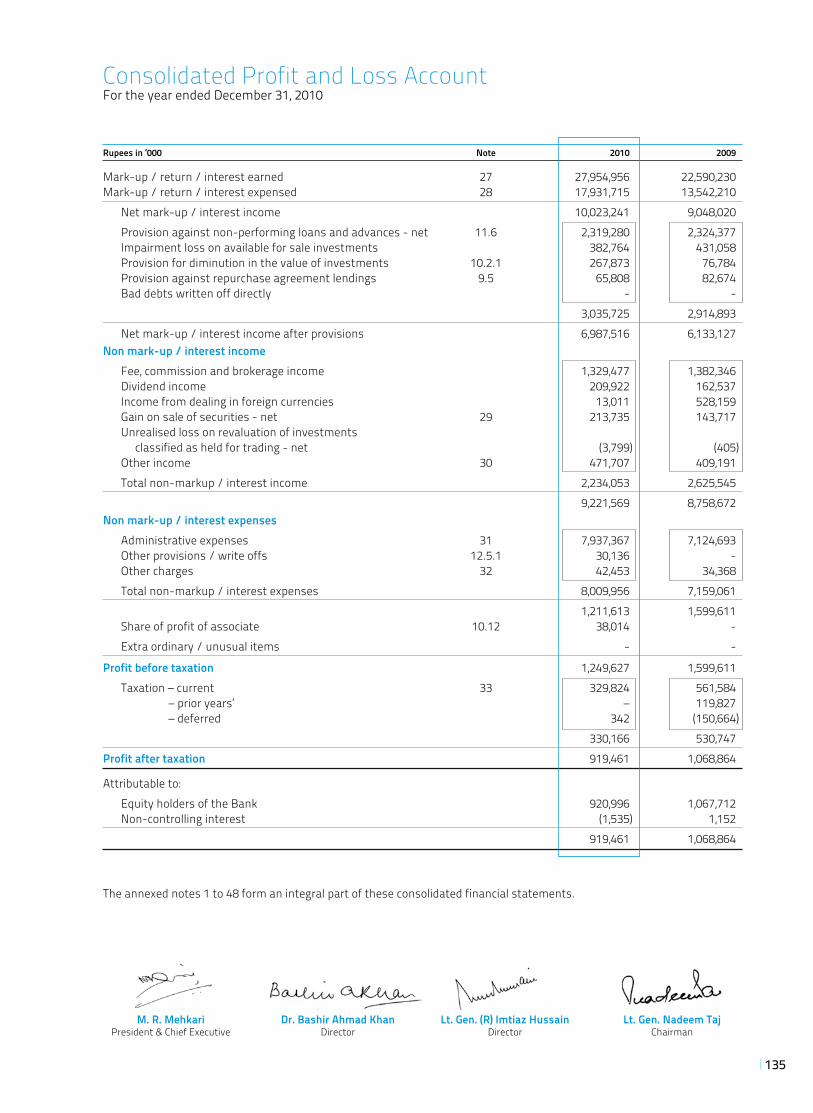
135
Rupees in ‘000 Note 2010 2009
Mark-up / return / interest earned 27 27,954,956 22,590,230 Mark-up / return / interest expensed 28 17,931,715 13,542,210 Net mark-up / interest income 10,023,241 9,048,020 Provision against non-performing loans and advances - net 11.6 2,319,280 2,324,377 Impairment loss on available for sale investments 382,764 431,058 Provision for diminution in the value of investments 10.2.1 267,873 76,784 Provision against repurchase agreement lendings 9.5 65,808 82,674 Bad debts written off directly - - 3,035,725 2,914,893 Net mark-up / interest income after provisions 6,987,516 6,133,127 Non mark-up / interest income Fee, commission and brokerage income 1,329,477 1,382,346 Dividend income 209,922 162,537 Income from dealing in foreign currencies 13,011 528,159 Gain on sale of securities - net 29 213,735 143,717 Unrealised loss on revaluation of investments classified as held for trading - net (3,799) (405) Other income 30 471,707 409,191 Total non-markup / interest income 2,234,053 2,625,545 9,221,569 8,758,672 Non mark-up / interest expenses Administrative expenses 31 7,937,367 7,124,693 Other provisions / write offs 12.5.1 30,136 - Other charges 32 42,453 34,368 Total non-markup / interest expenses 8,009,956 7,159,061 1,211,613 1,599,611 Share of profit of associate 10.12 38,014 - Extra ordinary / unusual items - -
Profit before taxation 1,249,627 1,599,611 Taxation – current 33 329,824 561,584 – prior years’ – 119,827 – deferred 342 (150,664) 330,166 530,747 Profit after taxation 919,461 1,068,864
Attributable to: Equity holders of the Bank 920,996 1,067,712 Non-controlling interest (1,535) 1,152 919,461 1,068,864
The annexed notes 1 to 48 form an integral part of these consolidated financial statements.
Consolidated Profit and Loss AccountFor the year ended December 31, 2010
M. R. Mehkari Dr. Bashir Ahmad Khan Lt. Gen. (R) Imtiaz Hussain Lt. Gen. Nadeem Taj President & Chief Executive Director Director Chairman
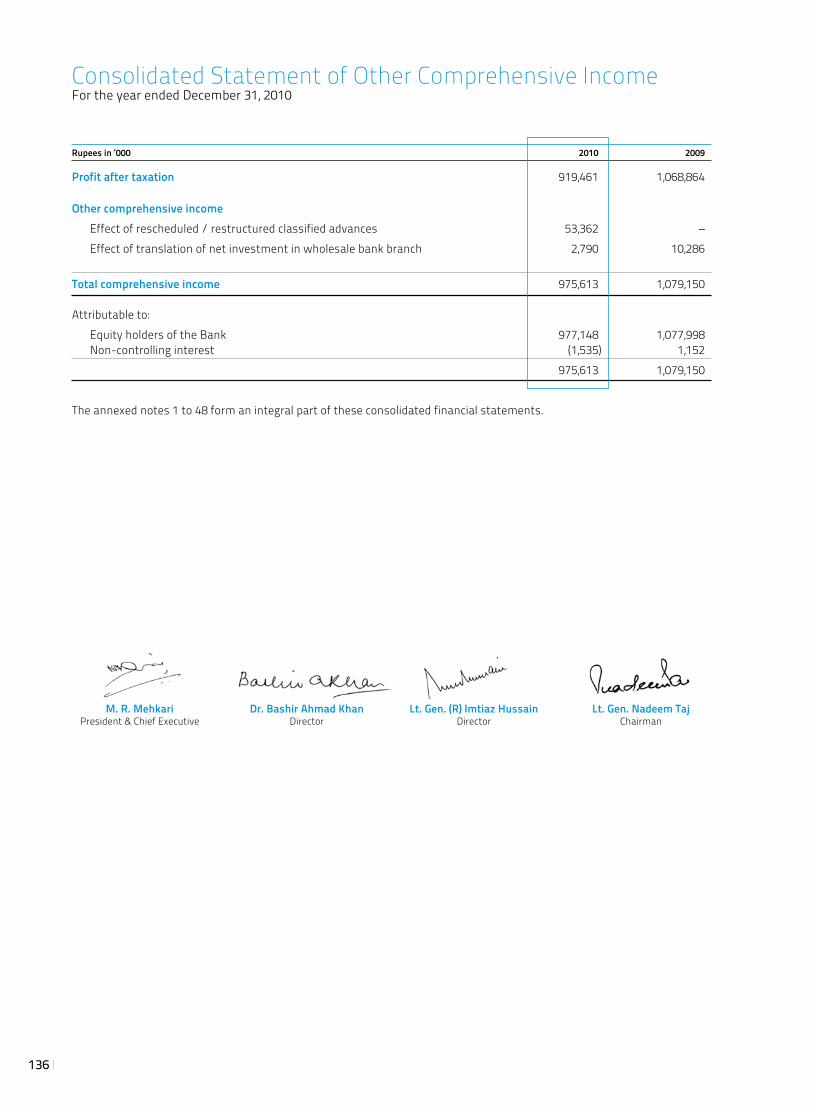
136
Rupees in ‘000 2010 2009
Profit after taxation 919,461 1,068,864
Other comprehensive income Effect of rescheduled / restructured classified advances 53,362 – Effect of translation of net investment in wholesale bank branch 2,790 10,286
Total comprehensive income 975,613 1,079,150
Attributable to: Equity holders of the Bank 977,148 1,077,998 Non-controlling interest (1,535) 1,152 975,613 1,079,150
The annexed notes 1 to 48 form an integral part of these consolidated financial statements.
Consolidated Statement of Other Comprehensive IncomeFor the year ended December 31, 2010
M. R. Mehkari Dr. Bashir Ahmad Khan Lt. Gen. (R) Imtiaz Hussain Lt. Gen. Nadeem Taj President & Chief Executive Director Director Chairman
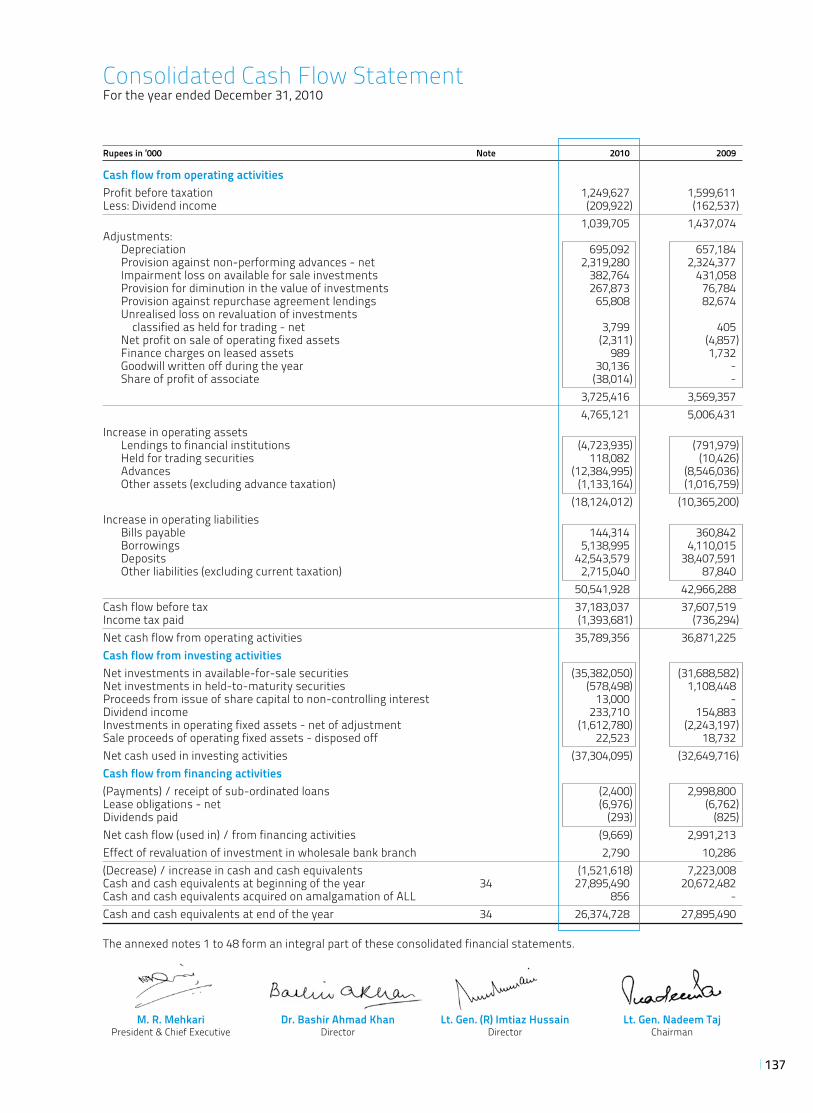
137
Rupees in ‘000 Note 2010 2009
Cash flow from operating activities Profit before taxation 1,249,627 1,599,611 Less: Dividend income (209,922) (162,537) 1,039,705 1,437,074 Adjustments: Depreciation 695,092 657,184 Provision against non-performing advances - net 2,319,280 2,324,377 Impairment loss on available for sale investments 382,764 431,058 Provision for diminution in the value of investments 267,873 76,784 Provision against repurchase agreement lendings 65,808 82,674 Unrealised loss on revaluation of investments classified as held for trading - net 3,799 405 Net profit on sale of operating fixed assets (2,311) (4,857) Finance charges on leased assets 989 1,732 Goodwill written off during the year 30,136 - Share of profit of associate (38,014) - 3,725,416 3,569,357 4,765,121 5,006,431 Increase in operating assets Lendings to financial institutions (4,723,935) (791,979) Held for trading securities 118,082 (10,426) Advances (12,384,995) (8,546,036) Other assets (excluding advance taxation) (1,133,164) (1,016,759) (18,124,012) (10,365,200)Increase in operating liabilities Bills payable 144,314 360,842 Borrowings 5,138,995 4,110,015 Deposits 42,543,579 38,407,591 Other liabilities (excluding current taxation) 2,715,040 87,840 50,541,928 42,966,288 Cash flow before tax 37,183,037 37,607,519 Income tax paid (1,393,681) (736,294)Net cash flow from operating activities 35,789,356 36,871,225 Cash flow from investing activities Net investments in available-for-sale securities (35,382,050) (31,688,582)Net investments in held-to-maturity securities (578,498) 1,108,448 Proceeds from issue of share capital to non-controlling interest 13,000 - Dividend income 233,710 154,883 Investments in operating fixed assets - net of adjustment (1,612,780) (2,243,197)Sale proceeds of operating fixed assets - disposed off 22,523 18,732 Net cash used in investing activities (37,304,095) (32,649,716)Cash flow from financing activities (Payments) / receipt of sub-ordinated loans (2,400) 2,998,800 Lease obligations - net (6,976) (6,762)Dividends paid (293) (825)Net cash flow (used in) / from financing activities (9,669) 2,991,213 Effect of revaluation of investment in wholesale bank branch 2,790 10,286 (Decrease) / increase in cash and cash equivalents (1,521,618) 7,223,008 Cash and cash equivalents at beginning of the year 34 27,895,490 20,672,482 Cash and cash equivalents acquired on amalgamation of ALL 856 - Cash and cash equivalents at end of the year 34 26,374,728 27,895,490
The annexed notes 1 to 48 form an integral part of these consolidated financial statements.
Consolidated Cash Flow StatementFor the year ended December 31, 2010
M. R. Mehkari Dr. Bashir Ahmad Khan Lt. Gen. (R) Imtiaz Hussain Lt. Gen. Nadeem Taj President & Chief Executive Director Director Chairman
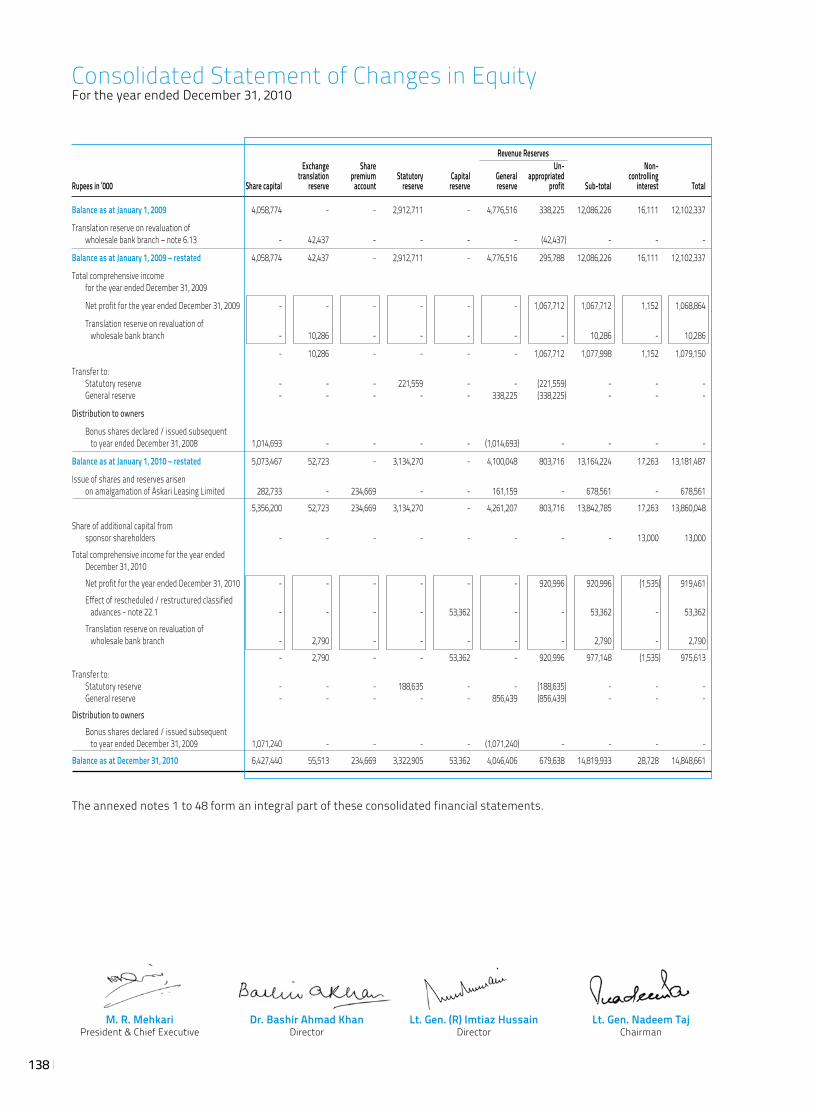
138
Revenue Reserves Exchange Share Un- Non- translation premium Statutory Capital General appropriated controlling Rupees in ‘000 Share capital reserve account reserve reserve reserve profit Sub-total interest Total Balance as at January 1, 2009 4,058,774 - - 2,912,711 - 4,776,516 338,225 12,086,226 16,111 12,102,337
Translation reserve on revaluation of wholesale bank branch – note 6.13 - 42,437 - - - - (42,437) - - -
Balance as at January 1, 2009 – restated 4,058,774 42,437 - 2,912,711 - 4,776,516 295,788 12,086,226 16,111 12,102,337
Total comprehensive income for the year ended December 31, 2009
Net profit for the year ended December 31, 2009 - - - - - - 1,067,712 1,067,712 1,152 1,068,864
Translation reserve on revaluation of wholesale bank branch - 10,286 - - - - - 10,286 - 10,286
- 10,286 - - - - 1,067,712 1,077,998 1,152 1,079,150
Transfer to: Statutory reserve - - - 221,559 - - (221,559) - - - General reserve - - - - - 338,225 (338,225) - - -
Distribution to owners
Bonus shares declared / issued subsequent to year ended December 31, 2008 1,014,693 - - - - (1,014,693) - - - -
Balance as at January 1, 2010 – restated 5,073,467 52,723 - 3,134,270 - 4,100,048 803,716 13,164,224 17,263 13,181,487
Issue of shares and reserves arisen on amalgamation of Askari Leasing Limited 282,733 - 234,669 - - 161,159 - 678,561 - 678,561 5,356,200 52,723 234,669 3,134,270 - 4,261,207 803,716 13,842,785 17,263 13,860,048
Share of additional capital from sponsor shareholders - - - - - - - - 13,000 13,000 Total comprehensive income for the year ended December 31, 2010 Net profit for the year ended December 31, 2010 - - - - - - 920,996 920,996 (1,535) 919,461 Effect of rescheduled / restructured classified advances - note 22.1 - - - - 53,362 - - 53,362 - 53,362 Translation reserve on revaluation of wholesale bank branch - 2,790 - - - - - 2,790 - 2,790 - 2,790 - - 53,362 - 920,996 977,148 (1,535) 975,613 Transfer to: Statutory reserve - - - 188,635 - - (188,635) - - - General reserve - - - - - 856,439 (856,439) - - - Distribution to owners Bonus shares declared / issued subsequent to year ended December 31, 2009 1,071,240 - - - - (1,071,240) - - - - Balance as at December 31, 2010 6,427,440 55,513 234,669 3,322,905 53,362 4,046,406 679,638 14,819,933 28,728 14,848,661
The annexed notes 1 to 48 form an integral part of these consolidated financial statements.
Consolidated Statement of Changes in EquityFor the year ended December 31, 2010
M. R. Mehkari Dr. Bashir Ahmad Khan Lt. Gen. (R) Imtiaz Hussain Lt. Gen. Nadeem Taj President & Chief Executive Director Director Chairman
139
Notes to the Consolidated Financial StatementsFor the year ended December 31, 2010
1. STATUS AND NATURE OF BUSINESS The Group consists of Askari Bank Limited, the holding company, Askari Investment Management Limited, a wholly
owned subsidiary company and Askari Securities Limited, a partly owned subsidiary company.
Askari Bank Limited (the Bank) was incorporated in Pakistan on October 09, 1991 as a Public Limited Company and is listed on the Karachi, Lahore and Islamabad Stock Exchanges. The registered office of the Bank is situated at AWT Plaza, The Mall, Rawalpindi. The Bank obtained its business commencement certificate on February 26, 1992 and started operations from April 01, 1992. Army Welfare Trust directly and indirectly holds a significant portion of the Bank’s share capital at the year end. The Bank has 235 branches (2009: 226 branches); 234 in Pakistan and Azad Jammu and Kashmir, including 31 (2009: 31) Islamic Banking branches, 16 (2009: 22) sub-branches and a wholesale bank branch in the Kingdom of Bahrain.
The Bank is a scheduled commercial bank and is principally engaged in the business of banking as defined in the Banking Companies Ordinance, 1962.
Askari Investment Management Limited (AIML) was incorporated in Pakistan on May 30, 2005 as a public limited company. AIML is a Non Banking Finance Company (NBFC), under license by the Securities and Exchange Commission of Pakistan (SECP) to undertake asset management and investment advisory services under the Non-Banking Finance Companies and Notified Entities Regulations, 2007 (NBFC & NE Regulations). The license was obtained on September 21, 2005. AIML is a wholly owned subsidiary of the Bank with its registered office in Islamabad. AIML obtained its certificate of commencement of business on September 22, 2005. During the year the financial year end of AIML was changed from June 30 to December 31.
Askari Securities Limited (ASL) was incorporated in Pakistan on October 1, 1999 under the Companies Ordinance, 1984 as a public limited company and obtained corporate membership of the Islamabad Stock Exchange (Guarantee) Limited on December 24, 1999 and Karachi Stock Exchange (Guarantee) Limited on May 26, 2010. The Bank acquired 74% of Ordinary Shares of ASL on October 1, 2007. The principal activity includes share brokerage, investment advisory and consultancy services. The registered office of the Company is situated at AWT Plaza, The Mall, Rawalpindi.
The financial statements of AIML and ASL have been consolidated based on their audited financial statements for the half year ended December 31, 2010. Figures for consolidated profit and loss account, statement of comprehensive income, cash flow statement and statement of changes in equity from the period from January 1, 2010 to June 30, 2010 have been extracted from the audited financial statements of these subsidiaries for the year ended June 30, 2010.
2. BUSINESS COMBINATION The amalgamation of formerly Askari Leasing Limited (ALL) with and into the Bank, was completed during the first
quarter of 2010, whereby the entire undertaking of ALL, including all properties, assets, liabilities, rights and obligations of ALL as at March 2, 2010 were amalgamated with and vest in the Bank in consideration for issue of 28.273 million fully paid ordinary shares to the shareholders of ALL which rank pari passu with the existing shares of the Bank.
ALL was incorporated in Pakistan as a public limited company on August 1, 1993 and was granted certificate of commencement of business on November 3, 1993. ALL was listed on Karachi, Lahore and Islamabad Stock Exchanges and principally engaged in the business of leasing. On the date of amalgamation, AWT held 57.66% of ALL’s share capital.
3. BASIS OF PRESENTATION3.1 These consolidated financial statements have been presented in accordance with the requirements of format
prescribed by the State Bank of Pakistan’s BSD Circular No. 4 dated February 17, 2006.
3.2 In accordance with the directives of the Federal Government regarding shifting of the banking system to Islamic modes, the State Bank of Pakistan (SBP) has issued various circulars from time to time. One permissible form of trade related mode of financing comprises of purchase of goods by the Bank from its customers and resale to them at appropriate mark-up in price on a deferred payment basis. The purchases and sales arising under these arrangements are not reflected in these consolidated financial statements as such but are restricted to the amount of facilities actually utilized and the appropriate portion of mark-up thereon.
3.3 The financial results of the Islamic banking branches have been consolidated in these consolidated financial statements for reporting purposes, after eliminating material inter-branch transactions / balances. Key figures of the Islamic banking branches are disclosed in Annexure-2 to the unconsolidated financial statements.
3.4 Items included in the consolidated financial statements are measured using the currency of the primary economic environment in which the Group operates. The consolidated financial statements are presented in Pak. Rupee, which is the Group’s functional currency. Figures have been rounded off to the nearest thousand of rupees unless otherwise stated.
140
4. STATEMENT OF COMPLIANCE These consolidated financial statements have been prepared in accordance with the approved accounting standards
as applicable in Pakistan and the requirements of the Companies Ordinance, 1984 and the Banking Companies Ordinance, 1962. Approved accounting standards comprise of such International Financial Reporting Standards (IFRS) issued by the International Accounting Standard Board (IASB) and Islamic Financial Accounting Standards issued by the Institute of Chartered Accountants of Pakistan as are notified under the Companies Ordinance, 1984, provisions of and directives issued under the Companies Ordinance, 1984 and the Banking Companies Ordinance, 1962 or directives issued by the Securities and Exchange Commission of Pakistan and the State Bank of Pakistan. In case requirements differ, the provisions or directives of the Companies Ordinance, 1984, the Banking Companies Ordinance, 1962 or the requirements of the said directives shall prevail.
International Accounting Standard 39, “Financial Instruments: Recognition and Measurement”, International Accounting Standard 40, “Investment Property” and International Financial Reporting Standard 7, ”Financial Instruments: Disclosure” are not applicable to banking companies in Pakistan. Accordingly, the requirements of these Standards have not been considered in the preparation of these consolidated financial statements. However, investments have been classified and valued in accordance with the requirements prescribed by the State Bank of Pakistan through various circulars.
In addition, Securities and Exchange Commission of Pakistan (SECP) has notified the Islamic Financial Accounting Standard (IFAS) 1 - Murabaha issued by the Institute of Chartered Accountant of Pakistan. IFAS 1 was effective for financial periods beginning on or after January 1, 2006. The IFAS 1 has not been adopted by standalone Islamic branches of conventional banks pending resolution of certain issues e.g. invoicing of goods, recording of inventories, concurrent application with other approved accounting standards in place for conventional banks, etc. Pakistan Banks’ Association and Modarba Association of Pakistan have taken up the issue with SBP and SECP.
Standards, interpretations and amendments to published approved standards that are not yet effective The following standards, amendments and interpretations of approved accounting standards are effective for
accounting periods beginning on or after January 1, 2011:
- Amendment to IAS 32 Financial Instruments: Presentation – Classification of Rights Issues (effective for annual periods beginning on or after February 01, 2010). The IASB amended IAS 32 to allow rights, options or warrants to acquire a fixed number of the entity’s own equity instruments for a fixed amount of any currency to be classified as equity instruments provided the entity offers the rights, options or warrants pro rata to all of its existing owners of the same class of its own non-derivative equity instruments. This interpretation has no impact on the Group’s financial statements.
- IFRIC 19 Extinguishing Financial Liabilities with Equity Instruments (effective for annual periods beginning on or after July 01, 2010). This interpretation provides guidance on the accounting for debt for equity swaps. This interpretation has no impact on Group’s financial statements.
- IAS 24 Related Party Disclosures (revised 2009 – effective for annual periods beginning on or after January 01, 2011). The revision amends the definition of a related party and modifies certain related party disclosure requirements for government-related entities. The amendment would result in certain changes in disclosures.
- Amendments to IFRIC 14 IAS 19 – The Limit on a Defined Benefit Assets, Minimum Funding Requirements and their Interaction (effective for annual periods beginning on or after January 01, 2011). These amendments remove unintended consequences arising from the treatment of prepayments where there is a minimum funding requirement. These amendments result in prepayments of contributions in certain circumstances being recognised as an asset rather than an expense. This amendment is not likely to have any impact on Group’s financial statements.
- Improvements to IFRSs 2010 – In May 2010, the IASB issued improvements to IFRSs 2010, which comprise of 11 amendments to 7 standards. Effective dates, early application and transitional requirements are addressed on a standard by standard basis. The majority of amendments are effective for annual periods beginning on or after January 1, 2011. The amendments include list of events or transactions that require disclosure in the interim financial statements and fair value of award credits under the customer loyalty programmes to take into account the amount of discounts or incentives that otherwise would be offered to customers that have not earned the award credits. Certain of these amendments will result in increased disclosures in the consolidated financial statements.
- Amendments to IAS 12 – deferred tax on investment property (effective for annual periods beginning on or after January 1, 2012). The 2010 amendment provides an exception to the measurement principle in respect of investment property measured using the fair value model in accordance with IAS 40 Investment Property. The amendment has no impact on financial statements of the Group.
Notes to the Consolidated Financial StatementsFor the year ended December 31, 2010
141
5. BASIS OF MEASUREMENT These consolidated financial statements have been prepared under the historical cost convention as modified for
certain investments which are carried at fair value and freehold and leasehold land which are shown at revalued amounts.
Use of critical accounting estimates and judgments The preparation of consolidated financial statements in conformity with approved accounting standards as applicable
in Pakistan requires the use of certain accounting estimates. It also requires management to exercise its judgment in the process of applying the Group’s accounting policies. The Group uses estimates and assumptions concerning the future. The resulting accounting estimate will, by definition, seldom equal the related actual results. Estimates and judgments are continually evaluated and are based on historical experience and other factors, including expectations of future events that are believed to be reasonable under the circumstances. The areas involving a higher degree of judgment or complexity, or areas where assumptions and estimates are significant to the consolidated financial statements are as follow:
i) classification of investments (note 6.6) ii) provision against investments (note 6.6), advances (note 6.7) and other assets (note 6.9) iii) valuation and impairment of available for sale securities (note 6.6) iv) useful life of property and equipments, revaluation of land (note 6.8) v) taxation (note 6.10) vi) staff retirement benefits (note 6.11)
6. SUMMARY OF SIGNIFICANT ACCOUNTING POLICIES6.1 Amalgamation of entity under common control is accounted for by applying Predecessor Value Method.6.2 SBP vide BSD circular letter No. 7 of 2010 dated April 20, 2010 has clarified that two statement approach shall be
adopted in the preparation of quarterly, half yearly and annual financial statements as mentioned in the revised IAS-1 “Presentation of Financial Statements”. Accordingly, the Group has presented consolidated Profit and Loss account and consolidated Statement of Comprehensive Income separately in these consolidated financial statements. Further in accordance with this circular, the Group has opted not to present the changes in fair value of available for sale securities in consolidated Statement of Comprehensive Income and accordingly such changes are included in surplus/ (deficit) on revaluation of available for sale securities.
6.3 Basis of consolidation Subsidiaries The consolidated financial statements include the financial statements of the Bank and its subsidiary companies,
AIML 100% holding (2009: 100%) and ASL 74% holding (2009: 74%). Subsidiaries are entities controlled by the Group. Control exists when the Group has the power to govern the financial
and operating policies of the entities. The financial statements of subsidiaries are included in the consolidated financial statements from the date that control commences until the date that control ceases.
The assets and liabilities of subsidiary companies have been consolidated on a line by line basis and the carrying value of investment held by the holding company is eliminated against holding company’s share in paid up capital of the subsidiaries.
Material intra-group balances and transactions have been eliminated. Non-controlling interest are that part of net results of the operations and of net assets of the subsidiary attributable
to interests which are not owned by the parent company. Non-controlling interest is presented as separate item in the consolidated financial statements.
Associate Associate is the entity in which the group has significant influence, but not control over the financial and operating
policies. Significant influence exists when the Group holds between 20 and 50 percent of the voting power of another entity. The consolidated financial statements include Group’s share of the results of the associate. Investment in associate is accounted for using the equity method of accounting and was initially recognized at cost.
6.4 Cash and cash equivalents Cash and cash equivalents comprise of cash and balances with treasury banks, balances with other banks and call
money lendings.
6.5 Sale and repurchase agreements Securities sold under repurchase agreement (repo) are retained in the consolidated financial statements as
investments and a liability for consideration received is included in borrowings. Conversely, consideration for securities purchased under resale agreement (reverse repo) are included in lendings to financial institutions. The difference between sale and repurchase / purchase and resale price is recognised as mark-up / return expensed and earned on
142
a time proportion basis as the case may be. Repo and reverse repo balances are reflected under borrowings from and lendings to financial institutions respectively.
6.6 Investments Investments are classified as follows: Held for trading These represent securities acquired with the intention to trade by taking advantage of short-term market / interest rate
movements. These are marked to market and surplus / deficit arising on revaluation of ‘held for trading’ investments is taken to consolidated profit and loss account in accordance with the requirements prescribed by the State Bank of Pakistan through various circulars.
Available for sale These represent securities which do not fall under ‘held for trading’ or ‘held to maturity’ categories. In accordance
with the requirements of the State Bank of Pakistan’s BSD Circular No. 20 dated August 04, 2000, available for sale securities for which ready quotations are available on Reuters Page (PKRV) or Stock Exchanges are valued at market value and the resulting surplus / deficit is kept in a separate account and is shown below the shareholders’ equity in the consolidated statement of financial position. Where the decline in prices of available for sale securities is significant or prolonged, it is considered impaired and included in consolidated profit and loss account. Foreign securities are carried at fair value, based on their current bid prices in active markets.
Unquoted equity securities are valued at the lower of cost and break-up value. Break-up value of equity securities is calculated with reference to the net assets of the investee as per the latest audited financial statements. Investments in other unquoted securities are valued at cost less impairment losses, if any.
Held to maturity These represent securities acquired with the intention and ability to hold them upto maturity. These are carried at
amortized cost less impairment, if any, in accordance with the requirements prescribed by the State Bank of Pakistan through various circulars.
All purchases and sale of investment that require delivery within the time frame established by regulations or market convention are recognized at the trade date, which is the date the Group commits to purchase or sell the investments.
6.7 Advances Advances are stated net of provisions for non-performing advances. Provision for advances is determined in
accordance with the requirements of the Prudential Regulations issued by the State Bank of Pakistan from time to time. In addition, a general provision is maintained for advances other than consumer advances as per details given in note 11.6.3.
The provisions against non-performing advances are charged to the consolidated profit and loss account. Advances are written off when there is no realistic prospect of recovery.
The State Bank of Pakistan has notified for adoption of “Islamic Financial Accounting Standard 2 Ijarah” (IFAS-2) which is applicable for accounting period beginning on or after January 01, 2009. Consequent to the adoption of IFAS-2, such Ijarahs booked on or after January 01, 2009 are stated at cost less accumulated depreciation and impairment if any, and are shown under advances.
Leases where the Group transfers substantially all the risks and rewards incidental to ownership of an asset to the lessee are classified as finance leases. A receivable is recognised at an amount equal to the present value of the lease payments including any guaranteed residual value. Finance lease receivables are included in advances to the customers.
The rentals received / receivable on above Ijarahs are recorded as income / revenue. Depreciation on Ijarah assets is charged to consolidated profit and loss account by applying the straight line method whereby the depreciable value of Ijarah assets is written off over the Ijarah period. The Group charges depreciation from the date of delivery of respective assets to Mustajir upto the date of maturity / termination of Ijarah agreement.
6.8 Capital work-in-progress, operating fixed assets and depreciation
Capital work-in-progress Capital work-in-progress is stated at cost less impairment loss, if any.
Owned assets Fixed assets are stated at cost less impairment losses and accumulated depreciation except for freehold / leasehold
land. Land is carried at revalued amounts which is not depreciated. Land is revalued by professionally qualified valuers with sufficient regularity to ensure that the net carrying
Notes to the Consolidated Financial StatementsFor the year ended December 31, 2010
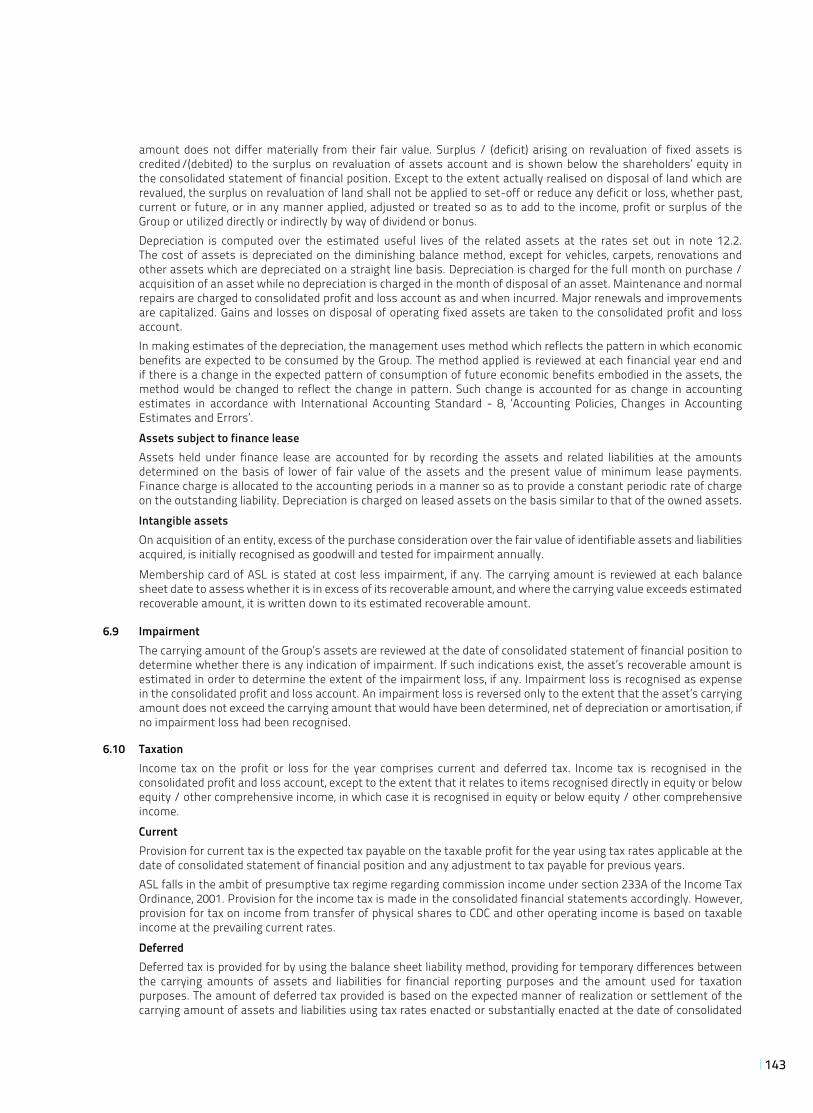
143
amount does not differ materially from their fair value. Surplus / (deficit) arising on revaluation of fixed assets is credited/(debited) to the surplus on revaluation of assets account and is shown below the shareholders’ equity in the consolidated statement of financial position. Except to the extent actually realised on disposal of land which are revalued, the surplus on revaluation of land shall not be applied to set-off or reduce any deficit or loss, whether past, current or future, or in any manner applied, adjusted or treated so as to add to the income, profit or surplus of the Group or utilized directly or indirectly by way of dividend or bonus.
Depreciation is computed over the estimated useful lives of the related assets at the rates set out in note 12.2. The cost of assets is depreciated on the diminishing balance method, except for vehicles, carpets, renovations and other assets which are depreciated on a straight line basis. Depreciation is charged for the full month on purchase / acquisition of an asset while no depreciation is charged in the month of disposal of an asset. Maintenance and normal repairs are charged to consolidated profit and loss account as and when incurred. Major renewals and improvements are capitalized. Gains and losses on disposal of operating fixed assets are taken to the consolidated profit and loss account.
In making estimates of the depreciation, the management uses method which reflects the pattern in which economic benefits are expected to be consumed by the Group. The method applied is reviewed at each financial year end and if there is a change in the expected pattern of consumption of future economic benefits embodied in the assets, the method would be changed to reflect the change in pattern. Such change is accounted for as change in accounting estimates in accordance with International Accounting Standard - 8, ‘Accounting Policies, Changes in Accounting Estimates and Errors’.
Assets subject to finance lease Assets held under finance lease are accounted for by recording the assets and related liabilities at the amounts
determined on the basis of lower of fair value of the assets and the present value of minimum lease payments. Finance charge is allocated to the accounting periods in a manner so as to provide a constant periodic rate of charge on the outstanding liability. Depreciation is charged on leased assets on the basis similar to that of the owned assets.
Intangible assets On acquisition of an entity, excess of the purchase consideration over the fair value of identifiable assets and liabilities
acquired, is initially recognised as goodwill and tested for impairment annually.
Membership card of ASL is stated at cost less impairment, if any. The carrying amount is reviewed at each balance sheet date to assess whether it is in excess of its recoverable amount, and where the carrying value exceeds estimated recoverable amount, it is written down to its estimated recoverable amount.
6.9 Impairment The carrying amount of the Group’s assets are reviewed at the date of consolidated statement of financial position to
determine whether there is any indication of impairment. If such indications exist, the asset’s recoverable amount is estimated in order to determine the extent of the impairment loss, if any. Impairment loss is recognised as expense in the consolidated profit and loss account. An impairment loss is reversed only to the extent that the asset’s carrying amount does not exceed the carrying amount that would have been determined, net of depreciation or amortisation, if no impairment loss had been recognised.
6.10 Taxation Income tax on the profit or loss for the year comprises current and deferred tax. Income tax is recognised in the
consolidated profit and loss account, except to the extent that it relates to items recognised directly in equity or below equity / other comprehensive income, in which case it is recognised in equity or below equity / other comprehensive income.
Current Provision for current tax is the expected tax payable on the taxable profit for the year using tax rates applicable at the
date of consolidated statement of financial position and any adjustment to tax payable for previous years. ASL falls in the ambit of presumptive tax regime regarding commission income under section 233A of the Income Tax
Ordinance, 2001. Provision for the income tax is made in the consolidated financial statements accordingly. However, provision for tax on income from transfer of physical shares to CDC and other operating income is based on taxable income at the prevailing current rates.
Deferred Deferred tax is provided for by using the balance sheet liability method, providing for temporary differences between
the carrying amounts of assets and liabilities for financial reporting purposes and the amount used for taxation purposes. The amount of deferred tax provided is based on the expected manner of realization or settlement of the carrying amount of assets and liabilities using tax rates enacted or substantially enacted at the date of consolidated
144
Notes to the Consolidated Financial StatementsFor the year ended December 31, 2010
statement of financial position, expected to be applicable at the time of its reversal. A deferred tax asset is recognised only to the extent that it is probable that the future taxable profit will be available and credits can be utilized. Deferred tax assets are reduced to the extent it is no longer probable that the related tax benefit will be realised.
Deferred tax, on revaluation of investments, if any, is recognised as an adjustment to surplus / (deficit) arising on such revaluation.
6.11 Staff retirement benefits Defined benefit plan The Bank and AIML operate an approved funded gratuity scheme for all its regular employees. Contributions are made
in accordance with the actuarial recommendation. The actuarial valuation is carried out periodically using “Projected Unit Credit Method”. The actuarial gains / losses in excess of corridor limit (10% of higher of present value of obligation and fair value of plan assets) are recognized over the expected remaining working life of their employees.
ASL operates an unfunded gratuity scheme for all its regular employees. The employees are entitled to gratuity on completion of three years of continuous service with the Company. The gratuity is payable on the basis of last drawn basic salary for E-1 grade employees and gross for other employees for each completed year of service.
Defined contribution plan The Bank operates a recognised provident fund scheme for all its regular employees for which equal monthly
contributions are made both by the Bank and by the employees at the rate of 8.33% of the basic salary of the employee. AIML operates a funded staff provident fund scheme as a defined contribution plan for all eligible employees. Equal
monthly contributions are made by the Company and the staff at the rate of 6% of the salary. ASL operates an unfunded provident fund scheme for all its regular employees for which equal monthly contributions
are made by the Company and the employees at the rate of 10% of basic salary of the employee. Compensated absences The Bank grants compensated absences to all its regular employees. Liability for unfunded scheme is recognized on
the basis of actuarial valuation using the “Projected Unit Credit Method”. Provision for the year is charged to profit and loss account. The amount recognised in the consolidated statement of financial position represents the present value of defined benefit obligations.
AIML also provides for compensated absences. Obligation under the scheme are charged to income currently.
6.12 Revenue recognition Mark-up / interest on advances and return on investments is recognised on accrual basis except on classified
advances and investments which is recognized on receipt basis. Mark-up / interest on rescheduled / restructured advances and investments is recognised as permitted by the regulations of the State Bank of Pakistan or overseas regulatory authority of the country where branch operates, except where in the opinion of the management it would not be prudent to do so.
Fees, commission and brokerage income is recognised at the time of performance of service. Dividend income is recognised when Group’s right to receive the income is established. Gains and losses on sale of investments are included in income currently. Remuneration for assets management services is recognised on accrual basis.
6.13 Foreign currencies Foreign currency transactions Foreign currency transactions are translated into Pak. Rupee at the exchange rates prevailing on the date of transaction.
Monetary assets and liabilities in foreign currencies are translated to Pak. Rupee at the exchange rates prevailing at the date of consolidated statement of financial position. Outstanding foreign bills purchased are valued at the rates applicable to the remaining maturities. Exchange gains and losses are included in consolidated profit and loss account currently.
Foreign operation The assets and liabilities of wholesale bank branch are translated to Pak. Rupee at exchange rates prevailing at the
date of consolidated statement of financial position. The results of foreign operations are translated at the average rate of exchange for the year.
Translation gains and losses Translation gains and losses were previously included in the consolidated profit and loss account, however, now
translation gains and losses arising on revaluation of net investment in foreign operations are taken to equity under “Exchange Translation Reserve” and on disposal are recognised in consolidated profit and loss account. Accordingly, comparative figures have been restated.
145
Commitments Commitments for outstanding forward foreign exchange contracts are valued at the rates applicable to the remaining
maturities. Contingent liabilities / commitments for letters of credits and letters of guarantees denominated in foreign currencies are translated into Pak. Rupee at the rates of exchange ruling on the date of consolidated statement of financial position.
6.14 Provisions Provisions are recognised when there are present, legal or constructive obligations as a result of past events, it is
probable that an out flow of resources embodying economic benefits will be required to settle the obligation and a reliable estimate of the amounts can be made. Provision for guarantee claims and other off balance sheet obligations is recognized when intimated and reasonable certainty exists to settle the obligations. Expected recoveries are recognized by debiting customer accounts. Charge to consolidated profit and loss account is stated net off expected recoveries.
6.15 Off-setting Financial assets and financial liabilities are only set-off and the net amount is reported in the consolidated financial
statements when there is a legally enforceable right to set-off the recognised amount and the Group intends either to settle on a net basis, or to realise the assets and to settle the liabilities simultaneously.
6.16 Appropriations subsequent to the date of consolidated statement of financial position Appropriations subsequent to year end are recognised during the year in which those appropriations are made.
6.17 Segment reporting A segment is a distinguishable component of the Group that is engaged in providing products or services (business
segment) or in providing product or services within a particular economic environment (geographical segment), which is subject to risks and rewards that are different from those of other segments. The Group’s primary format of reporting is based on business segments.
6.17.1 Business segment Corporate financing Corporate financing includes corporate and investment banking activities such as mergers and acquisition, underwriting,
privatization, securitisation, IPO’s related activities and secondary private placements. Trading and Sales Trading and sales includes the Group’s treasury and money market activities classified as held for trading. Retail Banking Retail banking segment provides services to small borrowers and include loans, deposits and other transactions with
retail customers and credit card business. Commercial Banking Commercial banking segment provides services related to project finance, export finance, trade finance, leasing, lending,
guarantees, bills of exchange and deposits from corporate customers. Payment and settlement Payment and settlement includes income from payments and collections, funds transfer, clearing and settlement. Agency services Agency services include income from rent of lockers provided to customers. Sub-ordinated loans It represents Term Finance Certificates issued by the Group. Asset Management It includes asset management and investment advisory services provided by AIML under the Non-Banking Finance
Companies and Notified Entities Regulations, 2007 (NBFC & NE Regulations). Retail Brokerage It includes share brokerage, investment advisory and consultancy services provided by ASL.
6.17.2 Geographical segments The Group operates in two geographic regions; Pakistan and the Middle East.
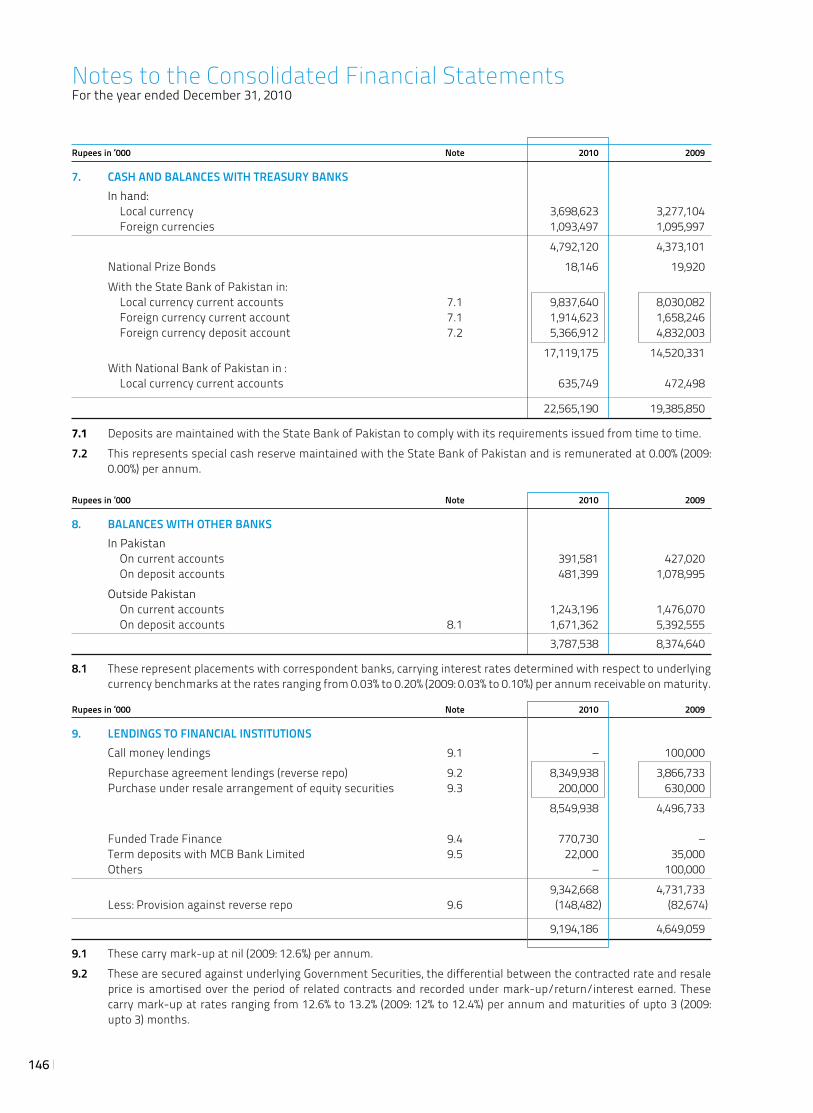
146
Rupees in ‘000 Note 2010 2009
7. CASH AND BALANCES WITH TREASURY BANKS In hand: Local currency 3,698,623 3,277,104 Foreign currencies 1,093,497 1,095,997 4,792,120 4,373,101 National Prize Bonds 18,146 19,920 With the State Bank of Pakistan in: Local currency current accounts 7.1 9,837,640 8,030,082 Foreign currency current account 7.1 1,914,623 1,658,246 Foreign currency deposit account 7.2 5,366,912 4,832,003 17,119,175 14,520,331 With National Bank of Pakistan in : Local currency current accounts 635,749 472,498
22,565,190 19,385,850
7.1 Deposits are maintained with the State Bank of Pakistan to comply with its requirements issued from time to time. 7.2 This represents special cash reserve maintained with the State Bank of Pakistan and is remunerated at 0.00% (2009:
0.00%) per annum.
Rupees in ‘000 Note 2010 2009
8. BALANCES WITH OTHER BANKS In Pakistan On current accounts 391,581 427,020 On deposit accounts 481,399 1,078,995 Outside Pakistan On current accounts 1,243,196 1,476,070 On deposit accounts 8.1 1,671,362 5,392,555 3,787,538 8,374,640
8.1 These represent placements with correspondent banks, carrying interest rates determined with respect to underlying currency benchmarks at the rates ranging from 0.03% to 0.20% (2009: 0.03% to 0.10%) per annum receivable on maturity.
Rupees in ‘000 Note 2010 2009
9. LENDINGS TO FINANCIAL INSTITUTIONS Call money lendings 9.1 – 100,000 Repurchase agreement lendings (reverse repo) 9.2 8,349,938 3,866,733 Purchase under resale arrangement of equity securities 9.3 200,000 630,000 8,549,938 4,496,733
Funded Trade Finance 9.4 770,730 – Term deposits with MCB Bank Limited 9.5 22,000 35,000 Others – 100,000 9,342,668 4,731,733 Less: Provision against reverse repo 9.6 (148,482) (82,674)
9,194,186 4,649,059
9.1 These carry mark-up at nil (2009: 12.6%) per annum.9.2 These are secured against underlying Government Securities, the differential between the contracted rate and resale
price is amortised over the period of related contracts and recorded under mark-up/return/interest earned. These carry mark-up at rates ranging from 12.6% to 13.2% (2009: 12% to 12.4%) per annum and maturities of upto 3 (2009: upto 3) months.
Notes to the Consolidated Financial StatementsFor the year ended December 31, 2010
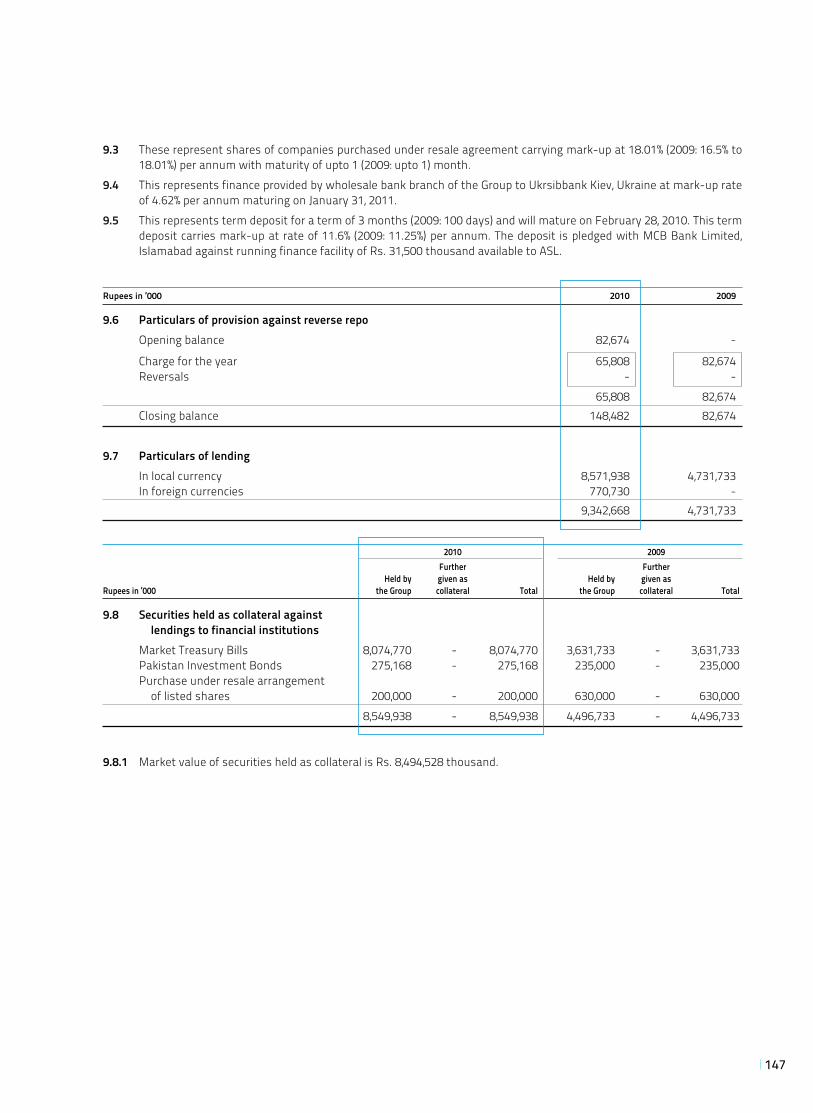
147
9.3 These represent shares of companies purchased under resale agreement carrying mark-up at 18.01% (2009: 16.5% to 18.01%) per annum with maturity of upto 1 (2009: upto 1) month.
9.4 This represents finance provided by wholesale bank branch of the Group to Ukrsibbank Kiev, Ukraine at mark-up rate of 4.62% per annum maturing on January 31, 2011.
9.5 This represents term deposit for a term of 3 months (2009: 100 days) and will mature on February 28, 2010. This term deposit carries mark-up at rate of 11.6% (2009: 11.25%) per annum. The deposit is pledged with MCB Bank Limited, Islamabad against running finance facility of Rs. 31,500 thousand available to ASL.
Rupees in ‘000 2010 2009
9.6 Particulars of provision against reverse repo Opening balance 82,674 -
Charge for the year 65,808 82,674 Reversals - - 65,808 82,674 Closing balance 148,482 82,674
9.7 Particulars of lending In local currency 8,571,938 4,731,733 In foreign currencies 770,730 - 9,342,668 4,731,733
2010 2009 Further Further Held by given as Held by given asRupees in ‘000 the Group collateral Total the Group collateral Total
9.8 Securities held as collateral against lendings to financial institutions Market Treasury Bills 8,074,770 - 8,074,770 3,631,733 - 3,631,733 Pakistan Investment Bonds 275,168 - 275,168 235,000 - 235,000 Purchase under resale arrangement of listed shares 200,000 - 200,000 630,000 - 630,000 8,549,938 - 8,549,938 4,496,733 - 4,496,733
9.8.1 Market value of securities held as collateral is Rs. 8,494,528 thousand.
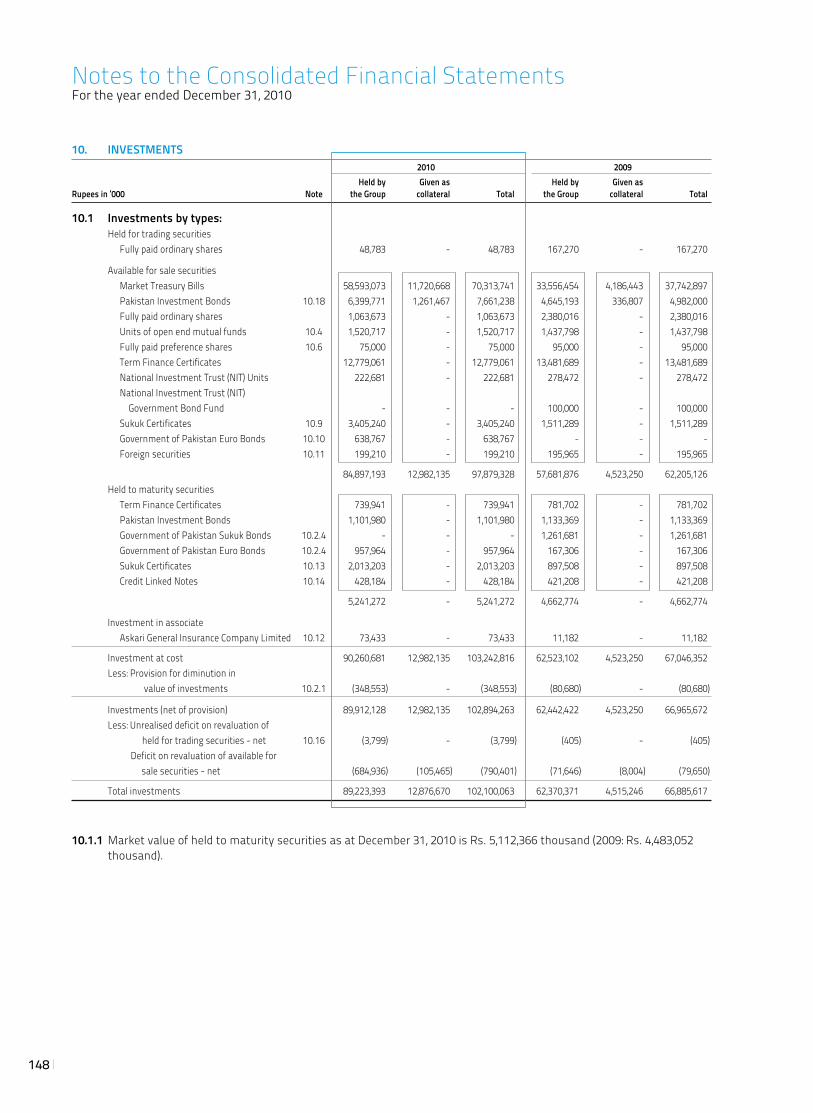
148
10. INVESTMENTS 2010 2009 Held by Given as Held by Given asRupees in ‘000 Note the Group collateral Total the Group collateral Total
10.1 Investments by types: Held for trading securities Fully paid ordinary shares 48,783 - 48,783 167,270 - 167,270
Available for sale securities Market Treasury Bills 58,593,073 11,720,668 70,313,741 33,556,454 4,186,443 37,742,897 Pakistan Investment Bonds 10.18 6,399,771 1,261,467 7,661,238 4,645,193 336,807 4,982,000 Fully paid ordinary shares 1,063,673 - 1,063,673 2,380,016 - 2,380,016 Units of open end mutual funds 10.4 1,520,717 - 1,520,717 1,437,798 - 1,437,798 Fully paid preference shares 10.6 75,000 - 75,000 95,000 - 95,000 Term Finance Certificates 12,779,061 - 12,779,061 13,481,689 - 13,481,689 National Investment Trust (NIT) Units 222,681 - 222,681 278,472 - 278,472 National Investment Trust (NIT) Government Bond Fund - - - 100,000 - 100,000 Sukuk Certificates 10.9 3,405,240 - 3,405,240 1,511,289 - 1,511,289 Government of Pakistan Euro Bonds 10.10 638,767 - 638,767 - - - Foreign securities 10.11 199,210 - 199,210 195,965 - 195,965
84,897,193 12,982,135 97,879,328 57,681,876 4,523,250 62,205,126 Held to maturity securities Term Finance Certificates 739,941 - 739,941 781,702 - 781,702 Pakistan Investment Bonds 1,101,980 - 1,101,980 1,133,369 - 1,133,369 Government of Pakistan Sukuk Bonds 10.2.4 - - - 1,261,681 - 1,261,681 Government of Pakistan Euro Bonds 10.2.4 957,964 - 957,964 167,306 - 167,306 Sukuk Certificates 10.13 2,013,203 - 2,013,203 897,508 - 897,508 Credit Linked Notes 10.14 428,184 - 428,184 421,208 - 421,208
5,241,272 - 5,241,272 4,662,774 - 4,662,774
Investment in associate Askari General Insurance Company Limited 10.12 73,433 - 73,433 11,182 - 11,182
Investment at cost 90,260,681 12,982,135 103,242,816 62,523,102 4,523,250 67,046,352 Less: Provision for diminution in value of investments 10.2.1 (348,553) - (348,553) (80,680) - (80,680)
Investments (net of provision) 89,912,128 12,982,135 102,894,263 62,442,422 4,523,250 66,965,672 Less: Unrealised deficit on revaluation of held for trading securities - net 10.16 (3,799) - (3,799) (405) - (405) Deficit on revaluation of available for sale securities - net (684,936) (105,465) (790,401) (71,646) (8,004) (79,650)
Total investments 89,223,393 12,876,670 102,100,063 62,370,371 4,515,246 66,885,617
10.1.1 Market value of held to maturity securities as at December 31, 2010 is Rs. 5,112,366 thousand (2009: Rs. 4,483,052 thousand).
Notes to the Consolidated Financial StatementsFor the year ended December 31, 2010
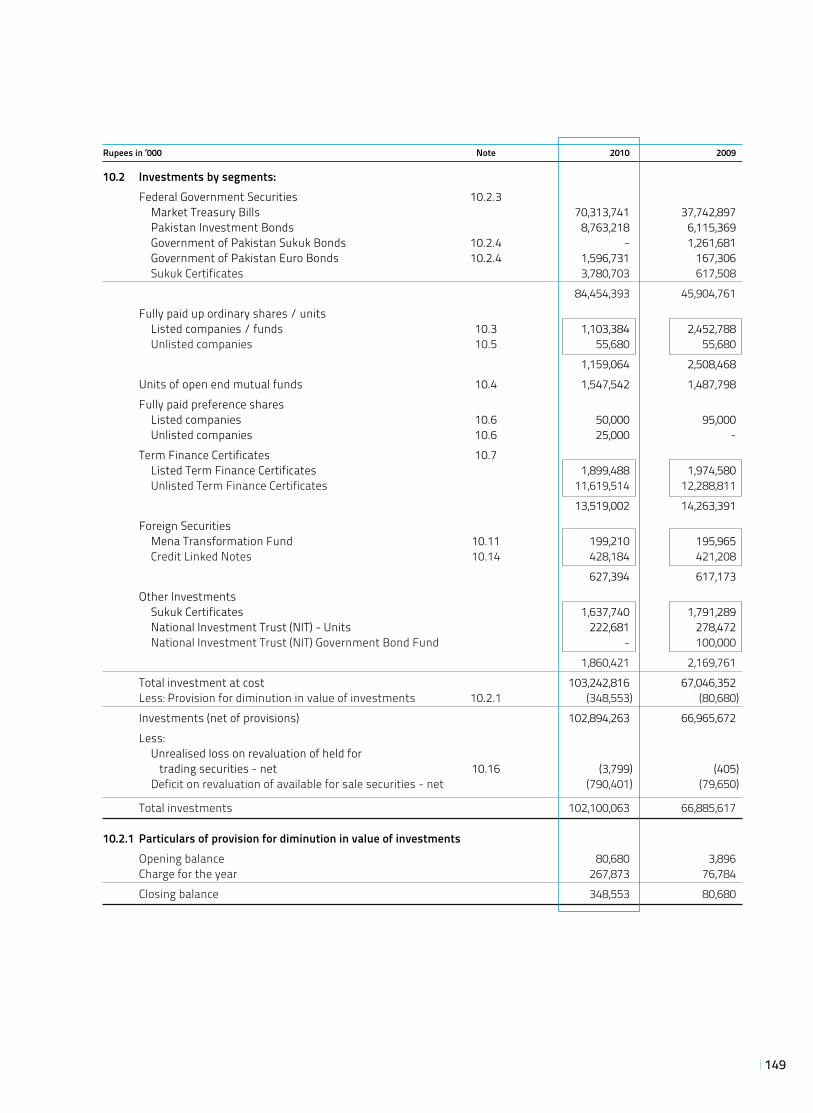
149
Rupees in ‘000 Note 2010 2009
10.2 Investments by segments: Federal Government Securities 10.2.3 Market Treasury Bills 70,313,741 37,742,897 Pakistan Investment Bonds 8,763,218 6,115,369 Government of Pakistan Sukuk Bonds 10.2.4 - 1,261,681 Government of Pakistan Euro Bonds 10.2.4 1,596,731 167,306 Sukuk Certificates 3,780,703 617,508 84,454,393 45,904,761 Fully paid up ordinary shares / units Listed companies / funds 10.3 1,103,384 2,452,788 Unlisted companies 10.5 55,680 55,680 1,159,064 2,508,468 Units of open end mutual funds 10.4 1,547,542 1,487,798 Fully paid preference shares Listed companies 10.6 50,000 95,000 Unlisted companies 10.6 25,000 - Term Finance Certificates 10.7 Listed Term Finance Certificates 1,899,488 1,974,580 Unlisted Term Finance Certificates 11,619,514 12,288,811 13,519,002 14,263,391 Foreign Securities Mena Transformation Fund 10.11 199,210 195,965 Credit Linked Notes 10.14 428,184 421,208 627,394 617,173 Other Investments Sukuk Certificates 1,637,740 1,791,289 National Investment Trust (NIT) - Units 222,681 278,472 National Investment Trust (NIT) Government Bond Fund - 100,000 1,860,421 2,169,761 Total investment at cost 103,242,816 67,046,352 Less: Provision for diminution in value of investments 10.2.1 (348,553) (80,680) Investments (net of provisions) 102,894,263 66,965,672 Less: Unrealised loss on revaluation of held for trading securities - net 10.16 (3,799) (405) Deficit on revaluation of available for sale securities - net (790,401) (79,650)
Total investments 102,100,063 66,885,617
10.2.1 Particulars of provision for diminution in value of investments Opening balance 80,680 3,896 Charge for the year 267,873 76,784 Closing balance 348,553 80,680
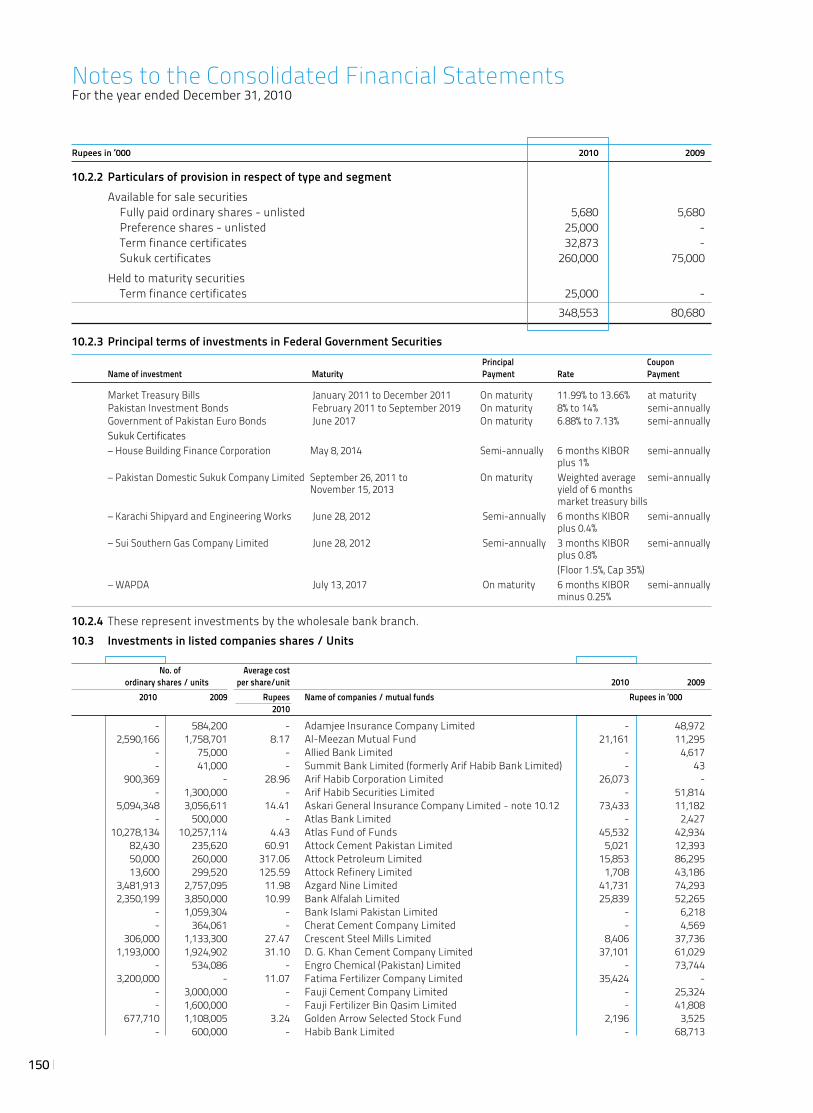
150
10.3 Investments in listed companies shares / Units No. of Average cost ordinary shares / units per share/unit 2010 2009 2010 2009 Rupees Name of companies / mutual funds Rupees in ‘000 2010
- 584,200 - Adamjee Insurance Company Limited - 48,972 2,590,166 1,758,701 8.17 Al-Meezan Mutual Fund 21,161 11,295 - 75,000 - Allied Bank Limited - 4,617 - 41,000 - Summit Bank Limited (formerly Arif Habib Bank Limited) - 43 900,369 - 28.96 Arif Habib Corporation Limited 26,073 - - 1,300,000 - Arif Habib Securities Limited - 51,814 5,094,348 3,056,611 14.41 Askari General Insurance Company Limited - note 10.12 73,433 11,182 - 500,000 - Atlas Bank Limited - 2,427 10,278,134 10,257,114 4.43 Atlas Fund of Funds 45,532 42,934 82,430 235,620 60.91 Attock Cement Pakistan Limited 5,021 12,393 50,000 260,000 317.06 Attock Petroleum Limited 15,853 86,295 13,600 299,520 125.59 Attock Refinery Limited 1,708 43,186 3,481,913 2,757,095 11.98 Azgard Nine Limited 41,731 74,293 2,350,199 3,850,000 10.99 Bank Alfalah Limited 25,839 52,265 - 1,059,304 - Bank Islami Pakistan Limited - 6,218 - 364,061 - Cherat Cement Company Limited - 4,569 306,000 1,133,300 27.47 Crescent Steel Mills Limited 8,406 37,736 1,193,000 1,924,902 31.10 D. G. Khan Cement Company Limited 37,101 61,029 - 534,086 - Engro Chemical (Pakistan) Limited - 73,744 3,200,000 - 11.07 Fatima Fertilizer Company Limited 35,424 - - 3,000,000 - Fauji Cement Company Limited - 25,324 - 1,600,000 - Fauji Fertilizer Bin Qasim Limited - 41,808 677,710 1,108,005 3.24 Golden Arrow Selected Stock Fund 2,196 3,525 - 600,000 - Habib Bank Limited - 68,713
10.2.3 Principal terms of investments in Federal Government Securities Principal Coupon Name of investment Maturity Payment Rate Payment
Market Treasury Bills January 2011 to December 2011 On maturity 11.99% to 13.66% at maturity Pakistan Investment Bonds February 2011 to September 2019 On maturity 8% to 14% semi-annually Government of Pakistan Euro Bonds June 2017 On maturity 6.88% to 7.13% semi-annually Sukuk Certificates – House Building Finance Corporation May 8, 2014 Semi-annually 6 months KIBOR semi-annually plus 1% – Pakistan Domestic Sukuk Company Limited September 26, 2011 to On maturity Weighted average semi-annually November 15, 2013 yield of 6 months market treasury bills – Karachi Shipyard and Engineering Works June 28, 2012 Semi-annually 6 months KIBOR semi-annually plus 0.4% – Sui Southern Gas Company Limited June 28, 2012 Semi-annually 3 months KIBOR semi-annually plus 0.8% (Floor 1.5%, Cap 35%) – WAPDA July 13, 2017 On maturity 6 months KIBOR semi-annually minus 0.25%
10.2.4 These represent investments by the wholesale bank branch.
Rupees in ‘000 2010 2009
10.2.2 Particulars of provision in respect of type and segment Available for sale securities Fully paid ordinary shares - unlisted 5,680 5,680 Preference shares - unlisted 25,000 - Term finance certificates 32,873 - Sukuk certificates 260,000 75,000 Held to maturity securities Term finance certificates 25,000 - 348,553 80,680
Notes to the Consolidated Financial StatementsFor the year ended December 31, 2010
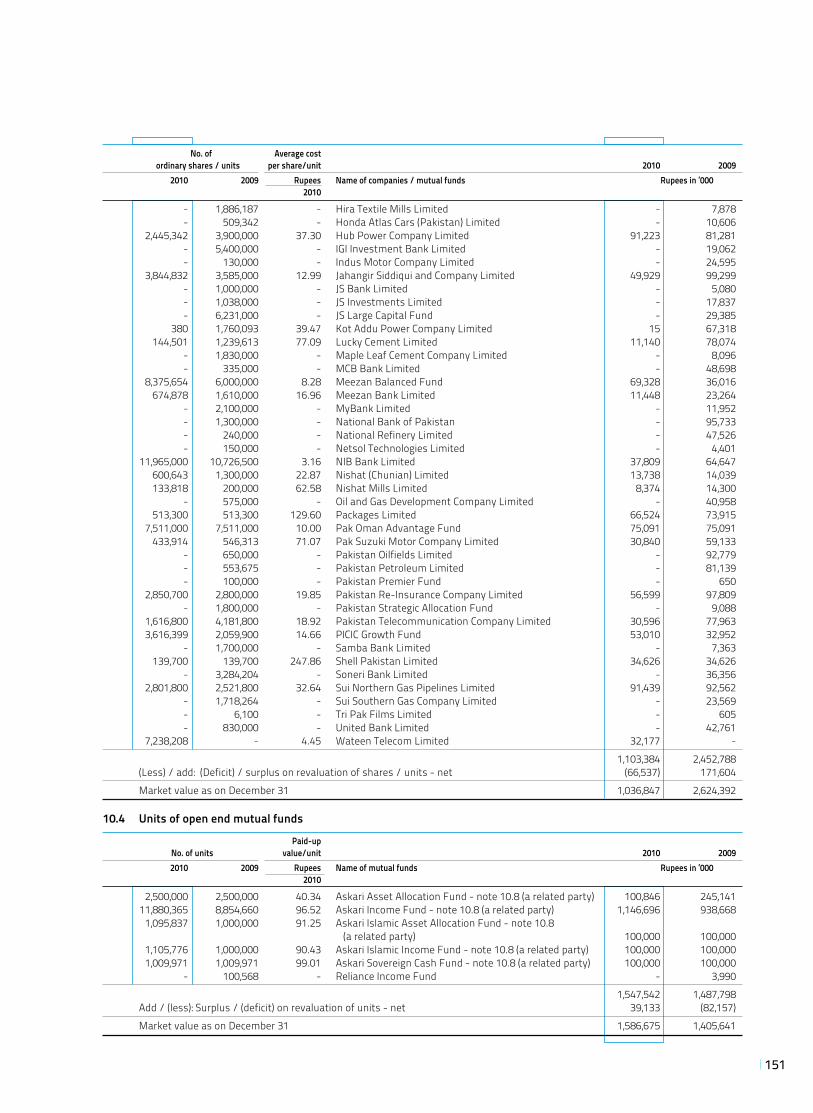
151
No. of Average cost ordinary shares / units per share/unit 2010 2009 2010 2009 Rupees Name of companies / mutual funds Rupees in ‘000 2010
- 1,886,187 - Hira Textile Mills Limited - 7,878 - 509,342 - Honda Atlas Cars (Pakistan) Limited - 10,606 2,445,342 3,900,000 37.30 Hub Power Company Limited 91,223 81,281 - 5,400,000 - IGI Investment Bank Limited - 19,062 - 130,000 - Indus Motor Company Limited - 24,595 3,844,832 3,585,000 12.99 Jahangir Siddiqui and Company Limited 49,929 99,299 - 1,000,000 - JS Bank Limited - 5,080 - 1,038,000 - JS Investments Limited - 17,837 - 6,231,000 - JS Large Capital Fund - 29,385 380 1,760,093 39.47 Kot Addu Power Company Limited 15 67,318 144,501 1,239,613 77.09 Lucky Cement Limited 11,140 78,074 - 1,830,000 - Maple Leaf Cement Company Limited - 8,096 - 335,000 - MCB Bank Limited - 48,698 8,375,654 6,000,000 8.28 Meezan Balanced Fund 69,328 36,016 674,878 1,610,000 16.96 Meezan Bank Limited 11,448 23,264 - 2,100,000 - MyBank Limited - 11,952 - 1,300,000 - National Bank of Pakistan - 95,733 - 240,000 - National Refinery Limited - 47,526 - 150,000 - Netsol Technologies Limited - 4,401 11,965,000 10,726,500 3.16 NIB Bank Limited 37,809 64,647 600,643 1,300,000 22.87 Nishat (Chunian) Limited 13,738 14,039 133,818 200,000 62.58 Nishat Mills Limited 8,374 14,300 - 575,000 - Oil and Gas Development Company Limited - 40,958 513,300 513,300 129.60 Packages Limited 66,524 73,915 7,511,000 7,511,000 10.00 Pak Oman Advantage Fund 75,091 75,091 433,914 546,313 71.07 Pak Suzuki Motor Company Limited 30,840 59,133 - 650,000 - Pakistan Oilfields Limited - 92,779 - 553,675 - Pakistan Petroleum Limited - 81,139 - 100,000 - Pakistan Premier Fund - 650 2,850,700 2,800,000 19.85 Pakistan Re-Insurance Company Limited 56,599 97,809 - 1,800,000 - Pakistan Strategic Allocation Fund - 9,088 1,616,800 4,181,800 18.92 Pakistan Telecommunication Company Limited 30,596 77,963 3,616,399 2,059,900 14.66 PICIC Growth Fund 53,010 32,952 - 1,700,000 - Samba Bank Limited - 7,363 139,700 139,700 247.86 Shell Pakistan Limited 34,626 34,626 - 3,284,204 - Soneri Bank Limited - 36,356 2,801,800 2,521,800 32.64 Sui Northern Gas Pipelines Limited 91,439 92,562 - 1,718,264 - Sui Southern Gas Company Limited - 23,569 - 6,100 - Tri Pak Films Limited - 605 - 830,000 - United Bank Limited - 42,761 7,238,208 - 4.45 Wateen Telecom Limited 32,177 -
1,103,384 2,452,788 (Less) / add: (Deficit) / surplus on revaluation of shares / units - net (66,537) 171,604
Market value as on December 31 1,036,847 2,624,392
10.4 Units of open end mutual funds
Paid-up No. of units value/unit 2010 2009 2010 2009 Rupees Name of mutual funds Rupees in ‘000 2010
2,500,000 2,500,000 40.34 Askari Asset Allocation Fund - note 10.8 (a related party) 100,846 245,141 11,880,365 8,854,660 96.52 Askari Income Fund - note 10.8 (a related party) 1,146,696 938,668 1,095,837 1,000,000 91.25 Askari Islamic Asset Allocation Fund - note 10.8 (a related party) 100,000 100,000 1,105,776 1,000,000 90.43 Askari Islamic Income Fund - note 10.8 (a related party) 100,000 100,000 1,009,971 1,009,971 99.01 Askari Sovereign Cash Fund - note 10.8 (a related party) 100,000 100,000 - 100,568 - Reliance Income Fund - 3,990
1,547,542 1,487,798 Add / (less): Surplus / (deficit) on revaluation of units - net 39,133 (82,157)
Market value as on December 31 1,586,675 1,405,641
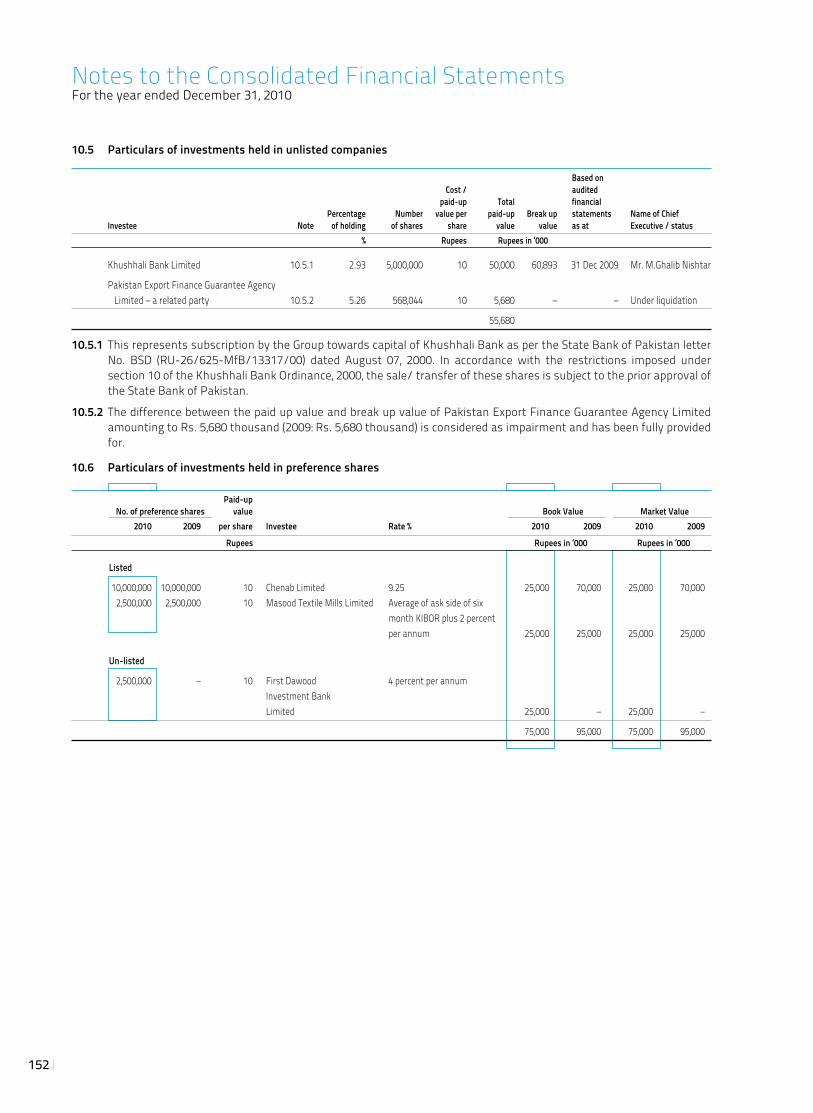
152
10.5 Particulars of investments held in unlisted companies
Based on Cost / audited paid-up Total financial Percentage Number value per paid-up Break up statements Name of Chief Investee Note of holding of shares share value value as at Executive / status % Rupees Rupees in ‘000
Khushhali Bank Limited 10.5.1 2.93 5,000,000 10 50,000 60,893 31 Dec 2009 Mr. M.Ghalib Nishtar
Pakistan Export Finance Guarantee Agency Limited – a related party 10.5.2 5.26 568,044 10 5,680 – – Under liquidation
55,680
10.5.1 This represents subscription by the Group towards capital of Khushhali Bank as per the State Bank of Pakistan letter No. BSD (RU-26/625-MfB/13317/00) dated August 07, 2000. In accordance with the restrictions imposed under section 10 of the Khushhali Bank Ordinance, 2000, the sale/ transfer of these shares is subject to the prior approval of the State Bank of Pakistan.
10.5.2 The difference between the paid up value and break up value of Pakistan Export Finance Guarantee Agency Limited amounting to Rs. 5,680 thousand (2009: Rs. 5,680 thousand) is considered as impairment and has been fully provided for.
10.6 Particulars of investments held in preference shares
Paid-up No. of preference shares value Book Value Market Value 2010 2009 per share Investee Rate % 2010 2009 2010 2009
Rupees Rupees in ‘000 Rupees in ‘000
Listed
10,000,000 10,000,000 10 Chenab Limited 9.25 25,000 70,000 25,000 70,000 2,500,000 2,500,000 10 Masood Textile Mills Limited Average of ask side of six month KIBOR plus 2 percent per annum 25,000 25,000 25,000 25,000
Un-listed
2,500,000 – 10 First Dawood 4 percent per annum Investment Bank Limited 25,000 – 25,000 –
75,000 95,000 75,000 95,000
Notes to the Consolidated Financial StatementsFor the year ended December 31, 2010
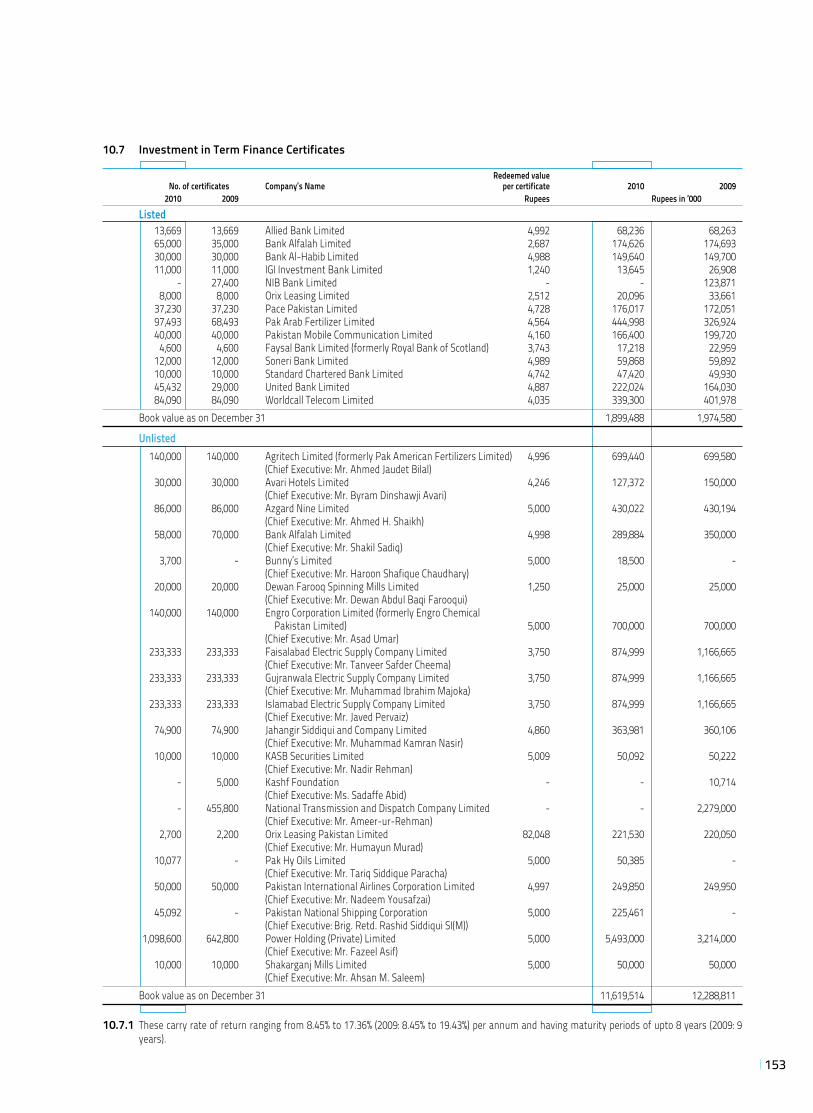
153
10.7 Investment in Term Finance Certificates
Redeemed value No. of certificates Company’s Name per certificate 2010 2009 2010 2009 Rupees Rupees in ‘000
Listed 13,669 13,669 Allied Bank Limited 4,992 68,236 68,263 65,000 35,000 Bank Alfalah Limited 2,687 174,626 174,693 30,000 30,000 Bank Al-Habib Limited 4,988 149,640 149,700 11,000 11,000 IGI Investment Bank Limited 1,240 13,645 26,908 - 27,400 NIB Bank Limited - - 123,871 8,000 8,000 Orix Leasing Limited 2,512 20,096 33,661 37,230 37,230 Pace Pakistan Limited 4,728 176,017 172,051 97,493 68,493 Pak Arab Fertilizer Limited 4,564 444,998 326,924 40,000 40,000 Pakistan Mobile Communication Limited 4,160 166,400 199,720 4,600 4,600 Faysal Bank Limited (formerly Royal Bank of Scotland) 3,743 17,218 22,959 12,000 12,000 Soneri Bank Limited 4,989 59,868 59,892 10,000 10,000 Standard Chartered Bank Limited 4,742 47,420 49,930 45,432 29,000 United Bank Limited 4,887 222,024 164,030 84,090 84,090 Worldcall Telecom Limited 4,035 339,300 401,978 Book value as on December 31 1,899,488 1,974,580
Unlisted 140,000 140,000 Agritech Limited (formerly Pak American Fertilizers Limited) 4,996 699,440 699,580 (Chief Executive: Mr. Ahmed Jaudet Bilal) 30,000 30,000 Avari Hotels Limited 4,246 127,372 150,000 (Chief Executive: Mr. Byram Dinshawji Avari) 86,000 86,000 Azgard Nine Limited 5,000 430,022 430,194 (Chief Executive: Mr. Ahmed H. Shaikh) 58,000 70,000 Bank Alfalah Limited 4,998 289,884 350,000 (Chief Executive: Mr. Shakil Sadiq) 3,700 - Bunny’s Limited 5,000 18,500 - (Chief Executive: Mr. Haroon Shafique Chaudhary) 20,000 20,000 Dewan Farooq Spinning Mills Limited 1,250 25,000 25,000 (Chief Executive: Mr. Dewan Abdul Baqi Farooqui) 140,000 140,000 Engro Corporation Limited (formerly Engro Chemical Pakistan Limited) 5,000 700,000 700,000 (Chief Executive: Mr. Asad Umar) 233,333 233,333 Faisalabad Electric Supply Company Limited 3,750 874,999 1,166,665 (Chief Executive: Mr. Tanveer Safder Cheema) 233,333 233,333 Gujranwala Electric Supply Company Limited 3,750 874,999 1,166,665 (Chief Executive: Mr. Muhammad Ibrahim Majoka) 233,333 233,333 Islamabad Electric Supply Company Limited 3,750 874,999 1,166,665 (Chief Executive: Mr. Javed Pervaiz) 74,900 74,900 Jahangir Siddiqui and Company Limited 4,860 363,981 360,106 (Chief Executive: Mr. Muhammad Kamran Nasir) 10,000 10,000 KASB Securities Limited 5,009 50,092 50,222 (Chief Executive: Mr. Nadir Rehman) - 5,000 Kashf Foundation - - 10,714 (Chief Executive: Ms. Sadaffe Abid) - 455,800 National Transmission and Dispatch Company Limited - - 2,279,000 (Chief Executive: Mr. Ameer-ur-Rehman) 2,700 2,200 Orix Leasing Pakistan Limited 82,048 221,530 220,050 (Chief Executive: Mr. Humayun Murad) 10,077 - Pak Hy Oils Limited 5,000 50,385 - (Chief Executive: Mr. Tariq Siddique Paracha) 50,000 50,000 Pakistan International Airlines Corporation Limited 4,997 249,850 249,950 (Chief Executive: Mr. Nadeem Yousafzai) 45,092 - Pakistan National Shipping Corporation 5,000 225,461 - (Chief Executive: Brig. Retd. Rashid Siddiqui SI(M)) 1,098,600 642,800 Power Holding (Private) Limited 5,000 5,493,000 3,214,000 (Chief Executive: Mr. Fazeel Asif) 10,000 10,000 Shakarganj Mills Limited 5,000 50,000 50,000 (Chief Executive: Mr. Ahsan M. Saleem) Book value as on December 31 11,619,514 12,288,811
10.7.1 These carry rate of return ranging from 8.45% to 17.36% (2009: 8.45% to 19.43%) per annum and having maturity periods of upto 8 years (2009: 9 years).
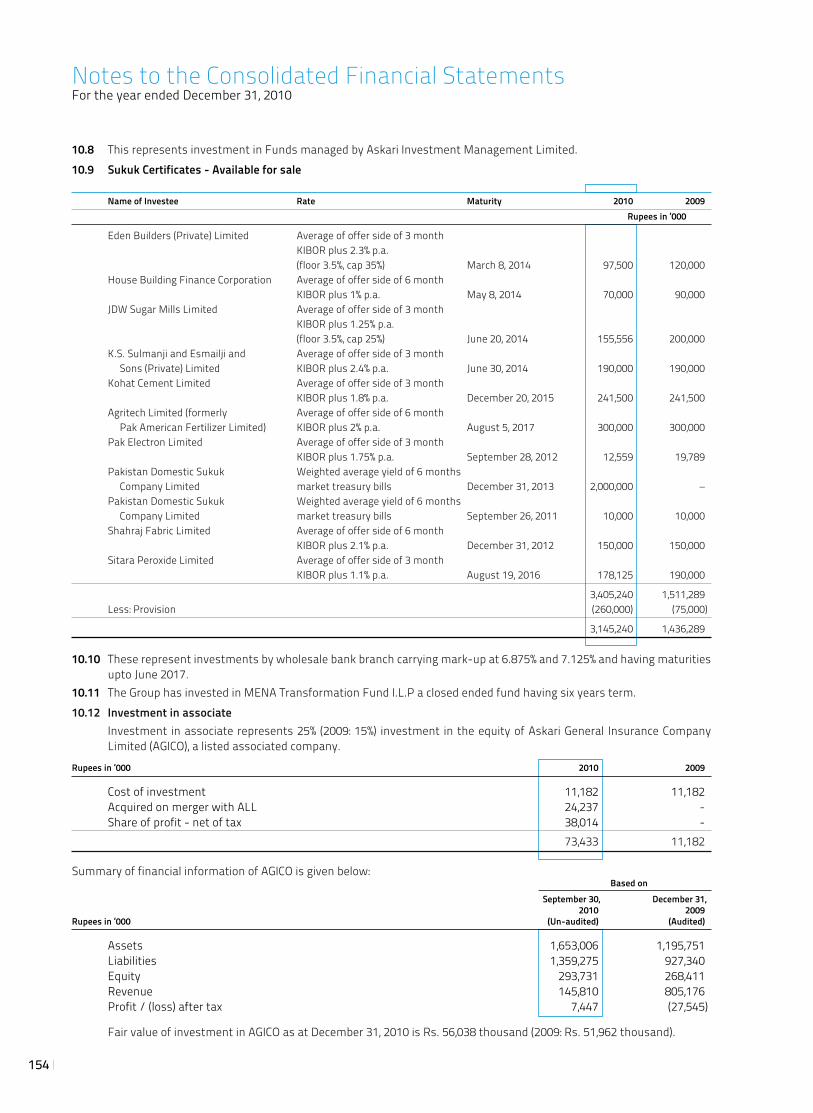
154
10.8 This represents investment in Funds managed by Askari Investment Management Limited.10.9 Sukuk Certificates - Available for sale
Name of Investee Rate Maturity 2010 2009 Rupees in ‘000
Eden Builders (Private) Limited Average of offer side of 3 month KIBOR plus 2.3% p.a. (floor 3.5%, cap 35%) March 8, 2014 97,500 120,000 House Building Finance Corporation Average of offer side of 6 month KIBOR plus 1% p.a. May 8, 2014 70,000 90,000 JDW Sugar Mills Limited Average of offer side of 3 month KIBOR plus 1.25% p.a. (floor 3.5%, cap 25%) June 20, 2014 155,556 200,000 K.S. Sulmanji and Esmailji and Average of offer side of 3 month Sons (Private) Limited KIBOR plus 2.4% p.a. June 30, 2014 190,000 190,000 Kohat Cement Limited Average of offer side of 3 month KIBOR plus 1.8% p.a. December 20, 2015 241,500 241,500 Agritech Limited (formerly Average of offer side of 6 month Pak American Fertilizer Limited) KIBOR plus 2% p.a. August 5, 2017 300,000 300,000 Pak Electron Limited Average of offer side of 3 month KIBOR plus 1.75% p.a. September 28, 2012 12,559 19,789 Pakistan Domestic Sukuk Weighted average yield of 6 months Company Limited market treasury bills December 31, 2013 2,000,000 – Pakistan Domestic Sukuk Weighted average yield of 6 months Company Limited market treasury bills September 26, 2011 10,000 10,000 Shahraj Fabric Limited Average of offer side of 6 month KIBOR plus 2.1% p.a. December 31, 2012 150,000 150,000 Sitara Peroxide Limited Average of offer side of 3 month KIBOR plus 1.1% p.a. August 19, 2016 178,125 190,000
3,405,240 1,511,289 Less: Provision (260,000) (75,000)
3,145,240 1,436,289
10.10 These represent investments by wholesale bank branch carrying mark-up at 6.875% and 7.125% and having maturities upto June 2017.
10.11 The Group has invested in MENA Transformation Fund I.L.P a closed ended fund having six years term. 10.12 Investment in associate Investment in associate represents 25% (2009: 15%) investment in the equity of Askari General Insurance Company
Limited (AGICO), a listed associated company.
Rupees in ‘000 2010 2009
Cost of investment 11,182 11,182 Acquired on merger with ALL 24,237 - Share of profit - net of tax 38,014 - 73,433 11,182
Summary of financial information of AGICO is given below: Based on September 30, December 31, 2010 2009Rupees in ‘000 (Un-audited) (Audited)
Assets 1,653,006 1,195,751 Liabilities 1,359,275 927,340 Equity 293,731 268,411 Revenue 145,810 805,176 Profit / (loss) after tax 7,447 (27,545)
Fair value of investment in AGICO as at December 31, 2010 is Rs. 56,038 thousand (2009: Rs. 51,962 thousand).
Notes to the Consolidated Financial StatementsFor the year ended December 31, 2010
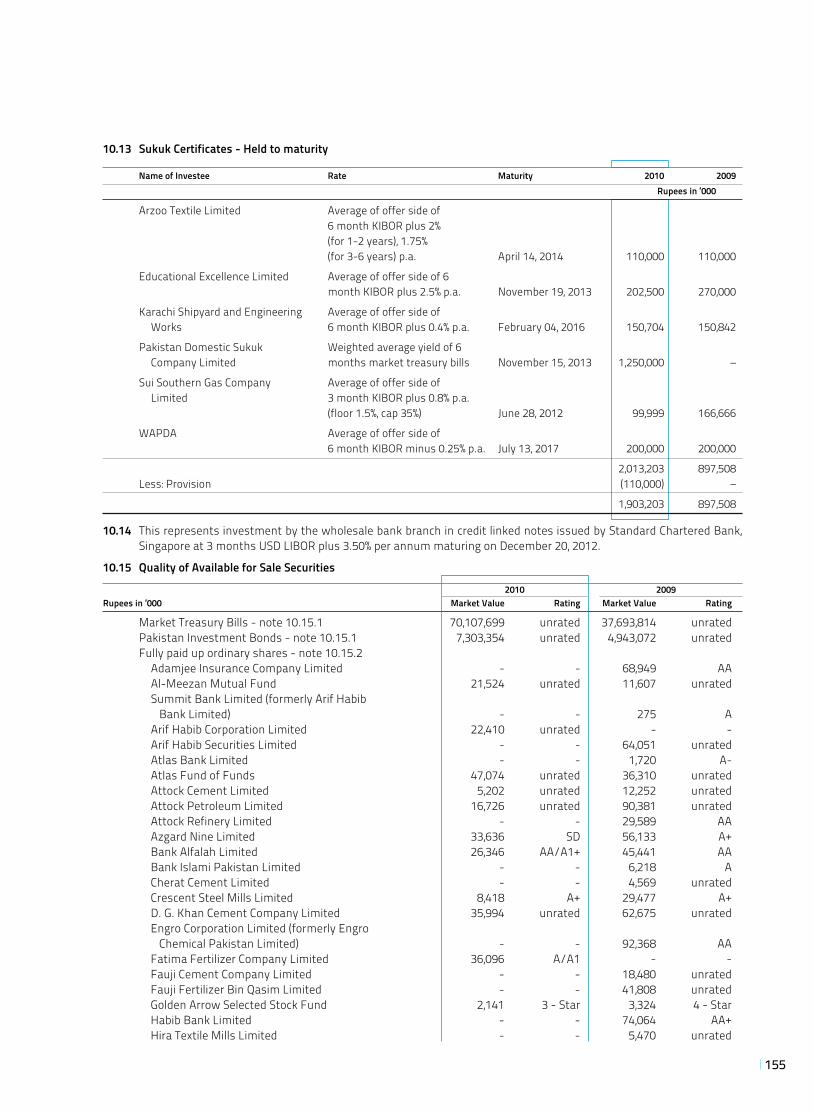
155
10.13 Sukuk Certificates - Held to maturity
Name of Investee Rate Maturity 2010 2009 Rupees in ‘000
Arzoo Textile Limited Average of offer side of 6 month KIBOR plus 2% (for 1-2 years), 1.75% (for 3-6 years) p.a. April 14, 2014 110,000 110,000
Educational Excellence Limited Average of offer side of 6 month KIBOR plus 2.5% p.a. November 19, 2013 202,500 270,000
Karachi Shipyard and Engineering Average of offer side of Works 6 month KIBOR plus 0.4% p.a. February 04, 2016 150,704 150,842
Pakistan Domestic Sukuk Weighted average yield of 6 Company Limited months market treasury bills November 15, 2013 1,250,000 –
Sui Southern Gas Company Average of offer side of Limited 3 month KIBOR plus 0.8% p.a. (floor 1.5%, cap 35%) June 28, 2012 99,999 166,666
WAPDA Average of offer side of 6 month KIBOR minus 0.25% p.a. July 13, 2017 200,000 200,000
2,013,203 897,508 Less: Provision (110,000) –
1,903,203 897,508
10.14 This represents investment by the wholesale bank branch in credit linked notes issued by Standard Chartered Bank, Singapore at 3 months USD LIBOR plus 3.50% per annum maturing on December 20, 2012.
10.15 Quality of Available for Sale Securities
2010 2009Rupees in ‘000 Market Value Rating Market Value Rating
Market Treasury Bills - note 10.15.1 70,107,699 unrated 37,693,814 unrated Pakistan Investment Bonds - note 10.15.1 7,303,354 unrated 4,943,072 unrated Fully paid up ordinary shares - note 10.15.2 Adamjee Insurance Company Limited - - 68,949 AA Al-Meezan Mutual Fund 21,524 unrated 11,607 unrated Summit Bank Limited (formerly Arif Habib Bank Limited) - - 275 A Arif Habib Corporation Limited 22,410 unrated - - Arif Habib Securities Limited - - 64,051 unrated Atlas Bank Limited - - 1,720 A- Atlas Fund of Funds 47,074 unrated 36,310 unrated Attock Cement Limited 5,202 unrated 12,252 unrated Attock Petroleum Limited 16,726 unrated 90,381 unrated Attock Refinery Limited - - 29,589 AA Azgard Nine Limited 33,636 SD 56,133 A+ Bank Alfalah Limited 26,346 AA/A1+ 45,441 AA Bank Islami Pakistan Limited - - 6,218 A Cherat Cement Limited - - 4,569 unrated Crescent Steel Mills Limited 8,418 A+ 29,477 A+ D. G. Khan Cement Company Limited 35,994 unrated 62,675 unrated Engro Corporation Limited (formerly Engro Chemical Pakistan Limited) - - 92,368 AA Fatima Fertilizer Company Limited 36,096 A/A1 - - Fauji Cement Company Limited - - 18,480 unrated Fauji Fertilizer Bin Qasim Limited - - 41,808 unrated Golden Arrow Selected Stock Fund 2,141 3 - Star 3,324 4 - Star Habib Bank Limited - - 74,064 AA+ Hira Textile Mills Limited - - 5,470 unrated
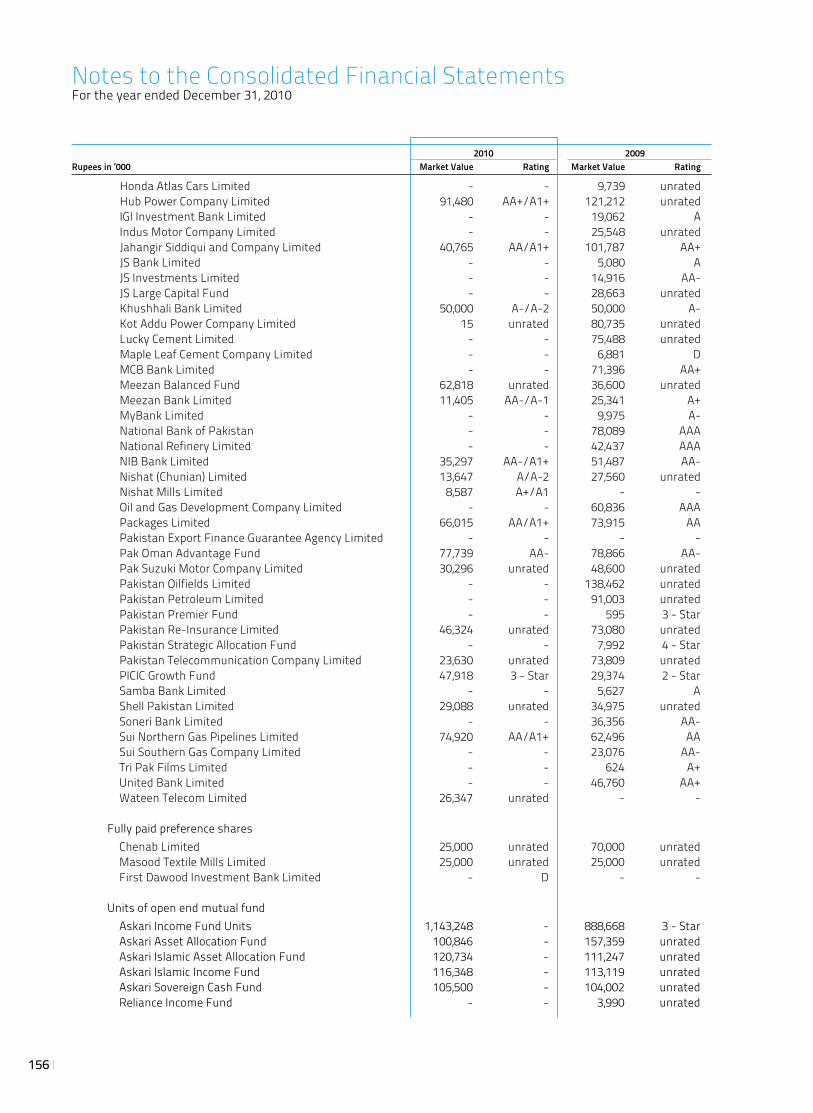
156
2010 2009Rupees in ‘000 Market Value Rating Market Value Rating
Honda Atlas Cars Limited - - 9,739 unrated Hub Power Company Limited 91,480 AA+/A1+ 121,212 unrated IGI Investment Bank Limited - - 19,062 A Indus Motor Company Limited - - 25,548 unrated Jahangir Siddiqui and Company Limited 40,765 AA/A1+ 101,787 AA+ JS Bank Limited - - 5,080 A JS Investments Limited - - 14,916 AA- JS Large Capital Fund - - 28,663 unrated Khushhali Bank Limited 50,000 A-/A-2 50,000 A- Kot Addu Power Company Limited 15 unrated 80,735 unrated Lucky Cement Limited - - 75,488 unrated Maple Leaf Cement Company Limited - - 6,881 D MCB Bank Limited - - 71,396 AA+ Meezan Balanced Fund 62,818 unrated 36,600 unrated Meezan Bank Limited 11,405 AA-/A-1 25,341 A+ MyBank Limited - - 9,975 A- National Bank of Pakistan - - 78,089 AAA National Refinery Limited - - 42,437 AAA NIB Bank Limited 35,297 AA-/A1+ 51,487 AA- Nishat (Chunian) Limited 13,647 A/A-2 27,560 unrated Nishat Mills Limited 8,587 A+/A1 - - Oil and Gas Development Company Limited - - 60,836 AAA Packages Limited 66,015 AA/A1+ 73,915 AA Pakistan Export Finance Guarantee Agency Limited - - - - Pak Oman Advantage Fund 77,739 AA- 78,866 AA- Pak Suzuki Motor Company Limited 30,296 unrated 48,600 unrated Pakistan Oilfields Limited - - 138,462 unrated Pakistan Petroleum Limited - - 91,003 unrated Pakistan Premier Fund - - 595 3 - Star Pakistan Re-Insurance Limited 46,324 unrated 73,080 unrated Pakistan Strategic Allocation Fund - - 7,992 4 - Star Pakistan Telecommunication Company Limited 23,630 unrated 73,809 unrated PICIC Growth Fund 47,918 3 - Star 29,374 2 - Star Samba Bank Limited - - 5,627 A Shell Pakistan Limited 29,088 unrated 34,975 unrated Soneri Bank Limited - - 36,356 AA- Sui Northern Gas Pipelines Limited 74,920 AA/A1+ 62,496 AA Sui Southern Gas Company Limited - - 23,076 AA- Tri Pak Films Limited - - 624 A+ United Bank Limited - - 46,760 AA+ Wateen Telecom Limited 26,347 unrated - -
Fully paid preference shares Chenab Limited 25,000 unrated 70,000 unrated Masood Textile Mills Limited 25,000 unrated 25,000 unrated First Dawood Investment Bank Limited - D - -
Units of open end mutual fund Askari Income Fund Units 1,143,248 - 888,668 3 - Star Askari Asset Allocation Fund 100,846 - 157,359 unrated Askari Islamic Asset Allocation Fund 120,734 - 111,247 unrated Askari Islamic Income Fund 116,348 - 113,119 unrated Askari Sovereign Cash Fund 105,500 - 104,002 unrated Reliance Income Fund - - 3,990 unrated
Notes to the Consolidated Financial StatementsFor the year ended December 31, 2010
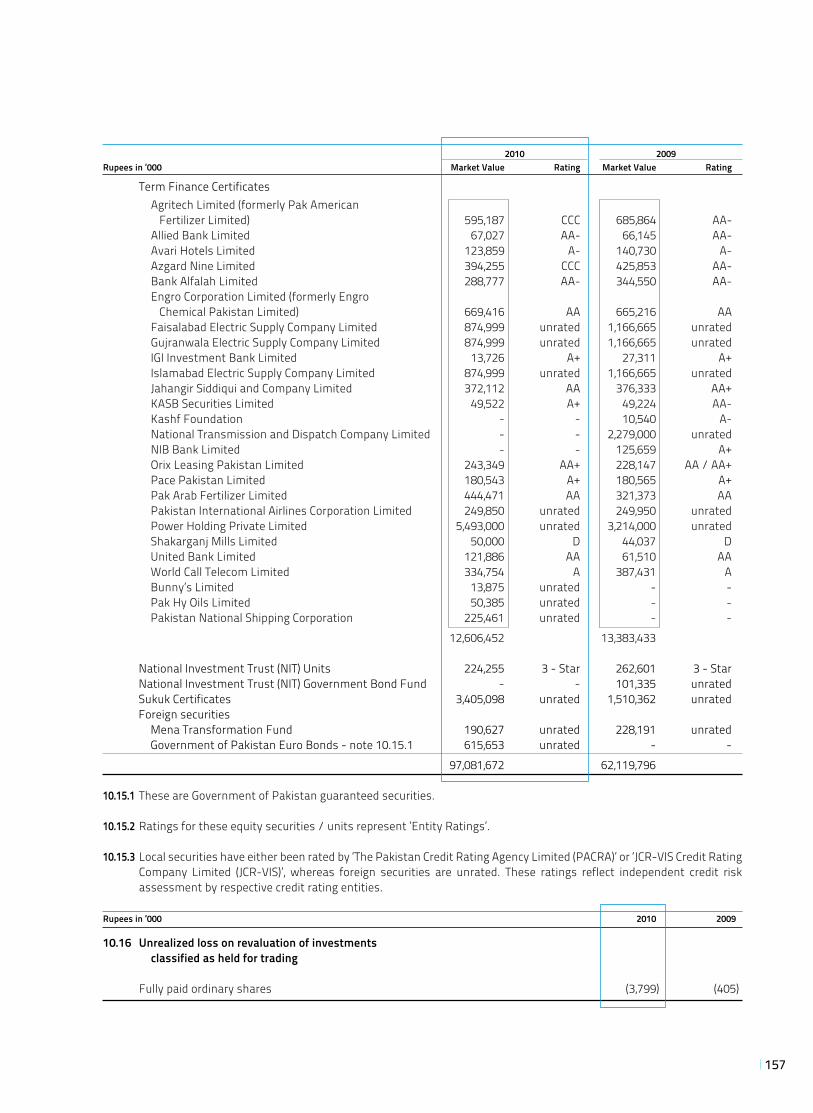
157
2010 2009Rupees in ‘000 Market Value Rating Market Value Rating
Term Finance Certificates Agritech Limited (formerly Pak American Fertilizer Limited) 595,187 CCC 685,864 AA- Allied Bank Limited 67,027 AA- 66,145 AA- Avari Hotels Limited 123,859 A- 140,730 A- Azgard Nine Limited 394,255 CCC 425,853 AA- Bank Alfalah Limited 288,777 AA- 344,550 AA- Engro Corporation Limited (formerly Engro Chemical Pakistan Limited) 669,416 AA 665,216 AA Faisalabad Electric Supply Company Limited 874,999 unrated 1,166,665 unrated Gujranwala Electric Supply Company Limited 874,999 unrated 1,166,665 unrated IGI Investment Bank Limited 13,726 A+ 27,311 A+ Islamabad Electric Supply Company Limited 874,999 unrated 1,166,665 unrated Jahangir Siddiqui and Company Limited 372,112 AA 376,333 AA+ KASB Securities Limited 49,522 A+ 49,224 AA- Kashf Foundation - - 10,540 A- National Transmission and Dispatch Company Limited - - 2,279,000 unrated NIB Bank Limited - - 125,659 A+ Orix Leasing Pakistan Limited 243,349 AA+ 228,147 AA / AA+ Pace Pakistan Limited 180,543 A+ 180,565 A+ Pak Arab Fertilizer Limited 444,471 AA 321,373 AA Pakistan International Airlines Corporation Limited 249,850 unrated 249,950 unrated Power Holding Private Limited 5,493,000 unrated 3,214,000 unrated Shakarganj Mills Limited 50,000 D 44,037 D United Bank Limited 121,886 AA 61,510 AA World Call Telecom Limited 334,754 A 387,431 A Bunny’s Limited 13,875 unrated - - Pak Hy Oils Limited 50,385 unrated - - Pakistan National Shipping Corporation 225,461 unrated - - 12,606,452 13,383,433 National Investment Trust (NIT) Units 224,255 3 - Star 262,601 3 - Star National Investment Trust (NIT) Government Bond Fund - - 101,335 unrated Sukuk Certificates 3,405,098 unrated 1,510,362 unrated Foreign securities Mena Transformation Fund 190,627 unrated 228,191 unrated Government of Pakistan Euro Bonds - note 10.15.1 615,653 unrated - - 97,081,672 62,119,796
10.15.1 These are Government of Pakistan guaranteed securities.
10.15.2 Ratings for these equity securities / units represent ‘Entity Ratings’.
10.15.3 Local securities have either been rated by ‘The Pakistan Credit Rating Agency Limited (PACRA)’ or ‘JCR-VIS Credit Rating Company Limited (JCR-VIS)’, whereas foreign securities are unrated. These ratings reflect independent credit risk assessment by respective credit rating entities.
Rupees in ‘000 2010 2009
10.16 Unrealized loss on revaluation of investments classified as held for trading
Fully paid ordinary shares (3,799) (405)
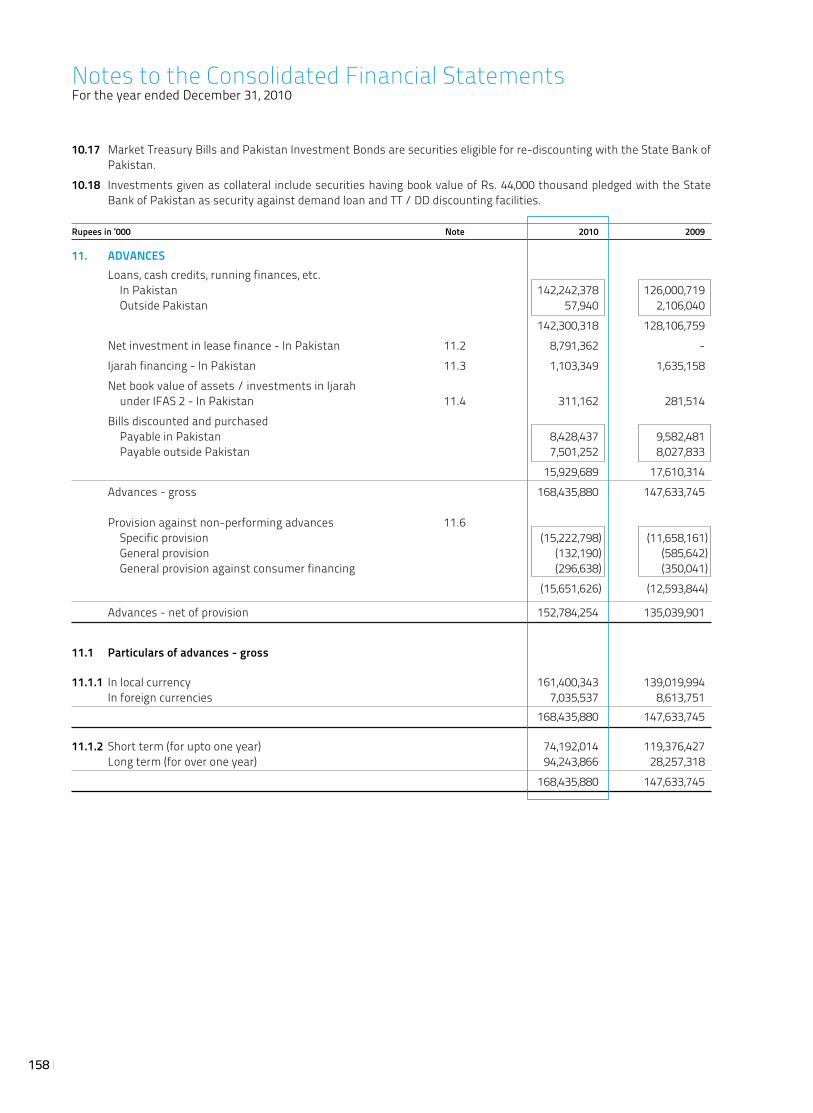
158
10.17 Market Treasury Bills and Pakistan Investment Bonds are securities eligible for re-discounting with the State Bank of Pakistan.
10.18 Investments given as collateral include securities having book value of Rs. 44,000 thousand pledged with the State Bank of Pakistan as security against demand loan and TT / DD discounting facilities.
Rupees in ‘000 Note 2010 2009
11. ADVANCES Loans, cash credits, running finances, etc. In Pakistan 142,242,378 126,000,719 Outside Pakistan 57,940 2,106,040 142,300,318 128,106,759 Net investment in lease finance - In Pakistan 11.2 8,791,362 - Ijarah financing - In Pakistan 11.3 1,103,349 1,635,158 Net book value of assets / investments in Ijarah under IFAS 2 - In Pakistan 11.4 311,162 281,514 Bills discounted and purchased Payable in Pakistan 8,428,437 9,582,481 Payable outside Pakistan 7,501,252 8,027,833 15,929,689 17,610,314 Advances - gross 168,435,880 147,633,745 Provision against non-performing advances 11.6 Specific provision (15,222,798) (11,658,161) General provision (132,190) (585,642) General provision against consumer financing (296,638) (350,041) (15,651,626) (12,593,844)
Advances - net of provision 152,784,254 135,039,901
11.1 Particulars of advances - gross
11.1.1 In local currency 161,400,343 139,019,994 In foreign currencies 7,035,537 8,613,751 168,435,880 147,633,745
11.1.2 Short term (for upto one year) 74,192,014 119,376,427 Long term (for over one year) 94,243,866 28,257,318 168,435,880 147,633,745
Notes to the Consolidated Financial StatementsFor the year ended December 31, 2010
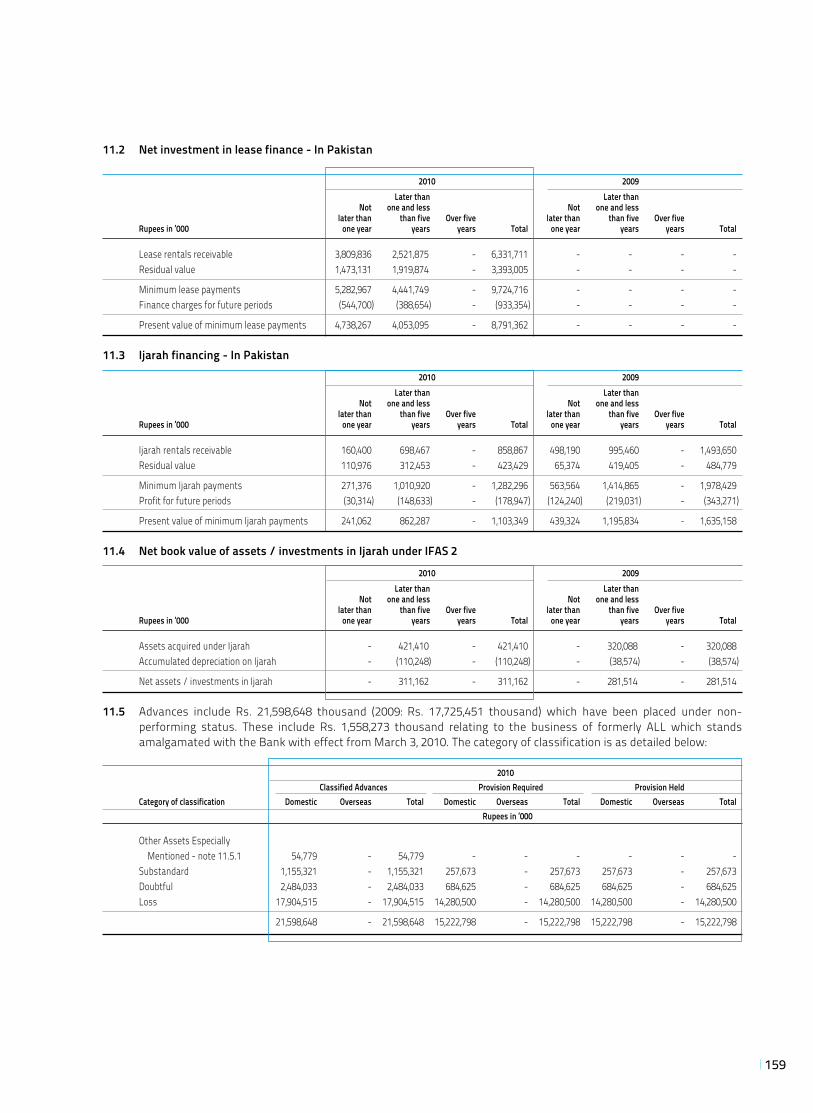
159
11.2 Net investment in lease finance - In Pakistan
2010 2009 Later than Later than Not one and less Not one and less later than than five Over five later than than five Over five Rupees in ‘000 one year years years Total one year years years Total
Lease rentals receivable 3,809,836 2,521,875 - 6,331,711 - - - - Residual value 1,473,131 1,919,874 - 3,393,005 - - - -
Minimum lease payments 5,282,967 4,441,749 - 9,724,716 - - - - Finance charges for future periods (544,700) (388,654) - (933,354) - - - -
Present value of minimum lease payments 4,738,267 4,053,095 - 8,791,362 - - - -
11.3 Ijarah financing - In Pakistan
2010 2009 Later than Later than Not one and less Not one and less later than than five Over five later than than five Over five Rupees in ‘000 one year years years Total one year years years Total
Ijarah rentals receivable 160,400 698,467 - 858,867 498,190 995,460 - 1,493,650 Residual value 110,976 312,453 - 423,429 65,374 419,405 - 484,779
Minimum Ijarah payments 271,376 1,010,920 - 1,282,296 563,564 1,414,865 - 1,978,429 Profit for future periods (30,314) (148,633) - (178,947) (124,240) (219,031) - (343,271)
Present value of minimum Ijarah payments 241,062 862,287 - 1,103,349 439,324 1,195,834 - 1,635,158
11.4 Net book value of assets / investments in Ijarah under IFAS 2
2010 2009 Later than Later than Not one and less Not one and less later than than five Over five later than than five Over five Rupees in ‘000 one year years years Total one year years years Total
Assets acquired under Ijarah - 421,410 - 421,410 - 320,088 - 320,088 Accumulated depreciation on Ijarah - (110,248) - (110,248) - (38,574) - (38,574)
Net assets / investments in Ijarah - 311,162 - 311,162 - 281,514 - 281,514
11.5 Advances include Rs. 21,598,648 thousand (2009: Rs. 17,725,451 thousand) which have been placed under non-performing status. These include Rs. 1,558,273 thousand relating to the business of formerly ALL which stands amalgamated with the Bank with effect from March 3, 2010. The category of classification is as detailed below:
2010 Classified Advances Provision Required Provision Held Category of classification Domestic Overseas Total Domestic Overseas Total Domestic Overseas Total Rupees in ‘000
Other Assets Especially Mentioned - note 11.5.1 54,779 - 54,779 - - - - - - Substandard 1,155,321 - 1,155,321 257,673 - 257,673 257,673 - 257,673 Doubtful 2,484,033 - 2,484,033 684,625 - 684,625 684,625 - 684,625 Loss 17,904,515 - 17,904,515 14,280,500 - 14,280,500 14,280,500 - 14,280,500
21,598,648 - 21,598,648 15,222,798 - 15,222,798 15,222,798 - 15,222,798
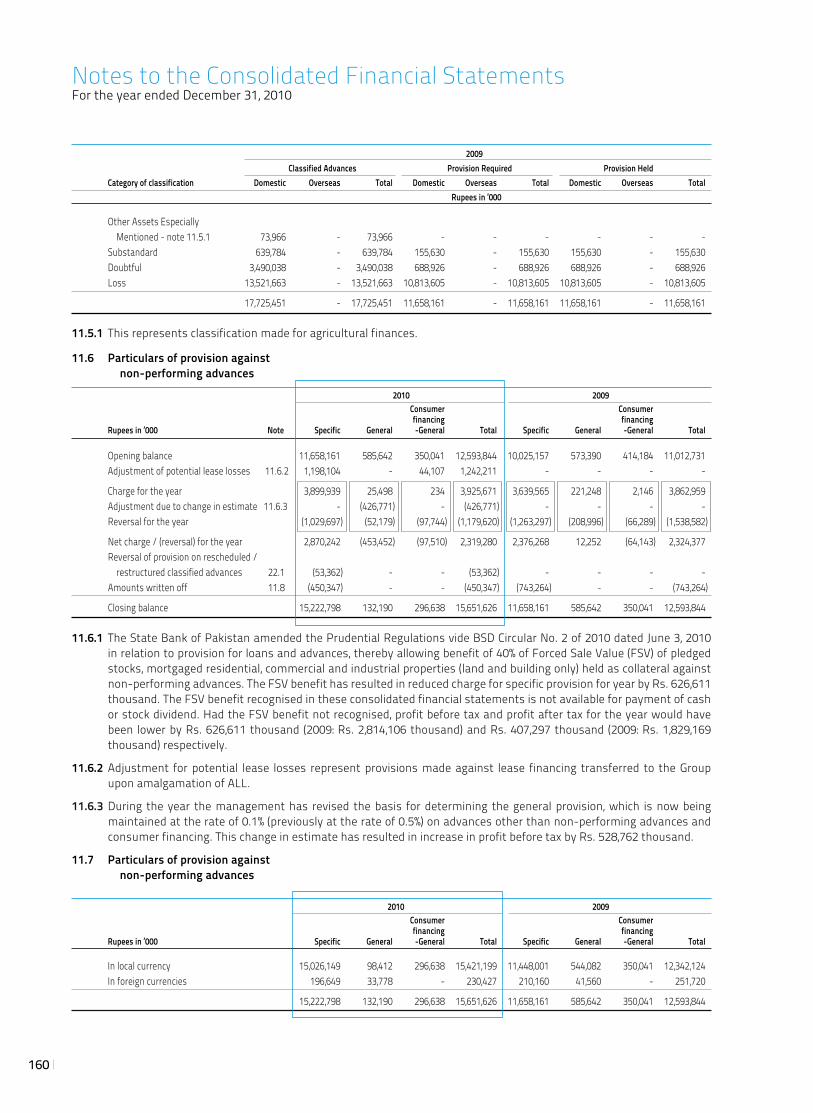
160
2009 Classified Advances Provision Required Provision Held Category of classification Domestic Overseas Total Domestic Overseas Total Domestic Overseas Total Rupees in ‘000
Other Assets Especially Mentioned - note 11.5.1 73,966 - 73,966 - - - - - - Substandard 639,784 - 639,784 155,630 - 155,630 155,630 - 155,630 Doubtful 3,490,038 - 3,490,038 688,926 - 688,926 688,926 - 688,926 Loss 13,521,663 - 13,521,663 10,813,605 - 10,813,605 10,813,605 - 10,813,605
17,725,451 - 17,725,451 11,658,161 - 11,658,161 11,658,161 - 11,658,161
11.5.1 This represents classification made for agricultural finances.
11.6 Particulars of provision against non-performing advances
2010 2009 Consumer Consumer financing financing Rupees in ‘000 Note Specific General -General Total Specific General -General Total Opening balance 11,658,161 585,642 350,041 12,593,844 10,025,157 573,390 414,184 11,012,731 Adjustment of potential lease losses 11.6.2 1,198,104 - 44,107 1,242,211 - - - -
Charge for the year 3,899,939 25,498 234 3,925,671 3,639,565 221,248 2,146 3,862,959 Adjustment due to change in estimate 11.6.3 - (426,771) - (426,771) - - - - Reversal for the year (1,029,697) (52,179) (97,744) (1,179,620) (1,263,297) (208,996) (66,289) (1,538,582)
Net charge / (reversal) for the year 2,870,242 (453,452) (97,510) 2,319,280 2,376,268 12,252 (64,143) 2,324,377 Reversal of provision on rescheduled / restructured classified advances 22.1 (53,362) - - (53,362) - - - - Amounts written off 11.8 (450,347) - - (450,347) (743,264) - - (743,264)
Closing balance 15,222,798 132,190 296,638 15,651,626 11,658,161 585,642 350,041 12,593,844
11.6.1 The State Bank of Pakistan amended the Prudential Regulations vide BSD Circular No. 2 of 2010 dated June 3, 2010 in relation to provision for loans and advances, thereby allowing benefit of 40% of Forced Sale Value (FSV) of pledged stocks, mortgaged residential, commercial and industrial properties (land and building only) held as collateral against non-performing advances. The FSV benefit has resulted in reduced charge for specific provision for year by Rs. 626,611 thousand. The FSV benefit recognised in these consolidated financial statements is not available for payment of cash or stock dividend. Had the FSV benefit not recognised, profit before tax and profit after tax for the year would have been lower by Rs. 626,611 thousand (2009: Rs. 2,814,106 thousand) and Rs. 407,297 thousand (2009: Rs. 1,829,169 thousand) respectively.
11.6.2 Adjustment for potential lease losses represent provisions made against lease financing transferred to the Group upon amalgamation of ALL.
11.6.3 During the year the management has revised the basis for determining the general provision, which is now being maintained at the rate of 0.1% (previously at the rate of 0.5%) on advances other than non-performing advances and consumer financing. This change in estimate has resulted in increase in profit before tax by Rs. 528,762 thousand.
11.7 Particulars of provision against non-performing advances
2010 2009 Consumer Consumer financing financing Rupees in ‘000 Specific General -General Total Specific General -General Total
In local currency 15,026,149 98,412 296,638 15,421,199 11,448,001 544,082 350,041 12,342,124 In foreign currencies 196,649 33,778 - 230,427 210,160 41,560 - 251,720
15,222,798 132,190 296,638 15,651,626 11,658,161 585,642 350,041 12,593,844
Notes to the Consolidated Financial StatementsFor the year ended December 31, 2010
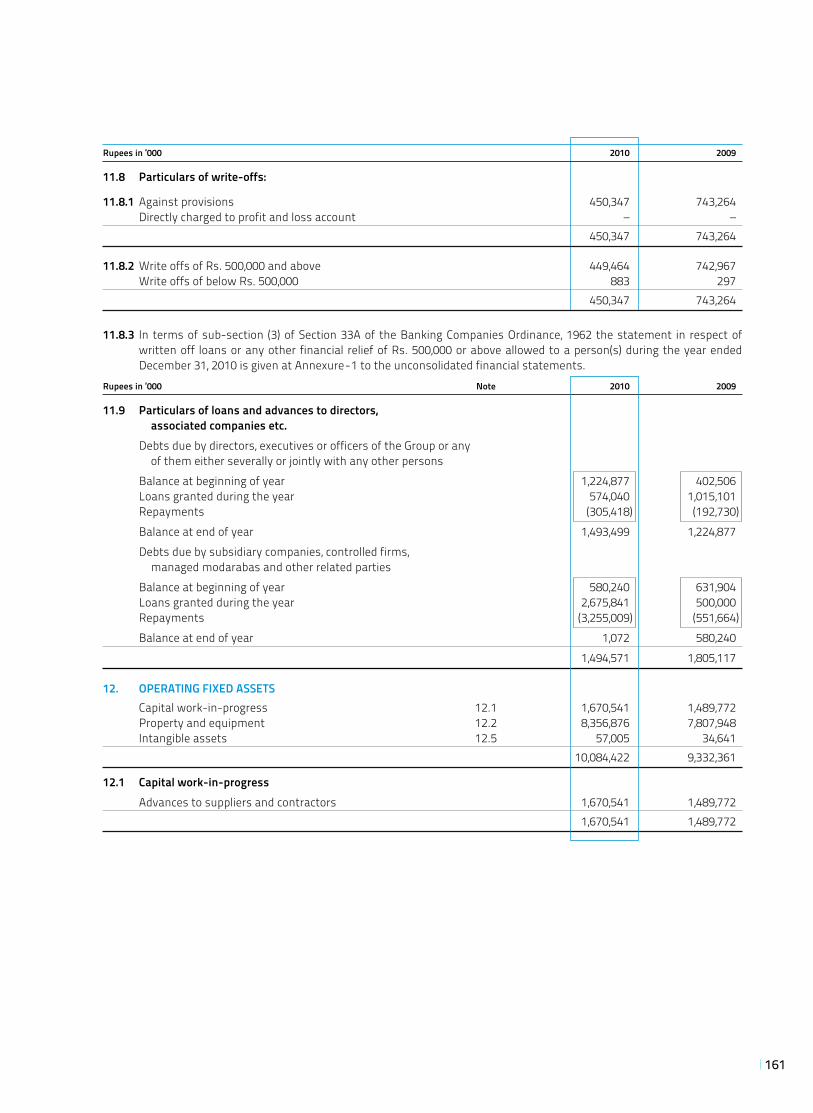
161
Rupees in ‘000 2010 2009
11.8 Particulars of write-offs:
11.8.1 Against provisions 450,347 743,264 Directly charged to profit and loss account – – 450,347 743,264
11.8.2 Write offs of Rs. 500,000 and above 449,464 742,967 Write offs of below Rs. 500,000 883 297 450,347 743,264
11.8.3 In terms of sub-section (3) of Section 33A of the Banking Companies Ordinance, 1962 the statement in respect of written off loans or any other financial relief of Rs. 500,000 or above allowed to a person(s) during the year ended December 31, 2010 is given at Annexure-1 to the unconsolidated financial statements.
Rupees in ‘000 Note 2010 2009
11.9 Particulars of loans and advances to directors, associated companies etc. Debts due by directors, executives or officers of the Group or any of them either severally or jointly with any other persons Balance at beginning of year 1,224,877 402,506 Loans granted during the year 574,040 1,015,101 Repayments (305,418) (192,730) Balance at end of year 1,493,499 1,224,877 Debts due by subsidiary companies, controlled firms, managed modarabas and other related parties Balance at beginning of year 580,240 631,904 Loans granted during the year 2,675,841 500,000 Repayments (3,255,009) (551,664) Balance at end of year 1,072 580,240 1,494,571 1,805,117
12. OPERATING FIXED ASSETS Capital work-in-progress 12.1 1,670,541 1,489,772 Property and equipment 12.2 8,356,876 7,807,948 Intangible assets 12.5 57,005 34,641 10,084,422 9,332,361
12.1 Capital work-in-progress Advances to suppliers and contractors 1,670,541 1,489,772 1,670,541 1,489,772
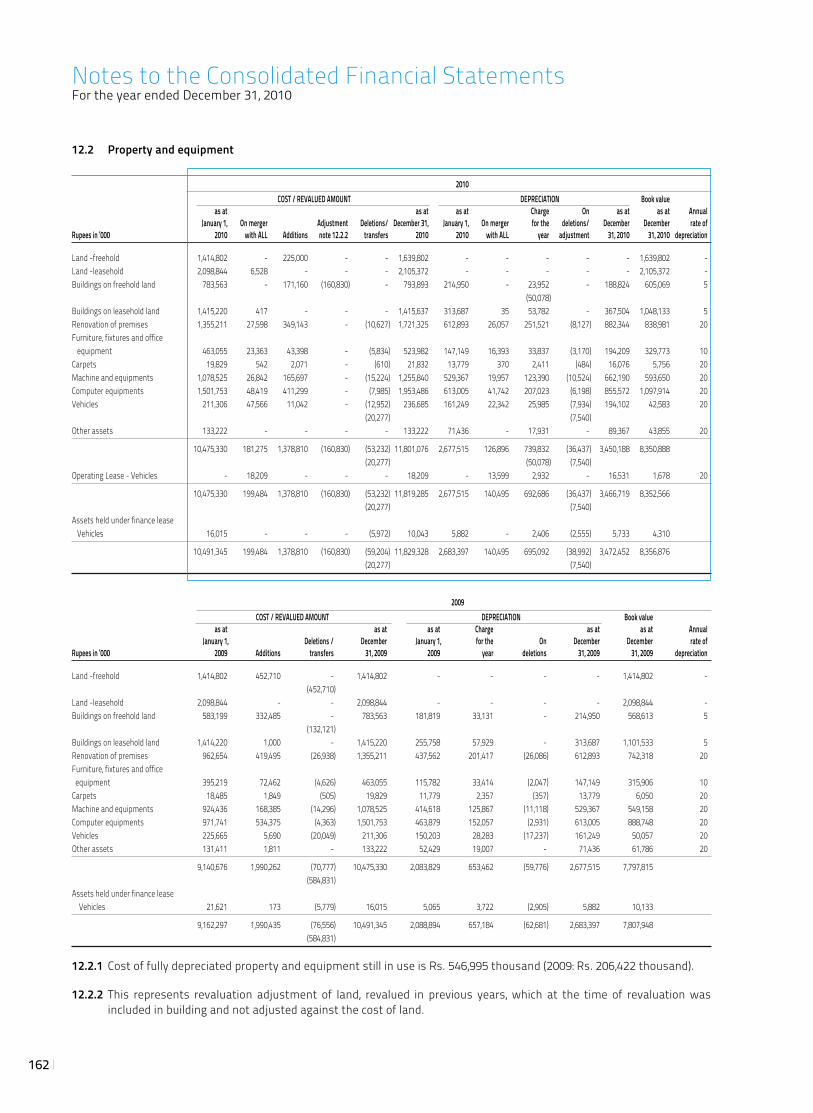
162
12.2 Property and equipment
2010 COST / REVALUED AMOUNT DEPRECIATION Book value as at as at as at Charge On as at as at Annual January 1, On merger Adjustment Deletions/ December 31, January 1, On merger for the deletions/ December December rate ofRupees in ‘000 2010 with ALL Additions note 12.2.2 transfers 2010 2010 with ALL year adjustment 31, 2010 31, 2010 depreciation
Land -freehold 1,414,802 - 225,000 - - 1,639,802 - - - - - 1,639,802 -Land -leasehold 2,098,844 6,528 - - - 2,105,372 - - - - - 2,105,372 -Buildings on freehold land 783,563 - 171,160 (160,830) - 793,893 214,950 - 23,952 - 188,824 605,069 5 (50,078) Buildings on leasehold land 1,415,220 417 - - - 1,415,637 313,687 35 53,782 - 367,504 1,048,133 5Renovation of premises 1,355,211 27,598 349,143 - (10,627) 1,721,325 612,893 26,057 251,521 (8,127) 882,344 838,981 20Furniture, fixtures and office equipment 463,055 23,363 43,398 - (5,834) 523,982 147,149 16,393 33,837 (3,170) 194,209 329,773 10Carpets 19,829 542 2,071 - (610) 21,832 13,779 370 2,411 (484) 16,076 5,756 20Machine and equipments 1,078,525 26,842 165,697 - (15,224) 1,255,840 529,367 19,957 123,390 (10,524) 662,190 593,650 20Computer equipments 1,501,753 48,419 411,299 - (7,985) 1,953,486 613,005 41,742 207,023 (6,198) 855,572 1,097,914 20Vehicles 211,306 47,566 11,042 - (12,952) 236,685 161,249 22,342 25,985 (7,934) 194,102 42,583 20
(20,277) (7,540) Other assets 133,222 - - - - 133,222 71,436 - 17,931 - 89,367 43,855 20
10,475,330 181,275 1,378,810 (160,830) (53,232) 11,801,076 2,677,515 126,896 739,832 (36,437) 3,450,188 8,350,888 (20,277) (50,078) (7,540) Operating Lease - Vehicles - 18,209 - - - 18,209 - 13,599 2,932 - 16,531 1,678 20
10,475,330 199,484 1,378,810 (160,830) (53,232) 11,819,285 2,677,515 140,495 692,686 (36,437) 3,466,719 8,352,566 (20,277) (7,540) Assets held under finance lease Vehicles 16,015 - - - (5,972) 10,043 5,882 - 2,406 (2,555) 5,733 4,310
10,491,345 199,484 1,378,810 (160,830) (59,204) 11,829,328 2,683,397 140,495 695,092 (38,992) 3,472,452 8,356,876 (20,277) (7,540)
2009 COST / REVALUED AMOUNT DEPRECIATION Book value as at as at as at Charge as at as at Annual January 1, Deletions / December January 1, for the On December December rate ofRupees in ‘000 2009 Additions transfers 31, 2009 2009 year deletions 31, 2009 31, 2009 depreciation
Land -freehold 1,414,802 452,710 - 1,414,802 - - - - 1,414,802 - (452,710)Land -leasehold 2,098,844 - - 2,098,844 - - - - 2,098,844 -Buildings on freehold land 583,199 332,485 - 783,563 181,819 33,131 - 214,950 568,613 5 (132,121)Buildings on leasehold land 1,414,220 1,000 - 1,415,220 255,758 57,929 - 313,687 1,101,533 5Renovation of premises 962,654 419,495 (26,938) 1,355,211 437,562 201,417 (26,086) 612,893 742,318 20Furniture, fixtures and office equipment 395,219 72,462 (4,626) 463,055 115,782 33,414 (2,047) 147,149 315,906 10Carpets 18,485 1,849 (505) 19,829 11,779 2,357 (357) 13,779 6,050 20Machine and equipments 924,436 168,385 (14,296) 1,078,525 414,618 125,867 (11,118) 529,367 549,158 20Computer equipments 971,741 534,375 (4,363) 1,501,753 463,879 152,057 (2,931) 613,005 888,748 20Vehicles 225,665 5,690 (20,049) 211,306 150,203 28,283 (17,237) 161,249 50,057 20Other assets 131,411 1,811 - 133,222 52,429 19,007 - 71,436 61,786 20
9,140,676 1,990,262 (70,777) 10,475,330 2,083,829 653,462 (59,776) 2,677,515 7,797,815 (584,831)Assets held under finance lease Vehicles 21,621 173 (5,779) 16,015 5,065 3,722 (2,905) 5,882 10,133
9,162,297 1,990,435 (76,556) 10,491,345 2,088,894 657,184 (62,681) 2,683,397 7,807,948 (584,831)
12.2.1 Cost of fully depreciated property and equipment still in use is Rs. 546,995 thousand (2009: Rs. 206,422 thousand).
12.2.2 This represents revaluation adjustment of land, revalued in previous years, which at the time of revaluation was included in building and not adjusted against the cost of land.
Notes to the Consolidated Financial StatementsFor the year ended December 31, 2010
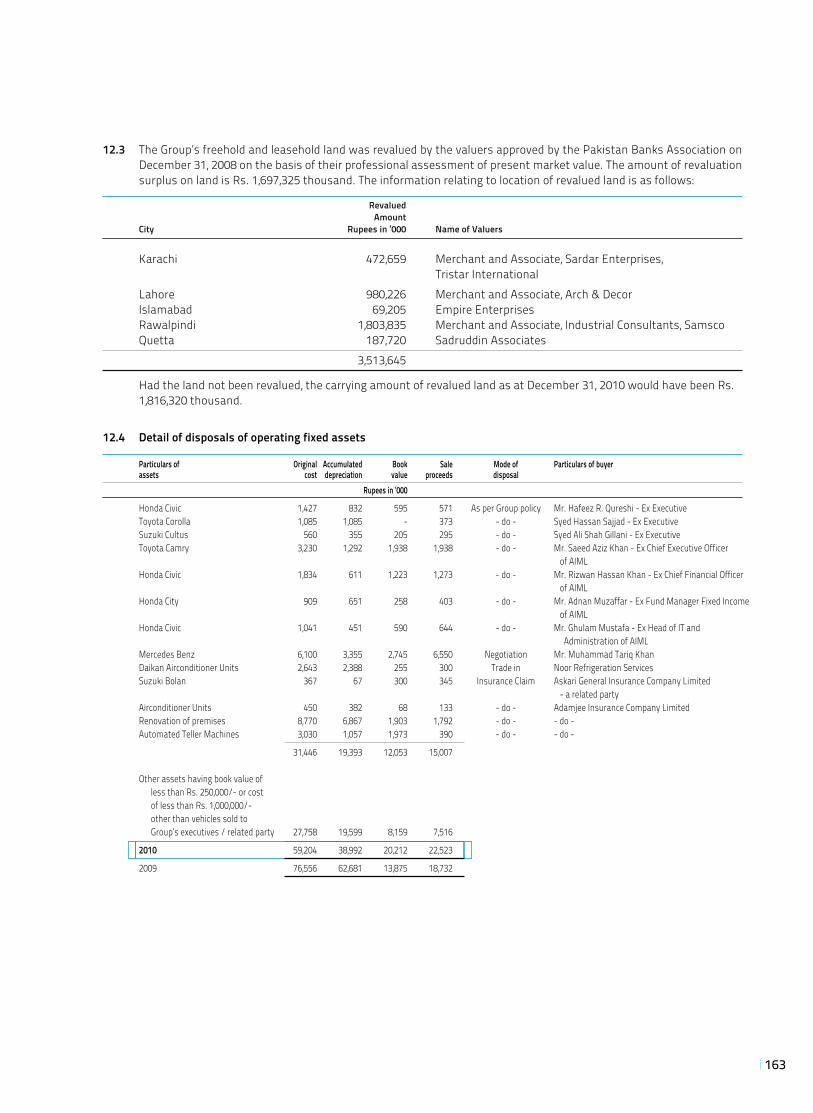
163
12.4 Detail of disposals of operating fixed assets
Particulars of Original Accumulated Book Sale Mode of Particulars of buyer assets cost depreciation value proceeds disposal Rupees in ‘000
Honda Civic 1,427 832 595 571 As per Group policy Mr. Hafeez R. Qureshi - Ex Executive Toyota Corolla 1,085 1,085 - 373 - do - Syed Hassan Sajjad - Ex Executive Suzuki Cultus 560 355 205 295 - do - Syed Ali Shah Gillani - Ex Executive Toyota Camry 3,230 1,292 1,938 1,938 - do - Mr. Saeed Aziz Khan - Ex Chief Executive Officer
of AIML Honda Civic 1,834 611 1,223 1,273 - do - Mr. Rizwan Hassan Khan - Ex Chief Financial Officer of AIML Honda City 909 651 258 403 - do - Mr. Adnan Muzaffar - Ex Fund Manager Fixed Income of AIML Honda Civic 1,041 451 590 644 - do - Mr. Ghulam Mustafa - Ex Head of IT and
Administration of AIML Mercedes Benz 6,100 3,355 2,745 6,550 Negotiation Mr. Muhammad Tariq Khan Daikan Airconditioner Units 2,643 2,388 255 300 Trade in Noor Refrigeration Services Suzuki Bolan 367 67 300 345 Insurance Claim Askari General Insurance Company Limited
- a related party Airconditioner Units 450 382 68 133 - do - Adamjee Insurance Company Limited Renovation of premises 8,770 6,867 1,903 1,792 - do - - do - Automated Teller Machines 3,030 1,057 1,973 390 - do - - do -
31,446 19,393 12,053 15,007 Other assets having book value of less than Rs. 250,000/- or cost of less than Rs. 1,000,000/- other than vehicles sold to Group’s executives / related party 27,758 19,599 8,159 7,516
2010 59,204 38,992 20,212 22,523
2009 76,556 62,681 13,875 18,732
12.3 The Group’s freehold and leasehold land was revalued by the valuers approved by the Pakistan Banks Association on December 31, 2008 on the basis of their professional assessment of present market value. The amount of revaluation surplus on land is Rs. 1,697,325 thousand. The information relating to location of revalued land is as follows:
Revalued Amount City Rupees in ‘000 Name of Valuers Karachi 472,659 Merchant and Associate, Sardar Enterprises,
Tristar International Lahore 980,226 Merchant and Associate, Arch & Decor Islamabad 69,205 Empire Enterprises Rawalpindi 1,803,835 Merchant and Associate, Industrial Consultants, Samsco Quetta 187,720 Sadruddin Associates 3,513,645
Had the land not been revalued, the carrying amount of revalued land as at December 31, 2010 would have been Rs. 1,816,320 thousand.
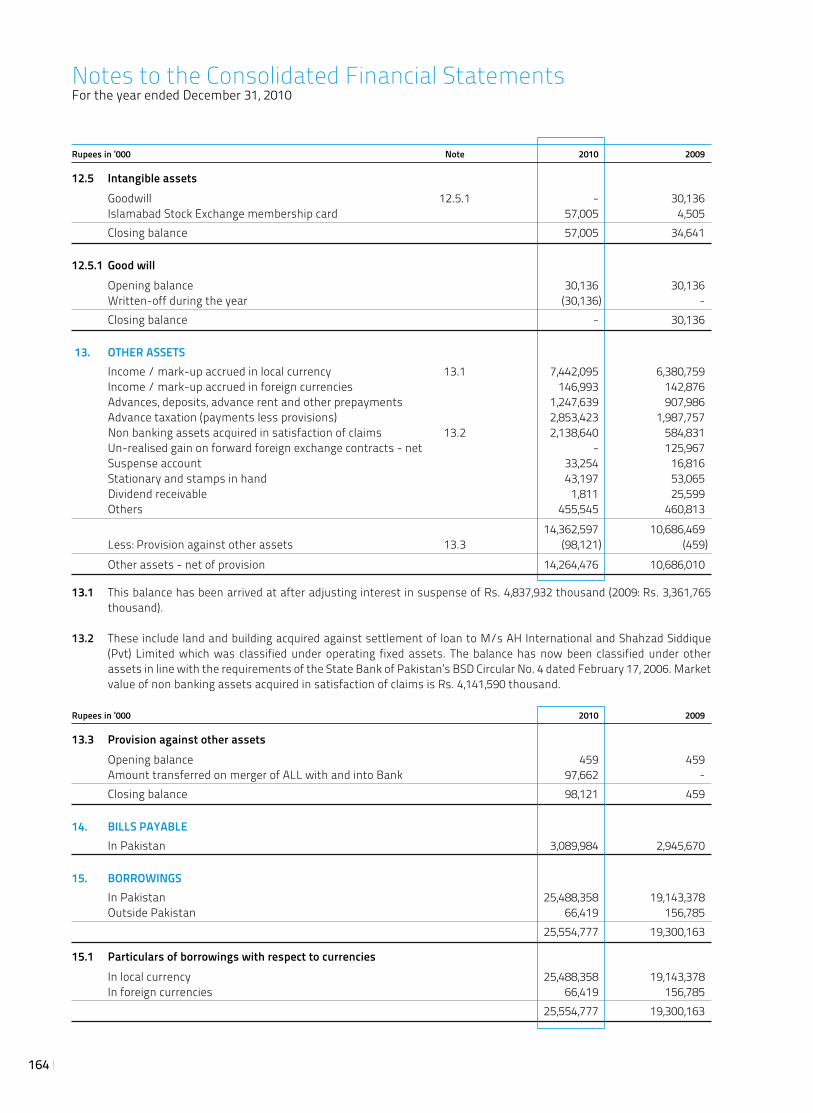
164
Rupees in ‘000 Note 2010 2009
12.5 Intangible assets Goodwill 12.5.1 - 30,136 Islamabad Stock Exchange membership card 57,005 4,505 Closing balance 57,005 34,641
12.5.1 Good will Opening balance 30,136 30,136 Written-off during the year (30,136) - Closing balance - 30,136
13. OTHER ASSETS Income / mark-up accrued in local currency 13.1 7,442,095 6,380,759 Income / mark-up accrued in foreign currencies 146,993 142,876 Advances, deposits, advance rent and other prepayments 1,247,639 907,986 Advance taxation (payments less provisions) 2,853,423 1,987,757 Non banking assets acquired in satisfaction of claims 13.2 2,138,640 584,831 Un-realised gain on forward foreign exchange contracts - net - 125,967 Suspense account 33,254 16,816 Stationary and stamps in hand 43,197 53,065 Dividend receivable 1,811 25,599 Others 455,545 460,813 14,362,597 10,686,469 Less: Provision against other assets 13.3 (98,121) (459) Other assets - net of provision 14,264,476 10,686,010
13.1 This balance has been arrived at after adjusting interest in suspense of Rs. 4,837,932 thousand (2009: Rs. 3,361,765 thousand).
13.2 These include land and building acquired against settlement of loan to M/s AH International and Shahzad Siddique (Pvt) Limited which was classified under operating fixed assets. The balance has now been classified under other assets in line with the requirements of the State Bank of Pakistan’s BSD Circular No. 4 dated February 17, 2006. Market value of non banking assets acquired in satisfaction of claims is Rs. 4,141,590 thousand.
Rupees in ‘000 2010 2009
13.3 Provision against other assets Opening balance 459 459 Amount transferred on merger of ALL with and into Bank 97,662 - Closing balance 98,121 459
14. BILLS PAYABLE In Pakistan 3,089,984 2,945,670
15. BORROWINGS In Pakistan 25,488,358 19,143,378 Outside Pakistan 66,419 156,785 25,554,777 19,300,163
15.1 Particulars of borrowings with respect to currencies In local currency 25,488,358 19,143,378 In foreign currencies 66,419 156,785 25,554,777 19,300,163
Notes to the Consolidated Financial StatementsFor the year ended December 31, 2010
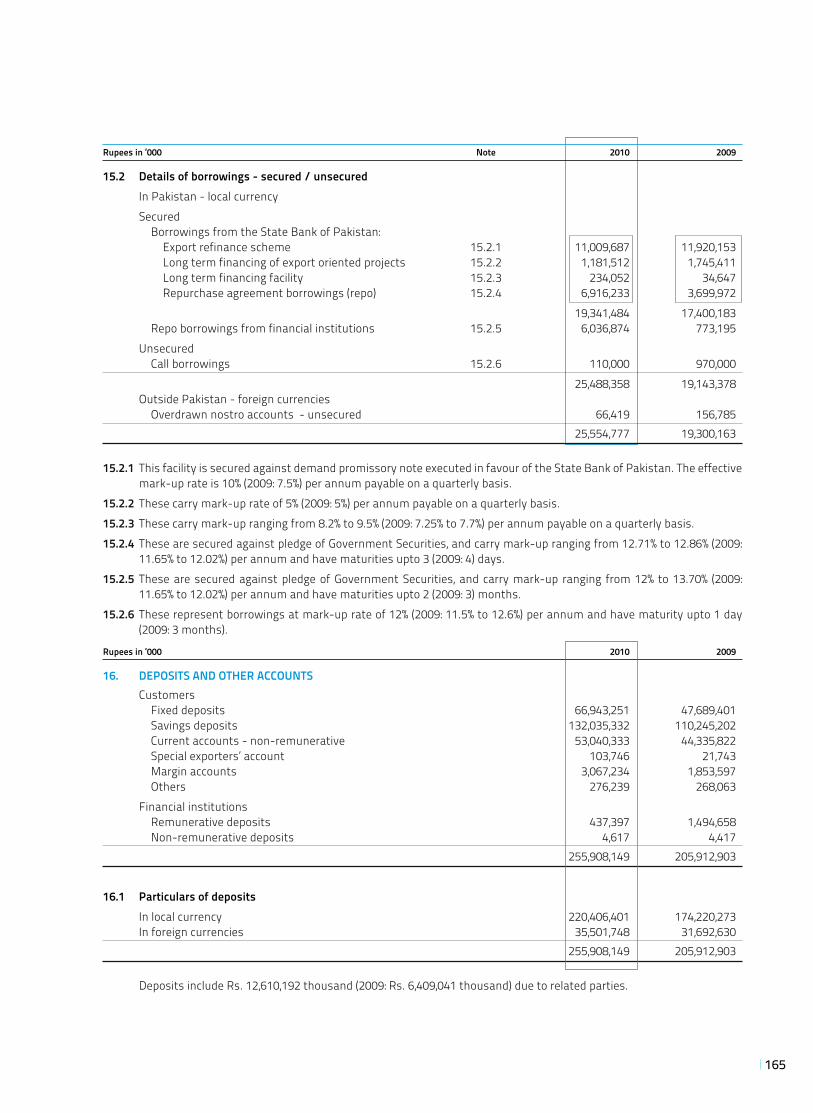
165
Rupees in ‘000 Note 2010 2009
15.2 Details of borrowings - secured / unsecured In Pakistan - local currency Secured Borrowings from the State Bank of Pakistan: Export refinance scheme 15.2.1 11,009,687 11,920,153 Long term financing of export oriented projects 15.2.2 1,181,512 1,745,411 Long term financing facility 15.2.3 234,052 34,647 Repurchase agreement borrowings (repo) 15.2.4 6,916,233 3,699,972 19,341,484 17,400,183 Repo borrowings from financial institutions 15.2.5 6,036,874 773,195 Unsecured Call borrowings 15.2.6 110,000 970,000 25,488,358 19,143,378 Outside Pakistan - foreign currencies Overdrawn nostro accounts - unsecured 66,419 156,785 25,554,777 19,300,163
15.2.1 This facility is secured against demand promissory note executed in favour of the State Bank of Pakistan. The effective mark-up rate is 10% (2009: 7.5%) per annum payable on a quarterly basis.
15.2.2 These carry mark-up rate of 5% (2009: 5%) per annum payable on a quarterly basis.15.2.3 These carry mark-up ranging from 8.2% to 9.5% (2009: 7.25% to 7.7%) per annum payable on a quarterly basis. 15.2.4 These are secured against pledge of Government Securities, and carry mark-up ranging from 12.71% to 12.86% (2009:
11.65% to 12.02%) per annum and have maturities upto 3 (2009: 4) days.15.2.5 These are secured against pledge of Government Securities, and carry mark-up ranging from 12% to 13.70% (2009:
11.65% to 12.02%) per annum and have maturities upto 2 (2009: 3) months.15.2.6 These represent borrowings at mark-up rate of 12% (2009: 11.5% to 12.6%) per annum and have maturity upto 1 day
(2009: 3 months).
Rupees in ‘000 2010 2009
16. DEPOSITS AND OTHER ACCOUNTS Customers Fixed deposits 66,943,251 47,689,401 Savings deposits 132,035,332 110,245,202 Current accounts - non-remunerative 53,040,333 44,335,822 Special exporters’ account 103,746 21,743 Margin accounts 3,067,234 1,853,597 Others 276,239 268,063 Financial institutions Remunerative deposits 437,397 1,494,658 Non-remunerative deposits 4,617 4,417 255,908,149 205,912,903
16.1 Particulars of deposits In local currency 220,406,401 174,220,273 In foreign currencies 35,501,748 31,692,630 255,908,149 205,912,903
Deposits include Rs. 12,610,192 thousand (2009: Rs. 6,409,041 thousand) due to related parties.
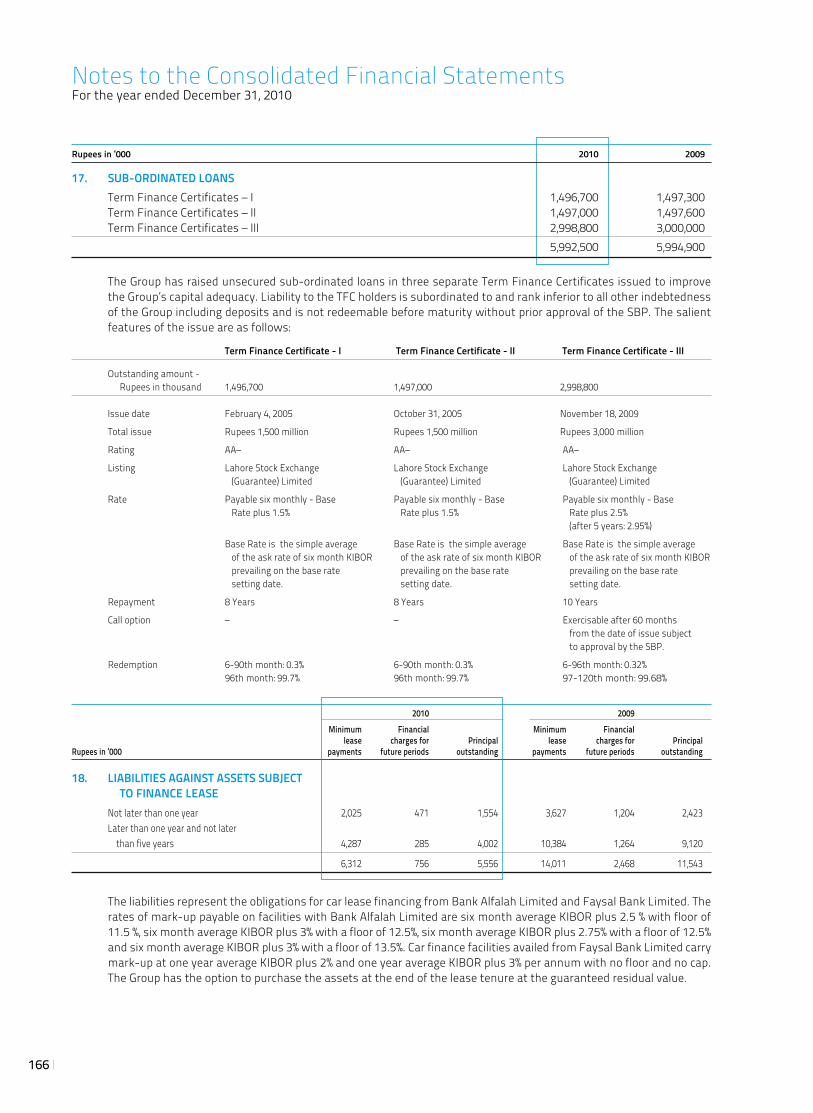
166
Rupees in ‘000 2010 2009
17. SUB-ORDINATED LOANS Term Finance Certificates – I 1,496,700 1,497,300 Term Finance Certificates – II 1,497,000 1,497,600 Term Finance Certificates – III 2,998,800 3,000,000 5,992,500 5,994,900
The Group has raised unsecured sub-ordinated loans in three separate Term Finance Certificates issued to improve the Group’s capital adequacy. Liability to the TFC holders is subordinated to and rank inferior to all other indebtedness of the Group including deposits and is not redeemable before maturity without prior approval of the SBP. The salient features of the issue are as follows:
Term Finance Certificate - I Term Finance Certificate - II Term Finance Certificate - III
Outstanding amount - Rupees in thousand 1,496,700 1,497,000 2,998,800
Issue date February 4, 2005 October 31, 2005 November 18, 2009
Total issue Rupees 1,500 million Rupees 1,500 million Rupees 3,000 million
Rating AA– AA– AA–
Listing Lahore Stock Exchange Lahore Stock Exchange Lahore Stock Exchange (Guarantee) Limited (Guarantee) Limited (Guarantee) Limited
Rate Payable six monthly - Base Payable six monthly - Base Payable six monthly - Base Rate plus 1.5% Rate plus 1.5% Rate plus 2.5% (after 5 years: 2.95%)
Base Rate is the simple average Base Rate is the simple average Base Rate is the simple average of the ask rate of six month KIBOR of the ask rate of six month KIBOR of the ask rate of six month KIBOR prevailing on the base rate prevailing on the base rate prevailing on the base rate setting date. setting date. setting date.
Repayment 8 Years 8 Years 10 Years
Call option – – Exercisable after 60 months from the date of issue subject to approval by the SBP.
Redemption 6-90th month: 0.3% 6-90th month: 0.3% 6-96th month: 0.32% 96th month: 99.7% 96th month: 99.7% 97-120th month: 99.68%
2010 2009 Minimum Financial Minimum Financial lease charges for Principal lease charges for PrincipalRupees in ‘000 payments future periods outstanding payments future periods outstanding
18. LIABILITIES AGAINST ASSETS SUBJECT TO FINANCE LEASE Not later than one year 2,025 471 1,554 3,627 1,204 2,423 Later than one year and not later than five years 4,287 285 4,002 10,384 1,264 9,120
6,312 756 5,556 14,011 2,468 11,543
The liabilities represent the obligations for car lease financing from Bank Alfalah Limited and Faysal Bank Limited. The rates of mark-up payable on facilities with Bank Alfalah Limited are six month average KIBOR plus 2.5 % with floor of 11.5 %, six month average KIBOR plus 3% with a floor of 12.5%, six month average KIBOR plus 2.75% with a floor of 12.5% and six month average KIBOR plus 3% with a floor of 13.5%. Car finance facilities availed from Faysal Bank Limited carry mark-up at one year average KIBOR plus 2% and one year average KIBOR plus 3% per annum with no floor and no cap. The Group has the option to purchase the assets at the end of the lease tenure at the guaranteed residual value.
Notes to the Consolidated Financial StatementsFor the year ended December 31, 2010
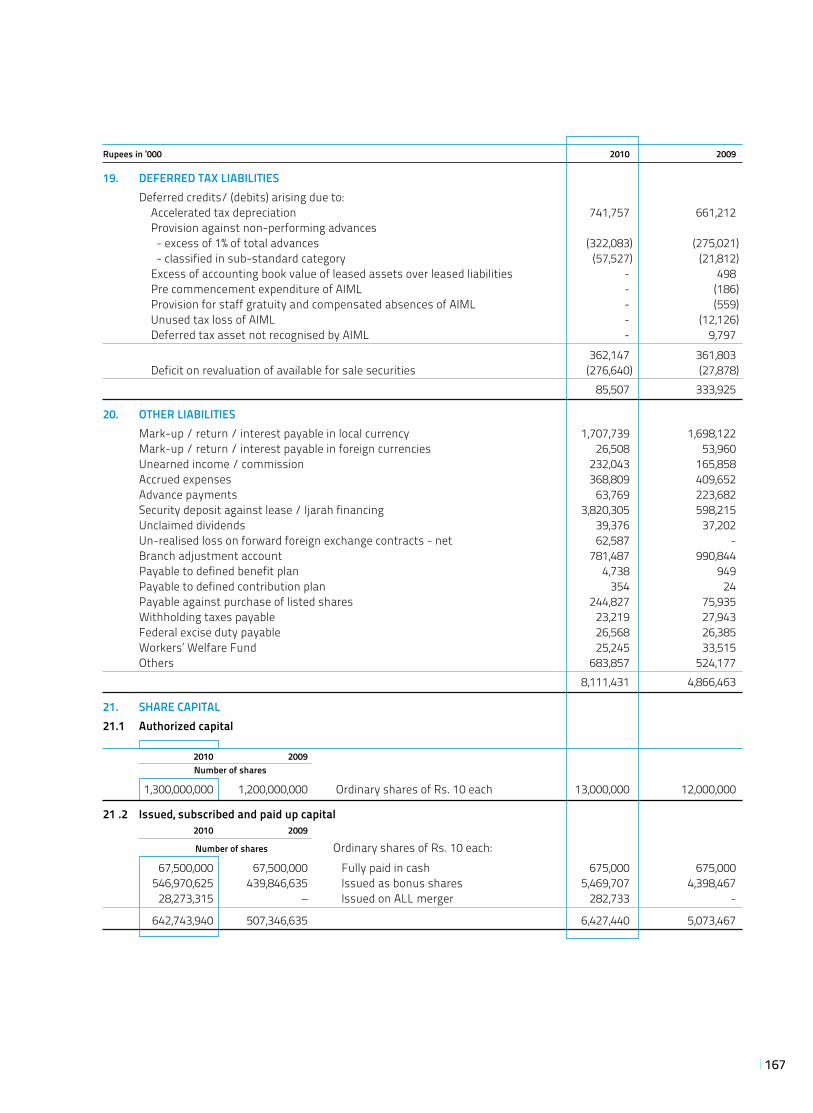
167
Rupees in ‘000 2010 2009
19. DEFERRED TAX LIABILITIES Deferred credits/ (debits) arising due to: Accelerated tax depreciation 741,757 661,212 Provision against non-performing advances - excess of 1% of total advances (322,083) (275,021) - classified in sub-standard category (57,527) (21,812) Excess of accounting book value of leased assets over leased liabilities - 498 Pre commencement expenditure of AIML - (186) Provision for staff gratuity and compensated absences of AIML - (559) Unused tax loss of AIML - (12,126) Deferred tax asset not recognised by AIML - 9,797 362,147 361,803 Deficit on revaluation of available for sale securities (276,640) (27,878) 85,507 333,925
20. OTHER LIABILITIES Mark-up / return / interest payable in local currency 1,707,739 1,698,122 Mark-up / return / interest payable in foreign currencies 26,508 53,960 Unearned income / commission 232,043 165,858 Accrued expenses 368,809 409,652 Advance payments 63,769 223,682 Security deposit against lease / Ijarah financing 3,820,305 598,215 Unclaimed dividends 39,376 37,202 Un-realised loss on forward foreign exchange contracts - net 62,587 - Branch adjustment account 781,487 990,844 Payable to defined benefit plan 4,738 949 Payable to defined contribution plan 354 24 Payable against purchase of listed shares 244,827 75,935 Withholding taxes payable 23,219 27,943 Federal excise duty payable 26,568 26,385 Workers’ Welfare Fund 25,245 33,515 Others 683,857 524,177 8,111,431 4,866,463
21. SHARE CAPITAL21.1 Authorized capital
2010 2009 Number of shares
1,300,000,000 1,200,000,000 Ordinary shares of Rs. 10 each 13,000,000 12,000,000
21 .2 Issued, subscribed and paid up capital 2010 2009
Number of shares Ordinary shares of Rs. 10 each: 67,500,000 67,500,000 Fully paid in cash 675,000 675,000 546,970,625 439,846,635 Issued as bonus shares 5,469,707 4,398,467 28,273,315 – Issued on ALL merger 282,733 -
642,743,940 507,346,635 6,427,440 5,073,467
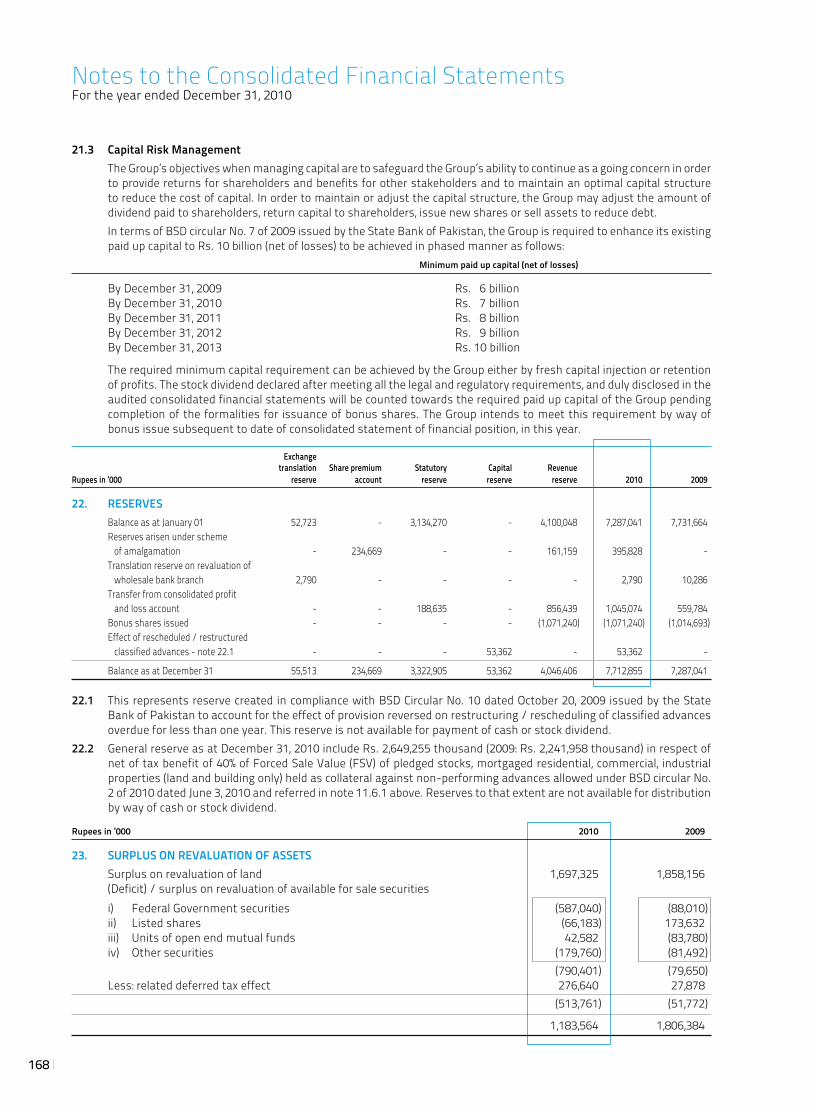
168
21.3 Capital Risk Management The Group’s objectives when managing capital are to safeguard the Group’s ability to continue as a going concern in order
to provide returns for shareholders and benefits for other stakeholders and to maintain an optimal capital structure to reduce the cost of capital. In order to maintain or adjust the capital structure, the Group may adjust the amount of dividend paid to shareholders, return capital to shareholders, issue new shares or sell assets to reduce debt.
In terms of BSD circular No. 7 of 2009 issued by the State Bank of Pakistan, the Group is required to enhance its existing paid up capital to Rs. 10 billion (net of losses) to be achieved in phased manner as follows:
Minimum paid up capital (net of losses)
By December 31, 2009 Rs. 6 billion By December 31, 2010 Rs. 7 billion By December 31, 2011 Rs. 8 billion By December 31, 2012 Rs. 9 billion By December 31, 2013 Rs. 10 billion
The required minimum capital requirement can be achieved by the Group either by fresh capital injection or retention of profits. The stock dividend declared after meeting all the legal and regulatory requirements, and duly disclosed in the audited consolidated financial statements will be counted towards the required paid up capital of the Group pending completion of the formalities for issuance of bonus shares. The Group intends to meet this requirement by way of bonus issue subsequent to date of consolidated statement of financial position, in this year.
Exchange translation Share premium Statutory Capital RevenueRupees in ‘000 reserve account reserve reserve reserve 2010 2009
22. RESERVES Balance as at January 01 52,723 - 3,134,270 - 4,100,048 7,287,041 7,731,664 Reserves arisen under scheme of amalgamation - 234,669 - - 161,159 395,828 - Translation reserve on revaluation of wholesale bank branch 2,790 - - - - 2,790 10,286 Transfer from consolidated profit
and loss account - - 188,635 - 856,439 1,045,074 559,784 Bonus shares issued - - - - (1,071,240) (1,071,240) (1,014,693) Effect of rescheduled / restructured classified advances - note 22.1 - - - 53,362 - 53,362 -
Balance as at December 31 55,513 234,669 3,322,905 53,362 4,046,406 7,712,855 7,287,041
22.1 This represents reserve created in compliance with BSD Circular No. 10 dated October 20, 2009 issued by the State Bank of Pakistan to account for the effect of provision reversed on restructuring / rescheduling of classified advances overdue for less than one year. This reserve is not available for payment of cash or stock dividend.
22.2 General reserve as at December 31, 2010 include Rs. 2,649,255 thousand (2009: Rs. 2,241,958 thousand) in respect of net of tax benefit of 40% of Forced Sale Value (FSV) of pledged stocks, mortgaged residential, commercial, industrial properties (land and building only) held as collateral against non-performing advances allowed under BSD circular No. 2 of 2010 dated June 3, 2010 and referred in note 11.6.1 above. Reserves to that extent are not available for distribution by way of cash or stock dividend.
Rupees in ‘000 2010 2009
23. SURPLUS ON REVALUATION OF ASSETS Surplus on revaluation of land 1,697,325 1,858,156 (Deficit) / surplus on revaluation of available for sale securities i) Federal Government securities (587,040) (88,010) ii) Listed shares (66,183) 173,632 iii) Units of open end mutual funds 42,582 (83,780) iv) Other securities (179,760) (81,492) (790,401) (79,650) Less: related deferred tax effect 276,640 27,878 (513,761) (51,772)
1,183,564 1,806,384
Notes to the Consolidated Financial StatementsFor the year ended December 31, 2010
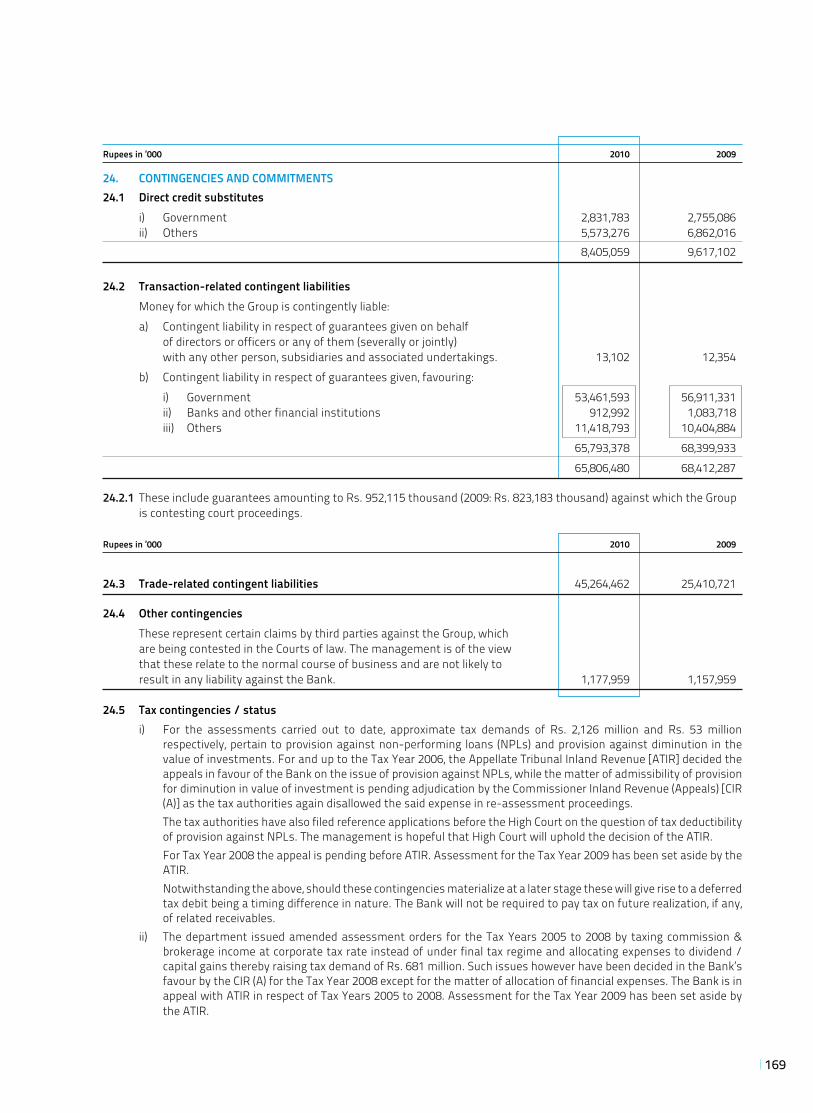
169
Rupees in ‘000 2010 2009
24. CONTINGENCIES AND COMMITMENTS24.1 Direct credit substitutes i) Government 2,831,783 2,755,086 ii) Others 5,573,276 6,862,016 8,405,059 9,617,102
24.2 Transaction-related contingent liabilities Money for which the Group is contingently liable: a) Contingent liability in respect of guarantees given on behalf of directors or officers or any of them (severally or jointly) with any other person, subsidiaries and associated undertakings. 13,102 12,354 b) Contingent liability in respect of guarantees given, favouring: i) Government 53,461,593 56,911,331 ii) Banks and other financial institutions 912,992 1,083,718 iii) Others 11,418,793 10,404,884 65,793,378 68,399,933 65,806,480 68,412,287
24.2.1 These include guarantees amounting to Rs. 952,115 thousand (2009: Rs. 823,183 thousand) against which the Group is contesting court proceedings.
Rupees in ‘000 2010 2009
24.3 Trade-related contingent liabilities 45,264,462 25,410,721
24.4 Other contingencies These represent certain claims by third parties against the Group, which are being contested in the Courts of law. The management is of the view that these relate to the normal course of business and are not likely to result in any liability against the Bank. 1,177,959 1,157,959 24.5 Tax contingencies / status i) For the assessments carried out to date, approximate tax demands of Rs. 2,126 million and Rs. 53 million
respectively, pertain to provision against non-performing loans (NPLs) and provision against diminution in the value of investments. For and up to the Tax Year 2006, the Appellate Tribunal Inland Revenue [ATIR] decided the appeals in favour of the Bank on the issue of provision against NPLs, while the matter of admissibility of provision for diminution in value of investment is pending adjudication by the Commissioner Inland Revenue (Appeals) [CIR (A)] as the tax authorities again disallowed the said expense in re-assessment proceedings.
The tax authorities have also filed reference applications before the High Court on the question of tax deductibility of provision against NPLs. The management is hopeful that High Court will uphold the decision of the ATIR.
For Tax Year 2008 the appeal is pending before ATIR. Assessment for the Tax Year 2009 has been set aside by the ATIR.
Notwithstanding the above, should these contingencies materialize at a later stage these will give rise to a deferred tax debit being a timing difference in nature. The Bank will not be required to pay tax on future realization, if any, of related receivables.
ii) The department issued amended assessment orders for the Tax Years 2005 to 2008 by taxing commission & brokerage income at corporate tax rate instead of under final tax regime and allocating expenses to dividend / capital gains thereby raising tax demand of Rs. 681 million. Such issues however have been decided in the Bank’s favour by the CIR (A) for the Tax Year 2008 except for the matter of allocation of financial expenses. The Bank is in appeal with ATIR in respect of Tax Years 2005 to 2008. Assessment for the Tax Year 2009 has been set aside by the ATIR.
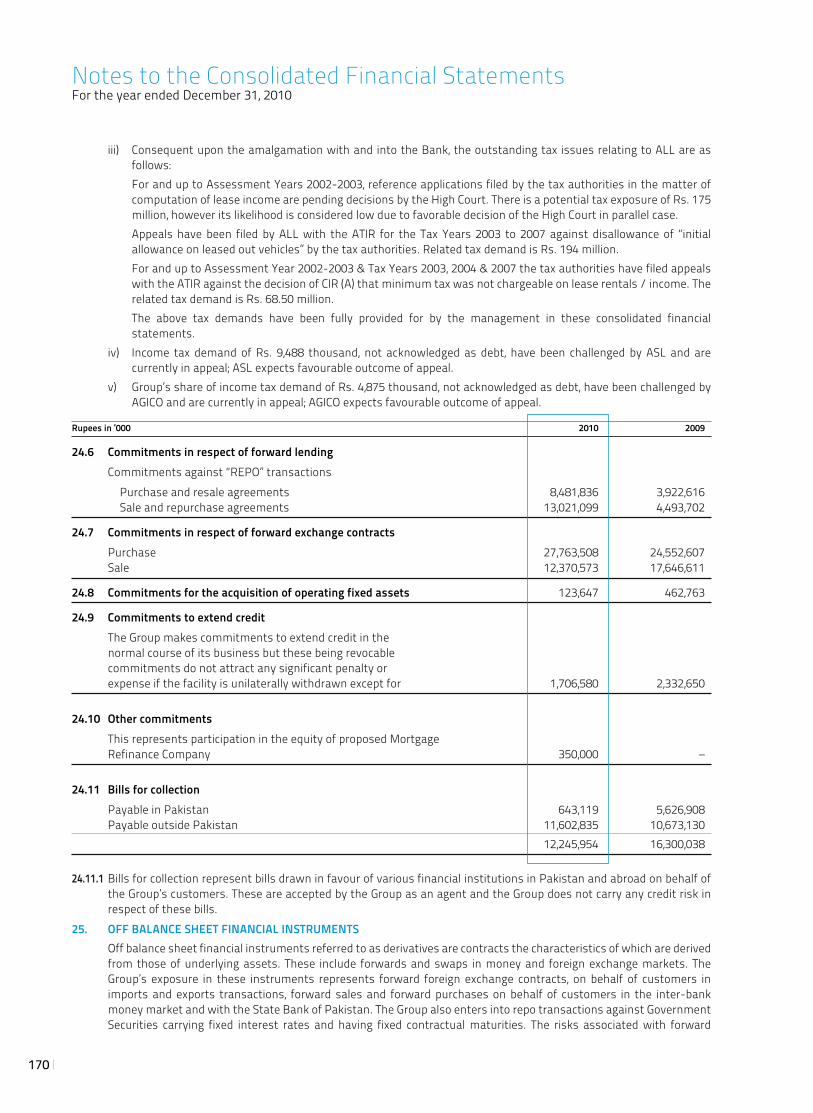
170
iii) Consequent upon the amalgamation with and into the Bank, the outstanding tax issues relating to ALL are as follows:
For and up to Assessment Years 2002-2003, reference applications filed by the tax authorities in the matter of computation of lease income are pending decisions by the High Court. There is a potential tax exposure of Rs. 175 million, however its likelihood is considered low due to favorable decision of the High Court in parallel case.
Appeals have been filed by ALL with the ATIR for the Tax Years 2003 to 2007 against disallowance of “initial allowance on leased out vehicles” by the tax authorities. Related tax demand is Rs. 194 million.
For and up to Assessment Year 2002-2003 & Tax Years 2003, 2004 & 2007 the tax authorities have filed appeals with the ATIR against the decision of CIR (A) that minimum tax was not chargeable on lease rentals / income. The related tax demand is Rs. 68.50 million.
The above tax demands have been fully provided for by the management in these consolidated financial statements.
iv) Income tax demand of Rs. 9,488 thousand, not acknowledged as debt, have been challenged by ASL and are currently in appeal; ASL expects favourable outcome of appeal.
v) Group’s share of income tax demand of Rs. 4,875 thousand, not acknowledged as debt, have been challenged by AGICO and are currently in appeal; AGICO expects favourable outcome of appeal.
Rupees in ‘000 2010 2009
24.6 Commitments in respect of forward lending Commitments against “REPO” transactions Purchase and resale agreements 8,481,836 3,922,616 Sale and repurchase agreements 13,021,099 4,493,702
24.7 Commitments in respect of forward exchange contracts Purchase 27,763,508 24,552,607 Sale 12,370,573 17,646,611
24.8 Commitments for the acquisition of operating fixed assets 123,647 462,763
24.9 Commitments to extend credit The Group makes commitments to extend credit in the
normal course of its business but these being revocable commitments do not attract any significant penalty or expense if the facility is unilaterally withdrawn except for 1,706,580 2,332,650
24.10 Other commitments This represents participation in the equity of proposed Mortgage Refinance Company 350,000 –
24.11 Bills for collection Payable in Pakistan 643,119 5,626,908 Payable outside Pakistan 11,602,835 10,673,130 12,245,954 16,300,038
24.11.1 Bills for collection represent bills drawn in favour of various financial institutions in Pakistan and abroad on behalf of the Group’s customers. These are accepted by the Group as an agent and the Group does not carry any credit risk in respect of these bills.
25. OFF BALANCE SHEET FINANCIAL INSTRUMENTS Off balance sheet financial instruments referred to as derivatives are contracts the characteristics of which are derived
from those of underlying assets. These include forwards and swaps in money and foreign exchange markets. The Group’s exposure in these instruments represents forward foreign exchange contracts, on behalf of customers in imports and exports transactions, forward sales and forward purchases on behalf of customers in the inter-bank money market and with the State Bank of Pakistan. The Group also enters into repo transactions against Government Securities carrying fixed interest rates and having fixed contractual maturities. The risks associated with forward
Notes to the Consolidated Financial StatementsFor the year ended December 31, 2010
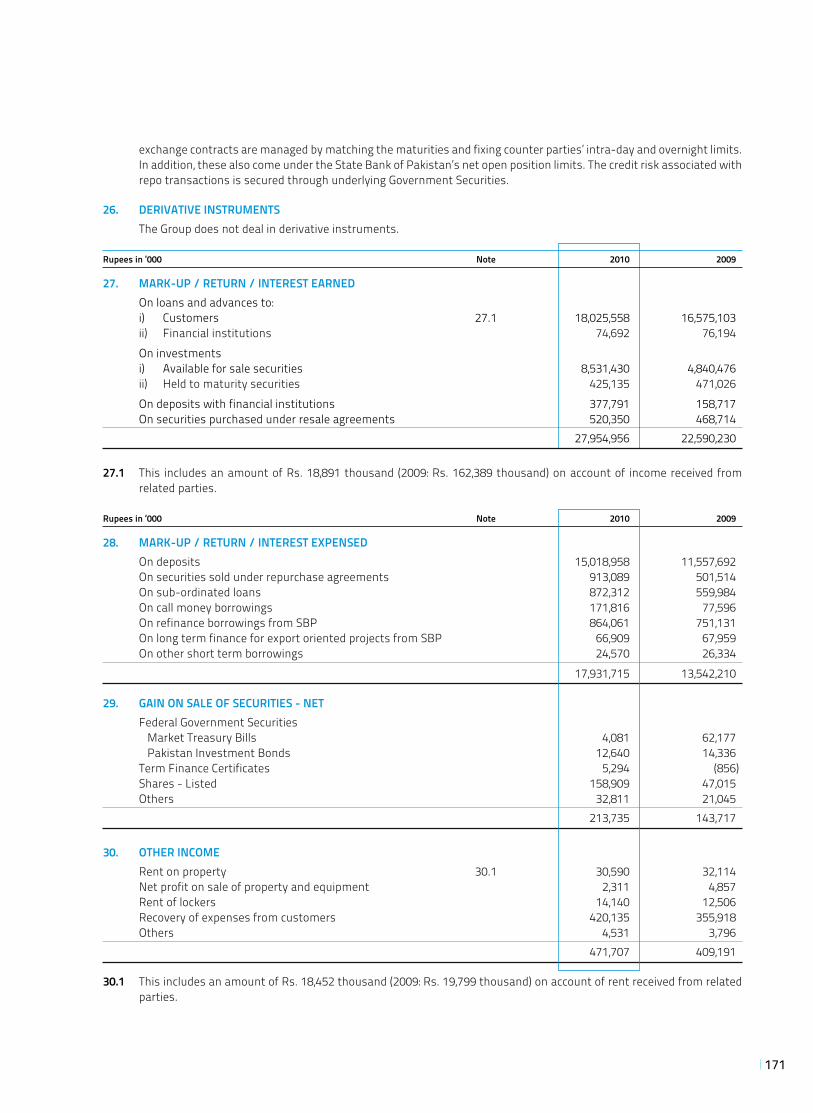
171
exchange contracts are managed by matching the maturities and fixing counter parties’ intra-day and overnight limits. In addition, these also come under the State Bank of Pakistan’s net open position limits. The credit risk associated with repo transactions is secured through underlying Government Securities.
26. DERIVATIVE INSTRUMENTS The Group does not deal in derivative instruments.
Rupees in ‘000 Note 2010 2009
27. MARK-UP / RETURN / INTEREST EARNED On loans and advances to: i) Customers 27.1 18,025,558 16,575,103 ii) Financial institutions 74,692 76,194 On investments i) Available for sale securities 8,531,430 4,840,476 ii) Held to maturity securities 425,135 471,026 On deposits with financial institutions 377,791 158,717 On securities purchased under resale agreements 520,350 468,714 27,954,956 22,590,230
27.1 This includes an amount of Rs. 18,891 thousand (2009: Rs. 162,389 thousand) on account of income received from related parties.
Rupees in ‘000 Note 2010 2009
28. MARK-UP / RETURN / INTEREST EXPENSED On deposits 15,018,958 11,557,692 On securities sold under repurchase agreements 913,089 501,514 On sub-ordinated loans 872,312 559,984 On call money borrowings 171,816 77,596 On refinance borrowings from SBP 864,061 751,131 On long term finance for export oriented projects from SBP 66,909 67,959 On other short term borrowings 24,570 26,334 17,931,715 13,542,210
29. GAIN ON SALE OF SECURITIES - NET Federal Government Securities Market Treasury Bills 4,081 62,177 Pakistan Investment Bonds 12,640 14,336 Term Finance Certificates 5,294 (856) Shares - Listed 158,909 47,015 Others 32,811 21,045 213,735 143,717
30. OTHER INCOME Rent on property 30.1 30,590 32,114 Net profit on sale of property and equipment 2,311 4,857 Rent of lockers 14,140 12,506 Recovery of expenses from customers 420,135 355,918 Others 4,531 3,796 471,707 409,191
30.1 This includes an amount of Rs. 18,452 thousand (2009: Rs. 19,799 thousand) on account of rent received from related parties.
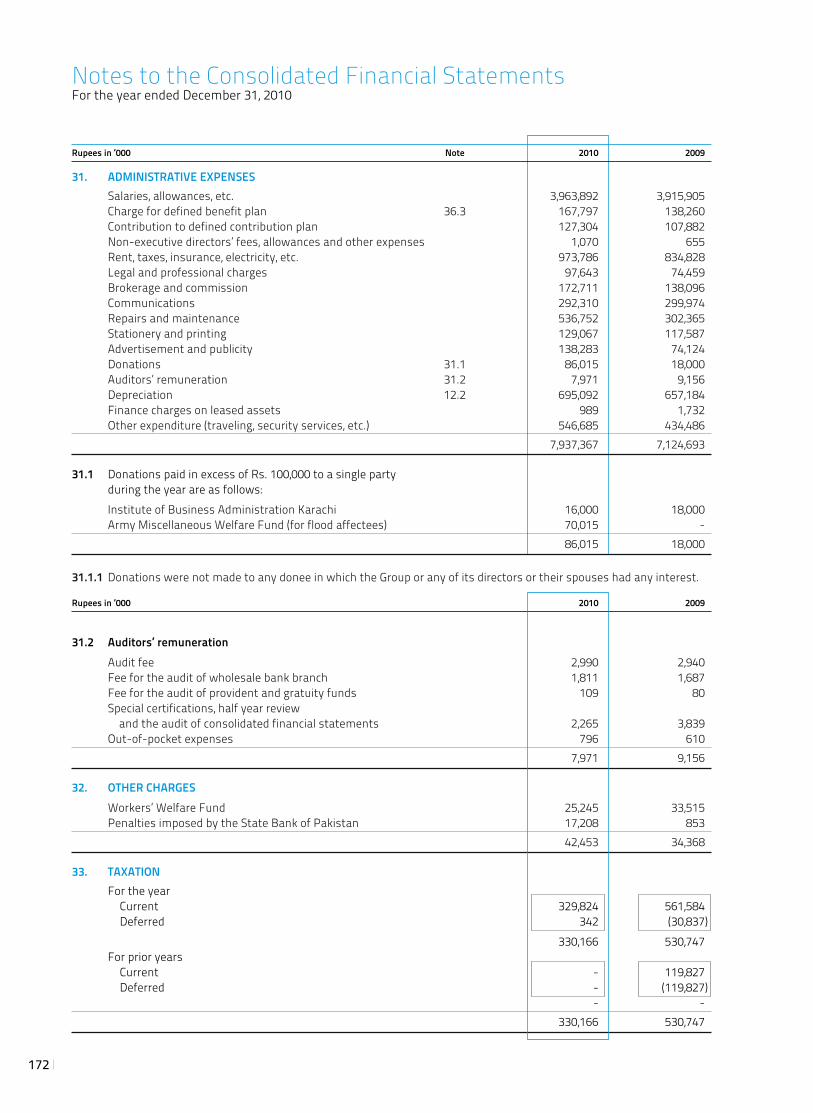
172
Rupees in ‘000 Note 2010 2009
31. ADMINISTRATIVE EXPENSES Salaries, allowances, etc. 3,963,892 3,915,905 Charge for defined benefit plan 36.3 167,797 138,260 Contribution to defined contribution plan 127,304 107,882 Non-executive directors’ fees, allowances and other expenses 1,070 655 Rent, taxes, insurance, electricity, etc. 973,786 834,828 Legal and professional charges 97,643 74,459 Brokerage and commission 172,711 138,096 Communications 292,310 299,974 Repairs and maintenance 536,752 302,365 Stationery and printing 129,067 117,587 Advertisement and publicity 138,283 74,124 Donations 31.1 86,015 18,000 Auditors’ remuneration 31.2 7,971 9,156 Depreciation 12.2 695,092 657,184 Finance charges on leased assets 989 1,732 Other expenditure (traveling, security services, etc.) 546,685 434,486 7,937,367 7,124,693
31.1 Donations paid in excess of Rs. 100,000 to a single party during the year are as follows: Institute of Business Administration Karachi 16,000 18,000 Army Miscellaneous Welfare Fund (for flood affectees) 70,015 - 86,015 18,000
31.1.1 Donations were not made to any donee in which the Group or any of its directors or their spouses had any interest.
Rupees in ‘000 2010 2009
31.2 Auditors’ remuneration Audit fee 2,990 2,940 Fee for the audit of wholesale bank branch 1,811 1,687 Fee for the audit of provident and gratuity funds 109 80 Special certifications, half year review and the audit of consolidated financial statements 2,265 3,839 Out-of-pocket expenses 796 610 7,971 9,156
32. OTHER CHARGES Workers’ Welfare Fund 25,245 33,515 Penalties imposed by the State Bank of Pakistan 17,208 853 42,453 34,368
33. TAXATION For the year Current 329,824 561,584 Deferred 342 (30,837) 330,166 530,747 For prior years Current - 119,827 Deferred - (119,827) - - 330,166 530,747
Notes to the Consolidated Financial StatementsFor the year ended December 31, 2010
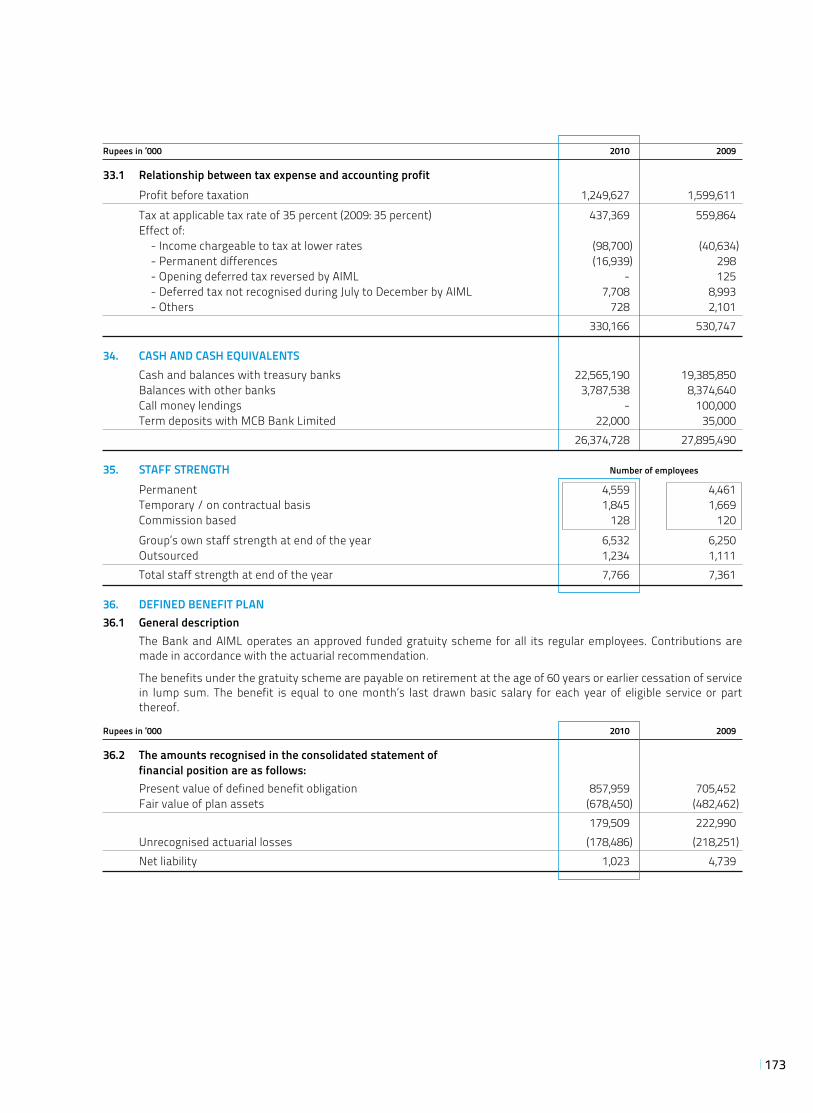
173
Rupees in ‘000 2010 2009
33.1 Relationship between tax expense and accounting profit Profit before taxation 1,249,627 1,599,611 Tax at applicable tax rate of 35 percent (2009: 35 percent) 437,369 559,864 Effect of: - Income chargeable to tax at lower rates (98,700) (40,634) - Permanent differences (16,939) 298 - Opening deferred tax reversed by AIML - 125 - Deferred tax not recognised during July to December by AIML 7,708 8,993 - Others 728 2,101 330,166 530,747
34. CASH AND CASH EQUIVALENTS Cash and balances with treasury banks 22,565,190 19,385,850 Balances with other banks 3,787,538 8,374,640 Call money lendings - 100,000 Term deposits with MCB Bank Limited 22,000 35,000 26,374,728 27,895,490
35. STAFF STRENGTH Number of employees
Permanent 4,559 4,461 Temporary / on contractual basis 1,845 1,669 Commission based 128 120 Group’s own staff strength at end of the year 6,532 6,250 Outsourced 1,234 1,111 Total staff strength at end of the year 7,766 7,361
36. DEFINED BENEFIT PLAN36.1 General description The Bank and AIML operates an approved funded gratuity scheme for all its regular employees. Contributions are
made in accordance with the actuarial recommendation.
The benefits under the gratuity scheme are payable on retirement at the age of 60 years or earlier cessation of service in lump sum. The benefit is equal to one month’s last drawn basic salary for each year of eligible service or part thereof.
Rupees in ‘000 2010 2009
36.2 The amounts recognised in the consolidated statement of financial position are as follows: Present value of defined benefit obligation 857,959 705,452 Fair value of plan assets (678,450) (482,462) 179,509 222,990 Unrecognised actuarial losses (178,486) (218,251) Net liability 1,023 4,739
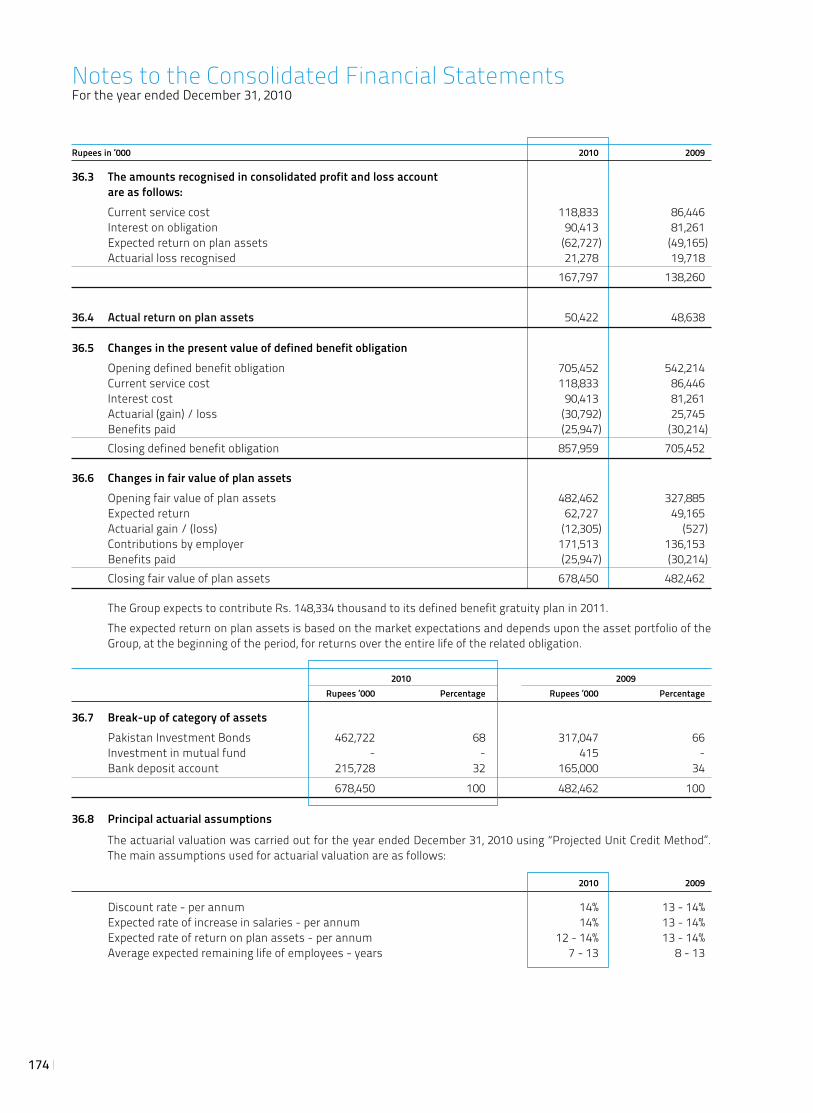
174
Rupees in ‘000 2010 2009
36.3 The amounts recognised in consolidated profit and loss account are as follows: Current service cost 118,833 86,446 Interest on obligation 90,413 81,261 Expected return on plan assets (62,727) (49,165) Actuarial loss recognised 21,278 19,718 167,797 138,260
36.4 Actual return on plan assets 50,422 48,638 36.5 Changes in the present value of defined benefit obligation Opening defined benefit obligation 705,452 542,214 Current service cost 118,833 86,446 Interest cost 90,413 81,261 Actuarial (gain) / loss (30,792) 25,745 Benefits paid (25,947) (30,214) Closing defined benefit obligation 857,959 705,452
36.6 Changes in fair value of plan assets Opening fair value of plan assets 482,462 327,885 Expected return 62,727 49,165 Actuarial gain / (loss) (12,305) (527) Contributions by employer 171,513 136,153 Benefits paid (25,947) (30,214) Closing fair value of plan assets 678,450 482,462
The Group expects to contribute Rs. 148,334 thousand to its defined benefit gratuity plan in 2011. The expected return on plan assets is based on the market expectations and depends upon the asset portfolio of the
Group, at the beginning of the period, for returns over the entire life of the related obligation.
2010 2009 Rupees ‘000 Percentage Rupees ‘000 Percentage
36.7 Break-up of category of assets Pakistan Investment Bonds 462,722 68 317,047 66 Investment in mutual fund - - 415 - Bank deposit account 215,728 32 165,000 34 678,450 100 482,462 100
36.8 Principal actuarial assumptions
The actuarial valuation was carried out for the year ended December 31, 2010 using “Projected Unit Credit Method”. The main assumptions used for actuarial valuation are as follows:
2010 2009
Discount rate - per annum 14% 13 - 14% Expected rate of increase in salaries - per annum 14% 13 - 14% Expected rate of return on plan assets - per annum 12 - 14% 13 - 14% Average expected remaining life of employees - years 7 - 13 8 - 13
Notes to the Consolidated Financial StatementsFor the year ended December 31, 2010
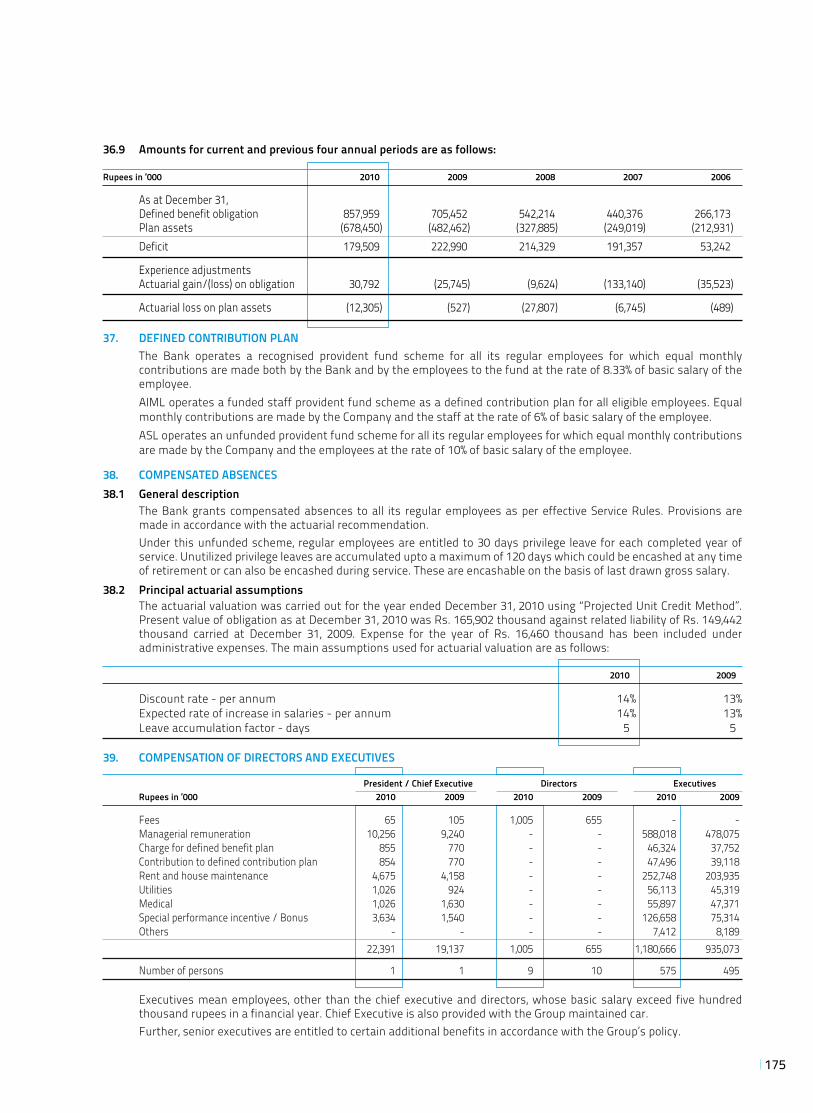
175
36.9 Amounts for current and previous four annual periods are as follows:
Rupees in ‘000 2010 2009 2008 2007 2006
As at December 31, Defined benefit obligation 857,959 705,452 542,214 440,376 266,173 Plan assets (678,450) (482,462) (327,885) (249,019) (212,931) Deficit 179,509 222,990 214,329 191,357 53,242
Experience adjustments Actuarial gain/(loss) on obligation 30,792 (25,745) (9,624) (133,140) (35,523)
Actuarial loss on plan assets (12,305) (527) (27,807) (6,745) (489)
37. DEFINED CONTRIBUTION PLAN The Bank operates a recognised provident fund scheme for all its regular employees for which equal monthly
contributions are made both by the Bank and by the employees to the fund at the rate of 8.33% of basic salary of the employee.
AIML operates a funded staff provident fund scheme as a defined contribution plan for all eligible employees. Equal monthly contributions are made by the Company and the staff at the rate of 6% of basic salary of the employee.
ASL operates an unfunded provident fund scheme for all its regular employees for which equal monthly contributions are made by the Company and the employees at the rate of 10% of basic salary of the employee.
38. COMPENSATED ABSENCES38.1 General description The Bank grants compensated absences to all its regular employees as per effective Service Rules. Provisions are
made in accordance with the actuarial recommendation. Under this unfunded scheme, regular employees are entitled to 30 days privilege leave for each completed year of
service. Unutilized privilege leaves are accumulated upto a maximum of 120 days which could be encashed at any time of retirement or can also be encashed during service. These are encashable on the basis of last drawn gross salary.
38.2 Principal actuarial assumptions The actuarial valuation was carried out for the year ended December 31, 2010 using “Projected Unit Credit Method”.
Present value of obligation as at December 31, 2010 was Rs. 165,902 thousand against related liability of Rs. 149,442 thousand carried at December 31, 2009. Expense for the year of Rs. 16,460 thousand has been included under administrative expenses. The main assumptions used for actuarial valuation are as follows:
2010 2009
Discount rate - per annum 14% 13% Expected rate of increase in salaries - per annum 14% 13% Leave accumulation factor - days 5 5
39. COMPENSATION OF DIRECTORS AND EXECUTIVES
President / Chief Executive Directors Executives Rupees in ‘000 2010 2009 2010 2009 2010 2009
Fees 65 105 1,005 655 - - Managerial remuneration 10,256 9,240 - - 588,018 478,075 Charge for defined benefit plan 855 770 - - 46,324 37,752 Contribution to defined contribution plan 854 770 - - 47,496 39,118 Rent and house maintenance 4,675 4,158 - - 252,748 203,935 Utilities 1,026 924 - - 56,113 45,319 Medical 1,026 1,630 - - 55,897 47,371 Special performance incentive / Bonus 3,634 1,540 - - 126,658 75,314 Others - - - - 7,412 8,189 22,391 19,137 1,005 655 1,180,666 935,073
Number of persons 1 1 9 10 575 495
Executives mean employees, other than the chief executive and directors, whose basic salary exceed five hundred thousand rupees in a financial year. Chief Executive is also provided with the Group maintained car.
Further, senior executives are entitled to certain additional benefits in accordance with the Group’s policy.
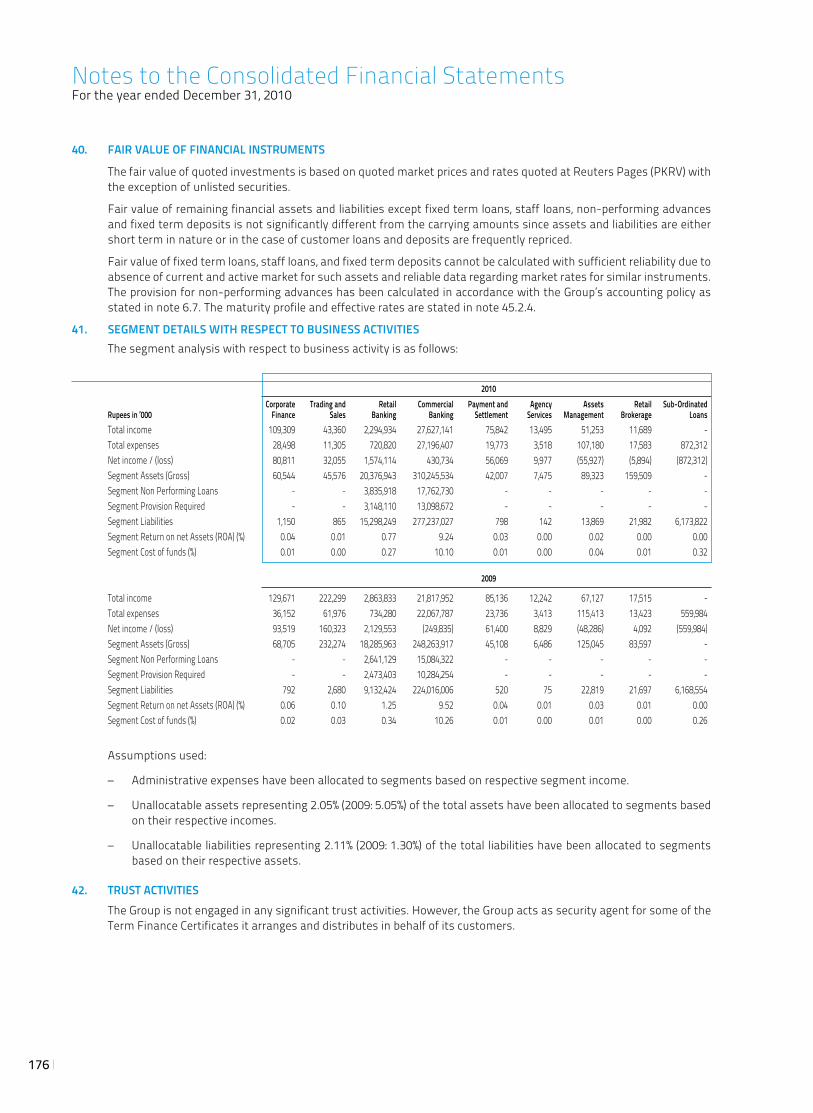
176
40. FAIR VALUE OF FINANCIAL INSTRUMENTS
The fair value of quoted investments is based on quoted market prices and rates quoted at Reuters Pages (PKRV) with the exception of unlisted securities.
Fair value of remaining financial assets and liabilities except fixed term loans, staff loans, non-performing advances and fixed term deposits is not significantly different from the carrying amounts since assets and liabilities are either short term in nature or in the case of customer loans and deposits are frequently repriced.
Fair value of fixed term loans, staff loans, and fixed term deposits cannot be calculated with sufficient reliability due to absence of current and active market for such assets and reliable data regarding market rates for similar instruments. The provision for non-performing advances has been calculated in accordance with the Group’s accounting policy as stated in note 6.7. The maturity profile and effective rates are stated in note 45.2.4.
41. SEGMENT DETAILS WITH RESPECT TO BUSINESS ACTIVITIES The segment analysis with respect to business activity is as follows:
2010 Corporate Trading and Retail Commercial Payment and Agency Assets Retail Sub-Ordinated Rupees in ‘000 Finance Sales Banking Banking Settlement Services Management Brokerage Loans Total income 109,309 43,360 2,294,934 27,627,141 75,842 13,495 51,253 11,689 - Total expenses 28,498 11,305 720,820 27,196,407 19,773 3,518 107,180 17,583 872,312 Net income / (loss) 80,811 32,055 1,574,114 430,734 56,069 9,977 (55,927) (5,894) (872,312) Segment Assets (Gross) 60,544 45,576 20,376,943 310,245,534 42,007 7,475 89,323 159,509 - Segment Non Performing Loans - - 3,835,918 17,762,730 - - - - - Segment Provision Required - - 3,148,110 13,098,672 - - - - - Segment Liabilities 1,150 865 15,298,249 277,237,027 798 142 13,869 21,982 6,173,822 Segment Return on net Assets (ROA) (%) 0.04 0.01 0.77 9.24 0.03 0.00 0.02 0.00 0.00 Segment Cost of funds (%) 0.01 0.00 0.27 10.10 0.01 0.00 0.04 0.01 0.32 2009
Total income 129,671 222,299 2,863,833 21,817,952 85,136 12,242 67,127 17,515 - Total expenses 36,152 61,976 734,280 22,067,787 23,736 3,413 115,413 13,423 559,984 Net income / (loss) 93,519 160,323 2,129,553 (249,835) 61,400 8,829 (48,286) 4,092 (559,984) Segment Assets (Gross) 68,705 232,274 18,285,963 248,263,917 45,108 6,486 125,045 83,597 - Segment Non Performing Loans - - 2,641,129 15,084,322 - - - - - Segment Provision Required - - 2,473,403 10,284,254 - - - - - Segment Liabilities 792 2,680 9,132,424 224,016,006 520 75 22,819 21,697 6,168,554 Segment Return on net Assets (ROA) (%) 0.06 0.10 1.25 9.52 0.04 0.01 0.03 0.01 0.00 Segment Cost of funds (%) 0.02 0.03 0.34 10.26 0.01 0.00 0.01 0.00 0.26
Assumptions used:
– Administrative expenses have been allocated to segments based on respective segment income.
– Unallocatable assets representing 2.05% (2009: 5.05%) of the total assets have been allocated to segments based on their respective incomes.
– Unallocatable liabilities representing 2.11% (2009: 1.30%) of the total liabilities have been allocated to segments based on their respective assets.
42. TRUST ACTIVITIES The Group is not engaged in any significant trust activities. However, the Group acts as security agent for some of the
Term Finance Certificates it arranges and distributes in behalf of its customers.
Notes to the Consolidated Financial StatementsFor the year ended December 31, 2010
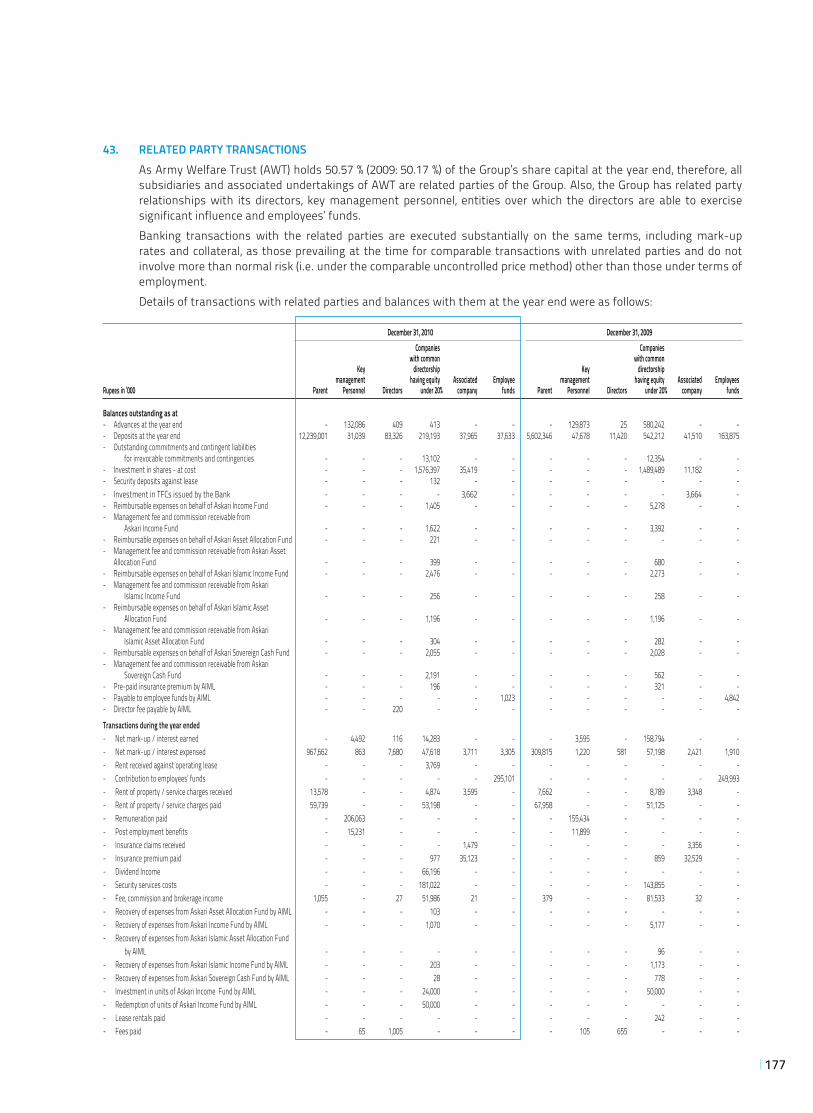
177
43. RELATED PARTY TRANSACTIONS As Army Welfare Trust (AWT) holds 50.57 % (2009: 50.17 %) of the Group’s share capital at the year end, therefore, all
subsidiaries and associated undertakings of AWT are related parties of the Group. Also, the Group has related party relationships with its directors, key management personnel, entities over which the directors are able to exercise significant influence and employees’ funds.
Banking transactions with the related parties are executed substantially on the same terms, including mark-up rates and collateral, as those prevailing at the time for comparable transactions with unrelated parties and do not involve more than normal risk (i.e. under the comparable uncontrolled price method) other than those under terms of employment.
Details of transactions with related parties and balances with them at the year end were as follows:
December 31, 2010 December 31, 2009 Companies Companies with common with common Key directorship Key directorship management having equity Associated Employee management having equity Associated EmployeesRupees in ‘000 Parent Personnel Directors under 20% company funds Parent Personnel Directors under 20% company funds
Balances outstanding as at- Advances at the year end - 132,086 409 413 - - - 129,873 25 580,242 - - - Deposits at the year end 12,239,001 31,039 83,326 219,193 37,965 37,633 5,602,346 47,678 11,420 542,212 41,510 163,875 - Outstanding commitments and contingent liabilities for irrevocable commitments and contingencies - - - 13,102 - - - - - 12,354 - - - Investment in shares - at cost - - - 1,576,397 35,419 - - - - 1,489,489 11,182 - - Security deposits against lease - - - 132 - - - - - - - - - Investment in TFCs issued by the Bank - - - - 3,662 - - - - - 3,664 - - Reimbursable expenses on behalf of Askari Income Fund - - - 1,405 - - - - - 5,278 - - - Management fee and commission receivable from Askari Income Fund - - - 1,622 - - - - - 3,392 - - - Reimbursable expenses on behalf of Askari Asset Allocation Fund - - - 221 - - - - - - - - - Management fee and commission receivable from Askari Asset Allocation Fund - - - 399 - - - - - 680 - - - Reimbursable expenses on behalf of Askari Islamic Income Fund - - - 2,476 - - - - - 2,273 - - - Management fee and commission receivable from Askari Islamic Income Fund - - - 256 - - - - - 258 - - - Reimbursable expenses on behalf of Askari Islamic Asset Allocation Fund - - - 1,196 - - - - - 1,196 - - - Management fee and commission receivable from Askari Islamic Asset Allocation Fund - - - 304 - - - - - 282 - - - Reimbursable expenses on behalf of Askari Sovereign Cash Fund - - - 2,055 - - - - - 2,028 - - - Management fee and commission receivable from Askari Sovereign Cash Fund - - - 2,191 - - - - - 562 - - - Pre-paid insurance premium by AIML - - - 196 - - - - - 321 - - - Payable to employee funds by AIML - - - - - 1,023 - - - - - 4,842 - Director fee payable by AIML - - 220 - - - - - - - - -
Transactions during the year ended - Net mark-up / interest earned - 4,492 116 14,283 - - - 3,595 - 158,794 - - - Net mark-up / interest expensed 967,662 863 7,680 47,618 3,711 3,305 309,815 1,220 581 57,198 2,421 1,910 - Rent received against operating lease - - - 3,769 - - - - - - - - - Contribution to employees’ funds - - - - - 295,101 - - - - - 249,993 - Rent of property / service charges received 13,578 - - 4,874 3,595 - 7,662 - - 8,789 3,348 - - Rent of property / service charges paid 59,739 - - 53,198 - - 67,958 - - 51,125 - - - Remuneration paid - 206,063 - - - - - 155,434 - - - - - Post employment benefits - 15,231 - - - - - 11,899 - - - - - Insurance claims received - - - - 1,479 - - - - - 3,356 - - Insurance premium paid - - - 977 35,123 - - - - 859 32,529 - - Dividend Income - - - 66,196 - - - - - - - - - Security services costs - - - 181,022 - - - - - 143,855 - - - Fee, commission and brokerage income 1,055 - 27 51,986 21 - 379 - - 81,533 32 - - Recovery of expenses from Askari Asset Allocation Fund by AIML - - - 103 - - - - - - - - - Recovery of expenses from Askari Income Fund by AIML - - - 1,070 - - - - - 5,177 - - - Recovery of expenses from Askari Islamic Asset Allocation Fund by AIML - - - - - - - - - 96 - - - Recovery of expenses from Askari Islamic Income Fund by AIML - - - 203 - - - - - 1,173 - - - Recovery of expenses from Askari Sovereign Cash Fund by AIML - - - 28 - - - - - 778 - - - Investment in units of Askari Income Fund by AIML - - - 24,000 - - - - - 50,000 - - - Redemption of units of Askari Income Fund by AIML - - - 50,000 - - - - - - - - - Lease rentals paid - - - - - - - - - 242 - - - Fees paid - 65 1,005 - - - - 105 655 - - -
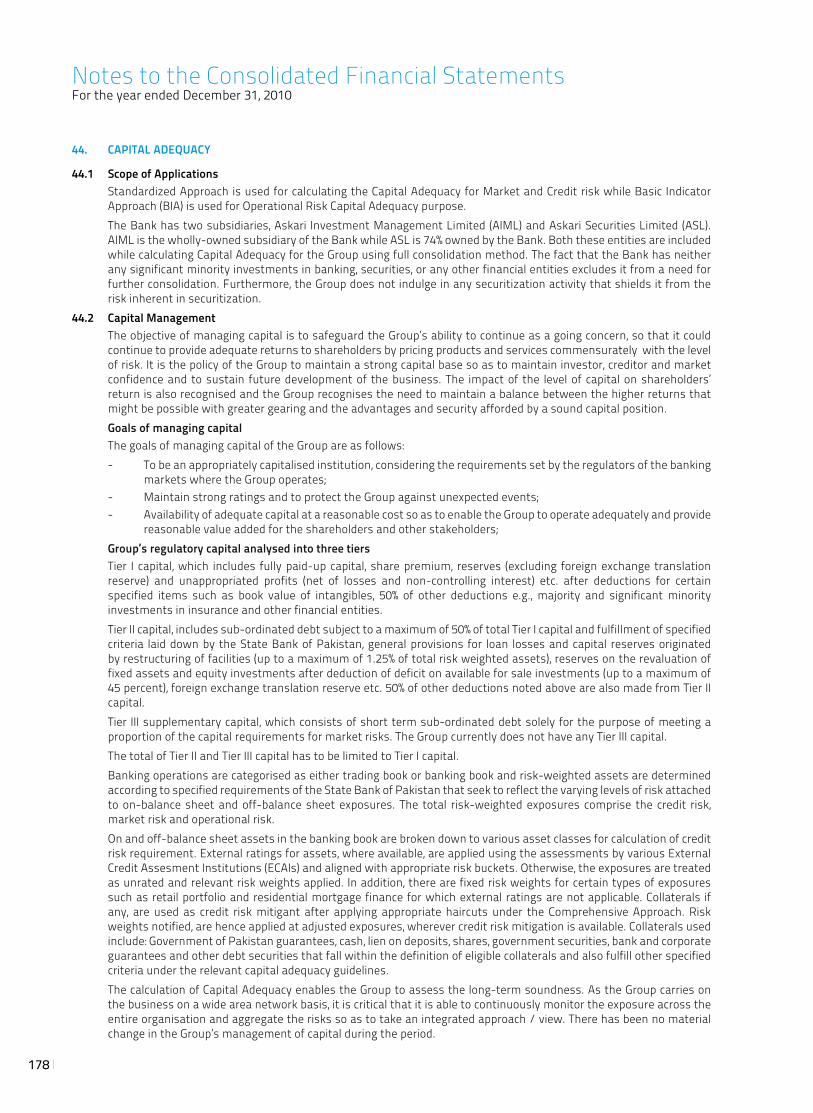
178
44. CAPITAL ADEQUACY
44.1 Scope of Applications Standardized Approach is used for calculating the Capital Adequacy for Market and Credit risk while Basic Indicator
Approach (BIA) is used for Operational Risk Capital Adequacy purpose. The Bank has two subsidiaries, Askari Investment Management Limited (AIML) and Askari Securities Limited (ASL).
AIML is the wholly-owned subsidiary of the Bank while ASL is 74% owned by the Bank. Both these entities are included while calculating Capital Adequacy for the Group using full consolidation method. The fact that the Bank has neither any significant minority investments in banking, securities, or any other financial entities excludes it from a need for further consolidation. Furthermore, the Group does not indulge in any securitization activity that shields it from the risk inherent in securitization.
44.2 Capital Management The objective of managing capital is to safeguard the Group’s ability to continue as a going concern, so that it could
continue to provide adequate returns to shareholders by pricing products and services commensurately with the level of risk. It is the policy of the Group to maintain a strong capital base so as to maintain investor, creditor and market confidence and to sustain future development of the business. The impact of the level of capital on shareholders’ return is also recognised and the Group recognises the need to maintain a balance between the higher returns that might be possible with greater gearing and the advantages and security afforded by a sound capital position.
Goals of managing capital The goals of managing capital of the Group are as follows:
- To be an appropriately capitalised institution, considering the requirements set by the regulators of the banking markets where the Group operates;
- Maintain strong ratings and to protect the Group against unexpected events;- Availability of adequate capital at a reasonable cost so as to enable the Group to operate adequately and provide
reasonable value added for the shareholders and other stakeholders; Group’s regulatory capital analysed into three tiers Tier I capital, which includes fully paid-up capital, share premium, reserves (excluding foreign exchange translation
reserve) and unappropriated profits (net of losses and non-controlling interest) etc. after deductions for certain specified items such as book value of intangibles, 50% of other deductions e.g., majority and significant minority investments in insurance and other financial entities.
Tier II capital, includes sub-ordinated debt subject to a maximum of 50% of total Tier I capital and fulfillment of specified criteria laid down by the State Bank of Pakistan, general provisions for loan losses and capital reserves originated by restructuring of facilities (up to a maximum of 1.25% of total risk weighted assets), reserves on the revaluation of fixed assets and equity investments after deduction of deficit on available for sale investments (up to a maximum of 45 percent), foreign exchange translation reserve etc. 50% of other deductions noted above are also made from Tier II capital.
Tier III supplementary capital, which consists of short term sub-ordinated debt solely for the purpose of meeting a proportion of the capital requirements for market risks. The Group currently does not have any Tier III capital.
The total of Tier II and Tier III capital has to be limited to Tier I capital. Banking operations are categorised as either trading book or banking book and risk-weighted assets are determined
according to specified requirements of the State Bank of Pakistan that seek to reflect the varying levels of risk attached to on-balance sheet and off-balance sheet exposures. The total risk-weighted exposures comprise the credit risk, market risk and operational risk.
On and off-balance sheet assets in the banking book are broken down to various asset classes for calculation of credit risk requirement. External ratings for assets, where available, are applied using the assessments by various External Credit Assesment Institutions (ECAIs) and aligned with appropriate risk buckets. Otherwise, the exposures are treated as unrated and relevant risk weights applied. In addition, there are fixed risk weights for certain types of exposures such as retail portfolio and residential mortgage finance for which external ratings are not applicable. Collaterals if any, are used as credit risk mitigant after applying appropriate haircuts under the Comprehensive Approach. Risk weights notified, are hence applied at adjusted exposures, wherever credit risk mitigation is available. Collaterals used include: Government of Pakistan guarantees, cash, lien on deposits, shares, government securities, bank and corporate guarantees and other debt securities that fall within the definition of eligible collaterals and also fulfill other specified criteria under the relevant capital adequacy guidelines.
The calculation of Capital Adequacy enables the Group to assess the long-term soundness. As the Group carries on the business on a wide area network basis, it is critical that it is able to continuously monitor the exposure across the entire organisation and aggregate the risks so as to take an integrated approach / view. There has been no material change in the Group’s management of capital during the period.
Notes to the Consolidated Financial StatementsFor the year ended December 31, 2010
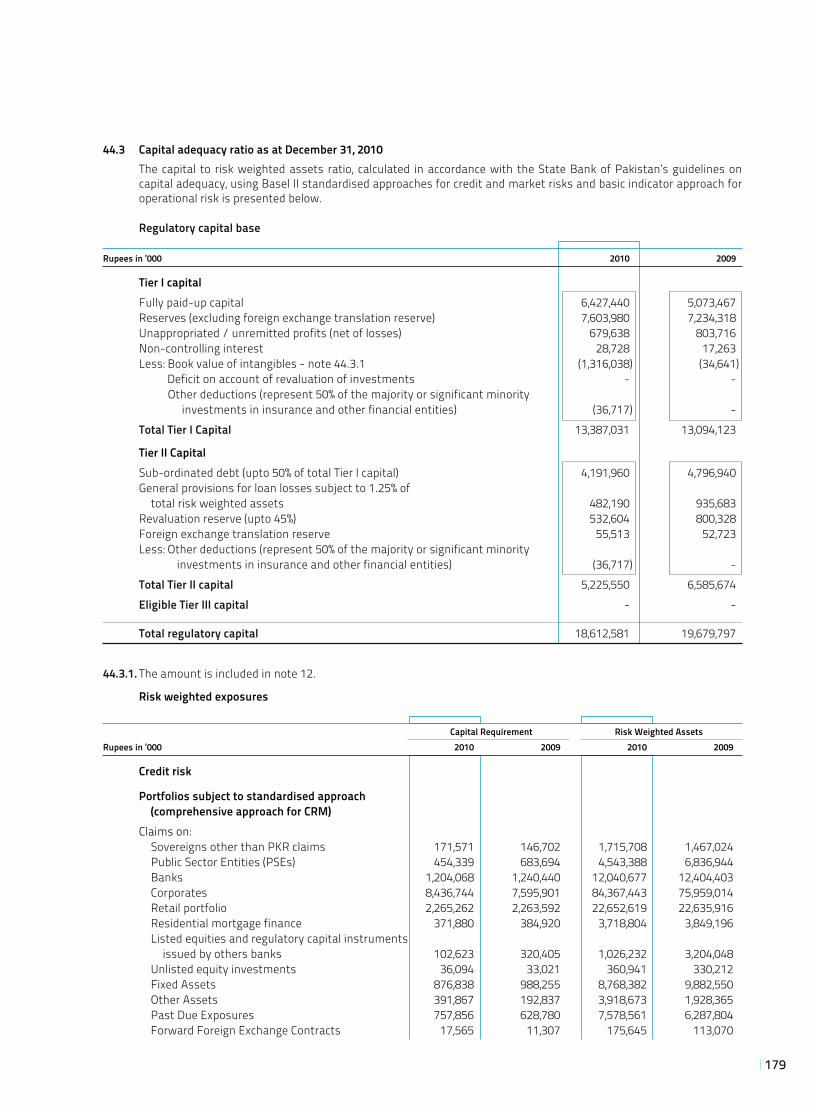
179
44.3 Capital adequacy ratio as at December 31, 2010 The capital to risk weighted assets ratio, calculated in accordance with the State Bank of Pakistan’s guidelines on
capital adequacy, using Basel II standardised approaches for credit and market risks and basic indicator approach for operational risk is presented below.
Regulatory capital base
Rupees in ‘000 2010 2009
Tier I capital Fully paid-up capital 6,427,440 5,073,467 Reserves (excluding foreign exchange translation reserve) 7,603,980 7,234,318 Unappropriated / unremitted profits (net of losses) 679,638 803,716 Non-controlling interest 28,728 17,263 Less: Book value of intangibles - note 44.3.1 (1,316,038) (34,641) Deficit on account of revaluation of investments - - Other deductions (represent 50% of the majority or significant minority investments in insurance and other financial entities) (36,717) - Total Tier I Capital 13,387,031 13,094,123
Tier II Capital Sub-ordinated debt (upto 50% of total Tier I capital) 4,191,960 4,796,940 General provisions for loan losses subject to 1.25% of
total risk weighted assets 482,190 935,683 Revaluation reserve (upto 45%) 532,604 800,328 Foreign exchange translation reserve 55,513 52,723 Less: Other deductions (represent 50% of the majority or significant minority investments in insurance and other financial entities) (36,717) - Total Tier II capital 5,225,550 6,585,674 Eligible Tier III capital - -
Total regulatory capital 18,612,581 19,679,797
44.3.1. The amount is included in note 12.
Risk weighted exposures
Capital Requirement Risk Weighted AssetsRupees in ‘000 2010 2009 2010 2009
Credit risk
Portfolios subject to standardised approach (comprehensive approach for CRM) Claims on: Sovereigns other than PKR claims 171,571 146,702 1,715,708 1,467,024 Public Sector Entities (PSEs) 454,339 683,694 4,543,388 6,836,944 Banks 1,204,068 1,240,440 12,040,677 12,404,403 Corporates 8,436,744 7,595,901 84,367,443 75,959,014 Retail portfolio 2,265,262 2,263,592 22,652,619 22,635,916 Residential mortgage finance 371,880 384,920 3,718,804 3,849,196 Listed equities and regulatory capital instruments issued by others banks 102,623 320,405 1,026,232 3,204,048 Unlisted equity investments 36,094 33,021 360,941 330,212 Fixed Assets 876,838 988,255 8,768,382 9,882,550 Other Assets 391,867 192,837 3,918,673 1,928,365 Past Due Exposures 757,856 628,780 7,578,561 6,287,804 Forward Foreign Exchange Contracts 17,565 11,307 175,645 113,070
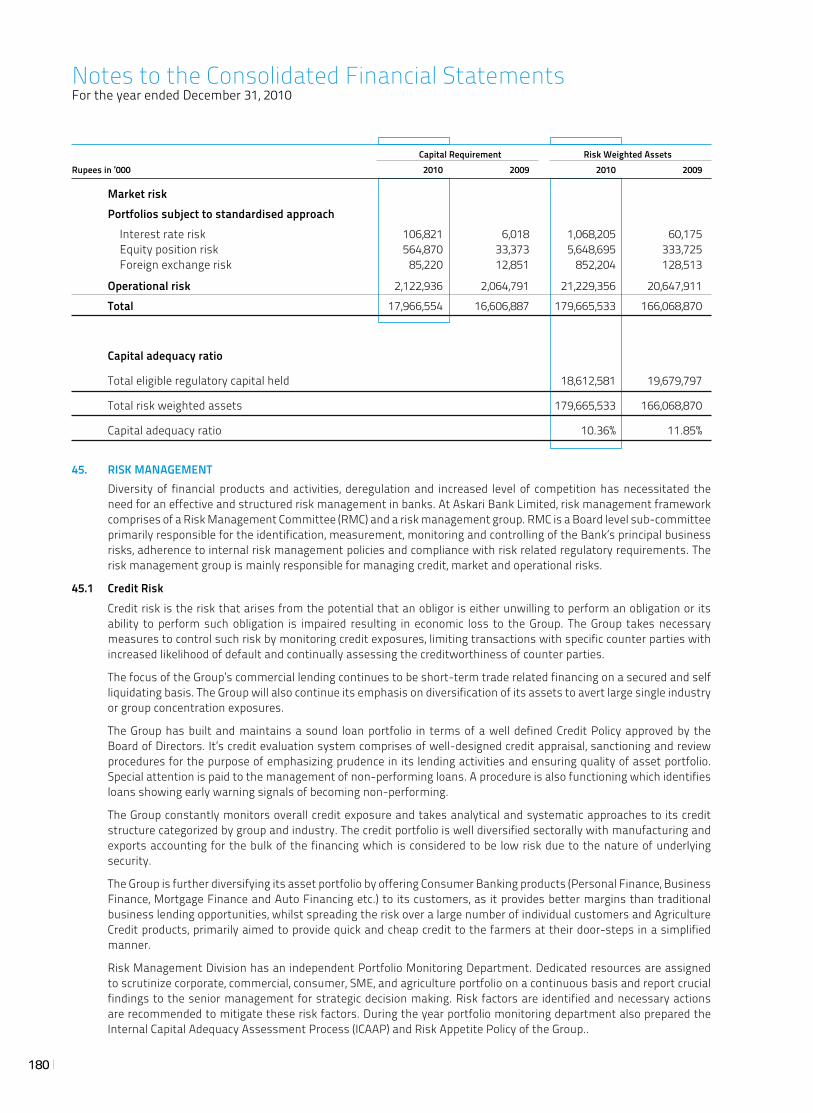
180
Capital Requirement Risk Weighted AssetsRupees in ‘000 2010 2009 2010 2009
Market risk Portfolios subject to standardised approach Interest rate risk 106,821 6,018 1,068,205 60,175 Equity position risk 564,870 33,373 5,648,695 333,725 Foreign exchange risk 85,220 12,851 852,204 128,513
Operational risk 2,122,936 2,064,791 21,229,356 20,647,911 Total 17,966,554 16,606,887 179,665,533 166,068,870
Capital adequacy ratio
Total eligible regulatory capital held 18,612,581 19,679,797
Total risk weighted assets 179,665,533 166,068,870
Capital adequacy ratio 10.36% 11.85%
45. RISK MANAGEMENT Diversity of financial products and activities, deregulation and increased level of competition has necessitated the
need for an effective and structured risk management in banks. At Askari Bank Limited, risk management framework comprises of a Risk Management Committee (RMC) and a risk management group. RMC is a Board level sub-committee primarily responsible for the identification, measurement, monitoring and controlling of the Bank’s principal business risks, adherence to internal risk management policies and compliance with risk related regulatory requirements. The risk management group is mainly responsible for managing credit, market and operational risks.
45.1 Credit Risk Credit risk is the risk that arises from the potential that an obligor is either unwilling to perform an obligation or its
ability to perform such obligation is impaired resulting in economic loss to the Group. The Group takes necessary measures to control such risk by monitoring credit exposures, limiting transactions with specific counter parties with increased likelihood of default and continually assessing the creditworthiness of counter parties.
The focus of the Group’s commercial lending continues to be short-term trade related financing on a secured and self liquidating basis. The Group will also continue its emphasis on diversification of its assets to avert large single industry or group concentration exposures.
The Group has built and maintains a sound loan portfolio in terms of a well defined Credit Policy approved by the Board of Directors. It’s credit evaluation system comprises of well-designed credit appraisal, sanctioning and review procedures for the purpose of emphasizing prudence in its lending activities and ensuring quality of asset portfolio. Special attention is paid to the management of non-performing loans. A procedure is also functioning which identifies loans showing early warning signals of becoming non-performing.
The Group constantly monitors overall credit exposure and takes analytical and systematic approaches to its credit structure categorized by group and industry. The credit portfolio is well diversified sectorally with manufacturing and exports accounting for the bulk of the financing which is considered to be low risk due to the nature of underlying security.
The Group is further diversifying its asset portfolio by offering Consumer Banking products (Personal Finance, Business Finance, Mortgage Finance and Auto Financing etc.) to its customers, as it provides better margins than traditional business lending opportunities, whilst spreading the risk over a large number of individual customers and Agriculture Credit products, primarily aimed to provide quick and cheap credit to the farmers at their door-steps in a simplified manner.
Risk Management Division has an independent Portfolio Monitoring Department. Dedicated resources are assigned to scrutinize corporate, commercial, consumer, SME, and agriculture portfolio on a continuous basis and report crucial findings to the senior management for strategic decision making. Risk factors are identified and necessary actions are recommended to mitigate these risk factors. During the year portfolio monitoring department also prepared the Internal Capital Adequacy Assessment Process (ICAAP) and Risk Appetite Policy of the Group..
Notes to the Consolidated Financial StatementsFor the year ended December 31, 2010
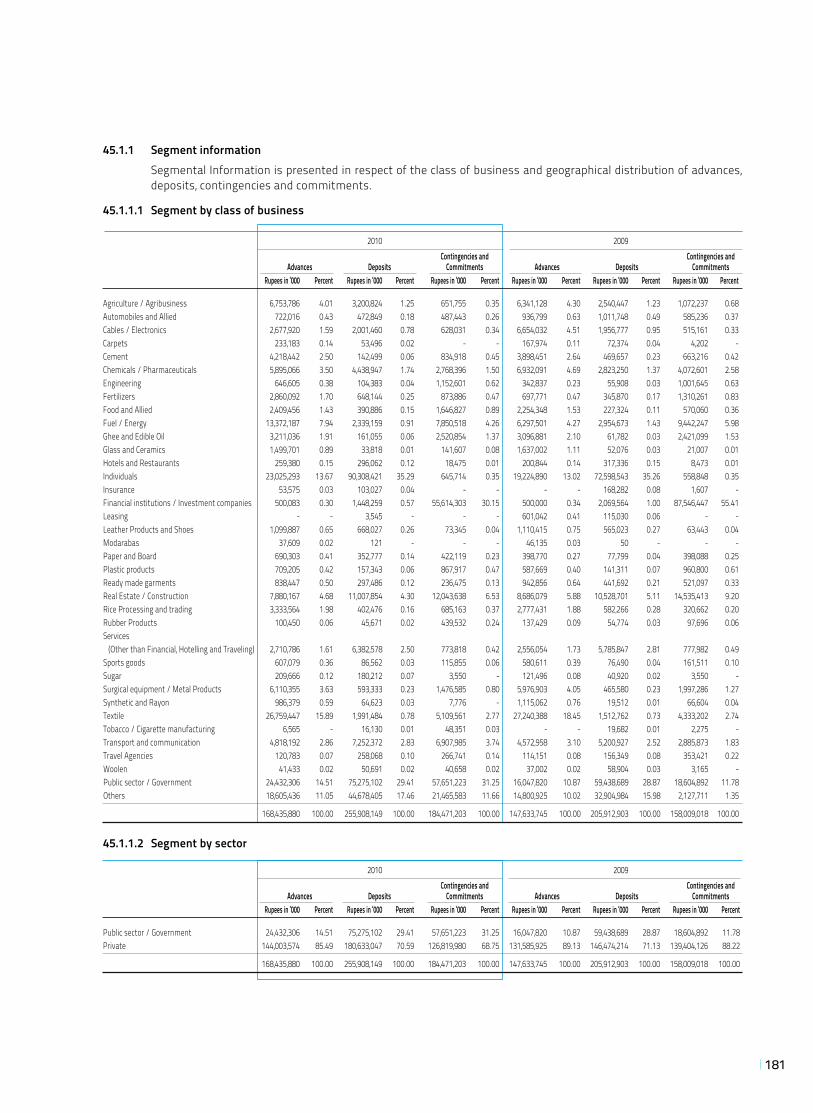
181
45.1.1 Segment information Segmental Information is presented in respect of the class of business and geographical distribution of advances,
deposits, contingencies and commitments.
45.1.1.1 Segment by class of business
2010 2009 Contingencies and Contingencies and Advances Deposits Commitments Advances Deposits Commitments Rupees in ‘000 Percent Rupees in ‘000 Percent Rupees in ‘000 Percent Rupees in ‘000 Percent Rupees in ‘000 Percent Rupees in ‘000 Percent
Agriculture / Agribusiness 6,753,786 4.01 3,200,824 1.25 651,755 0.35 6,341,128 4.30 2,540,447 1.23 1,072,237 0.68 Automobiles and Allied 722,016 0.43 472,849 0.18 487,443 0.26 936,799 0.63 1,011,748 0.49 585,236 0.37 Cables / Electronics 2,677,920 1.59 2,001,460 0.78 628,031 0.34 6,654,032 4.51 1,956,777 0.95 515,161 0.33 Carpets 233,183 0.14 53,496 0.02 - - 167,974 0.11 72,374 0.04 4,202 - Cement 4,218,442 2.50 142,499 0.06 834,918 0.45 3,898,451 2.64 469,657 0.23 663,216 0.42 Chemicals / Pharmaceuticals 5,895,066 3.50 4,438,947 1.74 2,768,396 1.50 6,932,091 4.69 2,823,250 1.37 4,072,601 2.58 Engineering 646,605 0.38 104,383 0.04 1,152,601 0.62 342,837 0.23 55,908 0.03 1,001,645 0.63 Fertilizers 2,860,092 1.70 648,144 0.25 873,886 0.47 697,771 0.47 345,870 0.17 1,310,261 0.83 Food and Allied 2,409,456 1.43 390,886 0.15 1,646,827 0.89 2,254,348 1.53 227,324 0.11 570,060 0.36 Fuel / Energy 13,372,187 7.94 2,339,159 0.91 7,850,518 4.26 6,297,501 4.27 2,954,673 1.43 9,442,247 5.98 Ghee and Edible Oil 3,211,036 1.91 161,055 0.06 2,520,854 1.37 3,096,881 2.10 61,782 0.03 2,421,099 1.53 Glass and Ceramics 1,499,701 0.89 33,818 0.01 141,607 0.08 1,637,002 1.11 52,076 0.03 21,007 0.01 Hotels and Restaurants 259,380 0.15 296,062 0.12 18,475 0.01 200,844 0.14 317,336 0.15 8,473 0.01 Individuals 23,025,293 13.67 90,308,421 35.29 645,714 0.35 19,224,890 13.02 72,598,543 35.26 558,848 0.35 Insurance 53,575 0.03 103,027 0.04 - - - - 168,282 0.08 1,607 - Financial institutions / Investment companies 500,083 0.30 1,448,259 0.57 55,614,303 30.15 500,000 0.34 2,069,564 1.00 87,546,447 55.41 Leasing - - 3,545 - - - 601,042 0.41 115,030 0.06 - - Leather Products and Shoes 1,099,887 0.65 668,027 0.26 73,345 0.04 1,110,415 0.75 565,023 0.27 63,443 0.04 Modarabas 37,609 0.02 121 - - - 46,135 0.03 50 - - - Paper and Board 690,303 0.41 352,777 0.14 422,119 0.23 398,770 0.27 77,799 0.04 398,088 0.25 Plastic products 709,205 0.42 157,343 0.06 867,917 0.47 587,669 0.40 141,311 0.07 960,800 0.61 Ready made garments 838,447 0.50 297,486 0.12 236,475 0.13 942,856 0.64 441,692 0.21 521,097 0.33 Real Estate / Construction 7,880,167 4.68 11,007,854 4.30 12,043,638 6.53 8,686,079 5.88 10,528,701 5.11 14,535,413 9.20 Rice Processing and trading 3,333,564 1.98 402,476 0.16 685,163 0.37 2,777,431 1.88 582,266 0.28 320,662 0.20 Rubber Products 100,450 0.06 45,671 0.02 439,532 0.24 137,429 0.09 54,774 0.03 97,696 0.06 Services (Other than Financial, Hotelling and Traveling) 2,710,786 1.61 6,382,578 2.50 773,818 0.42 2,556,054 1.73 5,785,847 2.81 777,982 0.49 Sports goods 607,079 0.36 86,562 0.03 115,855 0.06 580,611 0.39 76,490 0.04 161,511 0.10 Sugar 209,666 0.12 180,212 0.07 3,550 - 121,496 0.08 40,920 0.02 3,550 -Surgical equipment / Metal Products 6,110,355 3.63 593,333 0.23 1,476,585 0.80 5,976,903 4.05 465,580 0.23 1,997,286 1.27 Synthetic and Rayon 986,379 0.59 64,623 0.03 7,776 - 1,115,062 0.76 19,512 0.01 66,604 0.04 Textile 26,759,447 15.89 1,991,484 0.78 5,109,561 2.77 27,240,388 18.45 1,512,762 0.73 4,333,202 2.74 Tobacco / Cigarette manufacturing 6,565 - 16,130 0.01 48,351 0.03 - - 19,682 0.01 2,275 - Transport and communication 4,818,192 2.86 7,252,372 2.83 6,907,985 3.74 4,572,958 3.10 5,200,927 2.52 2,885,873 1.83 Travel Agencies 120,783 0.07 258,068 0.10 266,741 0.14 114,151 0.08 156,349 0.08 353,421 0.22 Woolen 41,433 0.02 50,691 0.02 40,658 0.02 37,002 0.02 58,904 0.03 3,165 - Public sector / Government 24,432,306 14.51 75,275,102 29.41 57,651,223 31.25 16,047,820 10.87 59,438,689 28.87 18,604,892 11.78Others 18,605,436 11.05 44,678,405 17.46 21,465,583 11.66 14,800,925 10.02 32,904,984 15.98 2,127,711 1.35
168,435,880 100.00 255,908,149 100.00 184,471,203 100.00 147,633,745 100.00 205,912,903 100.00 158,009,018 100.00
45.1.1.2 Segment by sector
2010 2009 Contingencies and Contingencies and Advances Deposits Commitments Advances Deposits Commitments Rupees in ‘000 Percent Rupees in ‘000 Percent Rupees in ‘000 Percent Rupees in ‘000 Percent Rupees in ‘000 Percent Rupees in ‘000 Percent
Public sector / Government 24,432,306 14.51 75,275,102 29.41 57,651,223 31.25 16,047,820 10.87 59,438,689 28.87 18,604,892 11.78Private 144,003,574 85.49 180,633,047 70.59 126,819,980 68.75 131,585,925 89.13 146,474,214 71.13 139,404,126 88.22
168,435,880 100.00 255,908,149 100.00 184,471,203 100.00 147,633,745 100.00 205,912,903 100.00 158,009,018 100.00
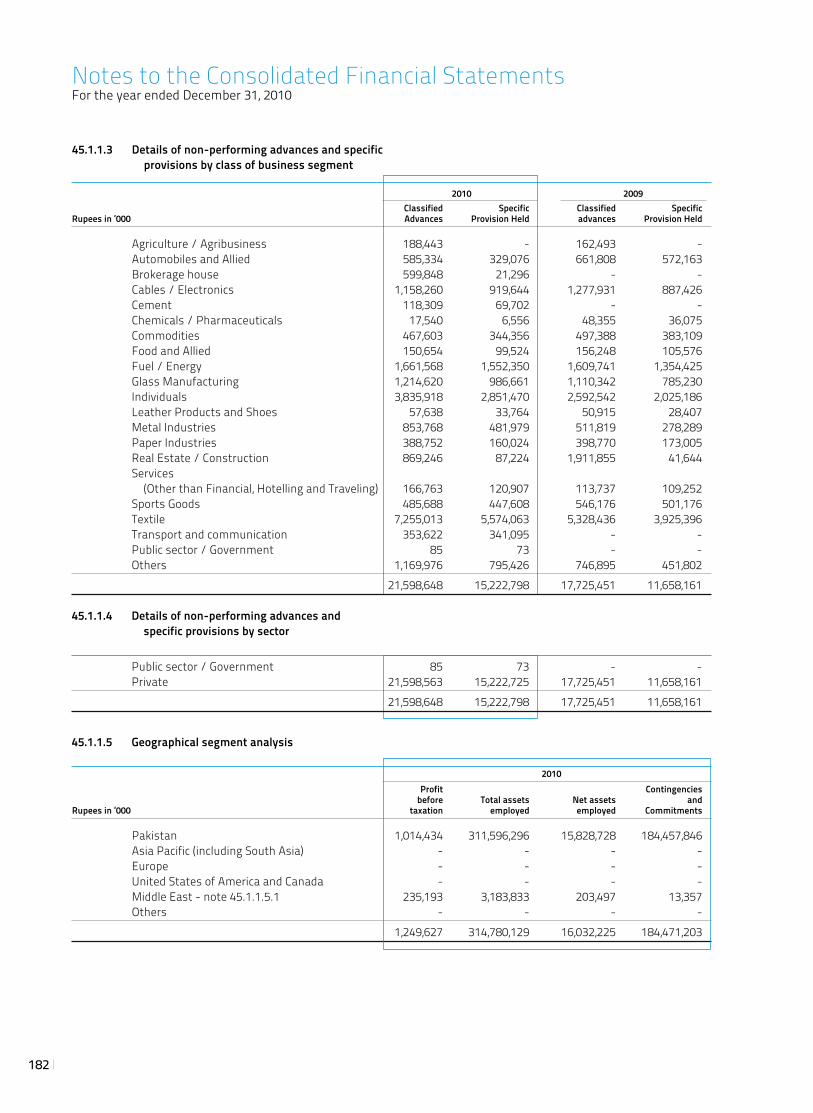
182
45.1.1.3 Details of non-performing advances and specific provisions by class of business segment
2010 2009 Classified Specific Classified Specific Rupees in ‘000 Advances Provision Held advances Provision Held Agriculture / Agribusiness 188,443 - 162,493 - Automobiles and Allied 585,334 329,076 661,808 572,163 Brokerage house 599,848 21,296 - - Cables / Electronics 1,158,260 919,644 1,277,931 887,426 Cement 118,309 69,702 - - Chemicals / Pharmaceuticals 17,540 6,556 48,355 36,075 Commodities 467,603 344,356 497,388 383,109 Food and Allied 150,654 99,524 156,248 105,576 Fuel / Energy 1,661,568 1,552,350 1,609,741 1,354,425 Glass Manufacturing 1,214,620 986,661 1,110,342 785,230 Individuals 3,835,918 2,851,470 2,592,542 2,025,186 Leather Products and Shoes 57,638 33,764 50,915 28,407 Metal Industries 853,768 481,979 511,819 278,289 Paper Industries 388,752 160,024 398,770 173,005 Real Estate / Construction 869,246 87,224 1,911,855 41,644 Services (Other than Financial, Hotelling and Traveling) 166,763 120,907 113,737 109,252 Sports Goods 485,688 447,608 546,176 501,176 Textile 7,255,013 5,574,063 5,328,436 3,925,396 Transport and communication 353,622 341,095 - - Public sector / Government 85 73 - - Others 1,169,976 795,426 746,895 451,802 21,598,648 15,222,798 17,725,451 11,658,161
45.1.1.4 Details of non-performing advances and specific provisions by sector
Public sector / Government 85 73 - - Private 21,598,563 15,222,725 17,725,451 11,658,161 21,598,648 15,222,798 17,725,451 11,658,161
45.1.1.5 Geographical segment analysis
2010 Profit Contingencies before Total assets Net assets and Rupees in ‘000 taxation employed employed Commitments Pakistan 1,014,434 311,596,296 15,828,728 184,457,846 Asia Pacific (including South Asia) - - - - Europe - - - - United States of America and Canada - - - - Middle East - note 45.1.1.5.1 235,193 3,183,833 203,497 13,357 Others - - - - 1,249,627 314,780,129 16,032,225 184,471,203
Notes to the Consolidated Financial StatementsFor the year ended December 31, 2010
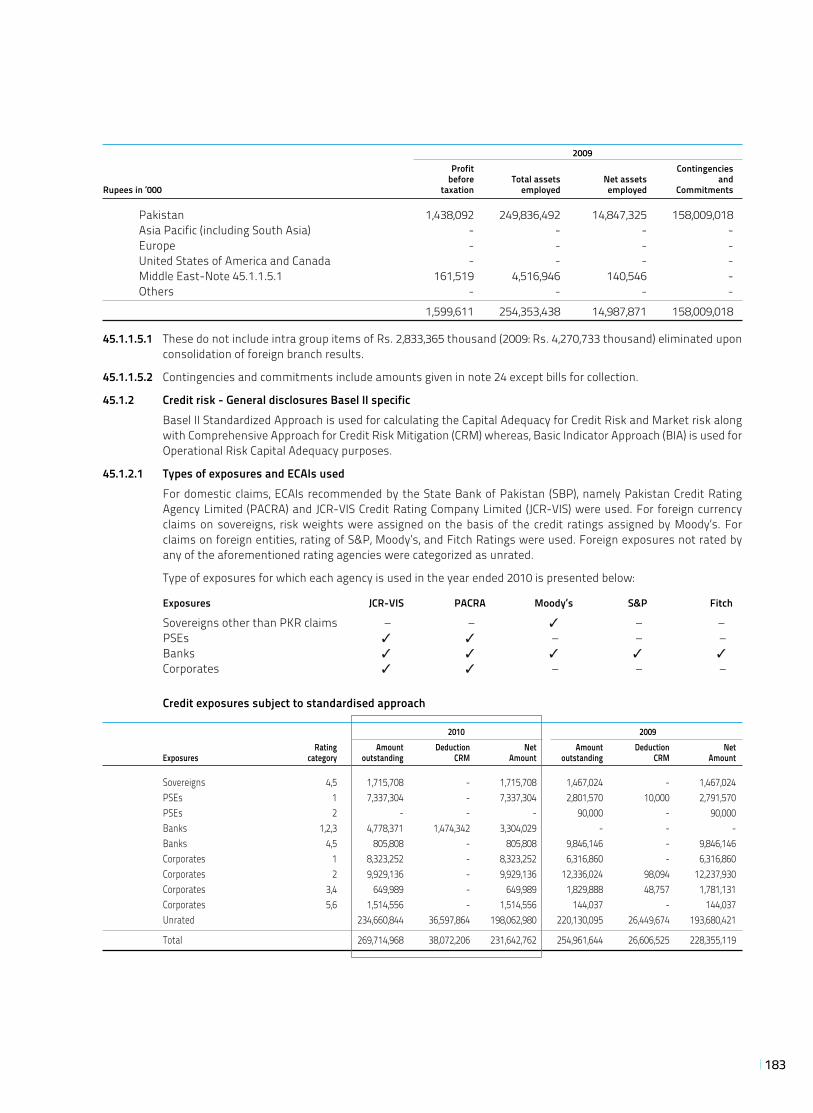
183
2009 Profit Contingencies before Total assets Net assets and Rupees in ‘000 taxation employed employed Commitments Pakistan 1,438,092 249,836,492 14,847,325 158,009,018 Asia Pacific (including South Asia) - - - - Europe - - - - United States of America and Canada - - - - Middle East-Note 45.1.1.5.1 161,519 4,516,946 140,546 - Others - - - - 1,599,611 254,353,438 14,987,871 158,009,018
45.1.1.5.1 These do not include intra group items of Rs. 2,833,365 thousand (2009: Rs. 4,270,733 thousand) eliminated upon consolidation of foreign branch results.
45.1.1.5.2 Contingencies and commitments include amounts given in note 24 except bills for collection.
45.1.2 Credit risk - General disclosures Basel II specific Basel II Standardized Approach is used for calculating the Capital Adequacy for Credit Risk and Market risk along
with Comprehensive Approach for Credit Risk Mitigation (CRM) whereas, Basic Indicator Approach (BIA) is used for Operational Risk Capital Adequacy purposes.
45.1.2.1 Types of exposures and ECAIs used For domestic claims, ECAIs recommended by the State Bank of Pakistan (SBP), namely Pakistan Credit Rating
Agency Limited (PACRA) and JCR-VIS Credit Rating Company Limited (JCR-VIS) were used. For foreign currency claims on sovereigns, risk weights were assigned on the basis of the credit ratings assigned by Moody’s. For claims on foreign entities, rating of S&P, Moody’s, and Fitch Ratings were used. Foreign exposures not rated by any of the aforementioned rating agencies were categorized as unrated.
Type of exposures for which each agency is used in the year ended 2010 is presented below:
Exposures JCR-VIS PACRA Moody’s S&P Fitch
Sovereigns other than PKR claims – – 3 – – PSEs 3 3 – – – Banks 3 3 3 3 3
Corporates 3 3 – – –
Credit exposures subject to standardised approach
2010 2009 Rating Amount Deduction Net Amount Deduction Net Exposures category outstanding CRM Amount outstanding CRM Amount
Sovereigns 4,5 1,715,708 - 1,715,708 1,467,024 - 1,467,024 PSEs 1 7,337,304 - 7,337,304 2,801,570 10,000 2,791,570 PSEs 2 - - - 90,000 - 90,000 Banks 1,2,3 4,778,371 1,474,342 3,304,029 - - - Banks 4,5 805,808 - 805,808 9,846,146 - 9,846,146 Corporates 1 8,323,252 - 8,323,252 6,316,860 - 6,316,860 Corporates 2 9,929,136 - 9,929,136 12,336,024 98,094 12,237,930 Corporates 3,4 649,989 - 649,989 1,829,888 48,757 1,781,131 Corporates 5,6 1,514,556 - 1,514,556 144,037 - 144,037 Unrated 234,660,844 36,597,864 198,062,980 220,130,095 26,449,674 193,680,421
Total 269,714,968 38,072,206 231,642,762 254,961,644 26,606,525 228,355,119
184
Following is list of main types of collateral taken by the Group. – Cash margins or deposits under lien – Lien on SSCs, DSCs, etc. – Residential / commercial mortgage (registered) – Residential / commercial mortgage (equitable) – Secured by agricultural land – Registered charge on stocks, book debts, receivables and other assets – Pledge of stocks - perishable / non-perishable – Shares of public listed companies – Guarantees of Government, Banks Autonomous bodies – Local bills - cheques / documentary bills – Import bills - clean – Export bills - clean
Collateral used by the Bank for Credit Risk Mitigation (CRM) in the simple approach was as follows: – Cash margin – Government Securities (with value discounted by 20%) – Government Securities (for repo-style transactions satisfying conditions for zero-H) – Guarantees of Government, Banks, PSEs and rated Corporates
45.2 Market Risk:
Market risk, or the risk that the Group’s earnings and / or capital can be negatively impacted by changes in market factors such as equity prices, interest rates, and exchange rates, originates from the Group’s open positions in interest rate, currency, and equity products that are exposed to market movements. Traded market risk exposures arise from the Group’s treasury and capital market operations. Non-traded market risk factors include interest rate risk in the banking book, equity position risk arising from the Bank’s strategic investments, and structural foreign exchange risk arising from the Group’s capital investments in off-shore operations.
The Group has a policy of identification, measurement, monitoring and control of market risks in order to protect against adverse movements in market factors and to optimize the risk / return profile of its open positions. The Market Risk Management Department (“MRMD”) of the Risk Management Division (“RMD”) of the Group develops and implements the market risk policy and risk measuring / monitoring methodology, and reviews and reports market risk against regulatory and internal limits. A Value-at-Risk (“VaR”) methodology is used to measure traded market risk. In compliance with Basel requirements, VaR is modeled using variance-covariance and historical approaches, at a 99% confidence interval over a 1-day and 10-day holding period for equity and debt positions in the trading book, and foreign exchange positions throughout the trading and banking books. Back testing of VaR estimates against hypothetical P&Ls is carried out on daily basis in order to assess their reliability and the performance of the VaR models. To supplement the VaR figures, possible worst-case losses are also quantified by MRMD using historical data. Sensitivity analysis are carried out to gauge the impact of extreme market movements on traded exposures and stress testing as per SBP guidelines is used to assess non-traded market risk, in particular interest rate risk in the banking book. Market risk capital charge for the Group is also calculated periodically using Basel II Standardized Approach. The MRMD monitors risk by revaluing all traded market risk exposed positions on a daily basis, and the risk is controlled by ensuring that these positions do not breach regulatory limits and the Group’s own internally set limits.
Notes to the Consolidated Financial StatementsFor the year ended December 31, 2010
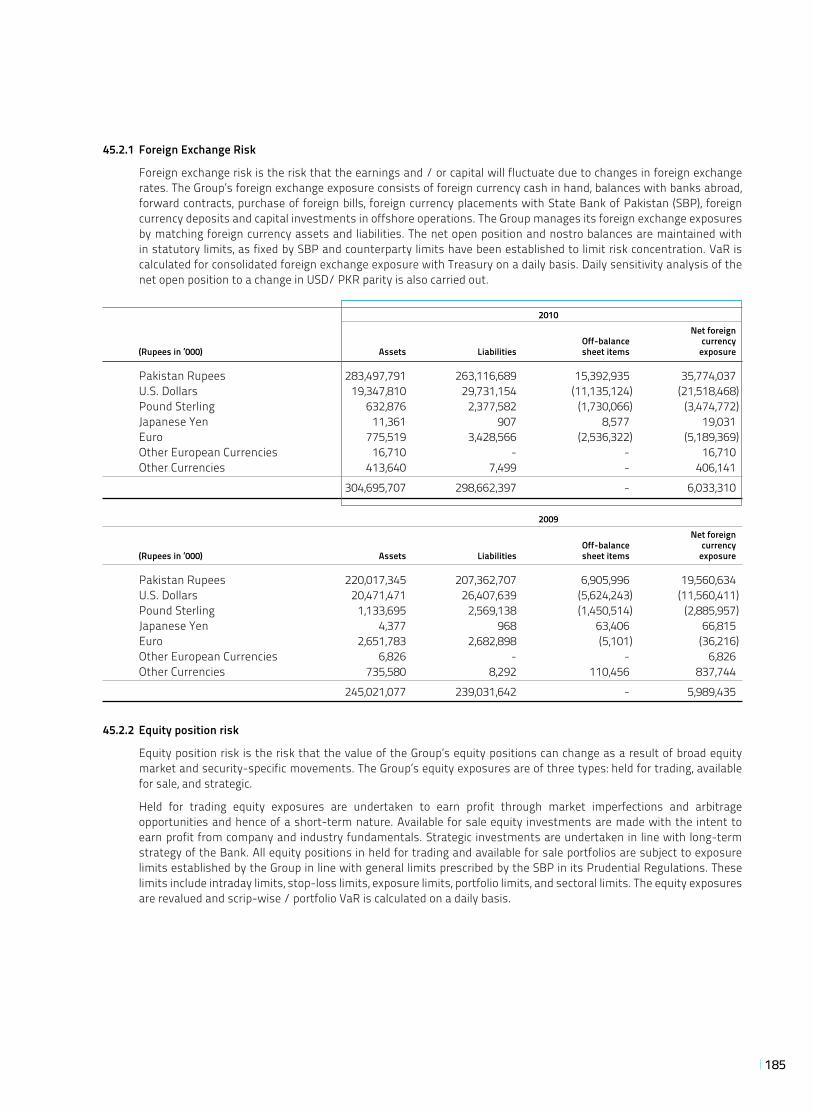
185
45.2.1 Foreign Exchange Risk
Foreign exchange risk is the risk that the earnings and / or capital will fluctuate due to changes in foreign exchange rates. The Group’s foreign exchange exposure consists of foreign currency cash in hand, balances with banks abroad, forward contracts, purchase of foreign bills, foreign currency placements with State Bank of Pakistan (SBP), foreign currency deposits and capital investments in offshore operations. The Group manages its foreign exchange exposures by matching foreign currency assets and liabilities. The net open position and nostro balances are maintained with in statutory limits, as fixed by SBP and counterparty limits have been established to limit risk concentration. VaR is calculated for consolidated foreign exchange exposure with Treasury on a daily basis. Daily sensitivity analysis of the net open position to a change in USD/ PKR parity is also carried out.
2010 Net foreign Off-balance currency (Rupees in ‘000) Assets Liabilities sheet items exposure
Pakistan Rupees 283,497,791 263,116,689 15,392,935 35,774,037 U.S. Dollars 19,347,810 29,731,154 (11,135,124) (21,518,468) Pound Sterling 632,876 2,377,582 (1,730,066) (3,474,772) Japanese Yen 11,361 907 8,577 19,031 Euro 775,519 3,428,566 (2,536,322) (5,189,369) Other European Currencies 16,710 - - 16,710 Other Currencies 413,640 7,499 - 406,141 304,695,707 298,662,397 - 6,033,310
2009 Net foreign Off-balance currency (Rupees in ‘000) Assets Liabilities sheet items exposure
Pakistan Rupees 220,017,345 207,362,707 6,905,996 19,560,634 U.S. Dollars 20,471,471 26,407,639 (5,624,243) (11,560,411) Pound Sterling 1,133,695 2,569,138 (1,450,514) (2,885,957) Japanese Yen 4,377 968 63,406 66,815 Euro 2,651,783 2,682,898 (5,101) (36,216) Other European Currencies 6,826 - - 6,826 Other Currencies 735,580 8,292 110,456 837,744 245,021,077 239,031,642 - 5,989,435
45.2.2 Equity position risk
Equity position risk is the risk that the value of the Group’s equity positions can change as a result of broad equity market and security-specific movements. The Group’s equity exposures are of three types: held for trading, available for sale, and strategic.
Held for trading equity exposures are undertaken to earn profit through market imperfections and arbitrage opportunities and hence of a short-term nature. Available for sale equity investments are made with the intent to earn profit from company and industry fundamentals. Strategic investments are undertaken in line with long-term strategy of the Bank. All equity positions in held for trading and available for sale portfolios are subject to exposure limits established by the Group in line with general limits prescribed by the SBP in its Prudential Regulations. These limits include intraday limits, stop-loss limits, exposure limits, portfolio limits, and sectoral limits. The equity exposures are revalued and scrip-wise / portfolio VaR is calculated on a daily basis.
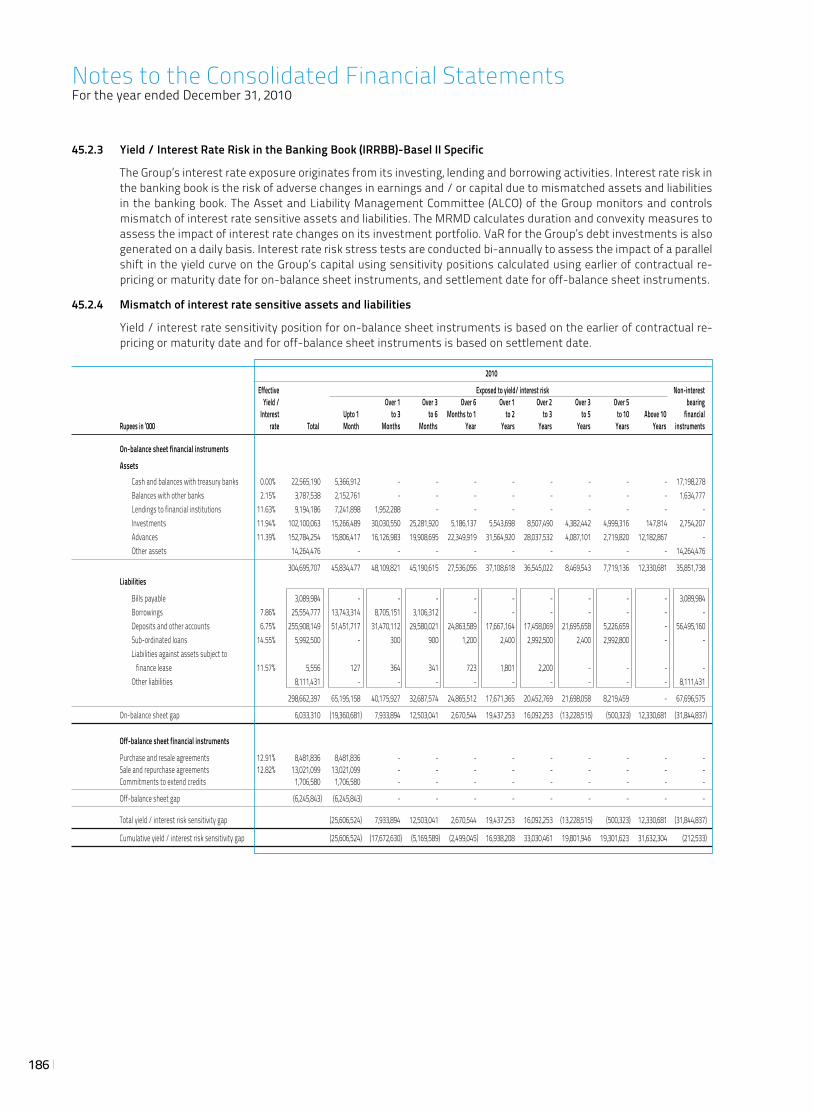
186
45.2.3 Yield / Interest Rate Risk in the Banking Book (IRRBB)-Basel II Specific
The Group’s interest rate exposure originates from its investing, lending and borrowing activities. Interest rate risk in the banking book is the risk of adverse changes in earnings and / or capital due to mismatched assets and liabilities in the banking book. The Asset and Liability Management Committee (ALCO) of the Group monitors and controls mismatch of interest rate sensitive assets and liabilities. The MRMD calculates duration and convexity measures to assess the impact of interest rate changes on its investment portfolio. VaR for the Group’s debt investments is also generated on a daily basis. Interest rate risk stress tests are conducted bi-annually to assess the impact of a parallel shift in the yield curve on the Group’s capital using sensitivity positions calculated using earlier of contractual re-pricing or maturity date for on-balance sheet instruments, and settlement date for off-balance sheet instruments.
45.2.4 Mismatch of interest rate sensitive assets and liabilities
Yield / interest rate sensitivity position for on-balance sheet instruments is based on the earlier of contractual re-pricing or maturity date and for off-balance sheet instruments is based on settlement date.
2010
Effective Exposed to yield/ interest risk Non-interest Yield / Over 1 Over 3 Over 6 Over 1 Over 2 Over 3 Over 5 bearing Interest Upto 1 to 3 to 6 Months to 1 to 2 to 3 to 5 to 10 Above 10 financial Rupees in ‘000 rate Total Month Months Months Year Years Years Years Years Years instruments
On-balance sheet financial instruments
Assets Cash and balances with treasury banks 0.00% 22,565,190 5,366,912 - - - - - - - - 17,198,278 Balances with other banks 2.15% 3,787,538 2,152,761 - - - - - - - - 1,634,777 Lendings to financial institutions 11.63% 9,194,186 7,241,898 1,952,288 - - - - - - - - Investments 11.94% 102,100,063 15,266,489 30,030,550 25,281,920 5,186,137 5,543,698 8,507,490 4,382,442 4,999,316 147,814 2,754,207 Advances 11.39% 152,784,254 15,806,417 16,126,983 19,908,695 22,349,919 31,564,920 28,037,532 4,087,101 2,719,820 12,182,867 - Other assets 14,264,476 - - - - - - - - - 14,264,476
304,695,707 45,834,477 48,109,821 45,190,615 27,536,056 37,108,618 36,545,022 8,469,543 7,719,136 12,330,681 35,851,738 Liabilities
Bills payable 3,089,984 - - - - - - - - - 3,089,984 Borrowings 7.86% 25,554,777 13,743,314 8,705,151 3,106,312 - - - - - - - Deposits and other accounts 6.75% 255,908,149 51,451,717 31,470,112 29,580,021 24,863,589 17,667,164 17,458,069 21,695,658 5,226,659 - 56,495,160 Sub-ordinated loans 14.55% 5,992,500 - 300 900 1,200 2,400 2,992,500 2,400 2,992,800 - - Liabilities against assets subject to finance lease 11.57% 5,556 127 364 341 723 1,801 2,200 - - - - Other liabilities 8,111,431 - - - - - - - - - 8,111,431
298,662,397 65,195,158 40,175,927 32,687,574 24,865,512 17,671,365 20,452,769 21,698,058 8,219,459 - 67,696,575
On-balance sheet gap 6,033,310 (19,360,681) 7,933,894 12,503,041 2,670,544 19,437,253 16,092,253 (13,228,515) (500,323) 12,330,681 (31,844,837)
Off-balance sheet financial instruments
Purchase and resale agreements 12.91% 8,481,836 8,481,836 - - - - - - - - - Sale and repurchase agreements 12.82% 13,021,099 13,021,099 - - - - - - - - - Commitments to extend credits 1,706,580 1,706,580 - - - - - - - - -
Off-balance sheet gap (6,245,843) (6,245,843) - - - - - - - - -
Total yield / interest risk sensitivity gap (25,606,524) 7,933,894 12,503,041 2,670,544 19,437,253 16,092,253 (13,228,515) (500,323) 12,330,681 (31,844,837)
Cumulative yield / interest risk sensitivity gap (25,606,524) (17,672,630) (5,169,589) (2,499,045) 16,938,208 33,030,461 19,801,946 19,301,623 31,632,304 (212,533)
Notes to the Consolidated Financial StatementsFor the year ended December 31, 2010
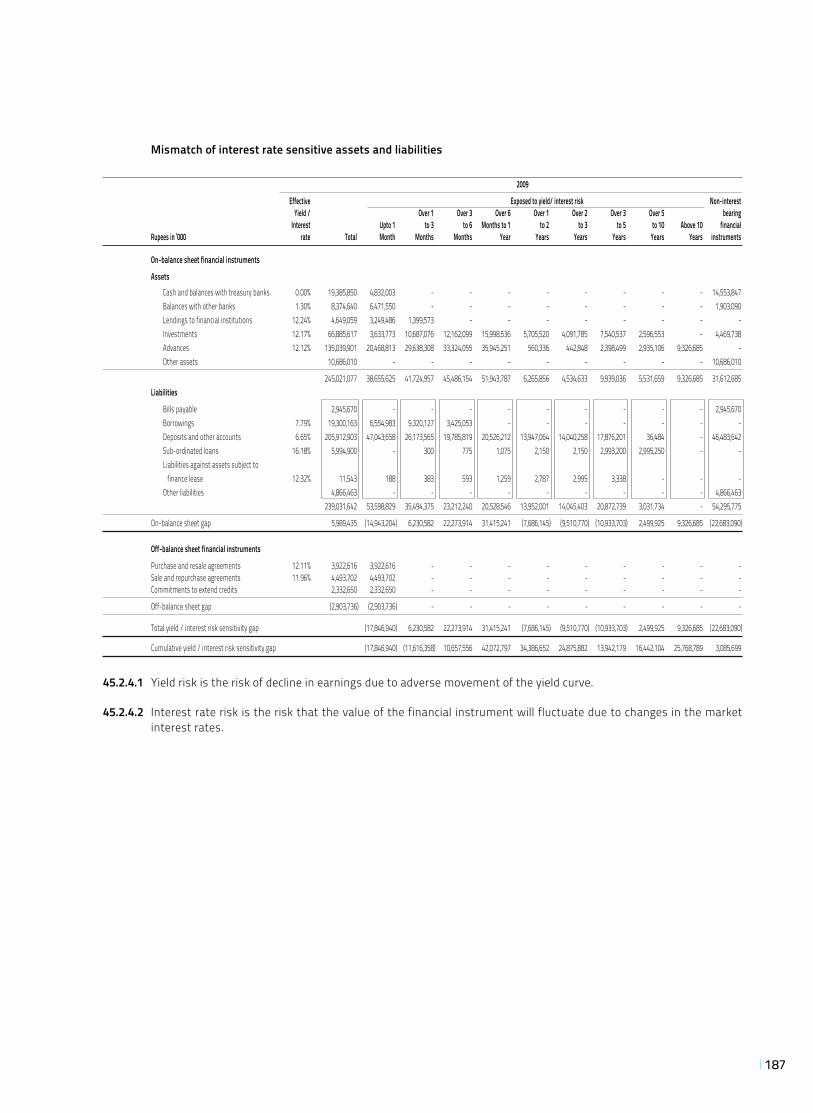
187
Mismatch of interest rate sensitive assets and liabilities
2009
Effective Exposed to yield/ interest risk Non-interest Yield / Over 1 Over 3 Over 6 Over 1 Over 2 Over 3 Over 5 bearing Interest Upto 1 to 3 to 6 Months to 1 to 2 to 3 to 5 to 10 Above 10 financial Rupees in ‘000 rate Total Month Months Months Year Years Years Years Years Years instruments
On-balance sheet financial instruments
Assets Cash and balances with treasury banks 0.00% 19,385,850 4,832,003 - - - - - - - - 14,553,847 Balances with other banks 1.30% 8,374,640 6,471,550 - - - - - - - - 1,903,090 Lendings to financial institutions 12.24% 4,649,059 3,249,486 1,399,573 - - - - - - - - Investments 12.17% 66,885,617 3,633,773 10,687,076 12,162,099 15,998,536 5,705,520 4,091,785 7,540,537 2,596,553 - 4,469,738 Advances 12.12% 135,039,901 20,468,813 29,638,308 33,324,055 35,945,251 560,336 442,848 2,398,499 2,935,106 9,326,685 - Other assets 10,686,010 - - - - - - - - - 10,686,010
245,021,077 38,655,625 41,724,957 45,486,154 51,943,787 6,265,856 4,534,633 9,939,036 5,531,659 9,326,685 31,612,685 Liabilities
Bills payable 2,945,670 - - - - - - - - - 2,945,670 Borrowings 7.79% 19,300,163 6,554,983 9,320,127 3,425,053 - - - - - - - Deposits and other accounts 6.65% 205,912,903 47,043,658 26,173,565 19,785,819 20,526,212 13,947,064 14,040,258 17,876,201 36,484 - 46,483,642 Sub-ordinated loans 16.18% 5,994,900 - 300 775 1,075 2,150 2,150 2,993,200 2,995,250 - - Liabilities against assets subject to finance lease 12.32% 11,543 188 383 593 1,259 2,787 2,995 3,338 - - - Other liabilities 4,866,463 - - - - - - - - - 4,866,463 239,031,642 53,598,829 35,494,375 23,212,240 20,528,546 13,952,001 14,045,403 20,872,739 3,031,734 - 54,295,775
On-balance sheet gap 5,989,435 (14,943,204) 6,230,582 22,273,914 31,415,241 (7,686,145) (9,510,770) (10,933,703) 2,499,925 9,326,685 (22,683,090)
Off-balance sheet financial instruments
Purchase and resale agreements 12.11% 3,922,616 3,922,616 - - - - - - - - - Sale and repurchase agreements 11.96% 4,493,702 4,493,702 - - - - - - - - - Commitments to extend credits 2,332,650 2,332,650 - - - - - - - - -
Off-balance sheet gap (2,903,736) (2,903,736) - - - - - - - - -
Total yield / interest risk sensitivity gap (17,846,940) 6,230,582 22,273,914 31,415,241 (7,686,145) (9,510,770) (10,933,703) 2,499,925 9,326,685 (22,683,090)
Cumulative yield / interest risk sensitivity gap (17,846,940) (11,616,358) 10,657,556 42,072,797 34,386,652 24,875,882 13,942,179 16,442,104 25,768,789 3,085,699
45.2.4.1 Yield risk is the risk of decline in earnings due to adverse movement of the yield curve.
45.2.4.2 Interest rate risk is the risk that the value of the financial instrument will fluctuate due to changes in the market interest rates.
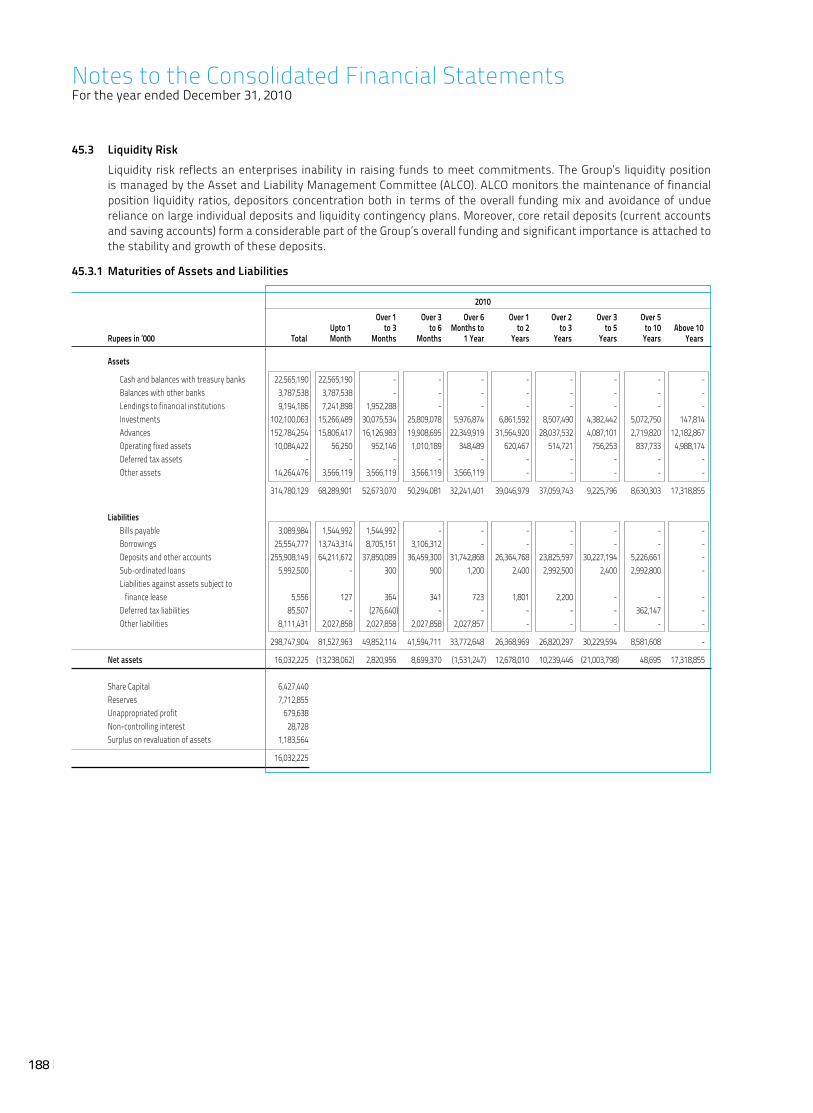
188
45.3 Liquidity Risk Liquidity risk reflects an enterprises inability in raising funds to meet commitments. The Group’s liquidity position
is managed by the Asset and Liability Management Committee (ALCO). ALCO monitors the maintenance of financial position liquidity ratios, depositors concentration both in terms of the overall funding mix and avoidance of undue reliance on large individual deposits and liquidity contingency plans. Moreover, core retail deposits (current accounts and saving accounts) form a considerable part of the Group’s overall funding and significant importance is attached to the stability and growth of these deposits.
45.3.1 Maturities of Assets and Liabilities
2010 Over 1 Over 3 Over 6 Over 1 Over 2 Over 3 Over 5 Upto 1 to 3 to 6 Months to to 2 to 3 to 5 to 10 Above 10 Rupees in ‘000 Total Month Months Months 1 Year Years Years Years Years Years
Assets
Cash and balances with treasury banks 22,565,190 22,565,190 - - - - - - - - Balances with other banks 3,787,538 3,787,538 - - - - - - - - Lendings to financial institutions 9,194,186 7,241,898 1,952,288 - - - - - - - Investments 102,100,063 15,266,489 30,075,534 25,809,078 5,976,874 6,861,592 8,507,490 4,382,442 5,072,750 147,814 Advances 152,784,254 15,806,417 16,126,983 19,908,695 22,349,919 31,564,920 28,037,532 4,087,101 2,719,820 12,182,867 Operating fixed assets 10,084,422 56,250 952,146 1,010,189 348,489 620,467 514,721 756,253 837,733 4,988,174 Deferred tax assets - - - - - - - - - - Other assets 14,264,476 3,566,119 3,566,119 3,566,119 3,566,119 - - - - -
314,780,129 68,289,901 52,673,070 50,294,081 32,241,401 39,046,979 37,059,743 9,225,796 8,630,303 17,318,855
Liabilities Bills payable 3,089,984 1,544,992 1,544,992 - - - - - - - Borrowings 25,554,777 13,743,314 8,705,151 3,106,312 - - - - - - Deposits and other accounts 255,908,149 64,211,672 37,850,089 36,459,300 31,742,868 26,364,768 23,825,597 30,227,194 5,226,661 - Sub-ordinated loans 5,992,500 - 300 900 1,200 2,400 2,992,500 2,400 2,992,800 - Liabilities against assets subject to finance lease 5,556 127 364 341 723 1,801 2,200 - - - Deferred tax liabilities 85,507 - (276,640) - - - - - 362,147 - Other liabilities 8,111,431 2,027,858 2,027,858 2,027,858 2,027,857 - - - - -
298,747,904 81,527,963 49,852,114 41,594,711 33,772,648 26,368,969 26,820,297 30,229,594 8,581,608 -
Net assets 16,032,225 (13,238,062) 2,820,956 8,699,370 (1,531,247) 12,678,010 10,239,446 (21,003,798) 48,695 17,318,855 Share Capital 6,427,440 Reserves 7,712,855 Unappropriated profit 679,638 Non-controlling interest 28,728 Surplus on revaluation of assets 1,183,564
16,032,225
Notes to the Consolidated Financial StatementsFor the year ended December 31, 2010
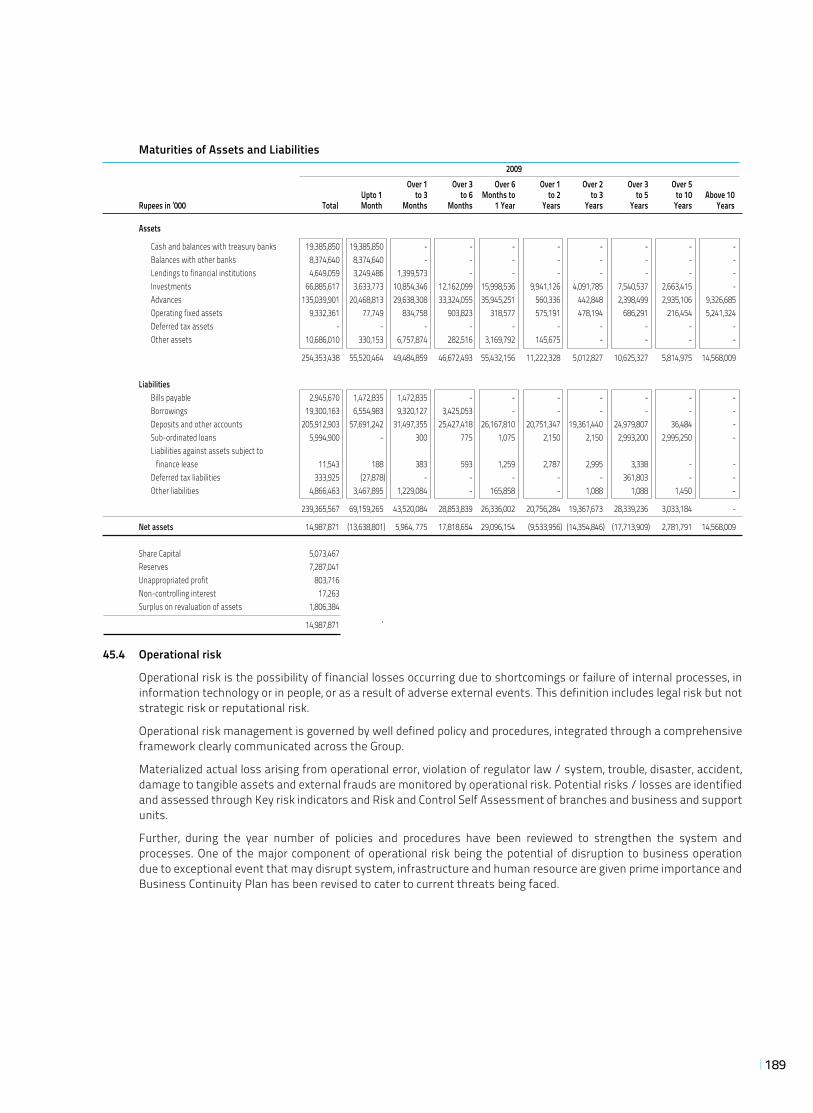
189
Maturities of Assets and Liabilities 2009 Over 1 Over 3 Over 6 Over 1 Over 2 Over 3 Over 5 Upto 1 to 3 to 6 Months to to 2 to 3 to 5 to 10 Above 10 Rupees in ‘000 Total Month Months Months 1 Year Years Years Years Years Years
Assets
Cash and balances with treasury banks 19,385,850 19,385,850 - - - - - - - - Balances with other banks 8,374,640 8,374,640 - - - - - - - - Lendings to financial institutions 4,649,059 3,249,486 1,399,573 - - - - - - - Investments 66,885,617 3,633,773 10,854,346 12,162,099 15,998,536 9,941,126 4,091,785 7,540,537 2,663,415 - Advances 135,039,901 20,468,813 29,638,308 33,324,055 35,945,251 560,336 442,848 2,398,499 2,935,106 9,326,685 Operating fixed assets 9,332,361 77,749 834,758 903,823 318,577 575,191 478,194 686,291 216,454 5,241,324 Deferred tax assets - - - - - - - - - - Other assets 10,686,010 330,153 6,757,874 282,516 3,169,792 145,675 - - - -
254,353,438 55,520,464 49,484,859 46,672,493 55,432,156 11,222,328 5,012,827 10,625,327 5,814,975 14,568,009 Liabilities Bills payable 2,945,670 1,472,835 1,472,835 - - - - - - - Borrowings 19,300,163 6,554,983 9,320,127 3,425,053 - - - - - - Deposits and other accounts 205,912,903 57,691,242 31,497,355 25,427,418 26,167,810 20,751,347 19,361,440 24,979,807 36,484 - Sub-ordinated loans 5,994,900 - 300 775 1,075 2,150 2,150 2,993,200 2,995,250 - Liabilities against assets subject to finance lease 11,543 188 383 593 1,259 2,787 2,995 3,338 - - Deferred tax liabilities 333,925 (27,878) - - - - - 361,803 - - Other liabilities 4,866,463 3,467,895 1,229,084 - 165,858 - 1,088 1,088 1,450 -
239,365,567 69,159,265 43,520,084 28,853,839 26,336,002 20,756,284 19,367,673 28,339,236 3,033,184 -
Net assets 14,987,871 (13,638,801) 5,964, 775 17,818,654 29,096,154 (9,533,956) (14,354,846) (17,713,909) 2,781,791 14,568,009 Share Capital 5,073,467 Reserves 7,287,041 Unappropriated profit 803,716 Non-controlling interest 17,263 Surplus on revaluation of assets 1,806,384
14,987,871 ‘ 45.4 Operational risk
Operational risk is the possibility of financial losses occurring due to shortcomings or failure of internal processes, in information technology or in people, or as a result of adverse external events. This definition includes legal risk but not strategic risk or reputational risk.
Operational risk management is governed by well defined policy and procedures, integrated through a comprehensive framework clearly communicated across the Group.
Materialized actual loss arising from operational error, violation of regulator law / system, trouble, disaster, accident, damage to tangible assets and external frauds are monitored by operational risk. Potential risks / losses are identified and assessed through Key risk indicators and Risk and Control Self Assessment of branches and business and support units.
Further, during the year number of policies and procedures have been reviewed to strengthen the system and processes. One of the major component of operational risk being the potential of disruption to business operation due to exceptional event that may disrupt system, infrastructure and human resource are given prime importance and Business Continuity Plan has been revised to cater to current threats being faced.
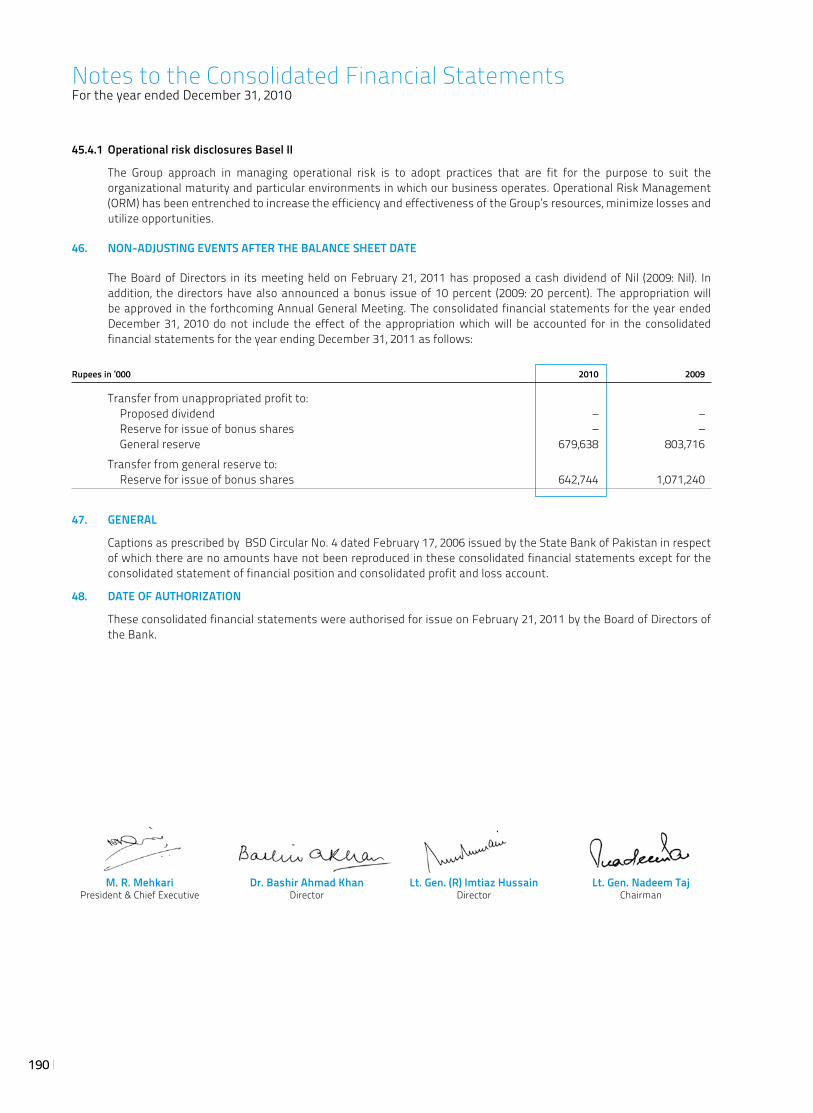
190
45.4.1 Operational risk disclosures Basel II
The Group approach in managing operational risk is to adopt practices that are fit for the purpose to suit the organizational maturity and particular environments in which our business operates. Operational Risk Management (ORM) has been entrenched to increase the efficiency and effectiveness of the Group’s resources, minimize losses and utilize opportunities.
46. NON-ADJUSTING EVENTS AFTER THE BALANCE SHEET DATE
The Board of Directors in its meeting held on February 21, 2011 has proposed a cash dividend of Nil (2009: Nil). In addition, the directors have also announced a bonus issue of 10 percent (2009: 20 percent). The appropriation will be approved in the forthcoming Annual General Meeting. The consolidated financial statements for the year ended December 31, 2010 do not include the effect of the appropriation which will be accounted for in the consolidated financial statements for the year ending December 31, 2011 as follows:
Rupees in ‘000 2010 2009
Transfer from unappropriated profit to: Proposed dividend – – Reserve for issue of bonus shares – – General reserve 679,638 803,716 Transfer from general reserve to: Reserve for issue of bonus shares 642,744 1,071,240
47. GENERAL
Captions as prescribed by BSD Circular No. 4 dated February 17, 2006 issued by the State Bank of Pakistan in respect of which there are no amounts have not been reproduced in these consolidated financial statements except for the consolidated statement of financial position and consolidated profit and loss account.
48. DATE OF AUTHORIZATION
These consolidated financial statements were authorised for issue on February 21, 2011 by the Board of Directors of the Bank.
Notes to the Consolidated Financial StatementsFor the year ended December 31, 2010
M. R. Mehkari Dr. Bashir Ahmad Khan Lt. Gen. (R) Imtiaz Hussain Lt. Gen. Nadeem Taj President & Chief Executive Director Director Chairman
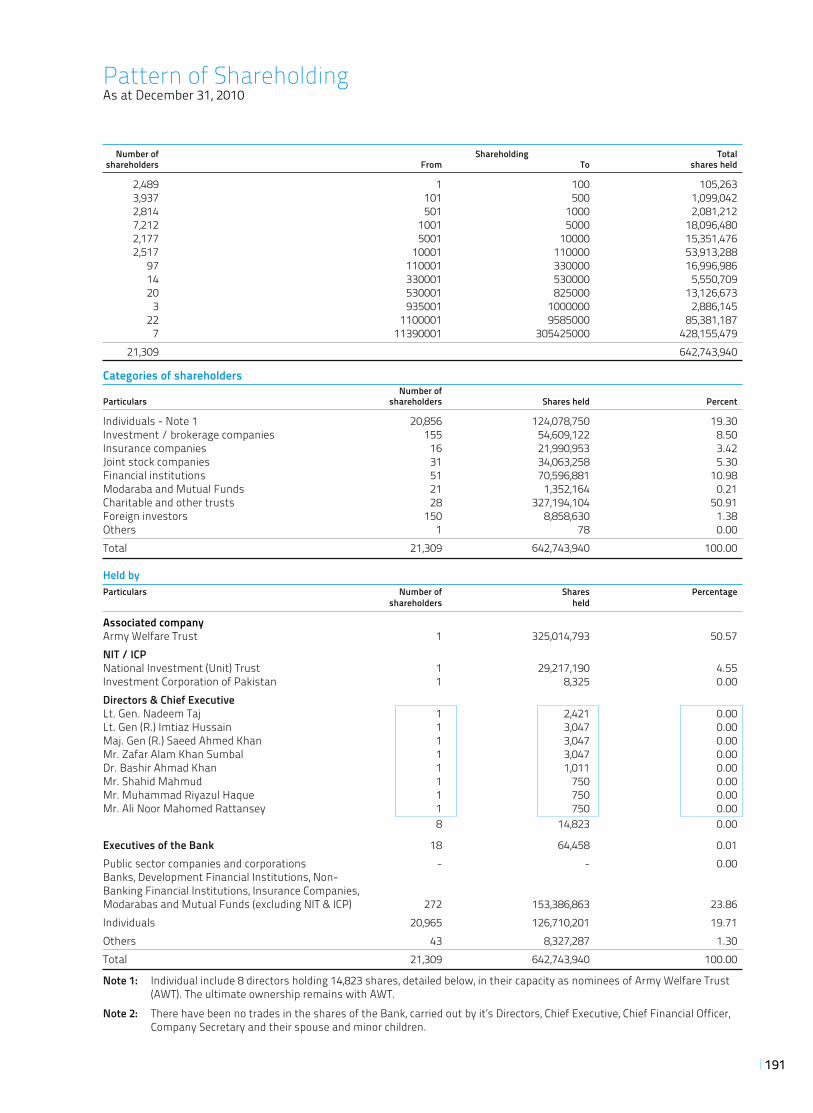
191
Pattern of ShareholdingAs at December 31, 2010
Number of Shareholding Total shareholders From To shares held
2,489 1 100 105,263 3,937 101 500 1,099,042 2,814 501 1000 2,081,212 7,212 1001 5000 18,096,480 2,177 5001 10000 15,351,476 2,517 10001 110000 53,913,288 97 110001 330000 16,996,986 14 330001 530000 5,550,709 20 530001 825000 13,126,673 3 935001 1000000 2,886,145 22 1100001 9585000 85,381,187 7 11390001 305425000 428,155,479 21,309 642,743,940
Categories of shareholders Number of Particulars shareholders Shares held Percent
Individuals - Note 1 20,856 124,078,750 19.30 Investment / brokerage companies 155 54,609,122 8.50 Insurance companies 16 21,990,953 3.42 Joint stock companies 31 34,063,258 5.30 Financial institutions 51 70,596,881 10.98 Modaraba and Mutual Funds 21 1,352,164 0.21 Charitable and other trusts 28 327,194,104 50.91 Foreign investors 150 8,858,630 1.38 Others 1 78 0.00 Total 21,309 642,743,940 100.00
Held byParticulars Number of Shares Percentage shareholders held
Associated companyArmy Welfare Trust 1 325,014,793 50.57NIT / ICP National Investment (Unit) Trust 1 29,217,190 4.55Investment Corporation of Pakistan 1 8,325 0.00Directors & Chief Executive Lt. Gen. Nadeem Taj 1 2,421 0.00Lt. Gen (R.) Imtiaz Hussain 1 3,047 0.00Maj. Gen (R.) Saeed Ahmed Khan 1 3,047 0.00Mr. Zafar Alam Khan Sumbal 1 3,047 0.00Dr. Bashir Ahmad Khan 1 1,011 0.00Mr. Shahid Mahmud 1 750 0.00Mr. Muhammad Riyazul Haque 1 750 0.00Mr. Ali Noor Mahomed Rattansey 1 750 0.00 8 14,823 0.00
Executives of the Bank 18 64,458 0.01Public sector companies and corporations - - 0.00Banks, Development Financial Institutions, Non- Banking Financial Institutions, Insurance Companies, Modarabas and Mutual Funds (excluding NIT & ICP) 272 153,386,863 23.86Individuals 20,965 126,710,201 19.71Others 43 8,327,287 1.30Total 21,309 642,743,940 100.00
Note 1: Individual include 8 directors holding 14,823 shares, detailed below, in their capacity as nominees of Army Welfare Trust (AWT). The ultimate ownership remains with AWT.
Note 2: There have been no trades in the shares of the Bank, carried out by it’s Directors, Chief Executive, Chief Financial Officer, Company Secretary and their spouse and minor children.
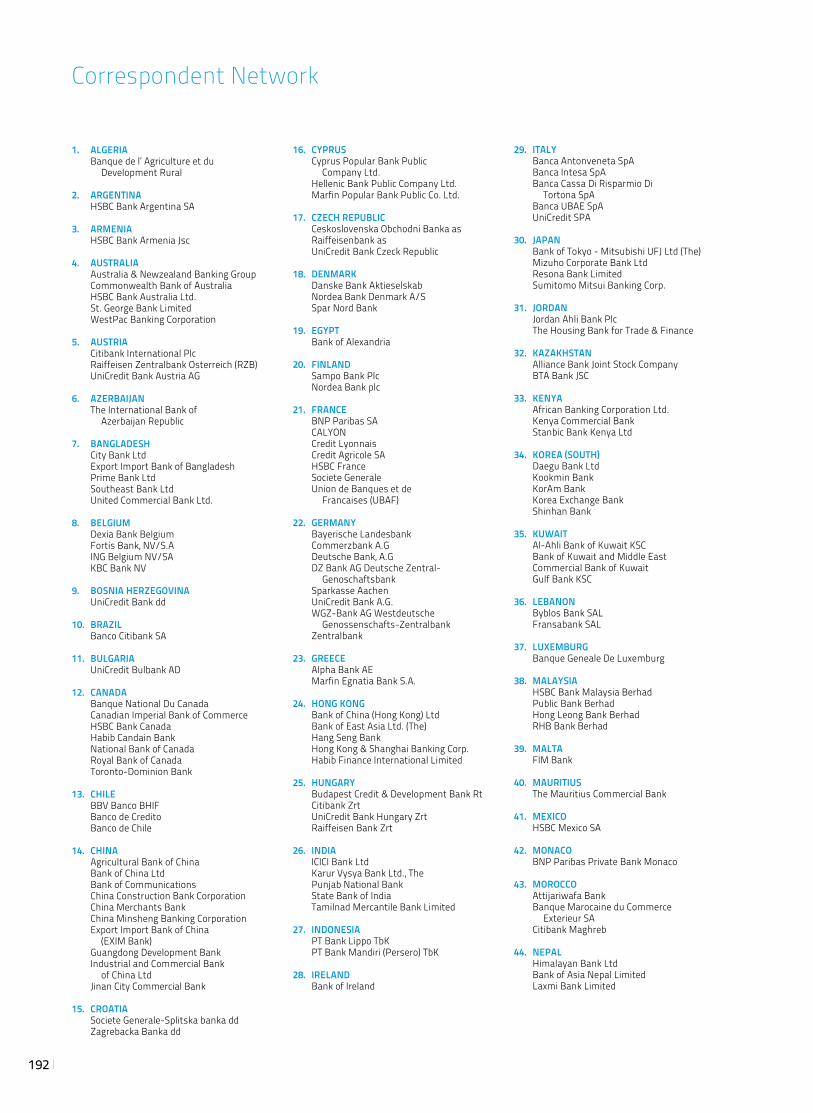
192
Correspondent Network
1. ALGERIA Banque de l’ Agriculture et du Development Rural 2. ARGENTINA HSBC Bank Argentina SA
3. ARMENIA HSBC Bank Armenia Jsc
4. AUSTRALIA Australia & Newzealand Banking Group Commonwealth Bank of Australia HSBC Bank Australia Ltd. St. George Bank Limited WestPac Banking Corporation 5. AUSTRIA Citibank International Plc Raiffeisen Zentralbank Osterreich (RZB) UniCredit Bank Austria AG
6. AZERBAIJAN The International Bank of Azerbaijan Republic
7. BANGLADESH City Bank Ltd Export Import Bank of Bangladesh Prime Bank Ltd Southeast Bank Ltd United Commercial Bank Ltd. 8. BELGIUM Dexia Bank Belgium Fortis Bank, NV/S.A ING Belgium NV/SA KBC Bank NV
9. BOSNIA HERZEGOVINA UniCredit Bank dd
10. BRAZIL Banco Citibank SA 11. BULGARIA UniCredit Bulbank AD
12. CANADA Banque National Du Canada Canadian Imperial Bank of Commerce HSBC Bank Canada Habib Candain Bank National Bank of Canada Royal Bank of Canada Toronto-Dominion Bank
13. CHILE BBV Banco BHIF Banco de Credito Banco de Chile
14. CHINA Agricultural Bank of China Bank of China Ltd Bank of Communications China Construction Bank Corporation China Merchants Bank China Minsheng Banking Corporation Export Import Bank of China (EXIM Bank) Guangdong Development Bank Industrial and Commercial Bank of China Ltd Jinan City Commercial Bank
15. CROATIA Societe Generale-Splitska banka dd Zagrebacka Banka dd
16. CYPRUS Cyprus Popular Bank Public Company Ltd. Hellenic Bank Public Company Ltd. Marfin Popular Bank Public Co. Ltd.
17. CZECH REPUBLIC Ceskoslovenska Obchodni Banka as Raiffeisenbank as UniCredit Bank Czeck Republic
18. DENMARK Danske Bank Aktieselskab Nordea Bank Denmark A/S Spar Nord Bank
19. EGYPT Bank of Alexandria
20. FINLAND Sampo Bank Plc Nordea Bank plc
21. FRANCE BNP Paribas SA CALYON Credit Lyonnais Credit Agricole SA HSBC France Societe Generale Union de Banques et de Francaises (UBAF)
22. GERMANY Bayerische Landesbank Commerzbank A.G Deutsche Bank, A.G DZ Bank AG Deutsche Zentral- Genoschaftsbank Sparkasse Aachen UniCredit Bank A.G. WGZ-Bank AG Westdeutsche Genossenschafts-Zentralbank Zentralbank
23. GREECE Alpha Bank AE Marfin Egnatia Bank S.A.
24. HONG KONG Bank of China (Hong Kong) Ltd Bank of East Asia Ltd. (The) Hang Seng Bank Hong Kong & Shanghai Banking Corp. Habib Finance International Limited
25. HUNGARY Budapest Credit & Development Bank Rt Citibank Zrt UniCredit Bank Hungary Zrt Raiffeisen Bank Zrt
26. INDIA ICICI Bank Ltd Karur Vysya Bank Ltd., The Punjab National Bank State Bank of India Tamilnad Mercantile Bank Limited
27. INDONESIA PT Bank Lippo TbK PT Bank Mandiri (Persero) TbK
28. IRELAND Bank of Ireland
29. ITALY Banca Antonveneta SpA Banca Intesa SpA Banca Cassa Di Risparmio Di Tortona SpA Banca UBAE SpA UniCredit SPA 30. JAPAN Bank of Tokyo - Mitsubishi UFJ Ltd (The) Mizuho Corporate Bank Ltd Resona Bank Limited Sumitomo Mitsui Banking Corp. 31. JORDAN Jordan Ahli Bank Plc The Housing Bank for Trade & Finance
32. KAZAKHSTAN Alliance Bank Joint Stock Company BTA Bank JSC 33. KENYA African Banking Corporation Ltd. Kenya Commercial Bank Stanbic Bank Kenya Ltd
34. KOREA (SOUTH) Daegu Bank Ltd Kookmin Bank KorAm Bank Korea Exchange Bank Shinhan Bank
35. KUWAIT Al-Ahli Bank of Kuwait KSC Bank of Kuwait and Middle East Commercial Bank of Kuwait Gulf Bank KSC
36. LEBANON Byblos Bank SAL Fransabank SAL 37. LUXEMBURG Banque Geneale De Luxemburg
38. MALAYSIA HSBC Bank Malaysia Berhad Public Bank Berhad Hong Leong Bank Berhad RHB Bank Berhad
39. MALTA FIM Bank
40. MAURITIUS The Mauritius Commercial Bank
41. MEXICO HSBC Mexico SA
42. MONACO BNP Paribas Private Bank Monaco
43. MOROCCO Attijariwafa Bank Banque Marocaine du Commerce Exterieur SA Citibank Maghreb
44. NEPAL Himalayan Bank Ltd Bank of Asia Nepal Limited Laxmi Bank Limited
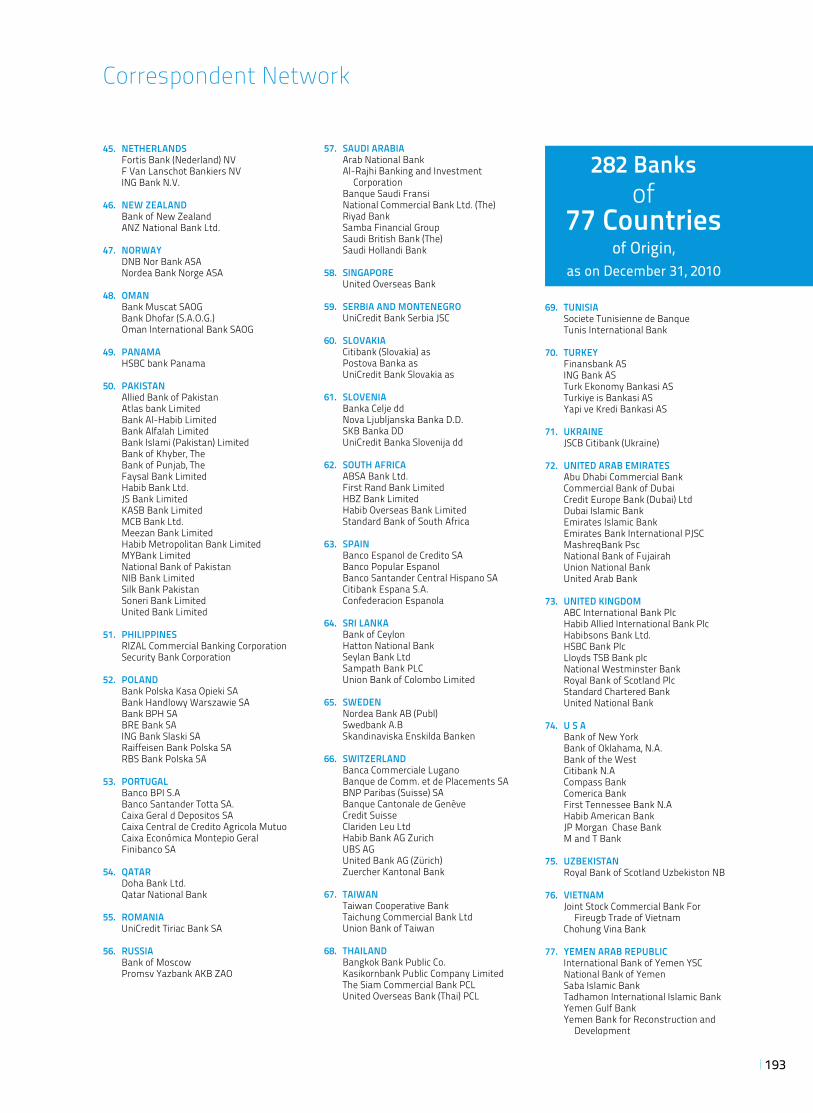
193
45. NETHERLANDS Fortis Bank (Nederland) NV F Van Lanschot Bankiers NV ING Bank N.V. 46. NEW ZEALAND Bank of New Zealand ANZ National Bank Ltd.
47. NORWAY DNB Nor Bank ASA Nordea Bank Norge ASA 48. OMAN Bank Muscat SAOG Bank Dhofar (S.A.O.G.) Oman International Bank SAOG
49. PANAMA HSBC bank Panama
50. PAKISTAN Allied Bank of Pakistan Atlas bank Limited Bank Al-Habib Limited Bank Alfalah Limited Bank Islami (Pakistan) Limited Bank of Khyber, The Bank of Punjab, The Faysal Bank Limited Habib Bank Ltd. JS Bank Limited KASB Bank Limited MCB Bank Ltd. Meezan Bank Limited Habib Metropolitan Bank Limited MYBank Limited National Bank of Pakistan NIB Bank Limited Silk Bank Pakistan Soneri Bank Limited United Bank Limited 51. PHILIPPINES RIZAL Commercial Banking Corporation Security Bank Corporation
52. POLAND Bank Polska Kasa Opieki SA Bank Handlowy Warszawie SA Bank BPH SA BRE Bank SA ING Bank Slaski SA Raiffeisen Bank Polska SA RBS Bank Polska SA 53. PORTUGAL Banco BPI S.A Banco Santander Totta SA. Caixa Geral d Depositos SA Caixa Central de Credito Agricola Mutuo Caixa Económica Montepio Geral Finibanco SA 54. QATAR Doha Bank Ltd. Qatar National Bank
55. ROMANIA UniCredit Tiriac Bank SA
56. RUSSIA Bank of Moscow Promsv Yazbank AKB ZAO
57. SAUDI ARABIA Arab National Bank Al-Rajhi Banking and Investment Corporation Banque Saudi Fransi National Commercial Bank Ltd. (The) Riyad Bank Samba Financial Group Saudi British Bank (The) Saudi Hollandi Bank
58. SINGAPORE United Overseas Bank
59. SERBIA AND MONTENEGRO UniCredit Bank Serbia JSC
60. SLOVAKIA Citibank (Slovakia) as Postova Banka as UniCredit Bank Slovakia as
61. SLOVENIA Banka Celje dd Nova Ljubljanska Banka D.D. SKB Banka DD UniCredit Banka Slovenija dd
62. SOUTH AFRICA ABSA Bank Ltd. First Rand Bank Limited HBZ Bank Limited Habib Overseas Bank Limited Standard Bank of South Africa
63. SPAIN Banco Espanol de Credito SA Banco Popular Espanol Banco Santander Central Hispano SA Citibank Espana S.A. Confederacion Espanola 64. SRI LANKA Bank of Ceylon Hatton National Bank Seylan Bank Ltd Sampath Bank PLC Union Bank of Colombo Limited
65. SWEDEN Nordea Bank AB (Publ) Swedbank A.B Skandinaviska Enskilda Banken 66. SWITZERLAND Banca Commerciale Lugano Banque de Comm. et de Placements SA BNP Paribas (Suisse) SA Banque Cantonale de Genève Credit Suisse Clariden Leu Ltd Habib Bank AG Zurich UBS AG United Bank AG (Zürich) Zuercher Kantonal Bank
67. TAIWAN Taiwan Cooperative Bank Taichung Commercial Bank Ltd Union Bank of Taiwan 68. THAILAND Bangkok Bank Public Co. Kasikornbank Public Company Limited The Siam Commercial Bank PCL United Overseas Bank (Thai) PCL
69. TUNISIA Societe Tunisienne de Banque Tunis International Bank 70. TURKEY Finansbank AS ING Bank AS Turk Ekonomy Bankasi AS Turkiye is Bankasi AS Yapi ve Kredi Bankasi AS
71. UKRAINE JSCB Citibank (Ukraine)
72. UNITED ARAB EMIRATES Abu Dhabi Commercial Bank Commercial Bank of Dubai Credit Europe Bank (Dubai) Ltd Dubai Islamic Bank Emirates Islamic Bank Emirates Bank International PJSC MashreqBank Psc National Bank of Fujairah Union National Bank United Arab Bank
73. UNITED KINGDOM ABC International Bank Plc Habib Allied International Bank Plc Habibsons Bank Ltd. HSBC Bank Plc Lloyds TSB Bank plc National Westminster Bank Royal Bank of Scotland Plc Standard Chartered Bank United National Bank
74. U S A Bank of New York Bank of Oklahama, N.A. Bank of the West Citibank N.A Compass Bank Comerica Bank First Tennessee Bank N.A Habib American Bank JP Morgan Chase Bank M and T Bank 75. UZBEKISTAN Royal Bank of Scotland Uzbekiston NB
76. VIETNAM Joint Stock Commercial Bank For Fireugb Trade of Vietnam Chohung Vina Bank 77. YEMEN ARAB REPUBLIC International Bank of Yemen YSC National Bank of Yemen Saba Islamic Bank Tadhamon International Islamic Bank Yemen Gulf Bank Yemen Bank for Reconstruction and Development
Correspondent Network
282 Banksof
77 Countriesof Origin,
as on December 31, 2010
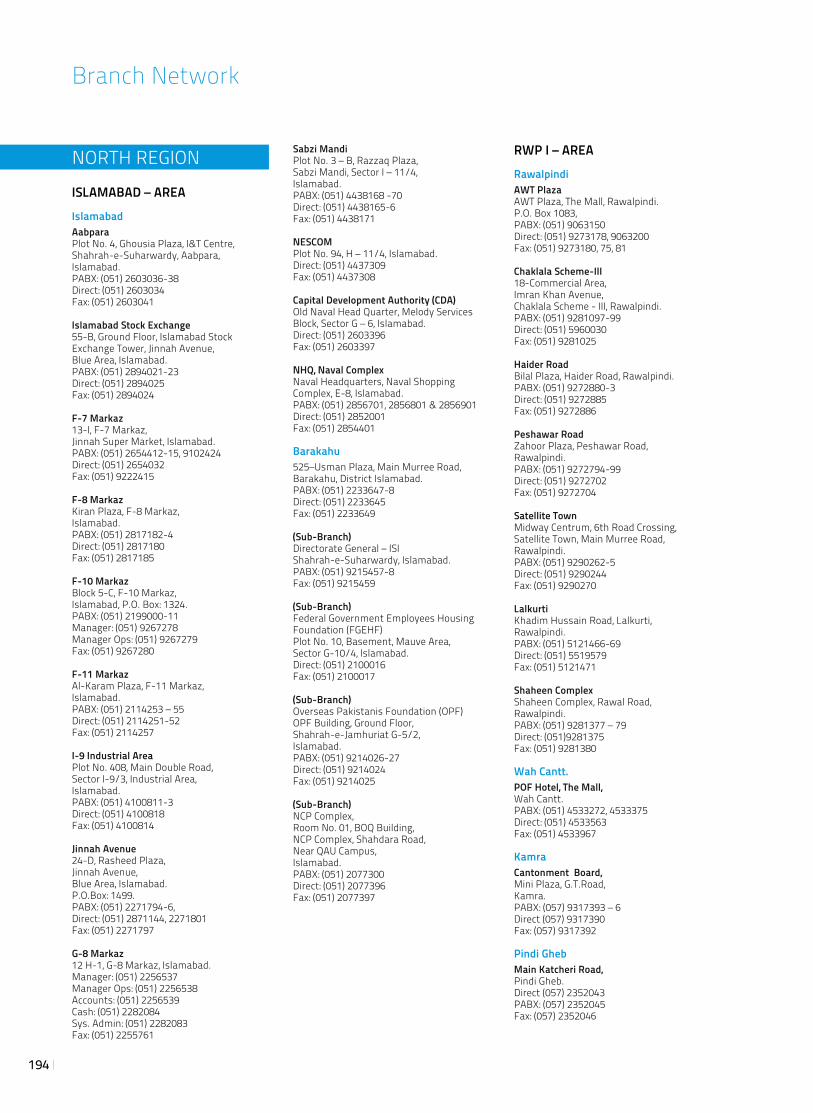
194
Branch Network
NORTH REGION
ISLAMABAD – AREA
IslamabadAabparaPlot No. 4, Ghousia Plaza, I&T Centre, Shahrah-e-Suharwardy, Aabpara, Islamabad.PABX: (051) 2603036-38Direct: (051) 2603034Fax: (051) 2603041
Islamabad Stock Exchange55-B, Ground Floor, Islamabad Stock Exchange Tower, Jinnah Avenue, Blue Area, Islamabad.PABX: (051) 2894021-23Direct: (051) 2894025Fax: (051) 2894024
F-7 Markaz13-I, F-7 Markaz, Jinnah Super Market, Islamabad.PABX: (051) 2654412-15, 9102424Direct: (051) 2654032Fax: (051) 9222415
F-8 MarkazKiran Plaza, F-8 Markaz,Islamabad.PABX: (051) 2817182-4Direct: (051) 2817180Fax: (051) 2817185
F-10 MarkazBlock 5-C, F-10 Markaz,Islamabad, P.O. Box: 1324.PABX: (051) 2199000-11Manager: (051) 9267278Manager Ops: (051) 9267279Fax: (051) 9267280
F-11 MarkazAl-Karam Plaza, F-11 Markaz, Islamabad.PABX: (051) 2114253 – 55 Direct: (051) 2114251-52Fax: (051) 2114257
I-9 Industrial AreaPlot No. 408, Main Double Road, Sector I-9/3, Industrial Area, Islamabad.PABX: (051) 4100811-3Direct: (051) 4100818Fax: (051) 4100814
Jinnah Avenue24-D, Rasheed Plaza, Jinnah Avenue, Blue Area, Islamabad. P.O.Box: 1499.PABX: (051) 2271794-6, Direct: (051) 2871144, 2271801Fax: (051) 2271797
G-8 Markaz12 H-1, G-8 Markaz, Islamabad.Manager: (051) 2256537Manager Ops: (051) 2256538Accounts: (051) 2256539Cash: (051) 2282084Sys. Admin: (051) 2282083Fax: (051) 2255761
Sabzi MandiPlot No. 3 – B, Razzaq Plaza,Sabzi Mandi, Sector I – 11/4,Islamabad.PABX: (051) 4438168 -70 Direct: (051) 4438165-6Fax: (051) 4438171
NESCOMPlot No. 94, H – 11/4, Islamabad.Direct: (051) 4437309Fax: (051) 4437308
Capital Development Authority (CDA)Old Naval Head Quarter, Melody Services Block, Sector G – 6, Islamabad.Direct: (051) 2603396Fax: (051) 2603397
NHQ, Naval ComplexNaval Headquarters, Naval Shopping Complex, E-8, Islamabad.PABX: (051) 2856701, 2856801 & 2856901 Direct: (051) 2852001Fax: (051) 2854401
Barakahu525–Usman Plaza, Main Murree Road, Barakahu, District Islamabad.PABX: (051) 2233647-8Direct: (051) 2233645Fax: (051) 2233649
(Sub-Branch)Directorate General – ISI Shahrah-e-Suharwardy, Islamabad.PABX: (051) 9215457-8Fax: (051) 9215459
(Sub-Branch)Federal Government Employees Housing Foundation (FGEHF)Plot No. 10, Basement, Mauve Area,Sector G-10/4, Islamabad.Direct: (051) 2100016Fax: (051) 2100017
(Sub-Branch)Overseas Pakistanis Foundation (OPF)OPF Building, Ground Floor, Shahrah-e-Jamhuriat G-5/2,Islamabad.PABX: (051) 9214026-27 Direct: (051) 9214024Fax: (051) 9214025
(Sub-Branch)NCP Complex,Room No. 01, BOQ Building,NCP Complex, Shahdara Road,Near QAU Campus,Islamabad.PABX: (051) 2077300 Direct: (051) 2077396Fax: (051) 2077397
RWP I – AREA
RawalpindiAWT PlazaAWT Plaza, The Mall, Rawalpindi.P.O. Box 1083, PABX: (051) 9063150Direct: (051) 9273178, 9063200Fax: (051) 9273180, 75, 81
Chaklala Scheme-III18-Commercial Area,Imran Khan Avenue,Chaklala Scheme - III, Rawalpindi.PABX: (051) 9281097-99Direct: (051) 5960030Fax: (051) 9281025
Haider RoadBilal Plaza, Haider Road, Rawalpindi.PABX: (051) 9272880-3Direct: (051) 9272885Fax: (051) 9272886
Peshawar RoadZahoor Plaza, Peshawar Road,Rawalpindi.PABX: (051) 9272794-99Direct: (051) 9272702Fax: (051) 9272704
Satellite TownMidway Centrum, 6th Road Crossing, Satellite Town, Main Murree Road, Rawalpindi.PABX: (051) 9290262-5Direct: (051) 9290244Fax: (051) 9290270
LalkurtiKhadim Hussain Road, Lalkurti,Rawalpindi.PABX: (051) 5121466-69Direct: (051) 5519579Fax: (051) 5121471
Shaheen ComplexShaheen Complex, Rawal Road,Rawalpindi.PABX: (051) 9281377 – 79 Direct: (051)9281375Fax: (051) 9281380
Wah Cantt.POF Hotel, The Mall,Wah Cantt.PABX: (051) 4533272, 4533375Direct: (051) 4533563Fax: (051) 4533967
KamraCantonment Board,Mini Plaza, G.T.Road,Kamra.PABX: (057) 9317393 – 6Direct (057) 9317390Fax: (057) 9317392
Pindi GhebMain Katcheri Road, Pindi Gheb.Direct (057) 2352043PABX: (057) 2352045Fax: (057) 2352046
195
(Sub-Branch)Project Management Organization (PMO)Shop No. 1 to 3, Commercial Complex, Gulshan Colony, PMO, Taxila.PABX: (051) 90652578Direct: (051) 9065274
(Sub-Branch)Main Hazroo Hattian Road,Near Bus Stand Hazroo, Hazroo.Direct: (057) 2313486Fax: (057) 2313487
(Sub-Branch)Rising Sun Shopping Complex, 10 Corps Head Quarter, Chaklala Garrison,Rawalpindi.Mobile: (0321) 5246097Dir: (051) 5592004Fax: (051) 5592008
(Sub-Branch)Kahota Research Laboratories (KRL), Qadeer Khan Road, Near Chathri Chowk, Rawalpindi.PABX: (051) 9268198-99Dir: (051) 9268195Mobile: (0333) 5115358
(Sub-Branch)Hamza Camp,Stadium Road, Rawalpindi.Direct: (051) 4421965, 4855372Fax: (051) 4855371
TaxilaHeavy Industries Taxila,Allama Iqbal Avenue,Near Cantonment Market,Taxila.Mobile: 0300 – 5086860
RWP II – AREA
RawalpindiAdyala RoadMain Adyala Road, Rawalpindi.PABX: (051) 5948081-84Direct: (051) 5948088Fax: (051) 5948085
College RoadCollege Road, Rawalpindi.PABX: (051) 5540516, 5540227Direct: (051) 5540388Fax: (051) 5540321
General Headquarters (GHQ)Near Gate No. 4, GHQ, Rawalpindi.PABX: (051) 9271739-40, 561-31192Direct: (051) 9271738Fax: (051) 9271541
Al-Shifa Eye Trust HospitalJhelum Road, Rawalpindi. Direct: (051) 5488721PABX: (051) 5488720, 5806943, Fax: (051) 5488552
Jarar CampShopping Complex, Jarar Camp, Mouza Budhial, Dhalla, Tehsil & Dist. Rawalpindi.Direct: (051) 5949048 Direct: (051) 5949045 Fax: (051) 5949047
C.M.HCombined Military Hospital (CMH),Range Road, Rawalpindi.Direct: (0345) 5912008
DHA, Islamabad DHA Mall, Jinnah Avenue,Defence Housing Authority,Phase-I, (Morgah), Islamabad.PABX: (051) 5788693-94Direct: (051)5788691/5788601Fax: (051) 5788695
ChakwalTalagang Road, Chakwal.PABX: (0543) 553142-43Direct: (0543) 551255Fax: (0543) 601979
Gujar KhanB-III-360/1, G.T. Road,Opposite DSP Office, Gujar Khan.PABX: (0513) 515671-74Direct: (0513) 515905Fax: (0513) 515676
ChashmaPlot 1, Bank Square,Chashma Barrage Colony,D.I. Khan Road, Chashma Distt. Mianwali.PABX: (0459) 241544Direct: (0459) 241667Fax: (0459) 242761
Mianwali Ballo Khail Road Plot No. 55 & 56, Ballo Khail Road, Mianwali.PABX: (0459)237903-4 Direct: (0459) 237901-2Fax: (0459) 237905
KRL SumbalgahKahota Research LaboratoriesShopping Colony Centre, Near Gate 1, K-Location, Tehsil Kahuta, Distt. Rawalpindi.Mob: 0300-5143137
(Sub-Branch)Engineering in Chief (E in C Branch),General Head Quarter (GHQ),R.A. Bazar, Rawalpindi.Direct: (051) 9271711 Fax: (051) 9171743 (Sub-Branch)Bahria Town, Phase - VIIIPlot No. 35, Linear Commercial, Safari Valley, Bahria Town, Rawalpindi.PABX: (051) 5705665-5705669Direct: (051) 5705667Fax: (051) 5705668
PESHAWAR – AREA
AbbottabadLala Rukh Plaza,Mansehra Road, Abbottabad.PABX: (0992) 332182-3 Direct: (0992) 332157 Fax: (0992) 332184
Dera Ismail KhanKaif Gulbahar Building,A.Q. Khan Chowk, Circular Road,Dera Ismail Khan. PABX: (0966) 720180-81 Direct: (0966) 720178 Fax: (0966) 720184
MardanThe Mall, Mardan, P.O. Box: 197. PABX: (0937) 9230501-02 Direct: (0937) 9230500 Fax: (0937) 9230503
Mingora, SwatOpposite Park Hotel, Makaan Bagh, Saidu Sharif Road,Mingora, Swat. PABX: (0946) 713358-59 Direct: (0946) 713356 Fax: (0946) 713363
NowsheraTaj Building,Main G.T. Road, Nowshera. PABX: (0923) 9220300-301 Direct: (0923) 9220302 Fax: (0923) 9220304
HaripurShahrah-e-Hazara, Haripur PABX: (0995) 627128-32 Direct: (0995) 616507 Fax: (0995) 616508
Allai1st Floor, New Saadat Market,Banna, Allai.Mobile : (0333) 5025995, 0334-5582980
GilgitMain Bazar, Airport Road, Gilgit PABX: (05811) 452023 Direct: (05811) 452021 Fax: (05811) 452026
PeshawarPeshawar Cantt.3-9, Fakhr-e-Alam Road, Plaza Branch, Peshawar Cantt. PABX: (091) 9212433-6 Direct: (091) 271653 Fax: (091) 5276391
Peshawar CityBank Square, Chowk Yadgar, Peshawar. PABX: (091) 2561246-7 Direct: (091) 2560156 Fax: (091) 2561245
University RoadBlock B, Al Haaj Tower, Jahangirabad, University Road, Peshawar PABX: (091) 9218587-90 Direct: (091) 9218594 Fax: (091) 9218591
(Sub-Branch)Risalpur, Shop No. 105, 106 & 107, Cantt Plaza, Gate No. 4, Risalpur Cantt, Tehsil & Distt Nowshera.Direct: 0923-631652, (0321) 9762340
196
AREA –AZAD KASHMIR
Mirpur (AK)Plot No. 629-B, Jabeer Tower, Bank Square Nangi, Mirpur, Azad KashmirPABX: (05827) 445450 - 2Direct: (05827) 448393Fax: (05827) 448394
Muzafarabad (AK)Main Secretariat Road, Muzafarabad, AJ&K.PABX: (05822) 920480 & 920487Direct: (05822) 920486Fax: (05822) 920484
Dadyal (AK)City Centre, Main Bazar, Dadyal, AJ&K.PABX: (05827) 446502-03Direct: (05827) 456607Fax: (05827) 465605
Chaksawari (AK)Shahzad Hotel, Kotli Road, Chaksawari, AJ&KPABX: (05827) 454735-36Direct: (05827) 45470Fax: (05827) 454737
Jatlan (AK)Main Bazar, Jatlan, Azad Kashmir.PABX: (05827) 404346-47 Direct: (05827) 404351Fax: (05827) 404348
JhelumPlot No. 225 & 226, Kohinoor Plaza,Old G.T. Road, Jhelum Cantt.PABX: (0544) 720053-55Direct: (0544) 720051Fax: (0544) 720060
KharianRaza Building, Main G.T. Road, Kharian.PABX: (053) 9240235-7Direct: (053) 9240134Fax: (053) 7536288
Mangla Cantt.Ground Floor, Community Centre, Adjacent Military Check Post, Mangla Road, Mangla.PABX: (0544) 639504-5Direct: (0544) 639502Fax: (0544) 639506
(Sub-Branch)Chowk Shaheedan, MirpurPlot No. 51-B, Nathia Building, Chowk Shaheedan, Mirpur, Azad Kashmir.Direct: (05827) 435247PABX: (05827) 435248Fax: (05827) 435429
CENTRAL REGION
LAHORE-I – AREA
LahoreAllama Iqbal Town, 14-Pak Block, Lahore.PABX: (042) 37494923-7Dir: (042) 37494922Fax: (042) 37494924
Gulberg10-E/II, Main BoulevardGulberg-III, Lahore.PABX: (042) 99231336-37Dir: (042) 99231330Fax: (042) 99230035
Main Market, Gulberg-II 32-E, Main MarketGulberg-II, Lahore.PABX: (042) 99268026-27Dir: (042) 99268023Fax: (042) 99268025
Cavalry Ground2nd Floor, 23-Commercial Area,Cavalry Ground, Lahore.PABX: (042) 36610563-6Dir: (042) 36676949Fax: (042) 36610562
DHA-I324-Z, Phase-II,DHA, Lahore.PABX: (042) 9264151-5Dir: (042) 9264158Fax: (042) 9264150
DHA-II63-T Block, CCA, Phase-II,DHA, Lahore.PABX: (042) 35707558-59Dir: (042) 35707556Fax: (042) 35707563
Model Town2-4, Central Commercial Market,Model Town, Lahore. PABX: (042) 5850575-6Dir: (042) 5915494Fax: (042) 5858564
Qartaba Chowk100-D, Lytton Road, Near Qartaba Chowk, Mozang, Lahore.PABX: (042) 37314500-5Dir: (042) 37314502Fax: (042) 37314555
Tufail Road12-Tufail Road,Lahore Cantt.PABX: (042) 99220940-45Dir: (042) 99220930Fax: (042) 99220946-47
Zarar Shaheed Road6-Block-B, Guldasht Town,Zarrar Shaheed Road, Lahore.PABX: (042) 36632941-43Dir: (042) 36632945Fax: (042) 36632944
DHA-V41-CCA, (Central Commercial Area),Phase-V, DHA, Lahore.PABX: (042) 36183097Dir: (042) 36183095Fax: (042) 36183099
M. A Johar Town473-Block G-III,M.A Johar Town, Lahore.PABX: (042) 35290434-6Dir: (042) 35290440Fax: (042) 35313569
LAHORE-II – AREA
LahoreBadami Bagh165-B, Badami Bagh, Lahore.PABX: (042) 37727601-2Dir: (042) 37721318Fax: (042) 37704775
Circular Road77-Circular Road, Lahore.PABX: (042) 37635920-22Dir: (042) 37633702 & 37633694Fax: (042) 37635919
Shad BaghChowk Nakhuda, Umar Din Road,Wassanpura, Shad Bagh, Lahore.PABX: (042) 7289430 & 7285343Dir: (042) 7604071Fax: (042) 6264225
Shah Alam5-C, Fawara Chowk,Shah Alam Market, Lahore.PABX: (042) 7642652-54Dir: (042) 7642650Fax: (042) 7642656
Ravi Road35-Main Ravi Road, Lahore.PABX: (042) 7709873-4 & 7700516Dir: (042) 7731000Fax: (042) 7700517
Shahrah-e-Aiwan-e-Tijarat7-A, Shahrah-e-Aiwan-e-Tijarat,Lahore.PABX: (042) 9203673-7Dir: (042) 9203081Fax: (042) 9203351
ShahdaraOpp. Darbar Allahoo Sheikhupura,Shahdara, Lahore.PABX: (042) 7919302-04Dir: (042) 7919300Fax: (042) 7919306
Urdu Bazar6-Chatterjee Road, Faqir Plaza,Urdu Bazar, Lahore.PABX: (042) 7247762-5Dir: (042) 7247771Fax: (042) 7247766
Baghbanpura6/7, Shalimar Link Road,Baghbanpura, Lahore.PABX: (042) 6830361-63 Dir: (042) 6830360Fax: (042) 6830367
Town Ship48/10, B-I, Akbar Chowk,Township, Lahore.PABX: (042) 99262031-33Dir: (042) 99262035Fax: (042) 5124221
Bank Square, The Mall47, Bank Square, The Mall,(Shahrah-e-Quaid-e-Azam) LahorePABX: (042) 7211851-55Dir: (042) 7314196 & 7211860Fax: (042) 7211865
Branch Network
197
SAHIWAL – AREA
OKARAM.A Jinnah Road, Chak # 2/42, M.A Jinnah Road, Tehsil & District, Okara.PABX: (044) 99200317-8Dir: (044) 2550002Fax: (044) 99200316
Okara Cantt117-D, Shahrah-e-Quaid-e-Azam,Civil Area, Okara Cantt.PABX: (044) 2880358-9Dir: (044) 2881644Fax: (044) 2881740
DepalpurKatchey Road, DepalpurDistrict Okara.PABX: (044) 4541543-4Dir: (044) 4541541Fax: (044) 4541545
Burewala95/1 C, College Road,Burewala,PABX: (067) 3772206-8Dir: (067) 3772252Fax: (042) 3772204
Vehari13, E Block, Karkhana Bazar, Vehari.PABX: (067) 3366718-9Direct: (067) 3360727Fax: (067) 3366720
Sahiwal48/B-I, High Street, Sahiwal.PABX: (040) 4467738-39Dir: (040) 4467748Fax: (040) 4467746
Phool NagarPlot Khasra # 1193, Main Multan Road,District Kasur, Phool Nagar.PABX: (049) 4510437Dir: (049) 4510431Fax: (049) 4510436
KhanewalDAHA Plaza, Chowk Markazi,Khanewal.PABX: (065) 9200971-74Dir: (065) 9200277Fax: (065) 9200273
FAISALABAD - AREA
JhangChurch Road, Saddar, Jhang.PABX: (047) 9200383-4Dir: (047) 9200380Fax: (047) 9200385
KhurrianwalaJhumra Road, Khurrianwala, Tehsil Jaranwala, District Faisalabad.PABX: (041) 4364029, 4363229Dir: (041) 4000029Fax: (041) 4364030
Sargodha80-Club Road, Old Civil Lines,Sargodha.PABX: (048) 3725490, 3725590Dir: (048) 3722728, 3768410Fax: (048) 3725240
Toba Tek Singh596-Mohallah Chamra Mandi,Jhang Road, Toba Tek Singh.PABX: (046) 2516120-21Dir: (046) 2516131Fax: (046) 2516142
Satayana Road,585-I, Block-B, Peoples Colony # 1,Satayana Road, Faisalabad.PABX: (041) 8559205-7Dir: (041) 8559101Fax: (041) 8559204
ChiniotChah Dargahi Wala,Chiniot # 2, Chiniot.PABX: (047) 6336377-8Dir: (047) 6336277Fax: (047) 6336279
Pir MahalRajana Road, Pir Mahal,District Toba Tek Singh.PABX: (046) 3366282-3Dir: (046) 3366280Fax: (046) 3366284
BhalwalLiaqat Shaheed Road, Bhalwal.PABX: (048) 6644695-6Dir: (048) 6644693Fax: (048) 6644699
Dijkot Chak # 263 RB, Faisalabad Road,Dijkot, District Faisalabad.PABX: (041) 2672287Dir: (041) 2672285Fax: (041) 2672288
FaisalabadPeoples Colony, Faisalabad.PABX: (041) 8739326-8Dir: (041) 8739323Fax: (041) 8739321
University Road, Faisalabad.PABX: (041) 9201008-11Dir: (041) 9201001Fax: (041) 9201006-7
GUJRANWALA – AREA
Jalalpur Bhattian Ghalla Mandi, Jalalpur Bhattian.PABX: (0547) 501013-14Dir: (0547) 501012Fax: (0547) 501015
LalamusaG. T Road, Lalamusa.PABX: (0537) 519690-91Dir: (0537) 519694Fax: (0537) 519693
Mandi BahauddinDr. Sakina Rizvi Road, Mandi Bahauddin.PABX: (0546) 600385-86Dir: (0546) 600728Fax: (0546) 6816083
SialkotParis Road, Sialkot.P. O Box # 2890.PABX: (052) 4262806-8Dir: (052) 9250672Fax: (052) 4265532
Sialkot Cantt.Tariq Road, Sialkot Cantt.PABX: (052) 4299001-3Dir: (052) 4299005Fax: (052) 4299004
SheikhupuraProperty # B-IX-6S-44,Main Lahore, Sargodha Road, Sheikhupura.PABX: (056) 3788031 & 3788071Dir: (056) 3788037Fax: (056) 3788084
DaskaRest House Chowk, Gujranwala Road,Daska, District Sialkot.PABX: (052) 6615815- 7Dir: (052) 6613634Fax: (052) 6615842
KamonkeG. T Road, Kamonke.PABX: (055) 6816080-82Dir: (055) 6816078Fax: (055) 6816083
GujranwalaG. T Road, Gujranwala.PABX: (055) 9200855-56 (055) 9200861-62Dir: (055) 9200857Fax: (055) 9200858
Gujranwala Cantt.Kent Plaza, Quaid-e-Azam Avenue, PABX: (055) 3865371-72Dir: (055) 3865988Fax: (055) 3865994
GujratHassan Plaza,G.T. Road, Gujrat.PABX: (053) 3530164-65Dir: (053) 3530178Fax: (053) 3530179
MULTAN – AREA
HasilpurBaldia Road, Hasilpur.PABX: (062) 2448030-2Dir: (062) 2448002Fax: (062) 2448035
MultanAbdali Road64/A-1, Abdali Road, Multan.PABX: (061) 9201391-94Dir: (061) 9201399Fax: (061) 9201395
198
Bosan Road MultanPlot # 23, Near Multan LawCollege, Bosan Road, Multan.PABX: (061) 6510435-7Dir: (061) 6510434Fax: (061) 6510438
Rahim Yar KhanAshraf Complex, Model Town,Rahim Yar Khan.PABX: (068) 5879851-3Dir: (068) 5879848Fax: (068) 5879850
Sadiqabad78-D, Allama Iqbal Road, New Town, Sadiqabad.PABX: (068) 5802377-78Dir: (068) 5802387Fax: (068) 5802374
Dera Ghazi KhanJampur Road, Dera Ghazi Khan.PABX: (064) 9260669-70Dir: (064) 9260675Fax: (064) 9260674
Chowk Azam LayyahMohallah Aiwan Colony, Chowk Azam,Tehsil & District LayyahPABX: (0606) 380112-3Dir: (0606) 372321Fax: (0606) 380114
Bahawalpur1-Noor Mahal Road, Bahawalpur.PABX: (062) 9255320-22Dir: (062) 9255325Fax: (062) 9255324
Channi GothUCH Road, Channi Goth, Tehsil AhmadpurEast, District Bahawalpur.PABX: (062) 2783008-9Dir: (062) 2783444Fax: (062) 2783010
Vehari44-48 Multan Commercial Centre, Vehari. PABX: (061) 6241001-2Dir: (061) 6241907Fax: (061) 6241003
Dera Ghazi Khan (Sub-Branch)Shop # 1-2, Main Shoping Complex, Dera Ghazi Khan Cantonment, Dera Ghazi Khan.PABX: (0606) 380112-3Dir: (0606) 372321Fax: (0606) 380114
SOUTH REGION
KARACHI-I – AREA
Cloth Cloth MarketLaxmidas Street, Karachi,PABX: (021) 32472611-5Direct: (021) 32472607Fax: (021) 32472605
Jodia BazarAbdullah Mansion, Bombay Bazar,Jodia Bazar, Karachi.PABX: (021) 32474851-55Direct: (021) 32473498Fax: (021) 32471224
M.A. Jinnah RoadSurvey No. 4, Sheet No. RB-7, Aram Bagh Quarters,M.A. Jinnah Road, Karachi.PABX: (021) 32217531-34Direct: (021) 32217490Fax: (021) 32217494
Marriot RoadRawalpindiwala Building,Marriot Road, Market Quarters, Karachi.PABX: (021) 32418425-28Direct: (021) 32418420Fax: (021) 32418429
New ChalliAbdullah Square Building,Shahrah-e-Liaquat, New Challi, Karachi. PABX: (021) 32471042-44Direct: (021) 32471021Fax: (021) 32471023
North Napier RoadIshaq Chamber, North Napier Road, Karachi.PABX: (021) 32549581-2Direct: (021) 32549588Fax: (021) 32549585
Saima Trade TowerI.I. Chundrigar Road, Karachi.P.O. Box 1096.PABX: (021) 32630731-4,(021) 32624316, 32634610Direct: (021) 32624714, 32631178Fax: (021) 32631176
Timber MarketPlot No. LA-7/116,Siddiq Wahab Road, Timber Market, Lawrence Quarters, Karachi.PABX: (021) 32770784-85, 32770737Direct: (021) 32770800Fax: (021) 32770055
Karachi Stock ExchangeOffice No. 55 & 56,Old Stock Exchange Building, Karachi.PABX: (021) 32446050-51, 32446053-54Direct: (021) 32446550Fax: (021) 32446559
Paper MarketPlot No. 21, Frere Road, Shahrah-e-Liaquat, Serai Quarter, Karachi.PABX: (021) 32600909-11 Direct: (021) 32600901Fax: (021) 32600912
KARACHI-II – AREA
Badar Commercial Area29-C, Badar Commercial Area,Street No. 1, Phase-V, DHA, Karachi-75500.PABX: (021) 35344175-77Direct: (021) 35344171Fax: (021) 35344174
CliftonMarine Trade Centre, Block-9, Clifton, Karachi. P.O. Box 13807.PABX: (021) 35868551-4 & 35832916Direct: (021) 35862868Fax: (021) 35868555
Khayaban-e-Ittehahad, DHAPlot No. 25-C, Khayaban-e-Ittehad, Phase-II Extension, Defence HousingAuthority (DHA), Karachi.PABX: (021) 35387491-2 (021) 35384902-5 Direct: (021) 35387493Fax: (021) 35387814
Korangi Industrial AreaPlot No. ST 2/3, Sector 23,Main Korangi Road,Korangi Industrial Area, Karachi.PABX: (021) 35115024-25Direct: (021) 35115020Fax: (021) 35115027
SaddarSindh Small Industries Building, Regal Chowk, Saddar, Karachi.PABX: (021) 32762840-2, 32741396-7Direct: (021) 32760506Fax: (021) 32760992
Khayaban-e-SeharPlot No. 2C, Sehar Lane No. 04, Khayaban-e-Sehar, DHA Phase-VII, Karachi.PABX: (021) 35847012-13, 35847012-1 (021) 35847251 – 52Direct: (021) 35847446Fax: (021) 35847022
DHA Phase-IV 9th Commercial Street, DHA Phase-IV, Karachi.PABX: (021) 35313055-58 Direct: (021) 35313091Fax: (021) 35313059
Bismillah Chowrangi, KorangiR-01, Sector No. 36 E, Bismillah Chowrangi, Area 5 D, Korangi No. 06, Karachi. PABX: (021) 35049330-31 Direct: (021) 35049210Fax: (021) 35049352
Khayban-e-Bokhari, DHA Phase – VI43-C, Khayaban-e-Bokhari, DHA Phase-VI, Karachi. PABX: (021) 35242747-50 Direct: (021) 35242745Fax: (021) 35242754
(Sub-Branch)PTA, Korangi, ST. 7, 7-A, Sector Pakistan Tanners Association, Korangi Industrial Area, Karachi.Direct: (021) 35116120Fax: (021) 35116121
KARACHI-III – AREA
Atrium Mall249- Staff Lines,Fatima Jinnah Road, Karachi.PABX: (021) 35650953, 35651046,(021) 35651048, 35651091Direct: (021) 35650940Fax: (021) 35651207
Branch Network
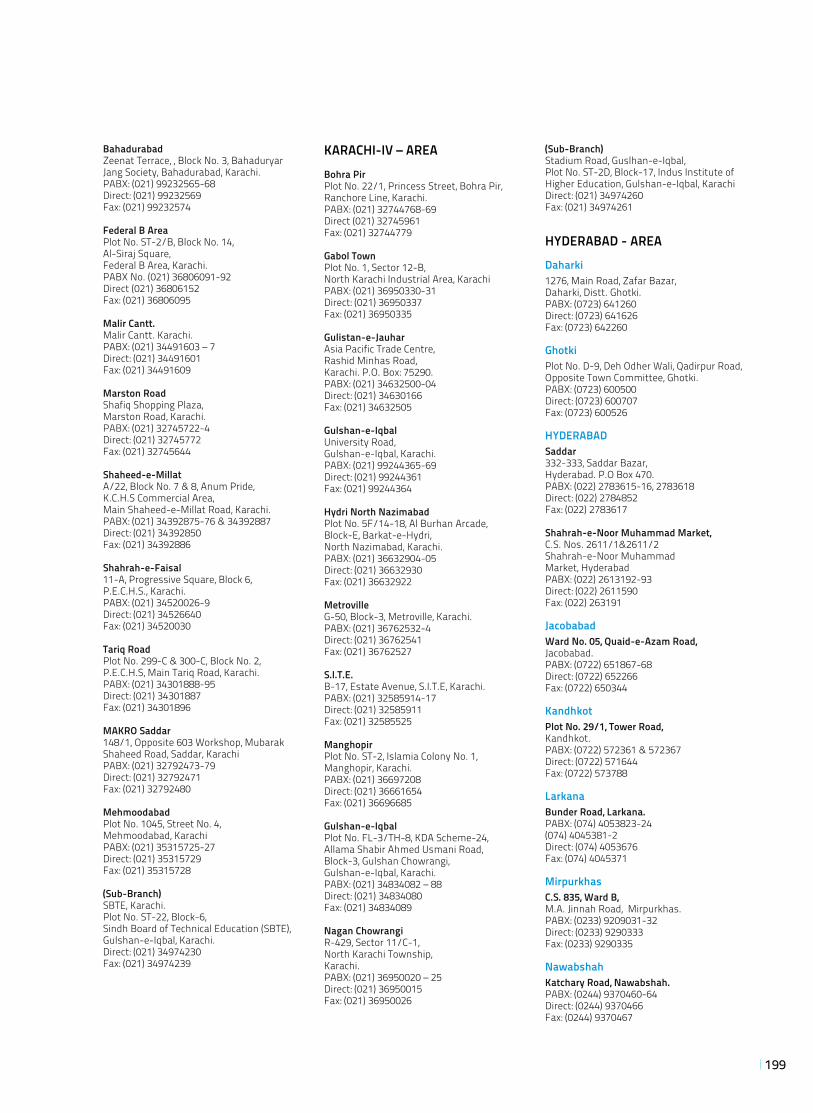
199
BahadurabadZeenat Terrace, , Block No. 3, Bahaduryar Jang Society, Bahadurabad, Karachi.PABX: (021) 99232565-68Direct: (021) 99232569Fax: (021) 99232574
Federal B AreaPlot No. ST-2/B, Block No. 14, Al-Siraj Square,Federal B Area, Karachi.PABX No. (021) 36806091-92Direct (021) 36806152Fax: (021) 36806095
Malir Cantt.Malir Cantt. Karachi.PABX: (021) 34491603 – 7 Direct: (021) 34491601Fax: (021) 34491609
Marston RoadShafiq Shopping Plaza,Marston Road, Karachi.PABX: (021) 32745722-4Direct: (021) 32745772Fax: (021) 32745644
Shaheed-e-MillatA/22, Block No. 7 & 8, Anum Pride, K.C.H.S Commercial Area, Main Shaheed-e-Millat Road, Karachi.PABX: (021) 34392875-76 & 34392887Direct: (021) 34392850Fax: (021) 34392886
Shahrah-e-Faisal11-A, Progressive Square, Block 6, P.E.C.H.S., Karachi.PABX: (021) 34520026-9Direct: (021) 34526640Fax: (021) 34520030
Tariq RoadPlot No. 299-C & 300-C, Block No. 2, P.E.C.H.S, Main Tariq Road, Karachi.PABX: (021) 34301888-95 Direct: (021) 34301887Fax: (021) 34301896
MAKRO Saddar148/1, Opposite 603 Workshop, Mubarak Shaheed Road, Saddar, Karachi PABX: (021) 32792473-79 Direct: (021) 32792471Fax: (021) 32792480
Mehmoodabad Plot No. 1045, Street No. 4, Mehmoodabad, Karachi PABX: (021) 35315725-27 Direct: (021) 35315729Fax: (021) 35315728
(Sub-Branch)SBTE, Karachi. Plot No. ST-22, Block-6, Sindh Board of Technical Education (SBTE), Gulshan-e-Iqbal, Karachi.Direct: (021) 34974230Fax: (021) 34974239
KARACHI-IV – AREA
Bohra PirPlot No. 22/1, Princess Street, Bohra Pir, Ranchore Line, Karachi.PABX: (021) 32744768-69Direct (021) 32745961Fax: (021) 32744779
Gabol TownPlot No. 1, Sector 12-B,North Karachi Industrial Area, KarachiPABX: (021) 36950330-31Direct: (021) 36950337Fax: (021) 36950335
Gulistan-e-JauharAsia Pacific Trade Centre,Rashid Minhas Road,Karachi. P.O. Box: 75290.PABX: (021) 34632500-04Direct: (021) 34630166Fax: (021) 34632505
Gulshan-e-IqbalUniversity Road,Gulshan-e-Iqbal, Karachi.PABX: (021) 99244365-69Direct: (021) 99244361Fax: (021) 99244364
Hydri North NazimabadPlot No. 5F/14-18, Al Burhan Arcade, Block-E, Barkat-e-Hydri, North Nazimabad, Karachi.PABX: (021) 36632904-05Direct: (021) 36632930Fax: (021) 36632922
MetrovilleG-50, Block-3, Metroville, Karachi.PABX: (021) 36762532-4Direct: (021) 36762541Fax: (021) 36762527
S.I.T.E.B-17, Estate Avenue, S.I.T.E, Karachi.PABX: (021) 32585914-17Direct: (021) 32585911Fax: (021) 32585525
ManghopirPlot No. ST-2, Islamia Colony No. 1, Manghopir, Karachi.PABX: (021) 36697208 Direct: (021) 36661654Fax: (021) 36696685
Gulshan-e-IqbalPlot No. FL-3/TH-8, KDA Scheme-24, Allama Shabir Ahmed Usmani Road, Block-3, Gulshan Chowrangi, Gulshan-e-Iqbal, Karachi.PABX: (021) 34834082 – 88 Direct: (021) 34834080Fax: (021) 34834089
Nagan ChowrangiR-429, Sector 11/C-1, North Karachi Township, Karachi.PABX: (021) 36950020 – 25 Direct: (021) 36950015Fax: (021) 36950026
(Sub-Branch)Stadium Road, Guslhan-e-Iqbal,Plot No. ST-2D, Block-17, Indus Institute of Higher Education, Gulshan-e-Iqbal, Karachi Direct: (021) 34974260Fax: (021) 34974261
HYDERABAD - AREA
Daharki1276, Main Road, Zafar Bazar,Daharki, Distt. Ghotki.PABX: (0723) 641260Direct: (0723) 641626Fax: (0723) 642260
GhotkiPlot No. D-9, Deh Odher Wali, Qadirpur Road,Opposite Town Committee, Ghotki.PABX: (0723) 600500Direct: (0723) 600707Fax: (0723) 600526
HYDERABADSaddar 332-333, Saddar Bazar, Hyderabad. P.O Box 470.PABX: (022) 2783615-16, 2783618Direct: (022) 2784852Fax: (022) 2783617
Shahrah-e-Noor Muhammad Market, C.S. Nos. 2611/1&2611/2Shahrah-e-Noor Muhammad Market, HyderabadPABX: (022) 2613192-93Direct: (022) 2611590Fax: (022) 263191
JacobabadWard No. 05, Quaid-e-Azam Road, Jacobabad.PABX: (0722) 651867-68Direct: (0722) 652266Fax: (0722) 650344
KandhkotPlot No. 29/1, Tower Road,Kandhkot.PABX: (0722) 572361 & 572367Direct: (0722) 571644Fax: (0722) 573788
LarkanaBunder Road, Larkana.PABX: (074) 4053823-24(074) 4045381-2Direct: (074) 4053676Fax: (074) 4045371
MirpurkhasC.S. 835, Ward B, M.A. Jinnah Road, Mirpurkhas.PABX: (0233) 9209031-32Direct: (0233) 9290333Fax: (0233) 9290335
NawabshahKatchary Road, Nawabshah.PABX: (0244) 9370460-64Direct: (0244) 9370466Fax: (0244) 9370467
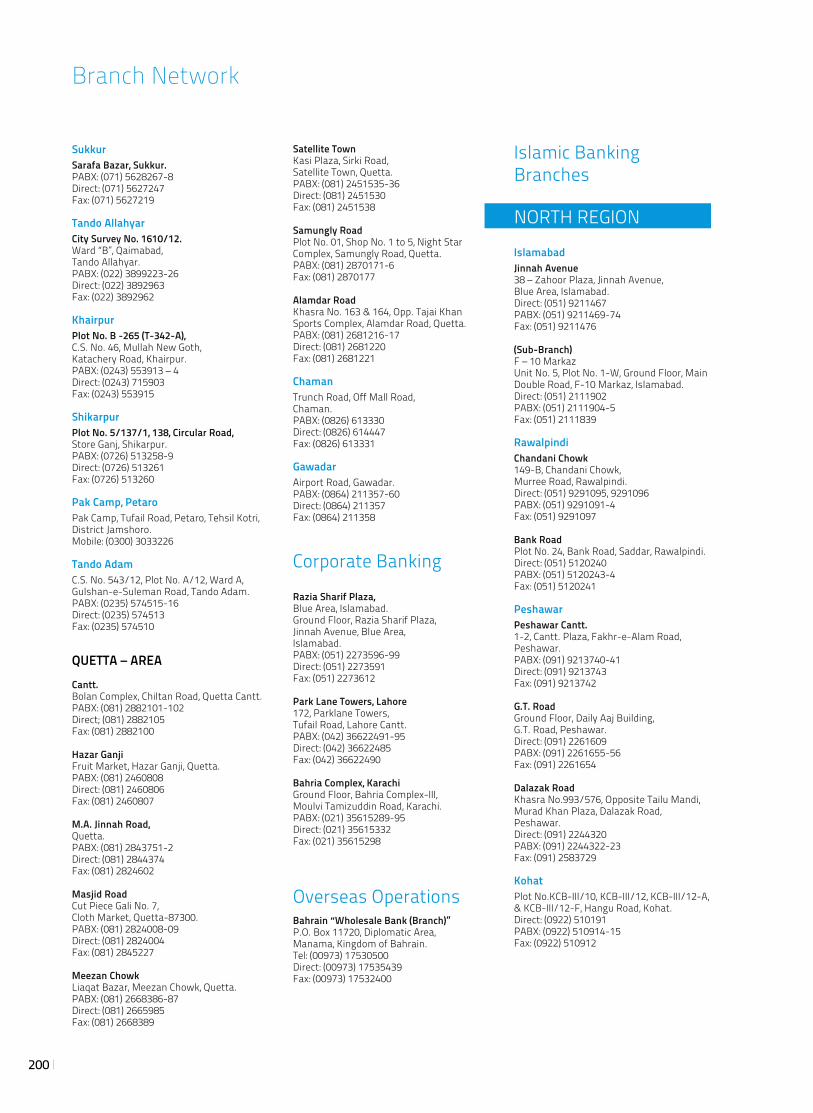
200
SukkurSarafa Bazar, Sukkur.PABX: (071) 5628267-8Direct: (071) 5627247Fax: (071) 5627219
Tando AllahyarCity Survey No. 1610/12.Ward “B”, Qaimabad, Tando Allahyar.PABX: (022) 3899223-26 Direct: (022) 3892963Fax: (022) 3892962
KhairpurPlot No. B -265 (T-342-A),C.S. No. 46, Mullah New Goth, Katachery Road, Khairpur.PABX: (0243) 553913 – 4 Direct: (0243) 715903Fax: (0243) 553915
ShikarpurPlot No. 5/137/1, 138, Circular Road, Store Ganj, Shikarpur.PABX: (0726) 513258-9 Direct: (0726) 513261Fax: (0726) 513260
Pak Camp, PetaroPak Camp, Tufail Road, Petaro, Tehsil Kotri, District Jamshoro.Mobile: (0300) 3033226
Tando AdamC.S. No. 543/12, Plot No. A/12, Ward A, Gulshan-e-Suleman Road, Tando Adam.PABX: (0235) 574515-16 Direct: (0235) 574513Fax: (0235) 574510
QUETTA – AREA
Cantt.Bolan Complex, Chiltan Road, Quetta Cantt.PABX: (081) 2882101-102Direct; (081) 2882105Fax: (081) 2882100
Hazar GanjiFruit Market, Hazar Ganji, Quetta.PABX: (081) 2460808Direct: (081) 2460806Fax: (081) 2460807
M.A. Jinnah Road,Quetta.PABX: (081) 2843751-2Direct: (081) 2844374Fax: (081) 2824602
Masjid RoadCut Piece Gali No. 7,Cloth Market, Quetta-87300.PABX: (081) 2824008-09Direct: (081) 2824004Fax: (081) 2845227
Meezan ChowkLiaqat Bazar, Meezan Chowk, Quetta.PABX: (081) 2668386-87Direct: (081) 2665985Fax: (081) 2668389
Satellite TownKasi Plaza, Sirki Road,Satellite Town, Quetta.PABX: (081) 2451535-36Direct: (081) 2451530Fax: (081) 2451538
Samungly RoadPlot No. 01, Shop No. 1 to 5, Night Star Complex, Samungly Road, Quetta.PABX: (081) 2870171-6Fax: (081) 2870177
Alamdar RoadKhasra No. 163 & 164, Opp. Tajai Khan Sports Complex, Alamdar Road, Quetta.PABX: (081) 2681216-17Direct: (081) 2681220Fax: (081) 2681221
ChamanTrunch Road, Off Mall Road,Chaman.PABX: (0826) 613330Direct: (0826) 614447Fax: (0826) 613331
GawadarAirport Road, Gawadar.PABX: (0864) 211357-60Direct: (0864) 211357Fax: (0864) 211358
Corporate Banking
Razia Sharif Plaza,Blue Area, Islamabad.Ground Floor, Razia Sharif Plaza, Jinnah Avenue, Blue Area,Islamabad.PABX: (051) 2273596-99Direct: (051) 2273591Fax: (051) 2273612
Park Lane Towers, Lahore172, Parklane Towers, Tufail Road, Lahore Cantt.PABX: (042) 36622491-95Direct: (042) 36622485Fax: (042) 36622490
Bahria Complex, KarachiGround Floor, Bahria Complex-III,Moulvi Tamizuddin Road, Karachi.PABX: (021) 35615289-95Direct: (021) 35615332Fax: (021) 35615298
Overseas OperationsBahrain “Wholesale Bank (Branch)”P.O. Box 11720, Diplomatic Area, Manama, Kingdom of Bahrain.Tel: (00973) 17530500Direct: (00973) 17535439Fax: (00973) 17532400
Islamic Banking Branches
NORTH REGION
IslamabadJinnah Avenue38 – Zahoor Plaza, Jinnah Avenue, Blue Area, Islamabad.Direct: (051) 9211467PABX: (051) 9211469-74Fax: (051) 9211476
(Sub-Branch)F – 10 MarkazUnit No. 5, Plot No. 1-W, Ground Floor, Main Double Road, F-10 Markaz, Islamabad.Direct: (051) 2111902PABX: (051) 2111904-5Fax: (051) 2111839
RawalpindiChandani Chowk149-B, Chandani Chowk,Murree Road, Rawalpindi.Direct: (051) 9291095, 9291096PABX: (051) 9291091-4Fax: (051) 9291097
Bank RoadPlot No. 24, Bank Road, Saddar, Rawalpindi.Direct: (051) 5120240PABX: (051) 5120243-4Fax: (051) 5120241
PeshawarPeshawar Cantt.1-2, Cantt. Plaza, Fakhr-e-Alam Road, Peshawar.PABX: (091) 9213740-41Direct: (091) 9213743Fax: (091) 9213742
G.T. RoadGround Floor, Daily Aaj Building, G.T. Road, Peshawar.Direct: (091) 2261609PABX: (091) 2261655-56 Fax: (091) 2261654
Dalazak RoadKhasra No.993/576, Opposite Tailu Mandi, Murad Khan Plaza, Dalazak Road,Peshawar.Direct: (091) 2244320PABX: (091) 2244322-23 Fax: (091) 2583729
KohatPlot No.KCB-III/10, KCB-III/12, KCB-III/12-A, & KCB-III/12-F, Hangu Road, Kohat.Direct: (0922) 510191PABX: (0922) 510914-15Fax: (0922) 510912
Branch Network
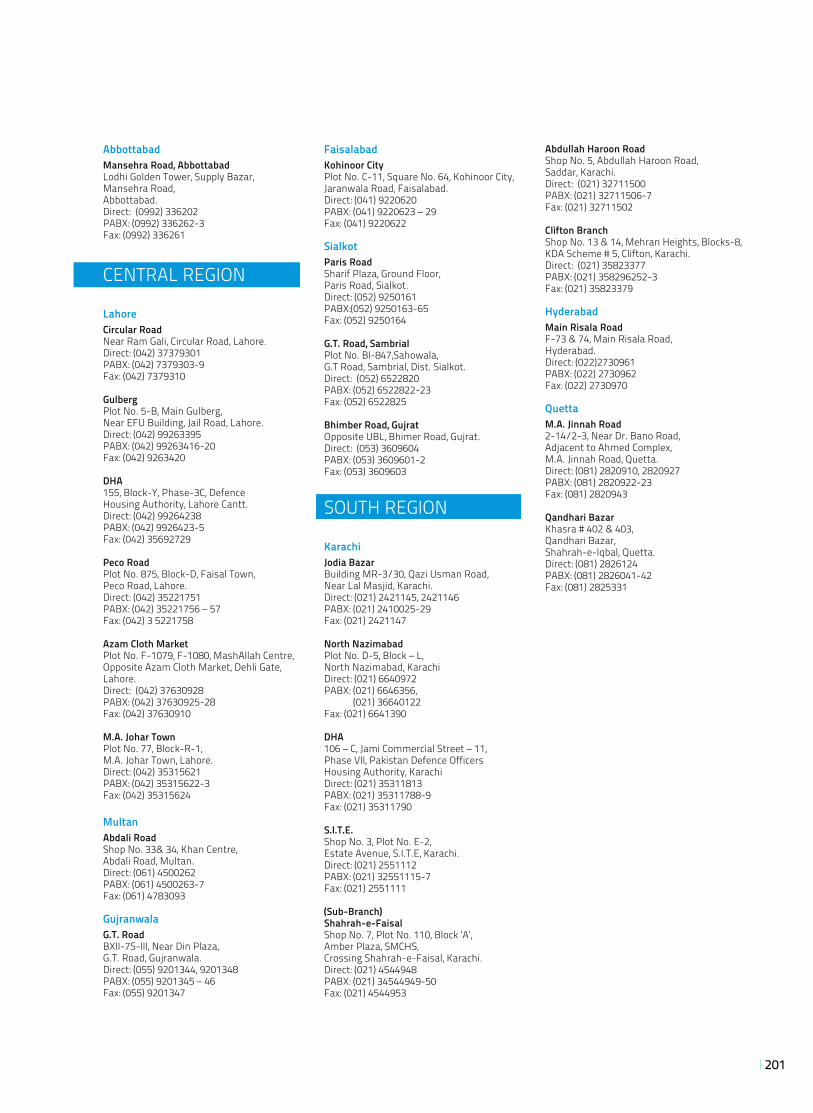
201
AbbottabadMansehra Road, AbbottabadLodhi Golden Tower, Supply Bazar, Mansehra Road,Abbottabad.Direct: (0992) 336202PABX: (0992) 336262-3 Fax: (0992) 336261
CENTRAL REGION
LahoreCircular RoadNear Ram Gali, Circular Road, Lahore.Direct: (042) 37379301PABX: (042) 7379303-9 Fax: (042) 7379310
GulbergPlot No. 5-B, Main Gulberg,Near EFU Building, Jail Road, Lahore.Direct: (042) 99263395PABX: (042) 99263416-20 Fax: (042) 9263420
DHA155, Block-Y, Phase-3C, Defence Housing Authority, Lahore Cantt.Direct: (042) 99264238PABX: (042) 9926423-5Fax: (042) 35692729
Peco RoadPlot No. 875, Block-D, Faisal Town, Peco Road, Lahore.Direct: (042) 35221751PABX: (042) 35221756 – 57 Fax: (042) 3 5221758
Azam Cloth MarketPlot No. F-1079, F-1080, MashAllah Centre, Opposite Azam Cloth Market, Dehli Gate, Lahore.Direct: (042) 37630928PABX: (042) 37630925-28Fax: (042) 37630910
M.A. Johar TownPlot No. 77, Block-R-1, M.A. Johar Town, Lahore.Direct: (042) 35315621PABX: (042) 35315622-3 Fax: (042) 35315624
MultanAbdali RoadShop No. 33& 34, Khan Centre, Abdali Road, Multan.Direct: (061) 4500262PABX: (061) 4500263-7Fax: (061) 4783093
GujranwalaG.T. RoadBXII-7S-III, Near Din Plaza, G.T. Road, Gujranwala.Direct: (055) 9201344, 9201348PABX: (055) 9201345 – 46 Fax: (055) 9201347
FaisalabadKohinoor CityPlot No. C-11, Square No. 64, Kohinoor City, Jaranwala Road, Faisalabad.Direct: (041) 9220620PABX: (041) 9220623 – 29 Fax: (041) 9220622
SialkotParis RoadSharif Plaza, Ground Floor, Paris Road, Sialkot.Direct: (052) 9250161PABX:(052) 9250163-65Fax: (052) 9250164
G.T. Road, SambrialPlot No. BI-847,Sahowala, G.T Road, Sambrial, Dist. Sialkot.Direct: (052) 6522820PABX: (052) 6522822-23 Fax: (052) 6522825
Bhimber Road, GujratOpposite UBL, Bhimer Road, Gujrat.Direct: (053) 3609604PABX: (053) 3609601-2 Fax: (053) 3609603
SOUTH REGION
KarachiJodia BazarBuilding MR-3/30, Qazi Usman Road,Near Lal Masjid, Karachi.Direct: (021) 2421145, 2421146PABX: (021) 2410025-29Fax: (021) 2421147
North NazimabadPlot No. D-5, Block – L,North Nazimabad, KarachiDirect: (021) 6640972PABX: (021) 6646356, (021) 36640122Fax: (021) 6641390
DHA106 – C, Jami Commercial Street – 11, Phase VII, Pakistan Defence Officers Housing Authority, KarachiDirect: (021) 35311813PABX: (021) 35311788-9Fax: (021) 35311790
S.I.T.E.Shop No. 3, Plot No. E-2, Estate Avenue, S.I.T.E, Karachi.Direct: (021) 2551112PABX: (021) 32551115-7Fax: (021) 2551111
(Sub-Branch)Shahrah-e-FaisalShop No. 7, Plot No. 110, Block ‘A’, Amber Plaza, SMCHS, Crossing Shahrah-e-Faisal, Karachi.Direct: (021) 4544948PABX: (021) 34544949-50Fax: (021) 4544953
Abdullah Haroon RoadShop No. 5, Abdullah Haroon Road,Saddar, Karachi.Direct: (021) 32711500PABX: (021) 32711506-7 Fax: (021) 32711502
Clifton BranchShop No. 13 & 14, Mehran Heights, Blocks-8, KDA Scheme # 5, Clifton, Karachi.Direct: (021) 35823377PABX: (021) 358296252-3 Fax: (021) 35823379
HyderabadMain Risala RoadF-73 & 74, Main Risala Road, Hyderabad.Direct: (022)2730961PABX: (022) 2730962Fax: (022) 2730970
QuettaM.A. Jinnah Road2-14/2-3, Near Dr. Bano Road, Adjacent to Ahmed Complex, M.A. Jinnah Road, Quetta.Direct: (081) 2820910, 2820927PABX: (081) 2820922-23Fax: (081) 2820943
Qandhari BazarKhasra # 402 & 403, Qandhari Bazar, Shahrah-e-Iqbal, Quetta.Direct: (081) 2826124 PABX: (081) 2826041-42Fax: (081) 2825331
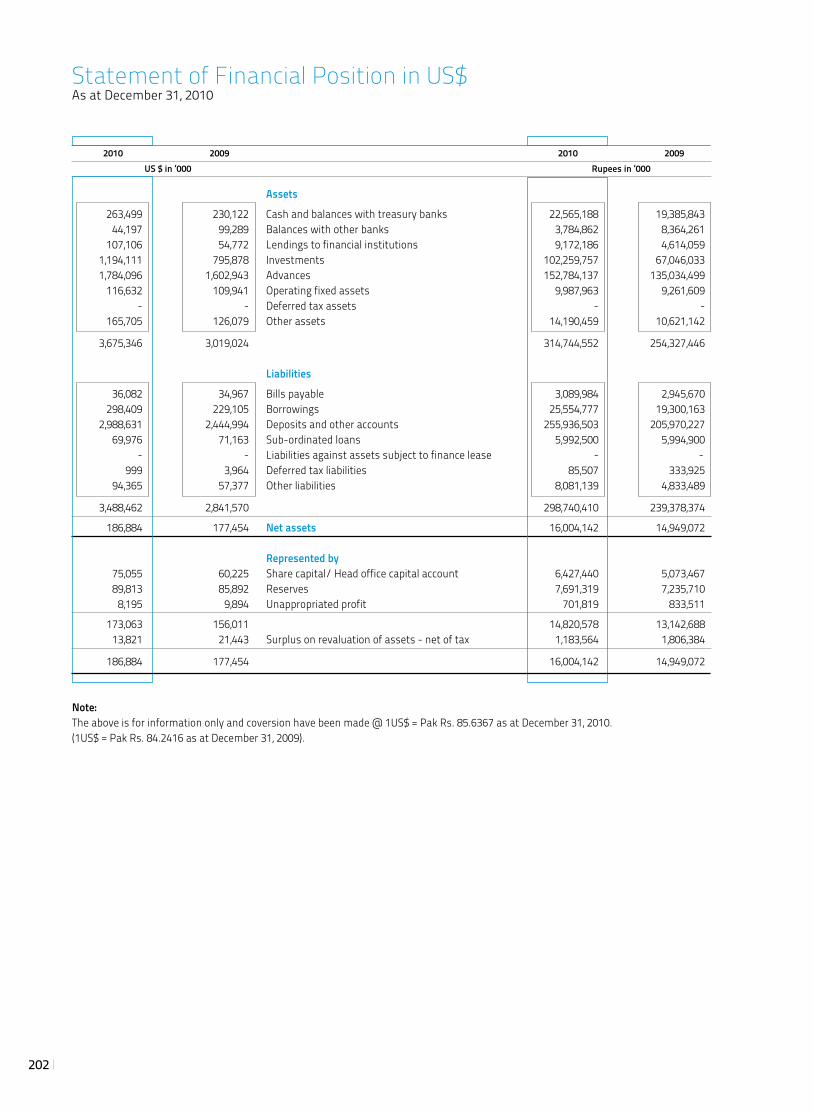
202
2010 2009 2010 2009 US $ in ‘000 Rupees in ‘000
Assets
263,499 230,122 Cash and balances with treasury banks 22,565,188 19,385,843 44,197 99,289 Balances with other banks 3,784,862 8,364,261 107,106 54,772 Lendings to financial institutions 9,172,186 4,614,059 1,194,111 795,878 Investments 102,259,757 67,046,033 1,784,096 1,602,943 Advances 152,784,137 135,034,499 116,632 109,941 Operating fixed assets 9,987,963 9,261,609 - - Deferred tax assets - - 165,705 126,079 Other assets 14,190,459 10,621,142
3,675,346 3,019,024 314,744,552 254,327,446 Liabilities
36,082 34,967 Bills payable 3,089,984 2,945,670 298,409 229,105 Borrowings 25,554,777 19,300,163 2,988,631 2,444,994 Deposits and other accounts 255,936,503 205,970,227 69,976 71,163 Sub-ordinated loans 5,992,500 5,994,900 - - Liabilities against assets subject to finance lease - - 999 3,964 Deferred tax liabilities 85,507 333,925 94,365 57,377 Other liabilities 8,081,139 4,833,489
3,488,462 2,841,570 298,740,410 239,378,374
186,884 177,454 Net assets 16,004,142 14,949,072
Represented by 75,055 60,225 Share capital/ Head office capital account 6,427,440 5,073,467 89,813 85,892 Reserves 7,691,319 7,235,710 8,195 9,894 Unappropriated profit 701,819 833,511
173,063 156,011 14,820,578 13,142,688 13,821 21,443 Surplus on revaluation of assets - net of tax 1,183,564 1,806,384
186,884 177,454 16,004,142 14,949,072
Note:The above is for information only and coversion have been made @ 1US$ = Pak Rs. 85.6367 as at December 31, 2010. (1US$ = Pak Rs. 84.2416 as at December 31, 2009).
Statement of Financial Position in US$As at December 31, 2010
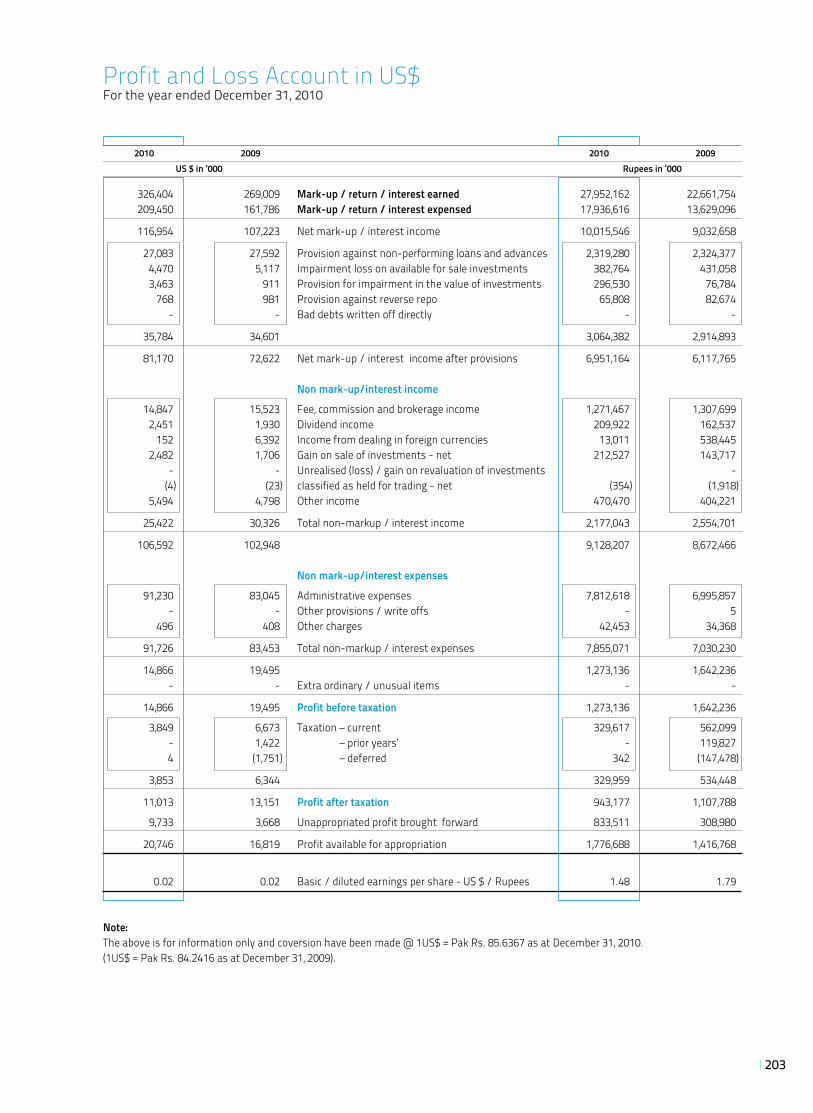
203
2010 2009 2010 2009 US $ in ‘000 Rupees in ‘000
326,404 269,009 Mark-up / return / interest earned 27,952,162 22,661,754 209,450 161,786 Mark-up / return / interest expensed 17,936,616 13,629,096
116,954 107,223 Net mark-up / interest income 10,015,546 9,032,658
27,083 27,592 Provision against non-performing loans and advances 2,319,280 2,324,377 4,470 5,117 Impairment loss on available for sale investments 382,764 431,058 3,463 911 Provision for impairment in the value of investments 296,530 76,784 768 981 Provision against reverse repo 65,808 82,674 - - Bad debts written off directly - -
35,784 34,601 3,064,382 2,914,893
81,170 72,622 Net mark-up / interest income after provisions 6,951,164 6,117,765
Non mark-up/interest income
14,847 15,523 Fee, commission and brokerage income 1,271,467 1,307,699 2,451 1,930 Dividend income 209,922 162,537 152 6,392 Income from dealing in foreign currencies 13,011 538,445 2,482 1,706 Gain on sale of investments - net 212,527 143,717 - - Unrealised (loss) / gain on revaluation of investments - (4) (23) classified as held for trading - net (354) (1,918) 5,494 4,798 Other income 470,470 404,221
25,422 30,326 Total non-markup / interest income 2,177,043 2,554,701
106,592 102,948 9,128,207 8,672,466
Non mark-up/interest expenses
91,230 83,045 Administrative expenses 7,812,618 6,995,857 - - Other provisions / write offs - 5 496 408 Other charges 42,453 34,368
91,726 83,453 Total non-markup / interest expenses 7,855,071 7,030,230
14,866 19,495 1,273,136 1,642,236 - - Extra ordinary / unusual items - -
14,866 19,495 Profit before taxation 1,273,136 1,642,236
3,849 6,673 Taxation – current 329,617 562,099 - 1,422 – prior years’ - 119,827 4 (1,751) – deferred 342 (147,478)
3,853 6,344 329,959 534,448
11,013 13,151 Profit after taxation 943,177 1,107,788
9,733 3,668 Unappropriated profit brought forward 833,511 308,980
20,746 16,819 Profit available for appropriation 1,776,688 1,416,768
0.02 0.02 Basic / diluted earnings per share - US $ / Rupees 1.48 1.79
Note:The above is for information only and coversion have been made @ 1US$ = Pak Rs. 85.6367 as at December 31, 2010. (1US$ = Pak Rs. 84.2416 as at December 31, 2009).
Profit and Loss Account in US$For the year ended December 31, 2010
204
ACCEPTANCESPromise to pay created when the drawee of a time draft stamps or writes the words “accepted” above his signature and a designated payment date.
ACCRUAL BASISRecognizing the effects of transactions and other events when they occur without waiting for receipt or payment of cash or its equivalent.
BILLS FOR COLLECTIONA bill of exchange drawn by the exporter usually at a term, on an importer overseas and brought by the exporter to this bank with a request to collect the proceeds.
BONUS ISSUE (SCRIP ISSUE)The issue of new shares to existing shareholders in proportion to their shareholdings. It is a process for converting a company’s reserves (in whole or part) into issued capital and hence does not involve an infusion of cash.
CAPITAL ADEQUACY RATIOThe relationship between capital and risk weighted assets as defined in the framework developed by the State Bank of Pakistan.
CASH EQUIVALENTSShort-term highly liquid investments that are readily convertible to known amounts of cash and which are subject to an insignificant risk of changes in value.
COMMITMENT TO EXTEND CREDITCredit facilities approved but not yet utilized by the client as at the Balance sheet date.
COMMITMENT TO EXTEND CREDITCommitments to extend credit are those commitments that are irrevocable because they cannot be withdrawn at the discretion of the bank without the risk of incurring significant penalty or expense.
CONTINGENCIESA condition or situation existing at Balance Sheet date where the outcome will be confirmed only by occurrence of one or more future events.
COST / INCOME RATIOOperating expenses as a percentage of total income.
CORPORATE GOVERNANCEThe process by which corporate entities are governed. It is concerned with the way in which power is exercised over the management and direction of entity, the supervision of executive actions and accountability to owners and others.
CAGRAn abbreviation for Compound Annual Growth Rate.
DEFERRED TAXATIONSum set aside for tax in the Financial Statements that will become payable in a financial year other than the current financial year.
DERIVATIVESDerivative is a financial instrument or other contract which has the following characteristics:
(a) its value changes in response to the change in a specified interest rate, financial instrument price, commodity price, foreign exchange rate, index of prices or rates, credit rating or credit index, or other variable, provided in the case of a non-financial variable that the variable is not specific to a party to the contract (sometimes called the ‘underlying’);
(b) it requires no initial net investment or an initial net investment that is smaller than would be required for other types of contracts that would be expected to have a similar response to changes in market factors; and
(c) it is settled at a future date.
EARNINGS PER SHAREProfit after taxation divided by the weighted average number of ordinary share in issue.
EFFECTIVE TAX RATEProvision for taxation excluding deferred tax divided by the profit before taxation.
EQUITY METHODA method of accounting whereby the investment is initially recorded at cost and adjusted thereafter for the post acquisition change in the investor’s share of net assets of the investee. The Income Statement reflects the investor’s share of the results of operations of the investee.
FINANCE LEASEA contract whereby a lessor conveys to the lessee the right to use an asset for rent over an agreed period of time which is sufficient to amortise the capital outlay of the lessor. The lessor retains ownership of the asset but transfers substantially all the risks and rewards of ownership to the lessee.
FORWARD EXCHANGE CONTRACTAgreement between two parties to exchange one currency for another at a future date at a rate agreed upon today.
GROSS DIVIDENDSThe portion of profits distributed to the shareholders including the tax withheld.
Glossary of Financial & Banking Terms
205
GUARANTEESAn agreement involving a promise by a person (the guarantor) to fulfill the obligations of another person owning debt if that person fails to perform.
HISTORICAL COST CONVENTIONRecording transactions at the actual value received or paid.
INTEREST IN SUSPENSEInterest suspended on non-performing loans and advances.
INTEREST SPREADRepresents the difference between the average interest rate earned and the average interest rate paid on funds.
LIQUID ASSETSAssets that are held in cash or in a form that can be converted to cash readily, such as deposits with other banks, bills of exchange, treasury bills.
LOAN LOSSES AND PROVISIONSAmount set aside against possible losses on loans, advances and other credit facilities as a result of their becoming party or wholly uncollectible.
MARKET CAPITALISATIONNumber of ordinary shares in issue multiplied by the market value of share as at the year end.
MATERIALITYThe relative significance of a transaction or an event the omission or misstatement of which could influence the economic decisions of users of financial statements.
NET ASSETS VALUE PER SHAREShareholders’ funds divided by the number of ordinary shares in issue.
NET DIVIDENDSDividend net of withholding tax.
NET INTEREST INCOMEThe difference between what a bank earns on assets such as loans and securities and what it pays on liabilities such as deposits, refinance funds and inter-bank borrowings.
NON PERFORMING LOANSA loan placed on cash basis (i.e Interest Income is only recognized when cash is received) because in the opinion of management, there is reasonable doubt regarding the collectability of principal or interest. Loans are automatically placed on cash basis when a payment is 3 months past due. All loans are classified as non-performing when a payment is 3 months in arrears.
OFF BALANCE SHEET TRANSACTIONSTransactions that are not recognized as assets or liabilities in the balance sheet but which give rise to contingencies and commitments.
PRICE EARNINGS RATIO (P/E RATIO)Market price of a share divided by earnings per share.
PRUDENCEInclusion of a degree of caution in the exercise of judgment needed in making the estimates required under conditions of uncertainty, such that assets or income are not overstated and liabilities or expenses are not understated.
RELATED PARTIESParties where one party has the ability to control the other party or exercise significant influence over the other party in making financial and operating decisions.
RETURN ON AVERAGE ASSETSProfit after tax divided by the average assets.
RISK WEIGHTED ASSETSOn Balance Sheet assets and the credit equivalent of off balance sheet assets multiplied by the relevant risk weighting factors.
REPURCHASE AGREEMENTContract to sell and subsequently repurchase securities at a specified date and price.
REVERSE REPURCHASE AGREEMENTTransaction involving the purchase of securities by a bank or dealer and resale back to the seller at a future date and specified price.
RETURN ON AVERAGE EQUITYNet profit for the year, less preference share dividends if any, expressed as a percentage of average ordinary shareholders’ equity.
REVENUE RESERVEReserves set aside for future distribution and investment.
SHAREHOLDERS’ FUNDSTotal of Issued and fully paid share capital and capital and revenue reserves.
STATUTORY RESERVE FUNDSA capital reserve created as per the provisions of the Banking Companies Ordinance, 1962.
SUBSIDIARY COMPANYA company is a subsidiary of another company if the parent company holds more than 50% of the nominal value of its equity capital or holds some share in it and controls the composition of its Board of Directors.

206
On March 29, 2011 at 10:00 am
Blue Lagoon Complex
Opposite Outward Gate of
Pearl Continental Hotel, Rawalpindi.
AGM
Notes
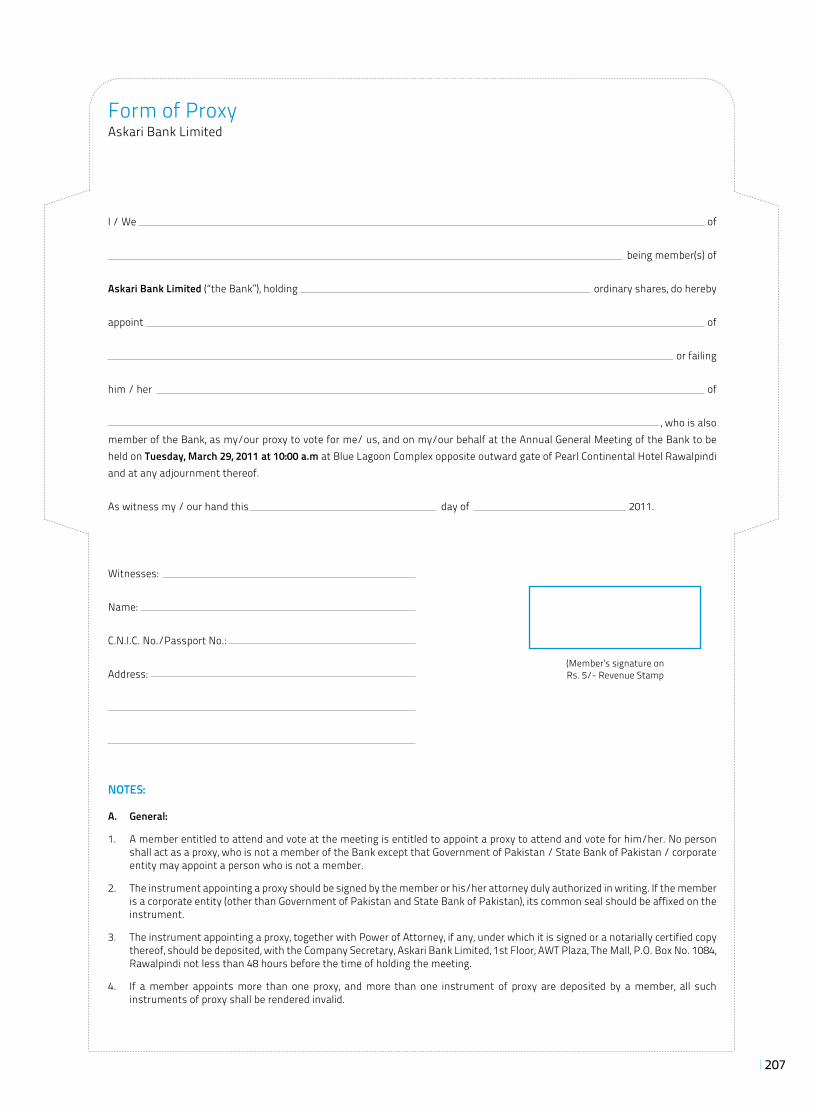
207
Form of ProxyAskari Bank Limited
I / We of
being member(s) of
Askari Bank Limited (“the Bank”), holding ordinary shares, do hereby
appoint of
or failing
him / her of
, who is alsomember of the Bank, as my/our proxy to vote for me/ us, and on my/our behalf at the Annual General Meeting of the Bank to be held on Tuesday, March 29, 2011 at 10:00 a.m at Blue Lagoon Complex opposite outward gate of Pearl Continental Hotel Rawalpindi and at any adjournment thereof.
As witness my / our hand this day of 2011.
Witnesses:
Name:
C.N.I.C. No./Passport No.:
Address:
NOTES:
A. General:
1. A member entitled to attend and vote at the meeting is entitled to appoint a proxy to attend and vote for him/her. No person shall act as a proxy, who is not a member of the Bank except that Government of Pakistan / State Bank of Pakistan / corporate entity may appoint a person who is not a member.
2. The instrument appointing a proxy should be signed by the member or his/her attorney duly authorized in writing. If the member is a corporate entity (other than Government of Pakistan and State Bank of Pakistan), its common seal should be affixed on the instrument.
3. The instrument appointing a proxy, together with Power of Attorney, if any, under which it is signed or a notarially certified copy thereof, should be deposited, with the Company Secretary, Askari Bank Limited, 1st Floor, AWT Plaza, The Mall, P.O. Box No. 1084, Rawalpindi not less than 48 hours before the time of holding the meeting.
4. If a member appoints more than one proxy, and more than one instrument of proxy are deposited by a member, all such instruments of proxy shall be rendered invalid.
(Member’s signature onRs. 5/- Revenue Stamp

208
The Company Secretary:
ASKARI BANK LIMITEDAWT Plaza, The Mall, P.O. Box No. 1084,Rawalpindi - Pakistan.


www.askaribank.com.pk
Des
igne
d &
Prin
ted
byw
ww
.van
tage
paki
stan
.com