assembly and analysis of radiotelemetry and …
TRANSCRIPT
1
Technical Report 2017-1
__________________________________________________________________
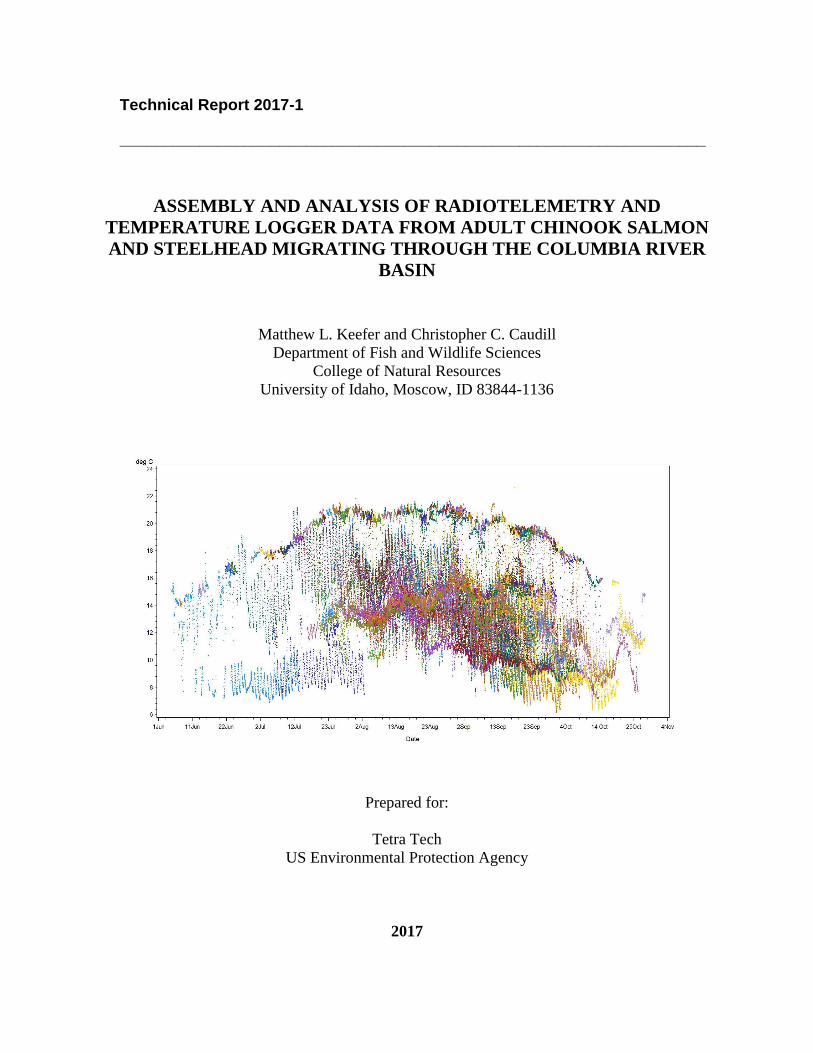
ASSEMBLY AND ANALYSIS OF RADIOTELEMETRY AND
TEMPERATURE LOGGER DATA FROM ADULT CHINOOK SALMON
AND STEELHEAD MIGRATING THROUGH THE COLUMBIA RIVER
BASIN
Matthew L. Keefer and Christopher C. Caudill
Department of Fish and Wildlife Sciences
College of Natural Resources
University of Idaho, Moscow, ID 83844-1136
Prepared for:
Tetra Tech
US Environmental Protection Agency
2017

i
Table of Contents
1.0 Introduction .................................................................................................................................... 1
1.1 Background: cold water refuge use by adult salmon and steelhead ........................................ 1
1.2 Use of RDST data for HexSim modeling ................................................................................ 1
2.0 Methods and Data Quality Assurance ......................................................................................... 2
2.1 Data collection ......................................................................................................................... 2
2.2 Monitoring of radio-tagged fish ................................................................................................ 2
2.3 Recovery and processing of RDST data ................................................................................... 4
2.4 Classifying cold water refuge (CWR) use by RDST-tagged fish ............................................. 5
3.0 Data Summaries ............................................................................................................................. 6
3.1 Columbia River water temperatures: 2000 and 2002 ............................................................... 6
3.2 Origin of recovered RDST-tagged fish ..................................................................................... 7
3.3 Representativeness of recovered RDST-tagged fish ................................................................. 8
3.4 Last detection locations of recovered RDST-tagged fish ......................................................... 10
3.5 Thermal histories of RDST-tagged fish .................................................................................... 10
3.5.1 Dataset summary ............................................................................................................... 10
3.5.2 Bonneville reservoir reach: Chinook salmon .................................................................... 13
3.5.3 Bonneville reservoir reach: Steelhead .............................................................................. 15
3.5.4 The Dalles reservoir reach: Chinook salmon .................................................................... 17
3.5.5 The Dalles reservoir reach: Steelhead ............................................................................... 20
3.5.6 John Day reservoir reach: Chinook salmon ...................................................................... 22
3.5.7 John Day reservoir reach: Steelhead ................................................................................. 24
3.5.8 McNary reservoir reach: Chinook salmon ........................................................................ 26
3.5.9 McNary reservoir reach: Steelhead ................................................................................... 28
3.6 Residence times in each reach .................................................................................................. 30
3.7 Migration rates in reservoir reaches .......................................................................................... 32
3.7.1 Bonneville reservoir reach ................................................................................................ 32
3.7.2 The Dalles reservoir reach ................................................................................................ 34
3.7.3 John Day reservoir reach .................................................................................................. 36
3.7.4 McNary reservoir reach .................................................................................................... 38
3.8 Residence times in cold water refuge (CWR) sites .................................................................. 40
3.8.1 Bonneville reservoir reach ................................................................................................ 40
3.8.2 The Dalles reservoir reach ................................................................................................ 42
3.8.3 John Day reservoir reach .................................................................................................. 44
3.8.4 McNary reservoir reach .................................................................................................... 46
3.9 Mean temperature exposure per reach ...................................................................................... 48
3.9.1 Bonneville reservoir reach ................................................................................................ 48
3.9.2 The Dalles reservoir reach ................................................................................................ 50
3.9.3 John Day reservoir reach .................................................................................................. 52
3.9.4 McNary reservoir reach .................................................................................................... 54
3.10 Maximum temperature exposure per reach............................................................................. 56
3.10.1 Bonneville reservoir reach .............................................................................................. 56
3.10.2 The Dalles reservoir reach .............................................................................................. 58
ii
3.10.3 John Day reservoir reach ................................................................................................ 60
3.10.4 McNary reservoir reach .................................................................................................. 62
3.11 Cumulative temperature exposure per reach ........................................................................... 64
3.11.1 Bonneville reservoir reach .............................................................................................. 64
3.11.2 The Dalles reservoir reach .............................................................................................. 66
3.11.3 John Day reservoir reach ................................................................................................ 68
3.11.4 McNary reservoir reach .................................................................................................. 70
3.12 Degree days per day per reach ................................................................................................ 72
3.12.1 Bonneville reservoir reach .............................................................................................. 73
3.12.2 The Dalles reservoir reach .............................................................................................. 74
3.12.3 John Day reservoir reach ................................................................................................ 76
3.12.4 McNary reservoir reach .................................................................................................. 77
3.13 Probability of CWR use in Bonneville pool by temperature and date .................................... 79
3.13.1 Fall Chinook salmon ....................................................................................................... 79
3.13.2 Steelhead ......................................................................................................................... 81
4.0 References ....................................................................................................................................... 84
Appendix A: Fish origin and final detection locations
Appendix B: Annotated temperature histories of selected RDST-tagged fish
Appendix C: Complete temperature histories for all RDST-tagged fish (2000)
Appendix D: Complete temperature histories for all RDST-tagged fish (2002)
Acknowledgements
Many people assisted with the field work and original RDST data collection and management.
T. Bjornn and C. Peery (UI) were project leaders. R. Ringe, S. Lee, and D. Queampts (UI)
tagged fish, K. Tolotti, C. Morat T. Dick, and M. Morasch (UI) maintained telemetry sites and
downloaded receivers, B. Burke, K. Frick, T.Bohn, and A. Matter (NMFS) administered
databases in Seattle, and M. Jepson, T. Clabough, D. Joosten, G. Naughton, B. High, T. Goniea,
C. Williams, and C. Nauman (UI) interpreted telemetry and RDST data. The original studies
were funded by the U.S. Army Corps of Engineers, Portland and Walla Walla Districts, with
assistance provided by M. Langeslay, D. Clugston, M. Shutters and K. Zelch. We thank Amy
King (Tetra Tech), Jayne Carlin (EPA) and Kathryn Knock (UI) for administration of the current
project. John Palmer, Dru Keenan, Joe Ebersole, and Marcia Snyder (EPA) provided guidance
on report content.

1
1.0 Introduction
1.1 Background: cold water refuge use by adult salmon and steelhead
Summertime water temperatures in the lower Columbia River have steadily increased over the
last several decades. Annual peak temperatures exceeded 21 °C in most recent years and have
been as high as 24 °C. The warmest period typically occurs from late July to early September,
coincident with late-migrating adult summer Chinook salmon (Oncorhynchus tshawytscha) and
sockeye salmon (O. nerka) and with substantial portions of the adult fall Chinook salmon and
summer steelhead (O. mykiss) runs. Water temperatures in the 19-22 °C range, like those that
routinely occur in the Columbia River and Snake River main stems, are a significant
management concern for adult migrants. Portions of many populations can experience thermal
conditions that have been associated with behavioral changes and a variety of sub-lethal effects
on physiology, disease susceptibility, reproductive development, gamete quality, survival, and
fitness.
Many adult salmon and steelhead behaviorally thermoregulate by using cold water refuge
(CWR) sites when Columbia and Snake River water temperatures are high. Most of the CWR
sites temporarily used by adult migrants are located where cold- or cool-water tributaries enter
Columbia and Snake River reservoirs. Extensive adult use of these CWR sites was identified
during a series of radiotelemetry studies conducted by the University of Idaho (UI) and NOAA-
Fisheries. Basic descriptions of some of the most-used CWR sites, the timing of CWR use by
adult migrants, and ambient temperature thresholds associated with CWR use have been
described previously (Keefer et al. 2004; Goniea et al. 2006; High et al. 2006; Keefer et al. 2009,
2011; Keefer and Caudill 2016).
In 2000 and 2002, a subset of the radio transmitters used in adult Chinook salmon and steelhead
also had onboard sensors that recorded fish depth and internal body temperature, a combination
referred to as radio data storage tags (RDST). The RDST study component allowed for highly-
detailed, spatially- and temporally-explicit reconstructions of the thermal experiences of
migrants. Portions of these histories were reported previously by Clabough et al. (2008) and
Caudill et al. (2013).
1.2 Use of RDST data for HexSim modeling
The RDST data were identified as a potentially useful source for parameterizing and validating
the individual-based HexSim model (Schumaker 2016) that is currently being developed by EPA
for adult salmon and steelhead. In this application, the HexSim model is intended to reproduce
and simulate the thermal experiences of adult migrants as they move through the main stem
Columbia River migration corridor from Bonneville Dam to the Columbia River–Snake River
confluence, including their use of CWR sites. This report describes the excerpting, processing,
and compilation of the existing RDST data and provides quality assurance documentation. The
report also includes complete thermal histories, a variety of RDST data summaries, and
classifications of tagged fish behaviors in relation to CWR use. The data summaries were
developed in consultation with EPA, specifically to inform the HexSim modeling effort.

2
2.0 Methods and Data Quality Assurance
2.1 Data collection
The RDST data were collected in 2000 and 2002 during studies of adult summer- and fall-run
Chinook salmon and summer-run steelhead collected at Bonneville Dam, released downstream
from the dam, and then monitored as they migrated upstream past dams, through reservoirs, and
into tributaries. The transmitters (Model LTD_100, Lotek Wireless, Inc.) were programmed to
log fish body temperature every one minute and pressure (i.e., fish depth) every 5 seconds.
These settings allowed the transmitters to store approximately 40 days of data and produced data
files of ~600,000 combined radiotelemetry, temperature, and depth records per fish. The
manufacturer-reported specifications for the transmitters included temperature accuracy of ±0.15
°C at ambient temperatures of 0-20 °C and ±0.10 °C at temperatures of 20-35 °C; resolution was
reported to be 0.02 °C.
Data stored on the transmitters were not available unless the tags were recovered, so salmon and
steelhead with relatively high recapture probability were preferentially tagged. Samples were
predominated by hatchery-origin fish and by fish from populations whose migrations passed
adult trapping facilities, especially the Lower Granite Dam trap in the lower Snake River. Adult
fish origin at the time of RDST-tagging was assessed using the presence of hatchery fin clips
and/or the presence of a passive integrated transponder (PIT) tag that was implanted in juvenile
fish (see Keefer et al. 2009 for details). Majorities of the tagged samples in 2002 (but not 2000)
had juvenile PIT tags, with many individuals from the Snake River basin (see Results).
The sampling broadly reflected seasonal run timing, but the prerogative to recover the RDST
data outweighed our effort to tag random subsamples of the runs at large. Juvenile PIT-tagging
projects in the late 1990s and early 2000s were disproportionately focused on interior
populations (i.e., from upper Columbia River and Snake River populations) and the RDST-
tagged fish reflect these biases. Furthermore, the recovered RDST data were primarily from
‘successful’ migrants that reached adult trapping facilities. Fish that died naturally during
migration (including due to high temperature exposure) and those that were harvested were
almost certainly under-represented in the dataset. These sampling biases should be considered
while interpreting results.
2.2 Monitoring of radio-tagged fish
Radio-tagged salmon and steelhead were monitored in Columbia and Snake River dam tailraces,
outside and inside dam fishways, in reservoirs, and in tributaries to assess a diverse mix of study
objectives (Figures 1-3). The raw telemetry files were filtered (i.e., ‘coded’) by UI biologists
using a set of rule-based decisions, and the coded subsets were then vetted by experienced
personnel. Radiotelemetry detection data were integrated with the RDST data so that each
temperature history has a spatial element; the spatial resolution varies among river reaches as a
function of the number and placement of antennas. The aerial (Yagi) radio antennas used to
monitor fish passage through dam tailraces, reservoirs, and near CWR sites were tuned to detect
3
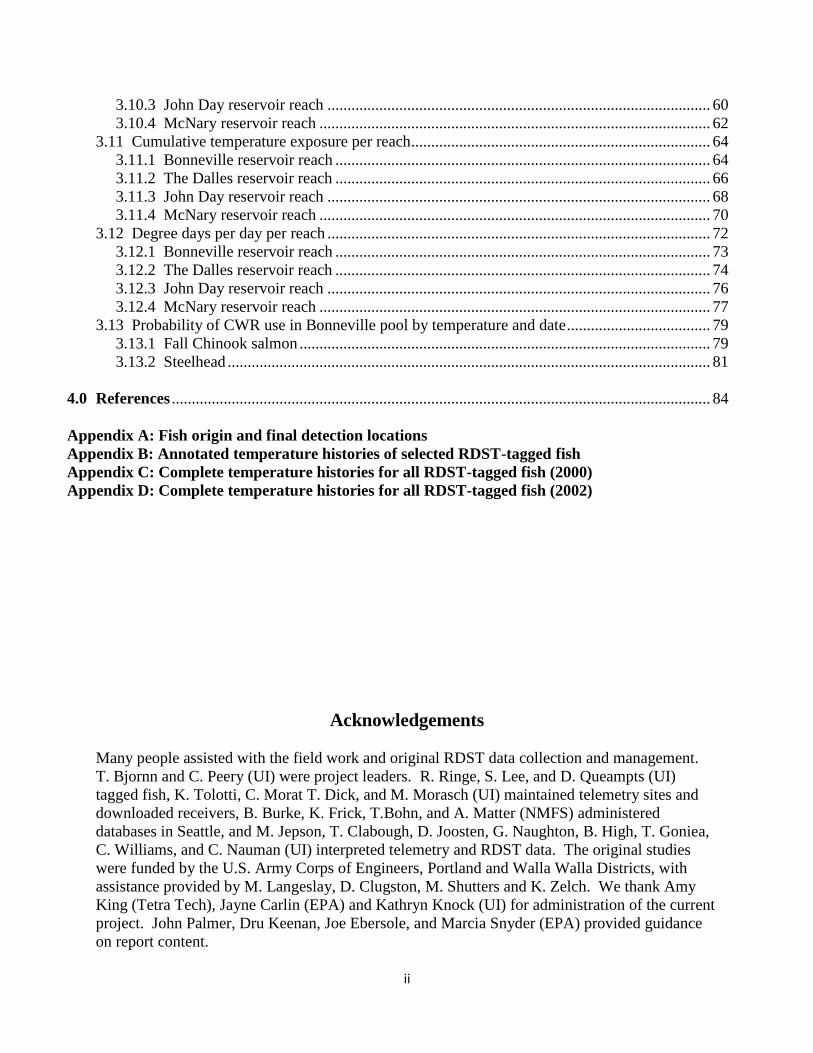
fish within approximately 0.5 km. However, actual detection ranges varied as a result of site
configuration, fish depth (radio signals attenuate with depth), and transmitter signal strength.
Figure 1. Map of the Columbia River from Bonneville Dam (BON) to The Dalles Dam (TDD)
showing locations of aerial antennas (●) and radio receiver names and river kilometer (text boxes).
Extensive underwater (coaxial cable) antenna arrays at dams are not shown.
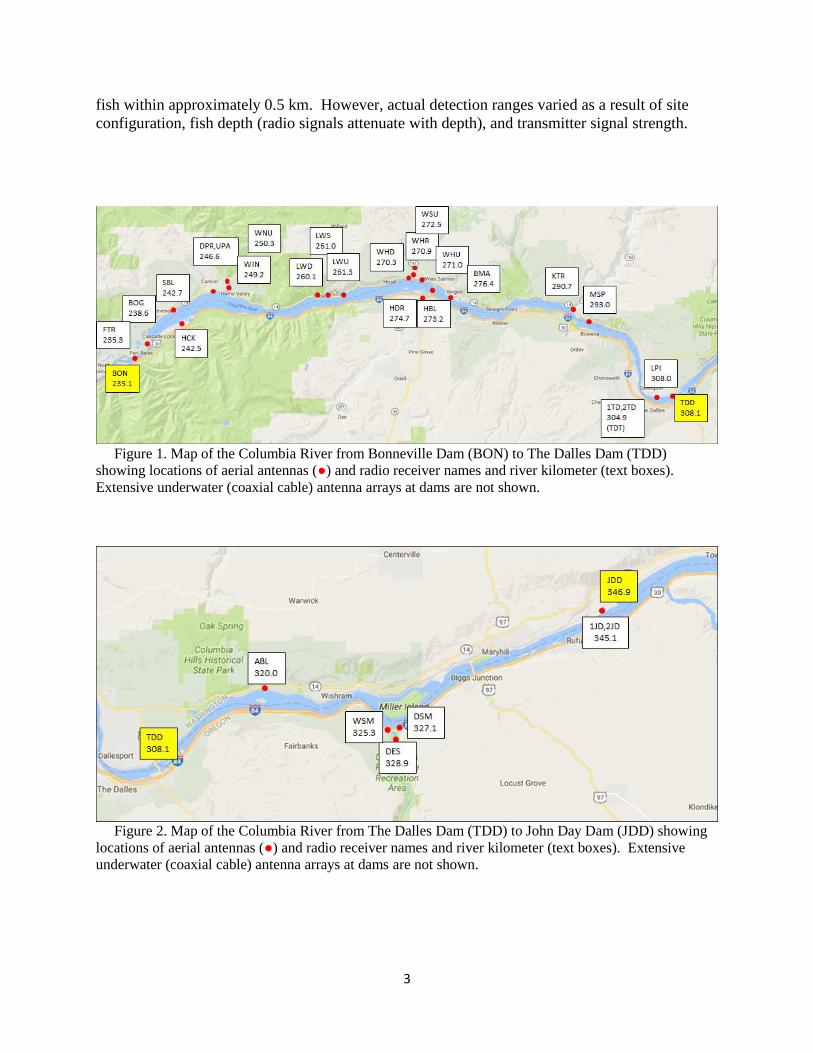
Figure 2. Map of the Columbia River from The Dalles Dam (TDD) to John Day Dam (JDD) showing
locations of aerial antennas (●) and radio receiver names and river kilometer (text boxes). Extensive
underwater (coaxial cable) antenna arrays at dams are not shown.

4
Figure 3. Map of the Columbia and lower Snake rivers from John Day Dam (JDD) past McNary Dam
(MCD) to Ice Harbor Dam (IHD) showing locations of aerial antennas (●) and radio receiver names and
river kilometer (text boxes). Extensive underwater (coaxial cable) antenna arrays at dams are not shown.
2.3 Recovery and processing of RDST data
Data from recovered RDST tags were downloaded and processed using the manufacturer-
recommended methods. Quality control screens included tests for temperature values outside
expected ranges and cross-checks with the radiotelemetry data for appropriate date-time stamps.
To better match the HexSim model needs, we reduced the RDST temperature and depth data to
30-minute time steps (i.e., to 48 records per day). The radiotelemetry datasets were also
substantially reduced so that only first detection records for each block of detections for each fish
were included from aerial antenna sites and only first tailrace, first fishway approach, and top-of-
ladder exit records were included from antenna arrays at dams. The temperature, depth and
radiotelemetry data were then merged to assemble combined detection+temperature histories for
each fish.
An additional post-processing step was to assign each RDST temperature record to a specific
river reach. Reaches included individual Columbia and Snake River reservoirs (last record at
downstream dam to first approach record at upstream dam) and individual dams (first fishway
approach record to pass a ladder), or the Hanford Reach of the Columbia River. Two additional
reaches were the Yakima River and the extended Columbia River reach that included multiple
dams and reservoirs upstream from Priest Rapids Dam (see Figure 6) where there was limited
radiotelemetry monitoring effort.
5
2.4 Classifying cold water refuge (CWR) use by RDST-tagged fish
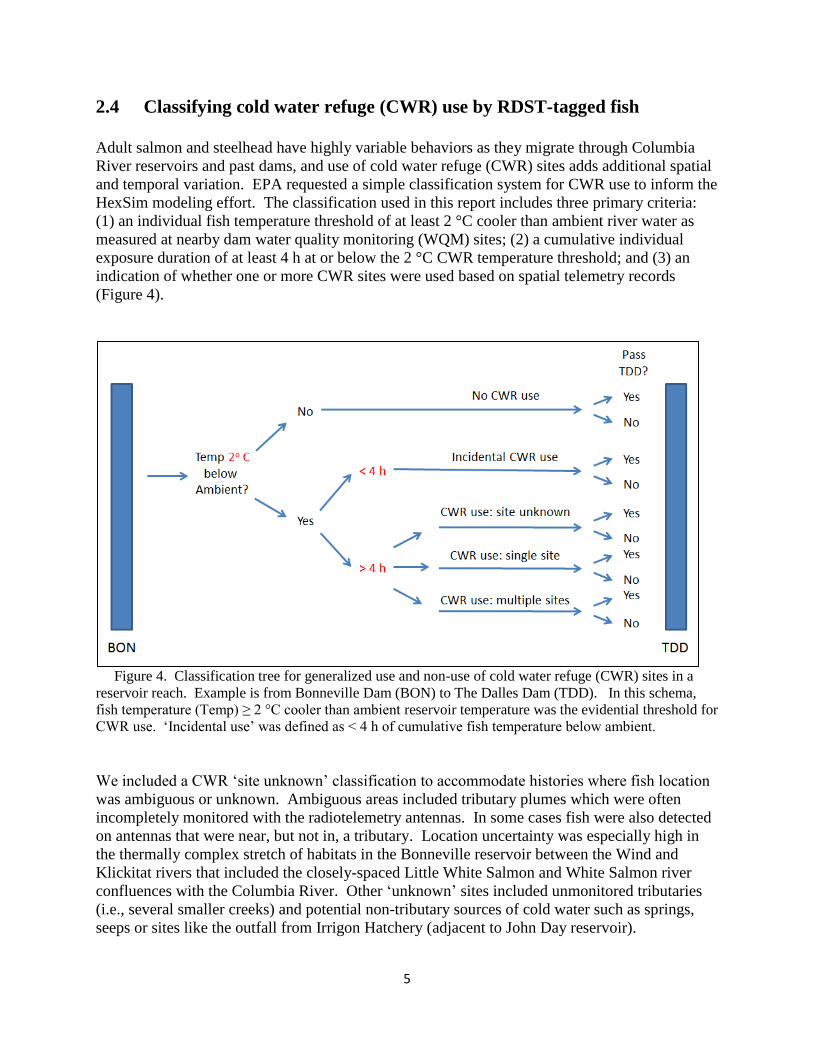
Adult salmon and steelhead have highly variable behaviors as they migrate through Columbia
River reservoirs and past dams, and use of cold water refuge (CWR) sites adds additional spatial
and temporal variation. EPA requested a simple classification system for CWR use to inform the
HexSim modeling effort. The classification used in this report includes three primary criteria:
(1) an individual fish temperature threshold of at least 2 °C cooler than ambient river water as
measured at nearby dam water quality monitoring (WQM) sites; (2) a cumulative individual
exposure duration of at least 4 h at or below the 2 °C CWR temperature threshold; and (3) an
indication of whether one or more CWR sites were used based on spatial telemetry records
(Figure 4).
Figure 4. Classification tree for generalized use and non-use of cold water refuge (CWR) sites in a
reservoir reach. Example is from Bonneville Dam (BON) to The Dalles Dam (TDD). In this schema,
fish temperature (Temp) ≥ 2 °C cooler than ambient reservoir temperature was the evidential threshold for
CWR use. ‘Incidental use’ was defined as < 4 h of cumulative fish temperature below ambient.
We included a CWR ‘site unknown’ classification to accommodate histories where fish location
was ambiguous or unknown. Ambiguous areas included tributary plumes which were often
incompletely monitored with the radiotelemetry antennas. In some cases fish were also detected
on antennas that were near, but not in, a tributary. Location uncertainty was especially high in
the thermally complex stretch of habitats in the Bonneville reservoir between the Wind and
Klickitat rivers that included the closely-spaced Little White Salmon and White Salmon river
confluences with the Columbia River. Other ‘unknown’ sites included unmonitored tributaries
(i.e., several smaller creeks) and potential non-tributary sources of cold water such as springs,
seeps or sites like the outfall from Irrigon Hatchery (adjacent to John Day reservoir).
6
Two complicating factors in the CWR use classification were whether or not an individual
passed through a given river reach and whether RDST data were collected throughout the reach.
Failure to pass a reach due to harvest or natal tributary entry adds a layer of uncertainty to the
proportions of fish classified in each CWR use category. Incomplete RDST data due to storage
capacity limitations similarly contributes to classification uncertainty. These factors are noted,
where relevant, in the Results.
3.0 Data Summaries
3.1 Columbia River water temperature: 2000 and 2002
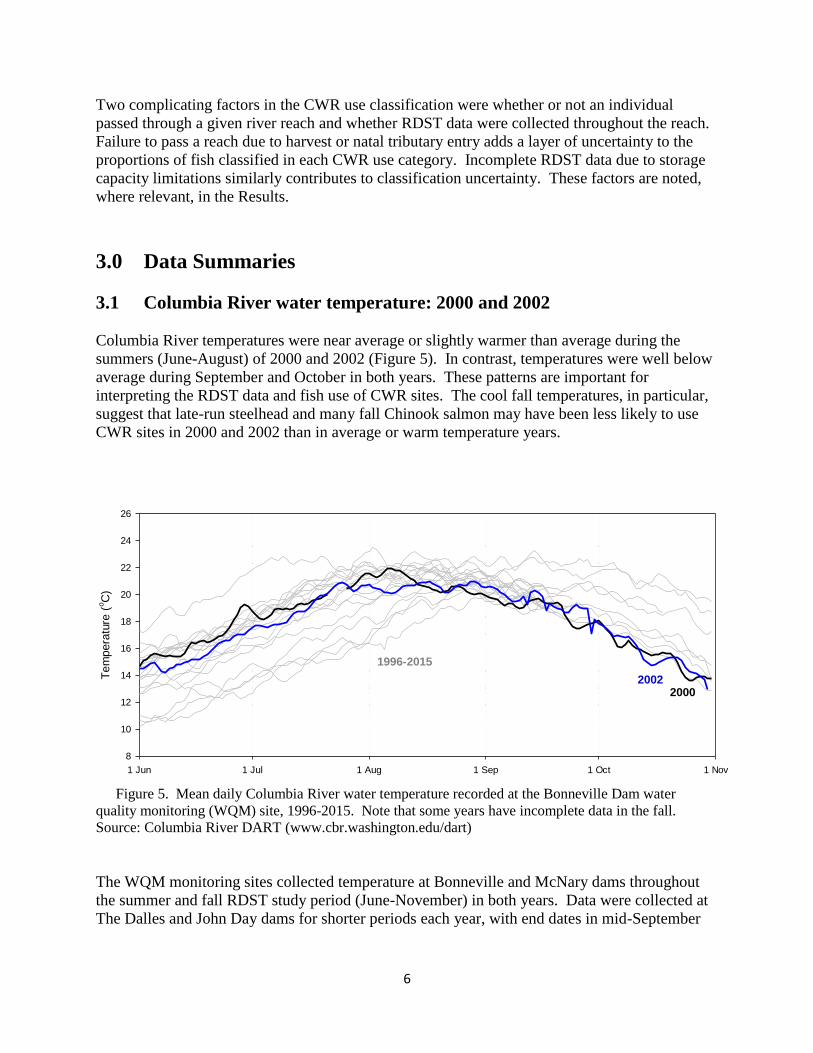
Columbia River temperatures were near average or slightly warmer than average during the
summers (June-August) of 2000 and 2002 (Figure 5). In contrast, temperatures were well below
average during September and October in both years. These patterns are important for
interpreting the RDST data and fish use of CWR sites. The cool fall temperatures, in particular,
suggest that late-run steelhead and many fall Chinook salmon may have been less likely to use
CWR sites in 2000 and 2002 than in average or warm temperature years.
1 Jun 1 Jul 1 Aug 1 Sep 1 Oct 1 Nov
Tem
pera
ture
(oC
)
8
10
12
14
16
18
20
22
24
26
20002002
1996-2015
Figure 5. Mean daily Columbia River water temperature recorded at the Bonneville Dam water
quality monitoring (WQM) site, 1996-2015. Note that some years have incomplete data in the fall.
Source: Columbia River DART (www.cbr.washington.edu/dart)
The WQM monitoring sites collected temperature at Bonneville and McNary dams throughout
the summer and fall RDST study period (June-November) in both years. Data were collected at
The Dalles and John Day dams for shorter periods each year, with end dates in mid-September
7
through early November (Table 1). Mean daily water temperatures were highly correlated (r >
0.96) among pairs of dams within each year for the date ranges when data were available.
Table 1. Correlation matrix of WQM daily average water temperature data for available data between
1 June and 30 November. Source: Columbia River DART (www.cbr.washington.edu/dart)
The Dalles1 John Day
2 McNary
2000 Bonneville 0.994 0.980 0.994
The Dalles - 0.989 0.976
John Day - - 0.969
The Dalles3
John Day4
McNary
2002 Bonneville 0.987 0.987 0.986
The Dalles - 0.988 0.983
John Day - - 0.983 1 20 September end date;
2 21 September end date;
3 6 November end date;
4 27 September end date
3.2 Origin of recovered RDST-tagged fish
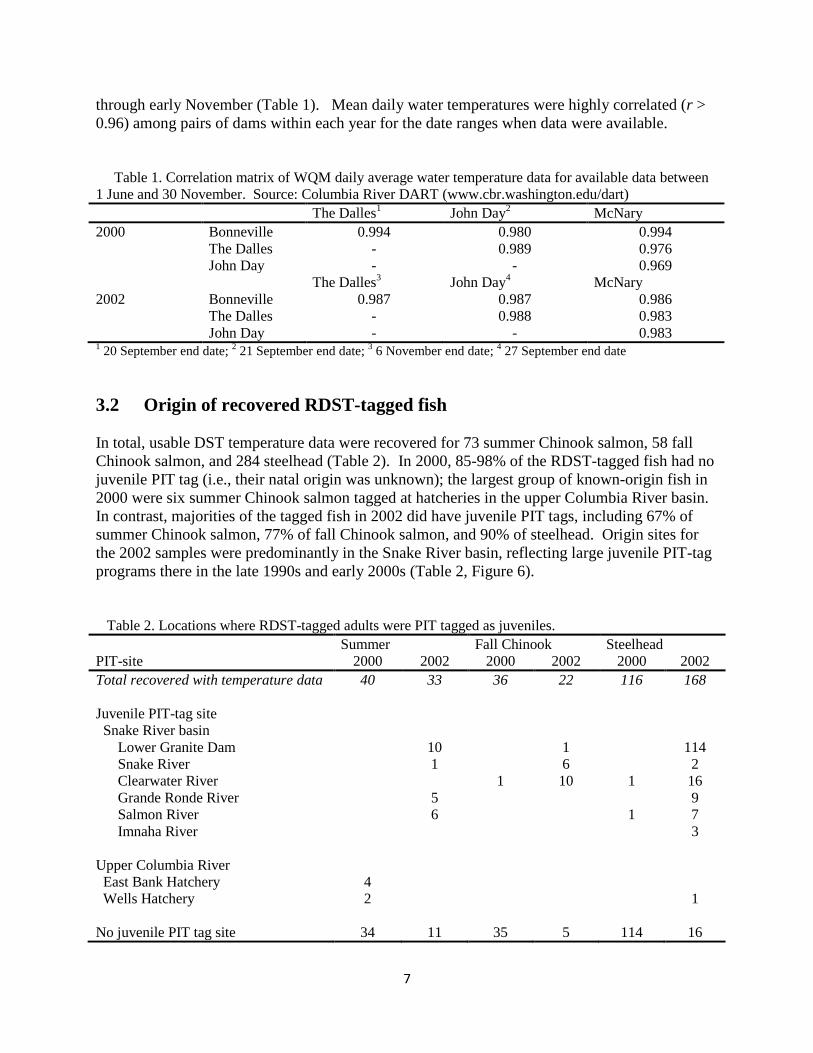
In total, usable DST temperature data were recovered for 73 summer Chinook salmon, 58 fall
Chinook salmon, and 284 steelhead (Table 2). In 2000, 85-98% of the RDST-tagged fish had no
juvenile PIT tag (i.e., their natal origin was unknown); the largest group of known-origin fish in
2000 were six summer Chinook salmon tagged at hatcheries in the upper Columbia River basin.
In contrast, majorities of the tagged fish in 2002 did have juvenile PIT tags, including 67% of
summer Chinook salmon, 77% of fall Chinook salmon, and 90% of steelhead. Origin sites for
the 2002 samples were predominantly in the Snake River basin, reflecting large juvenile PIT-tag
programs there in the late 1990s and early 2000s (Table 2, Figure 6).
Table 2. Locations where RDST-tagged adults were PIT tagged as juveniles.
Summer Fall Chinook Steelhead
PIT-site 2000 2002 2000 2002 2000 2002
Total recovered with temperature data 40 33 36 22 116 168
Juvenile PIT-tag site
Snake River basin
Lower Granite Dam 10 1 114
Snake River 1 6 2
Clearwater River 1 10 1 16
Grande Ronde River 5 9
Salmon River 6 1 7
Imnaha River 3
Upper Columbia River
East Bank Hatchery 4
Wells Hatchery 2 1
No juvenile PIT tag site 34 11 35 5 114 16

8
Figure 6. Map showing locations of dams, cold water refuge (CWR) tributaries (blue text) and
locations where RDST-tagged adults were PIT-tagged as juveniles (red text).
3.3 Representativeness of recovered RDST-tagged fish
In 2000, the recovered RDST-tagged fish were tagged throughout their respective run-timing
distributions at Bonneville Dam (Figure 7). However, median tag dates were later than medians
based on run-specific counts by 6 d (summer and fall Chinook salmon) and 9 days (steelhead).
Tagged fish were also under-represented during the tails of each run timing distribution, an
artifact of attempting to tag approximately in proportion to the runs at large based on timing in
previous years. In 2002, the recovered fish were similarly tagged throughout their respective
run-timing distributions (Figure 8). Median tag dates were again later than medians based on
run-specific counts, but by just 2 d (summer and fall Chinook salmon) and 8 days (steelhead).
As noted previously, juvenile PIT tags identified natal river basin for very few of the RDST-
tagged fish in 2000 but for majorities of the 2002-tagged fish. Selection for adults with juvenile
PIT tags improved the likelihood of RDST recovery, but had a mix of known and uncertain
effects on sample representativeness. The previously PIT-tagged fish were more likely to be of
non-hatchery origin, for example, primarily due to collection of wild smolts for PIT tagging at
Lower Granite Dam. The percentage of each sample with fin clips indicating hatchery origin
were: 100% (2000 summer Chinook), 58% (2002 summer Chinook), 100% (2000 fall Chinook),
10% (2002 fall Chinook), 98% (2000 steelhead), and 21% (2002 steelhead). We think it is likely
that Snake River populations were over-sampled in 2002 relative to the runs at large, especially

9
for fall Chinook salmon, and this should be considered when interpreting results. Furthermore,
all recovered RDST data in both years were from fish that were either harvested or that returned
to traps or hatcheries, and it is possible that some recovery bias affected the representativeness of
the data. For example, wild fish and fish that died prematurely for non-harvest reasons were
likely under-represented.
1 Jun 1 Jul 1 Aug 1 Sept 1 Oct 1 Nov
Count
at
Bonnevi
lle D
am
0
2000
4000
6000
8000
10000
2000
Figure 7. Daily adult Chinook salmon and steelhead counts at Bonneville Dam (lines: red = summer
Chinook, blue = fall Chinook, green = steelhead) and tag dates of RDSTs recovered in 2000. Black
whisker plots show 5th, 25th, 50th, 75th, and 95th percentiles of RDST tagging dates (recovered
transmitters only) and colored whisker plots are for adult counts at Bonneville Dam which correspond
with solid lines (Source: Columbia River DART).
1 Jun 1 Jul 1 Aug 1 Sept 1 Oct 1 Nov
Count
at
Bonnevi
lle D
am
0
5000
10000
15000
20000
250002002
Figure 8. Daily adult Chinook salmon and steelhead counts at Bonneville Dam (lines: red = summer
Chinook, blue = fall Chinook, green = steelhead) and tag dates of RDSTs recovered in 2002. Black
whisker plots show 5th, 25th, 50th, 75th, and 95th percentiles of RDST tagging dates (recovered
transmitters only) and colored whisker plots are for adult counts at Bonneville Dam which correspond
with solid lines (Source: Columbia River DART).
10
3.4 Last detection locations of recovered RDST-tagged fish
Summer Chinook salmon were last detected at sites throughout the Columbia River basin (Table
3). In both years, about 10% were last in reservoirs, at dams, or in tributaries in the lower
Columbia basin downstream from the Snake River confluence. Another 35% (2000) and 73%
(2002) were in the Snake River basin and 55% (2000) and 18% (2002) were at upper Columbia
River sites above the Snake River confluence.
Last detection locations for fall Chinook salmon in 2000 included 53% in the lower Columbia
River, 31% in the Snake River, and 8% at upper Columbia River sites above the Snake River
(Table 3). The distribution in 2002 included 32% at lower Columbia River sites, 64% in the
Snake River, and 5% at upper Columbia River sites. These distributions are consistent with
over-sampling of Snake River fish.
Last detection locations for steelhead in 2000 included 49% in the lower Columbia River, 44% in
the Snake River, and 3% at upper Columbia River sites (Table 3). The distribution in 2002
included 20% at lower Columbia River sites, 79% in the Snake River, and 1% at upper Columbia
River sites. Difference in distributions between years reflected the selection for previously-PIT
tagged fish in 2002.
3.5 Thermal histories of RDST-tagged fish
3.5.1 Dataset summary
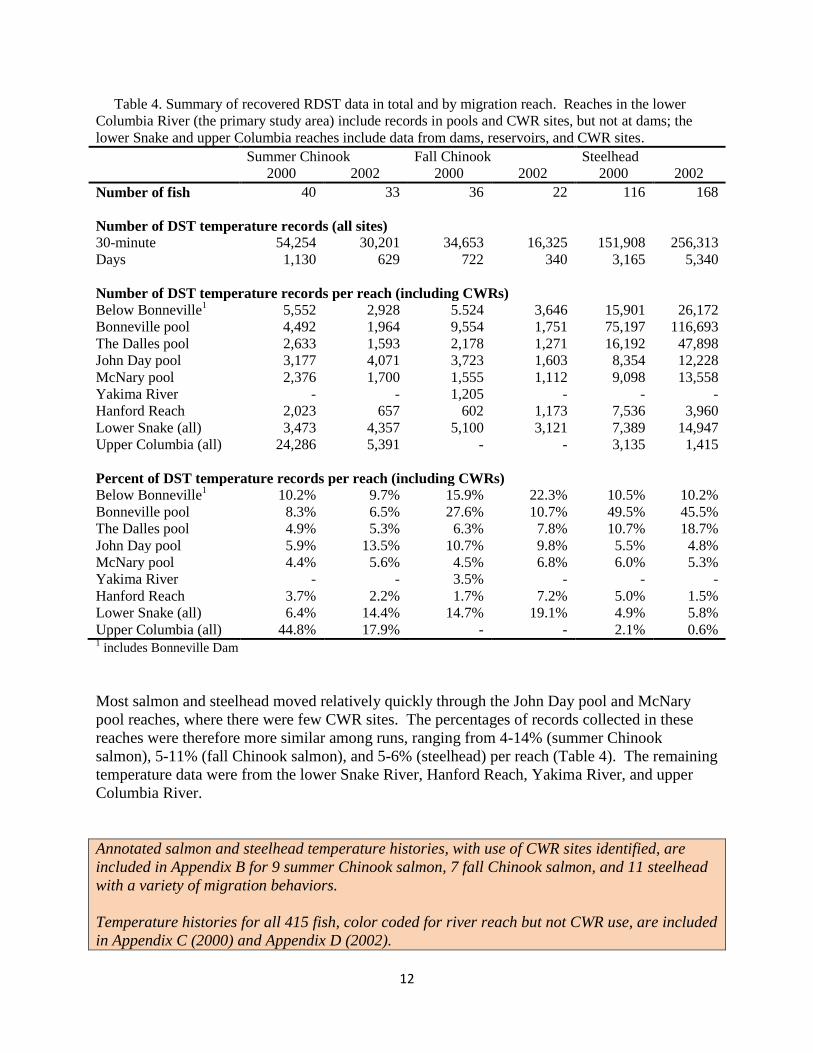
In total, 415 RDST transmitters were recovered with more than 540,000 temperature records
excerpted at 30-minute intervals (Table 4). By run, the data represented 1,759 d (summer
Chinook salmon), 1,062 d (fall Chinook salmon), and 8,505 d (steelhead) of body temperatures
during migration.
The spatial distribution of where temperature data were collected varied among runs, reflecting
differences in run timing, natal origin, and migration behaviors. Many fish were in the lower
Columbia River study area for longer than the 40-d data storage capacity for the RDSTs and this
resulted in disproportionately higher data collection rates in the lower reaches (i.e., Bonneville
and The Dalles pools), especially for steelhead.
From ~10-22% of the temperature records from each run-year were from sites at or downstream
from Bonneville Dam, collected as fish moved upstream from the release sites ~10 km below the
dam (Table 4). The percent of records collected in the Bonneville pool reach were 7-8%
(summer Chinook salmon), 11-28% (fall Chinook salmon), and 46-50% (steelhead), reflecting
the among-run differences in CWR use in this reach. Percentages in The Dalles pool reach were
~5% (summer Chinook salmon), 6-8% (fall Chinook salmon), and 11-19% (steelhead), similarly
reflecting extended use of the Deschutes River CWR by steelhead relative to Chinook salmon.

11
Table 3. Locations where RDST-tagged fish were last detected. See Appendix A for additional details
on adult recovery location in relation to juvenile PIT tag location.
Summer Fall Chinook Steelhead
RDST recovery site 2000 2002 2000 2002 2000 2002
Total recovered with data 40 33 36 22 116 168
Lower Columbia River basin
Sandy River 1
Below Bonneville Dam 1 2
Bonneville pool 3 2 1 2 25 16
Herman / Eagle Creek 1 1
Little White Salmon River 1 4
White Salmon River 2
Klickitat River 4 4 4
Hood River 2
The Dalles pool 1 1 4 1 4 6
Deschutes River 1 2
John Day pool 7 3 8 5
John Day River 1
Umatilla River 1
McNary pool 6
Walla Walla River 1
Snake River basin
Ice Harbor pool 1 1 1
Lower Monumental pool 1
Lyons Ferry Hatchery 2
Little Goose pool 3 1 1
Lower Granite dam / trap 9 2 1 6 63
Lower Granite pool 2 3 1
Snake River > L. Gr. pool 3 3 7 14
Clearwater River 1 3 9 18 17
Grande Ronde River 1 6 5
Salmon River 8 8 15 28
Imnaha River 2 1 2
Upper Columbia River
Yakima River 1
Hanford Reach 2
Ringold Hatchery 1 2
Wanapum pool 1
Wenatchee River 3 1
East Bank Hatchery
Rocky Reach pool 3 2
Wells trap 8 1
Wells pool 3 3 1
Methow River 1
Okanogan River 4 1
12
Table 4. Summary of recovered RDST data in total and by migration reach. Reaches in the lower
Columbia River (the primary study area) include records in pools and CWR sites, but not at dams; the
lower Snake and upper Columbia reaches include data from dams, reservoirs, and CWR sites.
Summer Chinook Fall Chinook Steelhead
2000 2002 2000 2002 2000 2002
Number of fish 40 33 36 22 116 168
Number of DST temperature records (all sites)
30-minute 54,254 30,201 34,653 16,325 151,908 256,313
Days 1,130 629 722 340 3,165 5,340
Number of DST temperature records per reach (including CWRs)
Below Bonneville1
5,552 2,928 5.524 3,646 15,901 26,172
Bonneville pool 4,492 1,964 9,554 1,751 75,197 116,693
The Dalles pool 2,633 1,593 2,178 1,271 16,192 47,898
John Day pool 3,177 4,071 3,723 1,603 8,354 12,228
McNary pool 2,376 1,700 1,555 1,112 9,098 13,558
Yakima River - - 1,205 - - -
Hanford Reach 2,023 657 602 1,173 7,536 3,960
Lower Snake (all) 3,473 4,357 5,100 3,121 7,389 14,947
Upper Columbia (all) 24,286 5,391 - - 3,135 1,415
Percent of DST temperature records per reach (including CWRs)
Below Bonneville1
10.2% 9.7% 15.9% 22.3% 10.5% 10.2%
Bonneville pool 8.3% 6.5% 27.6% 10.7% 49.5% 45.5%
The Dalles pool 4.9% 5.3% 6.3% 7.8% 10.7% 18.7%
John Day pool 5.9% 13.5% 10.7% 9.8% 5.5% 4.8%
McNary pool 4.4% 5.6% 4.5% 6.8% 6.0% 5.3%
Yakima River - - 3.5% - - -
Hanford Reach 3.7% 2.2% 1.7% 7.2% 5.0% 1.5%
Lower Snake (all) 6.4% 14.4% 14.7% 19.1% 4.9% 5.8%
Upper Columbia (all) 44.8% 17.9% - - 2.1% 0.6% 1 includes Bonneville Dam
Most salmon and steelhead moved relatively quickly through the John Day pool and McNary
pool reaches, where there were few CWR sites. The percentages of records collected in these
reaches were therefore more similar among runs, ranging from 4-14% (summer Chinook
salmon), 5-11% (fall Chinook salmon), and 5-6% (steelhead) per reach (Table 4). The remaining
temperature data were from the lower Snake River, Hanford Reach, Yakima River, and upper
Columbia River.
Annotated salmon and steelhead temperature histories, with use of CWR sites identified, are
included in Appendix B for 9 summer Chinook salmon, 7 fall Chinook salmon, and 11 steelhead
with a variety of migration behaviors.
Temperature histories for all 415 fish, color coded for river reach but not CWR use, are included
in Appendix C (2000) and Appendix D (2002).
13
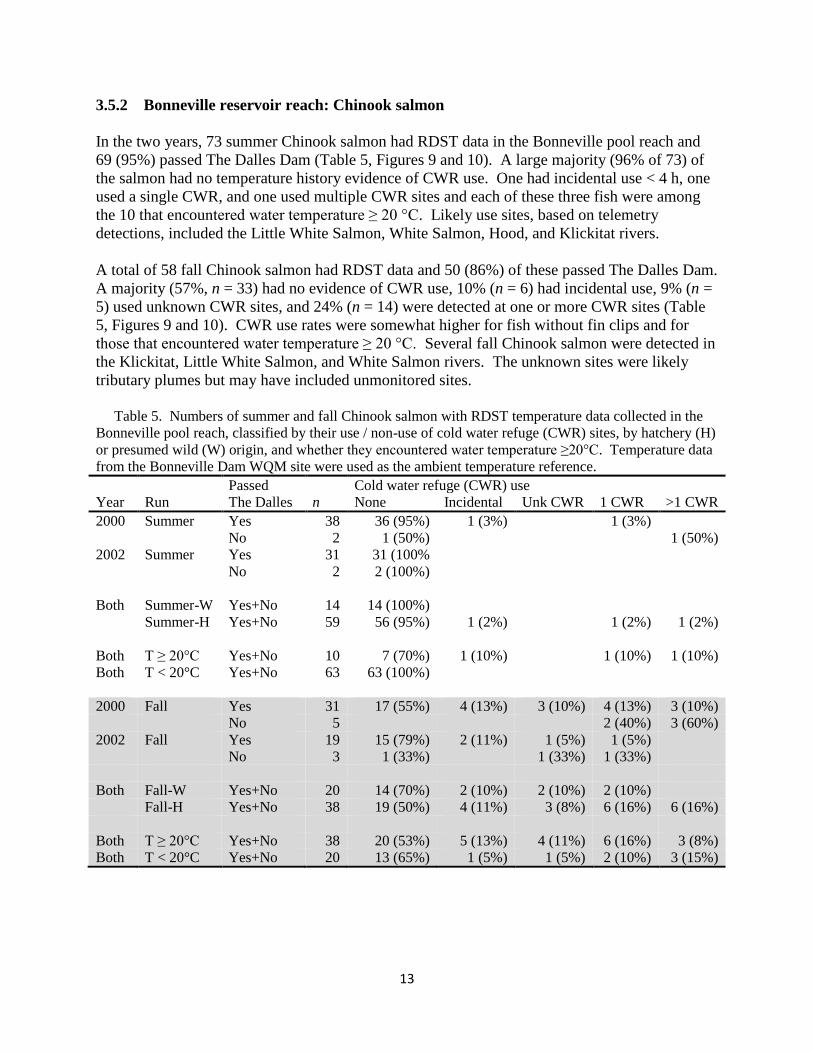
3.5.2 Bonneville reservoir reach: Chinook salmon
In the two years, 73 summer Chinook salmon had RDST data in the Bonneville pool reach and
69 (95%) passed The Dalles Dam (Table 5, Figures 9 and 10). A large majority (96% of 73) of
the salmon had no temperature history evidence of CWR use. One had incidental use < 4 h, one
used a single CWR, and one used multiple CWR sites and each of these three fish were among
the 10 that encountered water temperature ≥ 20 °C. Likely use sites, based on telemetry
detections, included the Little White Salmon, White Salmon, Hood, and Klickitat rivers.
A total of 58 fall Chinook salmon had RDST data and 50 (86%) of these passed The Dalles Dam.
A majority (57%, n = 33) had no evidence of CWR use, 10% (n = 6) had incidental use, 9% (n =
5) used unknown CWR sites, and 24% (n = 14) were detected at one or more CWR sites (Table
5, Figures 9 and 10). CWR use rates were somewhat higher for fish without fin clips and for
those that encountered water temperature ≥ 20 °C. Several fall Chinook salmon were detected in
the Klickitat, Little White Salmon, and White Salmon rivers. The unknown sites were likely
tributary plumes but may have included unmonitored sites.
Table 5. Numbers of summer and fall Chinook salmon with RDST temperature data collected in the
Bonneville pool reach, classified by their use / non-use of cold water refuge (CWR) sites, by hatchery (H)
or presumed wild (W) origin, and whether they encountered water temperature ≥20°C. Temperature data
from the Bonneville Dam WQM site were used as the ambient temperature reference.
Passed Cold water refuge (CWR) use
Year Run The Dalles n None Incidental Unk CWR 1 CWR >1 CWR
2000 Summer Yes 38 36 (95%) 1 (3%) 1 (3%)
No 2 1 (50%) 1 (50%)
2002 Summer Yes 31 31 (100%
No 2 2 (100%)
Both Summer-W Yes+No 14 14 (100%)
Summer-H Yes+No 59 56 (95%) 1 (2%) 1 (2%) 1 (2%)
Both T ≥ 20°C Yes+No 10 7 (70%) 1 (10%) 1 (10%) 1 (10%)
Both T < 20°C Yes+No 63 63 (100%)
2000 Fall Yes 31 17 (55%) 4 (13%) 3 (10%) 4 (13%) 3 (10%)
No 5 2 (40%) 3 (60%)
2002 Fall Yes 19 15 (79%) 2 (11%) 1 (5%) 1 (5%)
No 3 1 (33%) 1 (33%) 1 (33%)
Both Fall-W Yes+No 20 14 (70%) 2 (10%) 2 (10%) 2 (10%)
Fall-H Yes+No 38 19 (50%) 4 (11%) 3 (8%) 6 (16%) 6 (16%)
Both T ≥ 20°C Yes+No 38 20 (53%) 5 (13%) 4 (11%) 6 (16%) 3 (8%)
Both T < 20°C Yes+No 20 13 (65%) 1 (5%) 1 (5%) 2 (10%) 3 (15%)

14
Notably, four fall Chinook salmon were last detected in the Klickitat River in 2000 (see Table 3
and Appendix A), including three that were reported harvested. The natal origins of these fish
were unknown and therefore they may have originated from the Klickitat River (i.e., the
behavior was not CWR use). Alternately, these fish may be examples of harvest of non-local
thermoregulating fish.
Figure 9. Thermal histories (30-min) of RDST-tagged summer Chinook salmon (n = 39) and fall
Chinook salmon (n = 36) in Bonneville reservoir in 2000. Different colors represent individual fish.
15
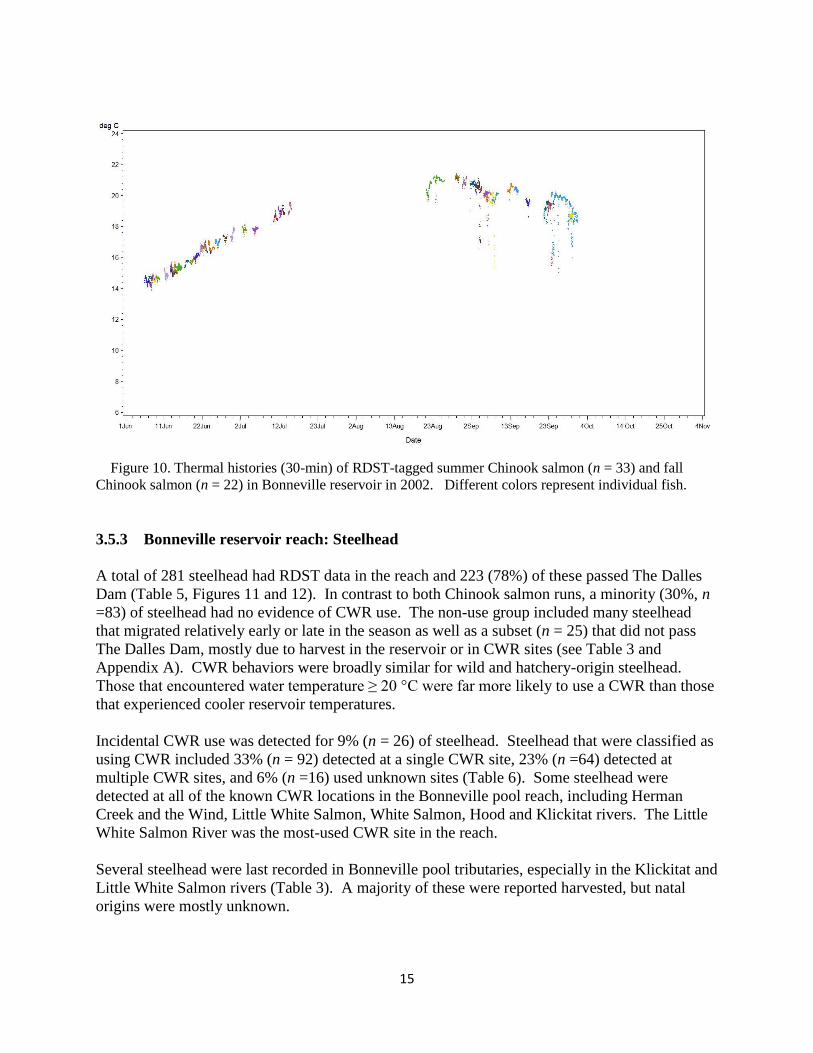
Figure 10. Thermal histories (30-min) of RDST-tagged summer Chinook salmon (n = 33) and fall
Chinook salmon (n = 22) in Bonneville reservoir in 2002. Different colors represent individual fish.
3.5.3 Bonneville reservoir reach: Steelhead
A total of 281 steelhead had RDST data in the reach and 223 (78%) of these passed The Dalles
Dam (Table 5, Figures 11 and 12). In contrast to both Chinook salmon runs, a minority (30%, n
=83) of steelhead had no evidence of CWR use. The non-use group included many steelhead
that migrated relatively early or late in the season as well as a subset (n = 25) that did not pass
The Dalles Dam, mostly due to harvest in the reservoir or in CWR sites (see Table 3 and
Appendix A). CWR behaviors were broadly similar for wild and hatchery-origin steelhead.
Those that encountered water temperature ≥ 20 °C were far more likely to use a CWR than those
that experienced cooler reservoir temperatures.
Incidental CWR use was detected for 9% (n = 26) of steelhead. Steelhead that were classified as
using CWR included 33% (n = 92) detected at a single CWR site, 23% (n =64) detected at
multiple CWR sites, and 6% (n =16) used unknown sites (Table 6). Some steelhead were
detected at all of the known CWR locations in the Bonneville pool reach, including Herman
Creek and the Wind, Little White Salmon, White Salmon, Hood and Klickitat rivers. The Little
White Salmon River was the most-used CWR site in the reach.
Several steelhead were last recorded in Bonneville pool tributaries, especially in the Klickitat and
Little White Salmon rivers (Table 3). A majority of these were reported harvested, but natal
origins were mostly unknown.
16
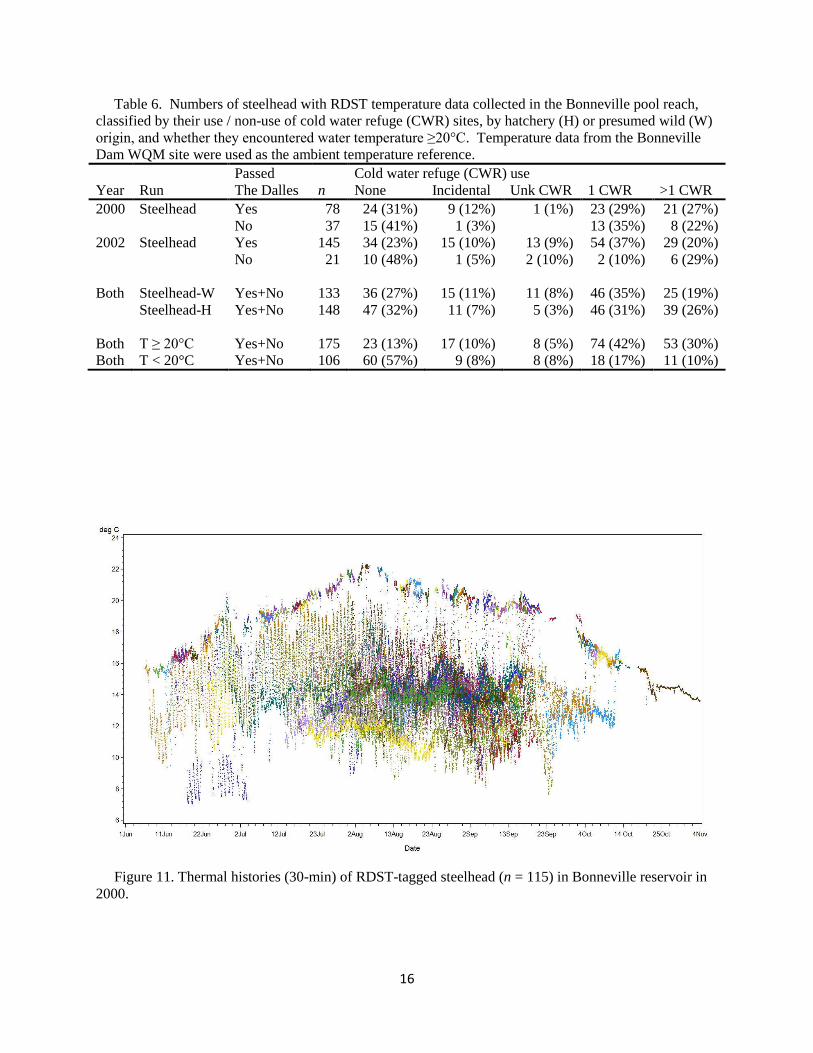
Table 6. Numbers of steelhead with RDST temperature data collected in the Bonneville pool reach,
classified by their use / non-use of cold water refuge (CWR) sites, by hatchery (H) or presumed wild (W)
origin, and whether they encountered water temperature ≥20°C. Temperature data from the Bonneville
Dam WQM site were used as the ambient temperature reference.
Passed Cold water refuge (CWR) use
Year Run The Dalles n None Incidental Unk CWR 1 CWR >1 CWR
2000 Steelhead Yes 78 24 (31%) 9 (12%) 1 (1%) 23 (29%) 21 (27%)
No 37 15 (41%) 1 (3%) 13 (35%) 8 (22%)
2002 Steelhead Yes 145 34 (23%) 15 (10%) 13 (9%) 54 (37%) 29 (20%)
No 21 10 (48%) 1 (5%) 2 (10%) 2 (10%) 6 (29%)
Both Steelhead-W Yes+No 133 36 (27%) 15 (11%) 11 (8%) 46 (35%) 25 (19%)
Steelhead-H Yes+No 148 47 (32%) 11 (7%) 5 (3%) 46 (31%) 39 (26%)
Both T ≥ 20°C Yes+No 175 23 (13%) 17 (10%) 8 (5%) 74 (42%) 53 (30%)
Both T < 20°C Yes+No 106 60 (57%) 9 (8%) 8 (8%) 18 (17%) 11 (10%)
Figure 11. Thermal histories (30-min) of RDST-tagged steelhead (n = 115) in Bonneville reservoir in
2000.

17
Figure 12. Thermal histories (30-min) of RDST-tagged steelhead (n = 166) in Bonneville reservoir in
2002.
3.5.4 The Dalles reservoir reach: Chinook salmon
A total of 69 summer Chinook salmon had RDST data and 64 (93%) of these passed John Day
Dam (Table 7). A large majority (96%, n = 66) had no evidence of CWR use in the Deschutes
River, the only known CWR in the reach (Figures 13 and 14). Two salmon (3% of 69) used the
Deschutes River or its plume and one (1%) had incidental use < 4 h. The CWR use occurred
when reservoir temperatures were ≥ 20 °C.
A total of 47 fall Chinook salmon had RDST data and 42 (89%) of these passed John Day Dam
(Table 7). A majority (74%, n = 35) had no evidence of CWR use in the Deschutes River
(Figures 13 and 14). Eleven salmon (23% of 47) used the Deschutes River or plume and three
(6%) had incidental use < 4 h. A single unknown-origin fall Chinook salmon was last recorded
in the Deschutes River (Table 3). Patterns were generally similar for wild and hatchery salmon
and for those that did or did not encounter reservoir temperatures were ≥ 20 °C.

18
Table 7. Numbers of summer and fall Chinook salmon with RDST temperature data collected in The
Dalles pool reach, classified by their use / non-use of cold water refuge (CWR) sites, by hatchery (H) or
presumed wild (W) origin, and whether they encountered water temperature ≥20°C. Temperature data
from the Bonneville Dam WQM site were used as the ambient temperature reference because The Dalles
WQM data were not available through the fall.
Passed Cold water refuge (CWR) use
Year Run John Day n None Incidental Unk CWR 1 CWR >1 CWR
2000 Summer Yes 37 34 (92%) 1 (3%) 2 (5%)
No 1 1 (100%)
2002 Summer Yes 30 30 (100%
No 1 1 (100%)
Both Summer-W Yes+No 13 13 (100%)
Summer-H Yes+No 56 53 (95%) 1 (2%) 2 (4%)
Both T ≥ 20°C Yes+No 6 4 (67%) 2 (33%)
Both T < 20°C Yes+No 62 61 (98%) 1 (2%)
2000 Fall Yes 24 19 (79%) 1 (4%) 5 (21%)
No 4 3 (75%) 1 (25%)
n/a1 3
2002 Fall Yes 18 12 (67%) 2 (11%) 4 (22%)
No 1 1(100%)
Both Fall-W Yes+No 17 11 (65%) 2 (12%) 4 (24%)
Fall-H Yes+No 30 23 (77%) 1 (3%) 6 (20%)
Both T ≥ 20°C Yes+No 30 23 (77%) 1 (3%) 6 (20%)
Both T < 20°C Yes+No 17 11 (65%) 2 (12%) 4 (24%) 1 No DST temperature data in reach

19
Figure 13. Thermal histories (30-min) of RDST-tagged summer Chinook salmon (n = 37) and fall
Chinook salmon (n = 28) in The Dalles reservoir in 2000.
Figure 14. Thermal histories (30-min) of RDST-tagged summer Chinook salmon (n = 31) and fall
Chinook salmon (n = 19) in The Dalles reservoir in 2002.
20
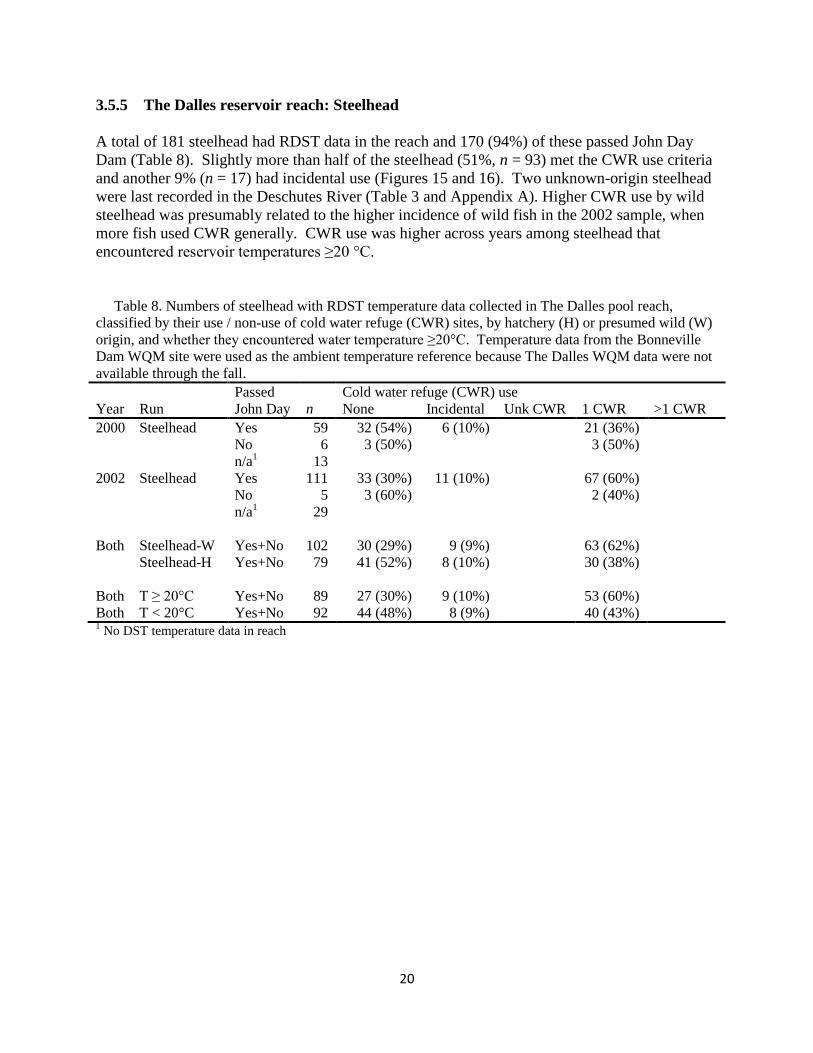
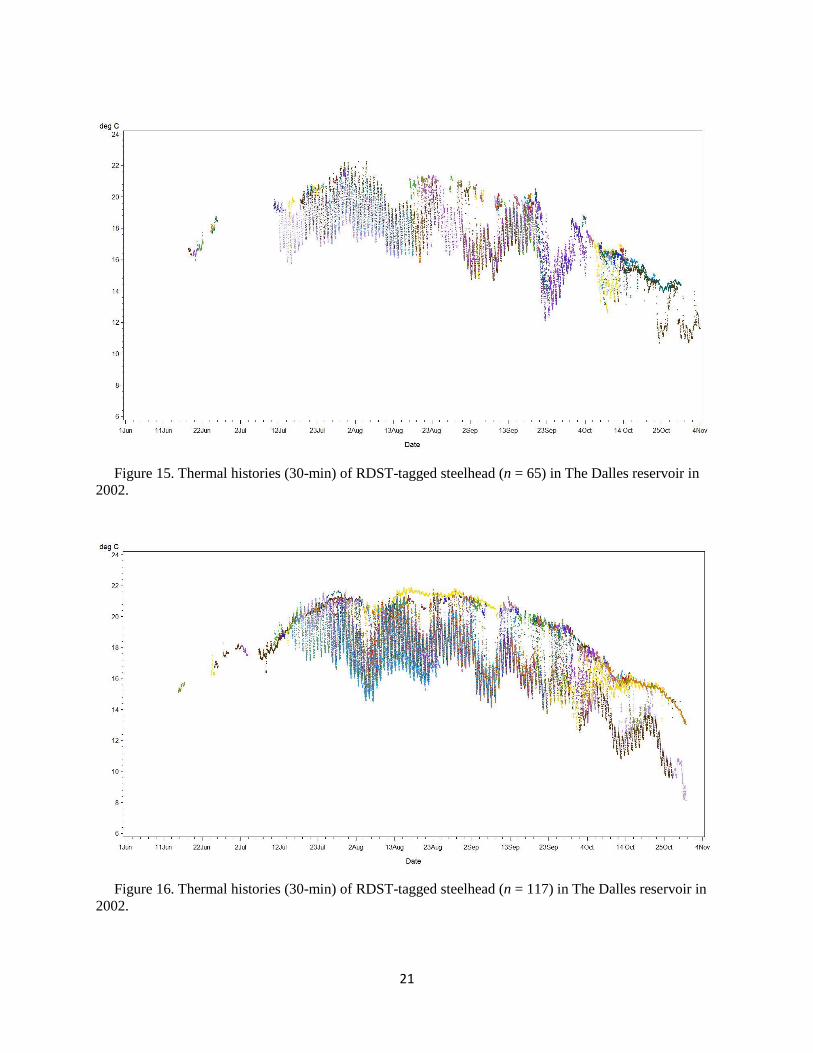
3.5.5 The Dalles reservoir reach: Steelhead
A total of 181 steelhead had RDST data in the reach and 170 (94%) of these passed John Day
Dam (Table 8). Slightly more than half of the steelhead (51%, n = 93) met the CWR use criteria
and another 9% (n = 17) had incidental use (Figures 15 and 16). Two unknown-origin steelhead
were last recorded in the Deschutes River (Table 3 and Appendix A). Higher CWR use by wild
steelhead was presumably related to the higher incidence of wild fish in the 2002 sample, when
more fish used CWR generally. CWR use was higher across years among steelhead that
encountered reservoir temperatures ≥20 °C.
Table 8. Numbers of steelhead with RDST temperature data collected in The Dalles pool reach,
classified by their use / non-use of cold water refuge (CWR) sites, by hatchery (H) or presumed wild (W)
origin, and whether they encountered water temperature ≥20°C. Temperature data from the Bonneville
Dam WQM site were used as the ambient temperature reference because The Dalles WQM data were not
available through the fall.
Passed Cold water refuge (CWR) use
Year Run John Day n None Incidental Unk CWR 1 CWR >1 CWR
2000 Steelhead Yes 59 32 (54%) 6 (10%) 21 (36%)
No 6 3 (50%) 3 (50%)
n/a1 13
2002 Steelhead Yes 111 33 (30%) 11 (10%) 67 (60%)
No 5 3 (60%) 2 (40%)
n/a1 29
Both Steelhead-W Yes+No 102 30 (29%) 9 (9%) 63 (62%)
Steelhead-H Yes+No 79 41 (52%) 8 (10%) 30 (38%)
Both T ≥ 20°C Yes+No 89 27 (30%) 9 (10%) 53 (60%)
Both T < 20°C Yes+No 92 44 (48%) 8 (9%) 40 (43%) 1 No DST temperature data in reach
21
Figure 15. Thermal histories (30-min) of RDST-tagged steelhead (n = 65) in The Dalles reservoir in
2002.
Figure 16. Thermal histories (30-min) of RDST-tagged steelhead (n = 117) in The Dalles reservoir in
2002.
22
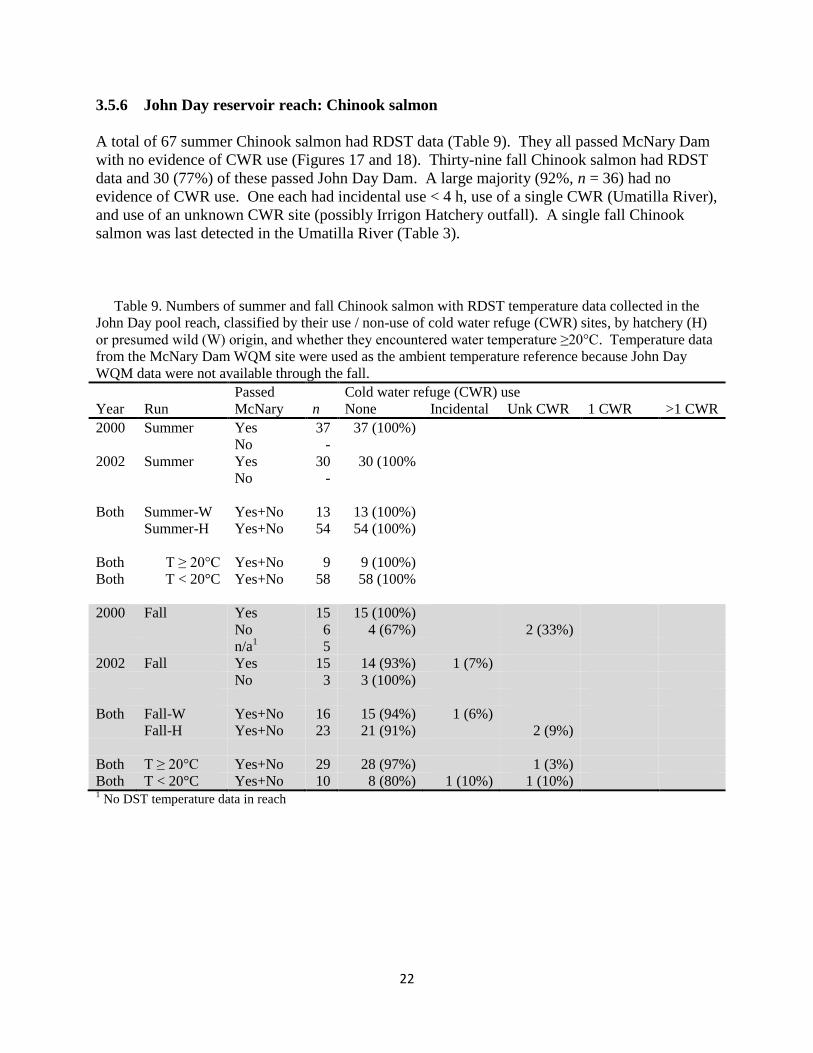
3.5.6 John Day reservoir reach: Chinook salmon
A total of 67 summer Chinook salmon had RDST data (Table 9). They all passed McNary Dam
with no evidence of CWR use (Figures 17 and 18). Thirty-nine fall Chinook salmon had RDST
data and 30 (77%) of these passed John Day Dam. A large majority (92%, n = 36) had no
evidence of CWR use. One each had incidental use < 4 h, use of a single CWR (Umatilla River),
and use of an unknown CWR site (possibly Irrigon Hatchery outfall). A single fall Chinook
salmon was last detected in the Umatilla River (Table 3).
Table 9. Numbers of summer and fall Chinook salmon with RDST temperature data collected in the
John Day pool reach, classified by their use / non-use of cold water refuge (CWR) sites, by hatchery (H)
or presumed wild (W) origin, and whether they encountered water temperature ≥20°C. Temperature data
from the McNary Dam WQM site were used as the ambient temperature reference because John Day
WQM data were not available through the fall.
Passed Cold water refuge (CWR) use
Year Run McNary n None Incidental Unk CWR 1 CWR >1 CWR
2000 Summer Yes 37 37 (100%)
No -
2002 Summer Yes 30 30 (100%
No -
Both Summer-W Yes+No 13 13 (100%)
Summer-H Yes+No 54 54 (100%)
Both T ≥ 20°C Yes+No 9 9 (100%)
Both T < 20°C Yes+No 58 58 (100%
2000 Fall Yes 15 15 (100%)
No 6 4 (67%) 2 (33%)
n/a1 5
2002 Fall Yes 15 14 (93%) 1 (7%)
No 3 3 (100%)
Both Fall-W Yes+No 16 15 (94%) 1 (6%)
Fall-H Yes+No 23 21 (91%) 2 (9%)
Both T ≥ 20°C Yes+No 29 28 (97%) 1 (3%)
Both T < 20°C Yes+No 10 8 (80%) 1 (10%) 1 (10%) 1 No DST temperature data in reach
23
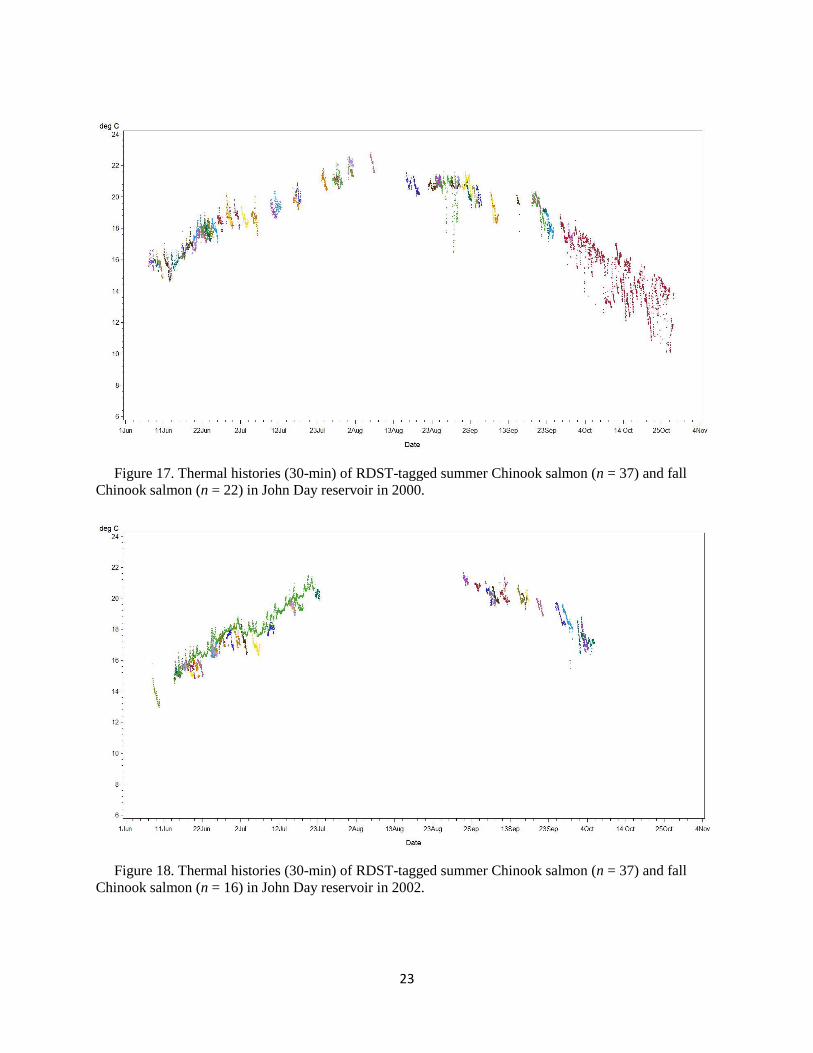
Figure 17. Thermal histories (30-min) of RDST-tagged summer Chinook salmon (n = 37) and fall
Chinook salmon (n = 22) in John Day reservoir in 2000.
Figure 18. Thermal histories (30-min) of RDST-tagged summer Chinook salmon (n = 37) and fall
Chinook salmon (n = 16) in John Day reservoir in 2002.

24
3.5.7 John Day reservoir reach: Steelhead
A total of 136 steelhead had RDST data in the reach and 129 (95%) of these passed McNary
Dam (Table 10). A large majority (90%, n = 123) had no evidence of CWR use (Figures 19 and
20). Eight steelhead (6% of 136) had incidental CWR use and 5 (4%) used unknown CWR sites.
Potential CWR locations included the John Day and Umatilla rivers, Rock Creek, the Irrigon
Hatchery outfall, or other unidentified sites. A single steelhead was last detected in the John Day
River (Table 3 and Appendix A). Patterns were similar among wild and hatchery steelhead and
for the encountered temperature groups.
Table 10. Numbers of steelhead with RDST temperature data collected in the John Day pool reach,
classified by their use / non-use of cold water refuge (CWR) sites, by hatchery (H) or presumed wild (W)
origin, and whether they encountered water temperature ≥20°C. Temperature data from the McNary Dam
WQM site were used as the ambient temperature reference because John Day WQM data were not
available through the fall.
Passed Cold water refuge (CWR) use
Year Run McNary n None Incidental Unk CWR 1 CWR >1 CWR
2000 Steelhead Yes 45 42 (93%) 2 (4%) 1 (2%)
No 5 5 (100%)
n/a1 21
2002 Steelhead Yes 84 75 (89%) 5 (6%) 4 (5%)
No 2 1 (50%) 1 (50%)
n/a1 53
Both Steelhead-W Yes+No 75 65 (87%) 6 (8%) 4 (5%)
Steelhead-H Yes+No 62 59 (95%) 2 (3%) 1 (2%)
Both T ≥ 20°C Yes+No 26 25 (96%) 1 (4%)
Both T < 20°C Yes+No 111 99 (89%) 7 (6%) 5 (5%) 1 No DST temperature data in reach

25
Figure 19. Thermal histories (30-min) of RDST-tagged steelhead (n = 52) in John Day reservoir in
2000.
Figure 20. Thermal histories (30-min) of RDST-tagged steelhead (n = 86) in John Day reservoir in
2002.
26
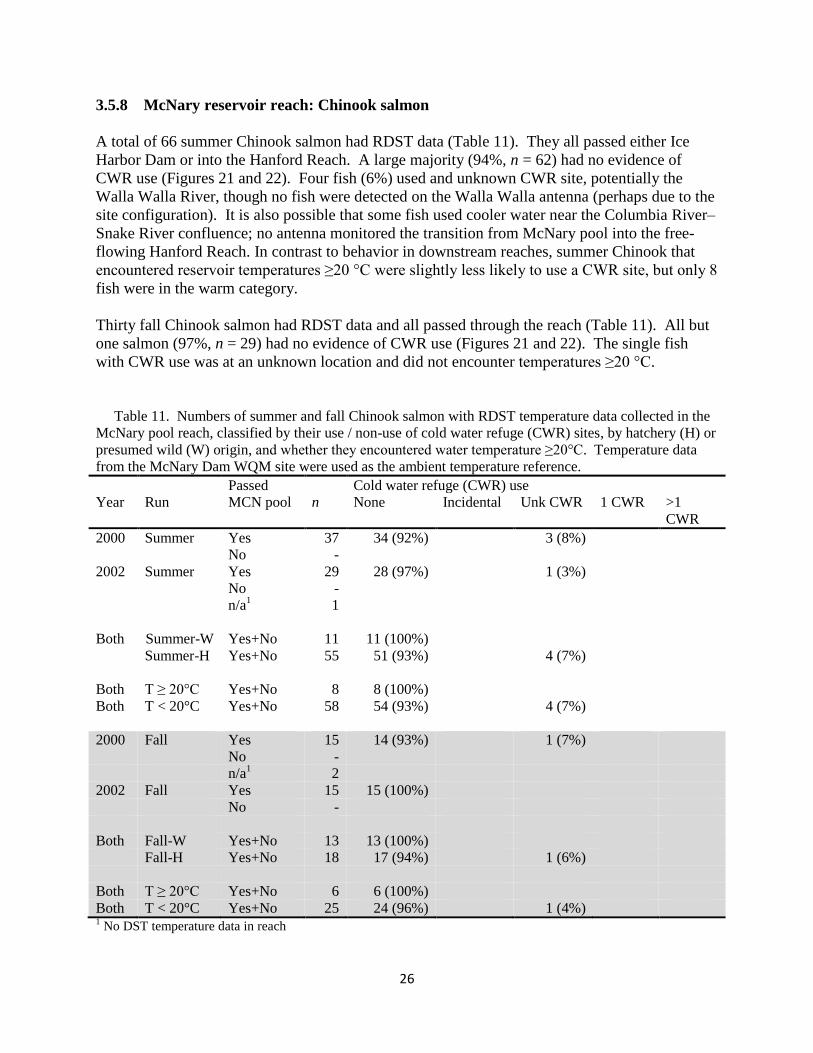
3.5.8 McNary reservoir reach: Chinook salmon
A total of 66 summer Chinook salmon had RDST data (Table 11). They all passed either Ice
Harbor Dam or into the Hanford Reach. A large majority (94%, n = 62) had no evidence of
CWR use (Figures 21 and 22). Four fish (6%) used and unknown CWR site, potentially the
Walla Walla River, though no fish were detected on the Walla Walla antenna (perhaps due to the
site configuration). It is also possible that some fish used cooler water near the Columbia River–
Snake River confluence; no antenna monitored the transition from McNary pool into the free-
flowing Hanford Reach. In contrast to behavior in downstream reaches, summer Chinook that
encountered reservoir temperatures ≥20 °C were slightly less likely to use a CWR site, but only 8
fish were in the warm category.
Thirty fall Chinook salmon had RDST data and all passed through the reach (Table 11). All but
one salmon (97%, n = 29) had no evidence of CWR use (Figures 21 and 22). The single fish
with CWR use was at an unknown location and did not encounter temperatures ≥20 °C.
Table 11. Numbers of summer and fall Chinook salmon with RDST temperature data collected in the
McNary pool reach, classified by their use / non-use of cold water refuge (CWR) sites, by hatchery (H) or
presumed wild (W) origin, and whether they encountered water temperature ≥20°C. Temperature data
from the McNary Dam WQM site were used as the ambient temperature reference.
Passed Cold water refuge (CWR) use
Year Run MCN pool n None Incidental Unk CWR 1 CWR >1
CWR
2000 Summer Yes 37 34 (92%) 3 (8%)
No -
2002 Summer Yes 29 28 (97%) 1 (3%)
No -
n/a1 1
Both Summer-W Yes+No 11 11 (100%)
Summer-H Yes+No 55 51 (93%) 4 (7%)
Both T ≥ 20°C Yes+No 8 8 (100%)
Both T < 20°C Yes+No 58 54 (93%) 4 (7%)
2000 Fall Yes 15 14 (93%) 1 (7%)
No -
n/a1 2
2002 Fall Yes 15 15 (100%)
No -
Both Fall-W Yes+No 13 13 (100%)
Fall-H Yes+No 18 17 (94%) 1 (6%)
Both T ≥ 20°C Yes+No 6 6 (100%)
Both T < 20°C Yes+No 25 24 (96%) 1 (4%) 1 No DST temperature data in reach
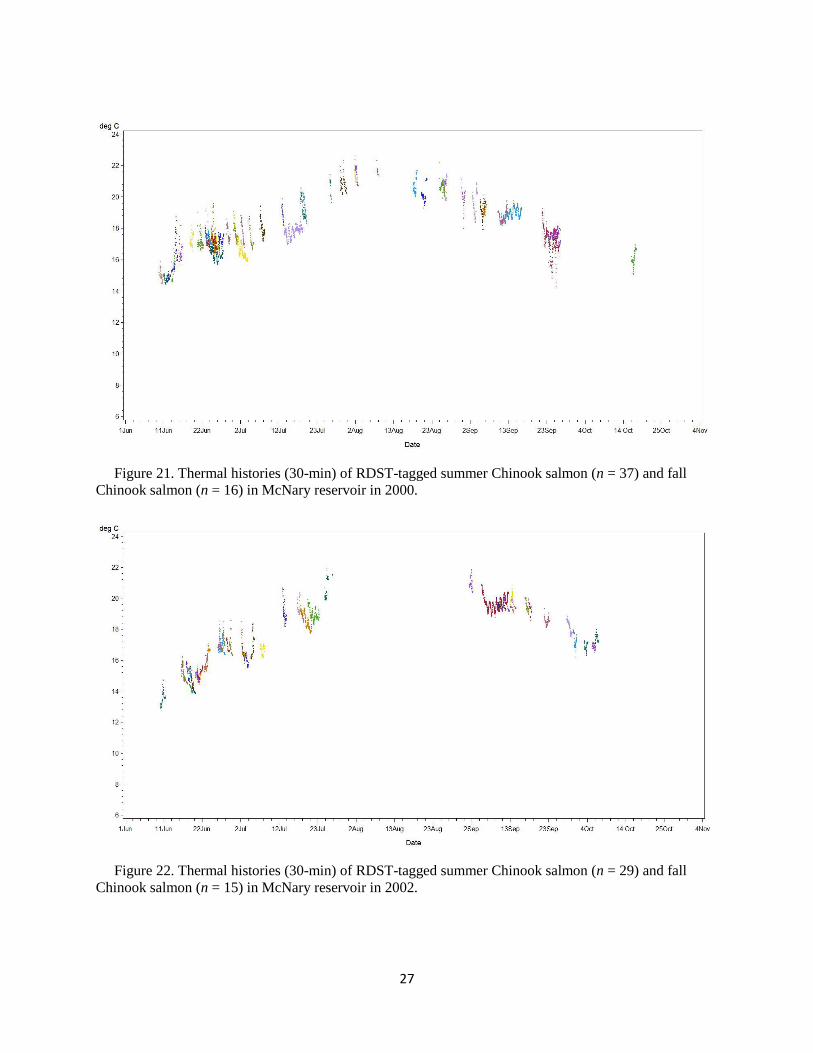
27
Figure 21. Thermal histories (30-min) of RDST-tagged summer Chinook salmon (n = 37) and fall
Chinook salmon (n = 16) in McNary reservoir in 2000.
Figure 22. Thermal histories (30-min) of RDST-tagged summer Chinook salmon (n = 29) and fall
Chinook salmon (n = 15) in McNary reservoir in 2002.

28
3.5.9 McNary reservoir reach: Steelhead
A total of 117 steelhead had RDST data in the reach and 112 (96%) of these passed through the
reach (Table 12). Several of the non-passers were reported harvested in the reservoir. A
majority (80%, n = 94) of the steelhead had no evidence of CWR use (Figures 23 and 24).
Patterns were similar for wild and hatchery fish. In contrast to in downstream reaches, steelhead
that encountered reservoir temperatures ≥20 °C were somewhat less likely to use CWR sites.
Thirteen steelhead (11% of 117) had incidental CWR use and 10 (9%) used unknown CWR sites.
Potential CWR sites included the Walla Walla River, the lower end of the Hanford Reach, or
other unidentified sites. A single steelhead was last detected in the Walla Walla River (Table 4).
Table 12. Numbers of steelhead with RDST temperature data collected in the McNary pool reach,
classified by their use / non-use of cold water refuge (CWR) sites, by hatchery (H) or presumed wild (W)
origin, and whether they encountered water temperature ≥20°C. Temperature data from the McNary Dam
WQM site were used as the ambient temperature reference.
Passed CWR use
Year Run MCN pool n None Incidental Unk CWR 1 CWR >1 CWR
2000 Steelhead Yes 39 34 (87%) 3 (8%) 2 (5%)
No 4 4 (100%)
n/a1 20
2002 Steelhead Yes 73 55 (75%) 10 (14%) 8 (11%)
No 1 1 (100%)
n/a1 61
Both Steelhead-W Yes+No 64 49 (77%) 7 (11%) 8 (13%)
Steelhead-H Yes+No 53 45 (85%) 6 (11%) 2 (4%)
Both T ≥ 20°C Yes+No 48 43 (90%) 3 (6%) 2 (4%)
Both T < 20°C Yes+No 69 51 (74%) 10 (14%) 8 (12%) 1 No DST temperature data in reach
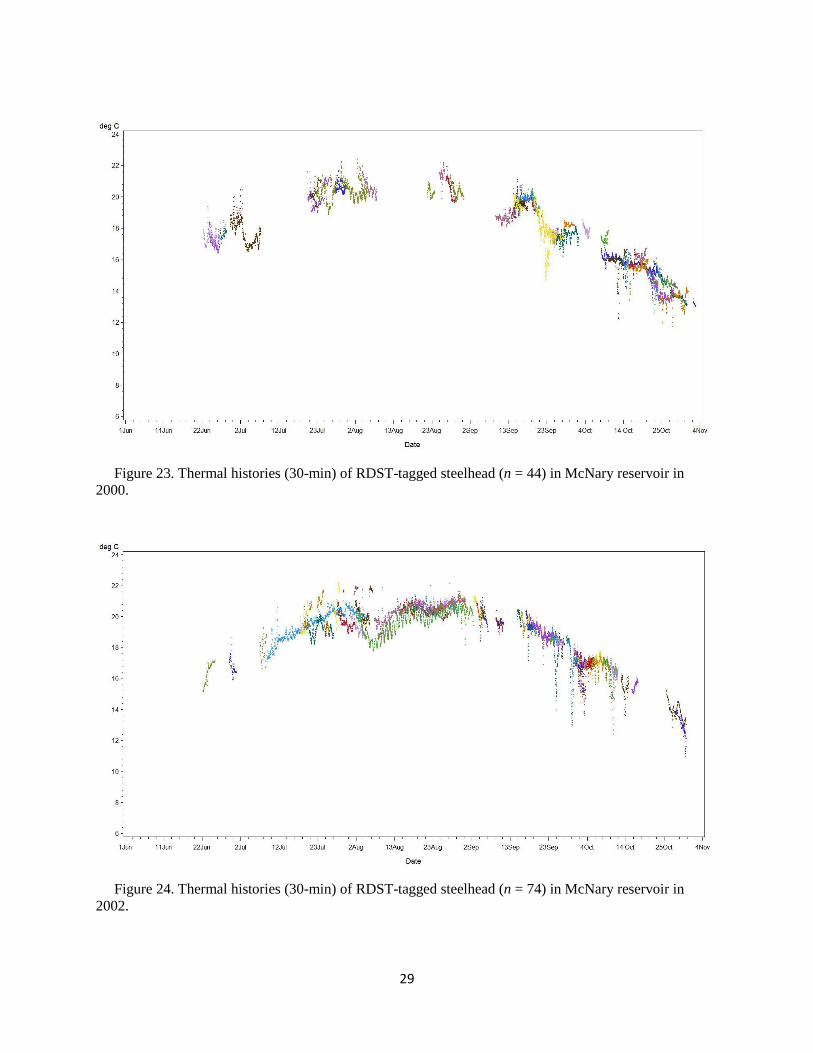
29
Figure 23. Thermal histories (30-min) of RDST-tagged steelhead (n = 44) in McNary reservoir in
2000.
Figure 24. Thermal histories (30-min) of RDST-tagged steelhead (n = 74) in McNary reservoir in
2002.

30
3.6 Residence times in each reach
Reach residence times were calculated using the number of RDST records (30-min) assigned to
each reach based on the radiotelemetry data (Figure 25). Time that fish spent in reservoir
reaches included their time in CWR sites for this section. Time that fish spent at dams included
time spent in tailraces and in fishways. The RDST-based estimates should not be considered
equivalent to passage times based strictly on radiotelemetry data at the start and end of a reach
for several reasons. First, some fish were in a reach for a short amount of time before they were
harvested (i.e., they did not pass entirely through the reach). Second, it was not always possible
to infer when fish moved downstream from tailraces back into reservoirs. Third, it was also
difficult to determine when fish exited the McNary reservoir reach into the Hanford Reach, as
there was no antenna monitoring the transition between these habitats. Fourth, in some cases the
RDST storage capacity was exceeded while a fish was traversing a reach, and hence residence
time was underestimated. Consequently, the summaries in Figure 25 should be a good
representation of the duration of the temperature data collected in each reach, but there was some
estimation error of total residence time for some fish in each run. For a thorough summary of
salmon and steelhead passage times through the study reaches, with much larger sample sizes,
see Keefer et al. (2004, 2009) and Goniea et al. (2006).

31
Days
0
5
10
15
20
25
30
35
2000
2002
Days
0
5
10
15
20
25
30
35
ds B
ON
BON p
ool
TDD
TDD p
ool
JDD
JDD p
ool
MCD
MCD p
ool
Han
ford
YAK
U C
OL
IHD
IHD p
ool
LMD
LMD p
ool
LGO
LGO p
ool
LGD
Days
0
5
10
15
20
25
30
35
Summer Chinook
Fall Chinook
Steelhead
Figure 25. Distributions of time RDST-tagged fish collected temperature data in each reach in 2000
(●) and 2002 (○). Whisker plots show 5th, 25
th, 50
th, 75
th, and 95
th percentiles. BON = Bonneville, TDD
= The Dalles, JDD = John Day, MCD = McNary, YAK = Yakima River, U COL = upper Columbia
River, IHD = Ice Harbor, LMD = Lower Monumental, LGO = Little Goose, LGD = Lower Granite.
Note: a small number of steelhead times in the Bonneville pool are not shown.
32
Most summer Chinook salmon spent < 4 d in each lower Columbia reach (Figure 25), reflecting
generally rapid upstream migration with little CWR use. Median migration times for fall
Chinook salmon were also < 4 d in each lower river reach, although the passage time distribution
was right-skewed in the Bonneville pool reach relative to summer Chinook salmon (Figure 25).
Steelhead passage times were far more variable than those of Chinook salmon, with some fish
taking weeks to pass through a reach; however, median steelhead residence times based on
RDST temperature records were ≤ 10 d in all lower river reaches.
3.7 Migration rates in reservoir reaches
To better standardize comparisons across reaches and to inform the HexSim model timesteps, we
calculated passage rates (km/h) for RDST-tagged fish through the four reservoir reaches. Start
times were the last radiotelemetry detection at a downstream dam (i.e., fishway exit antenna) to
the first detection at an upstream dam (i.e., fishway approach antenna). Fish that were harvested
in the reach or that were last detected in tributaries in the reach were excluded from rate
calculations. For a thorough summary of salmon and steelhead passage rates through the study
reaches, with much larger sample sizes, see Keefer et al. (2004, 2009) and Goniea et al. (2006).
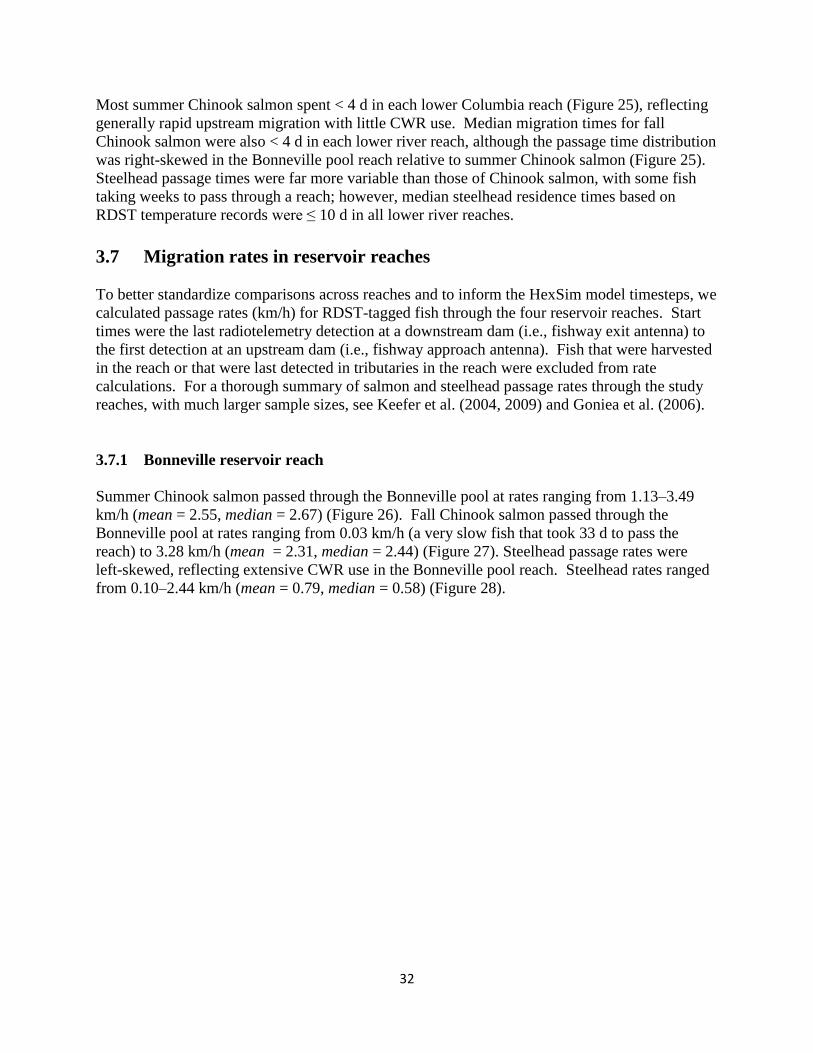
3.7.1 Bonneville reservoir reach
Summer Chinook salmon passed through the Bonneville pool at rates ranging from 1.13–3.49
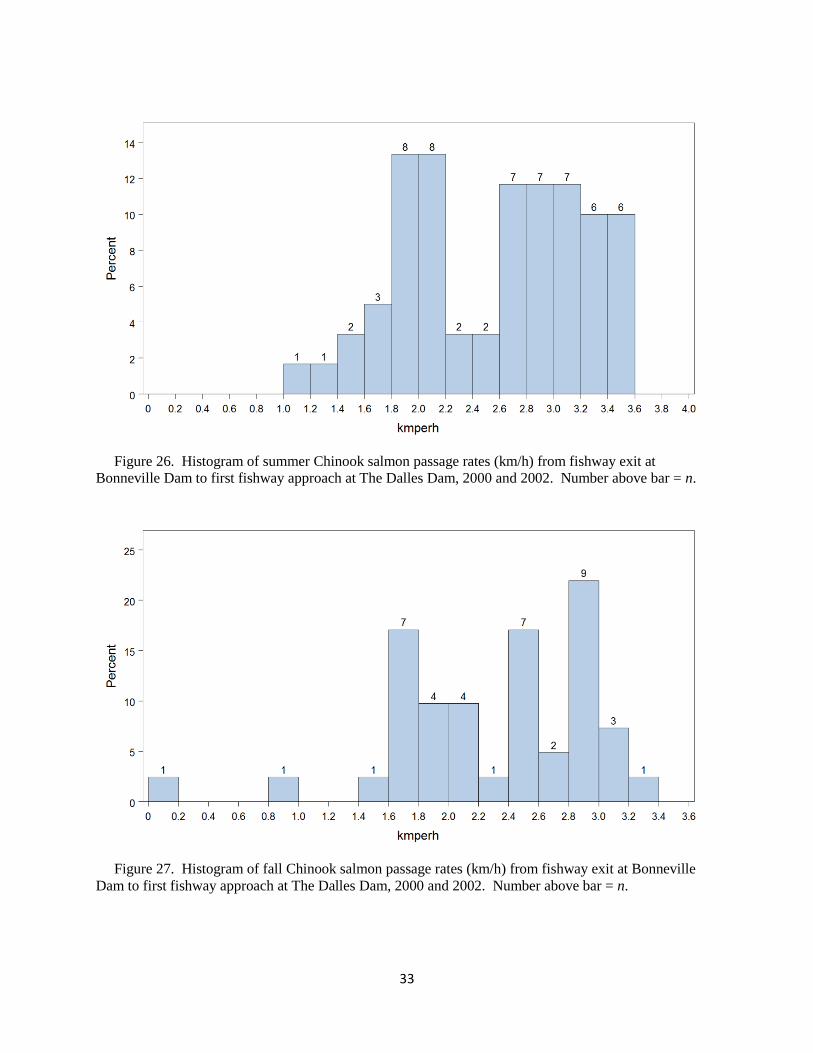
km/h (mean = 2.55, median = 2.67) (Figure 26). Fall Chinook salmon passed through the
Bonneville pool at rates ranging from 0.03 km/h (a very slow fish that took 33 d to pass the
reach) to 3.28 km/h (mean = 2.31, median = 2.44) (Figure 27). Steelhead passage rates were
left-skewed, reflecting extensive CWR use in the Bonneville pool reach. Steelhead rates ranged
from 0.10–2.44 km/h (mean = 0.79, median = 0.58) (Figure 28).
33
Figure 26. Histogram of summer Chinook salmon passage rates (km/h) from fishway exit at
Bonneville Dam to first fishway approach at The Dalles Dam, 2000 and 2002. Number above bar = n.
Figure 27. Histogram of fall Chinook salmon passage rates (km/h) from fishway exit at Bonneville
Dam to first fishway approach at The Dalles Dam, 2000 and 2002. Number above bar = n.
34
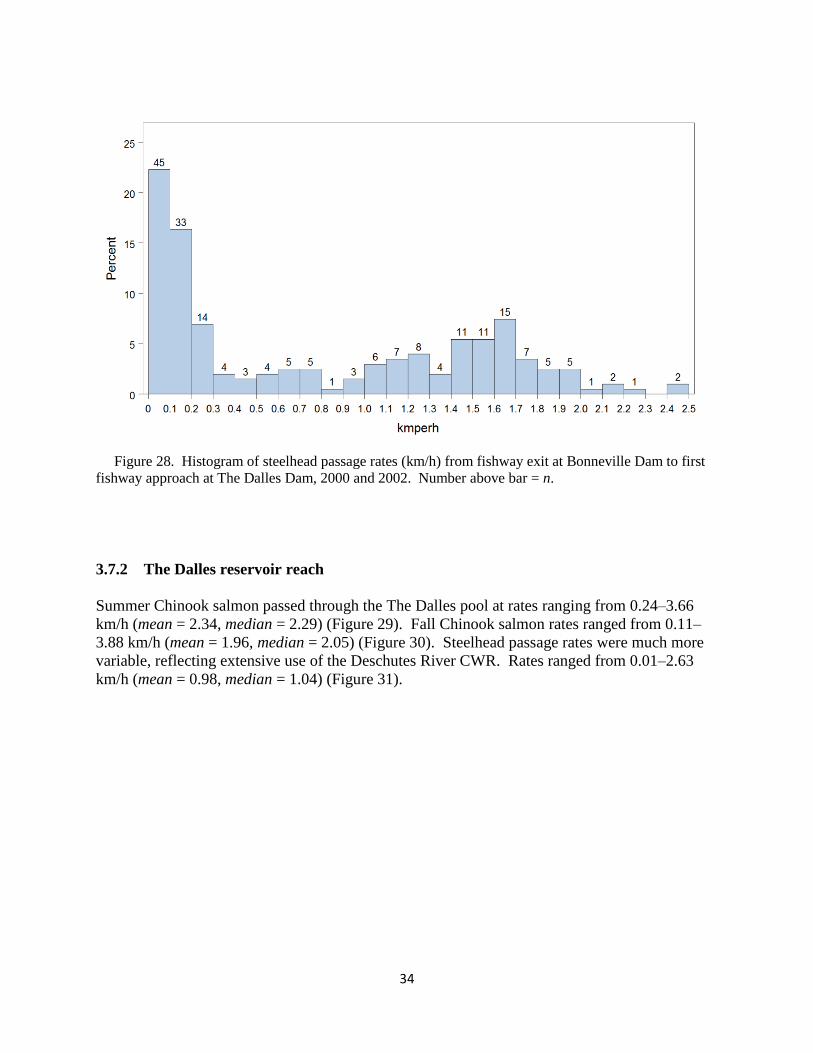
Figure 28. Histogram of steelhead passage rates (km/h) from fishway exit at Bonneville Dam to first
fishway approach at The Dalles Dam, 2000 and 2002. Number above bar = n.
3.7.2 The Dalles reservoir reach
Summer Chinook salmon passed through the The Dalles pool at rates ranging from 0.24–3.66
km/h (mean = 2.34, median = 2.29) (Figure 29). Fall Chinook salmon rates ranged from 0.11–
3.88 km/h (mean = 1.96, median = 2.05) (Figure 30). Steelhead passage rates were much more
variable, reflecting extensive use of the Deschutes River CWR. Rates ranged from 0.01–2.63
km/h (mean = 0.98, median = 1.04) (Figure 31).

35
Figure 29. Histogram of summer Chinook salmon passage rates (km/h) from fishway exit at The
Dalles Dam to first fishway approach at John Day Dam, 2000 and 2002. Number above bar = n.
Figure 30. Histogram of fall Chinook salmon passage rates (km/h) from fishway exit at The Dalles
Dam to first fishway approach at John Day Dam, 2000 and 2002. Number above bar = n.

36
Figure 31. Histogram of steelhead passage rates (km/h) from fishway exit at The Dalles Dam to first
fishway approach at John Day Dam, 2000 and 2002. Number above bar = n.
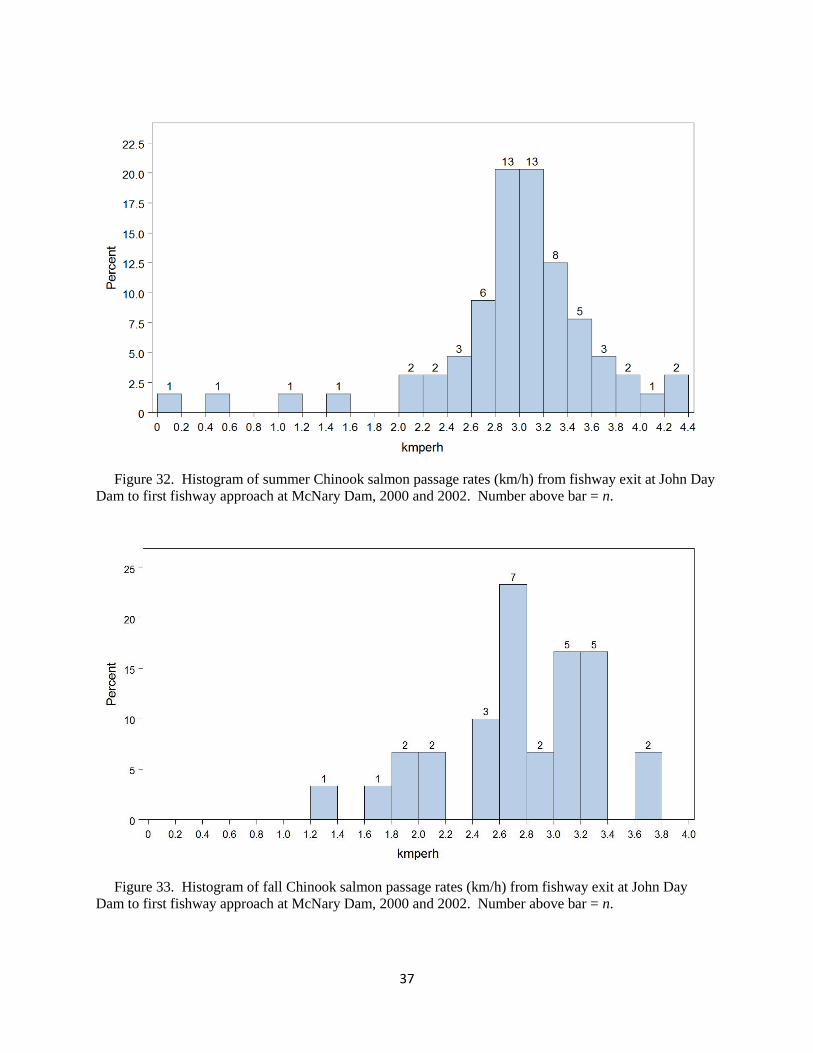
3.7.3 John Day reservoir reach
Summer Chinook salmon passed through the John Day pool at rates ranging from 0.10–4.27
km/h (mean = 2.95, median = 3.03) (Figure 32). Fall Chinook salmon rates ranged from 1.39–
3.67 km/h (mean = 2.76, median = 2.78) (Figure 33). Steelhead passage rates ranged from 0.09–
3.19 km/h (mean = 1.86, median = 1.90) (Figure 34).
37
Figure 32. Histogram of summer Chinook salmon passage rates (km/h) from fishway exit at John Day
Dam to first fishway approach at McNary Dam, 2000 and 2002. Number above bar = n.
Figure 33. Histogram of fall Chinook salmon passage rates (km/h) from fishway exit at John Day
Dam to first fishway approach at McNary Dam, 2000 and 2002. Number above bar = n.

38
Figure 34. Histogram of steelhead passage rates (km/h) from fishway exit at John Day Dam to first
fishway approach at McNary Dam, 2000 and 2002. Number above bar = n.
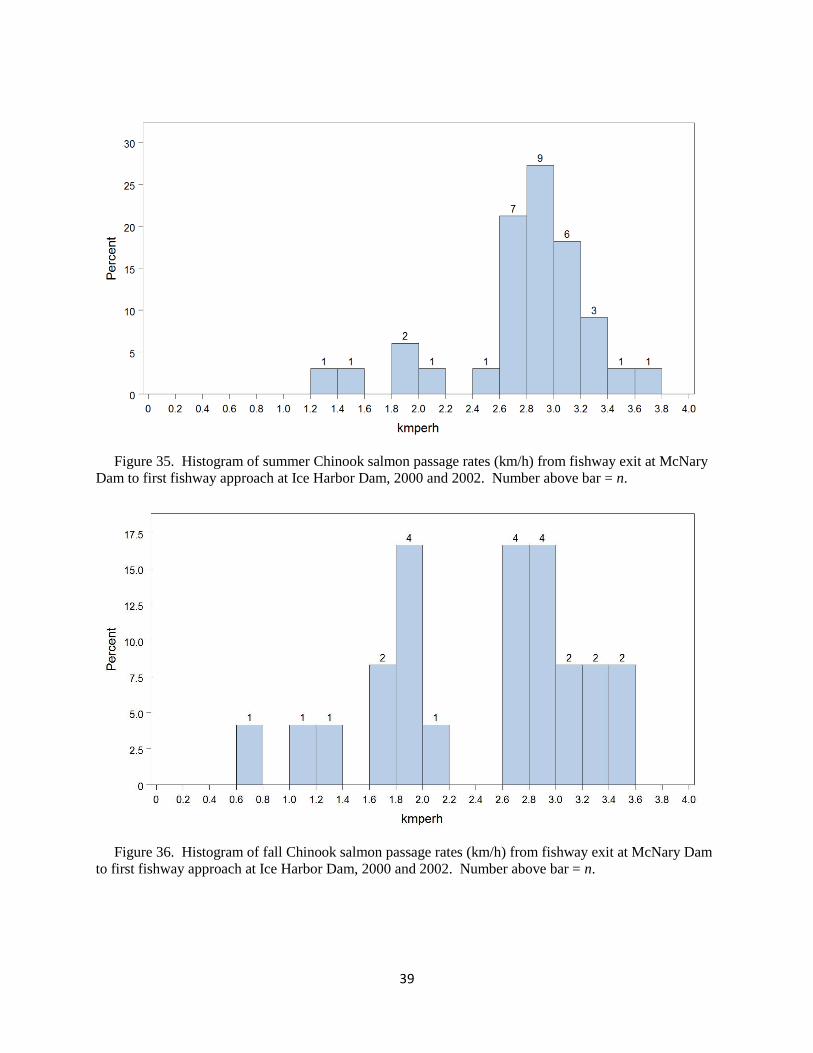
3.7.4 McNary reservoir reach
Summer Chinook salmon passed through the John Day pool at rates ranging from 1.36–3.73
km/h (mean = 2.80, median = 2.94) (Figure 35). Fall Chinook salmon rates ranged from 0.61–
3.57 km/h (mean = 2.42, median = 2.68) (Figure 36). Steelhead passage rates ranged from 0.02–
2.73 km/h (mean = 1.21, median = 1.31) (Figure 34). (Note: calculations for the McNary pool
reach do not include rates for fish that continued migrating up the Columbia River as there was
no antenna to monitor reservoir exit).
39
Figure 35. Histogram of summer Chinook salmon passage rates (km/h) from fishway exit at McNary
Dam to first fishway approach at Ice Harbor Dam, 2000 and 2002. Number above bar = n.
Figure 36. Histogram of fall Chinook salmon passage rates (km/h) from fishway exit at McNary Dam
to first fishway approach at Ice Harbor Dam, 2000 and 2002. Number above bar = n.
40
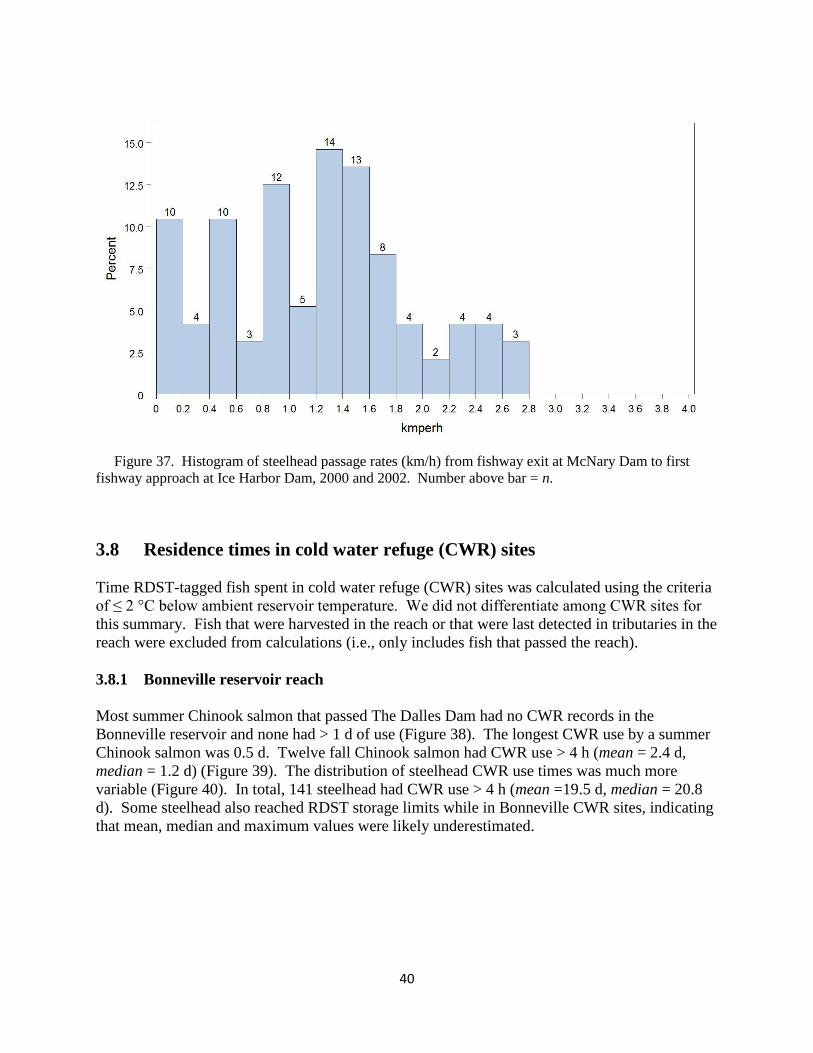
Figure 37. Histogram of steelhead passage rates (km/h) from fishway exit at McNary Dam to first
fishway approach at Ice Harbor Dam, 2000 and 2002. Number above bar = n.
3.8 Residence times in cold water refuge (CWR) sites
Time RDST-tagged fish spent in cold water refuge (CWR) sites was calculated using the criteria
of ≤ 2 °C below ambient reservoir temperature. We did not differentiate among CWR sites for
this summary. Fish that were harvested in the reach or that were last detected in tributaries in the
reach were excluded from calculations (i.e., only includes fish that passed the reach).
3.8.1 Bonneville reservoir reach
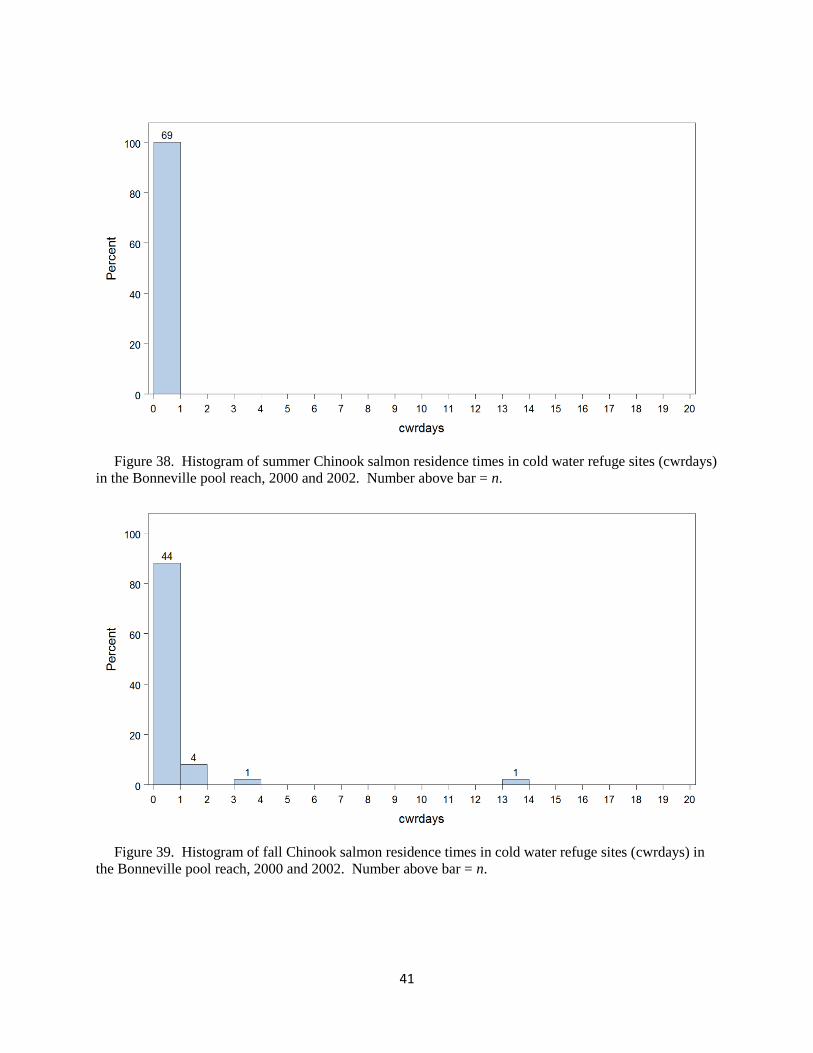
Most summer Chinook salmon that passed The Dalles Dam had no CWR records in the
Bonneville reservoir and none had > 1 d of use (Figure 38). The longest CWR use by a summer
Chinook salmon was 0.5 d. Twelve fall Chinook salmon had CWR use > 4 h (mean = 2.4 d,
median = 1.2 d) (Figure 39). The distribution of steelhead CWR use times was much more
variable (Figure 40). In total, 141 steelhead had CWR use > 4 h (mean =19.5 d, median = 20.8
d). Some steelhead also reached RDST storage limits while in Bonneville CWR sites, indicating
that mean, median and maximum values were likely underestimated.
41
Figure 38. Histogram of summer Chinook salmon residence times in cold water refuge sites (cwrdays)
in the Bonneville pool reach, 2000 and 2002. Number above bar = n.
Figure 39. Histogram of fall Chinook salmon residence times in cold water refuge sites (cwrdays) in
the Bonneville pool reach, 2000 and 2002. Number above bar = n.

42
Figure 40. Histogram of steelhead residence times in cold water refuge sites (cwrdays) in the
Bonneville pool reach, 2000 and 2002. Number above bar = n.
3.8.2 The Dalles reservoir reach
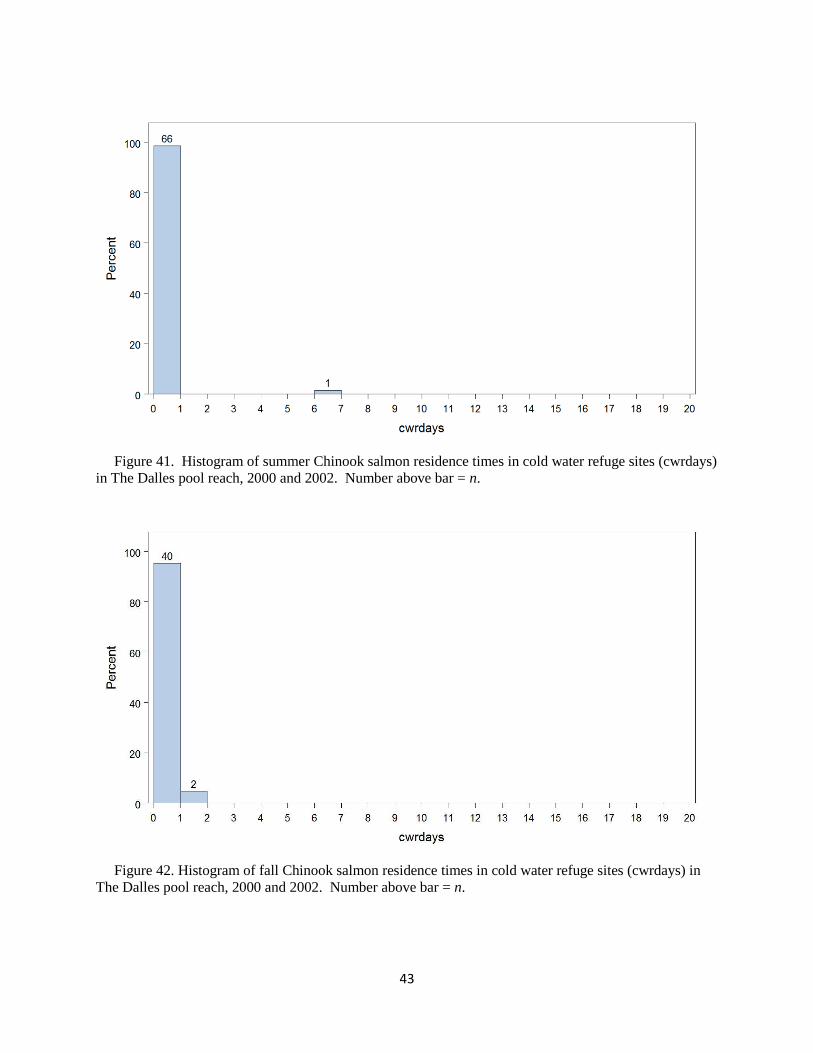
Most summer Chinook salmon that passed John Day Dam had no CWR records in The Dalles
reservoir and only one had > 1 d of use (6.9 d, Figure 41). Ten fall Chinook salmon had CWR
use > 4 h (mean = 0.9 d, median = 0.6 d) (Figure 42). The distribution of steelhead CWR use
times was much more variable (Figure 43). In total, 93 steelhead had CWR use > 4 h (mean =
6.3 d, median = 2.1 d). Some steelhead also reached RDST storage limits while in the reach,
indicating that mean, median and maximum values were likely underestimated.
43
Figure 41. Histogram of summer Chinook salmon residence times in cold water refuge sites (cwrdays)
in The Dalles pool reach, 2000 and 2002. Number above bar = n.
Figure 42. Histogram of fall Chinook salmon residence times in cold water refuge sites (cwrdays) in
The Dalles pool reach, 2000 and 2002. Number above bar = n.
44
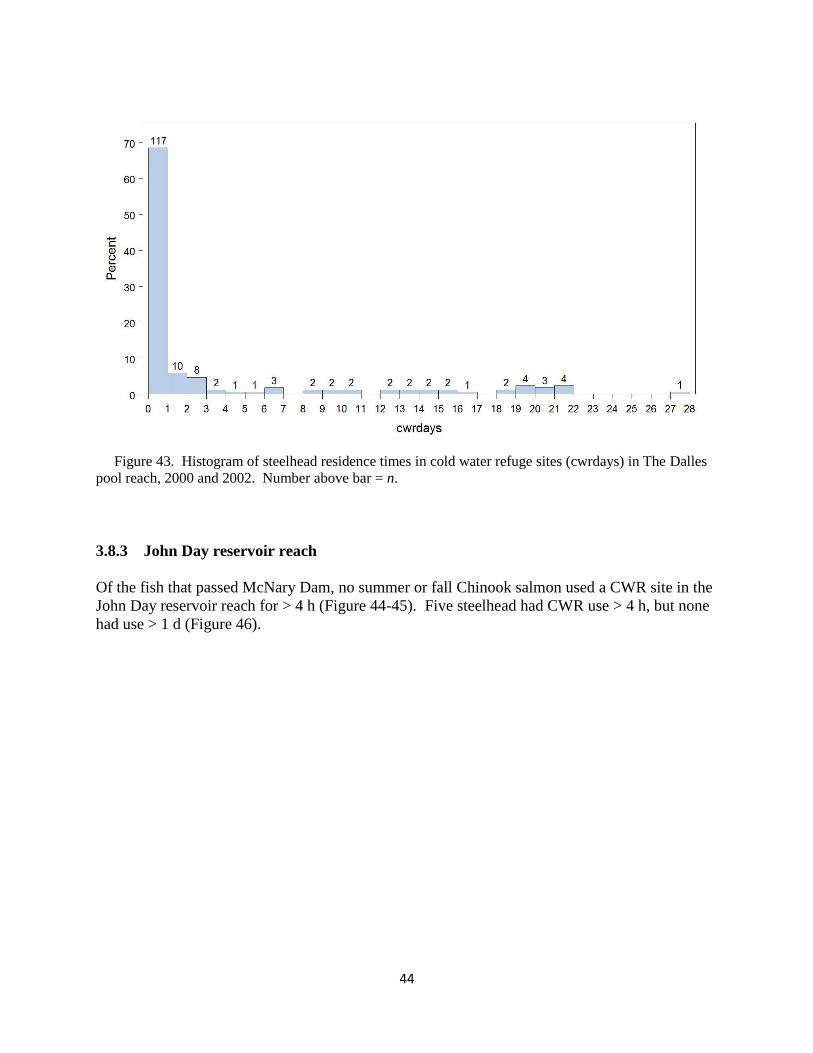
Figure 43. Histogram of steelhead residence times in cold water refuge sites (cwrdays) in The Dalles
pool reach, 2000 and 2002. Number above bar = n.
3.8.3 John Day reservoir reach
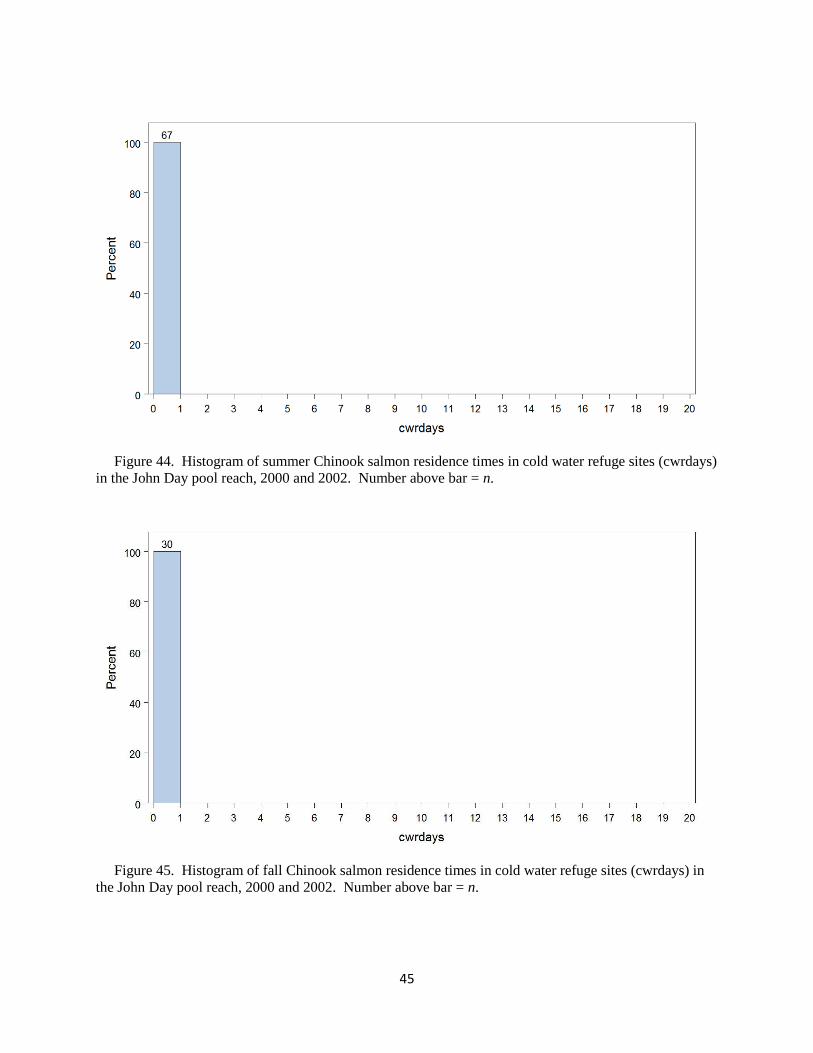
Of the fish that passed McNary Dam, no summer or fall Chinook salmon used a CWR site in the
John Day reservoir reach for > 4 h (Figure 44-45). Five steelhead had CWR use > 4 h, but none
had use > 1 d (Figure 46).
45
Figure 44. Histogram of summer Chinook salmon residence times in cold water refuge sites (cwrdays)
in the John Day pool reach, 2000 and 2002. Number above bar = n.
Figure 45. Histogram of fall Chinook salmon residence times in cold water refuge sites (cwrdays) in
the John Day pool reach, 2000 and 2002. Number above bar = n.
46
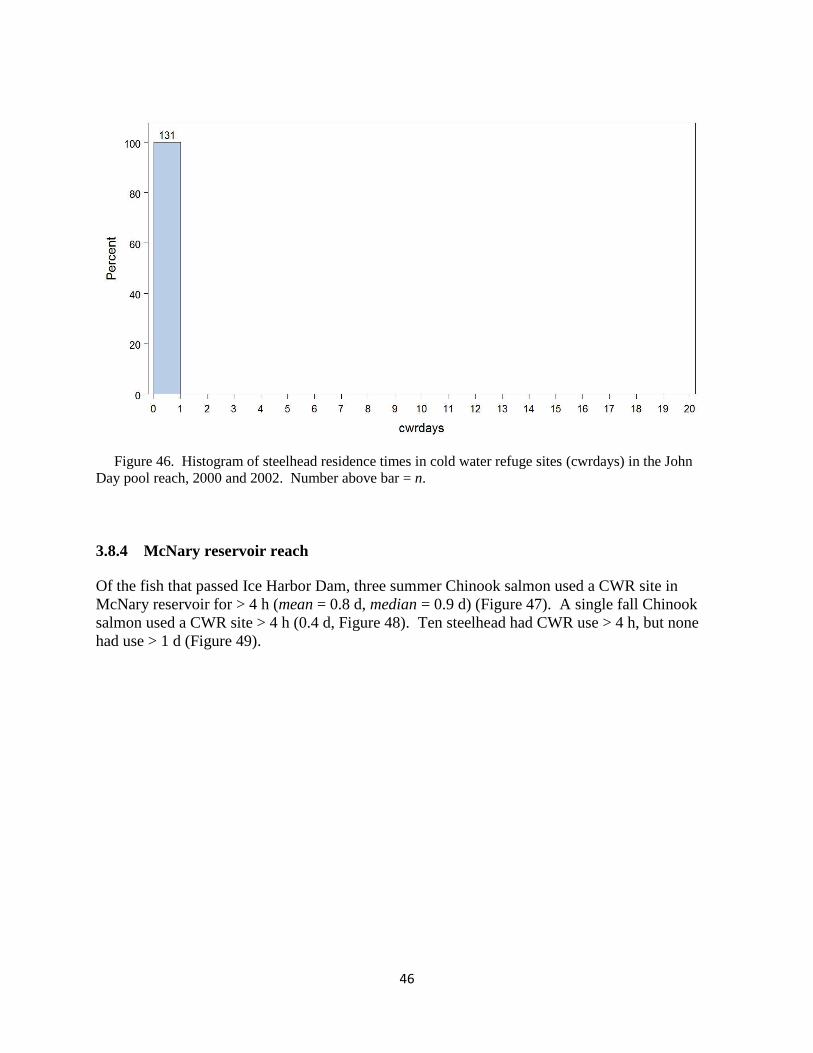
Figure 46. Histogram of steelhead residence times in cold water refuge sites (cwrdays) in the John
Day pool reach, 2000 and 2002. Number above bar = n.
3.8.4 McNary reservoir reach
Of the fish that passed Ice Harbor Dam, three summer Chinook salmon used a CWR site in
McNary reservoir for > 4 h (mean = 0.8 d, median = 0.9 d) (Figure 47). A single fall Chinook
salmon used a CWR site > 4 h (0.4 d, Figure 48). Ten steelhead had CWR use > 4 h, but none
had use > 1 d (Figure 49).
47
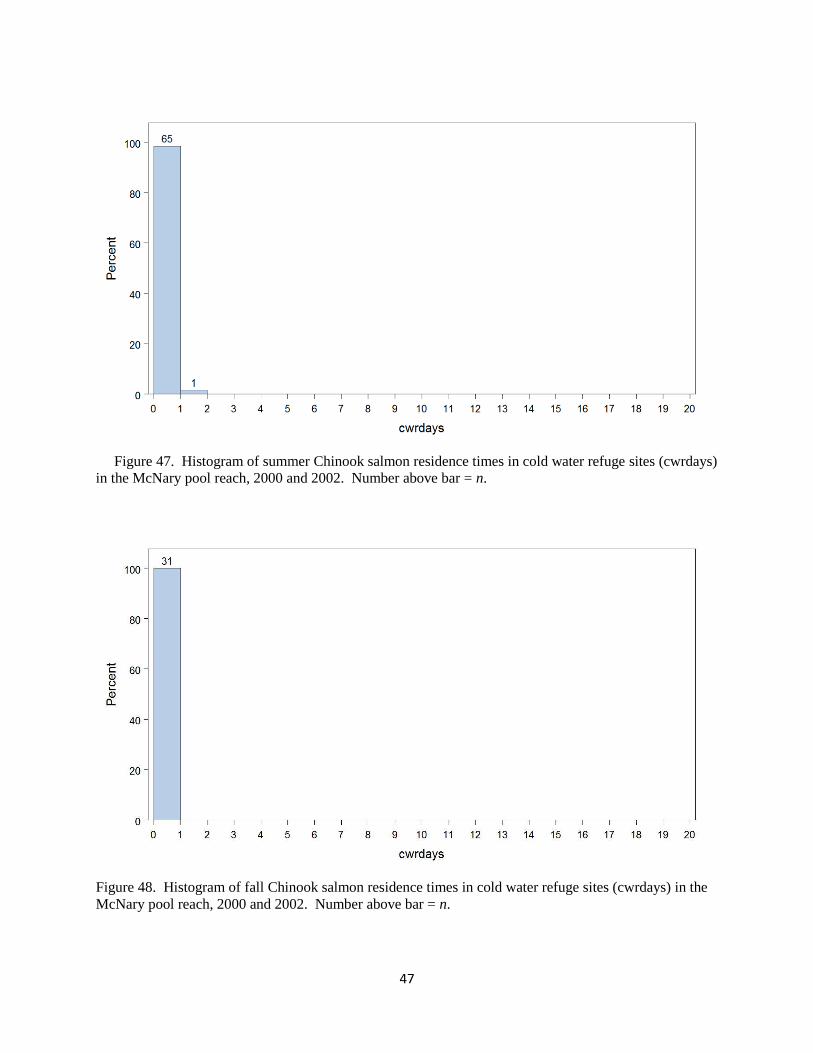
Figure 47. Histogram of summer Chinook salmon residence times in cold water refuge sites (cwrdays)
in the McNary pool reach, 2000 and 2002. Number above bar = n.
Figure 48. Histogram of fall Chinook salmon residence times in cold water refuge sites (cwrdays) in the
McNary pool reach, 2000 and 2002. Number above bar = n.
48
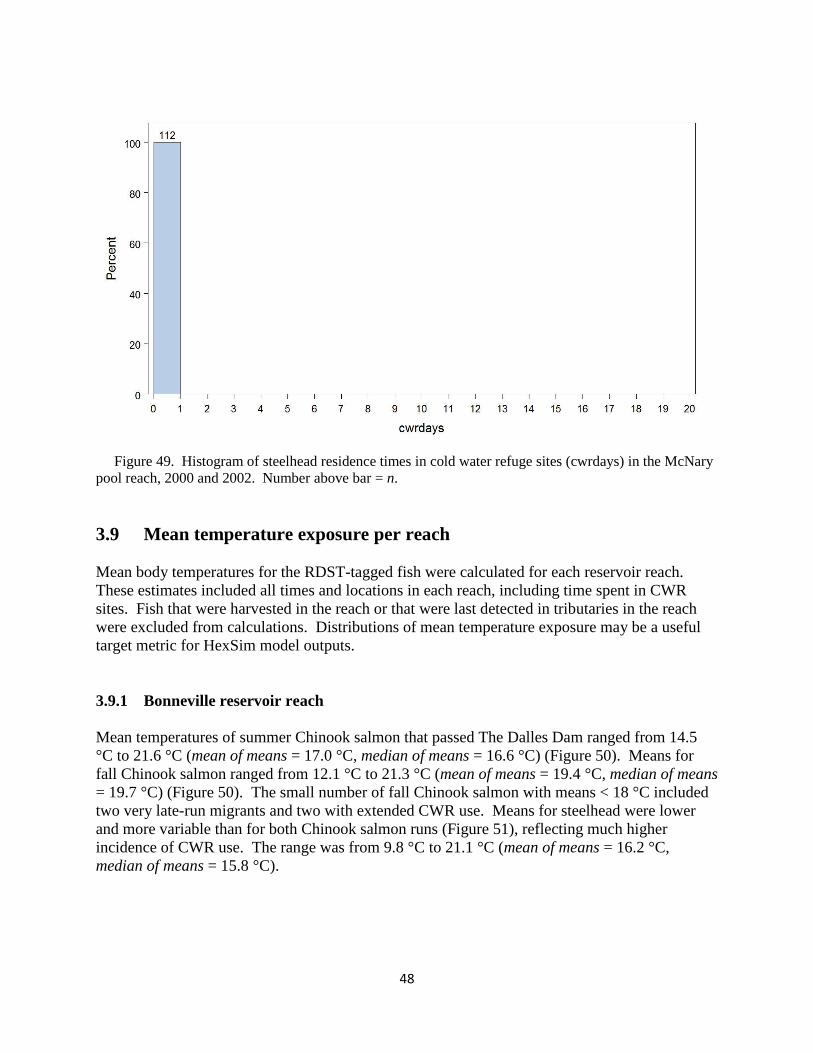
Figure 49. Histogram of steelhead residence times in cold water refuge sites (cwrdays) in the McNary
pool reach, 2000 and 2002. Number above bar = n.
3.9 Mean temperature exposure per reach
Mean body temperatures for the RDST-tagged fish were calculated for each reservoir reach.
These estimates included all times and locations in each reach, including time spent in CWR
sites. Fish that were harvested in the reach or that were last detected in tributaries in the reach
were excluded from calculations. Distributions of mean temperature exposure may be a useful
target metric for HexSim model outputs.
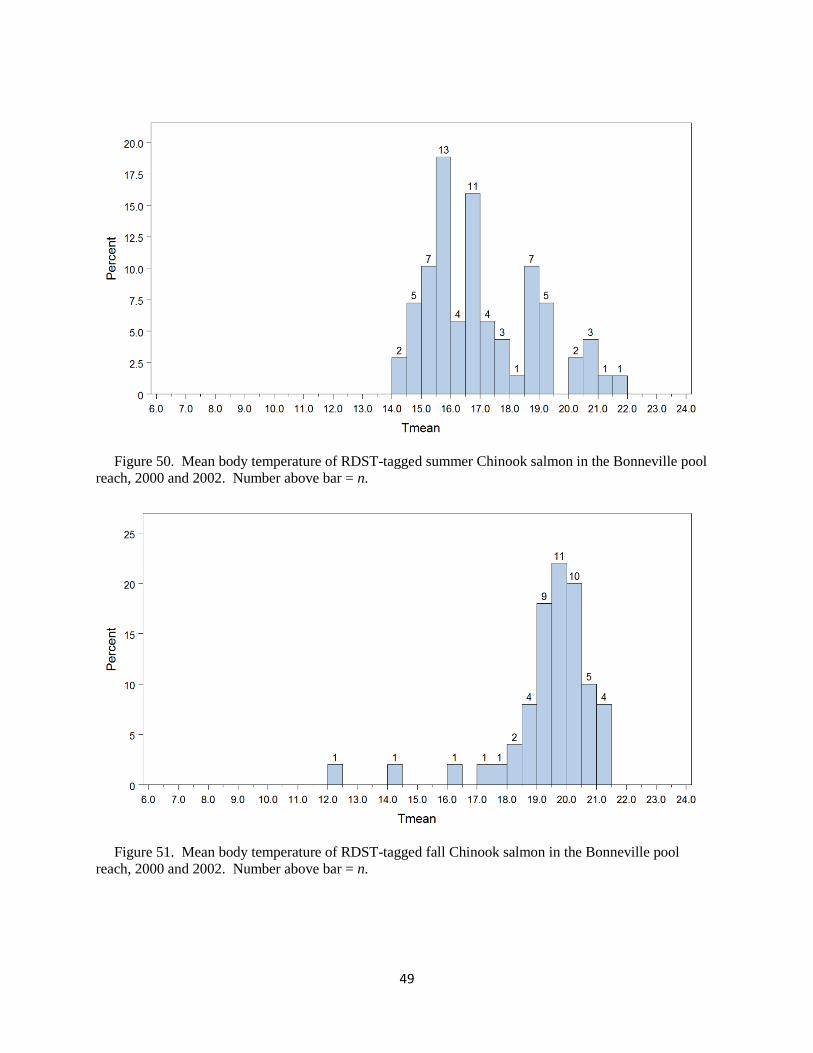
3.9.1 Bonneville reservoir reach
Mean temperatures of summer Chinook salmon that passed The Dalles Dam ranged from 14.5
°C to 21.6 °C (mean of means = 17.0 °C, median of means = 16.6 °C) (Figure 50). Means for
fall Chinook salmon ranged from 12.1 °C to 21.3 °C (mean of means = 19.4 °C, median of means
= 19.7 °C) (Figure 50). The small number of fall Chinook salmon with means < 18 °C included
two very late-run migrants and two with extended CWR use. Means for steelhead were lower
and more variable than for both Chinook salmon runs (Figure 51), reflecting much higher
incidence of CWR use. The range was from 9.8 °C to 21.1 °C (mean of means = 16.2 °C,
median of means = 15.8 °C).
49
Figure 50. Mean body temperature of RDST-tagged summer Chinook salmon in the Bonneville pool
reach, 2000 and 2002. Number above bar = n.
Figure 51. Mean body temperature of RDST-tagged fall Chinook salmon in the Bonneville pool
reach, 2000 and 2002. Number above bar = n.
50
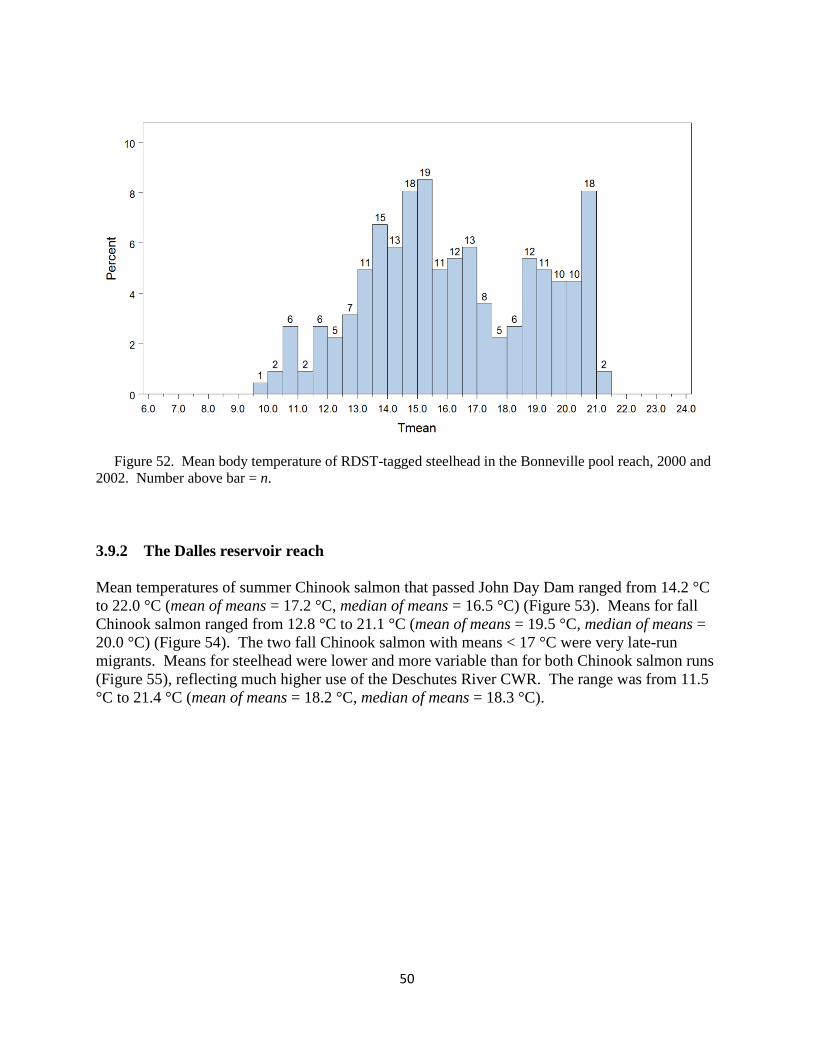
Figure 52. Mean body temperature of RDST-tagged steelhead in the Bonneville pool reach, 2000 and
2002. Number above bar = n.
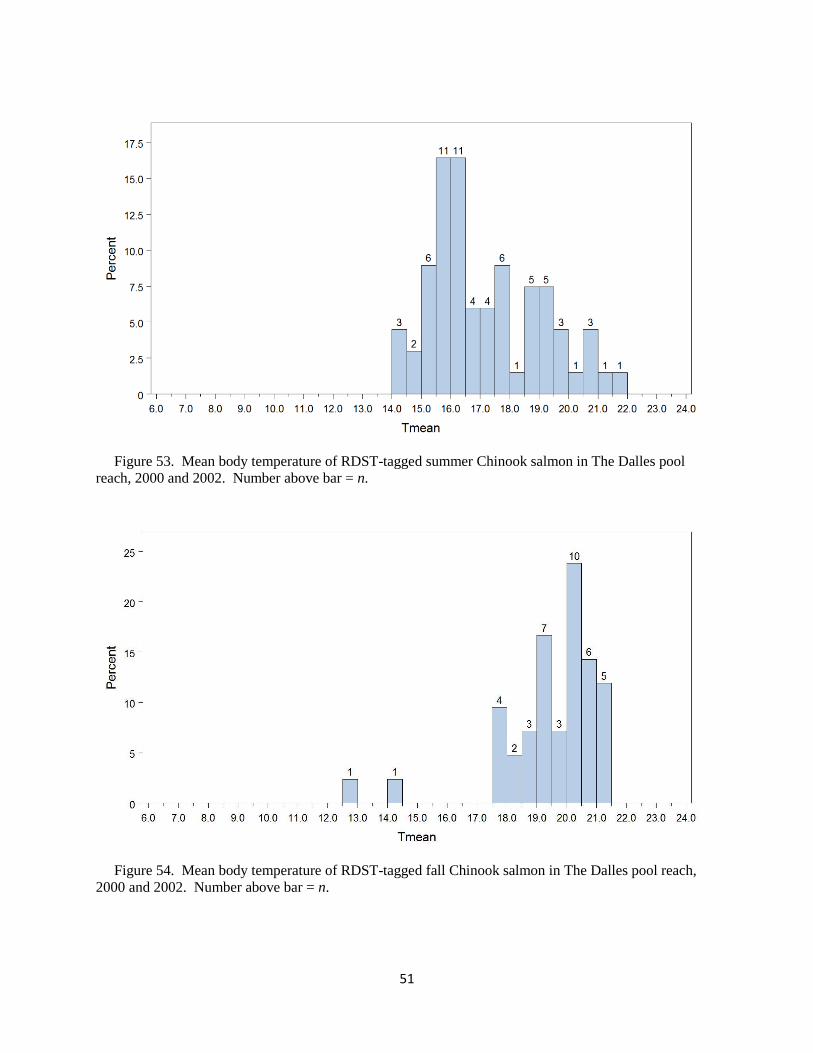
3.9.2 The Dalles reservoir reach
Mean temperatures of summer Chinook salmon that passed John Day Dam ranged from 14.2 °C
to 22.0 °C (mean of means = 17.2 °C, median of means = 16.5 °C) (Figure 53). Means for fall
Chinook salmon ranged from 12.8 °C to 21.1 °C (mean of means = 19.5 °C, median of means =
20.0 °C) (Figure 54). The two fall Chinook salmon with means < 17 °C were very late-run
migrants. Means for steelhead were lower and more variable than for both Chinook salmon runs
(Figure 55), reflecting much higher use of the Deschutes River CWR. The range was from 11.5
°C to 21.4 °C (mean of means = 18.2 °C, median of means = 18.3 °C).
51
Figure 53. Mean body temperature of RDST-tagged summer Chinook salmon in The Dalles pool
reach, 2000 and 2002. Number above bar = n.
Figure 54. Mean body temperature of RDST-tagged fall Chinook salmon in The Dalles pool reach,
2000 and 2002. Number above bar = n.

52
Figure 55. Mean body temperature of RDST-tagged steelhead in The Dalles pool reach, 2000 and
2002. Number above bar = n.
3.9.3 John Day reservoir reach
Mean temperatures of summer Chinook salmon that passed McNary Dam ranged from 13.8 °C
to 22.2 °C (mean of means = 17.6 °C, median of means = 17.4 °C) (Figure 56). Means for fall
Chinook salmon ranged from 16.0 °C to 21.7 °C (mean of means = 19.6 °C, median of means =
20.0 °C) (Figure 57). Means for steelhead were somewhat more variable than for both Chinook
salmon runs (Figure 58); the lowest means were for migrants in late October and early
November. The range for steelhead was from 11.0 °C to 21.8 °C (mean of means = 18.7 °C,
median of means = 19.1 °C).

53
Figure 56. Mean body temperature of RDST-tagged summer Chinook salmon in the John Day pool
reach, 2000 and 2002. Number above bar = n.
Figure 57. Mean body temperature of RDST-tagged fall Chinook salmon in the John Day pool reach,
2000 and 2002. Number above bar = n.

54
Figure 58. Mean body temperature of RDST-tagged steelhead in the John Day pool reach, 2000 and
2002. Number above bar = n.
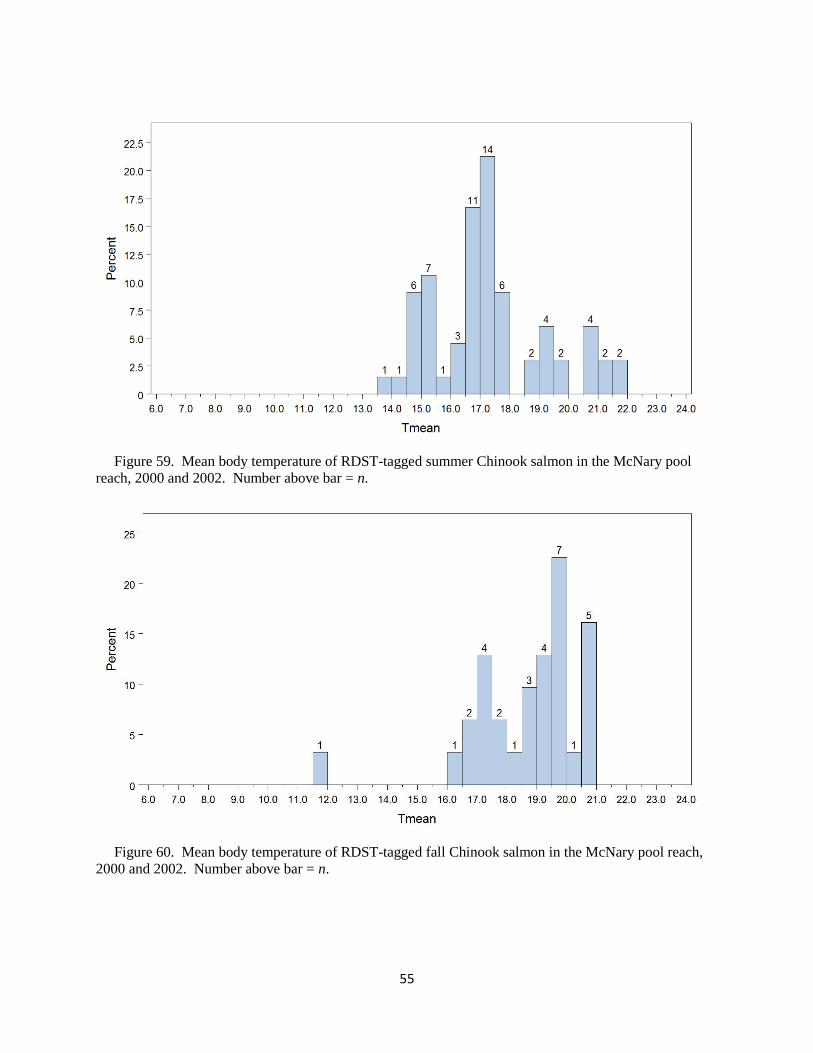
3.9.4 McNary reservoir reach
Mean temperatures of summer Chinook salmon that passed through the McNary reach ranged
from 13.5 °C to 21.6 °C (mean of means = 17.3 °C, median of means = 17.0 °C) (Figure 59).
Means for fall Chinook salmon ranged from 11.7 °C to 20.9 °C (mean of means = 18.7 °C,
median of means = 19.2 °C) (Figure 60). The lowest mean was for a mid-November migrant.
The range for steelhead was bimodally distributed (Figure 61) from 11.5 °C to 21.5 °C (mean of
means = 18.2 °C, median of means = 18.6 °C). The cooler mode included a higher proportion of
late-run migrants than the warmer mode.
55
Figure 59. Mean body temperature of RDST-tagged summer Chinook salmon in the McNary pool
reach, 2000 and 2002. Number above bar = n.
Figure 60. Mean body temperature of RDST-tagged fall Chinook salmon in the McNary pool reach,
2000 and 2002. Number above bar = n.

56
Figure 61. Mean body temperature of RDST-tagged steelhead in the McNary pool reach, 2000 and
2002. Number above bar = n.
3.10 Maximum temperature exposure per reach
Maximum body temperatures for the RDST-tagged fish were calculated for each reservoir reach.
These estimates included all times and locations in each reach. Fish that were harvested in the
reach or that were last detected in tributaries in the reach were excluded from calculations.
Distributions of maximum temperature exposure may be a useful target metric for HexSim
model outputs.
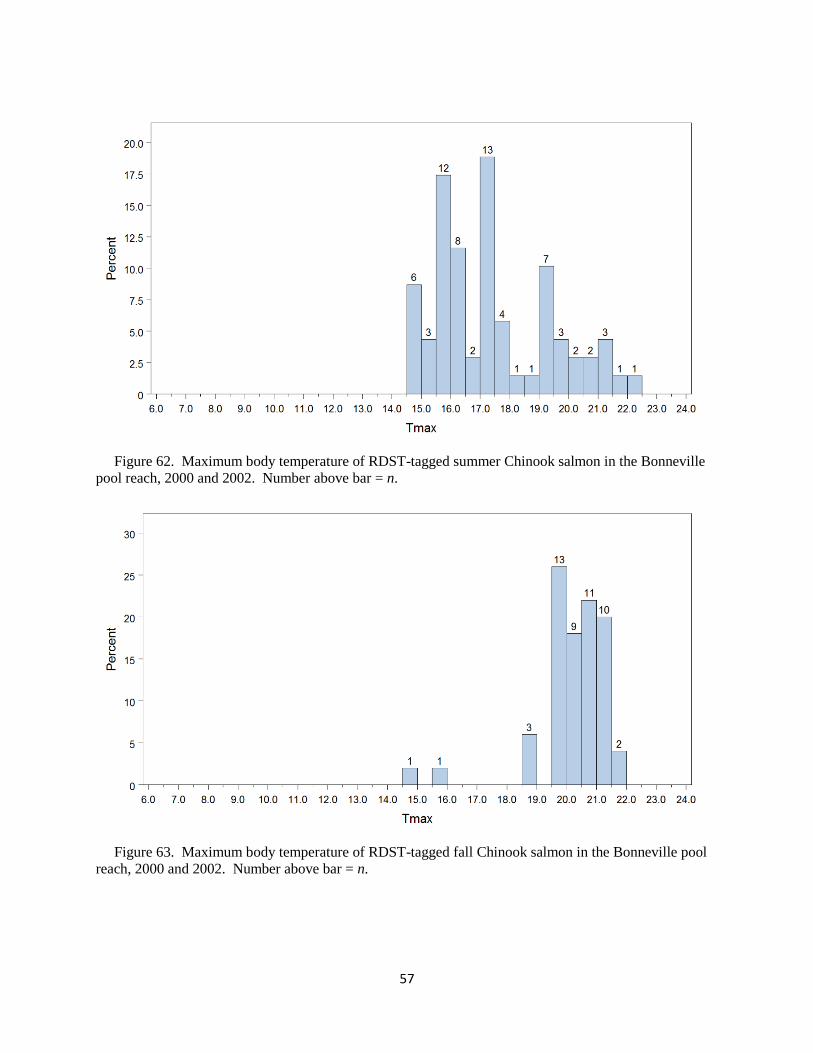
3.10.1 Bonneville reservoir reach
Maximum temperatures of summer Chinook salmon that passed The Dalles Dam ranged from
14.8 °C to 22.2 °C (mean of maximums = 17.5 °C, median of maximums = 17.1 °C) (Figure 62).
Means for fall Chinook salmon ranged from 14.7 °C to 21.6 °C (mean of maximums = 20.2 °C,
median of maximums = 20.5 °C) (Figure 63). Maximums for steelhead ranged from 15.7 °C to
22.4 °C (mean of maximums = 20.2 °C, median of maximums = 20.7 °C). Low maximum values
for steelhead tended to be early or late in the runs.
57
Figure 62. Maximum body temperature of RDST-tagged summer Chinook salmon in the Bonneville
pool reach, 2000 and 2002. Number above bar = n.
Figure 63. Maximum body temperature of RDST-tagged fall Chinook salmon in the Bonneville pool
reach, 2000 and 2002. Number above bar = n.
58
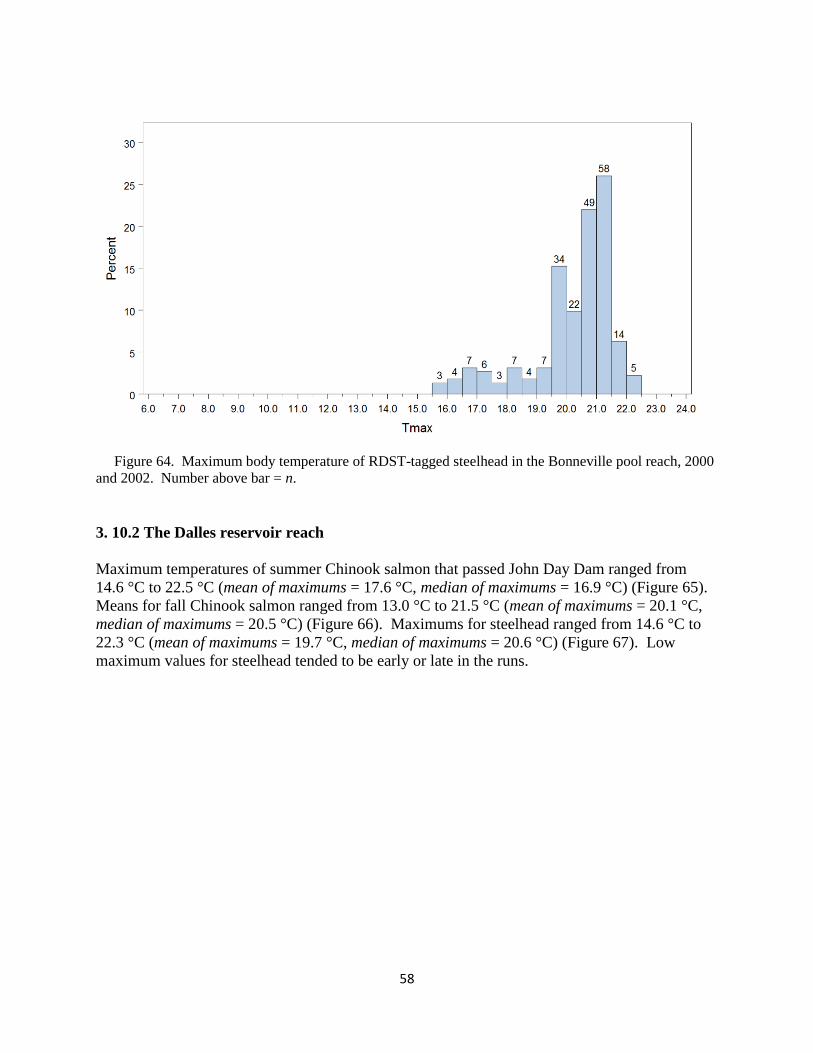
Figure 64. Maximum body temperature of RDST-tagged steelhead in the Bonneville pool reach, 2000
and 2002. Number above bar = n.
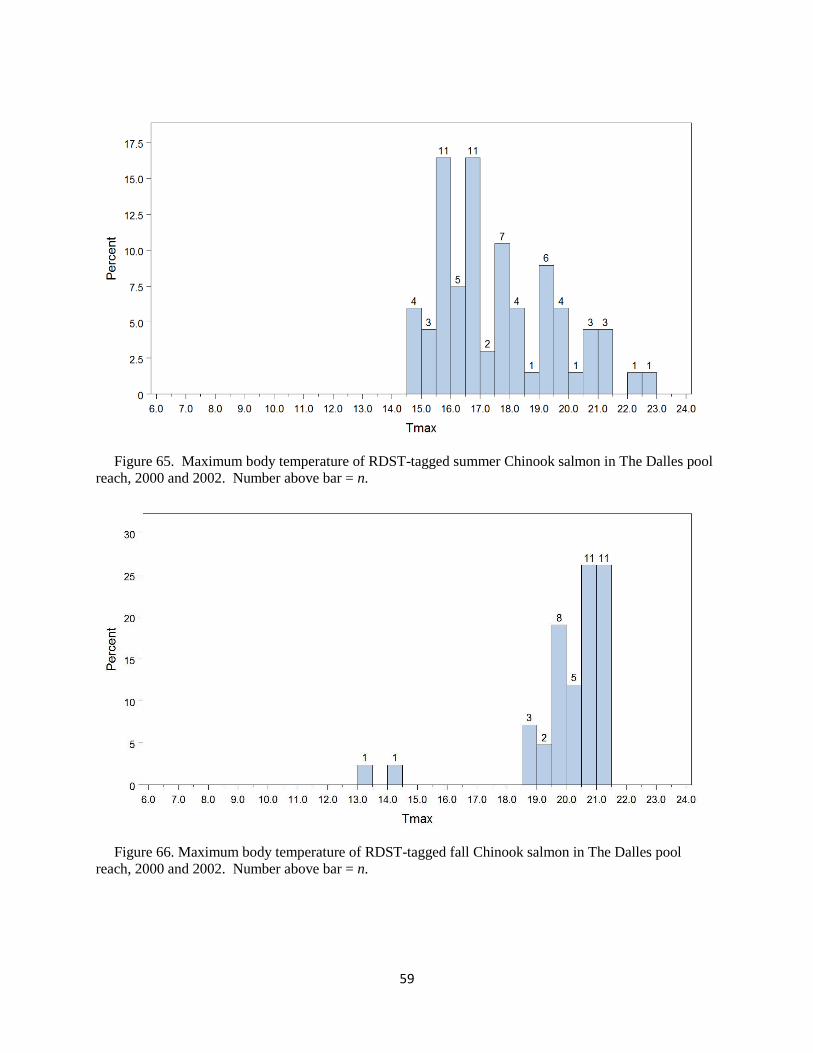
3. 10.2 The Dalles reservoir reach
Maximum temperatures of summer Chinook salmon that passed John Day Dam ranged from
14.6 °C to 22.5 °C (mean of maximums = 17.6 °C, median of maximums = 16.9 °C) (Figure 65).
Means for fall Chinook salmon ranged from 13.0 °C to 21.5 °C (mean of maximums = 20.1 °C,
median of maximums = 20.5 °C) (Figure 66). Maximums for steelhead ranged from 14.6 °C to
22.3 °C (mean of maximums = 19.7 °C, median of maximums = 20.6 °C) (Figure 67). Low
maximum values for steelhead tended to be early or late in the runs.
59
Figure 65. Maximum body temperature of RDST-tagged summer Chinook salmon in The Dalles pool
reach, 2000 and 2002. Number above bar = n.
Figure 66. Maximum body temperature of RDST-tagged fall Chinook salmon in The Dalles pool
reach, 2000 and 2002. Number above bar = n.
60
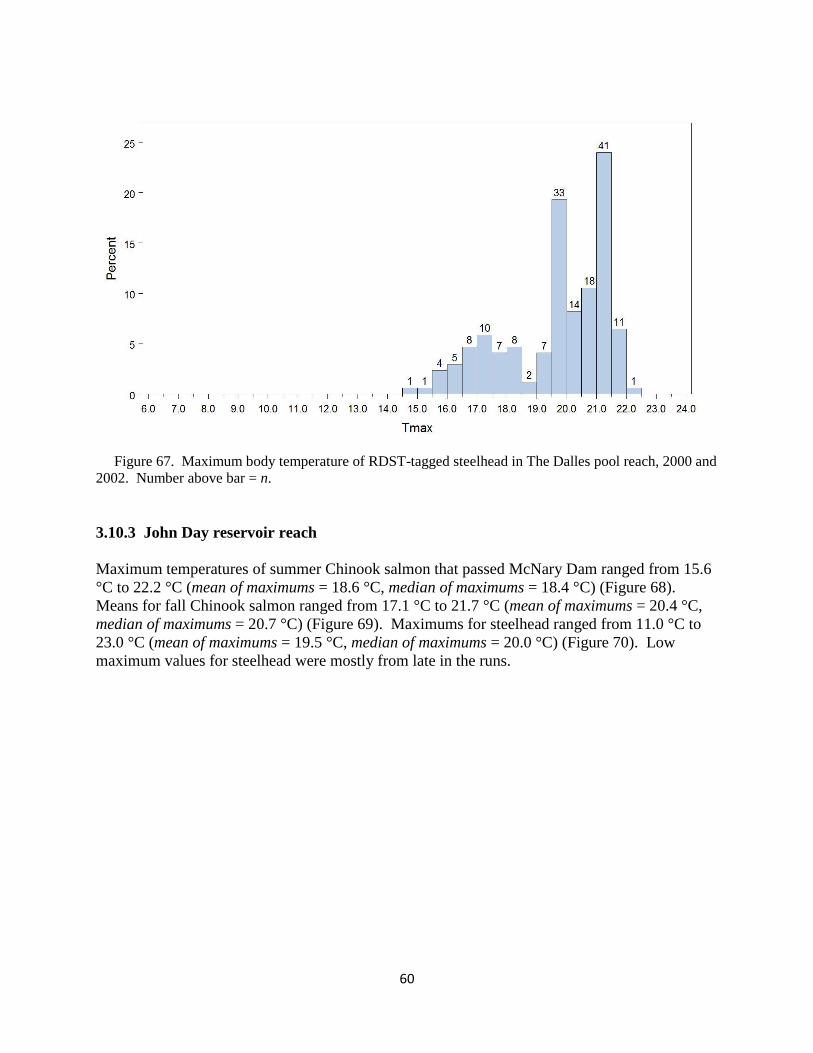
Figure 67. Maximum body temperature of RDST-tagged steelhead in The Dalles pool reach, 2000 and
2002. Number above bar = n.
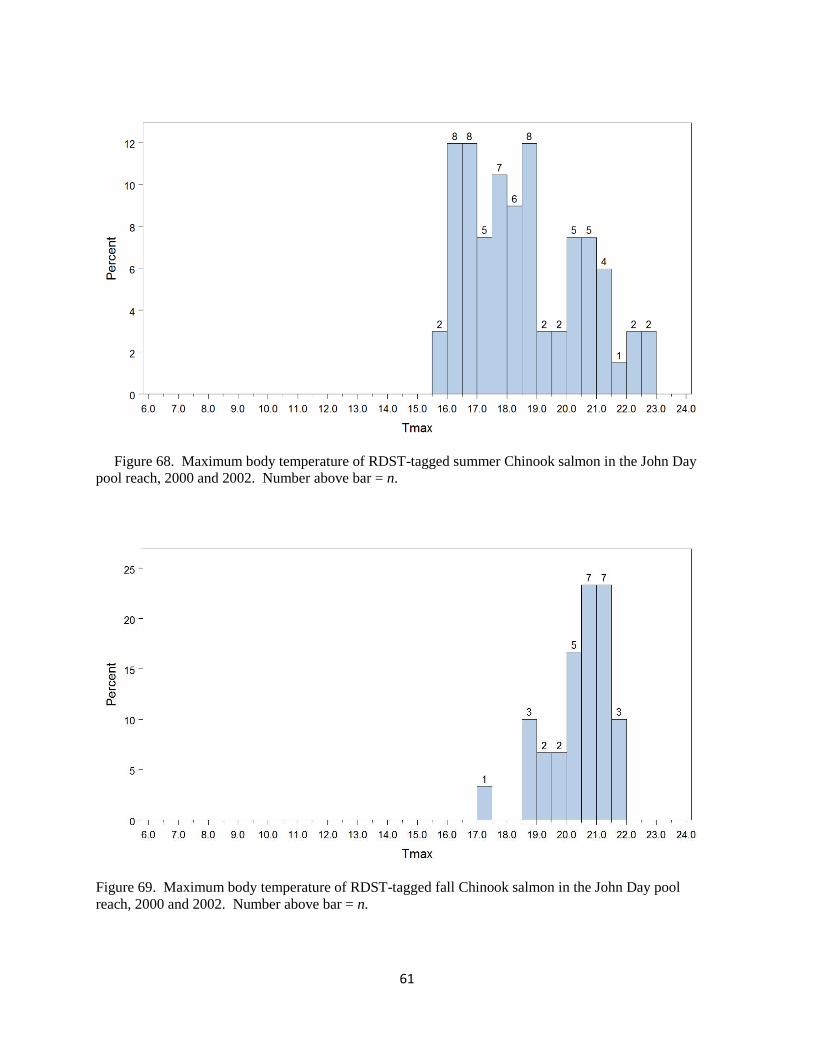
3.10.3 John Day reservoir reach
Maximum temperatures of summer Chinook salmon that passed McNary Dam ranged from 15.6
°C to 22.2 °C (mean of maximums = 18.6 °C, median of maximums = 18.4 °C) (Figure 68).
Means for fall Chinook salmon ranged from 17.1 °C to 21.7 °C (mean of maximums = 20.4 °C,
median of maximums = 20.7 °C) (Figure 69). Maximums for steelhead ranged from 11.0 °C to
23.0 °C (mean of maximums = 19.5 °C, median of maximums = 20.0 °C) (Figure 70). Low
maximum values for steelhead were mostly from late in the runs.
61
Figure 68. Maximum body temperature of RDST-tagged summer Chinook salmon in the John Day
pool reach, 2000 and 2002. Number above bar = n.
Figure 69. Maximum body temperature of RDST-tagged fall Chinook salmon in the John Day pool
reach, 2000 and 2002. Number above bar = n.
62
Figure 70. Maximum body temperature of RDST-tagged steelhead in the John Day pool reach, 2000
and 2002. Number above bar = n.
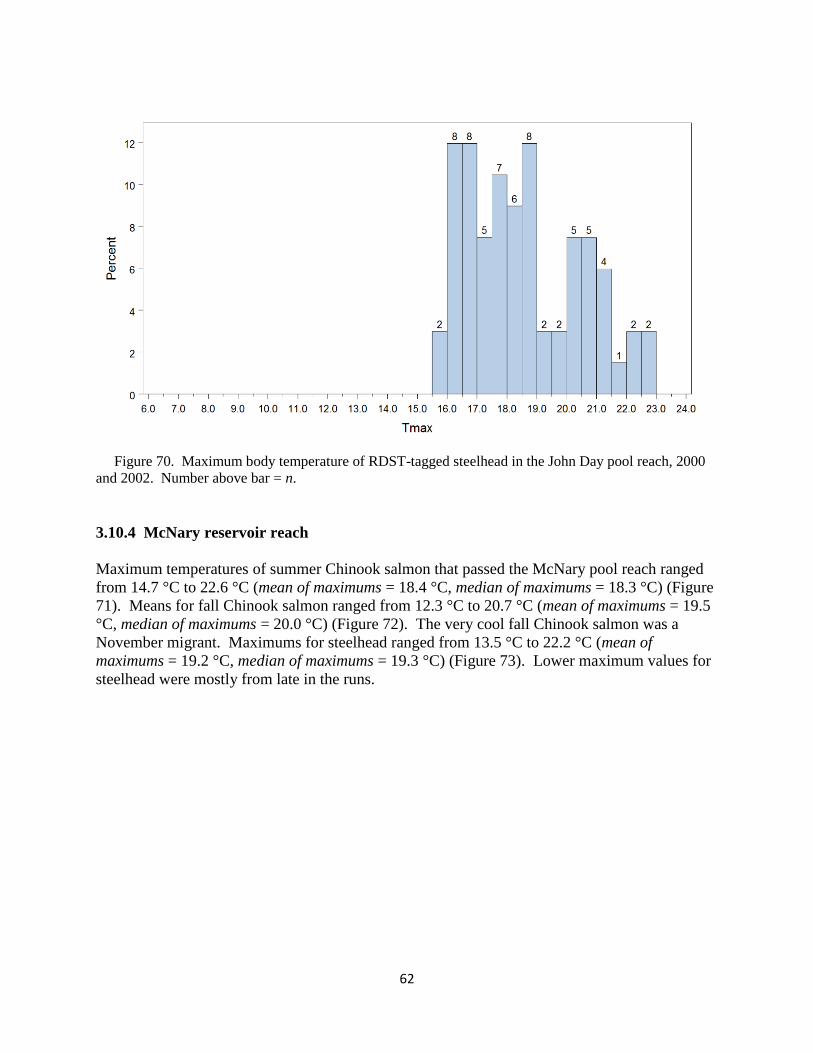
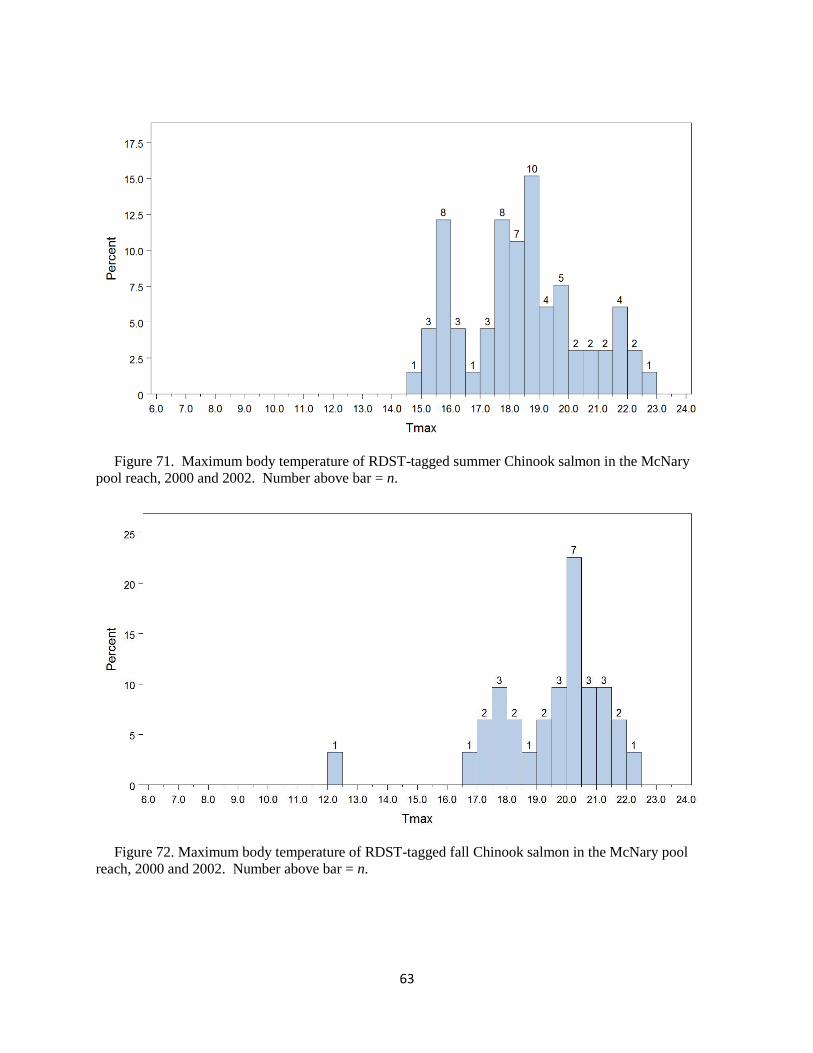
3.10.4 McNary reservoir reach
Maximum temperatures of summer Chinook salmon that passed the McNary pool reach ranged
from 14.7 °C to 22.6 °C (mean of maximums = 18.4 °C, median of maximums = 18.3 °C) (Figure
71). Means for fall Chinook salmon ranged from 12.3 °C to 20.7 °C (mean of maximums = 19.5
°C, median of maximums = 20.0 °C) (Figure 72). The very cool fall Chinook salmon was a
November migrant. Maximums for steelhead ranged from 13.5 °C to 22.2 °C (mean of
maximums = 19.2 °C, median of maximums = 19.3 °C) (Figure 73). Lower maximum values for
steelhead were mostly from late in the runs.
63
Figure 71. Maximum body temperature of RDST-tagged summer Chinook salmon in the McNary
pool reach, 2000 and 2002. Number above bar = n.
Figure 72. Maximum body temperature of RDST-tagged fall Chinook salmon in the McNary pool
reach, 2000 and 2002. Number above bar = n.

64
Figure 73. Maximum body temperature of RDST-tagged steelhead in the McNary pool reach, 2000
and 2002. Number above bar = n.
3.11 Cumulative temperature exposure per reach
The degree day (DD) is one of the common metrics used to measure cumulative temperature
exposure. We calculated DD (°C above 0) for the RDST-tagged fish in each reservoir reach.
These estimates included all times and locations in each reach, including time spent in CWR
sites. Fish that were harvested in the reach or that were last detected in tributaries in the reach
were excluded from calculations. Some likely underestimation occurred due to tags that reached
data storage capacity while fish were in a reach. Distributions of total degree day accumulation
may be a useful target metric for HexSim model outputs.
3.11.1 Bonneville reservoir reach
Total DD accumulations for summer Chinook salmon ranged from 13–125 DD (mean = 24.0,
median = 20.1 DD) (Figure 74). Totals for fall Chinook salmon ranged from 16–255 DD (mean
= 43.4, median = 30.2 DD) (Figure 75). Totals for steelhead were much higher and more
variable, ranging from 18–755 DD (mean = 209.4, median = 104.0 DD) (Figure 76).
Of the fish that encountered water temperature ≥ 20 °C, total exposure duration above that
threshold averaged 0.96–1.48 d per fish and medians were 0.71–1.15 d per fish (Table 13).
Totals included all records in the reach, regardless of location or timing (i.e., they included non-
continuous records).

65
Figure 74. Total accumulated degree days (DD) of RDST-tagged summer Chinook salmon in the
Bonneville pool reach, 2000 and 2002. Number above bar = n.
Figure 75. Total accumulated degree days (DD) of RDST-tagged fall Chinook salmon in the
Bonneville pool reach, 2000 and 2002. Number above bar = n.
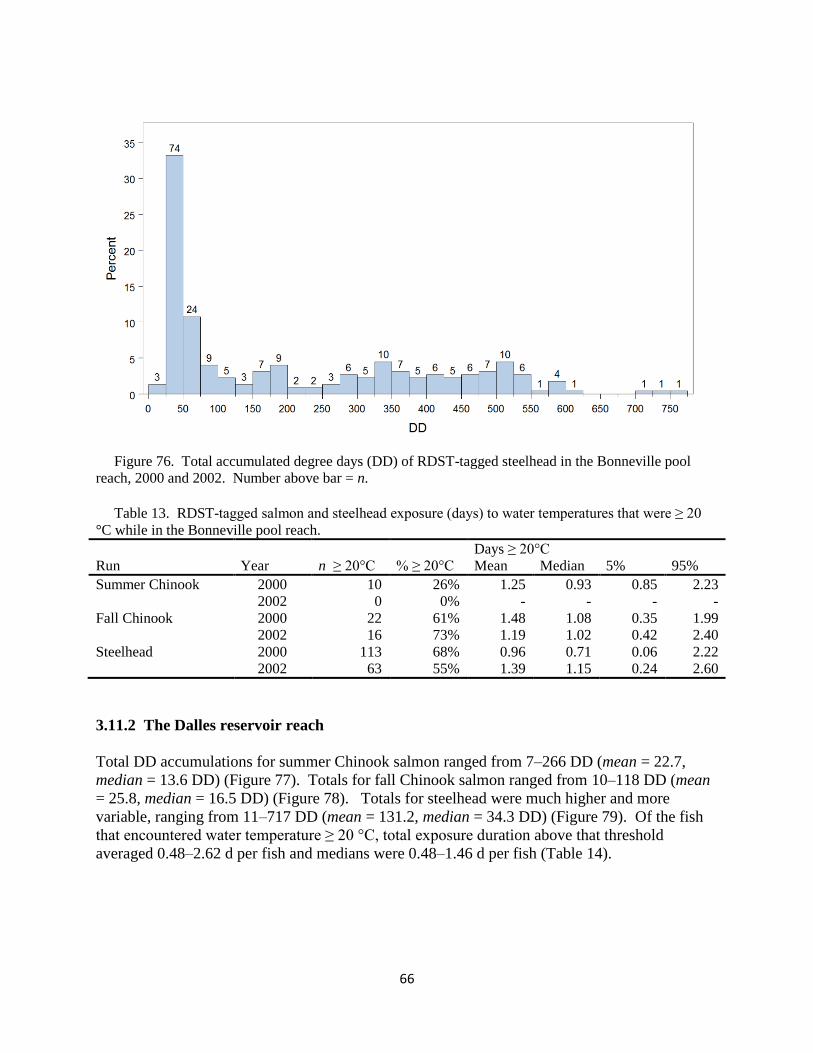
66
Figure 76. Total accumulated degree days (DD) of RDST-tagged steelhead in the Bonneville pool
reach, 2000 and 2002. Number above bar = n.
Table 13. RDST-tagged salmon and steelhead exposure (days) to water temperatures that were ≥ 20
°C while in the Bonneville pool reach.
Days ≥ 20°C
Run Year n ≥ 20°C % ≥ 20°C Mean Median 5% 95%
Summer Chinook 2000 10 26% 1.25 0.93 0.85 2.23
2002 0 0% - - - -
Fall Chinook 2000 22 61% 1.48 1.08 0.35 1.99
2002 16 73% 1.19 1.02 0.42 2.40
Steelhead 2000 113 68% 0.96 0.71 0.06 2.22
2002 63 55% 1.39 1.15 0.24 2.60
3.11.2 The Dalles reservoir reach
Total DD accumulations for summer Chinook salmon ranged from 7–266 DD (mean = 22.7,
median = 13.6 DD) (Figure 77). Totals for fall Chinook salmon ranged from 10–118 DD (mean
= 25.8, median = 16.5 DD) (Figure 78). Totals for steelhead were much higher and more
variable, ranging from 11–717 DD (mean = 131.2, median = 34.3 DD) (Figure 79). Of the fish
that encountered water temperature ≥ 20 °C, total exposure duration above that threshold
averaged 0.48–2.62 d per fish and medians were 0.48–1.46 d per fish (Table 14).
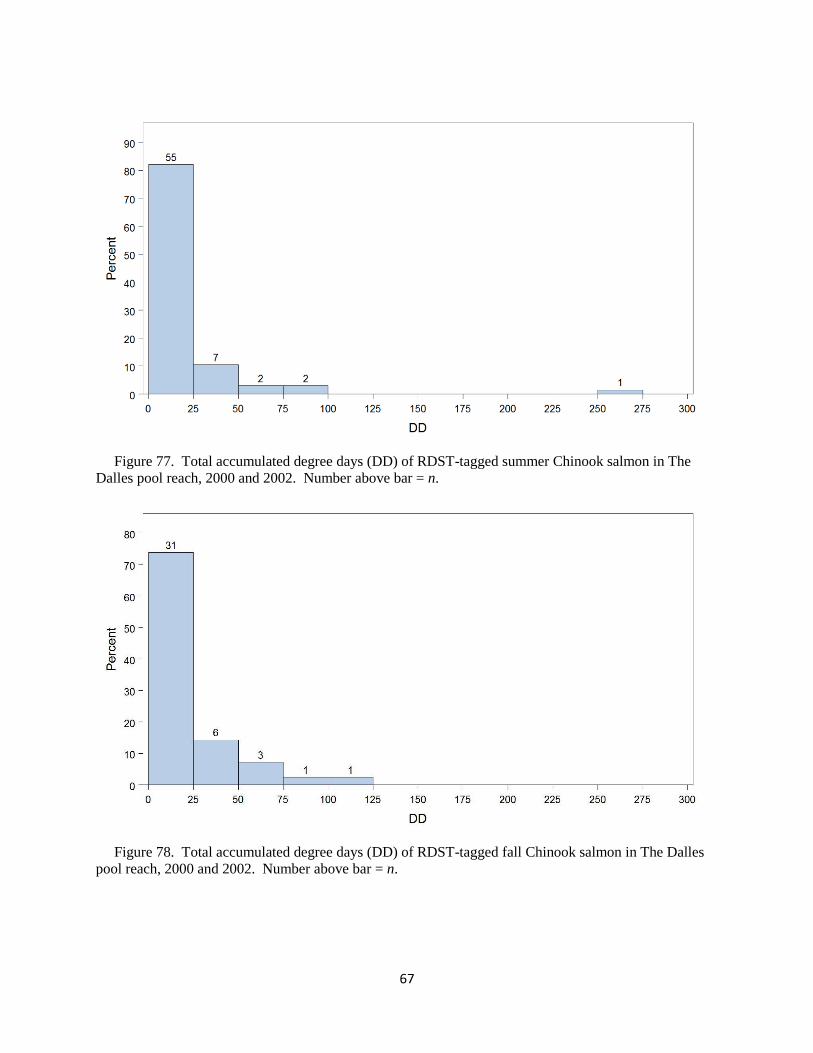
67
Figure 77. Total accumulated degree days (DD) of RDST-tagged summer Chinook salmon in The
Dalles pool reach, 2000 and 2002. Number above bar = n.
Figure 78. Total accumulated degree days (DD) of RDST-tagged fall Chinook salmon in The Dalles
pool reach, 2000 and 2002. Number above bar = n.
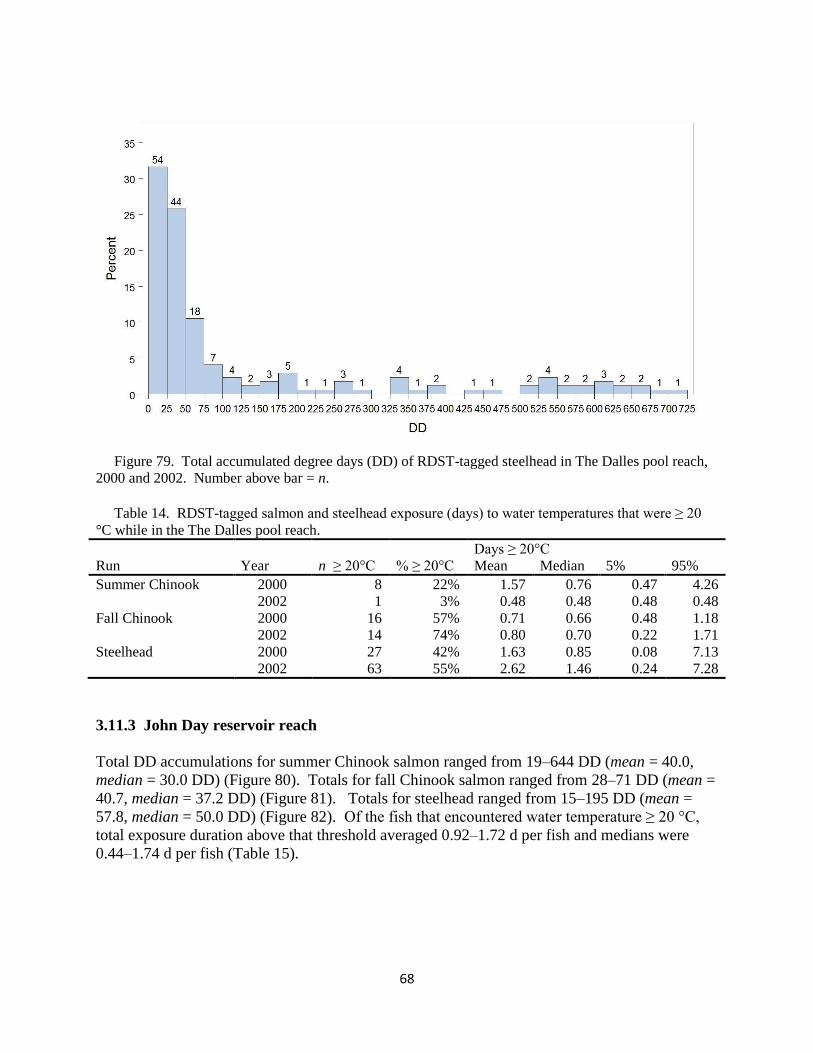
68
Figure 79. Total accumulated degree days (DD) of RDST-tagged steelhead in The Dalles pool reach,
2000 and 2002. Number above bar = n.
Table 14. RDST-tagged salmon and steelhead exposure (days) to water temperatures that were ≥ 20
°C while in the The Dalles pool reach.
Days ≥ 20°C
Run Year n ≥ 20°C % ≥ 20°C Mean Median 5% 95%
Summer Chinook 2000 8 22% 1.57 0.76 0.47 4.26
2002 1 3% 0.48 0.48 0.48 0.48
Fall Chinook 2000 16 57% 0.71 0.66 0.48 1.18
2002 14 74% 0.80 0.70 0.22 1.71
Steelhead 2000 27 42% 1.63 0.85 0.08 7.13
2002 63 55% 2.62 1.46 0.24 7.28
3.11.3 John Day reservoir reach
Total DD accumulations for summer Chinook salmon ranged from 19–644 DD (mean = 40.0,
median = 30.0 DD) (Figure 80). Totals for fall Chinook salmon ranged from 28–71 DD (mean =
40.7, median = 37.2 DD) (Figure 81). Totals for steelhead ranged from 15–195 DD (mean =
57.8, median = 50.0 DD) (Figure 82). Of the fish that encountered water temperature ≥ 20 °C,
total exposure duration above that threshold averaged 0.92–1.72 d per fish and medians were
0.44–1.74 d per fish (Table 15).
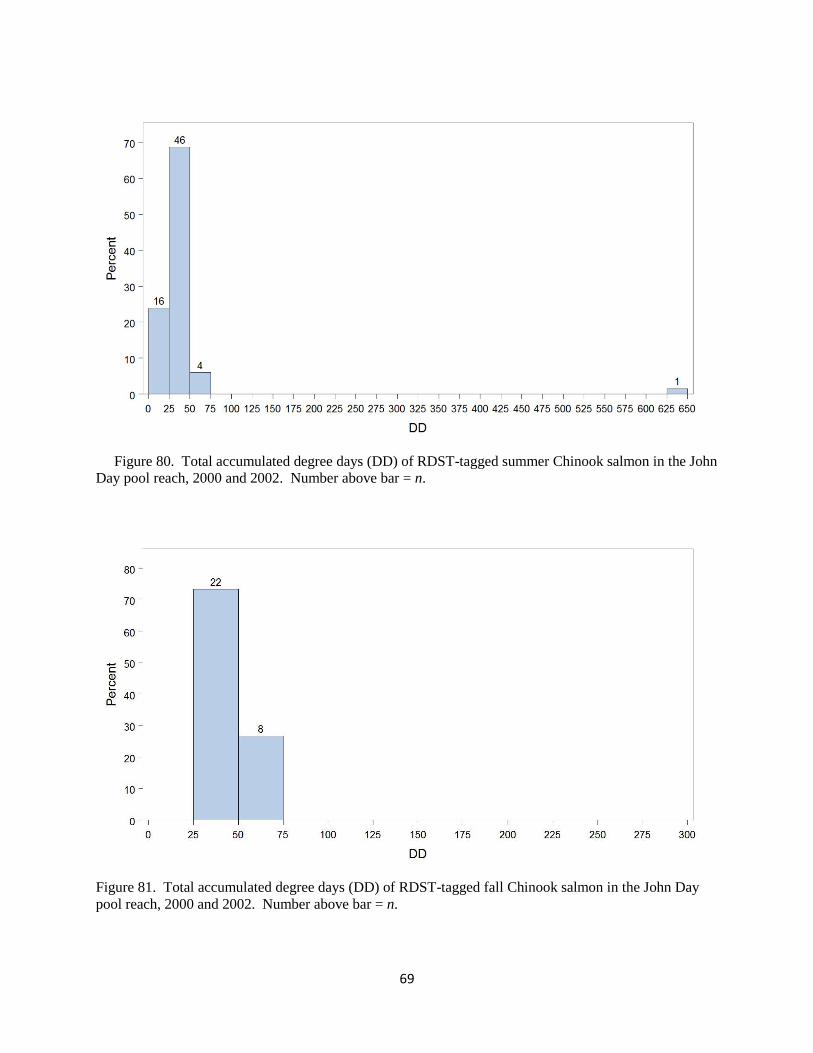
69
Figure 80. Total accumulated degree days (DD) of RDST-tagged summer Chinook salmon in the John
Day pool reach, 2000 and 2002. Number above bar = n.
Figure 81. Total accumulated degree days (DD) of RDST-tagged fall Chinook salmon in the John Day
pool reach, 2000 and 2002. Number above bar = n.

70
Figure 82. Total accumulated degree days (DD) of RDST-tagged steelhead in the John Day pool
reach, 2000 and 2002. Number above bar = n.
Table 15. RDST-tagged salmon and steelhead exposure (days) to water temperatures that were ≥ 20
°C while in the John Day pool reach.
Days ≥ 20°C
Run Year n ≥ 20°C % ≥ 20°C Mean Median 5% 95%
Summer Chinook 2000 0 0% 1.01 1.35 0.02 1.87
2002 5 17% 1.45 0.44 0.03 4.67
Fall Chinook 2000 16 73% 1.42 1.48 0.13 2.90
2002 13 72% 0.92 0.94 0.06 1.46
Steelhead 2000 26 50% 1.45 1.19 0.05 3.06
2002 46 53% 1.72 1.74 0.03 3.28
3.11.4 McNary reservoir reach
Total DD accumulations for summer Chinook salmon ranged from 6–103 DD (mean = 22.0,
median = 18.3 DD) (Figure 83). Totals for fall Chinook salmon ranged from 15–142 DD (mean
= 33.3, median = 21.5 DD) (Figure 84). Totals for steelhead were more variable and ranged
from 17–628 DD (mean = 67.0, median = 42.5 DD) (Figure 85). Of the fish that encountered
water temperature ≥ 20 °C, total exposure duration above that threshold averaged 0.36–3.10 d
per fish and medians were 0.06–1.74 d per fish (Table 16).

71
Figure 83. Total accumulated degree days (DD) of RDST-tagged summer Chinook salmon in the
McNary pool reach, 2000 and 2002. Number above bar = n.
Figure 84. Total accumulated degree days (DD) of RDST-tagged fall Chinook salmon in the McNary
pool reach, 2000 and 2002. Number above bar = n.

72
Figure 85. Total accumulated degree days (DD) of RDST-tagged steelhead in the McNary pool reach,
2000 and 2002. Number above bar = n.
Table 16. RDST-tagged salmon and steelhead exposure (days) to water temperatures that were ≥ 20
°C while in the McNary pool reach.
Days ≥ 20°C
Run Year n ≥ 20°C % ≥ 20°C Mean Median 5% 95%
Summer Chinook 2000 10 27% 0.51 0.43 0.27 0.97
2002 3 10% 0.39 0.23 0.12 0.77
Fall Chinook 2000 7 44% 0.89 0.96 0.18 1.51
2002 9 60% 0.36 0.06 0.02 1.31
Steelhead 2000 16 36% 2.11 1.74 0.17 5.17
2002 32 43% 3.10 1.38 0.06 13.47
3.12 Degree days per day per reach
The scatterplots in this section combine data from previous summaries to illustrate the
relationship between cumulative temperature exposure and the time that RDST-tagged fish spent
in each reservoir reach. Degree days/day is the rate at which temperature exposure is
accumulated, standardized over time. The product (degree days/day) × (days in a reach) is the
total degree days presented in Section 3.11.
In general, the warmest DD/d estimates were for salmon and steelhead that moved rapidly
through reservoir reaches with little or no CWR use. Relatively cooler DD/d estimates were
strongly associated with fish that used CWR sites for multiple days. Some early summer and late
fall migrants also had relatively low DD/d.

73
3.12.1 Bonneville reservoir reach
Figure 86. Relationship between the number of days RDST-tagged summer Chinook salmon spent in
the Bonneville pool reach and the accumulation of degree days per d (DDperd), 2000 and 2002.
Figure 87. Relationship between the number of days RDST-tagged fall Chinook salmon spent in the
Bonneville pool reach and the accumulation of degree days per d (DDperd), 2000 and 2002.
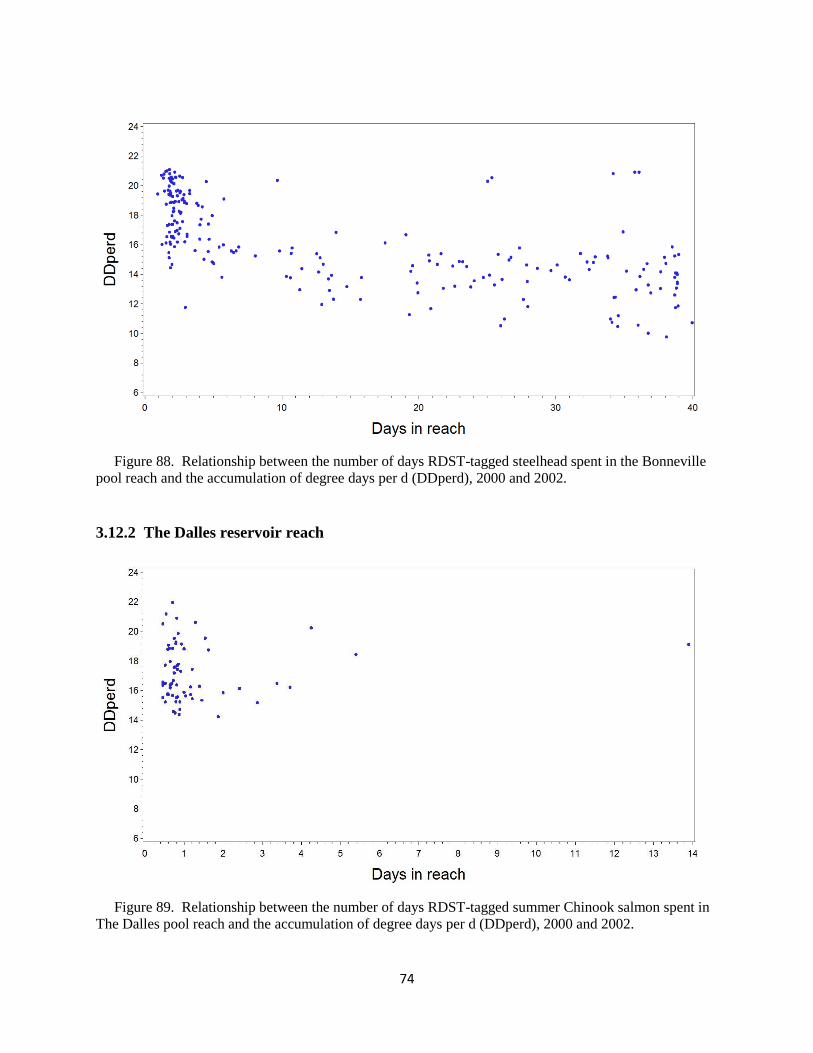
74
Figure 88. Relationship between the number of days RDST-tagged steelhead spent in the Bonneville
pool reach and the accumulation of degree days per d (DDperd), 2000 and 2002.
3.12.2 The Dalles reservoir reach
Figure 89. Relationship between the number of days RDST-tagged summer Chinook salmon spent in
The Dalles pool reach and the accumulation of degree days per d (DDperd), 2000 and 2002.
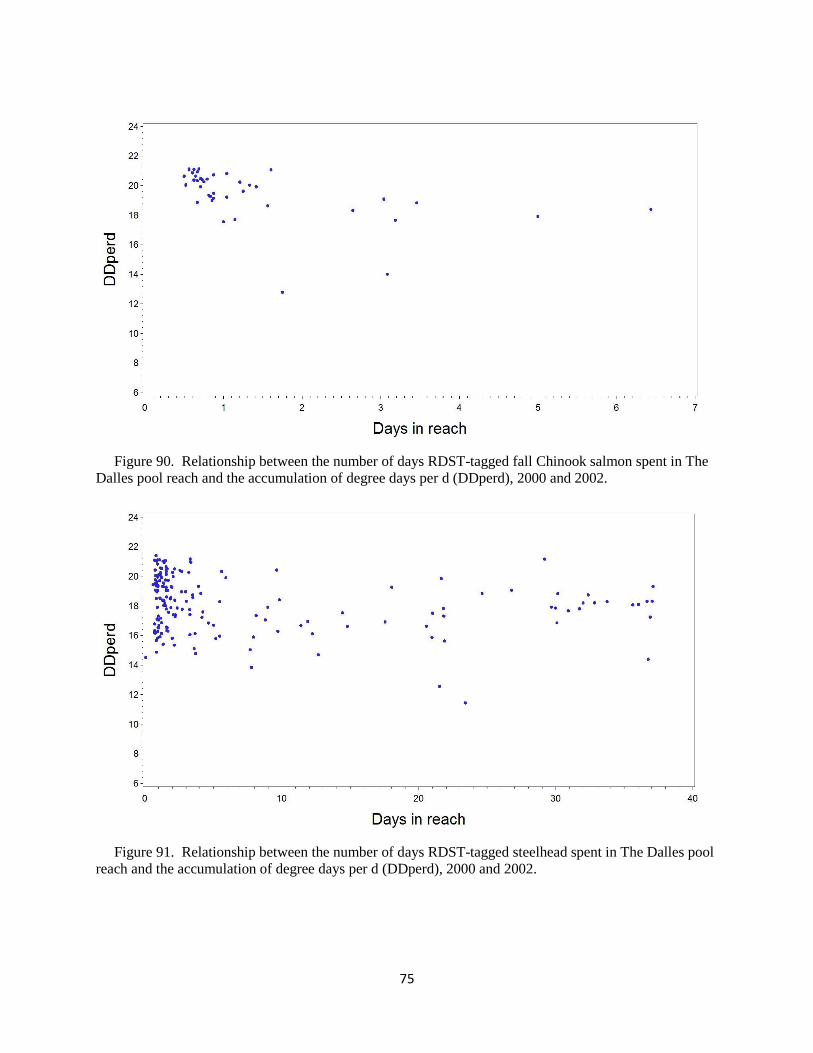
75
Figure 90. Relationship between the number of days RDST-tagged fall Chinook salmon spent in The
Dalles pool reach and the accumulation of degree days per d (DDperd), 2000 and 2002.
Figure 91. Relationship between the number of days RDST-tagged steelhead spent in The Dalles pool
reach and the accumulation of degree days per d (DDperd), 2000 and 2002.

76
3.12.3 John Day reservoir reach
Figure 92. Relationship between the number of days RDST-tagged summer Chinook salmon spent in
the John Day pool reach and the accumulation of degree days per d (DDperd), 2000 and 2002.
Figure 93. Relationship between the number of days RDST-tagged fall Chinook salmon spent in the
John Day pool reach and the accumulation of degree days per d (DDperd), 2000 and 2002.
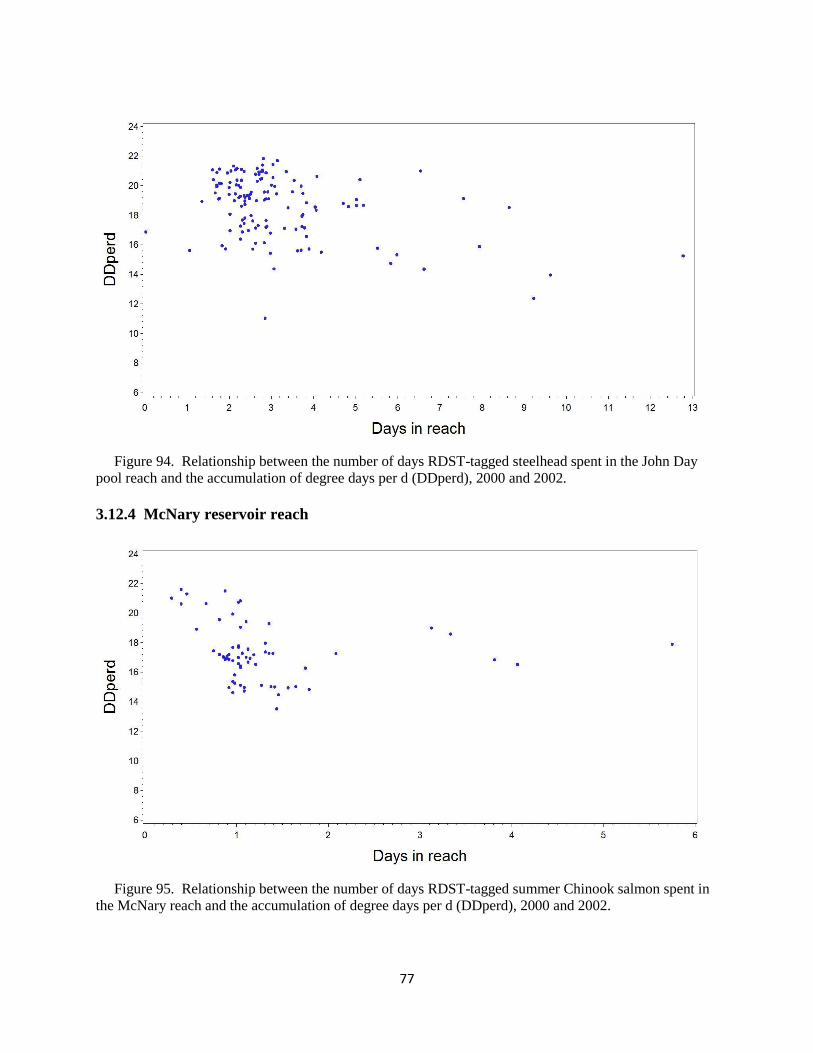
77
Figure 94. Relationship between the number of days RDST-tagged steelhead spent in the John Day
pool reach and the accumulation of degree days per d (DDperd), 2000 and 2002.
3.12.4 McNary reservoir reach
Figure 95. Relationship between the number of days RDST-tagged summer Chinook salmon spent in
the McNary reach and the accumulation of degree days per d (DDperd), 2000 and 2002.
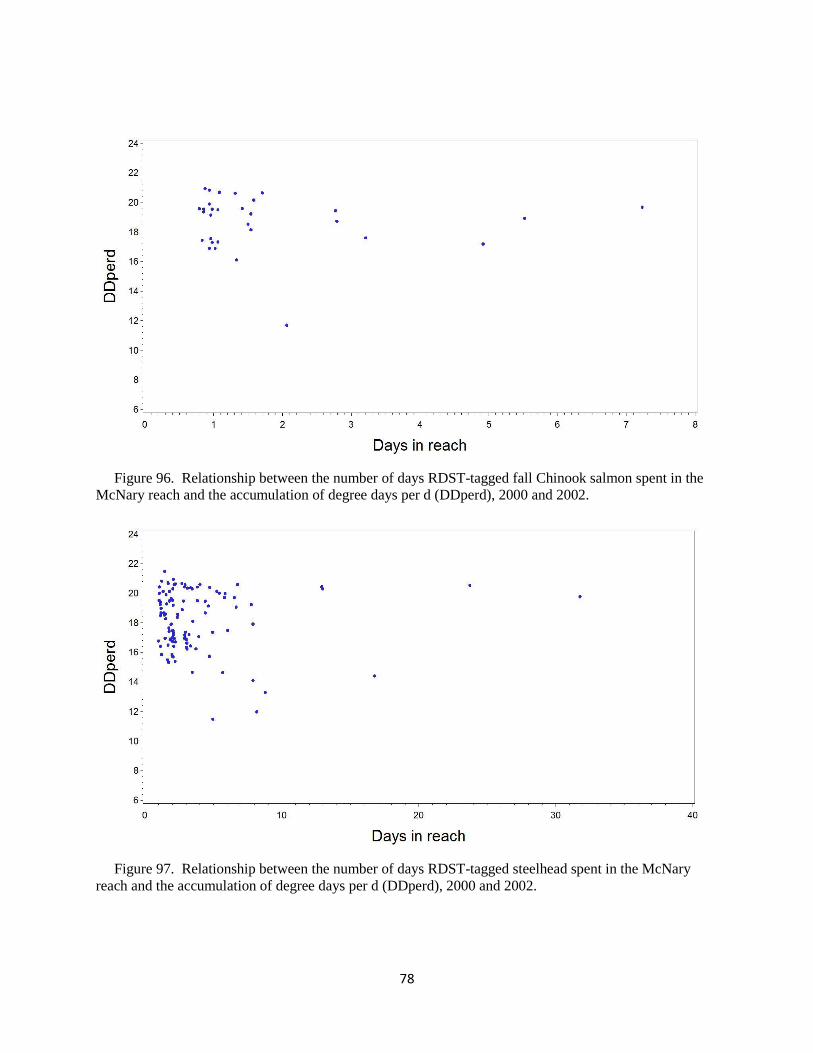
78
Figure 96. Relationship between the number of days RDST-tagged fall Chinook salmon spent in the
McNary reach and the accumulation of degree days per d (DDperd), 2000 and 2002.
Figure 97. Relationship between the number of days RDST-tagged steelhead spent in the McNary
reach and the accumulation of degree days per d (DDperd), 2000 and 2002.

79
3.13 Probability of CWR use in Bonneville pool by date and temperature
We used logistic regression in exploratory analyses of the relationship between migration date,
temperatures RDST-tagged fish encountered in Bonneville reservoir, and use of CWR sites. Fish
used in the analyses were restricted to those that passed The Dalles Dam, to reduce ambiguity
associated with fish last detected in CWR sites or harvested in the Bonneville pool. Because
CWR use by summer Chinook salmon was very limited in this reach, no model was developed.
The figures in this section do not substitute for formal analyses, which were beyond the scope of
the report, but should provide an indication of overall patterns.
3.13.1 Fall Chinook salmon
Fifty fall Chinook salmon passed The Dalles Dam with suitable RDST data and 12 of these had
evidence of CWR use of at least 4 h in Bonneville pool. The relationships between CWR use
and both first and maximum encountered temperatures in Bonneville pool indicated weak,
slightly decreasing likelihood of CWR use as temperatures increased (Figures 98 and 99).
However, results were strongly influenced by a pair of late-run salmon that did use CWR sites.
When reservoir entry date was used as the predictor, the predicted probability of use was
parabolic-shaped, with relatively high probabilities early and late in migration (Figure 100). The
two late-run fish again had relatively high influence on the shape of the plot. We note that the
below-average fall temperatures in 2000 and 2002 likely contributed to the low incidence of
CWR use by fall Chinook salmon. We recommend reviewing the fall Chinook salmon
summaries provided in Goniea et al. (2006), which included more representative samples from a
range of water years.
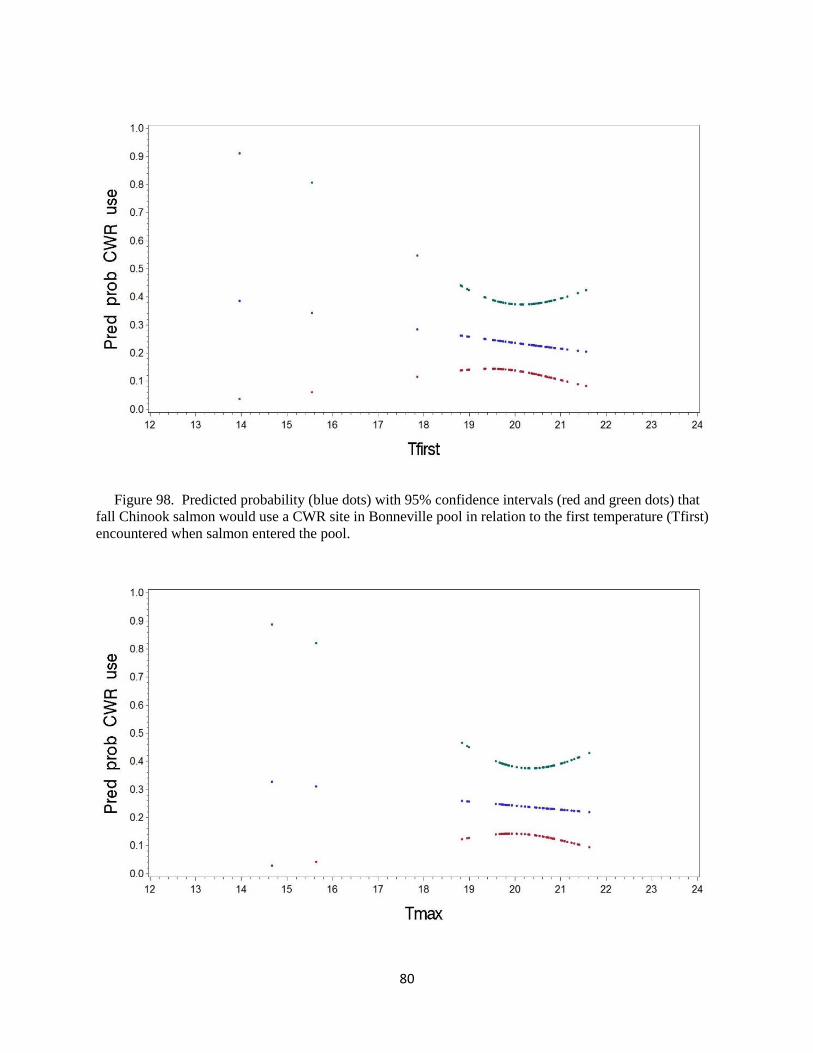
80
Figure 98. Predicted probability (blue dots) with 95% confidence intervals (red and green dots) that
fall Chinook salmon would use a CWR site in Bonneville pool in relation to the first temperature (Tfirst)
encountered when salmon entered the pool.
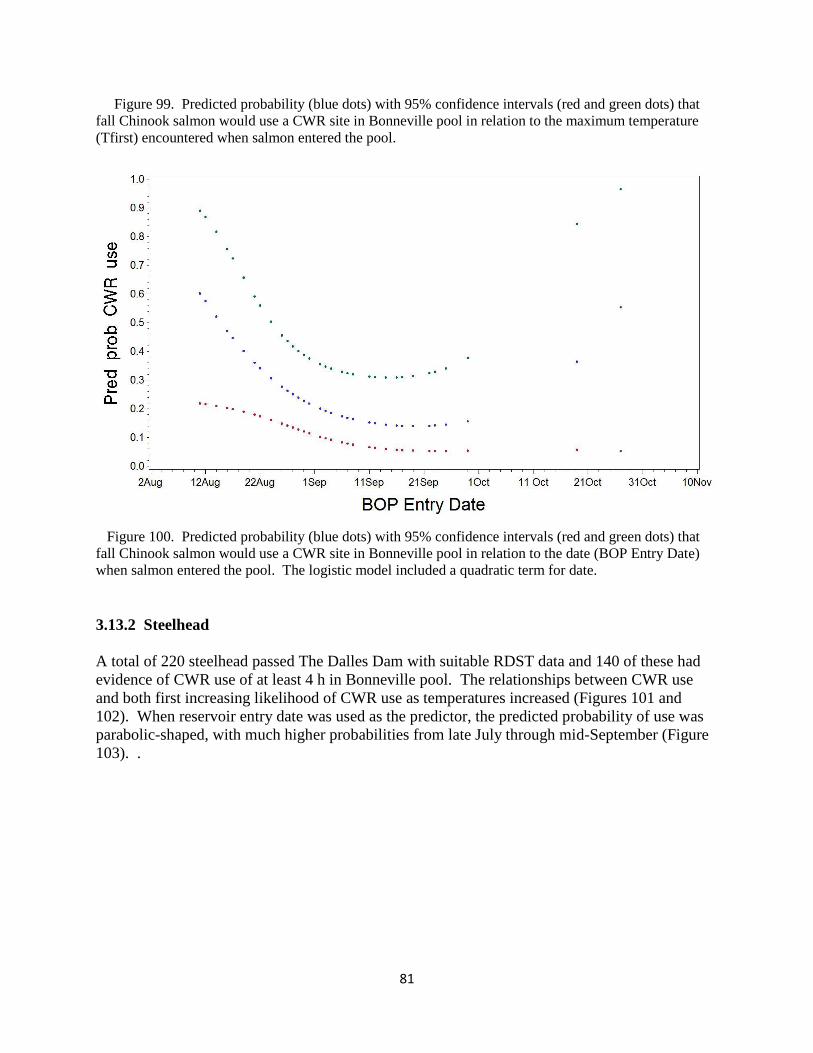
81
Figure 99. Predicted probability (blue dots) with 95% confidence intervals (red and green dots) that
fall Chinook salmon would use a CWR site in Bonneville pool in relation to the maximum temperature
(Tfirst) encountered when salmon entered the pool.
Figure 100. Predicted probability (blue dots) with 95% confidence intervals (red and green dots) that
fall Chinook salmon would use a CWR site in Bonneville pool in relation to the date (BOP Entry Date)
when salmon entered the pool. The logistic model included a quadratic term for date.
3.13.2 Steelhead
A total of 220 steelhead passed The Dalles Dam with suitable RDST data and 140 of these had
evidence of CWR use of at least 4 h in Bonneville pool. The relationships between CWR use
and both first increasing likelihood of CWR use as temperatures increased (Figures 101 and
102). When reservoir entry date was used as the predictor, the predicted probability of use was
parabolic-shaped, with much higher probabilities from late July through mid-September (Figure
103). .

82
Figure 101. . Predicted probability (blue dots) with 95% confidence intervals (red and green dots)
that steelhead would use a CWR site in Bonneville pool in relation to the first temperature (Tfirst)
encountered when salmon entered the pool.
Figure 102. Predicted probability (blue dots) with 95% confidence intervals (red and green dots) that
steelhead would use a CWR site in Bonneville pool in relation to the maximum temperature (Tfirst)
encountered when salmon entered the pool.
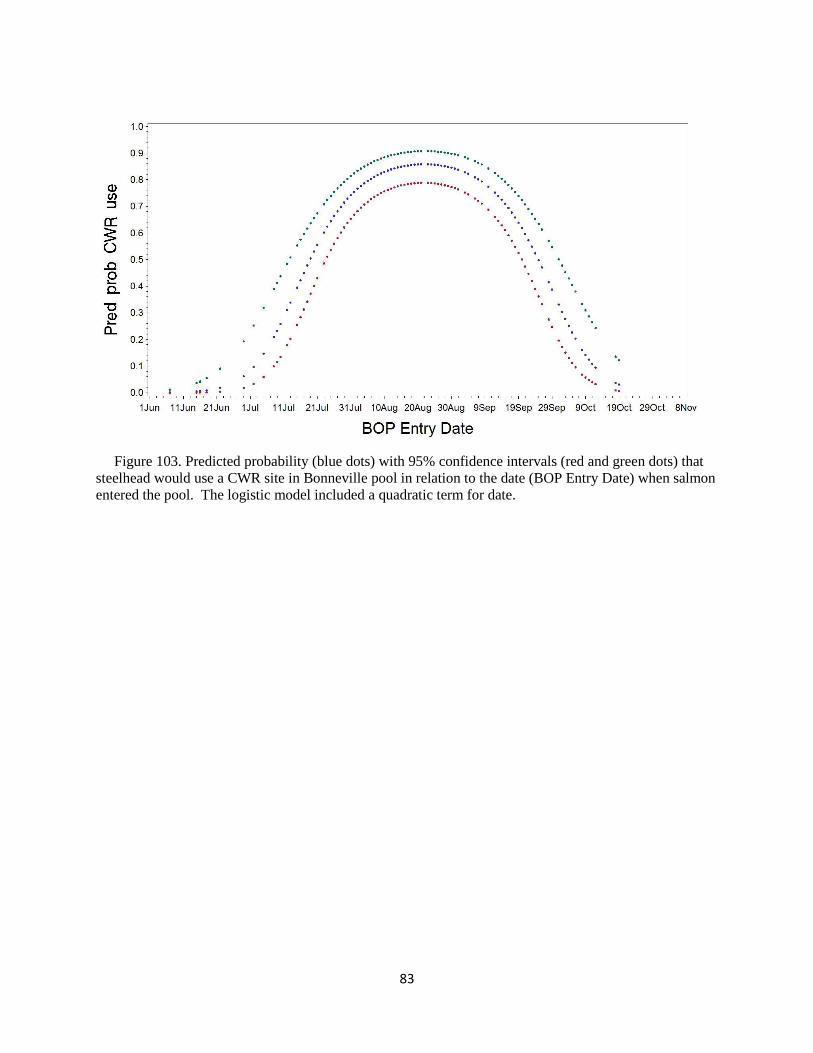
83
Figure 103. Predicted probability (blue dots) with 95% confidence intervals (red and green dots) that
steelhead would use a CWR site in Bonneville pool in relation to the date (BOP Entry Date) when salmon
entered the pool. The logistic model included a quadratic term for date.
84
4.0 References
Caudill, C. C., M. L. Keefer, T. S. Clabough, G. P. Naughton, B. J. Burke, and C. A. Peery.
2013. Indirect effects of impoundment on migrating fish: temperature gradients in fish
ladders slow dam passage by adult Chinook salmon and steelhead. PLOS ONE:e85586.
Clabough, T. S., C. C. Caudill, M. L. Keefer, M. A. Jepson, C. A. Peery, T. C. Bjornn, and L. C.
Stuehrenberg. 2008. Body temperature during migration in adult Chinook salmon and
steelhead through the lower Columbia and Snake rivers, 2000 and 2002. Technical Report
2008-3. Idaho Cooperative Fish and Wildlife Research Unit, University of Idaho, Moscow.
Goniea, T. M., M. L. Keefer, T. C. Bjornn, C. A. Peery, D. H. Bennett, and L. C. Stuehrenberg.
2006. Behavioral thermoregulation and slowed migration by adult fall Chinook salmon in
response to high Columbia River water temperatures. Transactions of the American Fisheries
Society 135:408-419.
High, B., C. A. Peery, and D. H. Bennett. 2006. Temporary staging of Columbia River summer
steelhead in coolwater areas and its effect on migration rates. Transactions of the American
Fisheries Society 135:519-528.
Keefer, M. L., C. A. Peery, T. C. Bjornn, M. A. Jepson, and L. C. Stuehrenberg. 2004.
Hydrosystem, dam, and reservoir passage rates of adult chinook salmon and steelhead in the
Columbia and Snake rivers. Transactions of the American Fisheries Society 133:1413-1439.
Keefer, M. L., C. A. Peery, and B. High. 2009. Behavioral thermoregulation and associated
mortality trade-offs in migrating adult steelhead (Oncorhynchus mykiss): variability among
sympatric populations. Canadian Journal of Fisheries and Aquatic Sciences 66:1734-1747.
Keefer, M. L., and C. C. Caudill. 2016. Estimating thermal exposure of adult summer steelhead
and fall Chinook salmon migrating in a warm impounded river. Ecology of Freshwater Fish
25:499-611.
Schumaker, N. H. 2016. HexSim (Version 3.1). U.S. Environmental Protection Agency,
Environmental Research Laboratory, Corvallis, OR.