assessing agriculture and livestock water demand in 2025/50: food habits, income growth and spatial...
TRANSCRIPT
Assessing Agriculture Assessing Agriculture and Livestock Water and Livestock Water Demand in 2025/50: Demand in 2025/50: Food Habits, Income Food Habits, Income Growth and Spatial Growth and Spatial
PatternPattern
O. P. SinghO. P. Singh
Introduction…Introduction…Irrigated crop production had made significant Irrigated crop production had made significant contribution to total foodgrain production and contribution to total foodgrain production and provided sufficient buffer-stock in the country provided sufficient buffer-stock in the country (Evenson (Evenson et alet al., 1999; Kumar, 2003)., 1999; Kumar, 2003)
~ 20% increase is attributed to expansion of ~ 20% increase is attributed to expansion of net cropped area and 80% by crop yield net cropped area and 80% by crop yield (Bhalla (Bhalla et alet al., 1999)., 1999)
Globally, there are two major water-dependent Globally, there are two major water-dependent interests, which are in conflict today i.e. “food interests, which are in conflict today i.e. “food security” and “ecological security” (Postel, 1996; security” and “ecological security” (Postel, 1996; Falkenmark, 2004)Falkenmark, 2004)
Researchers in past had made food demand Researchers in past had made food demand projections for India for 2020 (projections for India for 2020 (Kumar, 1998; Kumar, 1998; Rosegrant Rosegrant et alet al., 1995; Bhalla ., 1995; Bhalla et al.,et al., 1999; 1999; Bansil, Bansil, 1999)1999)
Population growth in rural and urban area will Population growth in rural and urban area will be the key determinant of growth in demand for be the key determinant of growth in demand for food in the country in coming decades (Dyson food in the country in coming decades (Dyson and Hanchate, 2000)and Hanchate, 2000)
Higher per capita incomes may increase the Higher per capita incomes may increase the demand for non-cereal based food items i.e. demand for non-cereal based food items i.e. fruits, vegetables milk, eggs, fish and meatfruits, vegetables milk, eggs, fish and meat
Long term NSSO’s data on food consumption Long term NSSO’s data on food consumption pattern suggests that there has been decline in pattern suggests that there has been decline in per capita cereal consumption since early 1970s per capita cereal consumption since early 1970s (Bansil, 1999; Rao, 1999; Kumar, 1998; Kumar (Bansil, 1999; Rao, 1999; Kumar, 1998; Kumar and Mathur, 1997; Radhakrishna and Ravi, and Mathur, 1997; Radhakrishna and Ravi, 1992)1992)
Present study Present study is an attempt to assess the state-is an attempt to assess the state-wise demand of food items and irrigation water wise demand of food items and irrigation water for 2025/2050for 2025/2050
IntroductionIntroduction
ObjectivesObjectives To estimate the state-wise current To estimate the state-wise current level of food consumption pattern and level of food consumption pattern and estimate it for 2025/2050estimate it for 2025/2050
To estimate the state-wise livestock To estimate the state-wise livestock feed demand in 2025/2050feed demand in 2025/2050
To estimate the state-wise seed/waste To estimate the state-wise seed/waste and other uses in 2025/2050and other uses in 2025/2050
To estimate the state-wise irrigation To estimate the state-wise irrigation water requirement to meet the food water requirement to meet the food demand in 2025/2050demand in 2025/2050
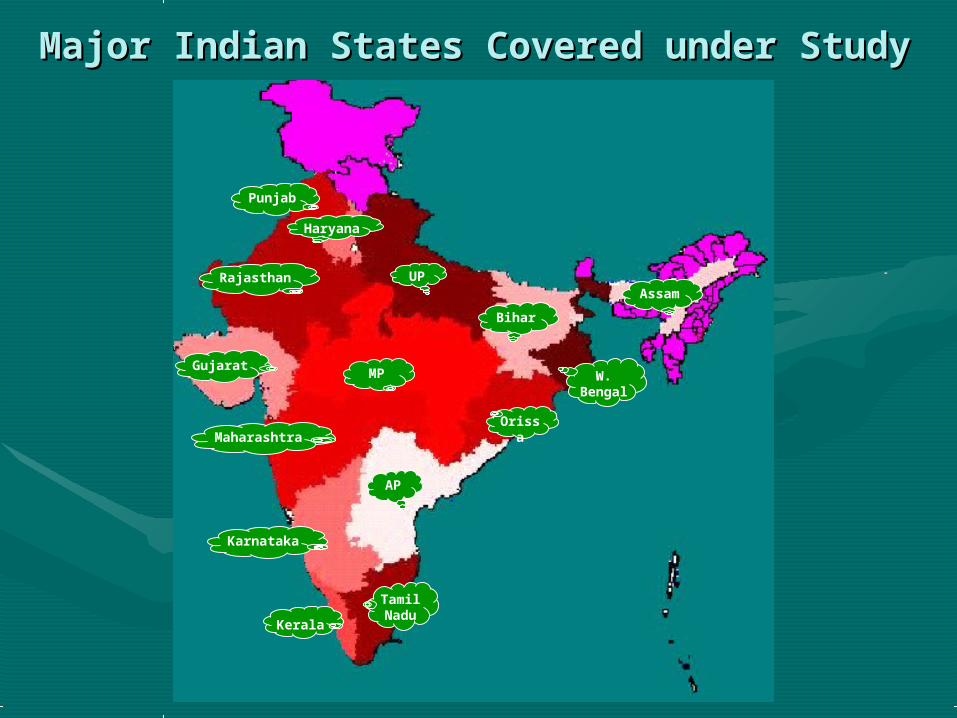
Major Indian States Covered under StudyMajor Indian States Covered under Study
UP
Bihar
Assam
W. Benga
lOriss
a
Gujarat
Rajasthan
Punjab
Haryana
MP
AP
Maharashtra
Karnataka
Kerala
Tamil Nadu
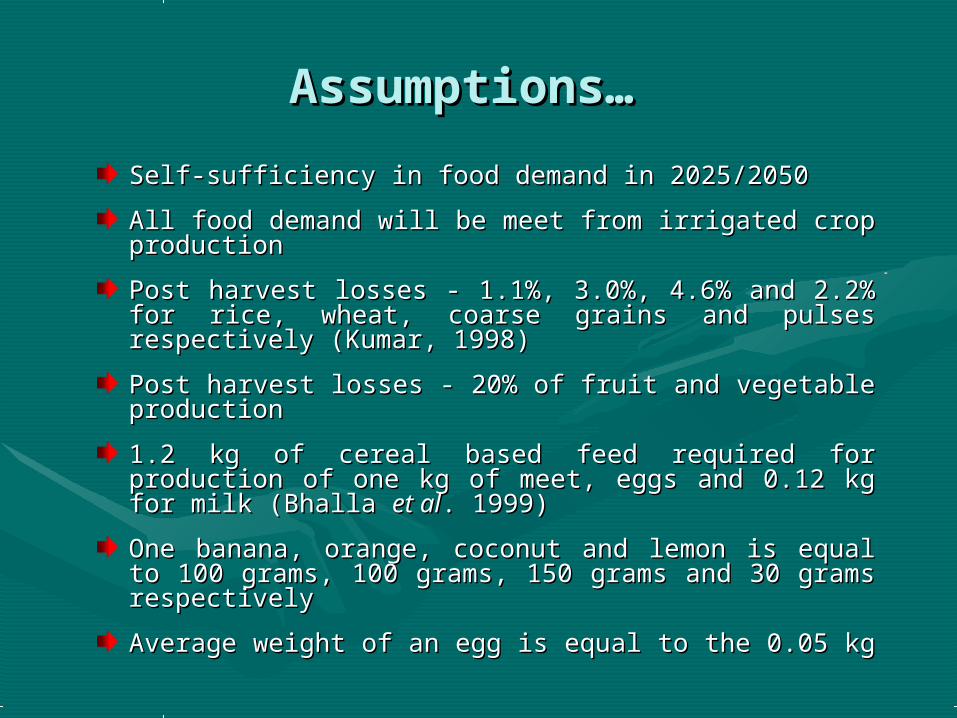
Assumptions…Assumptions… Self-sufficiency in food demand in 2025/2050Self-sufficiency in food demand in 2025/2050
All food demand will be meet from irrigated crop All food demand will be meet from irrigated crop productionproduction
Post harvest losses - 1.1%, 3.0%, 4.6% and 2.2% for Post harvest losses - 1.1%, 3.0%, 4.6% and 2.2% for rice, wheat, coarse grains and pulses respectively rice, wheat, coarse grains and pulses respectively (Kumar, 1998)(Kumar, 1998)
Post harvest losses - 20% of fruit and vegetable Post harvest losses - 20% of fruit and vegetable productionproduction
1.2 kg of cereal based feed required for production of 1.2 kg of cereal based feed required for production of one kg of meet, eggs and 0.12 kg for milk one kg of meet, eggs and 0.12 kg for milk ((Bhalla Bhalla et et alal. 1999) . 1999)
One banana, orange, coconut and lemon is equal to One banana, orange, coconut and lemon is equal to 100 grams, 100 grams, 150 grams and 30 grams 100 grams, 100 grams, 150 grams and 30 grams respectively respectively
Average weight of an egg is equal to the 0.05 kgAverage weight of an egg is equal to the 0.05 kg
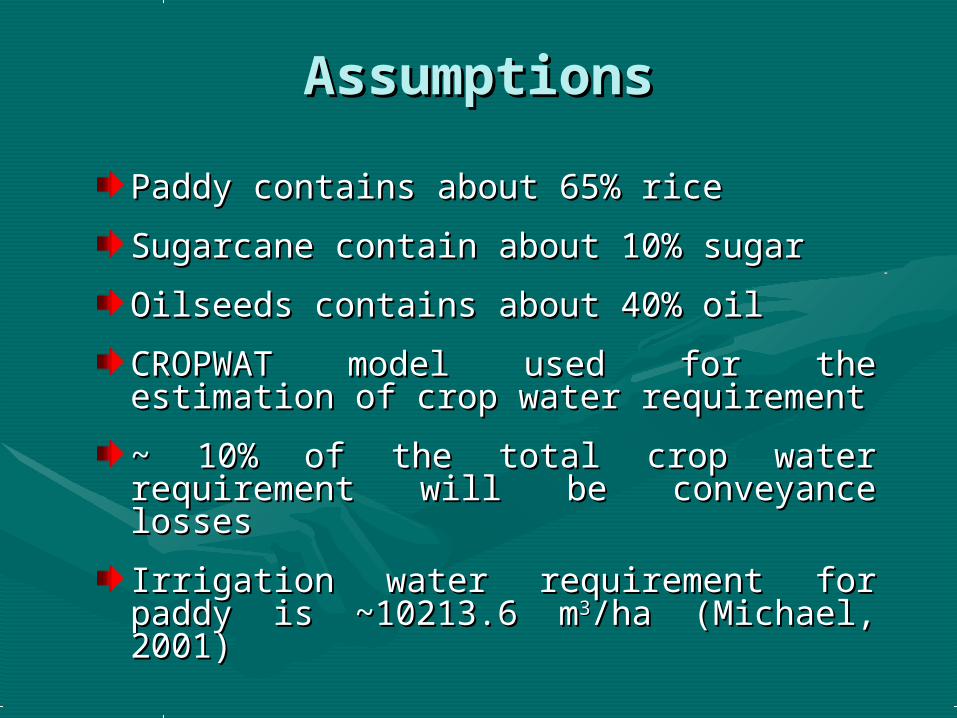
AssumptionsAssumptions
Paddy contains about 65% ricePaddy contains about 65% rice
Sugarcane contain about 10% sugarSugarcane contain about 10% sugar
Oilseeds contains about 40% oilOilseeds contains about 40% oil
CROPWAT model used for the CROPWAT model used for the estimation of crop water requirementestimation of crop water requirement
~ 10% of the total crop water ~ 10% of the total crop water requirement will be conveyance lossesrequirement will be conveyance losses
Irrigation water requirement for paddy Irrigation water requirement for paddy is ~10213.6 mis ~10213.6 m33/ha (/ha (Michael, 2001)Michael, 2001)

Methodological FrameworkMethodological Framework
Increase in animal based food demand
Increase in livestock
population
Total Agricultural Water Requirement
Food Demand (Cereals, pulses, oilseed, milk, meat, fish, egg, oil, vegetables,
fruits and Sugar)
Crop Water Requirement
Increase/decrease in crop based food
demand
Growth in per capita income
Growth in rural/ urban population
Per capita food consumption
Post harvest losses
Increase in rainfed
cultivation
Change in food consumption
pattern
Increase in cereal based animal feed
demand
Change in milk production system
Increase in green fodder demand
Over use of irrigation water for crop Production
Increase in area under fish cultivation
Increase in water use for fish farming
Increase in fish/ meat/egg
demand
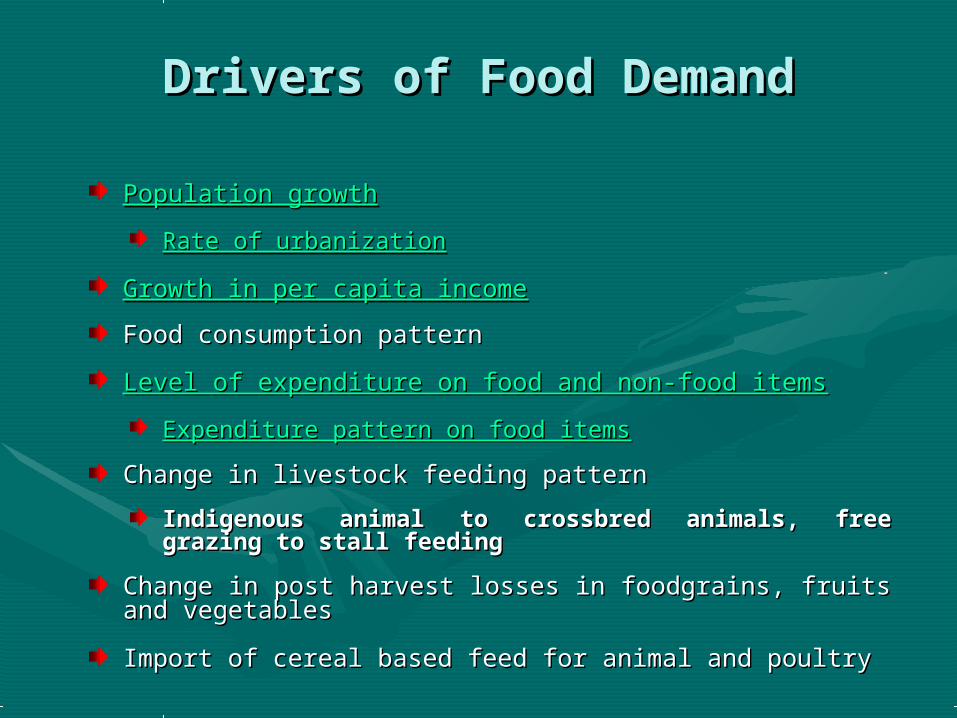
Drivers of Food DemandDrivers of Food Demand
Population growthPopulation growth
Rate of urbanizationRate of urbanization
Growth in per capita incomeGrowth in per capita income
Food consumption patternFood consumption pattern
Level of expenditure on food and non-food itemsLevel of expenditure on food and non-food items
Expenditure pattern on food itemsExpenditure pattern on food items
Change in livestock feeding patternChange in livestock feeding pattern
Indigenous animal to crossbred animals, free Indigenous animal to crossbred animals, free grazing to stall feedinggrazing to stall feeding
Change in post harvest losses in foodgrains, fruits and Change in post harvest losses in foodgrains, fruits and vegetablesvegetables
Import of cereal based feed for animal and poultry Import of cereal based feed for animal and poultry
Current Food Consumption Current Food Consumption and Future Demand and Future Demand
ProjectionProjection
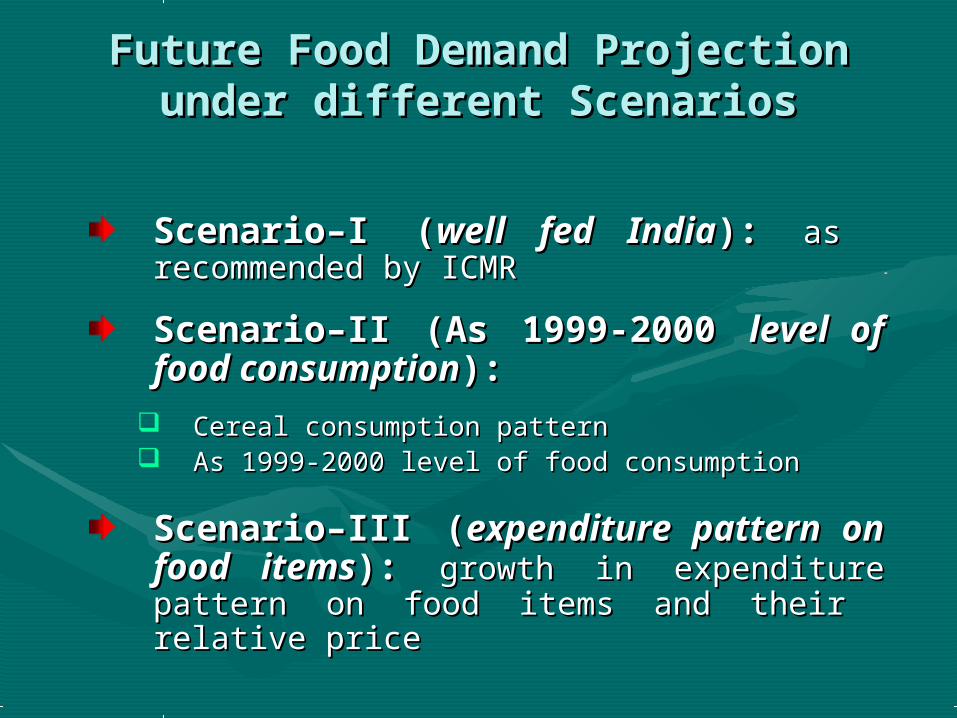
Future Food Demand Projection Future Food Demand Projection under different Scenariosunder different Scenarios
Scenario–I (Scenario–I (well fed Indiawell fed India):): as as recommended by ICMRrecommended by ICMR
Scenario–II (As 1999-2000 Scenario–II (As 1999-2000 level of level of food consumptionfood consumption):):
Cereal consumption patternCereal consumption pattern As 1999-2000 level of food consumptionAs 1999-2000 level of food consumption
Scenario–III (Scenario–III (expenditure pattern expenditure pattern on food itemson food items):): growth in expenditure growth in expenditure pattern on food items and their relative pattern on food items and their relative priceprice

Future Food Demand ProjectionsFuture Food Demand Projections
Human food demand – 2025/2050Human food demand – 2025/2050
Cereal demand for animal feedCereal demand for animal feed
Change in livestock feed requirementChange in livestock feed requirement
Import of animal based productImport of animal based product
Shift from free grazing to stall feed systemShift from free grazing to stall feed system
Post harvest losses in foodgrains, vegetablPost harvest losses in foodgrains, vegetables and fruitses and fruits
Aggregate food demand under different Aggregate food demand under different scenariosscenarios
Assessment of Irrigation Assessment of Irrigation Water Requirement for Food Water Requirement for Food
Production Production (Demand Driven Approach)(Demand Driven Approach)
Agricultural Water Requirement Agricultural Water Requirement
Water requirement for food Water requirement for food production production
Irrigation water requirement for Irrigation water requirement for animal product animal product
Aggregate irrigation water Aggregate irrigation water requirementrequirement
Conclusions and Policy Conclusions and Policy Implications… Implications…
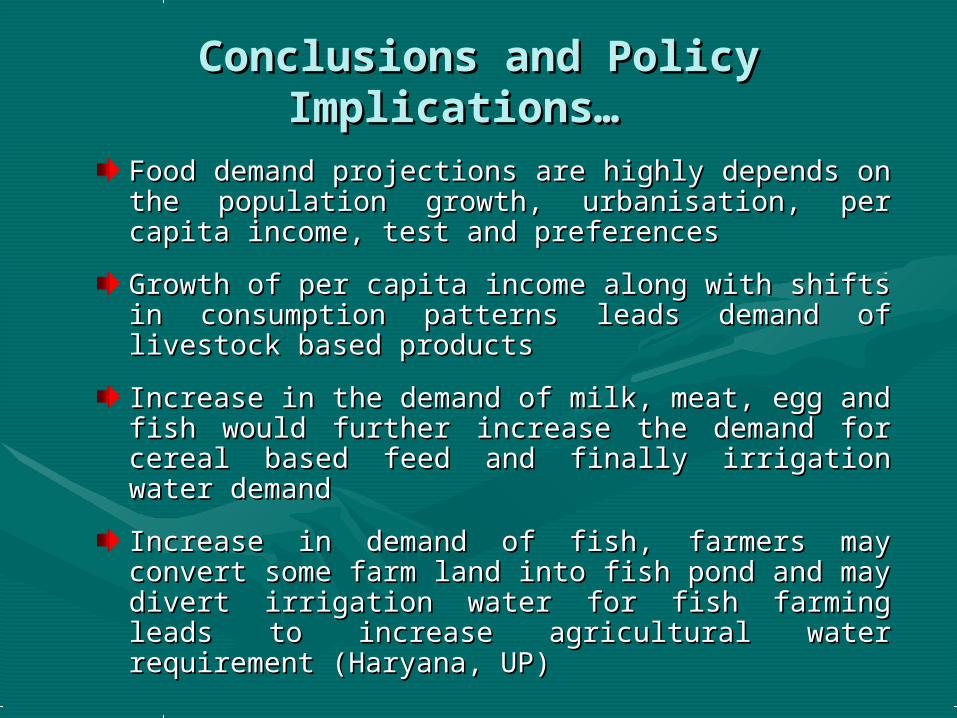
Food demand projections are highly depends on Food demand projections are highly depends on the population growth, urbanisation, per capita the population growth, urbanisation, per capita income, test and preferences income, test and preferences
Growth of per capita income along with shifts in Growth of per capita income along with shifts in consumption patterns leads demand of livestock consumption patterns leads demand of livestock based products based products
Increase in the demand of milk, meat, egg and Increase in the demand of milk, meat, egg and fish would further increase the demand for cereal fish would further increase the demand for cereal based feed and finally irrigation water demand based feed and finally irrigation water demand
Increase in demand of fish, farmers may convert Increase in demand of fish, farmers may convert some farm land into fish pond and may divert some farm land into fish pond and may divert irrigation water for fish farming leads to increase irrigation water for fish farming leads to increase agricultural water requirement (Haryana, UP) agricultural water requirement (Haryana, UP)
Conclusions and Policy Conclusions and Policy ImplicationsImplications
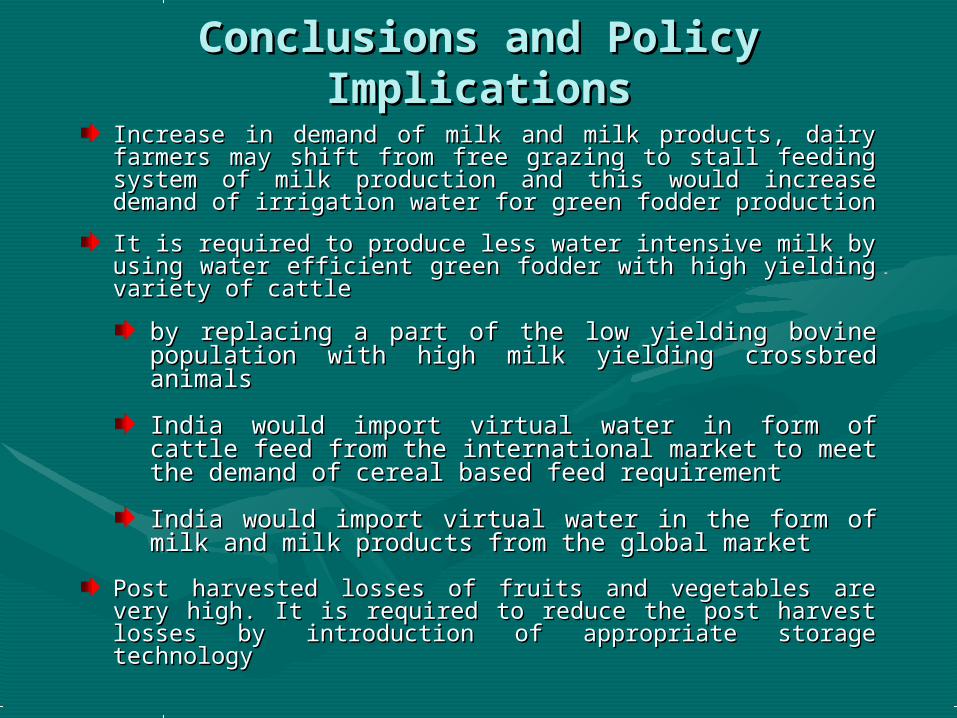
Increase in demand of milk and milk products, dairy Increase in demand of milk and milk products, dairy farmers may shift from free grazing to stall feeding farmers may shift from free grazing to stall feeding system of milk production and thissystem of milk production and this would increase would increase demand of irrigation water for green fodder productiondemand of irrigation water for green fodder production
It is required to produce less water intensive milk by It is required to produce less water intensive milk by using water efficient green fodder with high yielding using water efficient green fodder with high yielding variety of cattlevariety of cattle
by replacing a part of the low yielding bovine by replacing a part of the low yielding bovine population with high milk yielding crossbred population with high milk yielding crossbred animalsanimals
India would import virtual water in form of cattle India would import virtual water in form of cattle feed from the international market to meet the feed from the international market to meet the demand of cereal based feed requirementdemand of cereal based feed requirement
India would import virtual water in the form of milk India would import virtual water in the form of milk and milk products from the global marketand milk products from the global market
Post harvested losses of fruits and vegetables are very Post harvested losses of fruits and vegetables are very high. It is required to reduce the post harvest losses by high. It is required to reduce the post harvest losses by introduction of appropriate storage technology introduction of appropriate storage technology

Thank youThank you
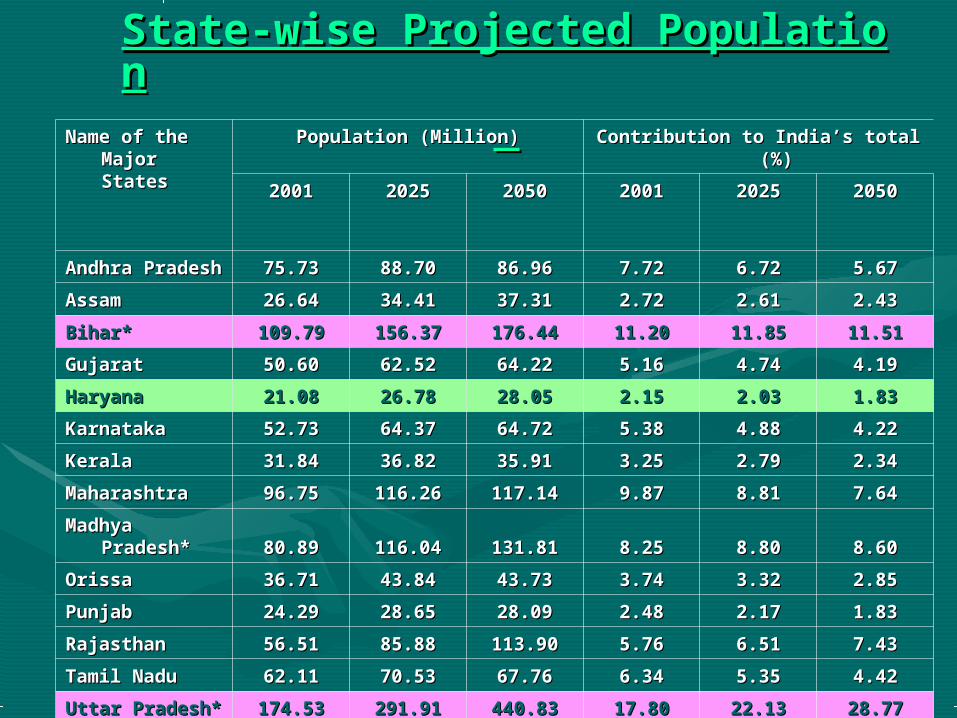
State-wise Projected PopulationState-wise Projected Population
Name of the Name of the Major Major StatesStates
Population (Million)Population (Million) Contribution to India’s total Contribution to India’s total (%)(%)
20012001 20252025 20502050 20012001 20252025 20502050
Andhra Andhra Pradesh Pradesh 75.7375.73 88.7088.70 86.9686.96 7.727.72 6.726.72 5.675.67
AssamAssam 26.6426.64 34.4134.41 37.3137.31 2.722.72 2.612.61 2.432.43
Bihar*Bihar* 109.79109.79 156.37156.37 176.44176.44 11.2011.20 11.8511.85 11.5111.51
GujaratGujarat 50.6050.60 62.5262.52 64.2264.22 5.165.16 4.744.74 4.194.19
HaryanaHaryana 21.0821.08 26.7826.78 28.0528.05 2.152.15 2.032.03 1.831.83
KarnatakaKarnataka 52.7352.73 64.3764.37 64.7264.72 5.385.38 4.884.88 4.224.22
KeralaKerala 31.8431.84 36.8236.82 35.9135.91 3.253.25 2.792.79 2.342.34
MaharashtraMaharashtra 96.7596.75 116.26116.26 117.14117.14 9.879.87 8.818.81 7.647.64
Madhya Madhya Pradesh*Pradesh* 80.8980.89 116.04116.04 131.81131.81 8.258.25 8.808.80 8.608.60
OrissaOrissa 36.7136.71 43.8443.84 43.7343.73 3.743.74 3.323.32 2.852.85
PunjabPunjab 24.2924.29 28.6528.65 28.0928.09 2.482.48 2.172.17 1.831.83
RajasthanRajasthan 56.5156.51 85.8885.88 113.90113.90 5.765.76 6.516.51 7.437.43
Tamil NaduTamil Nadu 62.1162.11 70.5370.53 67.7667.76 6.346.34 5.355.35 4.424.42
Uttar Pradesh*Uttar Pradesh* 174.53174.53 291.91291.91 440.83440.83 17.8017.80 22.1322.13 28.7728.77
West BengalWest Bengal 80.2280.22 96.2296.22 95.4695.46 8.188.18 7.297.29 6.236.23
IndiaIndia 980.42980.42 1319.311319.31 1532.341532.34 100.00100.00 100.00100.00 100.00100.00
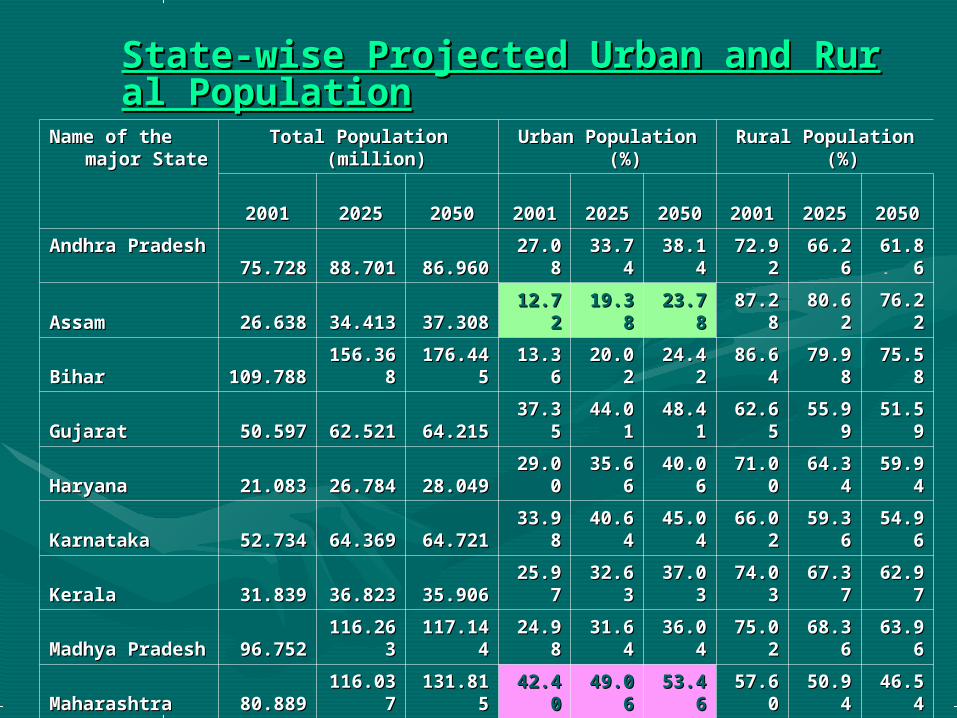
State-wise Projected Urban and RurState-wise Projected Urban and Rural Populational Population
Name of the Name of the major Statemajor State
Total Population Total Population (million)(million)
Urban Population Urban Population (%)(%)
Rural Population Rural Population (%)(%)
20012001 20252025 20502050 20012001 20252025 20502050 20012001 20252025 20502050
Andhra Andhra PradeshPradesh 75.72875.728
88.7088.7011 86.96086.960
27.027.088
33.733.744
38.138.144
72.972.922
66.266.266
61.861.866
AssamAssam 26.63826.63834.4134.41
33 37.30837.30812.712.7
2219.319.3
8823.723.7
8887.287.2
8880.680.6
2276.276.2
22
BiharBihar109.78109.78
88156.3156.3
6868176.44176.44
5513.313.3
6620.020.0
2224.424.4
2286.686.6
4479.979.9
8875.575.5
88
GujaratGujarat 50.59750.59762.5262.52
11 64.21564.21537.337.3
5544.044.0
1148.448.4
1162.662.6
5555.955.9
9951.551.5
99
HaryanaHaryana 21.08321.08326.7826.78
44 28.04928.04929.029.0
0035.635.6
6640.040.0
6671.071.0
0064.364.3
4459.959.9
44
KarnatakaKarnataka 52.73452.73464.3664.36
99 64.72164.72133.933.9
8840.640.6
4445.045.0
4466.066.0
2259.359.3
6654.954.9
66
KeralaKerala 31.83931.83936.8236.82
33 35.90635.90625.925.9
7732.632.6
3337.037.0
3374.074.0
3367.367.3
7762.962.9
77
Madhya Madhya PradeshPradesh 96.75296.752
116.2116.26363
117.14117.1444
24.924.988
31.631.644
36.036.044
75.075.022
68.368.366
63.963.966
MaharashtraMaharashtra 80.88980.889116.0116.0
3737131.81131.81
5542.442.4
0049.049.0
6653.453.4
6657.657.6
0050.950.9
4446.546.5
44
OrissaOrissa 36.70736.70743.8343.83
99 43.73343.73314.914.9
7721.621.6
3326.026.0
3385.085.0
3378.378.3
7773.973.9
77
PunjabPunjab 24.28924.28928.6428.64
88 28.09128.09133.933.9
5540.640.6
1145.045.0
1166.066.0
5559.359.3
9954.954.9
99
RajasthanRajasthan 56.50756.50785.8885.88
44113.89113.89
9923.323.3
8830.030.0
4434.434.4
4476.676.6
2269.969.9
6665.565.5
66
Tamil NaduTamil Nadu 62.11162.11170.5270.52
66 67.76167.76143.843.8
6650.550.5
2254.954.9
2256.156.1
4449.449.4
8845.045.0
88
Uttar PradeshUttar Pradesh174.53174.53
22291.9291.9
1313440.83440.83
1121.021.0
2227.627.6
8832.032.0
8878.978.9
8872.372.3
2267.967.9
22
West BengalWest Bengal 80.22180.22196.2296.22
11 95.46395.46328.028.0
3334.634.6
9939.039.0
9971.971.9
7765.365.3
1160.960.9
11
India TotalIndia Total980.41980.41
77
1319.1319.313122
1532.31532.34242
27.727.788
34.434.444
38.838.844
72.272.222
65.565.566
61.161.166
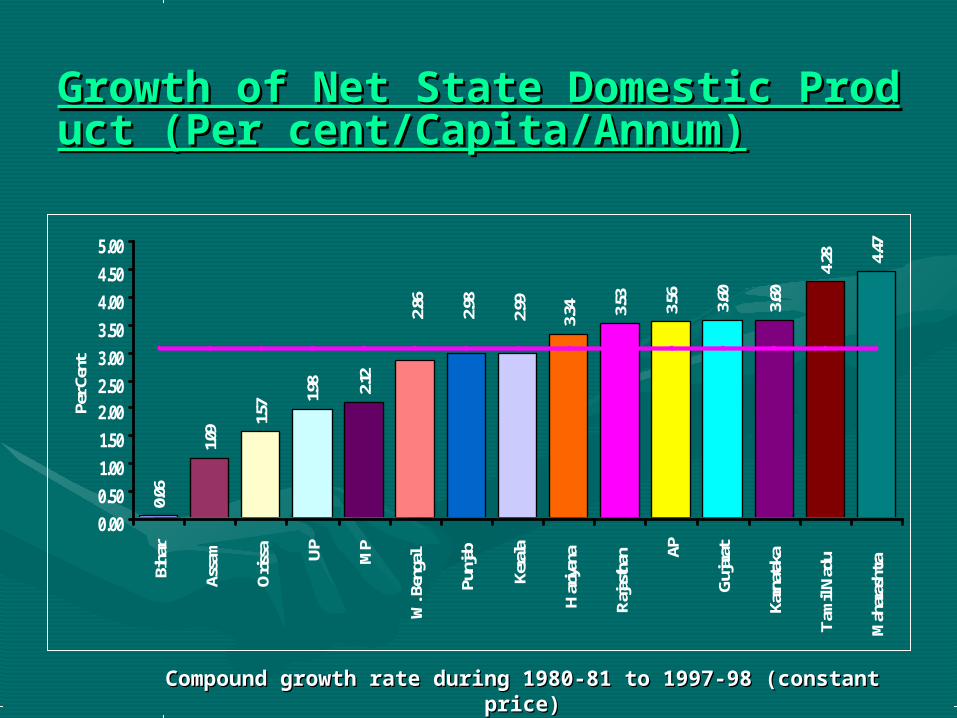
Growth of Net State Domestic ProdGrowth of Net State Domestic Product (Per cent/Capita/Annum)uct (Per cent/Capita/Annum)
Compound growth rate during 1980-81 to 1997-98 (constant Compound growth rate during 1980-81 to 1997-98 (constant price)price)
0.06
1.09 1.5
7 1.98 2.12
3.34 3.53
3.56
3.60
3.60
4.28 4.47
2.99
2.98
2.86
0.000.501.001.502.002.503.003.504.004.505.00
Biha
r
Assa
m
Oris
sa UP MP
W. B
enga
l
Punj
ab
Kera
la
Har
iyana
Rajas
than AP
Gujar
at
Karn
ataka
Tam
il N
adu
Mah
aras
htra
Per C
ent
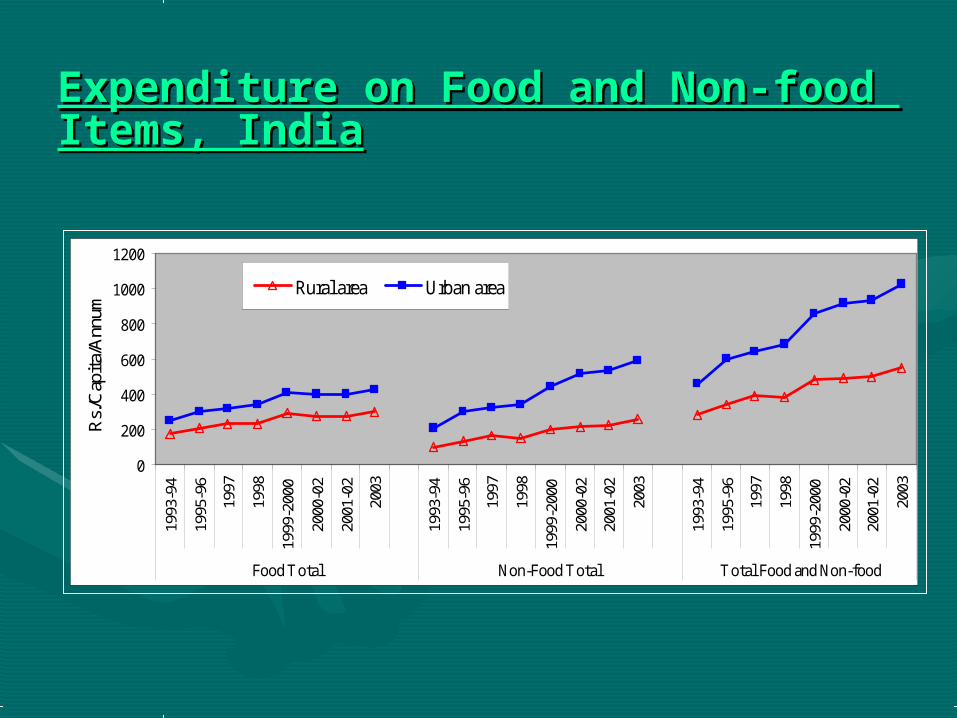
Expenditure on Food and Non-foodExpenditure on Food and Non-food Items, India Items, India
0
200
400
600
800
1000
1200
1993
-94
1995
-96
1997
1998
1999
-200
0
2000
-02
2001
-02
2003
1993
-94
1995
-96
1997
1998
1999
-200
0
2000
-02
2001
-02
2003
1993
-94
1995
-96
1997
1998
1999
-200
0
2000
-02
2001
-02
2003
Food Total Non-Food Total Total Food and Non-food
Rs./
Cap
ita/A
nnum
Rural area Urban area
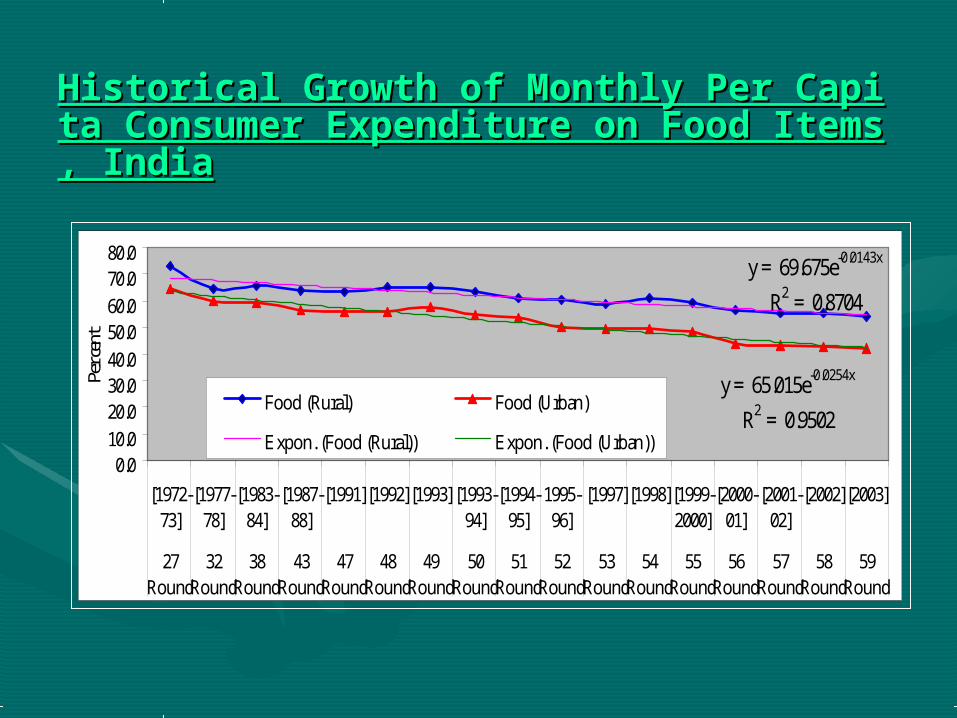
Historical Growth of Monthly Per CapitHistorical Growth of Monthly Per Capita Consumer Expenditure on Food Items,a Consumer Expenditure on Food Items, India India
y = 69.675e-0.0143x
R2 = 0.8704
y = 65.015e-0.0254x
R2 = 0.9502
0.010.020.030.040.050.060.070.080.0
[1972-73]
[1977-78]
[1983-84]
[1987-88]
[1991][1992][1993][1993-94]
[1994-95]
1995-96]
[1997][1998][1999-2000]
[2000-01]
[2001-02]
[2002][2003]
27Round
32Round
38Round
43Round
47Round
48Round
49Round
50Round
51Round
52Round
53Round
54Round
55Round
56Round
57Round
58Round
59Round
Per c
ent
Food (Rural) Food (Urban)
Expon. (Food (Rural)) Expon. (Food (Urban))
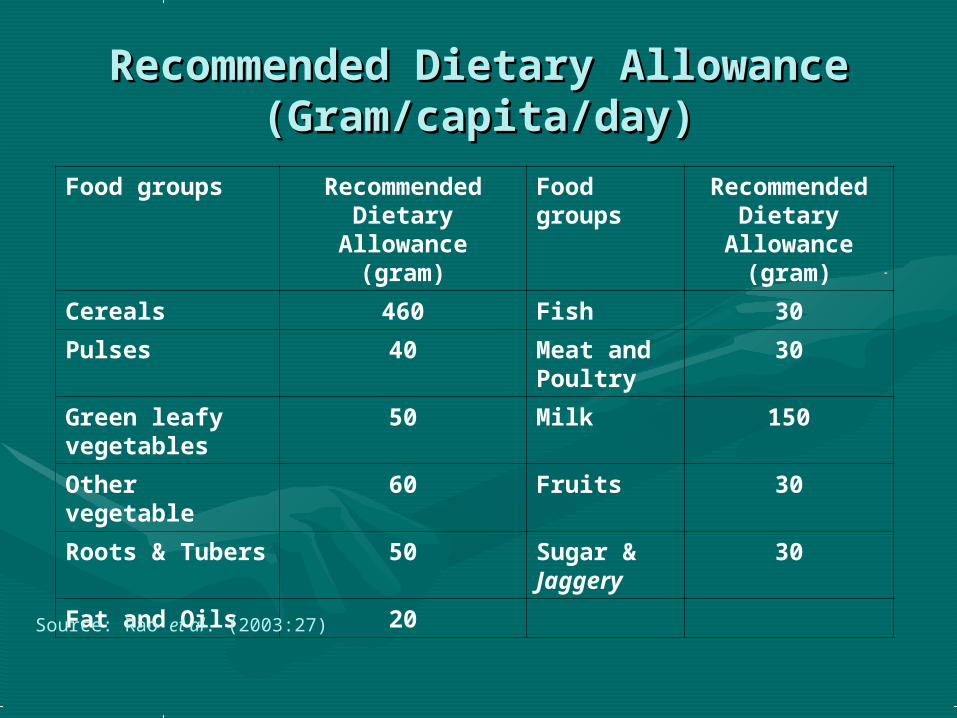
Recommended Dietary Allowance Recommended Dietary Allowance (Gram/capita/day)(Gram/capita/day)
Food groups Recommended Dietary
Allowance (gram)
Food groups
Recommended Dietary Allowance
(gram)
Cereals 460 Fish 30
Pulses 40 Meat and Poultry
30
Green leafy vegetables
50 Milk 150
Other vegetable
60 Fruits 30
Roots & Tubers
50 Sugar & Jaggery
30
Fat and Oils 20Source: Rao et al. (2003:27)

Cereal Consumption Pattern in Rural Cereal Consumption Pattern in Rural and Urban Areaand Urban Area
Rural area Rural area – Cereal: -1.45%Cereal: -1.45%
• Rice: -0.63%Rice: -0.63%• Wheat: -0.94%Wheat: -0.94%• Jowar: -8.14%Jowar: -8.14%• Bajra: -3.76%Bajra: -3.76%
UrbanUrban– Cereal: -0.95%Cereal: -0.95%
• Rice: -0.82%Rice: -0.82%• Wheat: -0.72%Wheat: -0.72%• Jowar: -4.08%Jowar: -4.08%
Historical Growth of Cereal Consumption in Rural India
y = 175.13e-0.0145x
R2 = 0.9655
0102030405060708090
100
[1987-88]
[1991] [1992] [1993] [1993-94]
[1994-95]
1995-96]
[1997] [1998] [2000-01]
[2001-02]
[2003]
43Round
47Round
48Round
49Round
50Round
51Round
52Round
53Round
54Round
56Round
57Round
59Round
Kgs
/cap
ita/
annu
m
130135140145150155160165170175180
Tot
al C
erea
l Con
sum
ptio
n
Total Cereals Rice WheatJowar Bajara MaizeExpon. (Total Cereals )
Historical Growth in Cereal Consumption in Urban India
y = 135.27e-0.0095x
R2 = 0.827
010203040506070
[1987-88]
[1991] [1992] [1993] [1993-94]
[1994-95]
1995-96]
[1997] [1998] [2000-01]
[2001-02]
[2003]
43Round
47Round
48Round
49Round
50Round
51Round
52Round
53Round
54Round
56Round
57Round
59Round
Kgs
/cap
ita/a
nnum
110115120125130135140
Tot
al C
erea
l Con
sum
ptio
n
Total Cereals Rice WheatJowar Bajara MaizeExpon. (Total Cereals )
Source: NSSOSource: NSSO
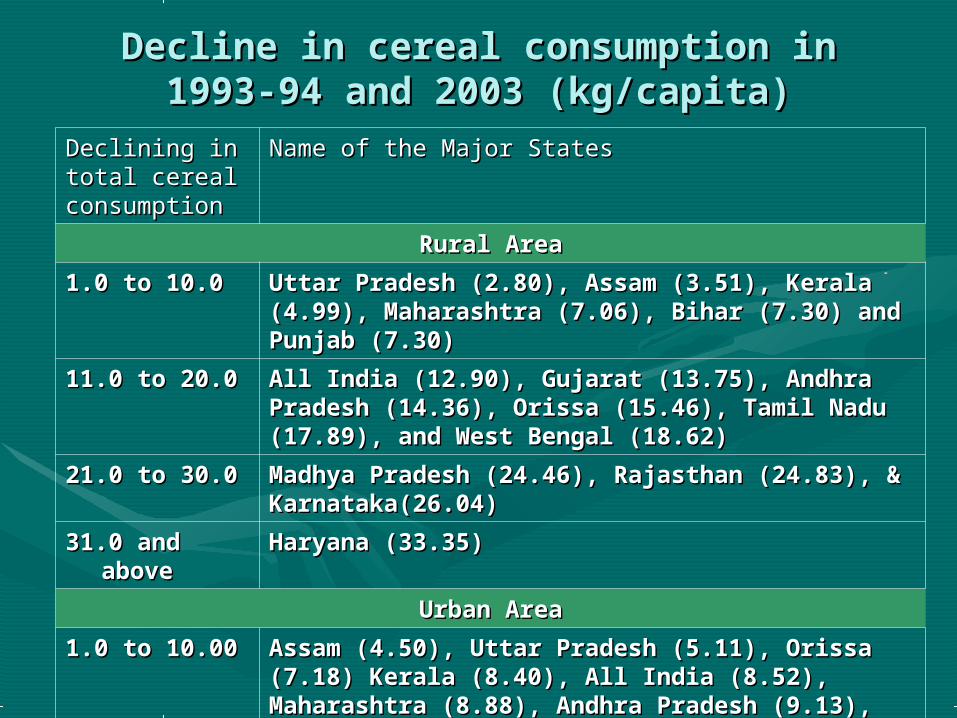
Decline in cereal consumption in 1993-Decline in cereal consumption in 1993-94 and 2003 (kg/capita)94 and 2003 (kg/capita)
Declining in Declining in total cereal total cereal consumption consumption
Name of the Major StatesName of the Major States
Rural AreaRural Area
1.0 to 10.0 1.0 to 10.0 Uttar Pradesh (2.80), Assam (3.51), Kerala Uttar Pradesh (2.80), Assam (3.51), Kerala (4.99), Maharashtra (7.06), Bihar (7.30) and (4.99), Maharashtra (7.06), Bihar (7.30) and Punjab (7.30) Punjab (7.30)
11.0 to 20.011.0 to 20.0 All India (12.90), Gujarat (13.75), Andhra All India (12.90), Gujarat (13.75), Andhra Pradesh (14.36), Orissa (15.46), Tamil Nadu Pradesh (14.36), Orissa (15.46), Tamil Nadu (17.89), and West Bengal (18.62)(17.89), and West Bengal (18.62)
21.0 to 30.021.0 to 30.0 Madhya Pradesh (24.46), Rajasthan (24.83), & Madhya Pradesh (24.46), Rajasthan (24.83), & Karnataka(26.04)Karnataka(26.04)
31.0 and 31.0 and aboveabove
Haryana (33.35)Haryana (33.35)
Urban AreaUrban Area
1.0 to 10.001.0 to 10.00 Assam (4.50), Uttar Pradesh (5.11), Orissa Assam (4.50), Uttar Pradesh (5.11), Orissa (7.18) Kerala (8.40), All India (8.52), (7.18) Kerala (8.40), All India (8.52), Maharashtra (8.88), Andhra Pradesh (9.13), Maharashtra (8.88), Andhra Pradesh (9.13), and Gujarat (9.98) and Gujarat (9.98)
11.0 to 20.011.0 to 20.0 Tamil Nadu (10.22), Madhya Pradesh (13.51), Tamil Nadu (10.22), Madhya Pradesh (13.51), Rajasthan (14.60), Karnataka (14.73), Haryana Rajasthan (14.60), Karnataka (14.73), Haryana (15.33), and West Bengal (15.70) (15.33), and West Bengal (15.70)
Positive Positive GrowthGrowth
Bihar (0.61), and Punjab (1.58)Bihar (0.61), and Punjab (1.58)
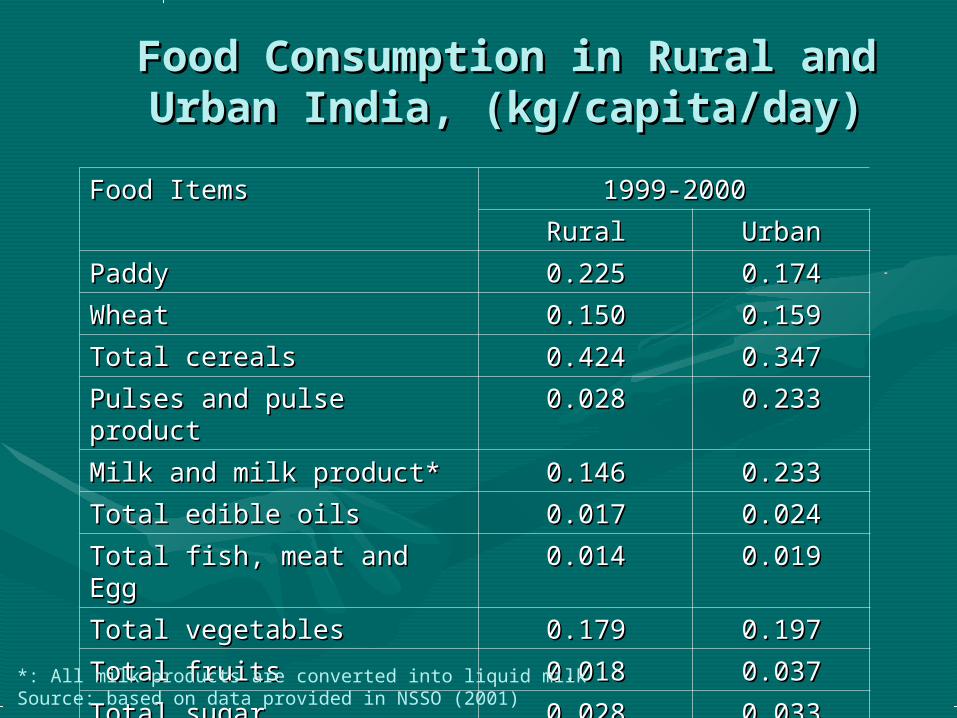
Food Consumption in Rural and Food Consumption in Rural and Urban India, (kg/capita/day)Urban India, (kg/capita/day)
Food ItemsFood Items 1999-20001999-2000
RuralRural UrbanUrban
PaddyPaddy 0.2250.225 0.1740.174
WheatWheat 0.1500.150 0.1590.159
Total cereals Total cereals 0.4240.424 0.3470.347
Pulses and pulse productPulses and pulse product 0.0280.028 0.2330.233
Milk and milk product*Milk and milk product* 0.1460.146 0.2330.233
Total edible oils Total edible oils 0.0170.017 0.0240.024
Total fish, meat and Egg Total fish, meat and Egg 0.0140.014 0.0190.019
Total vegetables Total vegetables 0.1790.179 0.1970.197
Total fruits Total fruits 0.0180.018 0.0370.037
Total sugar Total sugar 0.0280.028 0.0330.033*: All milk products are converted into liquid milkSource: based on data provided in NSSO (2001)
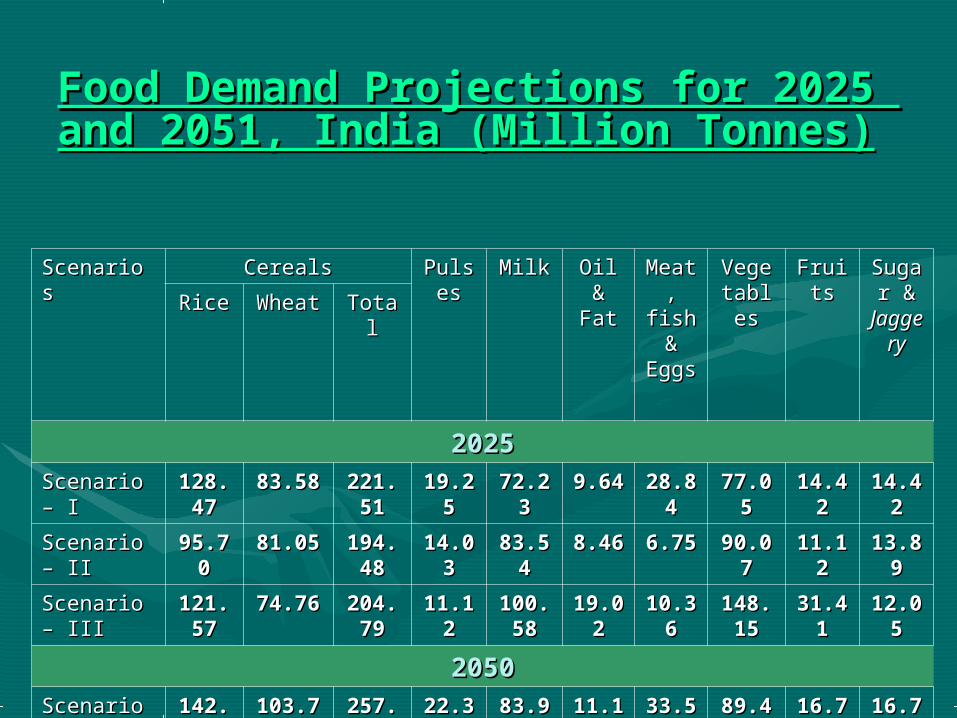
Food Demand Projections for 2025Food Demand Projections for 2025 and 2051, India (Million Tonnes) and 2051, India (Million Tonnes)
Scenarios Scenarios CerealsCereals PulsPulseses
MilkMilk Oil Oil & &
FatFat
MeaMeat, t,
fish fish & &
EggsEggs
VegeVegetabletable
ss
FruitFruitss
SugaSugar & r & JaggJaggeryery
RiceRice WheatWheat TotalTotal
20252025Scenario – Scenario – I I
128.128.4747
83.5883.58 221.221.5151
19.219.255
72.272.233
9.649.64 28.828.844
77.077.055
14.414.422
14.414.422
Scenario – Scenario – IIII
95.795.700
81.0581.05 194.194.4848
14.014.033
83.583.544
8.468.46 6.756.75 90.090.077
11.111.122
13.813.899
Scenario – Scenario – IIIIII
121.121.5757
74.7674.76 204.204.7979
11.111.122
100.100.5858
19.019.022
10.310.366
148.148.1515
31.431.411
12.012.055
20502050Scenario – Scenario – I I
142.142.9898
103.7103.766
257.257.2929
22.322.366
83.983.911
11.111.199
33.533.566
89.489.499
16.716.788
16.716.788
Scenario – Scenario – IIII
104.104.1919
102.6102.677
226.226.0909
16.616.644
101.101.2121
9.959.95 7.57.5 106.106.5656
13.413.4 16.516.544
Scenario – Scenario – IIIIII
186.186.2828
122.2122.288
326.326.8484
12.812.877
157.157.0707
40.840.899
19.219.211
287.287.5959
184.184.1919
13.813.888

Cereal Based Feed Requirement for Animal BaCereal Based Feed Requirement for Animal Based Products, India (Million Tonnes)sed Products, India (Million Tonnes)
YearYear Scenario – 1Scenario – 1(Well Fed India)(Well Fed India)
Scenario – 2Scenario – 2(Current level of (Current level of
food food Consumption Consumption (1999-2000))(1999-2000))
Scenario – 3Scenario – 3(Expenditure (Expenditure
Based)Based)
MilkMilk Meat, Meat, Egg & Egg & FishFish
TotaTotall
MilMilkk
Meat, Meat, Egg Egg & &
FishFish
TotTotaall
MilkMilk Meat, Meat, Egg Egg & &
FishFish
TotaTotall
20252025 8.678.67 34.6734.67 43.343.344
10.10.0022
8.128.12 18.18.1144
12.012.077
12.412.433
24.524.500
20502050 10.0710.07 40.2740.27 50.350.344
12.12.1155
9.009.00 21.21.1155
18.818.855
23.023.055
41.941.900
1.2 kg cereal requirement for production of meat and eggs and fish 1.2 kg cereal requirement for production of meat and eggs and fish 0.12 kg of cereal based feed requirement for milk production (Bhalla 0.12 kg of cereal based feed requirement for milk production (Bhalla et alet al. 1999). 1999)
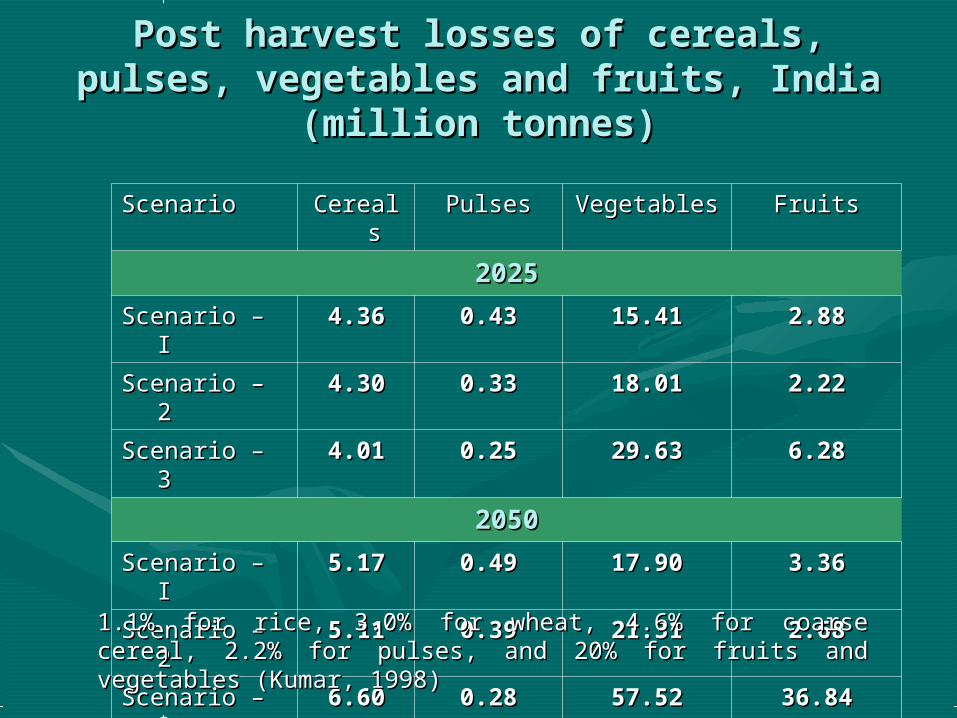
Post harvest losses of cereals, pulses, Post harvest losses of cereals, pulses, vegetables and fruits, India (million vegetables and fruits, India (million
tonnes)tonnes)
ScenarioScenario CerealsCereals PulsesPulses VegetablesVegetables FruitsFruits
20252025
Scenario – IScenario – I 4.364.36 0.430.43 15.4115.41 2.882.88
Scenario – 2Scenario – 2 4.304.30 0.330.33 18.0118.01 2.222.22
Scenario – 3Scenario – 3 4.014.01 0.250.25 29.6329.63 6.286.28
20502050
Scenario – IScenario – I 5.175.17 0.490.49 17.9017.90 3.363.36
Scenario – 2Scenario – 2 5.115.11 0.390.39 21.3121.31 2.682.68
Scenario – 3Scenario – 3 6.606.60 0.280.28 57.5257.52 36.8436.84
1.1% for rice, 3.0% for wheat, 4.6% for coarse cereal, 2.2% for 1.1% for rice, 3.0% for wheat, 4.6% for coarse cereal, 2.2% for pulses, and 20% for fruits and vegetables (Kumar, 1998)pulses, and 20% for fruits and vegetables (Kumar, 1998)

Aggregate Projected Food Demand under Aggregate Projected Food Demand under different Scenarios, India (million tonnes)different Scenarios, India (million tonnes)
ScenarioScenario Total Total CereCerealsals
PulsePulsess
MilkMilk EdiblEdible Oilse Oils
Meat, Meat, fish & fish & EggsEggs
VegetVegetablesables
FruitsFruits Sugar Sugar & &
JaggeJaggeryry
20252025
Scenario - Scenario - II
269.269.2121 19.6819.68 72.2372.23 9.649.64 28.8428.84 92.4692.46 17.3017.30 14.4214.42
Scenario - Scenario - IIII
216.216.9292 14.3614.36 83.5483.54 8.468.46 6.756.75
108.0108.088 13.3413.34 13.8913.89
Scenario - Scenario - IIIIII
233.233.3030 11.3711.37
100.5100.588 19.0219.02 10.3610.36
177.7177.788 37.6937.69 12.0512.05
20502050
Scenario - Scenario - II
312.312.8080 22.8522.85 83.9183.91 11.1911.19 33.5633.56
107.3107.399 20.1420.14 16.7816.78
Scenario - Scenario - IIII
252.252.3535 17.0317.03
101.2101.211 9.959.95 7.507.50
127.8127.877 16.0816.08 16.5416.54
Scenario - Scenario - IIIIII
375.375.3434 13.1513.15
157.0157.077 40.8940.89 19.2119.21
345.1345.111
221.0221.033 13.8813.88

Irrigation Water Requirement for Irrigation Water Requirement for Food Production (BCM)Food Production (BCM)
Scenario Scenario RiceRice WheaWheatt
OtheOthersrs
Total Total cerealcereal
ss
PulsePulsess
EdiblEdible Oilse Oils
SugaSugarr
20252025
Scenario – Scenario – II
661.661.5252
147.0147.022
30.430.411
838.9838.944
104.104.8383
95.495.455
68.868.866
Scenario – Scenario – IIII
492.492.2323
134.7134.744
50.850.822
677.7677.799
77.277.200
83.483.477
67.267.211
Scenario – Scenario – IIIIII
619.619.8888
133.5133.555
30.030.011
783.4783.444
62.762.700
185.185.4040
62.562.533
20502050
Scenario – Scenario – II
750.750.6767
173.2173.200
34.434.499
958.3958.355
117.117.5050
110.110.9494
77.177.144
Scenario – Scenario – IIII
546.546.3131
163.2163.255
55.155.111
764.6764.666
87.887.877
98.198.188
77.177.188
Scenario – Scenario – IIIIII
944.944.3636
227.7227.722
62.362.344
1234.1234.4242
72.872.866
395.395.3535
73.473.444
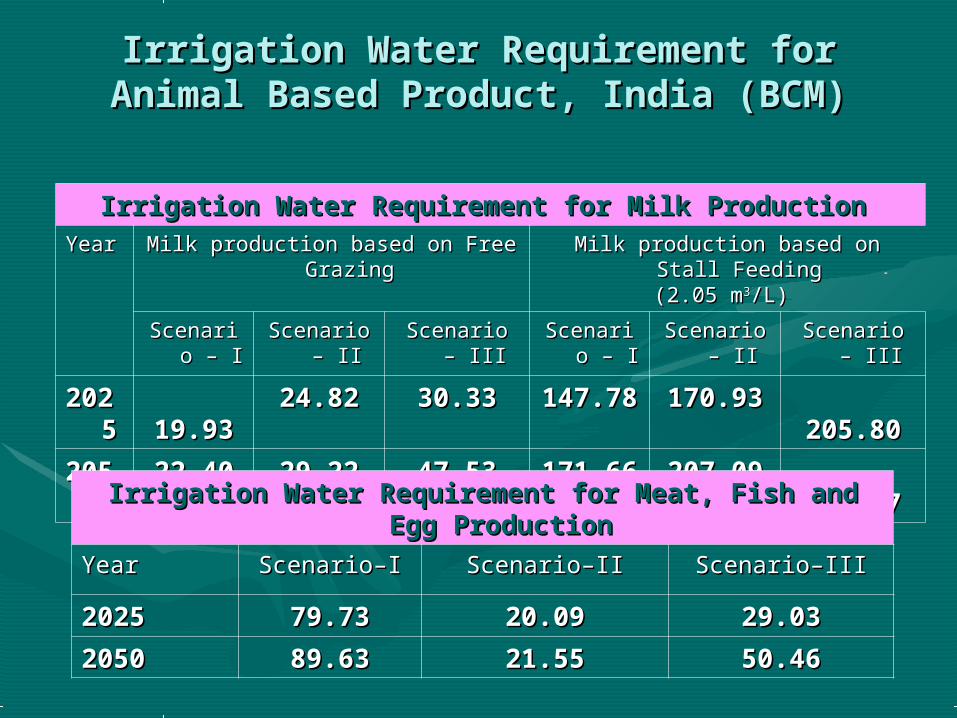
Irrigation Water Requirement for Irrigation Water Requirement for Animal Based Product, India (BCM)Animal Based Product, India (BCM)
Irrigation Water Requirement for Milk Production Irrigation Water Requirement for Milk Production YearYear Milk production based on Free Milk production based on Free
GrazingGrazingMilk production based on Stall Milk production based on Stall
Feeding Feeding (2.05 m(2.05 m33/L) /L)
Scenario Scenario – I– I
Scenario Scenario – II– II
Scenario – Scenario – IIIIII
Scenario Scenario – I– I
Scenario Scenario – II– II
Scenario – Scenario – IIIIII
2022025 5 19.9319.93
24.8224.82 30.3330.33 147.7147.788
170.93170.93205.80205.80
20520500
22.4022.40 29.2229.22 47.5347.53 171.6171.666
207.09207.09321.37321.37Irrigation Water Requirement for Meat, Fish and Egg Irrigation Water Requirement for Meat, Fish and Egg
ProductionProduction
YearYear Scenario–IScenario–I Scenario–IIScenario–II Scenario–IIIScenario–III
20252025 79.7379.73 20.0920.09 29.0329.03
20502050 89.6389.63 21.5521.55 50.4650.46
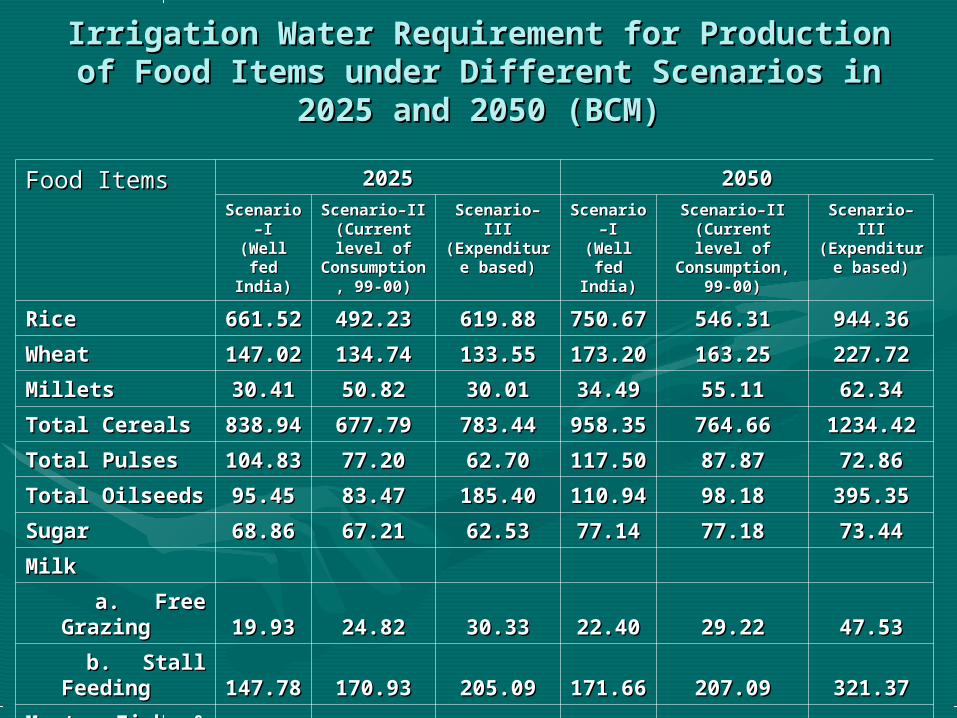
Irrigation Water Requirement for Production Irrigation Water Requirement for Production of Food Items under Different Scenarios in of Food Items under Different Scenarios in
2025 and 2050 (BCM)2025 and 2050 (BCM)
Food Items Food Items 20252025 20502050ScenariScenari
o–Io–I(Well (Well fed fed
India)India)
Scenario–IIScenario–II(Current (Current level of level of
ConsumptiConsumption, 99-00)on, 99-00)
Scenario–Scenario–IIIIII
(Expenditu(Expenditure based)re based)
ScenariScenario–Io–I
(Well (Well fed fed
India)India)
Scenario–IIScenario–II(Current level (Current level
of of Consumption, Consumption,
99-00)99-00)
Scenario–Scenario–IIIIII
(Expenditu(Expenditure based)re based)
Rice Rice 661.5661.522 492.23492.23 619.88619.88
750.6750.677 546.31546.31 944.36944.36
WheatWheat 147.0147.022 134.74134.74 133.55133.55
173.2173.200 163.25163.25 227.72227.72
Millets Millets 30.4130.41 50.8250.82 30.0130.01 34.4934.49 55.1155.11 62.3462.34
Total CerealsTotal Cereals 838.9838.944 677.79677.79 783.44783.44
958.3958.355 764.66764.66 1234.421234.42
Total PulsesTotal Pulses 104.8104.833 77.2077.20 62.7062.70
117.5117.500 87.8787.87 72.8672.86
Total OilseedsTotal Oilseeds95.4595.45 83.4783.47 185.40185.40
110.9110.944 98.1898.18 395.35395.35
SugarSugar 68.8668.86 67.2167.21 62.5362.53 77.1477.14 77.1877.18 73.4473.44
Milk Milk
a. Free a. Free GrazingGrazing 19.9319.93 24.8224.82 30.3330.33 22.4022.40 29.2229.22 47.5347.53
b. Stall b. Stall FeedingFeeding
147.7147.788 170.93170.93 205.09205.09
171.6171.666 207.09207.09 321.37321.37
Meat, Fish & Meat, Fish & EggsEggs 79.7379.73 20.0920.09 29.0329.03 89.6389.63 21.5521.55 50.4650.46