assessing the feasibility of impregnating phase change ... · assessing the feasibility of...
TRANSCRIPT

Construction and Building Materials 89 (2015) 48–59
Contents lists available at ScienceDirect
Construction and Building Materials
journal homepage: www.elsevier .com/locate /conbui ldmat
Assessing the feasibility of impregnating phase change materials inlightweight aggregate for development of thermal energy storagesystems
http://dx.doi.org/10.1016/j.conbuildmat.2015.04.0310950-0618/� 2015 Elsevier Ltd. All rights reserved.
⇑ Corresponding author. Tel.: +351 275 329 990; fax: +351 275 329 969.E-mail addresses: [email protected] (M. Kheradmand),
[email protected] (J. Castro-Gomes), [email protected](M. Azenha), [email protected] (P.D. Silva), [email protected] (J.L.B. de Aguiar),[email protected] (S.E. Zoorob).
1 Tel.: +351 913542324; fax: +351 253 510 217.2 Tel.: +351 938404554; fax: +351 253 510 217.3 Tel.: +351 275 329 916; fax: +351 275 329 969.4 Tel.: +351 253 510 206; fax: +351 253 510 217.
Mohammad Kheradmand a,1, João Castro-Gomes b,⇑, Miguel Azenha c,2, Pedro D. Silva d,3,José L.B. de Aguiar a,4, Salah E. Zoorob e,4
a CTAC – Territory, Environment and Construction Research Centre, University of Minho, School of Engineering, Civil Engineering Dept., Azurém Campus, 4800-058 Guimarães, Portugalb C-MADE, Centre of Materials and Building Technologies, Department of Civil Engineering and Architecture, University of Beira Interior, 6201-001 Covilhã, Portugalc ISISE – Institute for Sustainability and Innovation in Structural Engineering, University of Minho, School of Engineering, Civil Engineering Dept., Azurém Campus,4800-058 Guimarães, Portugald C-MADE, Centre of Materials and Building Technologies, Department of Electromechanical, University of Beira Interior, 6201-001 Covilhã, Portugale Highway Materials, Universiti Teknologi Petronas, Civil Engineering Department, 31750 Tronoh, Perak, Malaysia
h i g h l i g h t s
� Feasibility of PCMs incorporation/encasement in LWAs.� Leakage of impregnated/encased PCMs in LWAs under freeze/thawing test.� Leakage of impregnated/encased PCMs in LWAs under drying test.� SEM microstructural assessment of waterproof bound in LWAs.
a r t i c l e i n f o
Article history:Received 7 December 2014Received in revised form 9 March 2015Accepted 21 April 2015
Keywords:Phase change materialsLightweight aggregatesImpregnation/encasementFreeze/thawing testDrying test
a b s t r a c t
This paper assesses the feasibility of impregnation/encasement of phase change materials (PCMs) inlightweight aggregates (LWAs). An impregnation process was adopted to carry out the encasement studyof two different PCMs in four different LWAs. The leakage of the impregnated/encased PCMs was studiedwhen they were submitted to freeze/thawing and oven drying tests, separately. The results confirmedthat, the impregnation/encasement method is effective with respect to the large thermal energy storagedensity, and can be suitable for applications were PCMs cannot be incorporated directly such as asphaltroad pavements.
� 2015 Elsevier Ltd. All rights reserved.
1. Introduction
Phase change materials (PCMs) are used as thermal storage sys-tems for assisting thermal control, as a consequence of their ability
to store and release thermal energy during phase change processes(melting and freezing) [1]. During the process of solidification,PCMs release energy in the form of latent heat, and conversely,when PCMs melt, they absorb thermal energy from the surround-ings. The magnitude of energy stored in a given PCM subject to cer-tain environmental conditions strongly depends on its transitiontemperatures [2,3]. Many numerical and experimental investiga-tions have been carried out in order to evaluate the incorporationof PCMs into building materials [1,4,5]. For instance, PCMs havebeen incorporated into plastering mortars [6,7], masonry walls[8], tiles [9], concrete [10], asphalt road layers [11] and plasterboards [12]. It is also relevant to highlight selected earlier researchwork that specifically focused on the incorporation of PCMs in
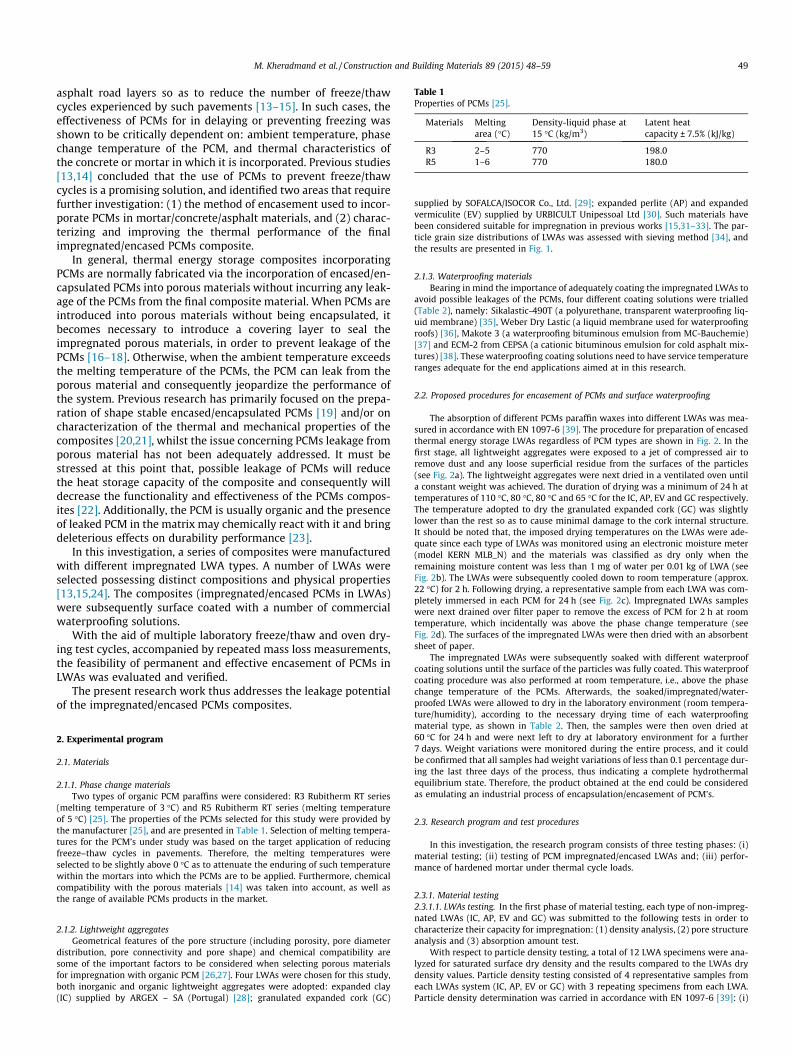
Table 1Properties of PCMs [25].
Materials Meltingarea (�C)
Density-liquid phase at15 �C (kg/m3)
Latent heatcapacity ± 7.5% (kJ/kg)
R3 2–5 770 198.0R5 1–6 770 180.0
M. Kheradmand et al. / Construction and Building Materials 89 (2015) 48–59 49
asphalt road layers so as to reduce the number of freeze/thawcycles experienced by such pavements [13–15]. In such cases, theeffectiveness of PCMs for in delaying or preventing freezing wasshown to be critically dependent on: ambient temperature, phasechange temperature of the PCM, and thermal characteristics ofthe concrete or mortar in which it is incorporated. Previous studies[13,14] concluded that the use of PCMs to prevent freeze/thawcycles is a promising solution, and identified two areas that requirefurther investigation: (1) the method of encasement used to incor-porate PCMs in mortar/concrete/asphalt materials, and (2) charac-terizing and improving the thermal performance of the finalimpregnated/encased PCMs composite.
In general, thermal energy storage composites incorporatingPCMs are normally fabricated via the incorporation of encased/en-capsulated PCMs into porous materials without incurring any leak-age of the PCMs from the final composite material. When PCMs areintroduced into porous materials without being encapsulated, itbecomes necessary to introduce a covering layer to seal theimpregnated porous materials, in order to prevent leakage of thePCMs [16–18]. Otherwise, when the ambient temperature exceedsthe melting temperature of the PCMs, the PCM can leak from theporous material and consequently jeopardize the performance ofthe system. Previous research has primarily focused on the prepa-ration of shape stable encased/encapsulated PCMs [19] and/or oncharacterization of the thermal and mechanical properties of thecomposites [20,21], whilst the issue concerning PCMs leakage fromporous material has not been adequately addressed. It must bestressed at this point that, possible leakage of PCMs will reducethe heat storage capacity of the composite and consequently willdecrease the functionality and effectiveness of the PCMs compos-ites [22]. Additionally, the PCM is usually organic and the presenceof leaked PCM in the matrix may chemically react with it and bringdeleterious effects on durability performance [23].
In this investigation, a series of composites were manufacturedwith different impregnated LWA types. A number of LWAs wereselected possessing distinct compositions and physical properties[13,15,24]. The composites (impregnated/encased PCMs in LWAs)were subsequently surface coated with a number of commercialwaterproofing solutions.
With the aid of multiple laboratory freeze/thaw and oven dry-ing test cycles, accompanied by repeated mass loss measurements,the feasibility of permanent and effective encasement of PCMs inLWAs was evaluated and verified.
The present research work thus addresses the leakage potentialof the impregnated/encased PCMs composites.
2. Experimental program
2.1. Materials
2.1.1. Phase change materialsTwo types of organic PCM paraffins were considered: R3 Rubitherm RT series
(melting temperature of 3 �C) and R5 Rubitherm RT series (melting temperatureof 5 �C) [25]. The properties of the PCMs selected for this study were provided bythe manufacturer [25], and are presented in Table 1. Selection of melting tempera-tures for the PCM’s under study was based on the target application of reducingfreeze–thaw cycles in pavements. Therefore, the melting temperatures wereselected to be slightly above 0 �C as to attenuate the enduring of such temperaturewithin the mortars into which the PCMs are to be applied. Furthermore, chemicalcompatibility with the porous materials [14] was taken into account, as well asthe range of available PCMs products in the market.
2.1.2. Lightweight aggregatesGeometrical features of the pore structure (including porosity, pore diameter
distribution, pore connectivity and pore shape) and chemical compatibility aresome of the important factors to be considered when selecting porous materialsfor impregnation with organic PCM [26,27]. Four LWAs were chosen for this study,both inorganic and organic lightweight aggregates were adopted: expanded clay(IC) supplied by ARGEX – SA (Portugal) [28]; granulated expanded cork (GC)
supplied by SOFALCA/ISOCOR Co., Ltd. [29]; expanded perlite (AP) and expandedvermiculite (EV) supplied by URBICULT Unipessoal Ltd [30]. Such materials havebeen considered suitable for impregnation in previous works [15,31–33]. The par-ticle grain size distributions of LWAs was assessed with sieving method [34], andthe results are presented in Fig. 1.
2.1.3. Waterproofing materialsBearing in mind the importance of adequately coating the impregnated LWAs to
avoid possible leakages of the PCMs, four different coating solutions were trialled(Table 2), namely: Sikalastic-490T (a polyurethane, transparent waterproofing liq-uid membrane) [35], Weber Dry Lastic (a liquid membrane used for waterproofingroofs) [36], Makote 3 (a waterproofing bituminous emulsion from MC-Bauchemie)[37] and ECM-2 from CEPSA (a cationic bituminous emulsion for cold asphalt mix-tures) [38]. These waterproofing coating solutions need to have service temperatureranges adequate for the end applications aimed at in this research.
2.2. Proposed procedures for encasement of PCMs and surface waterproofing
The absorption of different PCMs paraffin waxes into different LWAs was mea-sured in accordance with EN 1097-6 [39]. The procedure for preparation of encasedthermal energy storage LWAs regardless of PCM types are shown in Fig. 2. In thefirst stage, all lightweight aggregates were exposed to a jet of compressed air toremove dust and any loose superficial residue from the surfaces of the particles(see Fig. 2a). The lightweight aggregates were next dried in a ventilated oven untila constant weight was achieved. The duration of drying was a minimum of 24 h attemperatures of 110 �C, 80 �C, 80 �C and 65 �C for the IC, AP, EV and GC respectively.The temperature adopted to dry the granulated expanded cork (GC) was slightlylower than the rest so as to cause minimal damage to the cork internal structure.It should be noted that, the imposed drying temperatures on the LWAs were ade-quate since each type of LWAs was monitored using an electronic moisture meter(model KERN MLB_N) and the materials was classified as dry only when theremaining moisture content was less than 1 mg of water per 0.01 kg of LWA (seeFig. 2b). The LWAs were subsequently cooled down to room temperature (approx.22 �C) for 2 h. Following drying, a representative sample from each LWA was com-pletely immersed in each PCM for 24 h (see Fig. 2c). Impregnated LWAs sampleswere next drained over filter paper to remove the excess of PCM for 2 h at roomtemperature, which incidentally was above the phase change temperature (seeFig. 2d). The surfaces of the impregnated LWAs were then dried with an absorbentsheet of paper.
The impregnated LWAs were subsequently soaked with different waterproofcoating solutions until the surface of the particles was fully coated. This waterproofcoating procedure was also performed at room temperature, i.e., above the phasechange temperature of the PCMs. Afterwards, the soaked/impregnated/water-proofed LWAs were allowed to dry in the laboratory environment (room tempera-ture/humidity), according to the necessary drying time of each waterproofingmaterial type, as shown in Table 2. Then, the samples were then oven dried at60 �C for 24 h and were next left to dry at laboratory environment for a further7 days. Weight variations were monitored during the entire process, and it couldbe confirmed that all samples had weight variations of less than 0.1 percentage dur-ing the last three days of the process, thus indicating a complete hydrothermalequilibrium state. Therefore, the product obtained at the end could be consideredas emulating an industrial process of encapsulation/encasement of PCM’s.
2.3. Research program and test procedures
In this investigation, the research program consists of three testing phases: (i)material testing; (ii) testing of PCM impregnated/encased LWAs and; (iii) perfor-mance of hardened mortar under thermal cycle loads.
2.3.1. Material testing2.3.1.1. LWAs testing. In the first phase of material testing, each type of non-impreg-nated LWAs (IC, AP, EV and GC) was submitted to the following tests in order tocharacterize their capacity for impregnation: (1) density analysis, (2) pore structureanalysis and (3) absorption amount test.
With respect to particle density testing, a total of 12 LWA specimens were ana-lyzed for saturated surface dry density and the results compared to the LWAs drydensity values. Particle density testing consisted of 4 representative samples fromeach LWAs system (IC, AP, EV or GC) with 3 repeating specimens from each LWA.Particle density determination was carried in accordance with EN 1097-6 [39]: (i)

Table 2Technical data of waterproofing materials [35–38].
Materials Applicationtemperature (�C)
Servicetemperature (�C)
Softeningtemperature (�C)
Density (kg/m3) Drying time (h) Color Names
CEPSA (ECM-2) 30–60 – +35 – – Black CEPMC-Bauchemie (Makote 3) 5–40 * – 1080 48 Black MCBWeber Dry Lastic 10–40 �15 to +70 – 1300 24–36 White WEBSikalastic-490T 5–40 �30 to +90 – 990 8–12 Transparent SIK
* No information available on behalf of the supplier. The product is a bituminous emulsion that is recommended for protection of buried concrete elements or as a primerfor asphaltic fabric.
Fig. 1. Distribution of particle size of the LWA’s with the representative shot of LWAs presented in the insets: (a) expanded clay (IC); (b) granulated expanded cork (GC); (c)expanded vermiculite (EV); and (d) expanded perlite (AP).
50 M. Kheradmand et al. / Construction and Building Materials 89 (2015) 48–59
first, LWAs samples were oven-dried at 80 �C for 24 h; (ii) then, LWAs samples werenext immersed in water at 22 �C; (iii) following water immersion, LWAs sampleswere placed on filter paper for 2 h at room temperature (about 22 �C) to drainthe excess of superficial water; (iv) then, the surface of the samples was dried withan absorbent sheet of paper. Finally the surface dried LWAs samples were placedinside various densimeter of 500 mL capacity and weighted.
Pore structure analysis was also conducted on 12 specimens comprising 4 rep-resentative samples of each LWAs system (IC, AP, EV or GC) with 3 repeat specimensfrom each LWA type.
Specific total surface area and pore size distribution of the LWAs were mea-sured using a Quantachrome Instrument, model NOVA 2200e.
Total specific surface area (external surface area and pore surface of particles)determinations were conducted using Multi-point Brunauer–Emmett–Teller(B.E.T) method which is suitable for solid materials [40]. Furthermore, the Barrett,Joyner and Halenda’s (B.J.H) method was used to determine pore size distribution,which relates pore volume to pore size, also allowing porosity analysis. In this testnitrogen was used for adsorption and desorption processes with an accuracy of±0.1% and liquid nitrogen was used to maintain a controlled environment.
Also in this phase, a series of tests (24 specimens) have been performed toassess the absorption capacity of PCMs by the LWAs selected for this investigation.This included 8 representative specimens of each LWA type (IC, AP, EV or GC) witheach type of PCM (R3 or R5) with 3 repeating specimens from each mixture. Specificnomenclature has been given to each composite material in order facilitate identi-fication. In this way a designation type was created in which the two first charactersstand for the name of the corresponding LWA (IC, AP, EV or GC), followed by twocharacters corresponding to the PCMs type (R3 or R5).As an example, IC_R3 corre-sponds to expanded clay containing PCM with melting temperature of 3 �C.
2.3.1.2. PCM testing. Also in this phase of material testing, both PCM types (i.e. R3and R5) were subjected to differential scanning calorimetry (DSC) testing. OneDSC experiment was conducted for each of the studied PCMs.
The DSC calorimeter submits the pure PCM sample to controlled temperaturesand records the corresponding heat fluxes, thus providing information about tem-peratures and specific enthalpies associated with phase changes. Based on the mea-sured heat fluxes corresponding to heating or cooling processes, the specific heat, as

CEP: Is the waterproof material with the name of CEPSA (ECM-2); MCB:Is the waterproof material with the name of MC-Bauchemie (Makote 4);WEB:Is the waterproof material with the name of Weber Dry Lastic;SIK:Is the waterproof material with the name of Sikalastic -490T. Figure 2 - Illustration of encased/encapsulated thermal energy storage LWAs (a) cleaned surfaces of the particles after using a jet of compressed air; (b) dried LWAs following removal from a ventilated oven; (c) impregnation of LWA in PCM; (d) drainage procedure over a filter paper (e) visual appearance of PCM+LWA samples coated with different waterproofing materials.
Expanded Clay (IC) Granulated Expanded Cork (GC)
CEB MCB CEP MCB
WEB SIK WEB SIKExpanded Vermiculite (EV) Expanded Perlite (AP)
CEP MCB CEP MCB
WEB SIK WEB SIK
(a) (b)
(c)(d)
(e)
(a) (b)
(c)(d)
(e)
(d)
(a) (b)
(c)
(a) (b)
(c)(d)
(e)(e)
Fig. 2. Illustration of encased/encapsulated thermal energy storage LWAs (a) cleaned surfaces of the particles after using a jet of compressed air; (b) dried LWAs followingremoval from a ventilated oven; (c) impregnation of LWA in PCM; (d) drainage procedure over a filter paper (e) visual appearance of PCM + LWA samples coated withdifferent waterproofing materials.
M. Kheradmand et al. / Construction and Building Materials 89 (2015) 48–59 51
a function of temperature, can be obtained, and the specific enthalpy is determinedby numerical integration procedures [41]. In this study, the methodology of specificenthalpy calculation follows the strategy adopted in [42]. The melting and freezingbehaviors of the PCM were analyzed by a DSC model NETZSCH 200 F3 Maia. TheDSC has an accuracy of ±0.2 �C for temperature measurements.
All the samples were tested in 40 lL capacity aluminum crucibles undernitrogen (N2) atmosphere with a flow of 50 mL min�1. The weights forsamples R3 and R5 were 5.35 mg and 5.68 mg respectively, measured to an
accuracy of ±0.01 mg. Each sample was sealed in the pan by using an encap-sulating press. An empty aluminum crucible was used as a reference in allmeasurements.
The effect of thermal cycles and heating/cooling rates on the phase change pro-cesses and specific enthalpy values was examined. In this way, different heat-ing/cooling rates of 0.5 �C min�1, 1 �C min�1, 2 �C min�1, 5 �C min�1 and10 �C min�1 were considered. The applied program steps for the test procedure ofsamples were as follows: (i) initial isothermal period at �20 �C for 5 min; (ii)

52 M. Kheradmand et al. / Construction and Building Materials 89 (2015) 48–59
dynamic heating up to +20 �C according to the proposed rate (0.5 �C min�1,1 �C min�1, 2 �C min�1, 5 �C min�1 or 10 �C min�1); (iii) stabilization at +20�C for5 min; (iv) dynamic cooling to �20 �C with proposed rate (0.5 �C min�1,1 �C min�1, 2 �C min�1, 5 �C min�1 or 10 �C min�1). For the PCMs analyzed, eachsample endured one full cycle (each full cycle consisted of the steps (i)–(iv) asdetailed earlier). The DSC peaks for each PCM were evaluated for a cycle of heat-ing/cooling curves in terms of latent heat storage and phase change temperatures,in line with Refs. [43–45]. The onset and end temperature for each transition weredetermined in accordance with standard EN ISO 11357-1[46].
2.3.2. Testing of PCM impregnated/encased LWAsIn this phase, two series of tests were performed on PCM impregnated/encased
LWAs: freeze/thaw cycle tests and drying tests.A total of 40 specimens were tested under freeze/thaw cycles. This included 8
representative specimens from each LWAs system (IC, AP, EV or GC) with each typeof PCM (R3 or R5) with or without a waterproofing solution (REF, SIK, WEB, MCB orCEP). Additionally a total of 40 specimens (same distribution as used for the freeze/thaw cycles) were tested by oven drying. Specific nomenclature has been given toeach composite material in order facilitate identification. In this way a designationtype was created in which the first two characters stand for the name of corre-sponding LWAs (IC, AP, EV or GC), the following two characters correspond to thePCMs type (R3 or R5), and the last three characters represents the type of waterproofing solution (REF, SIK, WEB, MCB or CEP). For samples with no waterproofinglayer, the three letters ‘‘REF’’ stands for reference material. As an example, the ICLWA impregnated with R3 and waterproofed with the Sika product is termedIC_R3_SIK. Conversely, the corresponding impregnated LWA without waterproofingis termed IC_R3_REF.
Reference and waterproof-coated specimens were left at room temperature for7 days curing, prior to conducting the freeze/thawing tests. The freeze/thaw tem-perature range was selected to be between �7 �C and +16 �C. This range is slightlylarger than the range of temperatures that is recorded during Winter in Portugal,particularly in the mountain regions of Guarda [47].
To carry out the experiments, four sets of specimens were used. Each set con-tained five particles of different types of encased PCMs with and without water-proofing coating. At the start of each test, the initial weight of the specimens wasrecorded. Specimens were next exposed to 3 freeze/thaw cycles (1 cycle consistingof 0.25 h of freezing in air inside an automatic conventional freezer, followed by1.5 h of thawing in water). Each specimen was subsequently weighed at the conclu-sion of the third cycle, thus monitoring the process of desiccation.
A dimensionless parameter S has been introduced to evaluate the effect offreeze/thaw cycles on the percentage of mass loss, as follows (Eq. (1)):
S ¼ Dww0� 100% ð1Þ
where the Dw is increment of water content measured in the frozen/thawed com-posite after three cycles, and w0 is the water content in the unfrozen/unthawedcomposite.
To measure the ability of PCM to impregnate LWA, a drying test was adoptedaccording to Ref. [13]. In this test the specimens were first weighed and then placedin an oven at 40 �C, and repeatedly weighed with at least 24 h intervals betweenmeasurements for at least seven days thereafter. Since, the waterproofing materialsinclude water contents and will influence the correct measurement of the leakedPCM from LWAs, separate drying tests were performed on the waterproofing mate-rials themselves. The water content in each waterproofing material was determined
Fig. 3. (a) Density comparison between dried and water saturated LWA
by placing a few grams of waterproofing material in an oven and conducting a dry-ing test (following a similar test procedure as mentioned earlier for impregnated/encased LWAs). The average amount of PCM retained by the aggregate was consid-ered the impregnation capacity of the LWA in regard to the amount of the waterloss of waterproofing materials. Any residue remaining on the surface of the aggre-gates was only quantified with visual observations of whether the aggregateappeared wet or dry. Similar methodology has been attempted in terms of numberof specimens, consideration as freeze/thawing test.
3. Results and discussion
3.1. LWA testing results
Dry and water saturated LWAs particle density results, as wellas percentages masses of water absorption of LWAs, are presentedin Fig. 3. The saturated density difference between the four LWAs isrelated with the volume of existing voids that can be filled in withwater. As it can be seen from the results, the EV has the highest sat-urated particle density (see Fig. 3a), which means it can absorb thehighest amount of water in open pores when compared to theother LWAs studied in this work, as seen in Fig. 3b. The densityof saturated LWAs increased by 1.22, 1.64, 6.72 and 2.83 timeswhen compared with dry densities, for IC, GC, EV and AP respec-tively. This indicates that the amount of water penetrating theopen pores (water absorption) of LWAs are different, for example,the EV particles absorbed much more water than other LWA mate-rials and have higher open porosity.
It is important to note that the absorption characteristics of anaggregate can also depend on the aggregate size. Large lightweightaggregate have larger voids (like IC and GC). As a result, these largepores effectively become part of the texture of the aggregate, andthey are thus no longer considered as internal porosity in theaggregate [48]. Comparison between the studied LWAs revealsthat, smaller particles (like EV and AP) tend to have grater totalporosity simply because they have expanded to a greater extentthan a larger particle. Therefore, in the tested LAWs using differentsize particles it was observed that the absorption of the smalleraggregate particle sizes was higher than the absorption of largerparticles.
These results give adequate information regarding the pore vol-ume of the studied LWAs.
The pore size distributions of IC, GC, AP and EV, analyzedaccording to Section 2.3.1, are shown in Fig. 4. The figure presentsthe LWAs pore size distribution in terms of log differential intru-sion volume in dV/dlog(r), where V is the volume intruded intothe pores of the sample. The log differential intrusion volume is
s; (b) percentage of mass water absorption of the porous materials.

Fig. 4. Pore size distribution of IC, GC, AP and EV: (a) differential curves; (b) cumulative curves.
M. Kheradmand et al. / Construction and Building Materials 89 (2015) 48–59 53
the derivative of the intruded volume. The derivative plots showclearly identified points of inflection, which highlight zones whereclusters of pores of a particular radius occur. Fig. 4b, depicts therelative distribution of each LWA in terms of the cumulativeintruded pore volume to the weight of the sample.
As shown in Fig. 4a, EV LWAs have more volume of pores perunit weight when compared with the other LWA materials. Thestrong peak indicated that most pores have approximately2.1 lm radius, for the EV. On the other hand, IC, GC and AP haveless volume of pores, having approximately 1.9 lm of radius.According to the International Union of Pure and AppliedChemistry (IUPAC) pore-size classification [49], which classifiespores into macro, meso and micropores, the pores of the IC andEV LWAs are mesopores, as they are larger than 2 lm.Furthermore, GC and AP LWAs have micropores since sizes arelower than 2 lm.
The total specific surface areas per unit mass values were 0.321(m2/g), 0.188 (m2/g), 5.817(m2/g) and 0.437(m2/g) for IC, GC, EVand AP, respectively. The EV has much larger total specific surfacearea than other LWAs. The results of pore size analysis are coherentwith previous information regarding the capacity to absorb water,which indirectly indicated the porosities (see Fig. 3). Consequently,the pore structure plays an important factor in the absorptioncapacity of the LWAs. The LWAs with greater pore volumes and lar-ger pore radiuses are bound to be capable of absorbing higherwater or paraffin content. Nevertheless, it should be noted that,the viscosity of paraffin and water are slightly different, and alsothat the corresponding surface tension properties and henceimpregnation potential can also be different.
3.2. PCM absorption in LWAs
The results of absorption amounts of both R3 and R5 PCMs intothe four different LWAs are presented in Fig. 5. Comparing theseresults to the water saturated density test results (Fig. 3), the datashows that the PCMs (R3 or R5) absorption is not reaching themaximum possible absorption of water.
It is interesting to highlight the quantitative differencesbetween the capacity of absorption of water and PCM into LWAs.For instance, IC, EV and AP displayed water absorption valueshigher by 21%, 55% and 52% (wt.%) respectively compared to thecases with R3 absorption. In the case of GC the water absorption(wt.%) was about 7% less than that obtained with R3. However, itshould be noted that, there is a slight difference in PCM absorption(wt.%) between LWAs types GC, EV and AP absorbed 5%, 10% and23% more R4 respectively than the absorption values for R3.
These differences in absorption volume may be attributed to thedifferences in PCMs specific gravity, viscosity, and liquid surfacetension.
It can be clearly observed that the absorption amounts with dif-ferent LWAs follow the same trend. The absorption amounts for ICwas generally lower than that for the GC, EV and AP, possibly dueto the more homogenous (narrow particle size distribution of theIC particles). For the EV mixes with PCMs types R3 and R5, theincrements were about 290 wt.% and 240 wt.% respectively. In fact,the EV particles contain both types of meso and micropores whencompared to the other three kinds of LWAs. However, the impreg-nate of liquid part into the pore space of LWAs with smaller diam-eter becomes more difficult than those with larger diameter.Therefore, the adopted impregnation method may be more appro-priate to porous materials that encompass both micro and mesopores.
Overall, the results showed that the total amount of PCMabsorbed in each LWA is very high. It is interesting to have a com-parison between the global quantities of PCMs that can be intro-duced into the mix by impregnation technique and the classicalway of incorporating commercially microencapsulated PCM.
Consider the case of a cement based mortar incorporating withcommercial microencapsulated PCM that was formulated by theauthors [42]. This mortar, referred to as SPCMM24 contained293 kg of microencapsulated PCM per cubic meter, whereas, theimpregnation technique used in this investigation allows for upto a maximum PCM content of about 213 kg/m3 when using theEV aggregate. This is not a significantly lower PCM content, andis therefore, not necessarily a problem as it is approximately withinthe same order of magnitude, but at a fraction of the cost of themicroencapsulated PCM. With respect to LWA types IC, GC andAP, the impregnation technique used in this investigation allowsfor a maximum PCM content of about 49 kg/m3, 109 kg/m3, and171 kg/m3 respectively.
3.3. PCM testing results
3.3.1. General remarksIn order to quantify the thermal energy storage capacity of the
PCMs, differential scanning calorimetry (DSC) was deployed. Inview of the acknowledged dependency of DSC results on the heat-ing/cooling rates [50,51], the assessment of the influence of heat-ing/cooling rates on the DSC thermograms as well as specificenthalpy calculation has been analyzed and separated into twomain sections: (1) effect of the heating/cooling rates; (2) specificenthalpy analysis.

Fig. 5. Absorption amount for the studied PCMs impregnated into the LWAs: (a) PCM with melting temperature of 3 �C with corresponding LWAs; (b) PCM with meltingtemperature of 5 �C with corresponding LWAs.
Fig. 6. DSC thermograms for R3 specimen with different heating/cooling rates: (a) heating process at several rates; (b) cooling process at several rates.
Fig. 7. DSC thermograms for R5 specimen with different heating/cooling rates: (a) heating process at several rates; (b) cooling process at several rates.
54 M. Kheradmand et al. / Construction and Building Materials 89 (2015) 48–59
3.3.2. Effect of the heating/cooling ratesThe experimental curves for R3 at different heating/cooling
rates are shown in Fig. 6. The peak temperatures in the thermo-grams of the heating process (Fig. 6a) are consistently beingincreased as the heating rate increases. Conversely, in the case ofcooling (Fig. 6b), the peak temperatures decreases with increased
cooling rates. Overall, it was observed that the PCM peak responseshifts in the direction of the imposed flux; i.e. higher peaks forheating and lower peak temperatures for cooling. This type ofbehavior has been reported in earlier investigations [52] and[53], and it can be explained by an increasing thermal gradient inthe sample.
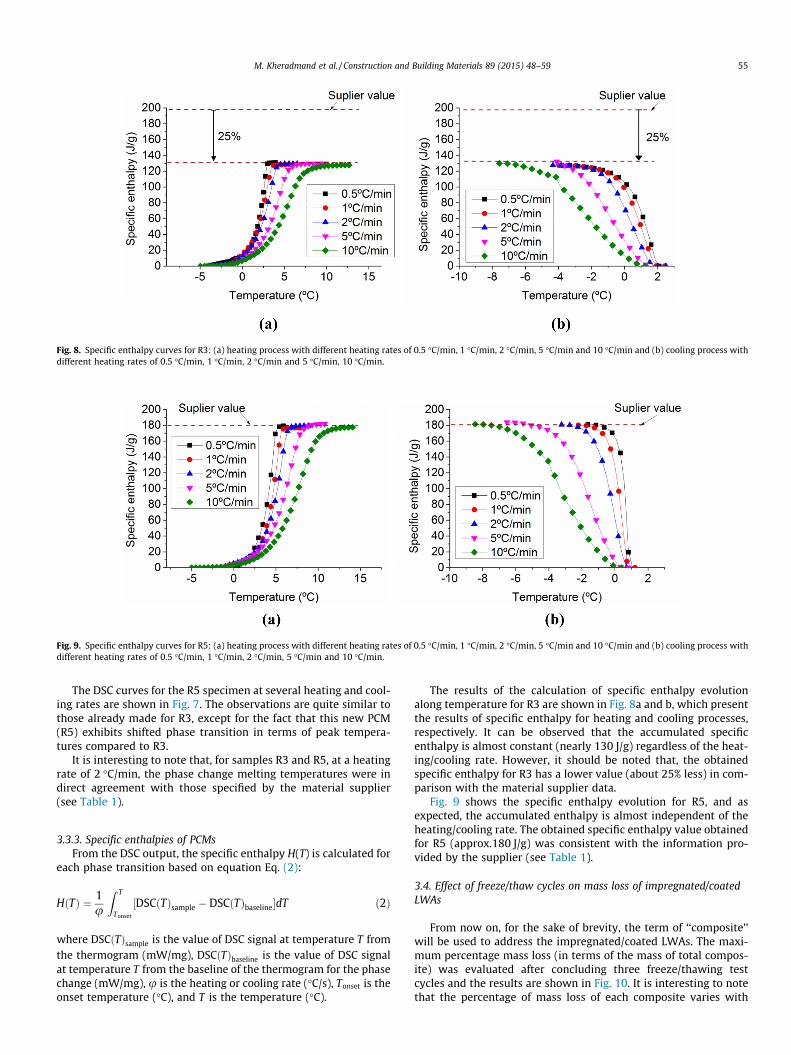
Fig. 8. Specific enthalpy curves for R3: (a) heating process with different heating rates of 0.5 �C/min, 1 �C/min, 2 �C/min, 5 �C/min and 10 �C/min and (b) cooling process withdifferent heating rates of 0.5 �C/min, 1 �C/min, 2 �C/min and 5 �C/min, 10 �C/min.
Fig. 9. Specific enthalpy curves for R5: (a) heating process with different heating rates of 0.5 �C/min, 1 �C/min, 2 �C/min, 5 �C/min and 10 �C/min and (b) cooling process withdifferent heating rates of 0.5 �C/min, 1 �C/min, 2 �C/min, 5 �C/min and 10 �C/min.
M. Kheradmand et al. / Construction and Building Materials 89 (2015) 48–59 55
The DSC curves for the R5 specimen at several heating and cool-ing rates are shown in Fig. 7. The observations are quite similar tothose already made for R3, except for the fact that this new PCM(R5) exhibits shifted phase transition in terms of peak tempera-tures compared to R3.
It is interesting to note that, for samples R3 and R5, at a heatingrate of 2 �C/min, the phase change melting temperatures were indirect agreement with those specified by the material supplier(see Table 1).
3.3.3. Specific enthalpies of PCMsFrom the DSC output, the specific enthalpy H(T) is calculated for
each phase transition based on equation Eq. (2):
HðTÞ ¼ 1u
Z T
Tonset
½DSCðTÞsample � DSCðTÞbaseline�dT ð2Þ
where DSCðTÞsample is the value of DSC signal at temperature T fromthe thermogram (mW/mg), DSCðTÞbaseline is the value of DSC signalat temperature T from the baseline of the thermogram for the phasechange (mW/mg), u is the heating or cooling rate (�C/s), Tonset is theonset temperature (�C), and T is the temperature (�C).
The results of the calculation of specific enthalpy evolutionalong temperature for R3 are shown in Fig. 8a and b, which presentthe results of specific enthalpy for heating and cooling processes,respectively. It can be observed that the accumulated specificenthalpy is almost constant (nearly 130 J/g) regardless of the heat-ing/cooling rate. However, it should be noted that, the obtainedspecific enthalpy for R3 has a lower value (about 25% less) in com-parison with the material supplier data.
Fig. 9 shows the specific enthalpy evolution for R5, and asexpected, the accumulated enthalpy is almost independent of theheating/cooling rate. The obtained specific enthalpy value obtainedfor R5 (approx.180 J/g) was consistent with the information pro-vided by the supplier (see Table 1).
3.4. Effect of freeze/thaw cycles on mass loss of impregnated/coatedLWAs
From now on, for the sake of brevity, the term of ‘‘composite’’will be used to address the impregnated/coated LWAs. The maxi-mum percentage mass loss (in terms of the mass of total compos-ite) was evaluated after concluding three freeze/thawing testcycles and the results are shown in Fig. 10. It is interesting to notethat the percentage of mass loss of each composite varies with

Fig. 10. Ratio of specimen’s desiccation after three cycles of freeze–thaw test for the composites with: (a) IC substance; (b) EV substance; (c) GC substance; and (d) APsubstance.
Fig. 11. SEM micrograph of the IC particle embedded in cement-based hardenedmortar showing waterproofing bound thickness variation.
56 M. Kheradmand et al. / Construction and Building Materials 89 (2015) 48–59
different waterproofing material. This can be explained by the factthat, the water proofing material loses weight during the freezethawing process and its thickness is not homogeneous in each par-ticle and LWA. Thus, the non-homogeneity of waterproofing thick-ness is most responsible for the mass losses discrepancies foundfor each different composite.
In order to illustrate the non-homogeneity of the thickness ofwaterproofing coating a scanning electron microscopy (SEM) studywas carried on IC particles. The IC particles were mixed with acement-based mortar, and cured for 28 days. A specimen of hard-ened mortar composite was then embedded in resin and surfacepolished for the microscopy study. The general view of themicrostructure of the specimen is presented in Fig. 11, whichshows a cross section of IC particles surrounded by waterproofcoating. It is evident that the thickness of the waterproofing coat-ing layer around the IC particles is not uniform.
In terms of waterproofing type effect on mass loss of the com-posites, a significant reduction can be observed in all compositeswith all four different waterproofing solutions. Taking into accountweight loss of the different composites with different PCMs, thesmallest value was recorded for the cases of composites with R5(about 0.7%, 1.5%, 0.5% and 1% by mass for the composites withIC, EV, GC and AP, respectively). In contrast, the composites withR3 exhibited a greater drop in mass of about 1%, 2.5%, 2% and 2%for IC, EV, GC and AP, respectively.
At this stage, the results revealed that, the influence of the por-ous lightweight aggregate on the development of physical propertyvalues has dependency on the waterproofing type.
The water loss percentage of the waterproofing itself wasdetermined, and then it was subtracted from corresponding totalweight loss of each composite. The results of drying test on the

Fig. 12. Ratio of specimen’s desiccation after the drying test with drying temperatures of 40 �C for composites with: (a) IC substance; (b) EV substance; (c) GC substance; and(d) EP substance.
M. Kheradmand et al. / Construction and Building Materials 89 (2015) 48–59 57
waterproofing materials showed that the waterproofing materialcan lose water by 65, 50, 58, 55 percentage weight loss for theWEB, MCB, CEB and SIK, respectively.
The increase or decrease of the PCM absorption amount dependson the porous aggregates and PCM type. It can be stated that thepercentage mass drop for the impregnated/coated LWAs with EVis related to the pore structure size (Fig. 4) of particles as well astheir absorption capacity (Fig. 5). Additionally, it should beremarked that the weight losses of composites with respect to theleaked PCM after freeze/thaw cycles are less than 0.5% for differentcoating solutions (except in the cases with SIK waterproofing withslightly higher leaked PCM), which indicates that such coating/en-casing materials minimizes the potential for leakage of the PCM.It should be stressed that, visual observation of the composites aftertesting confirmed that no leakage of the PCM was evident.
3.5. Effect of oven drying test on weight drop percentage of composites
The percentage weight loss of composites dried at 40 �C tem-perature was calculated with the same formula explained in theprevious section. The weight drop values in percentage by masswere calculated for three different drying temperatures and theresults for each composite are shown in Fig. 12.
Generally speaking, it can be observed in Fig. 12, that the leakedPCM percentage of mass loss in all the composites with water-proofing was less than 1% when composites are subjected to the
drying temperature of 40 �C. Considering, when mass loss is lessthan 1%, the potential for leakage of the PCM is minimum. Visualobservation of the composites after testing confirmed that no leak-age of the PCM occurred.
4. Conclusions
This paper assesses the thermal and physical aspects of light-weight aggregates (LWAs) incorporating phase change materials(PCMs), with the objective of improving freeze/thaw resistance ofthe studied composites, at material level. The study presentsresults from two different impregnated/encased PCMs in severalLWA composites, namely: (i) a series containing paraffin PCM withmelting temperature of 3 �C (R3); (ii) a series containing paraffinPCM with melting temperature of 5 �C (R5). These compositesmay prove advantageous for improving thermal resistance in pave-ments (reducing freeze/thaw cycles), and their feasibility at mate-rial/thermal/physical level was evaluated in this work.Experimental results, comprising a detailed analysis of the LWAs(particle density, absorption capacity of water and waterproofingmaterial), as well as the performance of coated/impregnatedLWAs under freeze/thaw cycles and exposure to high temperatureare presented in this paper.
From the observation of particle density analysis, it was con-cluded that, expanded vermiculite (EV) has the greatest variation

58 M. Kheradmand et al. / Construction and Building Materials 89 (2015) 48–59
between the dry and saturated states among other types of LWAs.EV’s pore structure analysis also revealed it has a highly porousmatrix suitable for PCM impregnation when compared with othertypes of studied LWAs.
The observations of DSC thermograms pertaining to a consecu-tive heating load of testing on each PCM suggest that maximumspecific enthalpy result was achieved for the R5. Therefore, R5 withspecific enthalpy value nearly 180 (J/g) has better potential of ther-mal energy storage than the other type of studied PCM (R3).Furthermore, it was found that tests with higher heating/coolingrates intensify the differences between the thermograms of theheating and cooling processes, both in terms of the peak tempera-tures and the overall shape of the curve. However, the calculatedspecific enthalpy for each phase transition seems to be indepen-dent of the heating/cooling rate.
From SEM analysis of the composite mortar it was concludedthat, the IC particles were well coated with waterproofing material.The SEM investigation also revealed non-homogeneity of thewaterproofing’s thickness around the IC particles.
The influence of different waterproofing solutions on the weightloss of the composites under freeze/thaw cycles was analyzed,namely in terms of the weight drop percentage by mass as wellas the amount of leaked PCM from the studied composites.Weight loss was found to be dependent on the used type of water-proofing materials. Since the waterproofing has potential of losingwater content, thus, the issue related to the higher mass loss in thecomposites can be justified by the fact that, these composites arewith thicker layer of waterproofing. Nevertheless, the amount ofleaked PCM from different composites under freeze/thaw cycleswere only up to 0.5%, which indicated the fact of minimizes leak-age of PCM from LWAs. Furthermore, visual observation confirmedthat no leakage of the PCM occurred.
The observations from drying tests of the composites were alsoanalogous to those already made for freeze/thaw test, confirmingthat, as expected, variation of weight loss percentages of the com-posites with and without waterproofing. However, an added anal-ysis was made in regard to the waterproofing propertiescorresponding to the minimized PCM leakage. The influence of dry-ing test has confirmed that, the waterproofing keeps its propertieswhen drying temperature is 40 �C. However, there is a slightlyhigher weight drop percentage mass occurred when comparedwith the results from the freeze/thawing test.
It is finally remarked that the use of PCMs incorporated/encasedin LWAs revealed adequate thermal behavior, as desirable outcometo reduce the freeze/thaw cycles effects under real climate condi-tions in pavement applications. Thus, this investigation carriedout at material level confirms the feasibility of the proposedmethod for PCMs incorporation/encasement in LWAs.Furthermore, this methodology can be extended to building appli-cations to increase thermal comfort. It may bring economic bene-fits due to the fact that some LWAs has the potential of highPCM absorption when compared with commercially availablemicroencapsulated PCM products.
Acknowledgments
The authors acknowledge the funding given by Centre forCoordination and Regional Development Committee (CCDR-C)through the research project CENTRO-07-ST24_FEDER-002020‘‘Environmentally-Friendly Aeronautical Transport SystemsIntegrated Program (EFATRAS)’’, http://efatrasubi.wordpress.com.Supply of Expanded Clay materials by ARGEX – Argila Expandida,S.A and Cork materials by Sofalca – Sociedade Central deProductos de Cortiça, Lda are also acknowledged.
References
[1] Cabeza L, Castell A, Barreneche C, de Gracia A, Fernández A. Materials used asPCM in thermal energy storage in buildings: a review. Renew Sustain EnergyRev 2011;15(3):1675–95.
[2] Soares N, Costa JJ, Gaspar AR, Santos P. Review of passive PCM latent heatthermal energy storage systems towards buildings’ energy efficiency. EnergyBuild 2013;59:82–103.
[3] Zhao CY, Zhang GH. Review on microencapsulated phase change materials(MEPCMs): fabrication, characterization and applications. Renew SustainEnergy Rev 2011;15(8):3813–32.
[4] Baetens A, Petter JB, Gustavsen A. Phase change materials for buildingapplications: a state-of-the-art review. Energy Build 2010;42(9):1361–8.
[5] Waqas A, Zia UD. Phase change material (PCM) storage for free cooling ofbuildings—a review. Renew Sustain Energy Rev 2013;18:607–25.
[6] Vaz Sá A, Azenha M, de Sousa H, Samagaio A. Thermal enhancement ofplastering mortars with phase change materials: experimental and numericalapproach. Energy Build 2012;49:16–27.
[7] Kheradmand M, Aguiar JL, Azenha M. Estimation of the specific enthalpy-temperature functions for plastering mortars containing hybrid mixes of phasechange materials. Int J Energy Environ Eng 2014;81(5).
[8] Silva T, Vicente R, Soares N, Ferreira V. Experimental testing and numericalmodelling of masonry wall solution with PCM incorporation: a passiveconstruction solution. Energy Build 2012;49:235–45.
[9] Zhang YP, Lin KP, Yang R, Di HF, Jiang Y. Preparation, thermal performance andapplication of shape-stabilized PCM in energy efficient buildings. Energy Build2006;38(10):1262–9.
[10] Ling T-C, Poon C-S. Use of phase change materials for thermal energy storagein concrete: an overview. Constr Build Mater 2013;46:55–62.
[11] Ma B, Adhikari S, Chang Y, Ren J, Liu J, You Z. Preparation of composite shape-stabilized phase change materials for highway pavements. Constr Build Mater2013;42:114–21.
[12] Gowreesunker BL, Tassou SA. Effectiveness of CFD simulation for theperformance prediction of phase change building boards in the thermalenvironment control of indoor spaces. Build Environ 2013;59:612–25.
[13] Sakulich AR, Bentz DP. Incorporation of phase change materials incementitious systems via fine lightweight aggregate. Constr Build Mater2012;35:483–90.
[14] Sakulich A, Bentz D. Increasing the service life of bridge decks by incorporatingphase-change materials to reduce freeze–thaw cycles. J Mater Civ Eng2012;24(8):1034–42.
[15] Nepomuceno MCS, Silva PD. Experimental evaluation of cement mortars withphase change material incorporated via lightweight expanded clay aggregate.Constr Build Mater 2014;63:89–96.
[16] Zhang Z, Shi G, Wang S, Fang X, Liu X. Thermal energy storage cement mortarcontaining n-octadecane/expanded graphite composite phase changematerial. Renew Energy 2013;50:670–5.
[17] Xu B, Li Z. Paraffin/diatomite composite phase change material incorporatedcement-based composite for thermal energy storage. Appl Energy2013;105:229–37.
[18] Li X, Sanjayan JG, Wilson JL. Fabrication and stability of form-stablediatomite/paraffin phase change material composites. Energy Build2014;76:284–94.
[19] Mehrali M, Tahan Latibari S, Mehrali M, Mahlia TMI, Cornelis Metselaar HS.Effect of carbon nanospheres on shape stabilization and thermal behavior ofphase change materials for thermal energy storage. Energy Convers Manage2014;88:206–13.
[20] Qi G-Q, Liang C-L, Bao R-Y, Liu Z-Y, Yang W, Xie B-H, et al. Polyethylene glycolbased shape-stabilized phase change material for thermal energy storage withultra-low content of graphene oxide. Sol Energy Mater Sol Cells2014;123:171–7.
[21] Trigui A, Karkri M, Krupa I. Thermal conductivity and latent heat thermalenergy storage properties of LDPE/wax as a shape-stabilized composite phasechange material. Energy Convers Manage 2014;77:586–96.
[22] Li H, Chen H, Li X, Sanjayan JG. Development of thermal energy storagecomposites and prevention of PCM leakage. Appl Energy 2014;135:225–33.
[23] He Y, Zhang X, Zhang Y. Preparation technology of phase change perlite andperformance research of phase change and temperature control mortar.Energy Build 2014;85:506–14.
[24] Sarı A, Karaipekli A. Preparation, thermal properties and thermal reliability ofcapric acid/expanded perlite composite for thermal energy storage. MaterChem Phys 2008;109(2–3):459–64.
[25] RUBITHERM GmbH, Technologies GmbH thermal challenges with PCM-Technology, Germany; 2013.
[26] Zhang D, Zhou J, Wu K, Li Z. Granular phase changing composites for thermalenergy storage. Sol Energy 2005;78(3):471–80.
[27] Pires L, Silva PD, Castro Gomes JP. Experimental study of an innovativeelement for passive cooling of buildings. Sustain Energy Technol Assessments2013;4:29–35.
[28] ARGEX – Argila Expandida, S.A., National structural ceramics, Technical sheetfor ARGILA EXPANDIDA, Portugal; 2013.
[29] GALO BRANCO – Produções and Construções Ecológicas LDA, Edisol Group,Agglomerates of expanded cork products, Portugal; 2014.
[30] The URBICULT Unipessoal Co. – Vermiculite/Perlite products, Portugal; 2012.
M. Kheradmand et al. / Construction and Building Materials 89 (2015) 48–59 59
[31] Karaipekli A, Sarı A. Capric–myristic acid/vermiculite composite as form-stablephase change material for thermal energy storage. Sol Energy 2009;83(3):323–32.
[32] Lu Z, Xu B, Zhang J, Zhu Y, Sun G, Li Z. Preparation and characterization ofexpanded perlite/paraffin composite as form-stable phase change material. SolEnergy 2014;108:460–6.
[33] Nóvoa PJRO, Ribeiro MCS, Ferreira AJM, Marques AT. Mechanicalcharacterization of lightweight polymer mortar modified with corkgranulates. Compos Sci Technol 2004;64(13–14):2197–205.
[34] CSN EN 933–1:2012, Tests for geometrical properties of aggregates – Part 1:determination of particle size distribution – Sieving method; 2012.
[35] SIKA Group. – Technical sheet for Sikalastic -490T, Version No. 1, Portugal;2012.
[36] Weber SAINT-GOBAIN – Leading industrial mortar manufacturer, Technicalsheet for Weber Dry Lastic, Portugal; 2009.
[37] MC-Bauchemie – Building chemical products, Technical data sheet for Makote3, Portugal; 2013.
[38] CEPSA (Compañía Española de Petróleos, S.A.U.) – Waterproofing andsoundproofing products, Technical sheet for ECM-2 (C67BF4), Version No. 5,Portugal; 2010.
[39] NP EN 1097–6:2013, Tests for mechanical and physical properties of aggregates– Part 6: determination of particle density and water absorption; 2013.
[40] User manual NOVA WIN. Quantachrome Instruments, Nova Series Windows-based operating and data 2008.
[41] Castellon C, Gunther E, Mehling H. Determination of the enthalpy of PCM as afunction of temperature using a heat-flux DSC, a study of differentmeasurement procedures and their accuracy. J Energy Res 2008;32:1258–65.
[42] Kheradmand M, Azenha M, De Aguiar JLB, Krakowiak KJ. Thermal behavior ofcement based plastering mortar containing hybrid microencapsulated phasechange materials. Energy Build 2014;84:526–36.
[43] Biwan Xu, Li Zongjin. Paraffin/diatomite composite phase change materialincorporated cement-based composites for thermal energy storage. ApplEnergy 2013;105:229–37.
[44] Melhing H, Cabeza LF. In: Dieter Mewes, editor. Heat and cold storage withPCM, an up to date introduction into basics and applications. Berlin,Germany: Springer; 2008.
[45] Denner T. NETZSCH Proteus – thermal analysis – release 6.0.0, GerätebauGmbH Wittelsbacherstraße 42; 2012.
[46] EN ISO 11357-1. Plastics – differential scanning calorimetry (DSC) part 1:general principles. Berlin: DIN Deutsches Institut für Normung e.V.; 1997.
[47] The World Weather Online, Global weather forecast and weather content forwebsites, businesses and the travel industry, <http://www.worldweatheronline.com/>. Retrieved 2014.
[48] Castro J, Keiser L, Golias M, Weiss J. Absorption and desorption properties offine lightweight aggregate for application to internally cured concretemixtures. Cement Concr Compos 2011;33(10):1001–8.
[49] Collins F, Sanjayan JG. Effect of pore size distribution on drying shrinking ofalkali-activated slag concrete. Cem Concr Res 2000;30(9):1401–6.
[50] Jin X, Xu X, Zhang X, Yin Y. Determination of the PCM melting temperaturerange using DSC. Thermochim Acta 2014;595:17–21.
[51] Dumas J-P, Gibout S, Zalewski L, Johannes K, Franquet E, Lassue S, et al.Interpretation of calorimetry experiments to characterise phase changematerials. Int J Therm Sci 2014;78:48–55.
[52] Kousksou T, Jamil A, Zeraouli Y. Enthalpy and apparent specific heat capacityof the binary solution during the melting process: DSC modelling. ThermochimActa 2012;41:31–41.
[53] Kousksou T, Rhafiki T, Jamil A, Bruel P, Zeraouli Y. PCMs inside emulsions:some specific aspects related to DSC (differential scanning calorimeter)-likeconfigurations. Energy 2013;56:175–83.