assessment and analysis of the floodplain of cagayan de
TRANSCRIPT

Mindanao Journal of Science and Technology Vol.12 (2014) 147-170
Assessment and Analysis of the Floodplain of
Cagayan De Oro River Basin
Kelvin Mabao
1 and Ruth G. Cabahug
2*
1Water Resources Engineering and Management
University of Stuttgart
Stuttgart, Germany 2College of Engineering and Architecture
Mindanao University of Science and Technology
Cagayan de Oro City, 9000 Philippines
Date received: March 24, 2014
Revision accepted: July 23, 2014
___________________________________________
Abstract
A technical approach using 1-dimensional steady flow model, GIS and remote
sensing were used to analyze the Cagayan de Oro River Basin with a catchment area
of 1400 sq. km., located in the northern central part of the island of Mindanao.
Precipitation frequency analysis was done for Cagayan de Oro Rainfall Station, the
only station with historical records starting from the year 1950. Probable point
rainfall for the said station was used in the frequency analysis for 2, 5, 10, 25, 50,
and 100 years return period storms. Results from precipitation frequency analysis
were then used to construct the Rainfall-Intensity-Duration-Frequency (RIDF)
Curves. Design precipitation hyetograph with their respective return periods were
established using the alternating block method. A hydrologic model was built in
HEC-HMS using ArcGIS and HEC GeoHMS. Physical attributes of the watershed
were extracted using the above-mentioned tools and then exported to the HEC-HMS
model. Using the design storms calculated during the precipitation analysis, the HMS
model yields peak flows for different return periods. The hydraulic model was
established in the river section starting from the river delta up to 9 kilometers
upstream. In ArcGIS, river geometry was extracted from Triangulated Irregular
Network (TIN) derived from Digital Elevation Model and ground survey. The river
geometry was then exported to HEC-RAS for hydraulic analysis. Water levels
computed in the hydraulic analysis were then exported back to ArcGIS for inundation
mapping. The flood inundation results show that the city of Cagayan de Oro is
extremely exposed to flood hazards. It is observed that the channel capacity is only
capable of handling 2-year and 5-year storms without flooding portions of the city.
Keywords: Floodplain analysis, flood inundation, hydrologic model, flood hazards,
GIS, remote sensing, river basin
K. Mabao & R. G. Cabahug / Mindanao Journal of Science and Technology Vol. 12 (2014) 147-170
148
1. Introduction
Rivers and river systems played a key role in the emergence of the world’s
ancient civilization such as ancient China, Mesopotamia and ancient Egypt.
These early river-based civilizations were largely concentrated around large
rivers because in those regions, opportunities for gathering and hunting for
food were declining. These people depended primarily on farming and
husbandry as the source of their food. This was only made possible because
of river flooding. The Greek historian Herodotus wrote that “Egypt was the
gift of Nile”. It is because of the annual flooding which provides a fertile
land. The Yellow River is also called “the cradle of Chinese civilization”
because it was the birthplace of the ancient Chinese civilization and at the
same time called “China’s Sorrow” due to its frequent devastating floods.
River flooding magnifies the agricultural advantages and at the same time
poses risks of property damage and deaths. Nowadays, flooding is a major
natural hazard which every year affects different regions all over the world.
Among the various types of natural hazards, floods have affected the largest
number of people worldwide, averaging 99 million people per year between
2000 and 2008 (WDR, 2010). In Asia, countries such as India, Bangladesh,
China, Thailand, Viet Nam and the Philippines are extremely vulnerable to
flooding (WWAP, 2012).
The Philippines is among the countries which are relatively vulnerable to
disaster risks. Situated in the western Pacific Ocean, this archipelago
comprising of 7,107 islands covers almost three hundred thousand square
kilometers. It is bounded by bodies of water, the Pacific Ocean on the east
and West Philippine Sea on the west and situated along the Pacific Ring of
Fire. The geographic location and its geologic characteristics make the
Philippines prone to natural hazards such as earthquakes and typhoons. On
average, the Philippines is hit by 15 astride typhoon belt and five to six
cyclonic storms each year, most of which hit Luzon and Visayas regions.
Aside from this hydrological condition, rapid and unplanned urbanization,
man-made obstructions in the flood path, such as wires, bridge piers, floating
debris, and dam breaks cause serious flooding. The problem of flood hazard
is particularly eminent in cities near the river deltas which are lying only up
to a few meters above sea level.
Cagayan de Oro is located along the central coast of Mindanao and the
capital city of the Province of Misamis Oriental. Serving as a regional center
for Northern Mindanao, the city has an estimated population of more than

K. Mabao & R. G. Cabahug / Mindanao Journal of Science and Technology Vol. 12 (2014) 147-170
149
622,000 as of 2011. In the heart of the city traverses Cagayan River or often
called as Cagayan de Oro River. It is one of the major rivers in Mindanao
having its headwaters in Kalatungan Mountain Range in the central Province
of Bukidnon, then picking up tributaries along the way as it traverses the
Municipalities of Talakag, Baungon, Libona and finally emptying into the
Macajalar Bay at Cagayan de Oro. This catchment of having an area of more
or less 1400 km² can discharge huge amount of water during a heavy
downpour. The flat slope and swallowing of the channel as it approaches the
delta poses risk of flooding to the densely populated riverside of Cagayan de
Oro city. In the last five years, the city suffered heavy losses due to flooding.
Therefore, consideration of appropriate mitigation measure is imperative.
Mindanao, the second biggest Island, has only an average of one tropical
cyclone per year based on statistics from 1883-1990. However, Mindanao
was hit with seven tropical cyclones in the last fifteen years. In 2011,
Tropical Storm Sendong (International name: WASHI) hit the island of
Mindanao. Cagayan de Oro city and other neighboring municipalities were
among which suffered the hardest hit. The tropical storm Sendong in
December 2011 exposed the city’s vulnerability to flooding. According to
Lumbia’s PAGASA, the weather station, which is situated few kilometers
from the city center recorded 180.9 mm one-day rainfall which exceeds the
monthly average of only 117 mm. With this heavy downpour in a short
period of time Cagayan de Oro River watershed discharges almost 2,500
m3/s at water level 9.86m which is 60 times more than the normal water of
2.0m. Coupled with high tide and high velocity, this high volume of water
resulted in flash floods in the city. Aside from this hydrological condition,
unplanned urbanization of the city also contributed to the flooding problem.
The rapid population growth due to migration resulted in informal
settlements along the riverbanks and floodplains. The presence of this
unplanned settlement which is only made up of light materials and sub-
standard construction makes the fatalities higher. Urbanization generally
increases the size and frequency of floods and may expose communities to
increasing flood hazards (USGS, 2003). This tropical storm left 1,206 dead,
6,036 injured, 162 missing and an estimated damage of PhP 12,086,284,000
(Philippine Peso, 2011) for all sectors (PDNA, 2012).
This tragic experience prompts urgent need to investigate and analyze the
flooding problem and provide effective structural and non-structural
countermeasures. This study used Hydrologic Engineering Center (HEC)
tools to achieve the research objectives. Hydrologic Engineering Center –

K. Mabao & R. G. Cabahug / Mindanao Journal of Science and Technology Vol. 12 (2014) 147-170
150
Hydrologic Modeling System (HEC-HMS) together with ArcGIS Advanced
and HEC-GeoHMS are used to build the hydrologic model. Hydraulic
analysis is done using the Hydrologic Engineering Center –Hydrologic
Modeling System (HEC-RAS), a one dimensional model. This study used
the above mentioned tools to investigate flooding potential of Cagayan de
Oro City as a result of extreme rainfall events, as well as to evaluate the
potential non-structural mitigation options. The specific objectives include a)
assessment of flood frequency for the assessment of flooding potential of
Cagayan de Oro City; b) build hydrologic model for the Cagayan de Oro
River Basin; c) analyze the floodplain using steady flow one-dimensional
model; and d) create flood inundation map.Figure 1 shows the location map
of the study area.
Figure 1. Location map of the study area

K. Mabao & R. G. Cabahug / Mindanao Journal of Science and Technology Vol. 12 (2014) 147-170
151
2. Methodology
Frequency analysis of precipitation data is essentially important to river
hydrology. It is a consistent, statistical method for denoting the probability
of occurrence of rainfall at a specific point in a catchment area USACE,
(1993). The frequency distribution of the precipitation data was determined
using analytical techniques. Theoretical distributions such as Log-Pearson
Type III, Normal, Log Normal, and Extreme Value (Gumbel) distribution
were used to evaluate the distribution functions at various points of interests.
In this study, two models were generated, namely; a hydrologic model and
hydraulic model. The automated basin processing and hydrologic model
building used ArcGIS (Environmental Systems Research Institute, 1990)
and HEC-HMS. The HEC-HMS requires three primary input parameters:
precipitation loss method, transform method and routing method (HEC,
2010a & e).There are several methods available in HMS to determine
precipitation loss for overland flow that accounts for infiltration losses.
These includes the Initial and Constant, Deficit and Constant, Exponential,
SCS Curve Number, Green-Ampt, Smith Parlange and Soil Moisture
Accounting. The second main input process parameter, Transform Method,
simulates the process of direct runoff of excess precipitation on a watershed.
There are two available options available in HEC-HMS. These are the
empirical models (theoretical models) and conceptual models. Once excess
precipitation has been transformed into overland flow and routed to the
outlet of the sub-watershed, it enters the stream and its added to the flow
routed from the upstream. There are several routing methods available in
HEC-HMS including the Kinematic Wave, Lag, Modified Puls, Muskingum,
and Straddle Stagger. In this study, the Muskingum-Cunge method or model
was selected because observed data were not available. This model is
physically-based routing and it is easier to set-up and apply with some
confidence compared to other empirical models.
On the other hand, the automated floodplain analysis used ArcGIS and HEC-
RAS.The methods used for floodplain analysis consisted of the following
steps:
Preparation of Triangular Irregular Networks (TIN) in ArcGIS for
Desktop Basic
Developing the RAS GIS Import File using HEC-GeoRAS
Running HEC-RAS
K. Mabao & R. G. Cabahug / Mindanao Journal of Science and Technology Vol. 12 (2014) 147-170
152
Post-processing of HEC-RAS results in HEC-GeoRAS for
floodplain analysis
The approach for floodplain analysis used one-dimensional model using
HEC-GeoRAS, ArcGIS, and HEC-RAS.
2.1 GeoRAS Preprocessing
2.1.1 River Digitization
The procedure for extracting geometric data in HEC-GeoRAS (HEC, 2010f)
is as follows:
Add the TIN dataset then in RAS Geometry tab in the GeoRAS
toolbar select Layer Setup and under Required Surface select the
TIN dataset
Create empty GIS layers for the Stream Centerline, Flow Path
Centerlines, Bank lines and XS Cut Lines.
In the editor mode, manually digitize the centerline of the river
from upstream to the downstream using Sketch Tool. Geo-
referenced Landsat images are helpful guides to pinpoint the path of
a stream.
In the RAS Geometry tab, select Stream Centerline Attributes
commands to populate the missing field of the new layer.
Similarly in the editor mode using the sketch tool, manually digitize
the Flow Path Centerlines, Bank Lines and XS Cut Lines(see Fig.
2).
Complete their attributes commands in the RAS Geometry tab to
populate the missing fields of the new layers.
Bank Lines defines the main channel flow from flow in the
overbanks. Flowpath center lines are used to identify the hydraulic
flow path in the left overbank, main channel and right overbank.
Manning’s n values can be assigned to cross-sections using land use
data along with Manning’s n value for different land use types. This
is not a compulsory step as it can also be performed manually in
HEC-RAS.
Select Export RAS Data in RAS Geometry tab to create the GIS
Import File for HEC-RAS

K. Mabao & R. G. Cabahug / Mindanao Journal of Science and Technology Vol. 12 (2014) 147-170
153
Figure 2. A snapshot of the river, river banks, flowpath centerlines, and cross-section
overlaid on top of geo-referenced Landsat image for Cagayan de Oro
2.2 HEC-RAS
To build a floodplain model, the import file created in GeoRAS was
imported to the Geometric Editor within HEC-RAS (HEC, 2010b& c). The
river geometry was represented by river stations or cross-sections. These
were numbered beginning from downstream to the upstream side. Flood
discharges for different return periods obtained from hydrological model
were entered in steady flow data. The flow data entered in the steady flow
data editor consists of six return periods, namely; 2-year, 5-year, 10-year,
25-year, 50-year and 100-year.
The upper cross section RS+9000 were taken as the upstream boundary.
Both upstream and downstream cross-sections have critical depth as the
boundary condition. A subcritical depth analysis was done in the steady flow
analysis. The resulting water surface profiles were then exported back to
GeoRAS by creating the RAS GIS export file.
2.3 Georas Post-Processing

K. Mabao & R. G. Cabahug / Mindanao Journal of Science and Technology Vol. 12 (2014) 147-170
154
Simulation results from HEC-RAS were exported back to GeoRAS (HEC,
2010f) for floodplain mapping. Floodplain boundary and inundation depth
data sets were created from exported cross-sectional water surface
elevations. The process of exporting HEC-RAS results are as follows:
Importing the RAS GIS Export File
Inundation Mapping
2.4 Importing the RAS GIS Export File
HEC-GeoRAS does not read directly the spatial data format.RASExport.sdf
written by HEC-RAS. It must be converted first into XML format. To
convert an SDF file to XML, select the Convert RAS SDF to XML File
button on GeoRAS interface. After converting the data from the SDF file to
XML format the data is read into the GS and HEC-RAS results are
processed.
2.5 Inundation Mapping
After the conversion of the data, initial datasets are created. The stream
network, cross-section data, bank station data and bounding polygon data
will be read and shape files are automatically created. Based on the water
surface elevation attached to each cross-section, a water surface TIN is
generated. Floodplain delineation then will use this water surface TIN and
terrain model to calculate the floodplain boundary and inundation depths.
The floodplain delineation method rasterizes the water surface TIN using the
Rasterization Cell Size and compares it to the DTMGRID. The flood plain is
calculated where the water surface grid is higher than the terrain grid.
Inundation depth grid is the result from the water surface and terrain grid
comparison.
3. Results and Discussion
3.1 Precipitation Frequency Analysis
Two rainfall stations which are located in Cagayan de Oro River Basin were
selected for Precipitation Frequency Analysis. These stations are under
PAGASA and listed in Table 1.

K. Mabao & R. G. Cabahug / Mindanao Journal of Science and Technology Vol. 12 (2014) 147-170
155
Table 1. Rainfall stations for probable analysis
Station
Code Name
Location Period of
Observation Longitude Latitude
748 Cagayan de Oro 124°38’00” 8°29’22” Jan.1950 to Dec.2000
747 Lumbia Airport 124°33’18” 8°24’12” Jan.1977 to Present
Annual maximum point rainfalls at Cagayan de Oro Rainfall Station were
used for precipitation frequency analysis. Using Gumbel, Log Normal and
Log Pearson III distribution the probable point rainfalls were obtained.
Among the results of these methods, the probable rainfall was selected
considering the goodness of fit described by Kolmogorov-Smirnov (KS).
Data are presented in Table 2 to Table 4 with corresponding graphical
representations shown in Figures 3 to 8.
Table 2. Probable point 1, 2 and 3 -hour rainfall at Cagayan de Oro Station in
millimeters
Return
Period
Gumbel Log Normal Log Pearson III
1-hr 2-hr 3-hr 1-hr 2-hr 3-hr 1-hr 2-hr 3-hr
2 47.70 61.00 68.04 48.064 62.2 80.121 48.030 60.20 76.744
5 61.05 81.74 89.75 61.766 81.4 103.403 61.752 80.20 101.277
10 69.89 95.48 104.12 70.419 93.7 118.403 70.450 95.10 120.190
25 81.06 112.83 122.28 80.990 108.8 136.207 81.060 115.90 147.298
50 89.35 125.71 135.75 88.640 119.8 149.312 88.840 132.80 169.965
100 97.57 138.49 149.12 96.140 130.7 162.173 96.450 151.00 194.879
200 105.77 151.22 162.45 103.560 141.6 174.912 103.980 170.80 222.370
KS 0.10013 0.11205 0.110212 0.10013 0.15171 0.013328 0.10556 0.11712 0.09745
Table 3. Probable point 6 and 12-hour rainfall at Cagayan de Oro Station in
millimeters
Return
Period
Gumbel Log Normal Log Pearson III
6-hr 12-hr 6-hr 12-hr 6-hr 12-hr
2 61.00 90.76 62.2 89.43 60.20 85.212
5 81.74 124.86 81.4 118.069 80.20 115.317
10 95.48 147.43 93.7 136.523 95.10 139.119
25 112.83 175.96 108.8 159.389 115.90 173.967
50 125.71 197.12 119.8 176.159 132.80 203.672
100 138.49 218.12 130.7 192.746 151.00 236.836
200 151.22 239.05 141.6 209.291 170.80 273.985
KS 0.11205 0.08159 0.15171 014918 0.11712 0.09715

K. Mabao & R. G. Cabahug / Mindanao Journal of Science and Technology Vol. 12 (2014) 147-170
156
Table 4. Probable point 24 and 48-hour rainfall at Cagayan de Oro Station in
millimeters
Return
Period
Gumbel Log Normal Log Pearson III
24-hr 48-hr 24-hr 48-hr 24-hr 48-hr
2 95.54 120.85 97.905 121.651 96.066 116.832
5 127.18 165.75 129.761 161.867 128.858 158.945
10 148.13 195.48 150.346 187.930 151.903 191.282
25 174.59 233.04 175.907 220.364 182.586 237.553
50 194.23 260.91 194.686 244.235 206.608 276.199
100 213.72 288.56 213.285 267.907 231.648 318.641
200 233.14 316.12 231.859 291.578 257.911 365.435
KS 0.12941 0.09721 0.15979 0.15372 0.13796 0.10589
Figure 3. Probable 1-hour rainfall

K. Mabao & R. G. Cabahug / Mindanao Journal of Science and Technology Vol. 12 (2014) 147-170
157
Figure 6. Probable 6-hour rainfall
Figure 7. Probable 12-hour rainfall

K. Mabao & R. G. Cabahug / Mindanao Journal of Science and Technology Vol. 12 (2014) 147-170
158
Figure 8. Probable 24-hour rainfall
3.2 Plots of Probable Point Rainfall in Cagayan de Oro Station
3.2.1 Rainfall-Intensity-Duration-Frequency Curve
Using the probable rainfall for 1-hour to 48-hour rainfall obtained from
Cagayan de Oro Station, the Rainfall-Intensity-Duration-Frequency-Curve
(RIDF) was prepared for 2-yr, 5-yr, 10yr, 25yr, 50yr, and 100yr return
period (See Fig. 9). RIDF’s were separated into short duration (10 min to 1
hour) and long duration (1 hour to 1-day). The following RIDF equations for
long duration were compared for analysis:
I = a
t+b ……… Type I I =
a
t ± b ………Type III
I = a
t n
………… Type II I = bc)(t
a
……….Type IV
Where, I = rainfall intensity in mm/hr and t= rainfall duration (hr)

K. Mabao & R. G. Cabahug / Mindanao Journal of Science and Technology Vol. 12 (2014) 147-170
159
Figure 9. RIDF for 2 days at Cagayan de Oro Station
The parameters for the RIDFequations were fitted by optimizing the Nash–
Sutcliffe model efficiency coefficient. Through comparison, Type IV was
selected as the RIDF function for Cagayan de Oro Station. Table5 shows the
values of the optimized parameters.
Table 5. Parameters for RIDF Type IV
2-yr 5-yr 10-yr 25-yr 50-yr 100-yr
a 66.49 88.49 108.70 133.66 142.92 177.64
b 0.42 0.48 0.61 0.78 0.85 1.10
c 0.89 0.88 0.89 0.89 0.90 0.91
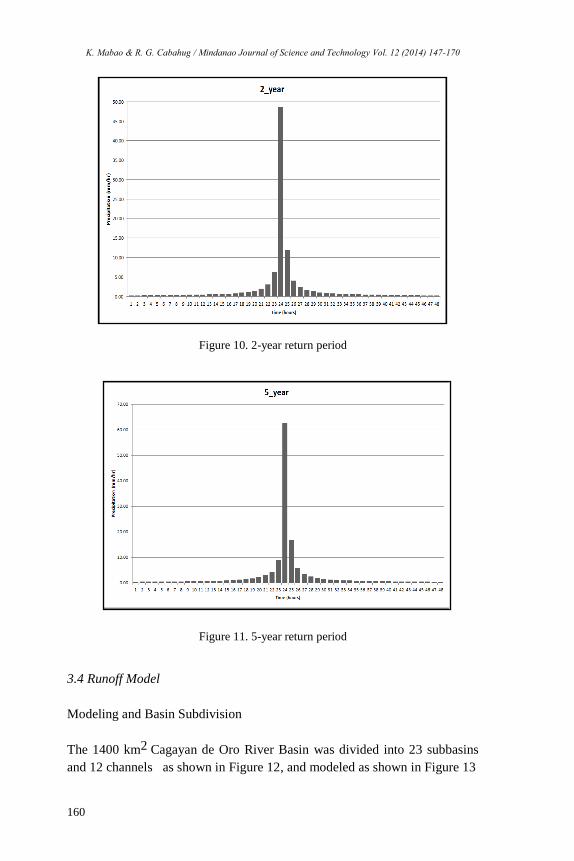
3.3 Design Precipitation Hyetograph
Sample design storms with their return periods of 2 and 5 years are shown
in Figures10 and 11, respectively considering the following:
Temporal distribution of rainfall was measured using the alternating
block method
48-hour rainfall amount was assumed equal to the probable mean
rainfall
K. Mabao & R. G. Cabahug / Mindanao Journal of Science and Technology Vol. 12 (2014) 147-170
160
Figure 10. 2-year return period
Figure 11. 5-year return period
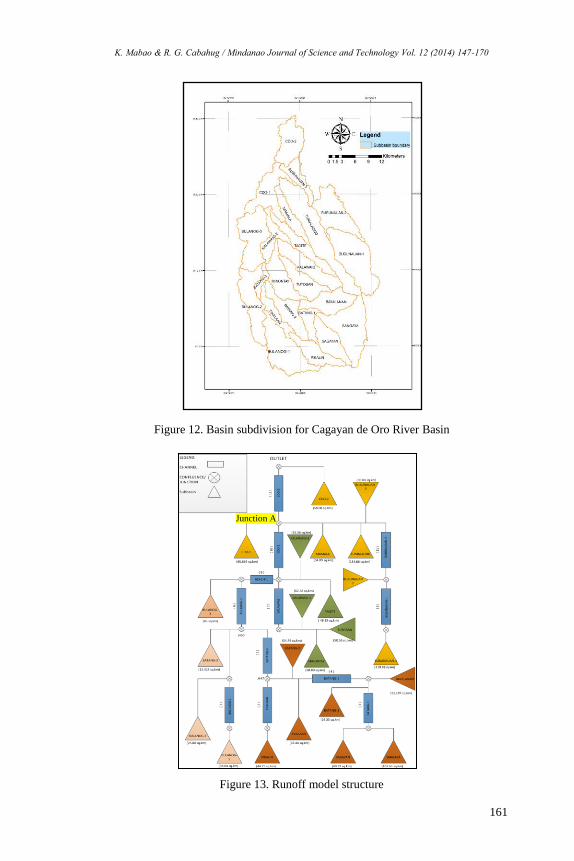
3.4 Runoff Model
Modeling and Basin Subdivision
The 1400 km2 Cagayan de Oro River Basin was divided into 23 subbasins
and 12 channels as shown in Figure 12, and modeled as shown in Figure 13
K. Mabao & R. G. Cabahug / Mindanao Journal of Science and Technology Vol. 12 (2014) 147-170
161
Figure 12. Basin subdivision for Cagayan de Oro River Basin
Figure 13. Runoff model structure
Junction A

K. Mabao & R. G. Cabahug / Mindanao Journal of Science and Technology Vol. 12 (2014) 147-170
162
consideration of the various river features and basin characteristics for which
peak discharge is necessary. Parameters required by the HEC-HMS related
to the physical attributes of the river and basin elements such as River
Length, catchment area, Basin Slope (S), Longest Flowpath,
CentroidalFlowpath and Lag Time are presented in Table 6aand Table 6b.
Table 6a. Parameters for Channel
Name Length
(km)
Elevation upstream
(m above sea level)
Elevation
downstream
(m above sea level)
(1) BULANOG-1 10.83 853.20 716.08
(2) TIKALAAN 18.58 868.44 480.44
(3) BATANG-1 6.28 808.51 656.16
(4) BATANG-2 14.30 656.16 480.44
(5) BATANG-3 6.53 480.23 402.23
(6) BULANOG-2 21.49 402.23 140.18
(7) KALAWAIG 22.10 498.72 129.00
(8) BUBUNAUAN-1 8.64 484.50 360.59
(9) REACH-1 3.22 274.25 129.00
(10) CDO-1 15.98 129.00 59.94
(11) BUBUNAUAN-2 17.36 360.59 59.94
(12) CDO-2 16.09 59.94 -03.04
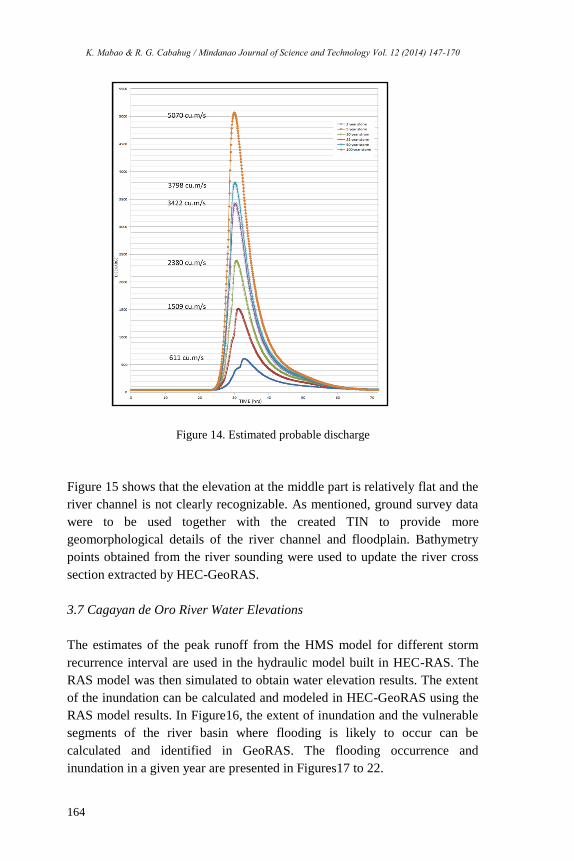
3.5 Simulation Results
Figure 14 shows the estimated probable discharge of 2, 5, 10, 25, 50 and 100
year return period at Junction A (See Figure 13).
3.6 Hydraulic Model
3.6.1 Preparation of TIN
The 30m x 30m DEM obtained from the GDEM (Global digital elevation
model established in 2007 by the National Aeronautics and Space Agency)
was used to generate Triangulated Irregular Network (TIN) for the subbasin
named CDO-2, the study area for floodplain analysis.

K. Mabao & R. G. Cabahug / Mindanao Journal of Science and Technology Vol. 12 (2014) 147-170
163
Table 6b. Parameters for Subbasin
Name Area
(km2)
Longest
Flowpath
(km)
Centroidal
Flowpath
(km)
Slope
(%) CN
Lag
(min)
SANGAYA 103.630 23.481 11.186 15.125 68.973 217.310
SAGAYAN 49.290 18.659 15.732 14.582 66.666 195.760
BAYALANAN 55.197 19.049 10.868 19.391 73.201 144.620
BATANG-1 24.352 12.190 5.200 12.295 67.625 148.090
BATANG-2 54.489 24.287 12.097 9.947 67.943 282.950
TIKALAAN 24.438 20.742 11.340 8.852 68.000 263.980
PIKALIN 44.746 20.310 10.723 12.24 68.562 217.440
BATANG-3 12.428 12.969 7.098 8.896 69.507 173.730
BULANOG-2 76.801 27.830 13.218 8.897 65.749 353.430
BULANOG-1 98.037 26.230 13.924 9.339 70.960 286.360
BULANOG-3 86.000 27.133 10.844 16.582 59.539 297.490
MINONTAY 58.803 22.353 6.092 6.834 72.986 278.530
KALAWAIG 62.677 25.333 13.043 15.914 72.704 203.340
TUTOBAN 50.560 19.772 11.136 9.236 71.594 225.740
TAGITE 46.185 28.753 15.300 14.510 71.575 243.130
KALAWAIG-2 35.360 20.528 11.947 9.227 75.843 206.420
BUBUNAUAN-2 78.831 20.495 7.370 8.435 77.027 208.250
BUBUNAUAN-1 110.81 28.273 16.474 25.060 72.339 178.720
TUMALAONG 134.86 18.201 23.373 14.834 72.821 325.370
MAMALA 34.088 19.774 9.206 8.757 67.396 259.570
BUBUNAUAN-3 30.835 28.723 7.086 11.796 70.740 191.390
CDO-1 65.869 16.183 5.086 11.987 55.829 320.330
CDO-2 58.076 16.813 8.010 8.431 66.162 240.010
During the creation of TIN in ArcGIS for Desktop, the elevation range was
classified into nine classes from 314-353, 274-314, 235-274, 195-234, 155-
195, 116-155, 76-116, 37-76, and -3-37m.
K. Mabao & R. G. Cabahug / Mindanao Journal of Science and Technology Vol. 12 (2014) 147-170
164
Figure 14. Estimated probable discharge
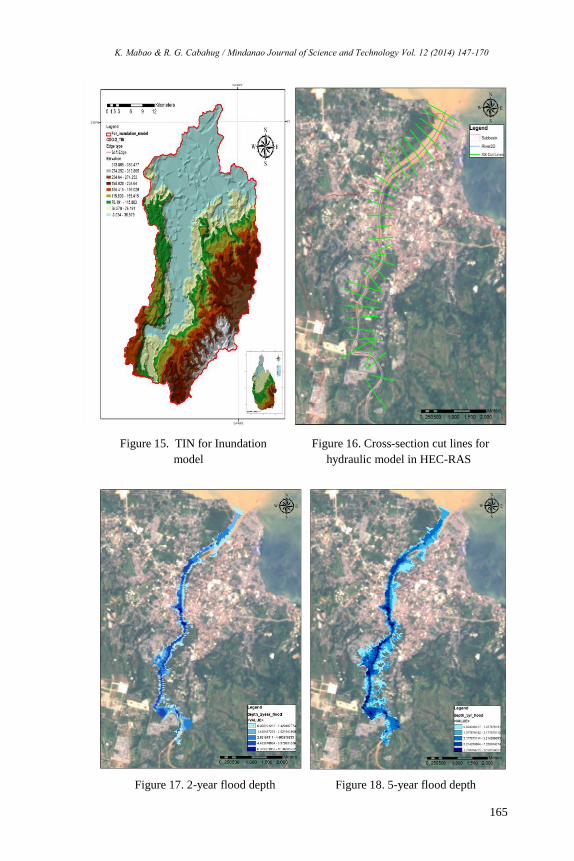
Figure 15 shows that the elevation at the middle part is relatively flat and the
river channel is not clearly recognizable. As mentioned, ground survey data
were to be used together with the created TIN to provide more
geomorphological details of the river channel and floodplain. Bathymetry
points obtained from the river sounding were used to update the river cross
section extracted by HEC-GeoRAS.
3.7 Cagayan de Oro River Water Elevations
The estimates of the peak runoff from the HMS model for different storm
recurrence interval are used in the hydraulic model built in HEC-RAS. The
RAS model was then simulated to obtain water elevation results. The extent
of the inundation can be calculated and modeled in HEC-GeoRAS using the
RAS model results. In Figure16, the extent of inundation and the vulnerable
segments of the river basin where flooding is likely to occur can be
calculated and identified in GeoRAS. The flooding occurrence and
inundation in a given year are presented in Figures17 to 22.
K. Mabao & R. G. Cabahug / Mindanao Journal of Science and Technology Vol. 12 (2014) 147-170
165
Figure 15. TIN for Inundation Figure 16. Cross-section cut lines for
model hydraulic model in HEC-RAS
Figure 17. 2-year flood depth Figure 18. 5-year flood depth

K. Mabao & R. G. Cabahug / Mindanao Journal of Science and Technology Vol. 12 (2014) 147-170
166
Figure 19. 10-year flood depth Figure 20. 25-year flood depth
Figure 21. 50-year flood depth Figure 22. 100-year flood depth

K. Mabao & R. G. Cabahug / Mindanao Journal of Science and Technology Vol. 12 (2014) 147-170
167
The results show that with the increasing storm depth, the flood inundation
also increases along the right banks. The inundation area results for the
different storm scenarios are shown in Table 7.
Table 7. Inundation Area
Inundation area (km) for different storm scenarios
Return period Area (km)
2 0.12
5 1.95
10 2.79
25 3.25
50 3.35
100 3.73
The applications of hydrologic and hydraulic models together with GIS for
floodplain analysis are very limited in the Philippines due to the scarcity of
river geometric, topographic and hydrologic data. Therefore, this floodplain
analysis and modeling are subject to the following sets of constraints.
HEC-HMS, HEC-GeoRAS and ArcGIS were the primary software
used to build the hydrological model.
HEC-RAS, HEC-GeoRAS and ArcGIS were the primary software
used for hydraulic analysis.
Landuse/landcover used for generating Curve Number were derived
from satellite images
During the model run in HEC-HMS and HEC-RAS, several
assumptions are made and needs to be verified.
According to the hydraulic model result, considerable flooding starts at 5-
year flood event. River cross sections in the middle reach to the delta are
observed to be shallower than the cross-sections upstream. Inundation map
shows that the right banks of Cagayan de Oro are most likely to overflow if a
5-year event or higher will occur. These areas need immediate
countermeasures because the level of hazard is high.
With the present river condition of the Cagayan de Oro River, structural
countermeasures are necessary but not the long term solution to the flooding
problem. With no possibilities of widening the river sections and increase

K. Mabao & R. G. Cabahug / Mindanao Journal of Science and Technology Vol. 12 (2014) 147-170
168
conveyance, a mitigation measure has to be made further upstream. A
retention basin or a dam could help manage river discharge, but needs
further studies.
Floodplain analysis is one of the interests of land developers, design
engineers and urban planners. The result of the floodplain analysis provides
good information for floodplain management program on the area. Below
are some of the potential applications of this study:
The hydrologic model can be used to test impacts of land use
changes and rainfall prediction in the Cagayan de Oro River Basin
The results of floodplain analysis can be used for the design of
flood control structures such as dikes, embankments, retention
ponds, etc.
The results can also provide information for the design of other
hydraulic structures such as weirs and bridges.
The results of this study could be a basis for non-structural measure
for flood protection such as floodplain zoning.
4. Conclusions and Recommendations
This study presents a systematic approach on conducting floodplain analysis
using 1-Dimensional steady flow models and GIS. The Cagayan de Oro
River Basin was modeled using numerical models in combination with
remote sensing techniques to determine the vulnerability of flooding of
Cagayan de Oro City. A hydrologic model was built in HEC-HMS and
ArcGIS. Design storms with different return periods for the whole basin
were then simulated. Peak flows for the design storms generated by the HMS
model were used to run the RAS model. The RAS model, then generates
estimates of water elevations and flood inundation extents for the different
design storms.
The use of GIS and remote sensing in providing unavailable ground
data proves to be a valuable tool in this study.
The automated basin processing and hydrologic model building
using ArcGIS and HEC-HMS saves time and resources while
providing reliable results at the same time.

K. Mabao & R. G. Cabahug / Mindanao Journal of Science and Technology Vol. 12 (2014) 147-170
169
The automated floodplain analysis using ArcGIS and HEC-RAS
provides results that will help decision-makers better understand the
flooding problem.
The flood inundation results show that the city of Cagayan de Oro is exposed
to a high level of flooding hazard. It is observed that channel capacity is only
capable of handling 2-year or 5-year storms without having considerable
floodplain. With little possibility for channel modification, mitigation
measures have to be made upstream. With the high probability that the city
will be flooded again in the next five years, it is imperative that short-term
and long-term mitigation measures have to be performed.
This study was conducted under the major constraint of limited data
availability. The following recommendations are made for further studies in
the future:
Precipitation data: One of the major parameters for the hydrologic
model, precipitation data in and around the catchment, is needed for
establishment of design hyetographs.Precipitation data series are
also needed for calibration and validation of the model
Topographical data. For flood routing in hydrologic models,
topographic data should be provided to fully represent the channel.
For modeling flows in overbank, topographic data of high
resolution are needed to fully represent the floodplain
Flow data: A major hydrologic parameter, long time series, are
necessary for the calibration and validation of models.
River cross sections should be measured through topographic
survey because the river morphology has changed drastically during
previous major flood event.
5. References
Environmental Systems Research Institute. (1990). Understanding GIS: The Arc/Info
Method. Redlands, CA: Environmental Systems Research Institute.
HEC, (2010a). HEC-HMS, Hydrologic Engineering Center. http://www.hec.usace.ar
my.mil/software/hec-hms/ (accessed Dec 10, 2012)
HEC, (2010b). HEC-RAS, Hydrologic Engineering Center. http://www.hec
.usace.army.mil/software/hec-ras/hec-georas.html (accessed Dec 10, 2012)

K. Mabao & R. G. Cabahug / Mindanao Journal of Science and Technology Vol. 12 (2014) 147-170
170
HEC, (2010c). HEC-RAS User’s Manual Version 4.1. Hydrologic Engineering
Center.
HEC, (2010e). HEC-HMS User’s Manual Version 3.5. Hydrologic Engineering
Center.
HEC, (2010f). HEC-GeoRAS, Hydrologic Engineering Center. http://www.h
ec.usace. army.mil/software/hec-ras/hec-georas.html (accessed10-10, 2012)
PDNA (Post Disaster Needs Assessment),(2012). Tropical Storm Sendong Post
Disaster Needs Assessment Draft Final Report.
USACE, (1993). Engineering and Design Hydrologic Frequency Analysis,
Washington DC.
USGS, (2003). United States Geologic Survey, Effects of urban development on
Floods. http://pubs.usgs.gov/fs/fs07603/pdf/fs07603.pdf. Accessed March 29, 2013.
WDR, (2010). World Disasters Report 2010. International Federation of Red Cross
and Red Crescent Societies.
WWAP (World Water Assessment Programme). (2012). The United Nations World
Water Development Report 4: Managing Water under Uncertainty and Risk. Paris,
UNESCO.