assessment of adoption behavior of ... - cornell...
TRANSCRIPT
ASSESSMENT OF ADOPTION BEHAVIOR OF SOIL AND WATER
CONSERVATION PRACTICES IN THE KOGA WATERSHED, HIGHLANDS OF
ETHIOPIA
A Thesis
Presented to the Faculty of the Graduate School
of Cornell University
in Partial Fulfillment of the Requirements for the Degree of
Master of Professional Studies
By
Fikru Assefa Mengstie
August 2009

© 2009 Fikru Assefa Mengstie
ABSTRACT
Land degradation is one of the major challenges in agricultural production in many
parts of the world, especially in developing nations like Ethiopia. Even though a
number of soil and water conservation methods were introduced to combat land
degradation, adoption of these practices remains below expectations. This research
was conducted in the Koga watershed, near Lake Tana, in the catchment of a recently
constructed dam. It aimed to examine farmers’ views on land degradation and to
assess their adoption behavior of soil and water conservation knowledge.
Structured questionnaire survey and focus group discussion methods were applied to
collect the necessary information from farm households. A total of 100 households
were interviewed and 282 plots and several fields were visited during transect walks.
The Tobit regression model was used for analyzing correlations among area,
household, plot characteristics and the adoption of three types of soil and water
conservation practices. In addition, data were analyzed using descriptive statistics and
cross-correlation methods.
The results show that total area of plots, age of household head, education of
household head, total number of livestock and distance to market from household
home are among the major factors that positively and significantly influence adoption
of soil and water conservation measures. Greater distance from home to farmland,
smaller land to labor ratio and larger family size are factors that decreased adoption.
The data showed in addition that more soil/stone bund terraces were implemented on
steep land. Unlike in other studies in the region, sex of the household head did not
seem to make a difference in adoption of three different SWC practices.

BIOGRAPHICAL SKETCH
The author was born in South Wello Administrative zone, Amhara-Sayint Woreda
(580 km Northern from Addis Ababa, capital city of Ethiopia) in June 07, 1984. He
attended Sayint Elementary and Junior Secondary School and completed his
secondary school education at Dubti (Afar Region) and Sayint (Amhara region) Senior
Secondary School. Then he joined Debub (currently Hawassa) University in
September 2002 and graduated with a BSc degree in Agricultural Resource Economics
and Management in July 2006.
Following his graduation, from July 2006 to September 2006, he served as Watershed
Management Expert in an Operational Research Project (joint NGO & Government
project) in Hawassa University, SNNPR.
Finally in October 2006, he was employed by Mehal-Sayint Woreda Agricultural and
Rural Development Office as an agricultural credit and input supply expert and
worked there until he joined Cornell University at Bahir Dar University to pursue his
Master of Professional Study (MPS) degree in International Agriculture and Rural
Development with a specialization in Integrated Watershed Management and
Hydrology in September 2007.
iii
To my lovely mother W/o Abesha Tadese and my father Ato Assefa Mengstie -- they
are still fresh in my memory and deserve great credit for my current achievement.
iv

ACKNOWLEDGEMENTS
Above all I thank the LORD GOD for giving me the strength to start and go through
with my studies and also his mercy and grace upon me during all these days here in
Bahir Dar and in all my life.
I would like to thank the Cornell University for sponsoring my MPS study here in
Bahir Dar University. I would also like to thank International Water Management
Institution (IWMI) for sponsoring my thesis work and International Livestock
Research Institution (ILRI) for providing data.
Next, I would like to express my deepest gratitude to my supervisors, Professor
Tammo S. Steenhuis and Professor Alice Pell, and Co-Advisors Dr. Amy S. Collick
(Coordinator for Integrated Watershed Management and Hydrology Masters Program
in CU/Bahir Dar University, Ethiopia) and Dr. Fitsum Hagos (Socio-economists in
IWMI, Addis Ababa Ethiopia) for their guidance and continuous follow up in the
entire process of the thesis work without which this thesis could not have been
possible. Steve Pacenka for helping with correcting my thesis.
My sincere thanks go to Dr. Seleshi Bekele (Regional Coordinator for (IWMI) in
Addis Ababa, Ethiopia), Dr. Amare H.Selassie and Mr. Solomon G. Selassie (ILRI
staff) for their advice on analysis methods, providing their literature and for their
helpful encouragements.
During my field work, I was helped by Mr. Woriku Alemu and Mr. Alehegni from
Mecha Woreda Agricultural and Rural Development Officers and Mr. Tilahun from
v
Koga Irrigation and Watershed Management Project. I would like to use this
opportunity to thank them all. Especially, I would like to thank the farmers of the
study area who gave their time to participate in this research.
I wish I could list all individuals and institutions that contributed, in one way or
another, to the successful completion of my study. But they are too many to mention
all. Generally, the kind EOTC fathers, students and local community in each church
who hosted and assisted us in undertaking the field experiments are unforgettable and
their wisdom is amazing.
Last but not least, I am most deeply grateful to my parents, for helping me strive
towards the realization of my potentials and all the inconveniences you have
encountered during my absence and your wonderful support and patience during my
stay away from home.
vi

TABLE OF CONTENTS
BIOGRAPHICAL SKETCH.........................................................................................iii ACKNOWLEDGEMENTS ...........................................................................................v TABLE OF CONTENTS .............................................................................................vii LIST OF FIGURES....................................................................................................... ix CHAPTER ONE.............................................................................................................1 1. INTRODUCTION......................................................................................................1 CHAPTER TWO............................................................................................................6 2. MATERIALS AND METHODS ...............................................................................6
2.1 Study area............................................................................................................6 2.2 Methods of data collection .................................................................................8 2.3 Methods of Data Analysis ................................................................................10
2.3.1 Specification of the statistical model...........................................................11 2.3.2 Hypothesis of Variables ..............................................................................13
3. RESULTS AND DISCUSSION...............................................................................16 3.1. Descriptive Analysis ........................................................................................16
3.1.1 Demographic Characteristics.......................................................................16 3.1.2 Education Status of Household ...................................................................17 3.1.3 Age Status of Households ...........................................................................19 3.1.4 Off-Farm Economic Activities ....................................................................20 3.1.5 Perception and Attitude of Farmers.............................................................21 3.1.6 Livestock Production...................................................................................24
3.2 Farmland Characteristics ................................................................................24 3.2.1 Land Size and Distribution..........................................................................24 3.2.2. Slope, Fertility, Soil Color and Degree of Erosion ....................................25 3.2.3 Distance between home and farmland.........................................................26 3.2.4 Types of major crops ...................................................................................27
3.3 Soil and water conservation practices in the area .........................................27 3.3.1 Traditional and newly introduced SWC practices.......................................28 3.3.1.1 Cut-off drains............................................................................................28 3.3.1.2 Leaving crop residues...............................................................................30 3.3.1.3 Contour farming .......................................................................................30 3.3.1.4 Fallowing..................................................................................................31 3.3.1.5 Application of manure..............................................................................31 3.3.1.6 Plantations ................................................................................................32 3.3.1.7 Soil/stone bund terraces............................................................................33
3.4 Econometric Analysis .......................................................................................35 3.4.1. Factors affecting adoption of SWC practices .............................................37 3.4.1.1 Personal factors in relation to adoption of SWC ......................................40 3.4.1.2 Socio-economic factors in relation to adoption of SWC..........................42 3.4.1.3 Institutional factors in relation to adoption of SWC ................................43 3.4.1.4 Biophysical factors in relation to adoption of SWC.................................44
CHAPTER-FOUR........................................................................................................47
vii
4. SUMMARY AND CONCLUSION.........................................................................47 4.1 Summary ...........................................................................................................47 4.2 Conclusion .........................................................................................................47
REFERENCES.............................................................................................................49 APPENDICES..............................................................................................................54 Appendix 1: Conversion factors used to estimate tropical livestock units (TLU) .......54 Appendix 2: Conversion factors used to estimate labor equivalent (man days) ..........54 Appendix 3: Structural survey questionnaire for formal interviewer...........................55 GLOSSARY.................................................................................................................62
viii
LIST OF FIGURES
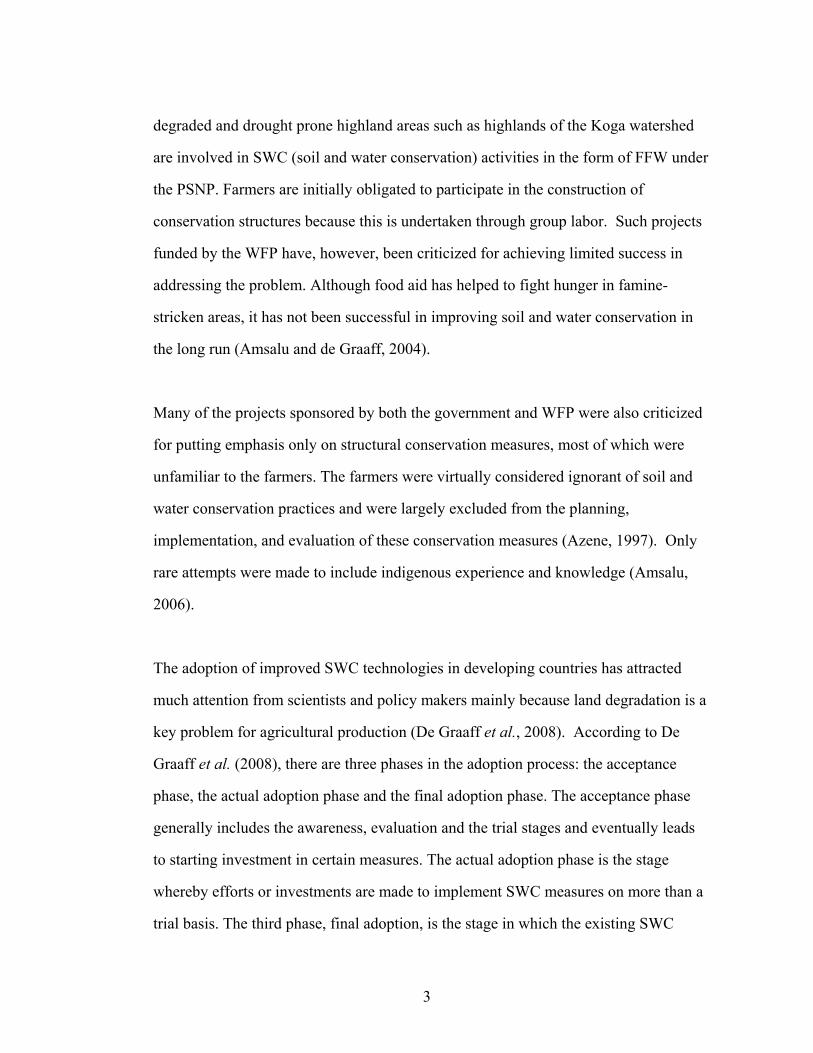
Figure 1: Topography maps of Ethiopia, Mecha Woreda and Koga Watershed, in the
highlands of Ethiopia.......................................................................................7 Figure 2: Plantation of Sisal and Euphorbia.................................................................32 Figure 3: Fields with stone bunds are common in cultivated fields along transect in the
Koga watershed, 2008. ..................................................................................34 Figure 4: Planting of trees in flat land areas of Koga watershed..................................46
ix

LIST OF TABLES
Table 1: Classification of independent variables..........................................................15 Table 2: Characteristics of farm plots, related households and their heads .................16 Table 3: Educational status of household heads...........................................................18 Table 4: Education status of family members (not counting head of household) ........18 Table 5: Age distribution of household heads..............................................................19 Table 6: Age distribution of household family members (not counting head of
household) .....................................................................................................20 Table 7: The perceived major causes of soil erosion and their ranks...........................22 Table 8: Farmers’ perceptions of soil erosion hazards in the Koga watershed ............23 Table 9: Type and number of livestock owned by the sample households ..................24 Table 10: Distribution of sample household heads by land holding ............................25 Table 11: Distribution of farm plots by slope category, level of fertility, soil color and
degree of erosion ...........................................................................................26 Table 12: Characteristics of farm land .........................................................................27 Table 13: Major types of crops in the study area .........................................................27 Table 14: Traditional and newly introduced SWC measures implemented by HH .....29
x
LIST OF ABBREVIATIONS
ACTRA Access to training AGEHH Age of household ATLND Area of total farmland BSc Bachelor of Science DA Development agent DAP Diammonium Phosphate DIMAR Distance to market DIST Distance to the plot EDUHH Education of household EOTC Ethiopia Orthodox Tewahedo Church ETB Ethiopian birr EXT Extension FAO Food and Agricultural Organization FFW Food for work GDP Gross domestic product GNP Gross national product ha Hectare HH Household ICOFD Improved cut-off drain ISOB Improved soil/stone bund Km2 Kilometer squared LMTs Land management technologies LNDLBR Land to labor ratio LNDSECU Land security masl Meters above sea level mm Millimeters MCM Million cubic meters MoARD Ministry of Agricultural and Rural Development MPS Master of Professional Studies MS-Excel Microsoft Excel N Number of observations NGO Non-governmental organization oC Degrees Celsius OFINCOM Off-farm income PAs Peasant associations PERCP Perception of farmers PLTRE Plantation of trees PSNP Productive Safety Net Program RF Rainfall SEXHH Sex of head of household SLOP Slope SNNPR Southern Nations, Nationalities, and Peoples’ Region
xi
SOCIAL Social position SPSS Statistical Package for Social Sciences SWC Soil and water conservation TLS Total livestock TLU Tropical Livestock Unit TOFAM Total family size TOL Tolerance level VIF Variance Inflation Factor WFP World food program % Percent m/ha Meters per hectare No/ha Number per hectare
xii
CHAPTER ONE
1. INTRODUCTION
1.1 Background
The backbone of the agrarian economy in most developing countries is rain fed
agriculture. The economic development of developing countries depends on the
performance of the agricultural sector, and the contribution of this sector depends on
how the natural resources are managed. Unfortunately, in the majority of developing
nations, the quality and quantity of natural resources are decreasing resulting in more
severe droughts and floods. Effective integrated watershed management can reduce
these effects.
Ethiopia is one of the poorest countries in the world (World Bank, 2003). Its economy
is based mainly on agriculture providing employment for over 80% of the labor force
which accounts for a little over 50% of the GDP (Gross domestic product). In fact,
agriculture in Ethiopia is not only an economic activity but also a way of life for
which agricultural land is an indispensable resource upon which the welfare of the
society is built. The livelihood of the vast majority of the population depends directly
or indirectly on this sector. Such dependence obviously leads to increased
vulnerability of the economy to problems related to land degradation (Wegayehu,
2003). Most farmers are poor and operate at subsistence level, and investment for
intensification of agriculture is not well developed in the country. This has created a
vicious circle of low productivity - land degradation reduces the production potential
of the land and this, in return, makes it difficult for farmers to produce enough and
invest in protecting the land. Although land provides a means of livelihood for the
majority of the population, land resources are facing increasing degradation mainly
due to erosion (FAO. 1986).
1

Land degradation in the form of soil erosion, sedimentation, depletion of nutrients,
deforestation, and overgrazing - is one of the basic problems facing farmers in the
Ethiopian highlands, and this limits their ability to increase agricultural production and
reduce poverty and food insecurity. The integrated process of land degradation and
increased poverty has been referred to as the "downhill spiral of un-sustainability"
leading to the "poverty trap" (Greenland et al., 1994). The immediate consequence of
land degradation is reduced crop yield followed by economic decline and social stress.
Soil erosion is the main form of land degradation, caused by the interacting effects of
factors, such as biophysical characteristics and socio-economic aspects. Degradation
resulting from soil erosion and nutrient depletion is one of the most challenging
environmental problems in Ethiopia. The Ethiopian highlands have been experiencing
declining soil fertility and severe soil erosion due to intensive farming on steep and
fragile land (Amsalu and de Graaff, 2006).
Recognizing land degradation as a major environmental and socio-economic problem,
the government of Ethiopia has made several interventions. As a result, large areas
have been converted to terraces, covered by soil bunds, closed by area closures and
planted with millions of tree seedlings. Nevertheless, the achievements have fallen far
below expectations. The country still loses a tremendous amount of fertile topsoil, and
the threat of land degradation is broadening alarmingly (Teklu and Gezahegn, 2003).
Of the various interventions, extensive conservation projects are carried out with the
support of the WFP (World Food Program) (Shiferaw and Holden, 1998). One of these
is the PSNP (Productive Safety Net Program), implemented in the study area, that
provides farmers with grains (FFW, Food for Work) or cash payment for their
participation in the funded conservation works. Rural communities living in highly
2
degraded and drought prone highland areas such as highlands of the Koga watershed
are involved in SWC (soil and water conservation) activities in the form of FFW under
the PSNP. Farmers are initially obligated to participate in the construction of
conservation structures because this is undertaken through group labor. Such projects
funded by the WFP have, however, been criticized for achieving limited success in
addressing the problem. Although food aid has helped to fight hunger in famine-
stricken areas, it has not been successful in improving soil and water conservation in
the long run (Amsalu and de Graaff, 2004).
Many of the projects sponsored by both the government and WFP were also criticized
for putting emphasis only on structural conservation measures, most of which were
unfamiliar to the farmers. The farmers were virtually considered ignorant of soil and
water conservation practices and were largely excluded from the planning,
implementation, and evaluation of these conservation measures (Azene, 1997). Only
rare attempts were made to include indigenous experience and knowledge (Amsalu,
2006).
The adoption of improved SWC technologies in developing countries has attracted
much attention from scientists and policy makers mainly because land degradation is a
key problem for agricultural production (De Graaff et al., 2008). According to De
Graaff et al. (2008), there are three phases in the adoption process: the acceptance
phase, the actual adoption phase and the final adoption phase. The acceptance phase
generally includes the awareness, evaluation and the trial stages and eventually leads
to starting investment in certain measures. The actual adoption phase is the stage
whereby efforts or investments are made to implement SWC measures on more than a
trial basis. The third phase, final adoption, is the stage in which the existing SWC
3
measures are maintained over many years and new ones are introduced on other fields
used by the same farmer.
The most important reason for limited use of SWC technologies is farmers’ low
adoption behavior1. Kessler (2006) considers SWC measures fully adopted only when
their execution is sustained and fully integrated in the household’s farming system.
Adoption of SWC measures does not automatically guarantee long-term use. For
example, when SWC measures have been established with considerable project
assistance, not all farmers may continue using the measures. Therefore, introduction of
SWC technologies may not lead to sustained land rehabilitation unless the farmers
proceed to final adoption.
Previous studies show that various personal, economic, socio-institutional and bio-
physical attributes have influential roles in farmers’ decisions about the adoption of
SWC measures in different areas of Ethiopia. This relationship between attributes has
not yet been studied in the Koga watershed in the highland of Ethiopia. Appropriate
understanding of these factors in the Koga watershed would assist in the formulation
and implementation of the policy interventions designed to induce voluntary continued
use of SWC measures.
Because local farmers ultimately determine the use of SWC measures, clear
knowledge of the local factors that determine farmer decisions is an essential part of
combating severe soil erosion. Whether these factors, widely present throughout
Ethiopia, have similar roles in areas where the PSNP is implemented like Koga
1 “Adoption behavior” refers to the degree to which farmers are intrinsically motivated to maintain and replicate SWC measures. The highest degree of adoption is when farmers are convinced themselves, not by incentives or by statements from others that a measure actually works.
4

watershed, however, is unexplored. Some subsistence farmers in the Koga watershed
are hesitant to accept different measures such as terracing, check dam construction and
gully planting, and cut-off drains (Wubneh, 2007). These farmers may not believe that
these measures are effective, or they may have socio-economic challenges that restrict
use of the specific promoted SWC technologies.
The purpose of this research is, therefore, to contribute to the understanding of the
factors that influence farmers’ decisions on the adoption of SWC in the Koga
watershed study area. The objectives of the study were: to assess the adoption
behavior of farmers for different SWC practices; identify personal, socio-economic,
institutional and biophysical factors that may influence farmers’ participation in those
conservation activities; and lastly evaluate the strength of correlations between
adoption behavior and different influencing factors.
The study area is in the Koga Irrigation and Watershed Management project, located
in the watershed of the upper Blue Nile. This project, supported by the African
Development Bank (ADB) and the Ethiopian government, has a 7000 ha command
area intended for the cultivation of profitable and environmentally friendly crops to
enhance food security. Besides protecting land for agriculture, there is an extra
incentive to decrease erosion in the watershed: extending the project’s irrigation
reservoir life.
Information obtained from this research can aid policy makers, the world community,
individual farmers, researchers and extension staff to enhance the adoption of SWC
measures in the Koga watershed and other areas with conditions similar to Ethiopia.
5
CHAPTER TWO
2. MATERIALS AND METHODS
2.1 Study area
The study was carried out in the Koga watershed (Enamirt, Rim, Kurt-Bahir, Andinet,
Kudmi and Midre-Genet villages). It is located between 110 10’ and 110 25’ North
latitude and 370 2’ and 370 17’ East longitude in Blue Nile basin, within the Highland
of Ethiopia which is located about 540 km North of the capital city, Addis Ababa
(Figure 1). The mean annual rainfall (RF) recorded at Merawi station is 1480 mm, of
which 90% falls in the months May through October. The monthly mean temperature
is 25.8oC. The elevation ranges between 1885-3131 masl (meters above sea level), and
the slope ranges from nearly flat to very steep. The mean annual runoff recorded at
Koga station near Merawi for the years 1985-2003 is 176 MCM (Million cubic
meters). The dry season limits the water availability in the study area.
The Koga watershed lies in the Blue Nile Basin and consists of land drained by the
Koga River above its confluence with the Gilgel Abay (Little Nile). The Koga River
flows south to northwest with a total length of 49 km to Gilgel (Little) Abay and Lake
Tana; its tributaries effectively drain the total catchment area, which is 27,850 ha and
lies to the North of the Wezem Mountains.
Soil erosion in the Koga watershed is severe and is the result of the mountainous and
hilly topography, a low degree of vegetation cover and gully erosion. Soil erosion has
made cultivation infeasible in several parts of watershed. This together with
increasing population pressure has forced farmers to constantly cultivate new and
more marginal areas.
6
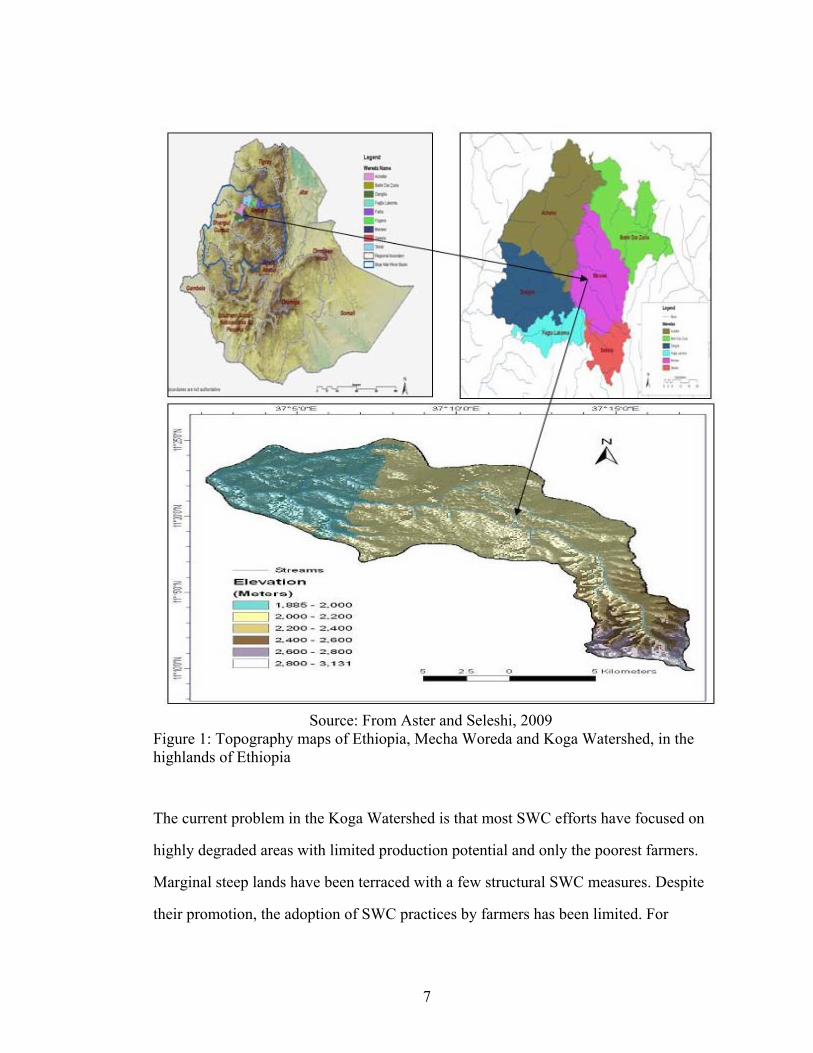
Source: From Aster and Seleshi, 2009 Figure 1: Topography m ga Watershed, in the
current problem in the Koga Watershed is that most SWC efforts have focused on
aps of Ethiopia, Mecha Woreda and Kohighlands of Ethiopia
The
highly degraded areas with limited production potential and only the poorest farmers.
Marginal steep lands have been terraced with a few structural SWC measures. Despite
their promotion, the adoption of SWC practices by farmers has been limited. For
7

example most farmers have not implemented stone bund terraces because they harbor
rodents that consume the crop. As a result, land degradation remains a major threat to
agricultural production.
2.2 Methods of data collection
The data used for this study were obtained from both primary and secondary sources.
The primary sources mainly related to adoption behavior were collected using both
formal and informal survey methods. All the necessary quantitative data required for
the study were gathered through a farm household survey conducted from June to
October, 2008. At the beginning stage of the survey, informal meetings were
undertaken with a group of farmers in order to understand the general agricultural and
socio-economic situation of the population of the study area. Also, informal meetings
with key informants (farmers, elder people, researchers, women, experts and
development agents) were held to gain in-depth knowledge about the area and to pre-
test the farm survey questionnaire. Almost all survey questions (Appendix 3) were
closed-ended. These questions were pre–tested with selected respondents.
Subsequently, on the basis of the results obtained from the pre-test, necessary
modifications were made to the questionnaire, which was ultimately translated from
English into the local language, Amharic. The interviews were conducted in Amharic.
In addition to informal contacts, transect walks across each village were conducted in
order to obtain all the necessary physical information and determine the questions that
need to be included in the survey. It was a useful technique to characterize and
understand biophysical and terrain features such as topography, erosion status, and
types of traditional and improved SWC practices, land uses, soil type, slope
characteristics and soil depth of the area. During the transect walks, informal
8
discussions with villagers helped to acquire useful and detailed information which
would have been difficult to collect through the questionnaire survey.
For the detailed personal interviews, a random sampling technique was used to select a
total of 100 households (HHs) from among 1260 HH farmers participating in the
agricultural activities in the study area. The sampling was done using a list of all
households in the villages which was obtained from the representative village
administrations and local development agents. A structured questionnaire was used for
the interviews, which were conducted both in the homestead and on the farm land. To
develop the farmer’s trust in the interviewer, each farmer was well informed about the
purpose of the survey and why he/she was chosen for the interview.
Data generated from the interview included types of SWC measures (traditional and
improved) adopted by the farmer, their extent and their effectiveness. In addition, the
personal, socio-economic, institutional and biophysical factors affecting adoption of
SWC practices were obtained.
Three enumerators (interviewers) were selected based on their understanding of
farming and SWC practices and their educational level. One day of intensive training
on how to conduct interviews and record information in the questionnaire properly
was given by the corresponding main researcher. Subsequently interviews were
conducted by the three enumerators and the corresponding main researcher with every
interview done together. At the end of the formal survey in each village, discussions
were held by the researcher and the three enumerators with key informants including
community leaders, elders, women farmers and development agents. This informal
technique helped to acquire useful and detailed information about biophysical factors
9

and farmers’ perceptions. Secondary data from literature (scientific and non-scientific
reports and unpublished material, proceedings and statistical abstracts) and offices of
Agriculture and Water Resources at Regional, Zonal and Woreda level were used as
additional sources of information. These data from informal local discussions and
secondary sources were used to verify and supplement the quantitative results from the
structured questionnaires.
2.3 Methods of Data Analysis
To analyze factors affecting adoption of soil and water conservation technologies is
difficult because of differences in agro-ecological and socio-economic settings within
which farmers operate (Bekele, 2003). To address this difficulty, it was assumed that
every farmer has the objective to maximize utility, but each farmer has their own
perception of utility and makes SWC practice adoption decisions based on the unique
attributes of their own situation and location. In other words, the adoption of soil and
water conservation practices is assumed to depend upon the set of attribute values that
apply to a plot of land, some of which are specific to the particular region, to the
village, to the farm or to the plot within the farm.
Farmers in the Koga watershed cultivate or manage several plots located at different
distances from home. Each plot has different soil and environmental conditions. As a
result, farm households may make different soil and water conservation decisions for
different plots depending on specific circumstances and the importance of the plot to
the household. This requires that data be interpreted at an individual plot level rather
than aggregated across all plots of a household.
10
To accomplish the analysis at the plot level, the data acquired for each plot were
analyzed using descriptive statistical techniques and econometric analysis (Tobit
regression model) provided by the Statistical Package for Social Sciences (SPSS).
MS-Excel was used to generate tables. For the informal key informant interviews and
field observation notes, a qualitative analysis was used.
2.3.1 Specification of the statistical model
Farm households in Koga watershed differ in the proportion of cultivated land on
which different types of soil and water conservation structures are used. There are
non-users of these improved and traditional soil and water conservation (SWC)
measures even in the places were they are promoted. Because some households are
non-adopters of SWC practices, the reported proportion of land with SWC for such
households is equal to zero. As noted in Greene (2000), a dependent variable that has
a zero value for a significant fraction of the observations requires a censored
regression model (also referred to as a Tobit model) because standard OLS regression
“fails to account for the qualitative difference between limit (zero) and nonlimit
(continuous) observations.” Thus, analysis of the determinants of the adoption of
SWC requires the application of a censored regression model. Censored regression is
preferred because it uses data at the limit as well as those above the limit to estimate
regression.
Following Maddala (1997), the Tobit model can be derived based on defining a new
random variable y* that is a function of a vector of variables x as:
,0 if 0
,0 if 0
,
*
*
*
>=
≤=
+′=
ii
ii
iii
yy
yy
xy εβ
………………..……………………………………….Equation (1)
11
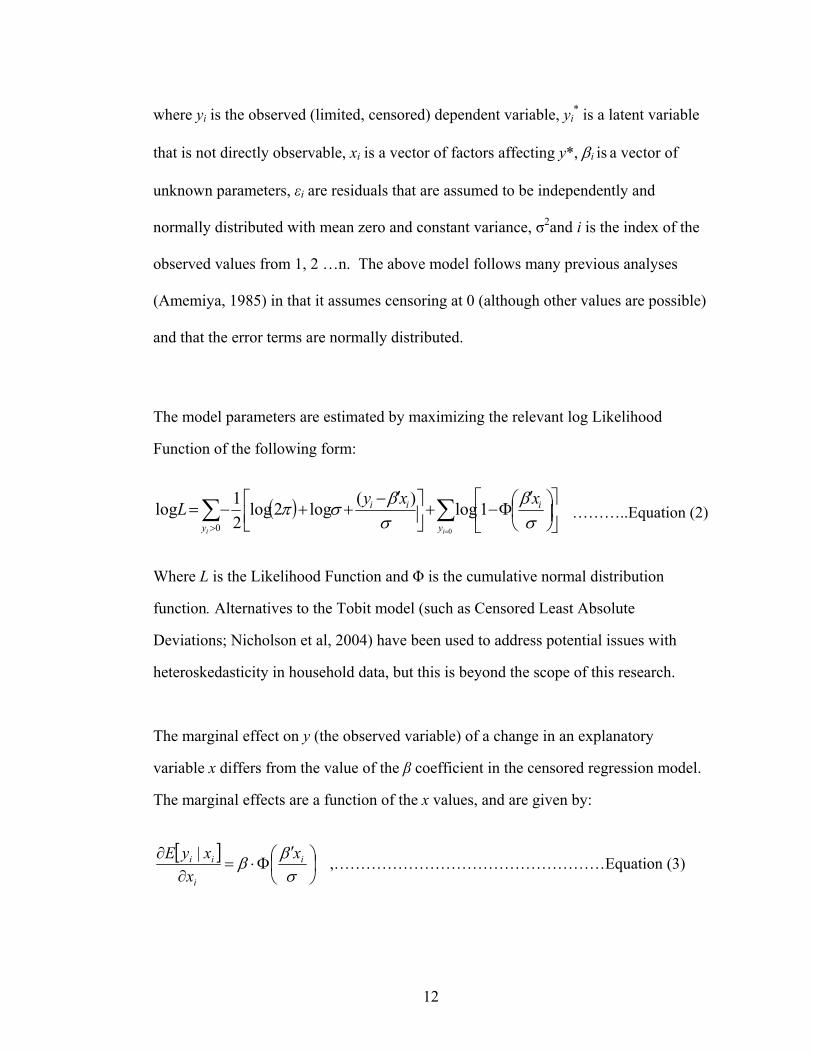
where yi is the observed (limited, censored) dependent variable, yi* is a latent variable
that is not directly observable, xi is a vector of factors affecting y*, βi is a vector of
unknown parameters, εi are residuals that are assumed to be independently and
normally distributed with mean zero and constant variance, σ2and i is the index of the
observed values from 1, 2 …n. The above model follows many previous analyses
(Amemiya, 1985) in that it assumes censoring at 0 (although other values are possible)
and that the error terms are normally distributed.
The model parameters are estimated by maximizing the relevant log Likelihood
Function of the following form:
………..Equation (
2)
here L is the Likelihood Function and Φ is the cumulative normal distribution
with
he marginal effect on y (the observed variable) of a change in an explanatory
odel.
…………………………………………Equation (3)
( )∑ ∑> =
⎥⎦
⎤⎢⎣
⎡⎟⎠⎞
⎜⎝⎛ ′
Φ−+⎥⎦⎤
⎢⎣⎡ ′−
++−=0 0
1log)(log2log21log
i iy y
iii xxyLσβ
σβσπ
W
function. Alternatives to the Tobit model (such as Censored Least Absolute
Deviations; Nicholson et al, 2004) have been used to address potential issues
heteroskedasticity in household data, but this is beyond the scope of this research.
T
variable x differs from the value of the β coefficient in the censored regression m
The marginal effects are a function of the x values, and are given by:
[ ]
,…⎟⎞
⎜⎛ ′
Φ⋅=∂ ββ iii xxyE |
⎠⎝∂ σix
12
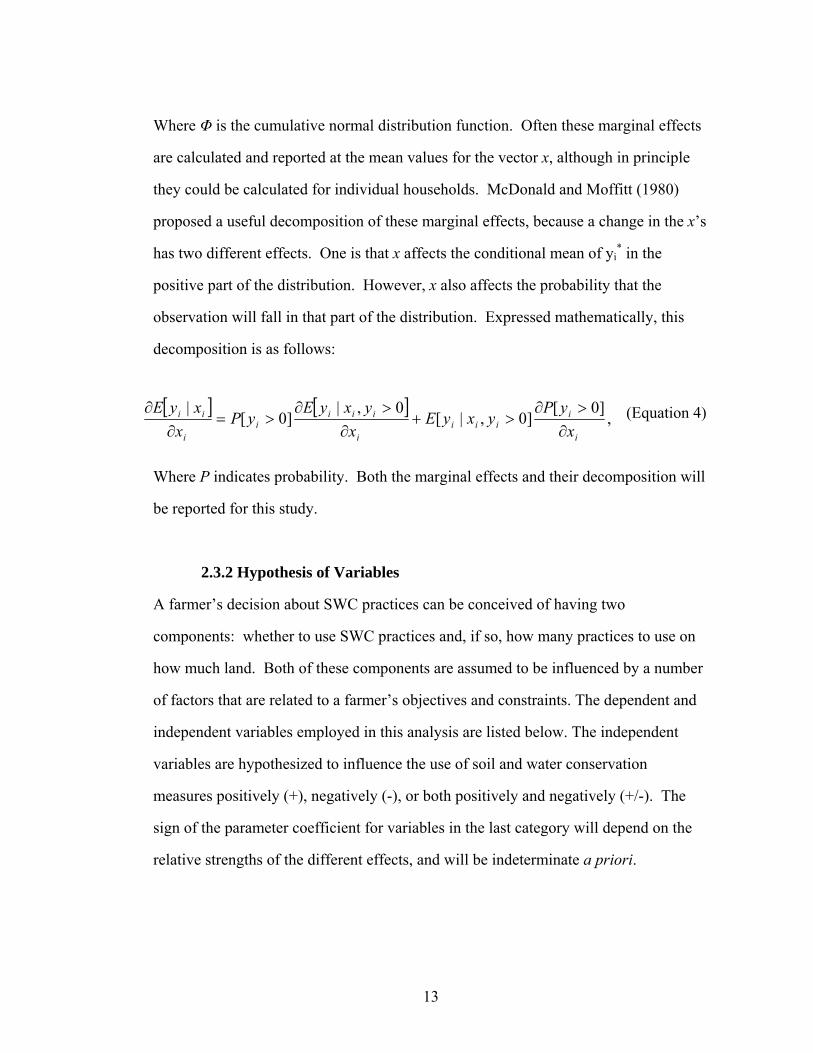
Where Φ is the cumulative normal distribution function. Often these marginal effects
are calculated and reported at the mean values for the vector x, although in principle
they could be calculated for individual households. McDonald and Moffitt (1980)
proposed a useful decomposition of these marginal effects, because a change in the x’s
has two different effects. One is that x affects the conditional mean of yi* in the
positive part of the distribution. However, x also affects the probability that the
observation will fall in that part of the distribution. Expressed mathematically, this
decomposition is as follows:
[ ] [ ],
]0[]0,|[
0,|]0[
|
i
iiii
i
iiii
i
ii
xyP
yxyEx
yxyEyP
xxyE
∂>∂
>+∂
>∂>=
∂∂ (Equation 4)
Where P indicates probability. Both the marginal effects and their decomposition will
be reported for this study.
2.3.2 Hypothesis of Variables
A farmer’s decision about SWC practices can be conceived of having two
components: whether to use SWC practices and, if so, how many practices to use on
how much land. Both of these components are assumed to be influenced by a number
of factors that are related to a farmer’s objectives and constraints. The dependent and
independent variables employed in this analysis are listed below. The independent
variables are hypothesized to influence the use of soil and water conservation
measures positively (+), negatively (-), or both positively and negatively (+/-). The
sign of the parameter coefficient for variables in the last category will depend on the
relative strengths of the different effects, and will be indeterminate a priori.
13
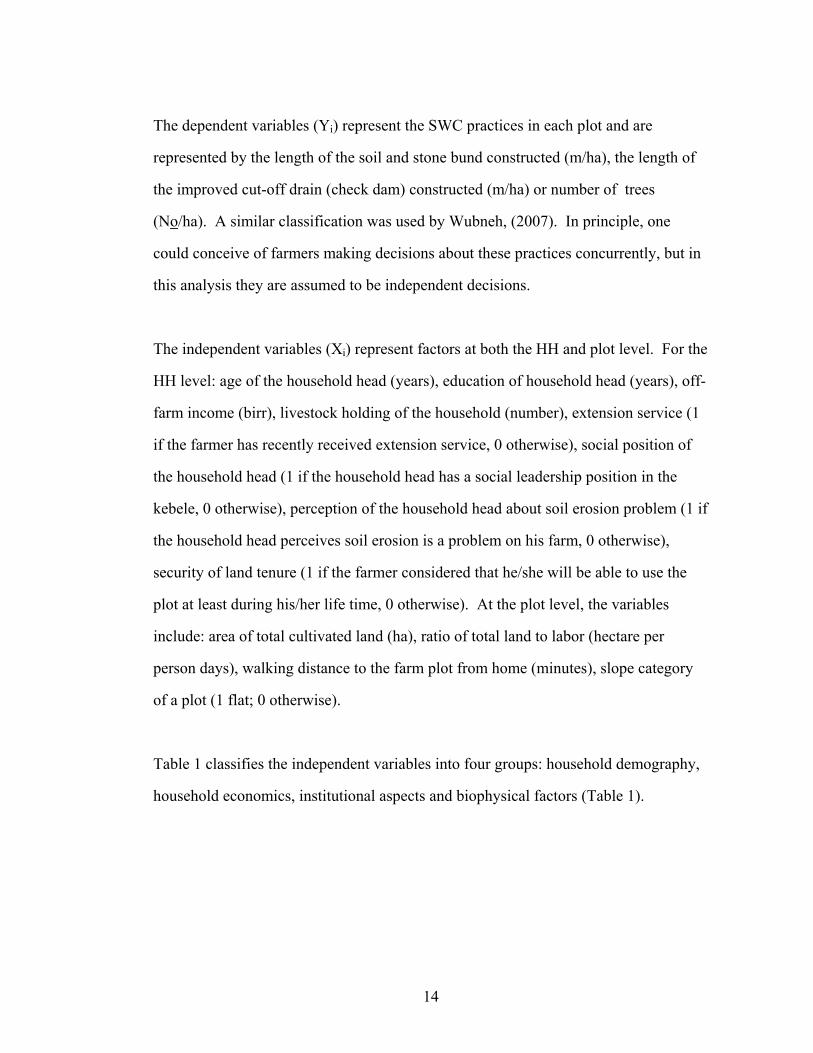
The dependent variables (Yi) represent the SWC practices in each plot and are
represented by the length of the soil and stone bund constructed (m/ha), the length of
the improved cut-off drain (check dam) constructed (m/ha) or number of trees
(No/ha). A similar classification was used by Wubneh, (2007). In principle, one
could conceive of farmers making decisions about these practices concurrently, but in
this analysis they are assumed to be independent decisions.
The independent variables (Xi) represent factors at both the HH and plot level. For the
HH level: age of the household head (years), education of household head (years), off-
farm income (birr), livestock holding of the household (number), extension service (1
if the farmer has recently received extension service, 0 otherwise), social position of
the household head (1 if the household head has a social leadership position in the
kebele, 0 otherwise), perception of the household head about soil erosion problem (1 if
the household head perceives soil erosion is a problem on his farm, 0 otherwise),
security of land tenure (1 if the farmer considered that he/she will be able to use the
plot at least during his/her life time, 0 otherwise). At the plot level, the variables
include: area of total cultivated land (ha), ratio of total land to labor (hectare per
person days), walking distance to the farm plot from home (minutes), slope category
of a plot (1 flat; 0 otherwise).
Table 1 classifies the independent variables into four groups: household demography,
household economics, institutional aspects and biophysical factors (Table 1).
14
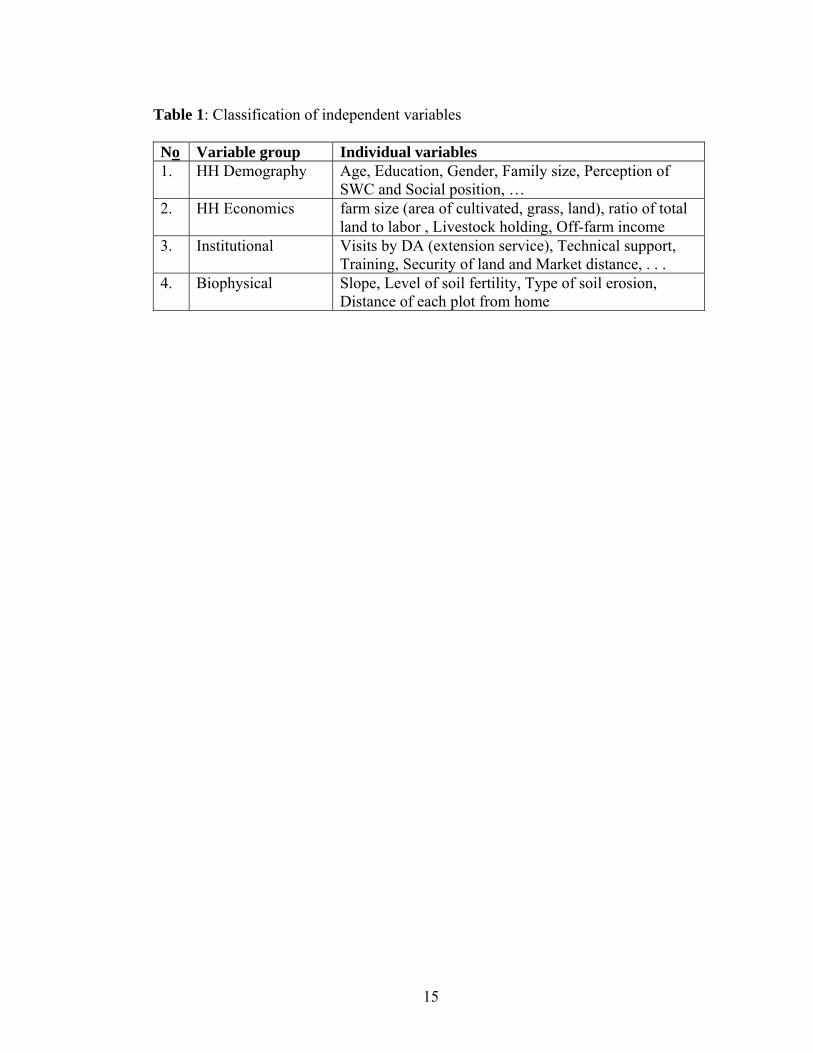
Table 1: Classification of independent variables No Variable group Individual variables 1. HH Demography Age, Education, Gender, Family size, Perception of
SWC and Social position, … 2. HH Economics farm size (area of cultivated, grass, land), ratio of total
land to labor , Livestock holding, Off-farm income 3. Institutional Visits by DA (extension service), Technical support,
Training, Security of land and Market distance, . . . 4. Biophysical Slope, Level of soil fertility, Type of soil erosion,
Distance of each plot from home
15

CHAPTER THREE
3. RESULTS AND DISCUSSION
3.1. Descriptive Analysis
This chapter presents the survey data and interpretation of the analytical findings. Of
the 100 sample respondents all reported that they have participated in the adoption of
some soil and water conservation activities. However, the degree of adoption differs
widely between households.
3.1.1 Demographic Characteristics
Household size and characteristics are directly related to the supply and demand
conditions for basic human needs, such as food, shelter, health and educational
facilities which in turn directly or indirectly influence the adoption of improved SWC
technologies for a farming system. From the sample of 100 HH, the result indicates
that 79% of the heads of household are male. These household heads include a wide
range of people: village elders, decision makers (local administration), younger
people, older people, poor farmers and rich farmers (Table 2).
Table 2: Characteristics of farm plots, related households and their heads
Description No of observations Min. Max. Mean Std.
Deviation Education of HH head (years)
100 0 8 0.62 1.4
Age of HH head (years) 100 25 78 41.1 11.0 Family size 100 3 12 6.5 2.1 Area per plot (ha) 282 0 2 0.67 0.43 Distance of plot from home (walking minutes)
282 0 120 23.9 29.3
Distance of home to market (minutes)
100 10 300 86.9 58.3
Livestock holding in TLU 100 0 18.8 3.2 2.8
16
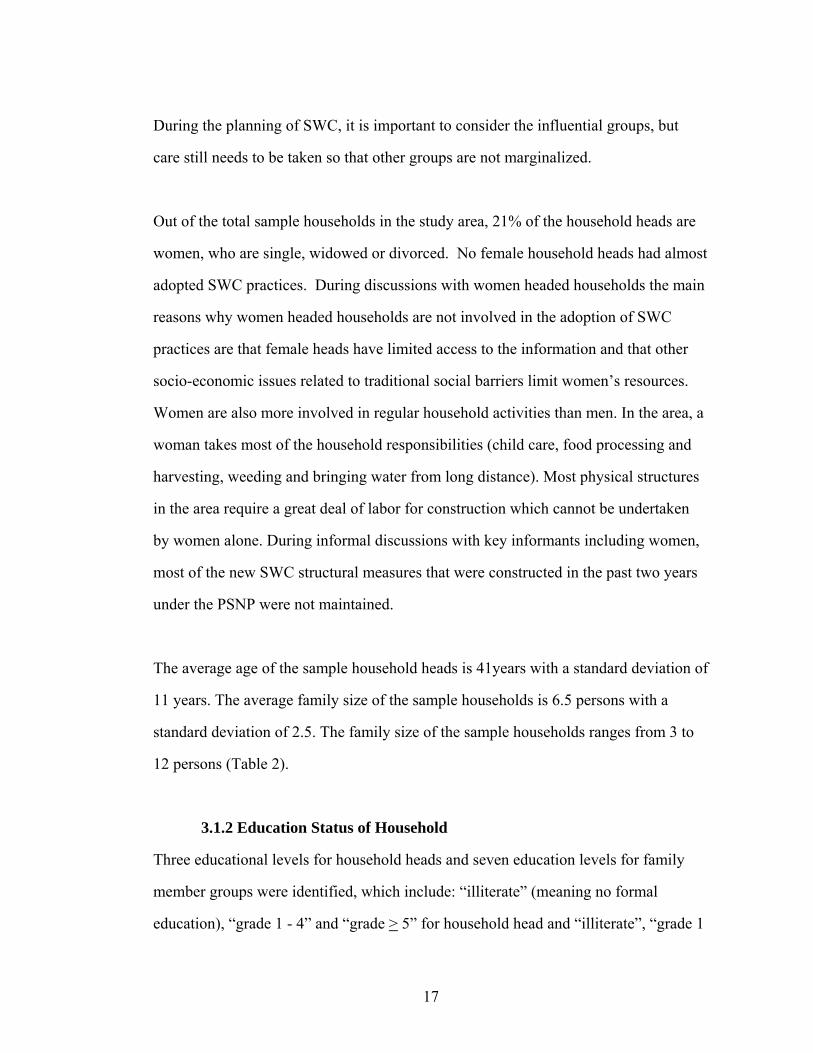
During the planning of SWC, it is important to consider the influential groups, but
care still needs to be taken so that other groups are not marginalized.
Out of the total sample households in the study area, 21% of the household heads are
women, who are single, widowed or divorced. No female household heads had almost
adopted SWC practices. During discussions with women headed households the main
reasons why women headed households are not involved in the adoption of SWC
practices are that female heads have limited access to the information and that other
socio-economic issues related to traditional social barriers limit women’s resources.
Women are also more involved in regular household activities than men. In the area, a
woman takes most of the household responsibilities (child care, food processing and
harvesting, weeding and bringing water from long distance). Most physical structures
in the area require a great deal of labor for construction which cannot be undertaken
by women alone. During informal discussions with key informants including women,
most of the new SWC structural measures that were constructed in the past two years
under the PSNP were not maintained.
The average age of the sample household heads is 41years with a standard deviation of
11 years. The average family size of the sample households is 6.5 persons with a
standard deviation of 2.5. The family size of the sample households ranges from 3 to
12 persons (Table 2).
3.1.2 Education Status of Household
Three educational levels for household heads and seven education levels for family
member groups were identified, which include: “illiterate” (meaning no formal
education), “grade 1 - 4” and “grade > 5” for household head and “illiterate”, “grade 1
17
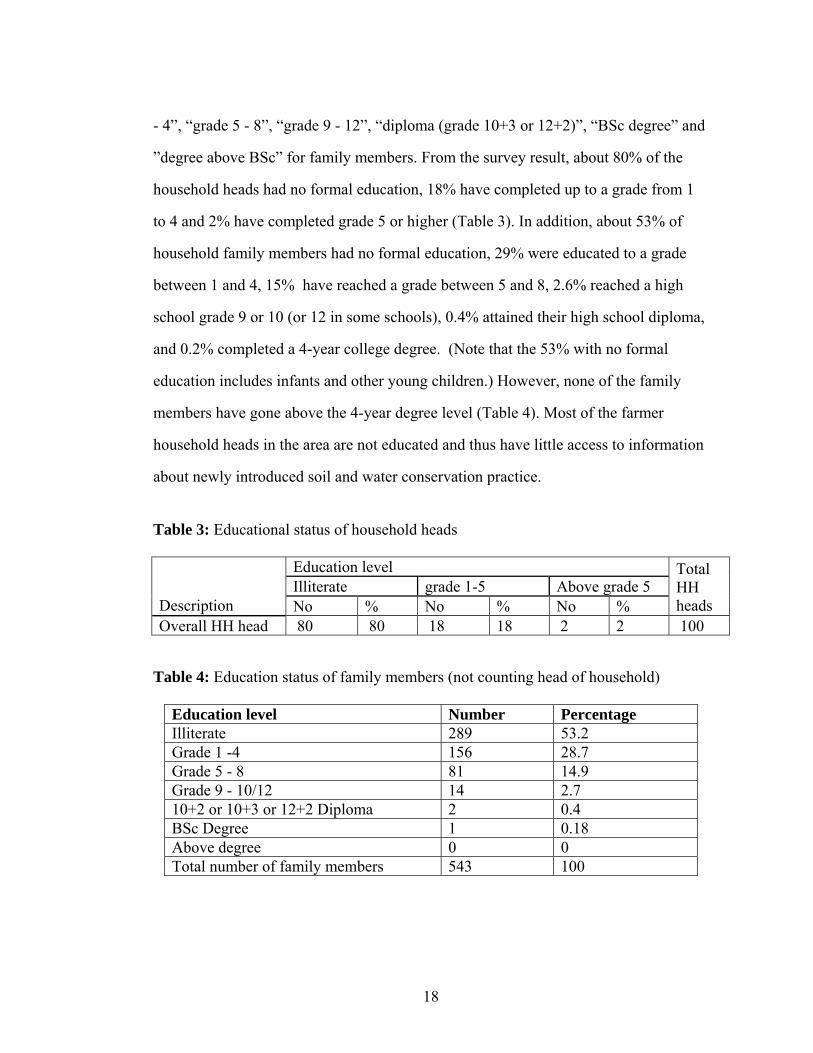
- 4”, “grade 5 - 8”, “grade 9 - 12”, “diploma (grade 10+3 or 12+2)”, “BSc degree” and
”degree above BSc” for family members. From the survey result, about 80% of the
household heads had no formal education, 18% have completed up to a grade from 1
to 4 and 2% have completed grade 5 or higher (Table 3). In addition, about 53% of
household family members had no formal education, 29% were educated to a grade
between 1 and 4, 15% have reached a grade between 5 and 8, 2.6% reached a high
school grade 9 or 10 (or 12 in some schools), 0.4% attained their high school diploma,
and 0.2% completed a 4-year college degree. (Note that the 53% with no formal
education includes infants and other young children.) However, none of the family
members have gone above the 4-year degree level (Table 4). Most of the farmer
household heads in the area are not educated and thus have little access to information
about newly introduced soil and water conservation practice.
Table 3: Educational status of household heads
Education level Illiterate grade 1-5 Above grade 5
Description No % No % No %
Total HH heads
Overall HH head 80 80 18 18 2 2 100
Table 4: Education status of family members (not counting head of household)
Education level Number PercentageIlliterate 289 53.2 Grade 1 -4 156 28.7 Grade 5 - 8 81 14.9 Grade 9 - 10/12 14 2.7 10+2 or 10+3 or 12+2 Diploma 2 0.4 BSc Degree 1 0.18 Above degree 0 0 Total number of family members 543 100
18
From the survey results, better-educated households have more realistic perceptions
about soil erosion problems and more knowledge related to SWC and hence can more
easily be involved in conservation activities. From discussion with key informants,
with respect to educational status of households in relation to their location within the
watershed, downstream farmers are better educated than upstream farmers of the Koga
watershed because the downstream area is close to the Woreda town, Merawi, where
more schools are available.
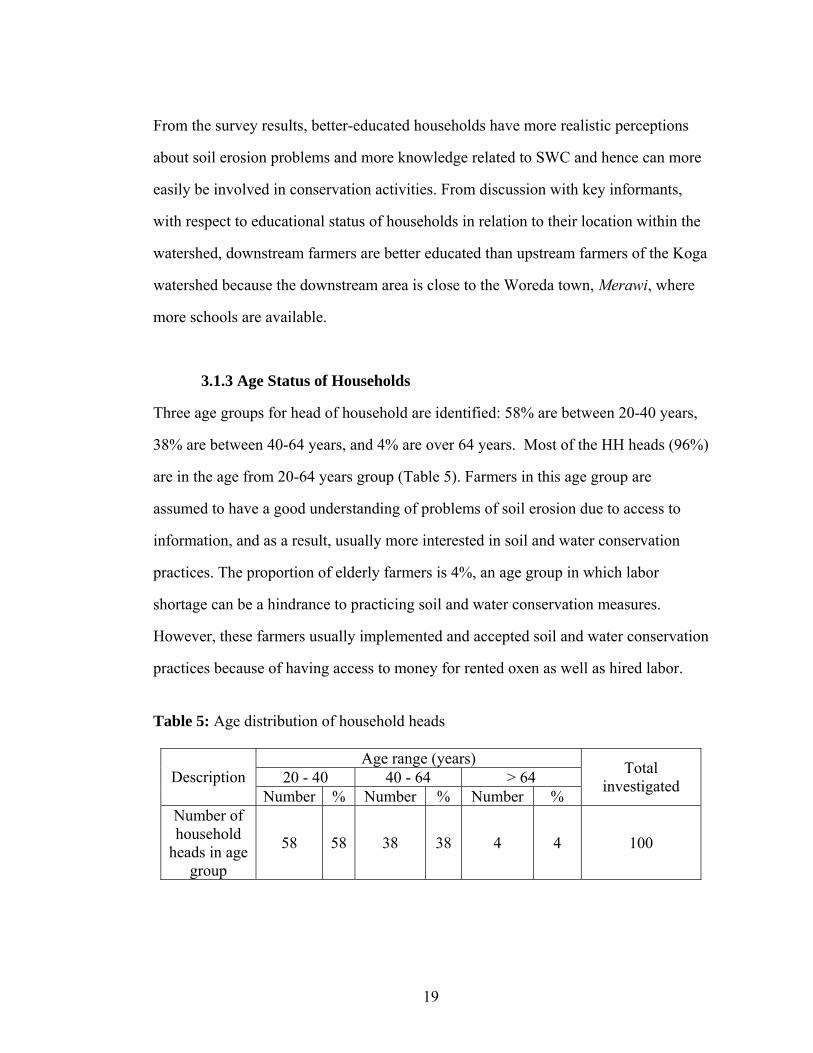
3.1.3 Age Status of Households
Three age groups for head of household are identified: 58% are between 20-40 years,
38% are between 40-64 years, and 4% are over 64 years. Most of the HH heads (96%)
are in the age from 20-64 years group (Table 5). Farmers in this age group are
assumed to have a good understanding of problems of soil erosion due to access to
information, and as a result, usually more interested in soil and water conservation
practices. The proportion of elderly farmers is 4%, an age group in which labor
shortage can be a hindrance to practicing soil and water conservation measures.
However, these farmers usually implemented and accepted soil and water conservation
practices because of having access to money for rented oxen as well as hired labor.
Table 5: Age distribution of household heads
Age range (years) 20 - 40 40 - 64 > 64 Description
Number % Number % Number %
Total investigated
Number of household
heads in age group
58 58 38 38 4 4 100
19
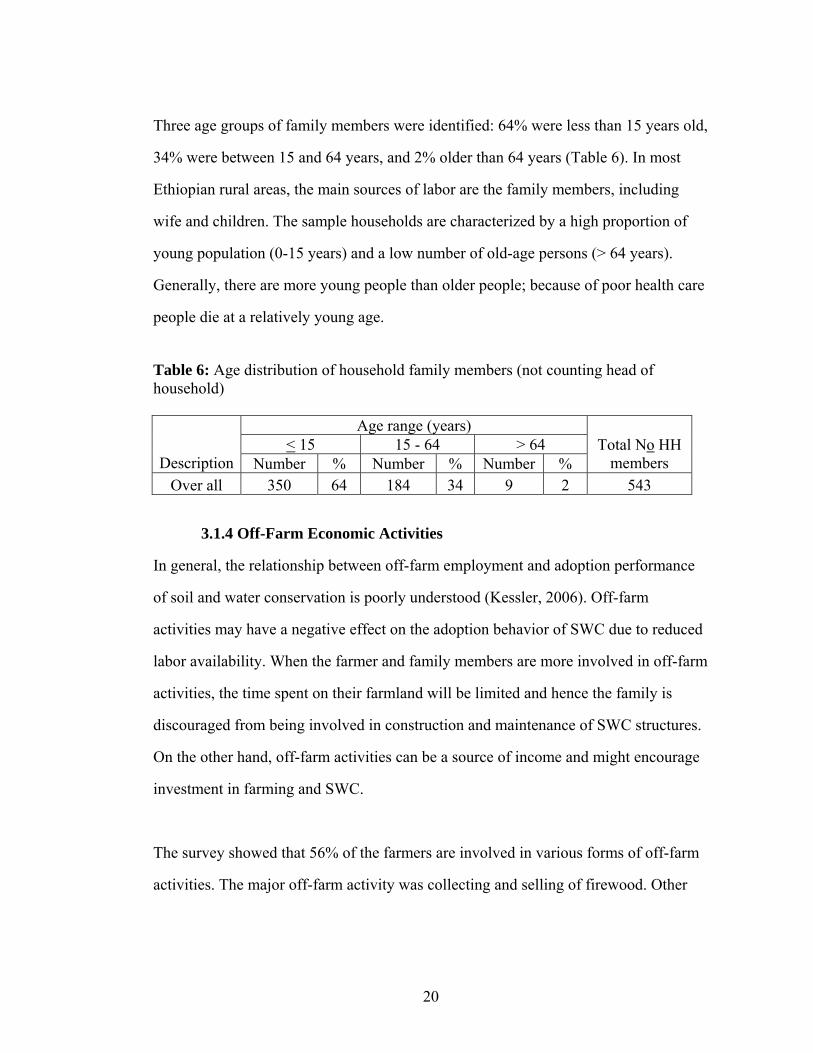
Three age groups of family members were identified: 64% were less than 15 years old,
34% were between 15 and 64 years, and 2% older than 64 years (Table 6). In most
Ethiopian rural areas, the main sources of labor are the family members, including
wife and children. The sample households are characterized by a high proportion of
young population (0-15 years) and a low number of old-age persons (> 64 years).
Generally, there are more young people than older people; because of poor health care
people die at a relatively young age.
Table 6: Age distribution of household family members (not counting head of household)
Age range (years) < 15 15 - 64 > 64
Description Number % Number % Number % Total No HH
members Over all 350 64 184 34 9 2 543
3.1.4 Off-Farm Economic Activities
In general, the relationship between off-farm employment and adoption performance
of soil and water conservation is poorly understood (Kessler, 2006). Off-farm
activities may have a negative effect on the adoption behavior of SWC due to reduced
labor availability. When the farmer and family members are more involved in off-farm
activities, the time spent on their farmland will be limited and hence the family is
discouraged from being involved in construction and maintenance of SWC structures.
On the other hand, off-farm activities can be a source of income and might encourage
investment in farming and SWC.
The survey showed that 56% of the farmers are involved in various forms of off-farm
activities. The major off-farm activity was collecting and selling of firewood. Other
20

activities were petty trade, pottery, weaving, leather making, labor hired out and rental
of a local “Gary” for transportation.
3.1.5 Perception and Attitude of Farmers
Perception of soil erosion as a hazard to agricultural production and sustainable
agriculture is the most important determinant of effort at adoption of conservation
measures. Theoretically, those farmers who perceive soil erosion as a problem having
negative impacts on productivity and who expect positive returns from conservation
are likely to decide in favor of adopting available conservation technologies
(Semgalawe and Folmer, 2000; Gebremedhin and Swinton, 2003). On the other hand,
when farmers do not acknowledge soil erosion as a problem, they will not expect
benefits from controlling erosion and it is highly likely that they will decide against
adopting any conservation technologies.
Thirty six percent of the sample farmers believed that overgrazing was the most
important cause of soil erosion followed by 24% of the farmers who considered that
deforestation caused the most erosion. Interestingly, only 12% found that cultivation
of steeply sloping land was the most important cause (Table 7). This finding is
consistent with findings in the Debre Mewi watershed by fellow student Tigist (2009),
in which gully erosion in the overgrazed area was the source of most of the soil loss.
Tigist found that gully development started when the watershed was being deforested.
Thus findings in both areas stand in contrast to the common belief by outsiders that
steep lands are the main cause of erosion.
21
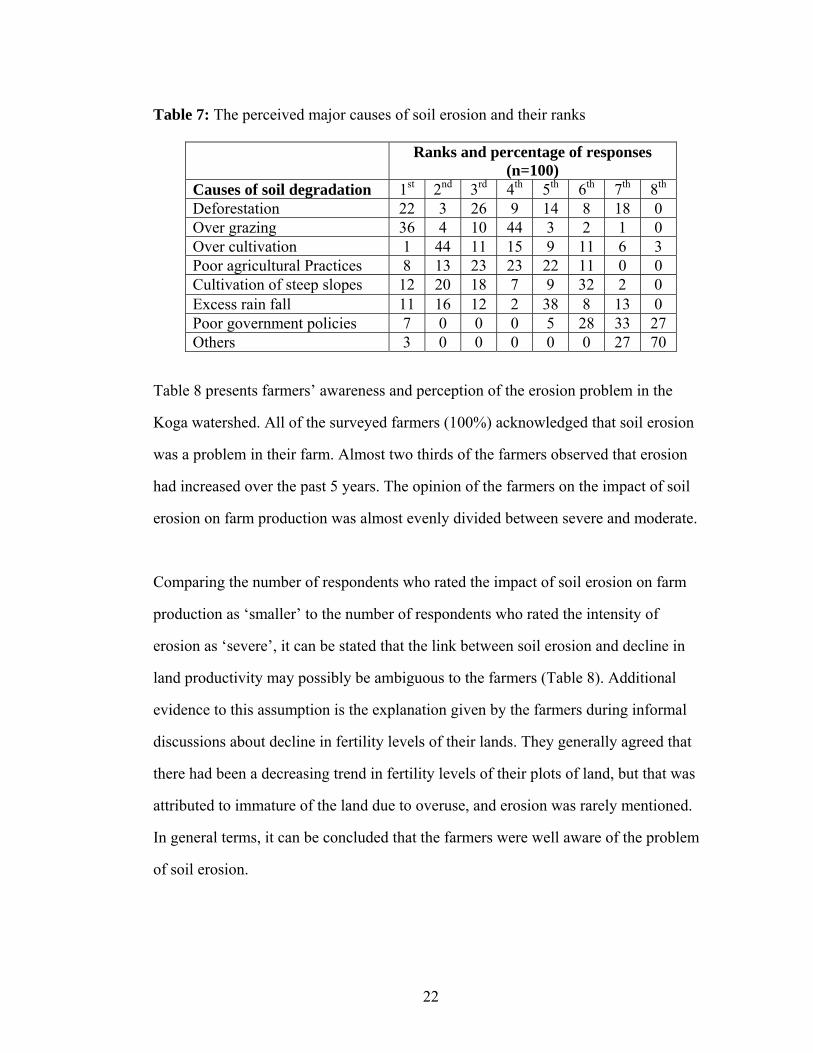
Table 7: The perceived major causes of soil erosion and their ranks
Ranks and percentage of responses (n=100)
Causes of soil degradation 1st 2nd 3rd 4th 5th 6th 7th 8th
Deforestation 22 3 26 9 14 8 18 0 Over grazing 36 4 10 44 3 2 1 0 Over cultivation 1 44 11 15 9 11 6 3 Poor agricultural Practices 8 13 23 23 22 11 0 0 Cultivation of steep slopes 12 20 18 7 9 32 2 0 Excess rain fall 11 16 12 2 38 8 13 0 Poor government policies 7 0 0 0 5 28 33 27 Others 3 0 0 0 0 0 27 70
Table 8 presents farmers’ awareness and perception of the erosion problem in the
Koga watershed. All of the surveyed farmers (100%) acknowledged that soil erosion
was a problem in their farm. Almost two thirds of the farmers observed that erosion
had increased over the past 5 years. The opinion of the farmers on the impact of soil
erosion on farm production was almost evenly divided between severe and moderate.
Comparing the number of respondents who rated the impact of soil erosion on farm
production as ‘smaller’ to the number of respondents who rated the intensity of
erosion as ‘severe’, it can be stated that the link between soil erosion and decline in
land productivity may possibly be ambiguous to the farmers (Table 8). Additional
evidence to this assumption is the explanation given by the farmers during informal
discussions about decline in fertility levels of their lands. They generally agreed that
there had been a decreasing trend in fertility levels of their plots of land, but that was
attributed to immature of the land due to overuse, and erosion was rarely mentioned.
In general terms, it can be concluded that the farmers were well aware of the problem
of soil erosion.
22
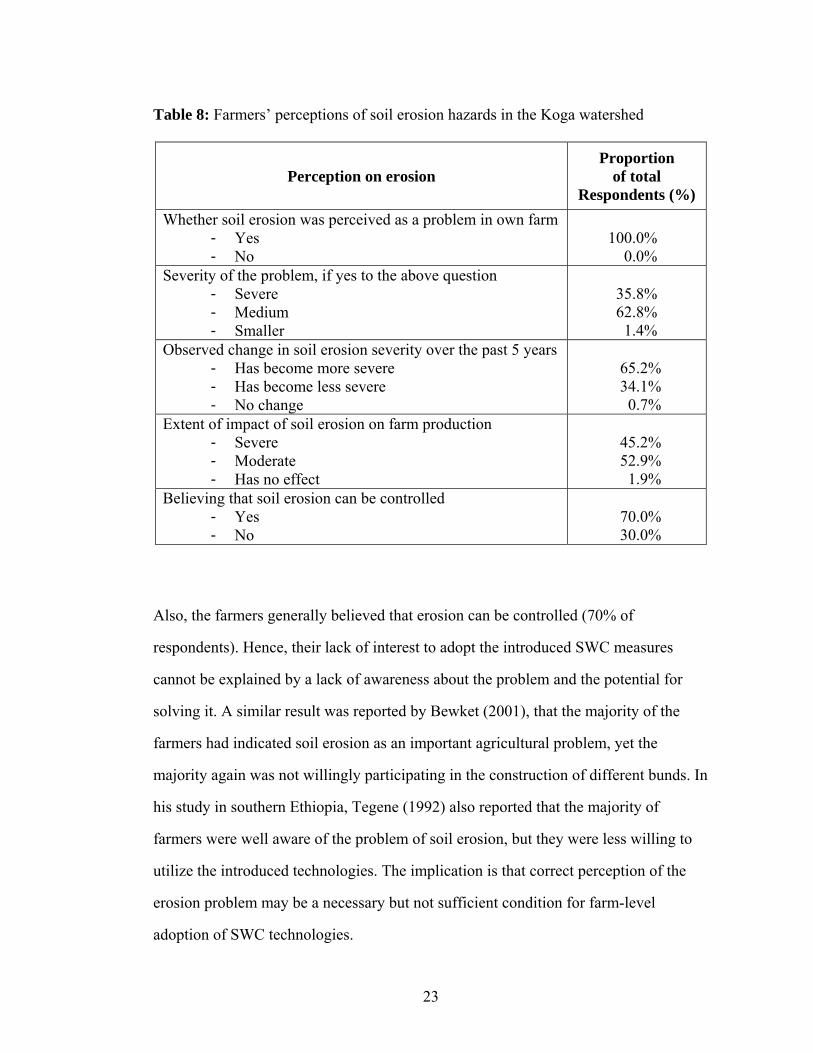
Table 8: Farmers’ perceptions of soil erosion hazards in the Koga watershed
Perception on erosion Proportion
of total Respondents (%)
Whether soil erosion was perceived as a problem in own farm - Yes - No
100.0% 0.0%
Severity of the problem, if yes to the above question - Severe - Medium - Smaller
35.8% 62.8% 1.4%
Observed change in soil erosion severity over the past 5 years - Has become more severe - Has become less severe - No change
65.2% 34.1% 0.7%
Extent of impact of soil erosion on farm production - Severe - Moderate - Has no effect
45.2% 52.9% 1.9%
Believing that soil erosion can be controlled - Yes - No
70.0% 30.0%
Also, the farmers generally believed that erosion can be controlled (70% of
respondents). Hence, their lack of interest to adopt the introduced SWC measures
cannot be explained by a lack of awareness about the problem and the potential for
solving it. A similar result was reported by Bewket (2001), that the majority of the
farmers had indicated soil erosion as an important agricultural problem, yet the
majority again was not willingly participating in the construction of different bunds. In
his study in southern Ethiopia, Tegene (1992) also reported that the majority of
farmers were well aware of the problem of soil erosion, but they were less willing to
utilize the introduced technologies. The implication is that correct perception of the
erosion problem may be a necessary but not sufficient condition for farm-level
adoption of SWC technologies.
23
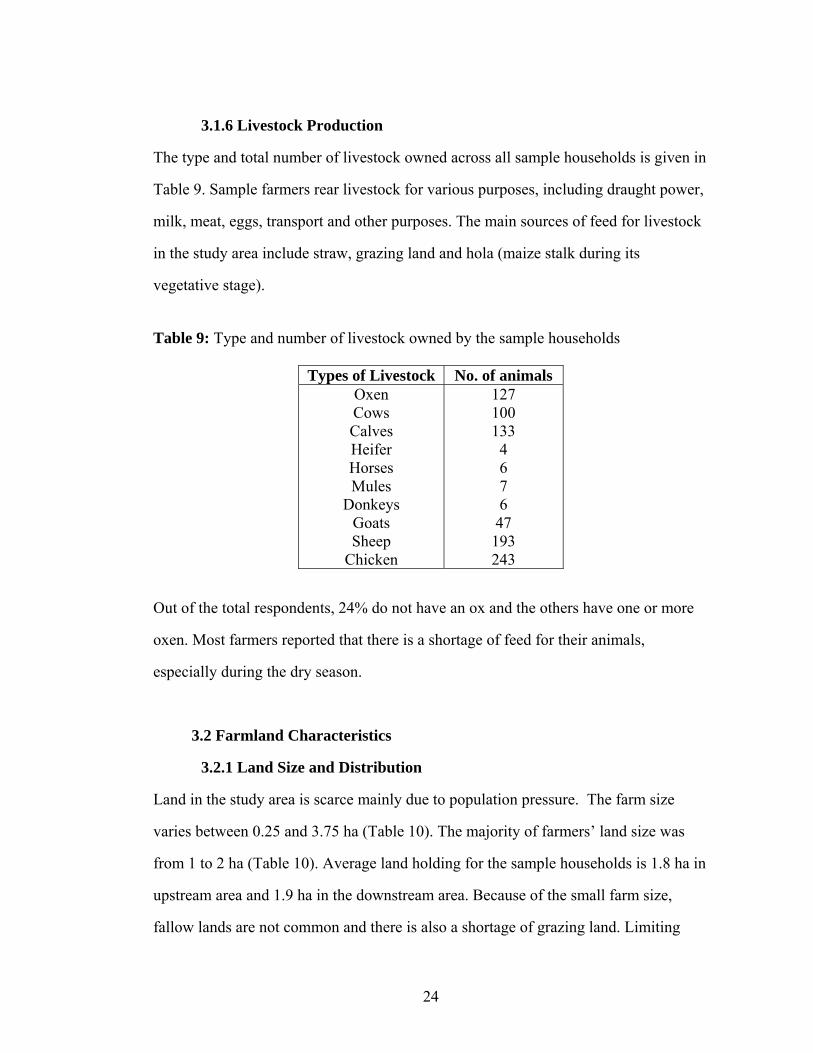
3.1.6 Livestock Production
The type and total number of livestock owned across all sample households is given in
Table 9. Sample farmers rear livestock for various purposes, including draught power,
milk, meat, eggs, transport and other purposes. The main sources of feed for livestock
in the study area include straw, grazing land and hola (maize stalk during its
vegetative stage).
Table 9: Type and number of livestock owned by the sample households
Types of Livestock No. of animals Oxen Cows Calves Heifer Horses Mules
Donkeys Goats Sheep
Chicken
127 100 133 4 6 7 6 47 193 243
Out of the total respondents, 24% do not have an ox and the others have one or more
oxen. Most farmers reported that there is a shortage of feed for their animals,
especially during the dry season.
3.2 Farmland Characteristics
3.2.1 Land Size and Distribution
Land in the study area is scarce mainly due to population pressure. The farm size
varies between 0.25 and 3.75 ha (Table 10). The majority of farmers’ land size was
from 1 to 2 ha (Table 10). Average land holding for the sample households is 1.8 ha in
upstream area and 1.9 ha in the downstream area. Because of the small farm size,
fallow lands are not common and there is also a shortage of grazing land. Limiting
24
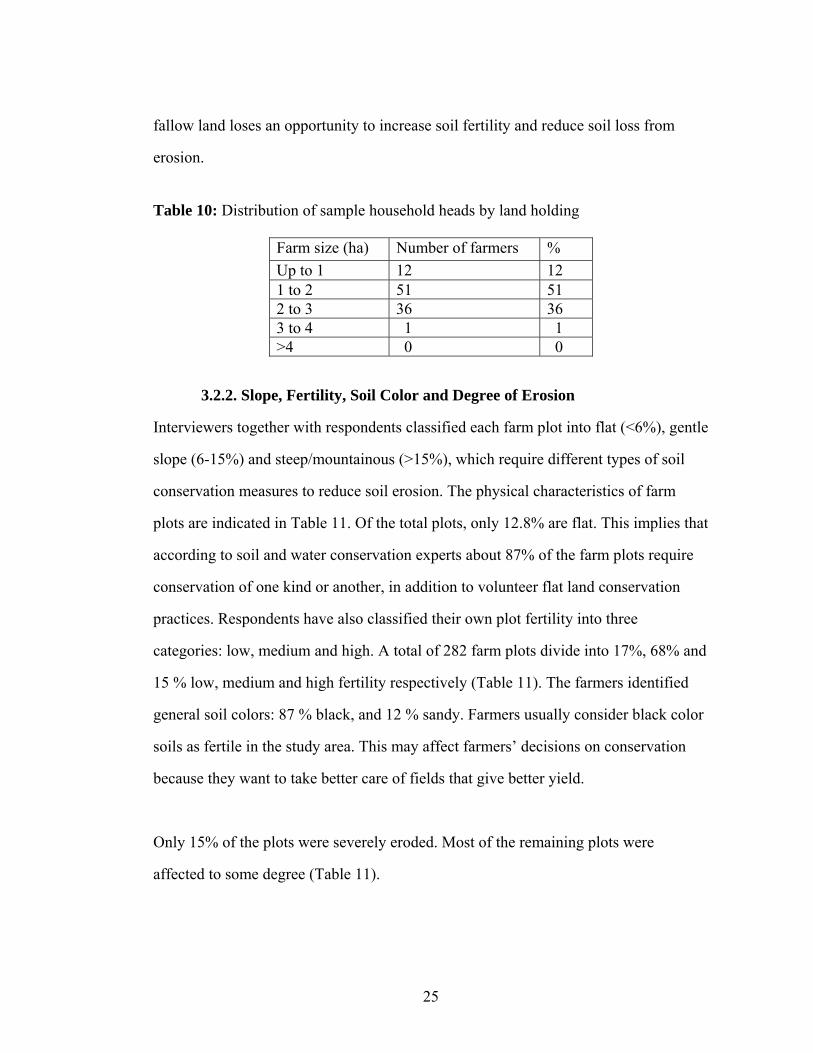
fallow land loses an opportunity to increase soil fertility and reduce soil loss from
erosion.
Table 10: Distribution of sample household heads by land holding
Farm size (ha) Number of farmers % Up to 1 12 12 1 to 2 51 51 2 to 3 36 36 3 to 4 1 1 >4 0 0
3.2.2. Slope, Fertility, Soil Color and Degree of Erosion
Interviewers together with respondents classified each farm plot into flat (<6%), gentle
slope (6-15%) and steep/mountainous (>15%), which require different types of soil
conservation measures to reduce soil erosion. The physical characteristics of farm
plots are indicated in Table 11. Of the total plots, only 12.8% are flat. This implies that
according to soil and water conservation experts about 87% of the farm plots require
conservation of one kind or another, in addition to volunteer flat land conservation
practices. Respondents have also classified their own plot fertility into three
categories: low, medium and high. A total of 282 farm plots divide into 17%, 68% and
15 % low, medium and high fertility respectively (Table 11). The farmers identified
general soil colors: 87 % black, and 12 % sandy. Farmers usually consider black color
soils as fertile in the study area. This may affect farmers’ decisions on conservation
because they want to take better care of fields that give better yield.
Only 15% of the plots were severely eroded. Most of the remaining plots were
affected to some degree (Table 11).
25

Table 11: Distribution of farm plots by slope category, level of fertility, soil color and degree of erosion
Number of plots Description Frequency % Flat (< 6%) 36 12.8 Gentle (6 - 15%) 200 70.9 Slope category Steep/mountainous (>15%) 46 16.3 Low 48 17 Medium 191 67.7 Fertility High 43 15.3 Red 0 0 Black 246 87.2 Brown 0 0
Soil color
Sandy 33 11.8 Low 7 2.4 Medium 234 83 Degree of erosion High 41 14.6
3.2.3 Distance between home and farmland
It has been found that distance between the farmland and a homestead is an important
factor in the adoption behavior of soil and water conservation. In the study area the
average walking time from the homestead to the farm land is 24 minutes. The
scattered and far away fields are one of the factors that discourage farmers from
adopting SWC measures. Shiferaw and Holden (1998) found that some farmers
undertake SWC work during the evening, making it difficult to go to the fields that are
located far from the home.
Regarding ownership and sources of farmland, the survey result showed that more
than 85.9% of the plots are inherited from family. Almost 10% of the fields were
distributed by village (kebele) leaders and nearly 5% of the fields were either rented or
newly purchased by the current farmer (Table 12).
26
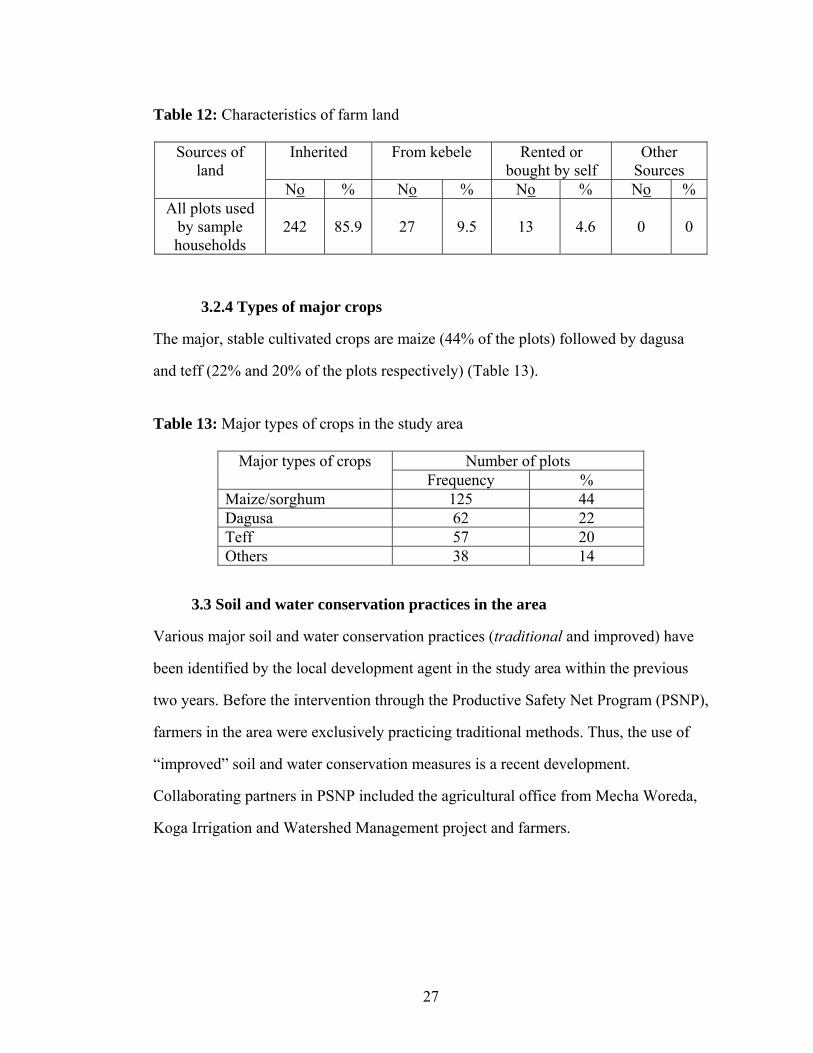
Table 12: Characteristics of farm land
Inherited From kebele Rented or bought by self
Other Sources
Sources of land
No % No % No % No % All plots used
by sample households
242 85.9 27 9.5 13 4.6 0 0
3.2.4 Types of major crops
The major, stable cultivated crops are maize (44% of the plots) followed by dagusa
and teff (22% and 20% of the plots respectively) (Table 13).
Table 13: Major types of crops in the study area
Number of plots Major types of crops Frequency %
Maize/sorghum 125 44 Dagusa 62 22 Teff 57 20 Others 38 14
3.3 Soil and water conservation practices in the area
Various major soil and water conservation practices (traditional and improved) have
been identified by the local development agent in the study area within the previous
two years. Before the intervention through the Productive Safety Net Program (PSNP),
farmers in the area were exclusively practicing traditional methods. Thus, the use of
“improved” soil and water conservation measures is a recent development.
Collaborating partners in PSNP included the agricultural office from Mecha Woreda,
Koga Irrigation and Watershed Management project and farmers.
27
3.3.1 Traditional and newly introduced SWC practices
Until recently, traditional2 soil and water conservation practices have often been
ignored or underestimated by development agents, researchers, soil and water
conservationists and government staff (IFAD, 1992). However, surveying both
traditional and improved soil and water conservation practices provides an
understanding of farmers' way of thinking about the interventions (Hudson, 1992). To
prevent land degradation, especially soil erosion, in the Koga watershed, farmers use a
number of traditional and improved soil and water conservation technologies. These
technologies include application of manure, traditional and newly introduced cut-off
drains, plantation of both traditional and newly introduced trees, stone bunds, leaving
crop residues in the field and fallowing on the farm.
3.3.1.1 Cut-off drains
The survey results show that almost two thirds of the 282 sampled plots had traditional
or improved cut-off drains (or both)3 (Table 14). The farmers construct these drains to
prevent loss of seeds, fertilizers, manure and soil due to water flowing onto the plot
from uphill. The excess water is disposed away from the field. However, according to
farmer opinions, some of the traditional drain structures enhance soil erosion through
time. Transect walks with the key informants confirmed this, revealing several gullies
between farm boundaries that were started by the cutoff drains. Farmers in the study
2 The traditional soil and water conservation methods refer to practices built upon farmers' indigenous knowledge and experience. They include intensive cultivation, zero-grazing, agro-forestry, forestry (woodlot), furrow irrigation, trash lines, grass strips, minimum tillage, and biological or agronomic methods such as cereal-legume intercropping, rotation and mulching, residues of crop production. 3 Cut off drains are both traditional and newly introduced SWC, one of the physical structures commonly constructed by digging a trench in order to divert the run off before reaching the farmland.
28
area are, therefore, reluctant to install this type of SWC practice. SWC technicians
believe that by better surveying, the performance of the cutoff drains can be improved.
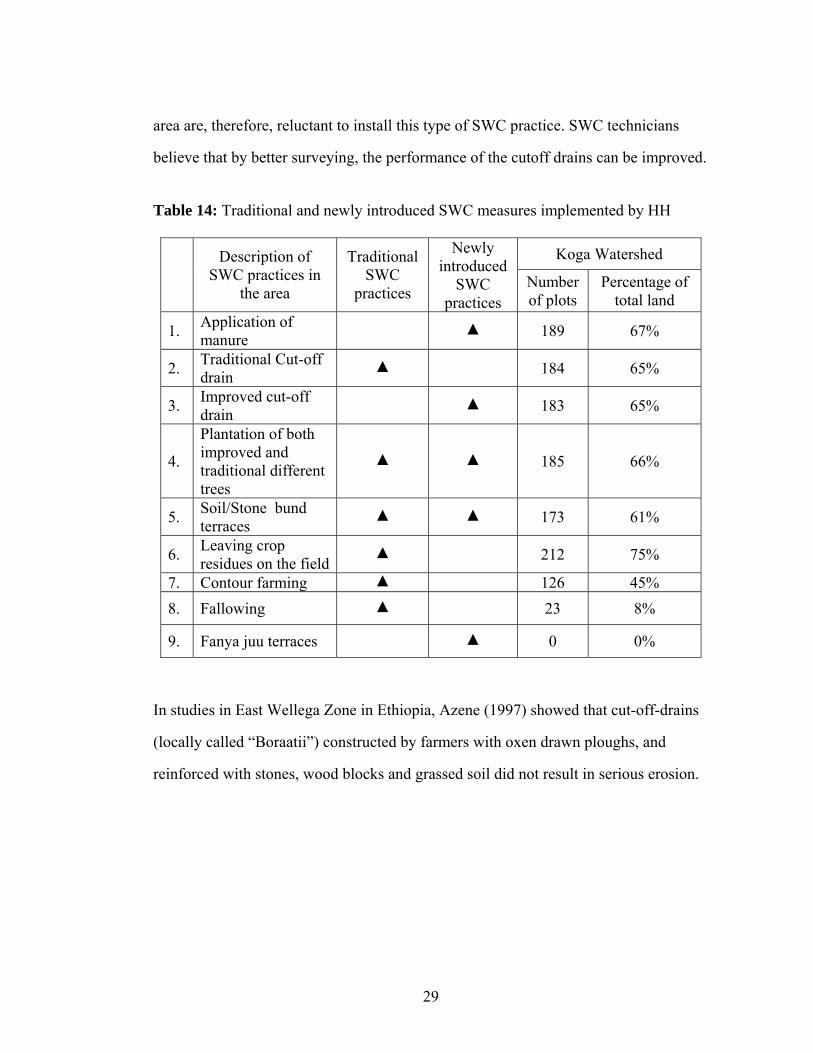
Table 14: Traditional and newly introduced SWC measures implemented by HH
Koga Watershed
Description of SWC practices in
the area
Traditional SWC
practices
Newly introduced
SWC practices
Number of plots
Percentage of total land
1. Application of manure ▲ 189 67%
2. Traditional Cut-off drain
▲ 184 65%
3. Improved cut-off drain ▲ 183 65%
4.
Plantation of both improved and traditional different trees
▲ ▲ 185 66%
5. Soil/Stone bund terraces
▲ ▲ 173 61%
6. Leaving crop residues on the field
▲ 212 75%
7. Contour farming ▲ 126 45% 8. Fallowing ▲ 23 8%
9. Fanya juu terraces ▲ 0 0%
In studies in East Wellega Zone in Ethiopia, Azene (1997) showed that cut-off-drains
(locally called “Boraatii”) constructed by farmers with oxen drawn ploughs, and
reinforced with stones, wood blocks and grassed soil did not result in serious erosion.
29

3.3.1.2 Leaving crop residues
Another traditional practice common in the area is leaving crop residues on the field
after harvest. There are two types of agricultural crop residues: process residues4 and
field residues5. Area farmers are generally not attempting to use crop residues to
improve the fertility of soil. The survey results showed that most of the users are
implementing this measure in order to protect the soil from erosion (Table 14). During
the transect walks with the farmers, there were only small amounts of crop residues
visible in farm plots. Key informants indicated that the farmers had serious fuel wood
and animal feed shortages and therefore gradually used the crop residue for off-plot
purposes.
Most of the farm households in the area, especially women members, collect crop
residues from the field for animal feed and fuel wood. Similarly, research conducted
by Tilahun (1996) found that farmers in Areka removed all crop residues from their
fields and used them in their livestock pen or home garden. Some of the residues from
cereals (wheat, barely and teff) and legumes (haricot beans and pea beans) are stored
in the home compound and sold as fodder or used to feed livestock during the dry
season.
3.3.1.3 Contour farming
Contour farming is a practice of cultivating the land along contours of equal elevation
in order to reduce the runoff on lands with a slope over 6%. It is used alone or in
4 Process residues are those materials left after the processing of the crop into a usable resource. These residues include husks, seeds and roots. Crop residues can be used as animal fodder and soil amendment, and in manufacturing. 5 Field residues are materials left in an agricultural field or orchard after the crop has been harvested. These residues include stalks and stubble (stems), leaves and seed pods. Good management of field residues can increase efficiency of irrigation and control of erosion.
30
combination with other conservation practices such as cut-off drains and plantation of
different trees. (As indicated in Table 14, these two other practices are each used on
two thirds of the surveyed plots.) Of the sampled plots, 45% had contour farming
(Table 14) and although the farmer was aware of the soil and water conservation
function of contour farming. In addition to this, it was implemented during land
preparation before planting season because their ploughs the land for preparing an
appropriate seedbed for production.
3.3.1.4 Fallowing
Fallowing6 is one of the best methods to reduce soil fertility loss (Hudson, 1992). In
the study area, fallowing is restricted to highly degraded lands which cannot be
restored within a short period of time. In most cases only stones are found on these
lands. Only 8% of the surveyed plots were fallowed (Table 14). During discussions
with the farmers it was learned that through time, the traditional fallowing periods are
practiced less and less as a result of the increasing population pressure and decreasing
agricultural productivity.
3.3.1.5 Application of manure
Application of manure was used on more plots than any other conservation practice,
67% of the total (Table 14). Farmers applied manure near the homestead, rather than
to land at a distance.
6 Fallowing is a traditional practice of leaving the land out of production for 3-5 years for the purpose of restoring soil fertility and minimizing soil loss.
31
Based on focus group discussions with key informants, farmers have increased the
amount of manure applied because of the high price of inorganic fertilizers (such as
DAP and UREA) which the farmers cannot afford.
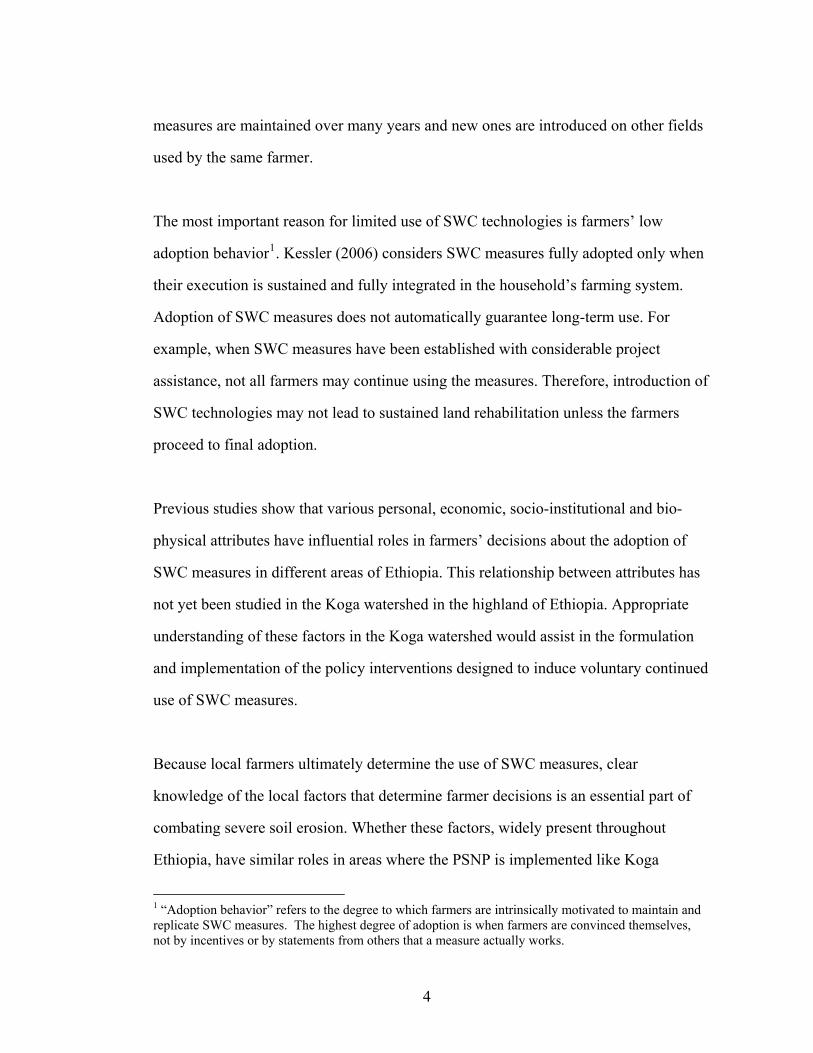
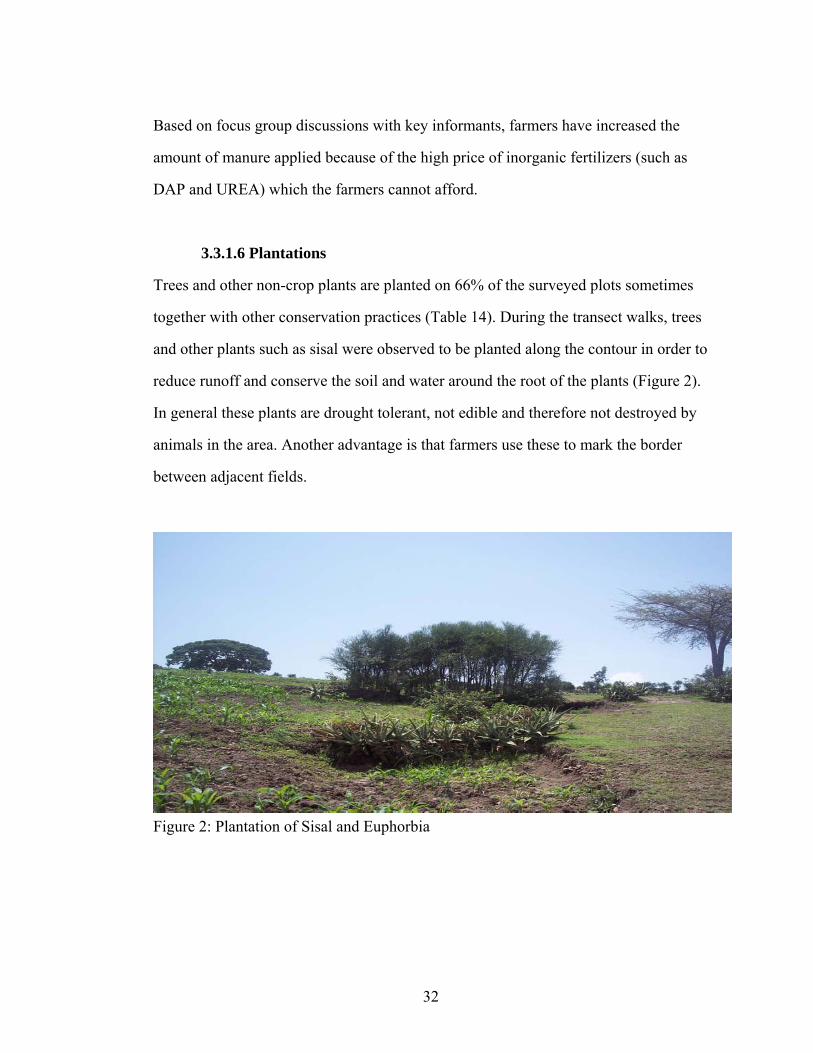
3.3.1.6 Plantations
Trees and other non-crop plants are planted on 66% of the surveyed plots sometimes
together with other conservation practices (Table 14). During the transect walks, trees
and other plants such as sisal were observed to be planted along the contour in order to
reduce runoff and conserve the soil and water around the root of the plants (Figure 2).
In general these plants are drought tolerant, not edible and therefore not destroyed by
animals in the area. Another advantage is that farmers use these to mark the border
between adjacent fields.
Figure 2: Plantation of Sisal and Euphorbia
32
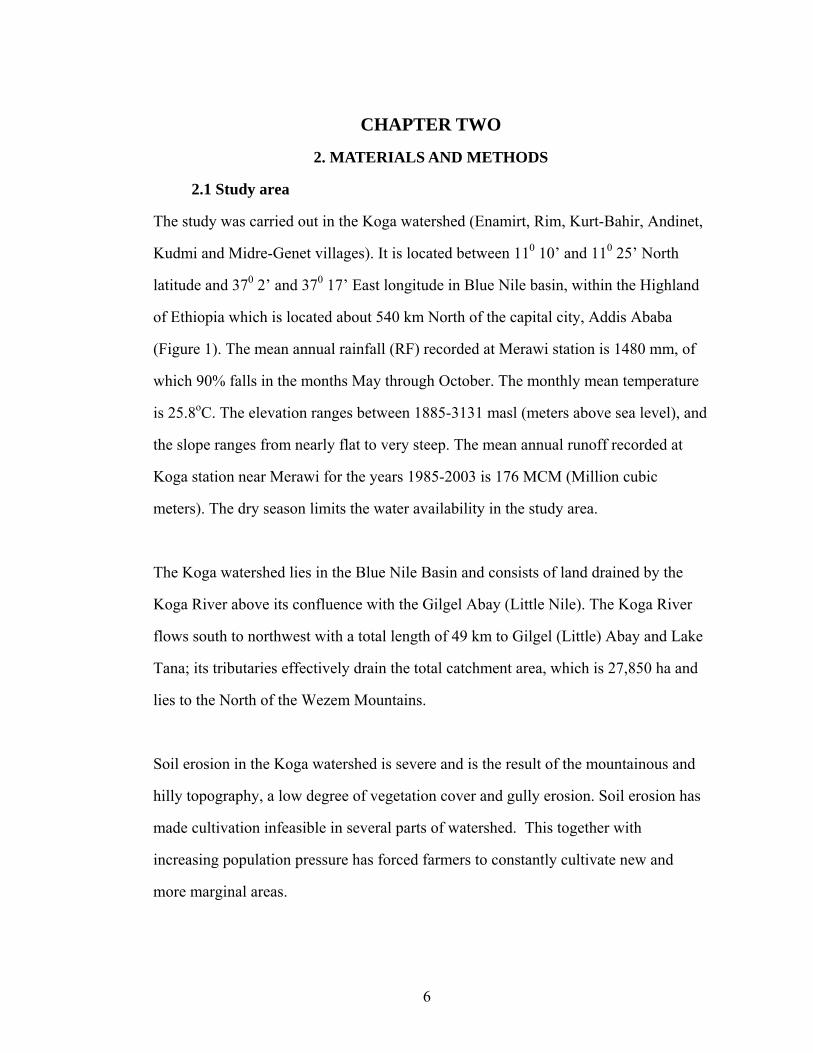
3.3.1.7 Soil/stone bund terraces
About 61% of the surveyed plots included soil and stone bunds (Table 14). In the
common land especially around the mountainous area, farmers were constructing
bunds because of the cash they would earn from a safety net program. During focus
group discussions with key informants, it was learned that farmers are well aware of
erosion problem in the area. Moreover, they agree that bund terraces are effective in
protecting the soil. The newly introduced SWC measures, stone and soil bunds, were
widely acknowledged as being effective measures in arresting soil erosion and as
having the potential to improve land productivity. Nevertheless, due to the top-down
approach (haven’t participation of Development Agents with local farmers), adoption
of these new soil and water conservation practices by the farmers appears less likely
(Mitiku H, Karl H., Brigitta S., 2006).
During discussions with key informants in each of the study areas, the farmers
mentioned that ineffective designs by the development agents are responsible for
causing gullies. Farmers use mostly soil/stone bunds that are impermeable intended to
maintain all rainfall but when overtopped at one location will cause gullies unless they
have specially designed spillways and protected soils below. These structures are
better suited for semi-arid and arid parts of the country than in the high rainfall areas.
This is in line with a study conducted by Belay (1992) in southern Ethiopia which
concluded that farmers are willing to conserve their soil and water but demand more
appropriate technologies, and that poorly designed practices can be the major cause of
erosion in areas treated with SWC.
33
No surveyed plots had fanya juu7 terraces (Table 14). Key informants indicated that
the farmers were not aware of this SWC practice. Other farmers using this type of
structure explained that the advantage of fanya juu terraces is that it changes gradually
into a bench terrace, does not need too much maintenance, and decreases the speed of
runoff more than a soil bund. This is consistent with findings of earlier studies in
southern Ethiopia. Tegene (1992) reported that the farmers considered the introduced
soil and fanya juu bunds as inappropriate technologies because they occupy cultivable
area, and they harbor rats and other rodents.
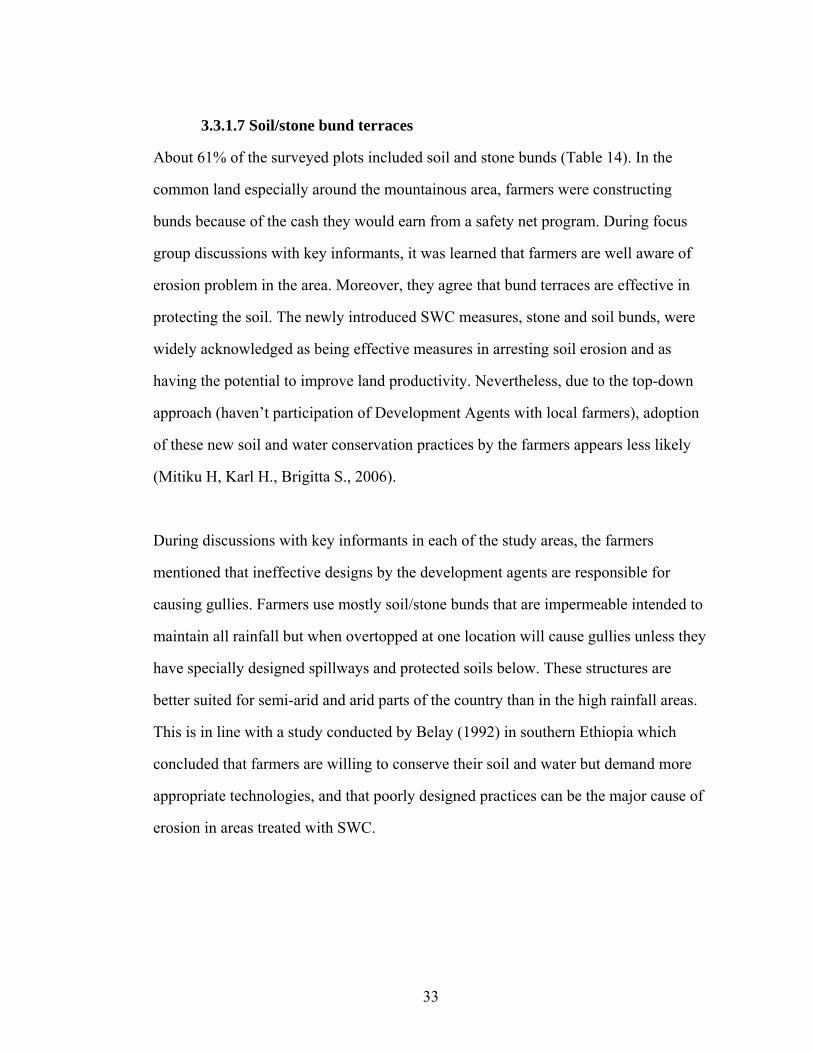
Figure 3: Fields with stone bunds are common in cultivated fields along transect in the Koga watershed, 2008.
7 Fanya juu terraces are made by digging a trench and throwing the soil uphill to form an embankment, this after some years develops in to outward sloping bench terraces.
34
3.4 Econometric Analysis
The major objective of this section is to identify the relative importance of personal,
socio economic, institutional and biophysical variables which affect smallholder
farmers’ decisions to adopt improved and traditional soil and water conservation
structures. These variables were selected based on literature review.
There are different factors related to the adoption of soil and water conservation
measures. Farmers seldom sustain the technical solutions offered by external
interventions in the long term unless proper consideration is given to these factors
(McDonald and Brown, 2000).
Previously, studies concerning adoption have identified household variables, farming
and socio-economic variables and other external factors as the major determinants of
adoption (Amsalu and De Graaff, 2007). In the Ethiopian case, several household and
socio-economic factors that influence the decision to accept SWC measures have been
identified. Amsalu and De Graaff (2006) found in the Beressa watershed in the
Highlands of Ethiopia that age of the head of household, farm size, and numbers of
livestock were factors that significantly influenced the adoption of SWC practices.
Before doing the analysis, it was necessary to check for the existence of multi-
collinearity among the continuous variables and verify the degree of association
among discrete variables. Correlation analysis showed that only two candidate
variables suffered from significant multi-collinearity among the set of continuous and
discrete predictor variables chosen for regression analysis at 5% confidence interval.
The analysis omitted Extension contact and security of land tenure because of
collinearity.
35

Table 15: Definition and measurement of variables used in the model
Variables Description and unit of measurement Dependent variablesY1=ISOB Improved soil/stone bund constructed (m/ha) Y2=ICOFD Improved cut-off drain (check dam) constructed
(m/ha) Y3=PLTRE Covered Plantation of trees (no/ha) Explanatory variablesX1=AGEHH Age of the household head (years) X2=EDUHH Education of head of household (years)
X3=SEXHH Sex of household: 1 if the household is male, 0 otherwise
X4=TOFAM Family size of the household (numbers)
X5=PERCP
Perception of the household head about soil erosion problem: 1 if the household head perceive soil erosion problem in his farm, 0 otherwise
X6= SOCIAL Social position of the household head: 1 if the household head has social position in the kebele, 0 otherwise
X7 =ATLND Area of total farmland (ha)
X8=LNDLBR Ratio of total land to labor (hectare per man days) X9=TLS Livestock holding of the household (numbers)
X10=OFINCOM Off-farm income (ETB)
X11= ACTRA Access to training about SWC practices (numbers) X12=DIMAR Walking distance to the market (minutes)
X13=SLOP Slope category of a plot: 1 flat; 2 steep land; 0 other wise
X14=DISTP Walking distance to the farm plot from home (minutes)
X15=EXT Extension contact: 1 if the farmer gets extension contact, 0 Otherwise
X16=LNDSECU Security of land tenure: 1 if the farmer considered that he/she will be able to use the plot at least during his /her lifetime, 0 other wise
36
37
3.4.1. Factors affecting adoption of SWC practices
Tobit model analysis has been used to examine the determinants of adoption of
selected soil and water conservation practices in Koga watershed. Lengths of
constructed improved and traditional soil and water conservation structures in meters
per hectare, and numbers of trees per hectare, were chosen as three proxy measures of
conservation efforts. Results of the Tobit regression analysis are presented in Table
16.
Among the many hypothesized explanatory variables, only seven variables were found
to significantly affect improved soil and stone bund terraces. Five variables
significantly affected improved cut-off drains and two variables significantly affected
the adoption of tree plantations. The log likelihood ratios for all cases were significant
at the p < 0.05 probability level. This indicates that there exists useful information in
the estimated Tobit model.
The results indicate that the significant (at 5%) variables affecting adoption of at least
one of three improved SWC (Soil/stone bund terraces, cut-off drains and plantation of
trees) efforts in the study area include area of total farm land (ATLND), land to labor
ratio (LNDLBR), age of the household head (AGEHH), education level of the
household head (EDUHH), distance of the farm plot from home (DIPLO), slope of the
farm plots (SLOP), total family size (TOFAM), total livestock holding capacity
(TOLS), access to training (ACTRA) and distance of the market from home
(DIMAR). Variables sex of HH head (SEXHH), perception of an erosion problem
(PERCP), social position of HH head (SOCIAL), and off-farm income (OFINCO) did
not have coefficients significantly different from zero in any of the three equations.

DEPENDENT VARIABLES
Y1 (soil/stone bund terrace) Y2 (cut-off drain) Y3 (tree plantation)
Change Change Change
Parameters Bi SE T-val. Prob. Bi SE T-val. Prob. Bi SE T-val. Prob. X1=AGEHH 0.425 0.26 1.62 0.105 0.352 0.14 2.44 0.016 0.470 0.97 0.48 0.629 X2=EDUHH 3.823 1.96 1.95 0.003 0.114 1.09 0.1 0.917 5.932 7.13 0.83 0.406 X3=SEXHH -3.883 6.73 -0.58 0.565 -4.389 3.71 -1.18 0.238 22.431 24.6 -0.91 0.363 X4=TOFAM -3.383 1.15 -2.93 0.003 -1.687 0.63 -2.66 0.008 11.342 4.26 -2.66 0.008 X5=PERCP 51.362 28.9 1.78 0.076 18.212 16 1.14 0.256 31.803 106 -0.3 0.765 X6=SOCIAL -0.840 1.91 -0.44 0.660 -1.702 1.05 -1.62 0.105 -3.346 6.94 -0.48 0.630 X7=ATLAND 20.077 9.31 2.16 0.002 10.373 5.15 2.01 0.045 39.324 34.4 -1.14 0.253 X8=LNDLBR -563.63 513 -1.1 0.273 513.98 287 -1.79 0.005 92.600 875 0.05 0.961 X9=TOLS 1.542 0.32 4.8 0.000 0.561 0.17 3.16 0.002 3.083 1.16 2.65 0.001 X10=OFINCO 0.016 0.01 1.71 0.089 0.004 0 0.84 0.402 -0.040 0.03 -1.12 0.263 X11=ACTRA -6.173 6.24 -0.99 0.323 -8.474 3.39 -2.5 0.013 22.776 22.5 -1.01 0.312 X12=DIMAR 0.113 0.05 2.36 0.019 0.030 0.02 1.15 0.253 0.235 0.17 1.35 Error X13=SLOP 16.061 6.83 2.35 0.009 5.188 3.69 1.4 0.161 -0.300 0.23 -1.3 Error
X14=DIPLO -0.311 0.07 -4.65 0.000 -0.209 0.04 -5.67 0.000 195.00 134 1.46 Error
Table 16: Maximum likelihood estimates of Tobit Model results (adoption of improved soil and water conservation practices)
Where, Bi represents the regression coefficient associated with the variable SE means standard error of the regression coefficient T-val. is Bi/SE Change prob. is the probability that Bi is not significantly different from zero
38
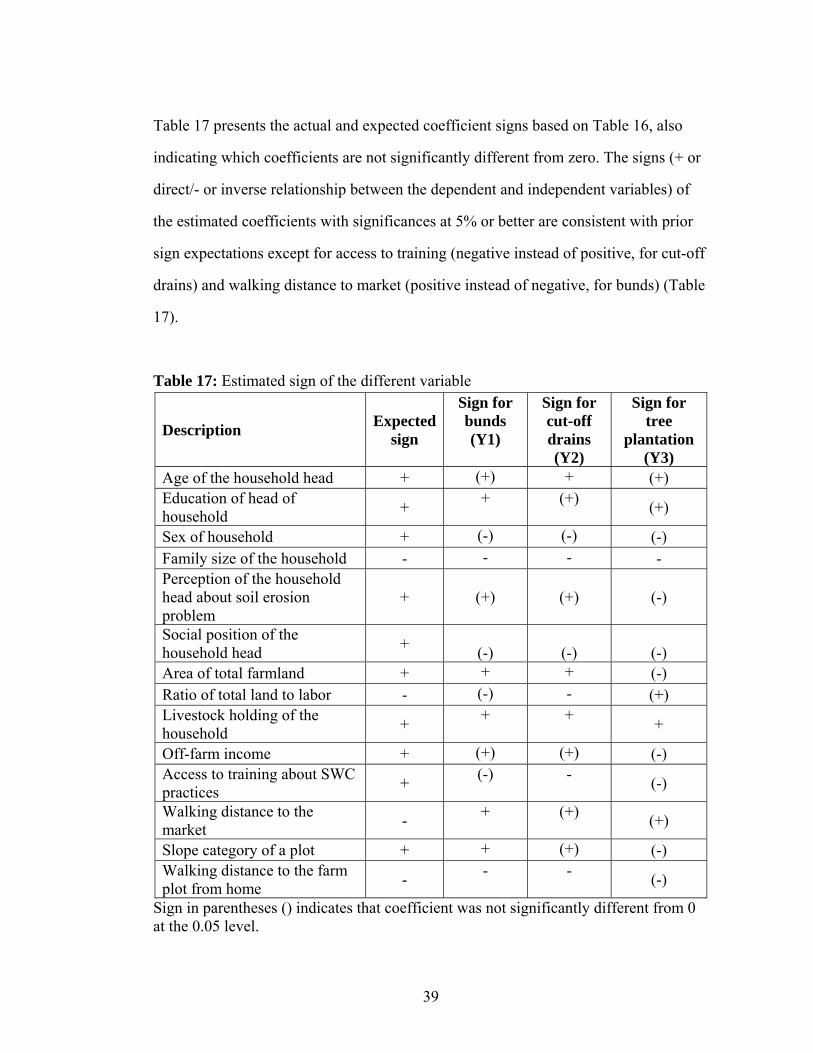
Table 17 presents the actual and expected coefficient signs based on Table 16, also
indicating which coefficients are not significantly different from zero. The signs (+ or
direct/- or inverse relationship between the dependent and independent variables) of
the estimated coefficients with significances at 5% or better are consistent with prior
sign expectations except for access to training (negative instead of positive, for cut-off
drains) and walking distance to market (positive instead of negative, for bunds) (Table
17).
Table 17: Estimated sign of the different variable
Description Expected sign
Sign for bunds (Y1)
Sign for cut-off drains (Y2)
Sign for tree
plantation (Y3)
Age of the household head + (+) + (+) Education of head of household + + (+) (+)
Sex of household + (-) (-) (-) Family size of the household - - - - Perception of the household head about soil erosion problem
+
(+)
(+) (-)
Social position of the household head +
(-)
(-)
(-) Area of total farmland + + + (-) Ratio of total land to labor - (-) - (+) Livestock holding of the household + + + +
Off-farm income + (+) (+) (-) Access to training about SWC practices + (-) - (-)
Walking distance to the market - + (+) (+)
Slope category of a plot + + (+) (-) Walking distance to the farm plot from home - - - (-)
Sign in parentheses () indicates that coefficient was not significantly different from 0 at the 0.05 level.
39

3.4.1.1 Personal factors in relation to adoption of SWC
The personal factors that are considered in relation to adoption behavior of SWC
included age, education and family size. The influence of farmers’ age8 on the
adoption performance of soil and water conservation is positive and it is statistically
significant with cut-off drain types of SWC. A unit increase in age of HH head
increases the adoption behavior of improved cut-off drains by 0.35% (Table 16). The
positive sign indicates that, as a farmer’s age increases, the adoption behavior of
improved cut-off drains increases. The hypothesis that younger farmers do not expend
more effort on improved soil and water conservation measures, especially improved
cut-off drains compared to older ones, was motivated by the view that older farmers
have experience . Therefore, they were more aware of the problems of erosion and the
importance of soil and water conservation practices. Another reason for the expected
positive relationship between age of HH head and conservation effort is that older
farmers have sufficient land for adopting improved SWC structures while younger
farmers do not.
There is significant correlation between the education9 level of household head and
the adoption of soil/stone bund terraces (Table 16). Education increased the adoption
behavior of improved soil/stone bund terraces by 3.8% per additional year of
education. This provides support for the hypothesis that better education levels are
8 Age of the household head: This is a continuous independent variable indicating the farming experience of the household head in years. Through experience, farmers may perceive and analyze the problem of soil erosion and to develop confidence to use soil-conserving measures. Thus, more experienced farmers in farming are more likely to use soil conserving technologies than less experienced farmers. 9 Education: Refers to the number of years of formal education completed by the head of the household. Educated farmers can understand, analyze, and interpret the advantage of different technologies more easily than uneducated farmers. Therefore, farmers who have greater year of schooling are expected more likely to use soil and water-conserving technologies.
40
associated with greater information on conservation measures and in turn results in a
greater adoption of soil and water conservation practices. Krishana et.al. (2008) found
that education of the HH head was positively related to the adoption of improved
SWC technology. Therefore, if the amount of educated people increases, the country
sustainable development will be improved.
The family size of households has an impact on the investment in all three types of
soil and water conservation practices. As mentioned above, population growth has
brought about land scarcity and land degradation in the study area. Table 16 is
consistent with this because survey results show that a one-person increase in family
size decreases the adoption of soil/stone bund terraces by 3.4%, cut-off drains by 1.7%
and tree plantation by 11.3%. It is plausible that large families do not spend their
money on conservation practices; rather they spend it for food and other basic
necessities.
Similarly Amsalu (2006) found that, in the Beressa watershed in the highlands of
Ethiopia, larger families were less likely to continue using stone terraces. Bekele and
Drake (2003) also found similar results in the eastern highlands of the Ethiopia. They
noted that in a family with a large number of mouths to feed, there was competition
for labor between off-farm activities to earn cash for buying food and maintenance of
SWC. Moreover as population increases, landholding per household gradually
decreases which in turn has a negative impact on soil and water conservation.
It was surprising that the SEXHH variable did not have a significant relationship to
any of the three SWC practice proxies, because of the existing strengthen capacity of
women farmers for work in the study area.
41
3.4.1.2 Socio-economic factors in relation to adoption of SWC
The main and significant economic factors considered in this study are the area of
farmland, land to labor ratio and livestock holding of the household. Economic factors
can play important role in determining the adoption of SWC practices.
Among the economic factors, farm size10 is an important variable in relation to the
adoption of soil and water conservation (Table 16). Areas of farmland had positive
and significant influence on the adoption of improved soil/stone bund terraces and cut-
off drains, but not on tree plantation. From the survey result, for a 1 hectare increase in
farmland, the probability of adoption of bunds increases by 20% (Table 16). Large
farms have land available for soil/stone bund while on small farmers all land is needed
for crop production.
Amsalu and Graaff (2007) similarly found that farmers who have a larger farm are
more likely to invest in soil conservation measures because they have the funds to do
so.
Land to labor ratio11 negatively affected the adoption of cut-off drain SWC. A unit
increase in land to labor ratio decreased the adoption of cut-off drains by 51% (Table
16). Implementation of SWC structure is labor intensive and therefore implementation
10 Area of farm land (farm size): Soil and water conservation structures may take some area that would have been used for farm (growing of crops). Farmers who operate on larger farms can allocate some part of the land than those who have small farms. Therefore, it is anticipated that farm size and the likelihood of using soil-and-water conserving technologies are positively correlated. 11 Land to labor ratio measured as the ratio of the area operated to the number of family members engaged in farming is used as an indicator of the population pressure. Households with lower land to labor ratio may have incentives to invest in soil conservation. On the other hand, the potential loss of land to soil conserving structures may discourage use of soil and water conserving Structures. For households with more land per unit of labor, this potential loss of land and the subsequent reduction in cropping area may be less of a constraint relative to those with little land. Hence households with higher land to labor ratio may be more likely to use soil and water conservation structures. The effect of land to labor ratio is, therefore, indeterminate a priori.
42
is related more to labor availability than to land size. This finding lends support to the
hypothesis that as population grows relative to land resources, land will be more
intensively cultivated (Boserup, 1965).
Another important component of the farming system in the study area is livestock
rearing. Most farmers reported that there was shortage of feed for their livestock,
especially during the dry season. The average size of livestock holding in each HH
measured in terms of tropical livestock unit (TLU) was found to be 3.2 (Appendix 1).
Increased livestock holdings12 are positively related to the adoption of improved
soil/stone bund terraces, cut-off drain and tree plantation of SWC structures (at 5%
significant level, Table 16). The survey result show that a unit increase in livestock
increased the adoption of improved soil/stone bund terraces by 1.5%, cut-off drains by
0.6% and tree plantations by 3.1%. This may imply that money earned from the
livestock makes possible the purchase of materials for construction of SWC structures.
3.4.1.3 Institutional factors in relation to adoption of SWC
For the purpose of this thesis the institutional factors consist of: visits by development
agent (DA), technical support, training, land tenure and distance to market.
Institutional factors did not affect significantly the rate of adoption of soil and water
conservation practices with the exception of the distance between the market and
12 Livestock holding: This variable represents the livestock holding of the household in tropical livestock unit. It is used as an indicator of wealth. More specialization into livestock away from cropping may reduce the economic impact of soil erosion and lower the need for soil conservation. On the other hand, those farmers who have large number of livestock may have more capital to invest in soil conservation practices. This affects the use of soil conservation measures positively. However, in the case of the study area, conservation technologies are more labor intensive and require less capital. Therefore, the size of livestock holding is hypothesized to affect conservation investment negatively.
43

household home. Interestingly the larger the distance to the market13 the greater the
adoption of soil/stone bund terraces and cut-off drains (Table 16). For each minute
increase in walking to the market the soil/stone bund terraces increased by 0.11% and
the number of cut-off drains increased by 0.03%.
Farmers cannot adopt technologies if they do not have access to all the relevant
information, but the information they are given is often incomplete, focusing only on
the technical aspects and overlooking some key criteria from a farmer’s point of view.
From the result, access to training had a significant negative effect on use of cut-off
drains because the information they were get about cut-off training is often incomplete
relative to other practices. So, most trained farmers adopt other practices rather than
cut-off drain. Therefore, nor can they adopt technologies if they do not clearly
perceive information that scope of returns could be expected after adoption.
It was not possible to test the effect of renting land on adoption of SWC practices due
to the small number of farmers who rented land in the sample, According to Bakhsh,
Kanwar and Ahuja. (1998), farmers are not likely to invest in rented property if it is
unlikely that their investments can be recouped.
3.4.1.4 Biophysical factors in relation to adoption of SWC
Another group of characteristics that determines the adoption of SWC structures are
the biophysical factors. They include the distance between the plot and the household
13 Distance of the market: It refers to the average distance of the market from residence home. Farmers whose markets were far to their residence use soil-and-water conserving technologies because the time and energy they spend to market is changed in to constructing SWC measurement in their field. Therefore, distance from residence more likely affects conservation practices positively.
44
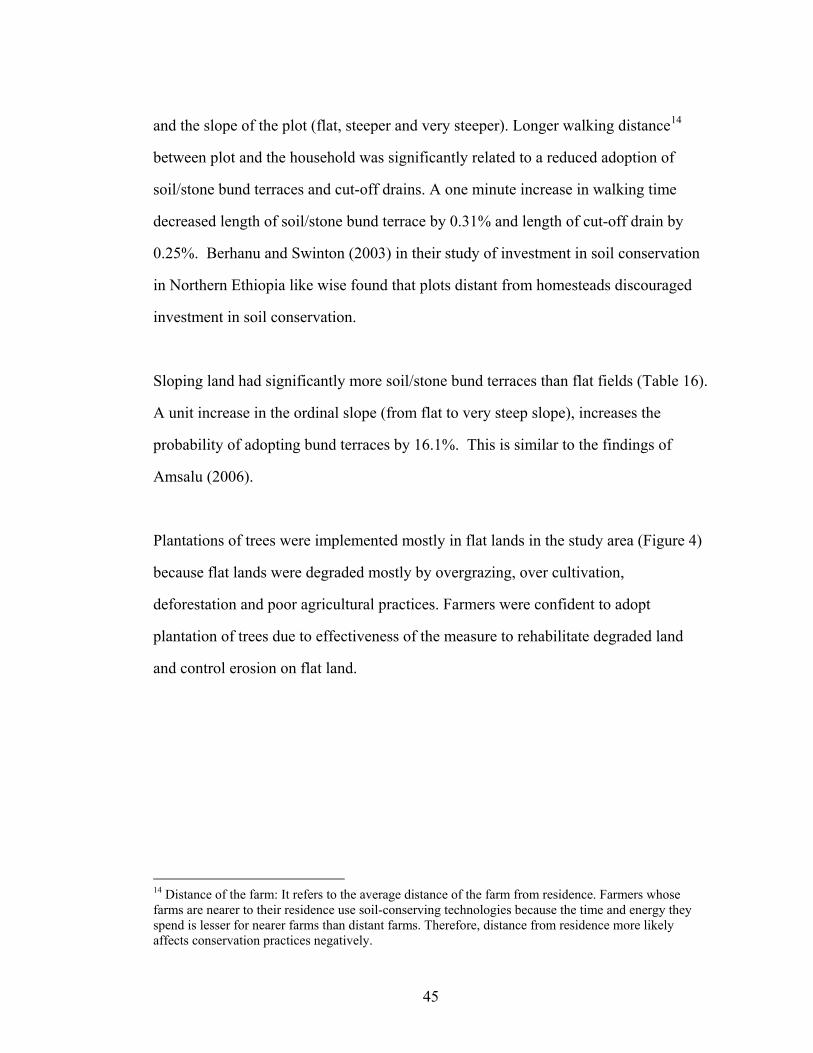
and the slope of the plot (flat, steeper and very steeper). Longer walking distance14
between plot and the household was significantly related to a reduced adoption of
soil/stone bund terraces and cut-off drains. A one minute increase in walking time
decreased length of soil/stone bund terrace by 0.31% and length of cut-off drain by
0.25%. Berhanu and Swinton (2003) in their study of investment in soil conservation
in Northern Ethiopia like wise found that plots distant from homesteads discouraged
investment in soil conservation.
Sloping land had significantly more soil/stone bund terraces than flat fields (Table 16).
A unit increase in the ordinal slope (from flat to very steep slope), increases the
probability of adopting bund terraces by 16.1%. This is similar to the findings of
Amsalu (2006).
Plantations of trees were implemented mostly in flat lands in the study area (Figure 4)
because flat lands were degraded mostly by overgrazing, over cultivation,
deforestation and poor agricultural practices. Farmers were confident to adopt
plantation of trees due to effectiveness of the measure to rehabilitate degraded land
and control erosion on flat land.
14 Distance of the farm: It refers to the average distance of the farm from residence. Farmers whose farms are nearer to their residence use soil-conserving technologies because the time and energy they spend is lesser for nearer farms than distant farms. Therefore, distance from residence more likely affects conservation practices negatively.
45
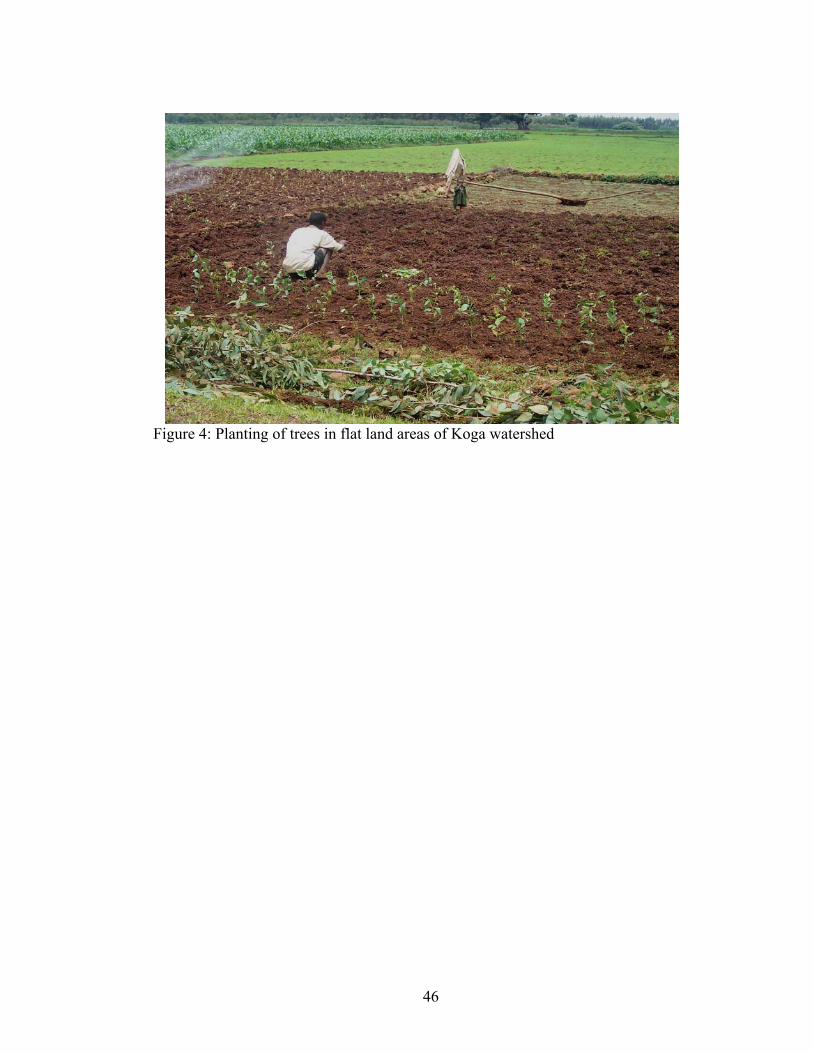
Figure 4: Planting of trees in flat land areas of Koga watershed
46
CHAPTER-FOUR
4. SUMMARY AND CONCLUSION
4.1 Summary
Agricultural development in Ethiopia is hampered by land degradation; degradation in
turn is threatening the overall sustainability of agricultural production. Soil erosion is a
major cause of land degradation in Ethiopia.
Based on the result of this study, personal factors, socio-economic factors and
livestock holding capacity of HH, institutional factors, biophysical factors and degree
of slope significantly affect the probability of adopting both improved and traditional
soil and water conservation measures.
Farmers’ age and education level of HH head have a positive impact on adoption of
some soil and water conservation practices. Older farmers have advantages of more
experience and access to more farmlands, and younger farmers possess a higher level
of education. Degree of slope increased the use of bund terraces while distance of farm
plots from home had negative influences on bunds and cut-off drains. The results are
consistent with the woreda’s hilly and rugged topography especially above the
Irrigation Dam. The cost of soil and water conservation also includes the cost of travel
to the plot from home. Land to labor ratio affects the adoption of cut-off drains.
4.2 Conclusion
Understanding of personal, socio-economic, institutional and biophysical factors
would contribute to the design of appropriate strategies to achieve technical change in
soil and water conservation process in the study area and other similar areas of the
region and as well as the country.
47
On the basis of the survey results and literature reviewed, the following points were
made.
• Soil and water conservation policies that fail to account for inter household and
inter plot variation and important biophysical factors that influence the adoption of
soil and water conservation measures by farmers are unlikely to be effective.
Therefore, policies should consider differences in the above factors in the design and
promotion of conservation technologies.
• Investment in physical soil and water conserving technologies becomes more
attractive as the area of farm land is larger, i.e. farmers make more soil and water
conservation investment in holdings that are wider in area.
• From the informal discussion, key informants said concerned organizations
and government bodies involved in soil conservation should shift emphasis to give
greater attention in conserving soils before the land lost all the fertile soils rather
than targeting land that has been already exhausted and degraded.
As the results indicated, SWC structures are more likely to be implemented and
maintained on low fertility and steep sloping farmland by giving the priority for it
rather than fertile lands, because labor and other resources are scarce.
48
REFERENCES
Admassie, Y. 2000. Twenty years to nowhere: property right, and conservation in
Ethiopia, Red Sea Press, Lawrenceville, NJ.
Amemiya, T. (1985). Advanced Econometrics. T.J. Press, Padstaw Ltd. Great Britain.
Amsalu, A. 2006. Best practices in soil and water conservation in Beressa watershed,
highlands of Ethiopia. Ph.D Thesis, Wageningen University, Netherlands.
Amsalu, A., and De Graaff, J. 2004. Farmers views of soil and water erosion problems
and their conservation knowledge at Beressa watershed, central highlands of
Ethiopia. Agriculture and Human Values, 23:99-108.
Amsalu, A., and De Graaff, J. 2006. Determinants of adoption and continued use of
stone terraces for soil and water conservation in the Ethiopian highland
watershed. Ecological Economics. In press.
Amsalu, A., and De Graaff, J. 2007. Determinants of adoption and continued use of
stone terraces for soil and water conservation in an Ethiopian highland
watershed. Ecological Economics. 61:294-302
Azene B. 1997. A Participatory Agro forestry Approach for Soil and Water
Conservation in Ethiopia. Tropical Resource Management Papers, No. 17,
Wageningen Agricultural University: Wageningen.
Azene B. 2001. Status and dynamics of natural resources in Ethiopia. In Food
Security through Sustainable Land Use: Population, Environment and Rural
Development Issues for Sustainable Livelihoods in Ethiopia, Taye Assefa
(ed.). NOVIB partners Forum on Sustainable Land Use: Addis Ababa; 165–
184.
Bakhsh, A., R. S. Kanwar and L. R. Ahuja. 1998. Simulating the Effects of Manure
Application on Water Quality Using RZWQM. In: Proceeding of the
49
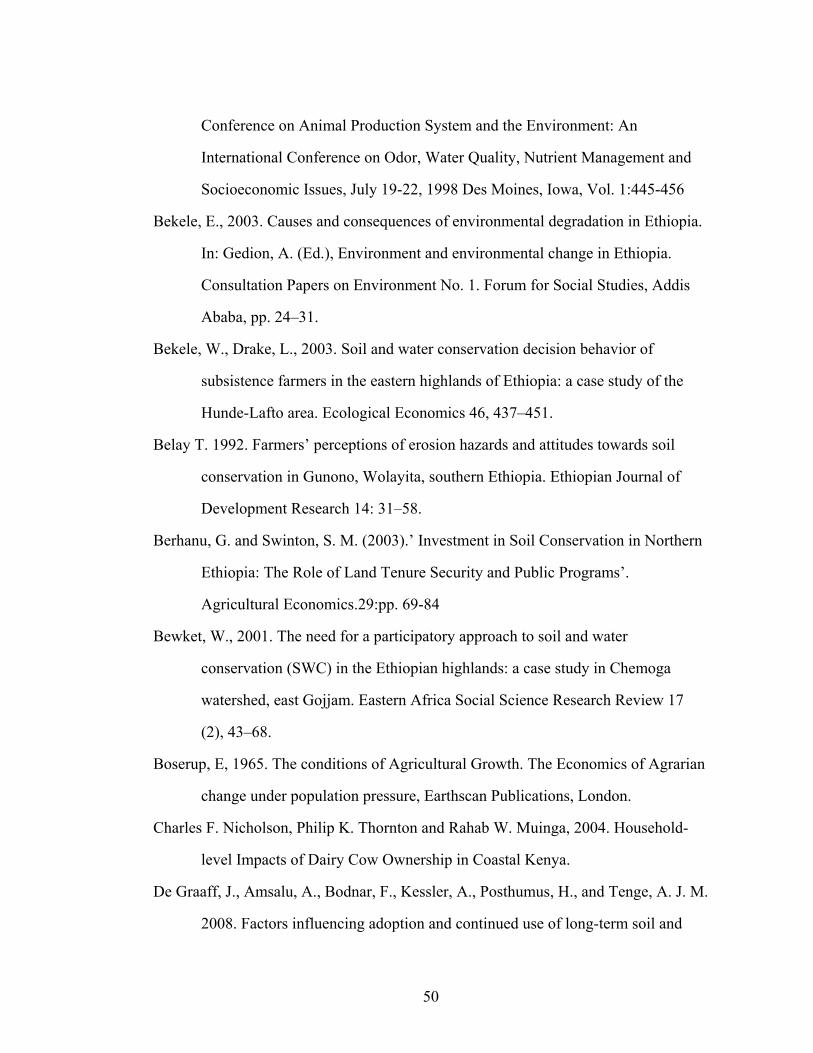
Conference on Animal Production System and the Environment: An
International Conference on Odor, Water Quality, Nutrient Management and
Socioeconomic Issues, July 19-22, 1998 Des Moines, Iowa, Vol. 1:445-456
Bekele, E., 2003. Causes and consequences of environmental degradation in Ethiopia.
In: Gedion, A. (Ed.), Environment and environmental change in Ethiopia.
Consultation Papers on Environment No. 1. Forum for Social Studies, Addis
Ababa, pp. 24–31.
Bekele, W., Drake, L., 2003. Soil and water conservation decision behavior of
subsistence farmers in the eastern highlands of Ethiopia: a case study of the
Hunde-Lafto area. Ecological Economics 46, 437–451.
Belay T. 1992. Farmers’ perceptions of erosion hazards and attitudes towards soil
conservation in Gunono, Wolayita, southern Ethiopia. Ethiopian Journal of
Development Research 14: 31–58.
Berhanu, G. and Swinton, S. M. (2003).’ Investment in Soil Conservation in Northern
Ethiopia: The Role of Land Tenure Security and Public Programs’.
Agricultural Economics.29:pp. 69-84
Bewket, W., 2001. The need for a participatory approach to soil and water
conservation (SWC) in the Ethiopian highlands: a case study in Chemoga
watershed, east Gojjam. Eastern Africa Social Science Research Review 17
(2), 43–68.
Boserup, E, 1965. The conditions of Agricultural Growth. The Economics of Agrarian
change under population pressure, Earthscan Publications, London.
Charles F. Nicholson, Philip K. Thornton and Rahab W. Muinga, 2004. Household-
level Impacts of Dairy Cow Ownership in Coastal Kenya.
De Graaff, J., Amsalu, A., Bodnar, F., Kessler, A., Posthumus, H., and Tenge, A. J. M.
2008. Factors influencing adoption and continued use of long-term soil and
50
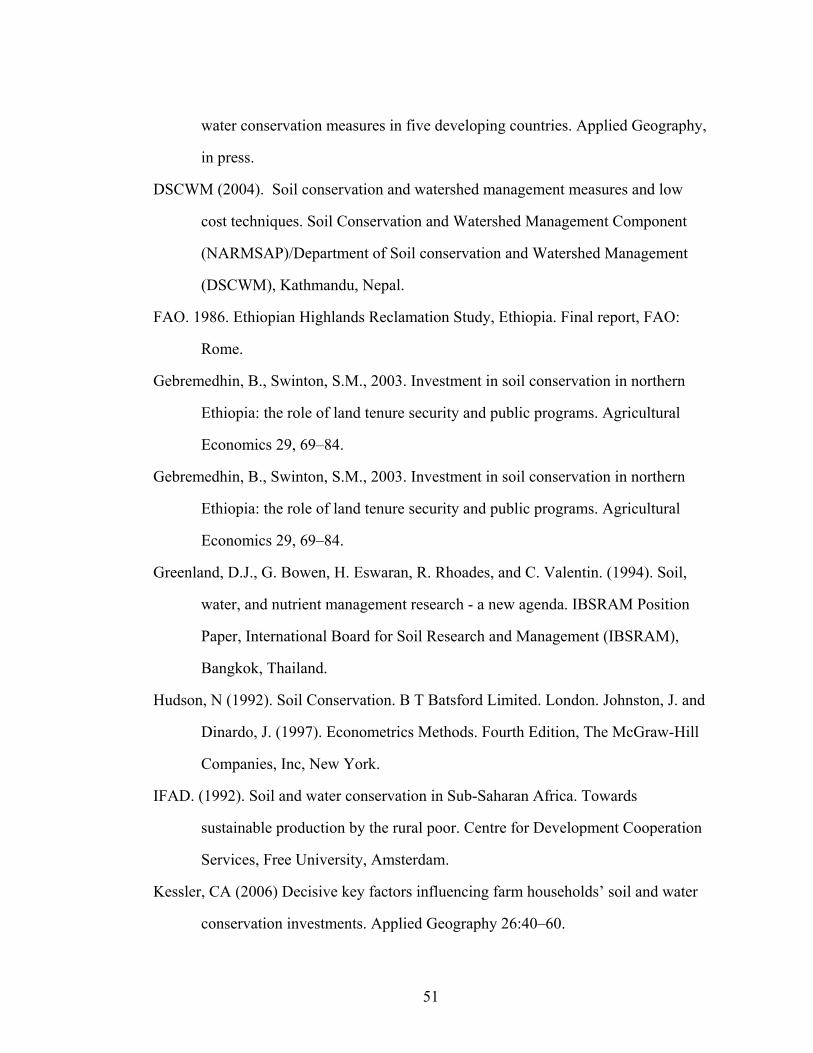
water conservation measures in five developing countries. Applied Geography,
in press.
DSCWM (2004). Soil conservation and watershed management measures and low
cost techniques. Soil Conservation and Watershed Management Component
(NARMSAP)/Department of Soil conservation and Watershed Management
(DSCWM), Kathmandu, Nepal.
FAO. 1986. Ethiopian Highlands Reclamation Study, Ethiopia. Final report, FAO:
Rome.
Gebremedhin, B., Swinton, S.M., 2003. Investment in soil conservation in northern
Ethiopia: the role of land tenure security and public programs. Agricultural
Economics 29, 69–84.
Gebremedhin, B., Swinton, S.M., 2003. Investment in soil conservation in northern
Ethiopia: the role of land tenure security and public programs. Agricultural
Economics 29, 69–84.
Greenland, D.J., G. Bowen, H. Eswaran, R. Rhoades, and C. Valentin. (1994). Soil,
water, and nutrient management research - a new agenda. IBSRAM Position
Paper, International Board for Soil Research and Management (IBSRAM),
Bangkok, Thailand.
Hudson, N (1992). Soil Conservation. B T Batsford Limited. London. Johnston, J. and
Dinardo, J. (1997). Econometrics Methods. Fourth Edition, The McGraw-Hill
Companies, Inc, New York.
IFAD. (1992). Soil and water conservation in Sub-Saharan Africa. Towards
sustainable production by the rural poor. Centre for Development Cooperation
Services, Free University, Amsterdam.
Kessler, CA (2006) Decisive key factors influencing farm households’ soil and water
conservation investments. Applied Geography 26:40–60.
51
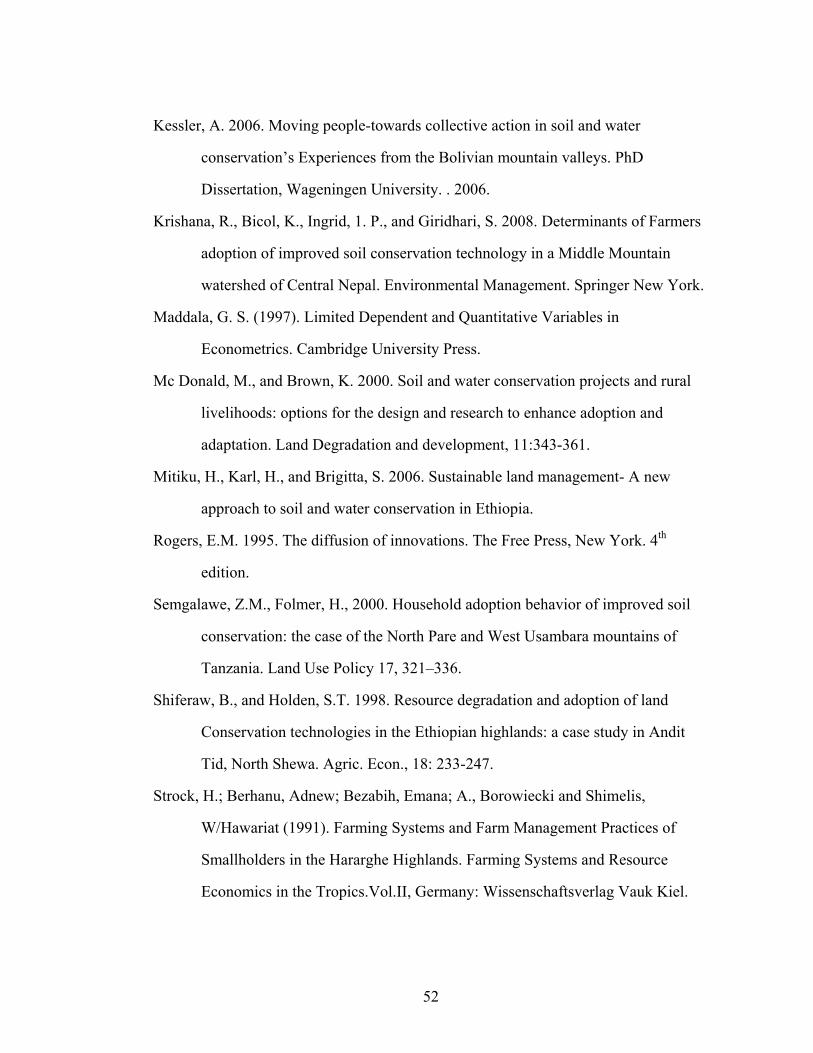
Kessler, A. 2006. Moving people-towards collective action in soil and water
conservation’s Experiences from the Bolivian mountain valleys. PhD
Dissertation, Wageningen University. . 2006.
Krishana, R., Bicol, K., Ingrid, 1. P., and Giridhari, S. 2008. Determinants of Farmers
adoption of improved soil conservation technology in a Middle Mountain
watershed of Central Nepal. Environmental Management. Springer New York.
Maddala, G. S. (1997). Limited Dependent and Quantitative Variables in
Econometrics. Cambridge University Press.
Mc Donald, M., and Brown, K. 2000. Soil and water conservation projects and rural
livelihoods: options for the design and research to enhance adoption and
adaptation. Land Degradation and development, 11:343-361.
Mitiku, H., Karl, H., and Brigitta, S. 2006. Sustainable land management- A new
approach to soil and water conservation in Ethiopia.
Rogers, E.M. 1995. The diffusion of innovations. The Free Press, New York. 4th
edition.
Semgalawe, Z.M., Folmer, H., 2000. Household adoption behavior of improved soil
conservation: the case of the North Pare and West Usambara mountains of
Tanzania. Land Use Policy 17, 321–336.
Shiferaw, B., and Holden, S.T. 1998. Resource degradation and adoption of land
Conservation technologies in the Ethiopian highlands: a case study in Andit
Tid, North Shewa. Agric. Econ., 18: 233-247.
Strock, H.; Berhanu, Adnew; Bezabih, Emana; A., Borowiecki and Shimelis,
W/Hawariat (1991). Farming Systems and Farm Management Practices of
Smallholders in the Hararghe Highlands. Farming Systems and Resource
Economics in the Tropics.Vol.II, Germany: Wissenschaftsverlag Vauk Kiel.
52
Tegene, B., 1992. Farmers’ perceptions of erosion hazards and attitudes towards soil
conservation in Gunono, Wolayita, Southern Ethiopia. Ethiopian Journal of
Development Research 14 (2), 31–58.
Tekelu, E., and Gezeahegn, A. 2003 .Indigenous knowledge and practices for soil and
water management in East Wolega Ethiopia. Conference on International
agricultural Research and development. Göttingen, October 8-10, 2003.
Tigist Y. 2009 Assessment of hydrological controls on gully formation near Lake,
Northern highlands of Ethiopia. MPS Thesis.
Tilahun, Y. (1996). Impacts of conservation bunds on crop yields in Degua Tembien,
northern Ethiopia. M.Sc. thesis, Agricultural University of Norway (NLH).
Wegayehu, B. 2003. Economics of Soil and Water Conservation: Theory and
Empirical Application to Subsistence Farming in the Eastern Ethiopian
Highlands. Doctoral Thesis, Swedish University of Agricultural Science.
World Bank. 2003. World Development Report Oxford University Press, New York.
Wubneh B. (2007) EIA implementation and follow up: a case study of Koga irrigation
and watershed management project, Ethiopia pp 30-31.
Y., Aster and Seleshi B. 2009, Characterization and Atlas of the Blue Nile Basin and
its Sub basins. Addis Ababa, Ethiopia; International Water Management
Institute, Working Paper, unpublished.
53
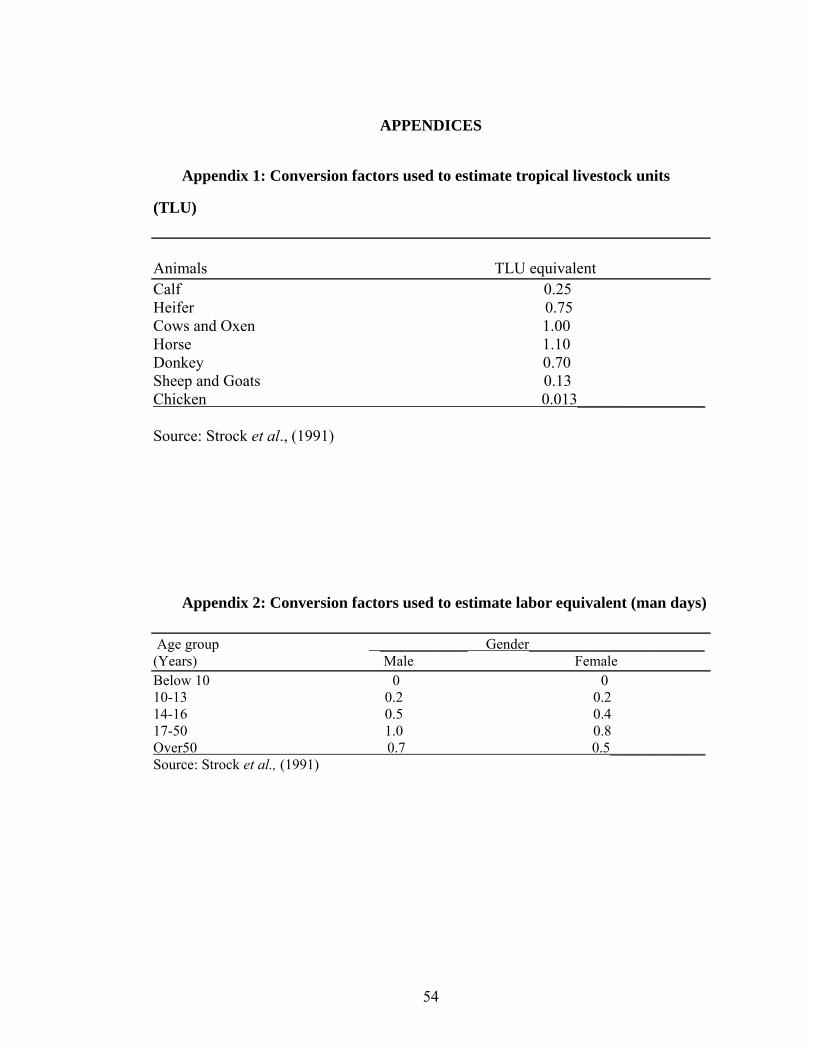
APPENDICES
Appendix 1: Conversion factors used to estimate tropical livestock units
(TLU) Animals TLU equivalent Calf 0.25 Heifer 0.75 Cows and Oxen 1.00 Horse 1.10 Donkey 0.70 Sheep and Goats 0.13 Chicken 0.013________________ Source: Strock et al., (1991)
Appendix 2: Conversion factors used to estimate labor equivalent (man days) Age group ____________ Gender________________________ (Years) Male Female Below 10 0 0 10-13 0.2 0.2 14-16 0.5 0.4 17-50 1.0 0.8 Over50 0.7 0.5_____________ Source: Strock et al., (1991)
54
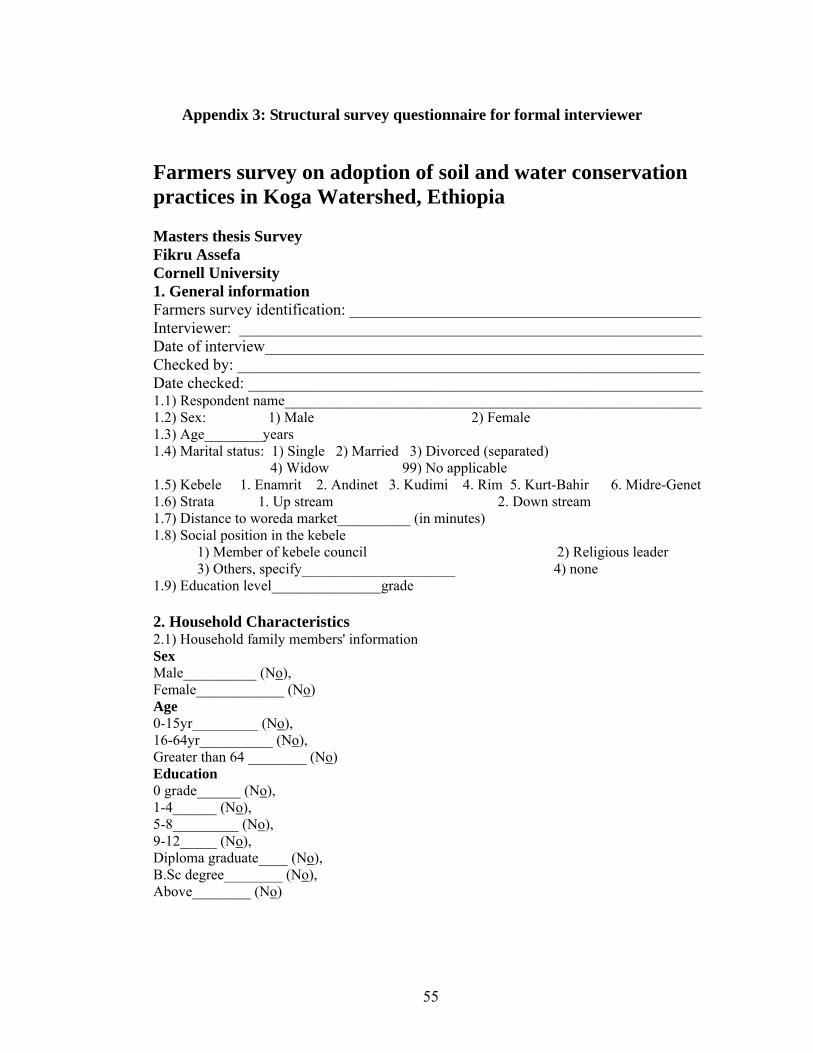
Appendix 3: Structural survey questionnaire for formal interviewer
Farmers survey on adoption of soil and water conservation practices in Koga Watershed, Ethiopia Masters thesis Survey Fikru Assefa Cornell University 1. General information Farmers survey identification: ____________________________________________ Interviewer: __________________________________________________________ Date of interview_______________________________________________________ Checked by: __________________________________________________________ Date checked: _________________________________________________________ 1.1) Respondent name_________________________________________________________ 1.2) Sex: 1) Male 2) Female 1.3) Age________years 1.4) Marital status: 1) Single 2) Married 3) Divorced (separated) 4) Widow 99) No applicable 1.5) Kebele 1. Enamrit 2. Andinet 3. Kudimi 4. Rim 5. Kurt-Bahir 6. Midre-Genet 1.6) Strata 1. Up stream 2. Down stream 1.7) Distance to woreda market__________ (in minutes) 1.8) Social position in the kebele 1) Member of kebele council 2) Religious leader 3) Others, specify_____________________ 4) none 1.9) Education level_______________grade 2. Household Characteristics 2.1) Household family members' information Sex Male__________ (No), Female____________ (No) Age 0-15yr_________ (No), 16-64yr__________ (No), Greater than 64 ________ (No) Education 0 grade______ (No), 1-4______ (No), 5-8_________ (No), 9-12_____ (No), Diploma graduate____ (No), B.Sc degree________ (No), Above________ (No)
55
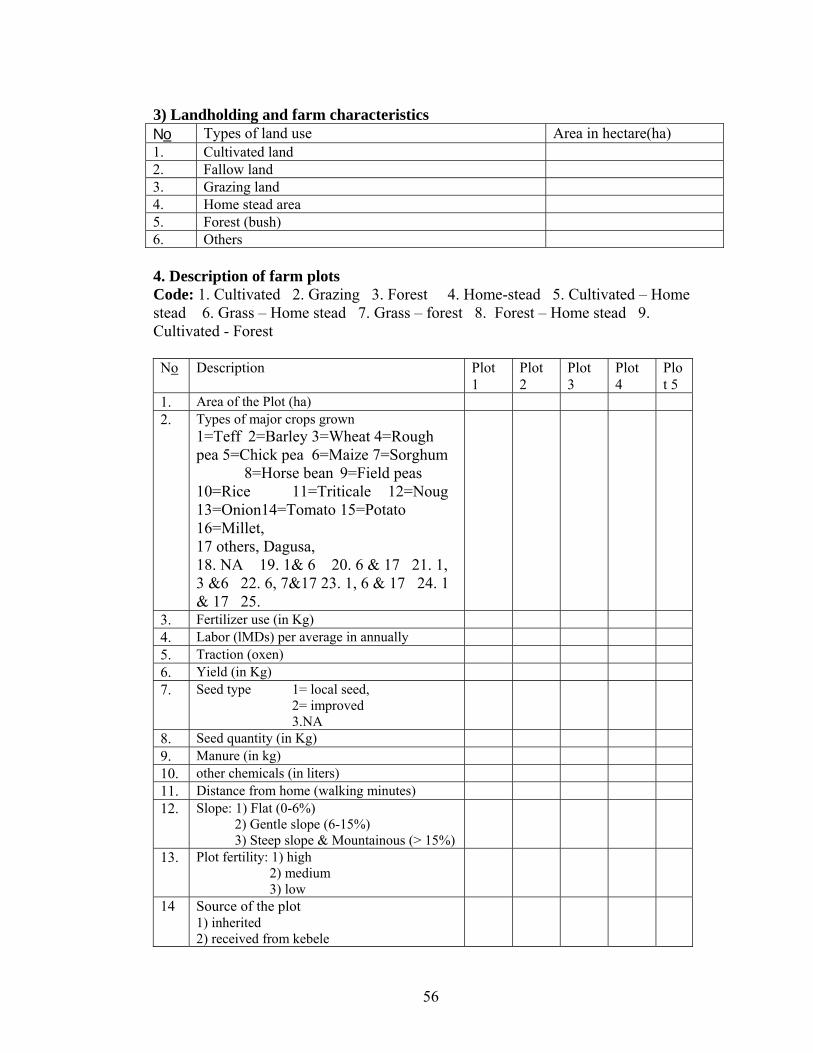
3) Landholding and farm characteristics No Types of land use Area in hectare(ha) 1. Cultivated land 2. Fallow land 3. Grazing land 4. Home stead area 5. Forest (bush) 6. Others 4. Description of farm plots Code: 1. Cultivated 2. Grazing 3. Forest 4. Home-stead 5. Cultivated – Home stead 6. Grass – Home stead 7. Grass – forest 8. Forest – Home stead 9. Cultivated - Forest No Description Plot
1 Plot 2
Plot 3
Plot 4
Plot 5
1. Area of the Plot (ha) 2. Types of major crops grown
1=Teff 2=Barley 3=Wheat 4=Rough pea 5=Chick pea 6=Maize 7=Sorghum 8=Horse bean 9=Field peas 10=Rice 11=Triticale 12=Noug 13=Onion14=Tomato 15=Potato 16=Millet, 17 others, Dagusa, 18. NA 19. 1& 6 20. 6 & 17 21. 1, 3 &6 22. 6, 7&17 23. 1, 6 & 17 24. 1 & 17 25.
3. Fertilizer use (in Kg) 4. Labor (lMDs) per average in annually 5. Traction (oxen) 6. Yield (in Kg) 7. Seed type 1= local seed,
2= improved 3.NA
8. Seed quantity (in Kg) 9. Manure (in kg) 10. other chemicals (in liters) 11. Distance from home (walking minutes) 12. Slope: 1) Flat (0-6%)
2) Gentle slope (6-15%) 3) Steep slope & Mountainous (> 15%)
13. Plot fertility: 1) high 2) medium 3) low
14 Source of the plot 1) inherited 2) received from kebele
56

3) rented in 4) other ____ (specify)
15. Color of the soil 1) red 2) black 3) brown 4) sandy 5) 2 & 4
16. Degree of erosion problem on the plot 1) high 2)medium 3)low
17. Number of years since the plot is used
18. Irrigated 1) yes 2) no
19. Presence of at least one type of improved Conservation structures 1) yes 2)no
Physical Improved soil and water conservation structures built in meter or No
Soil terrace Cut off drain Fanya juu Planting of d/t trees in No
20.
Others, specify 21. Who constructed the structures?
1) Community participation 2) Family (hired) labor 3) Financial incentives by government 4) labor exchange 5)NA
22. Do improved soil and water conservation structures maintained or not 1)yes 2)no 3) NA
23. Who did the maintenance work? 1) Community participation 2) Family 3) hired labor 4) Labor exchange 5. NA
24. Status (degree) of use of improved soil conservation structures (practices) 1) Removed totally; 2) Partially removed 3) Not removed; 4) Modified (adapted) 5) NA
25. Traditional soil and water conservation structures built (in meter) 1.Traditional stone bund
57

2.Traditional ditches 3.Trash (garbage) lines 4. Cut off-drain 5. Plantation 6. Others, specify
26. Total LMDs for conservation per annually 27. Total LMDs for maintenance per annually 28. How do you perceive the soil depth of your
plot since you owned it? 1) increased 2) decreased 3) no change 4) I do not know
29. How do you compare the problem of soil erosion in your farm plots after conservation structures were built? 1) aggravated 2) reduced 3) no change 4) I do not know 5) NA
5) Labor Availability 5.1) Do you have labor shortage for your farm activities? 1) Yes 2) No 5.2) If the answer to question 4.1 is yes, how do you solve labor shortage? 1) Hiring labor 2) By cooperating with other farmers (Koga) 3) Others, specify______________ 4) NA 5) 1 &2 5.3) If labor is hired, what type of labor do you hire? 1) Casual 2) permanent 3) both 4) NA 5.4) Can you easily get labor whenever you need? 1) Yes 2) No 3) NA 5.5) Which family members participate in soil and water conservation works? 1) Men 2) women 3) Children 4) all of them participate 5.6) Do you or your family member work on off – farm activities? 1) Yes 2) No 5.7) If the answer to question 5.6 is yes, Fill in the following table for 2007/08 No Types of off-farm (non- farm)
activity Total income
obtained in one year (birr), approximate
1. Petty trade 2. Pottery 3. Weaving 4. Leather making 5. Selling of fire wood 6. Labor hire out 7. Transportation by “Gary” 8. None
5.8) if answer for #V068 is from 1-7, Which Family members working non-farm activity? 1) Men 2) Women 3) Children 4) All 5) NA
58
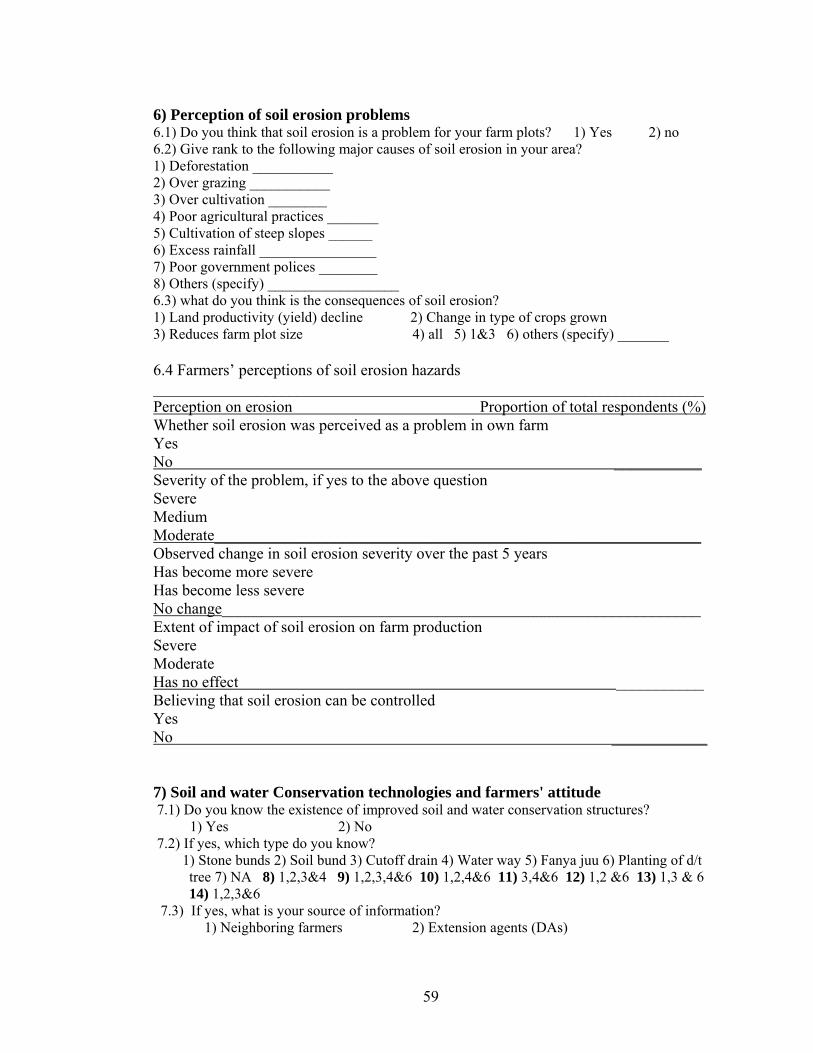
6) Perception of soil erosion problems 6.1) Do you think that soil erosion is a problem for your farm plots? 1) Yes 2) no 6.2) Give rank to the following major causes of soil erosion in your area? 1) Deforestation ___________ 2) Over grazing ___________ 3) Over cultivation ________ 4) Poor agricultural practices _______ 5) Cultivation of steep slopes ______ 6) Excess rainfall ________________ 7) Poor government polices ________ 8) Others (specify) __________________ 6.3) what do you think is the consequences of soil erosion? 1) Land productivity (yield) decline 2) Change in type of crops grown 3) Reduces farm plot size 4) all 5) 1&3 6) others (specify) _______ 6.4 Farmers’ perceptions of soil erosion hazards _____________________________________________________________________ Perception on erosion Proportion of total respondents (%) Whether soil erosion was perceived as a problem in own farm Yes No ___________ Severity of the problem, if yes to the above question Severe Medium Moderate_____________________________________________________________ Observed change in soil erosion severity over the past 5 years Has become more severe Has become less severe No change____________________________________________________________ Extent of impact of soil erosion on farm production Severe Moderate Has no effect ___________ Believing that soil erosion can be controlled Yes No ____________ 7) Soil and water Conservation technologies and farmers' attitude 7.1) Do you know the existence of improved soil and water conservation structures? 1) Yes 2) No 7.2) If yes, which type do you know? 1) Stone bunds 2) Soil bund 3) Cutoff drain 4) Water way 5) Fanya juu 6) Planting of d/t
tree 7) NA 8) 1,2,3&4 9) 1,2,3,4&6 10) 1,2,4&6 11) 3,4&6 12) 1,2 &6 13) 1,3 & 6 14) 1,2,3&6
7.3) If yes, what is your source of information? 1) Neighboring farmers 2) Extension agents (DAs)
59
3) NGOs 4) From field days and Trainings 5) Others, specify____________ 6) NA 7) 1, 2 & 3 8) 1 & 4 7.4) which of the following types of soil and water conservation measurers are efficient to
reduce the problem of soil erosion? 1) Stone bund 2) Soil bund 3) Cut off drain 4) Water way 5) Fanya juu 6) Planting of d/t trees 7) NA 8) 1,2,3,4 9) 1, 2, 3, 4, 6 10) 1,3,4,6 11) 3,4,6 12) 1,2,6 13) 1,3,6 14) 1,2,3,6
7.5) Have you participated in community conservation activities this year? 1) Yes, 2) No 7.6) Did you undertake the maintenance work by your own? 1) Yes 2) No
7.7) if no, what were the reasons for not doing? 1) I have shortage of labor 2) Lack of skill and knowledge 3) Conservation structures were built without my knowledge and willingness 4) I expect the land will be transferred to other farmers 5) There was no need for maintenance 6) 1, 2 & 4 7) all 8) NA 7.8 Do you believe that investment in soil and water conservation practices is profitable in the
long run? 1) Yes, 2) No 7.9) if the farmer did not use any improved conservation structures in all his plots, why you
did not use it? 1) No problem of soil erosion 2) Shortage of labor 3) Expecting that the structures will be done by financial incentives 4) I feel that the land belongs to the government and it is the duty of the government to
maintain the land 5) it reduces farmland 6) Due to problems of rodents and others pests 7) I did not get extension service 8) Others, specify 99) NA 7.10) what are the problems related to each soil and water conservation structures?
Hint, choose from 1-5 Problems Soil bund Cut off drain Water way Plantation
1. Source of rodents 2. Reduce farm land 3. Difficult to turn oxen 4. Labor intensive 5. Difficult to implement
(technically) 6. Costly
Code: 1) 1, 4, 5 3) 1, 4, 6 7) 2, 4 8) 3, 4 9) 2, 4, 6 10) 2, 3 11) 2, 3, 4 12) 1, 3, 6 13) 1, 2, 6 14) 1,2,3,6 15) 4, 5, 6 16) 2, 6 17) 1, 2, 3 18) 2,3,4,6 8. Tenure arrangement 8.1) whom do you think land belongs to? 1) My own 2) the government 3) Other____________ 8.2) Do you think that you have the right to inherit the land to your children? 1) Yes 2) No 8.3) Do you expect that you will use the land throughout your life time? 1) Yes 2) No
60

8.4) Do you agree if the government allows the farmers to sell their land? 1) Agree 2) Disagree 3) Difficult to decide 8.5) Have you rented in land before? 1) Yes 2) No 8.6) If yes, who is responsible for keeping the rented land quality? 1) The owner 2) Myself 3) both of us 4) NA 8.7 Are your plots all registered? 1) Yes 2) No 8.8 If yes, did you get certificate for all plots? 1) Yes 2) No 3) NA 9) Institutional Support 9.1) Do you get extension service? 1) Yes 2) No 9.2) If yes, who provides the extension service? 1) Development agents (DAs) 2) NGOs 3) All 4) Others, specify ___ 9.3) How often you have been visited by DAs last year? 1) Once per month, 2) Twice per month, 3) Three times per month 4) Others, specify-__________________ 9.4) How often you have obtained extension advice on soil and water conservation practices 1) Once per month 2) twice per month 3) Three times per month 4) Once per three months 5) Twice per three months 6) others, specify____________________ 9.5) Have you participated in training of soil and water conservation for the last five years? 1) Yes 2) No 9.6) If yes, for how many days? __________days 99) Many 2) NA 9.7 Was the training useful? 1) Yes 2) No 3. NA 9.8 Do you participate from access of Credit? 1. Yes 2. No 10) Wealth status of the respondents 10.1) Livestock No Type of livestock Number 1. Ox 2. Cow 3. Calve 4. Heifer 5. Horses 6. Mules 7. Donkey 8. Goats 9. Sheep 10. Chicken 10.2) what are the main source of feed? 1) Grazing 2) Hay 3) Straw 4) Maize and Sorghum Hola 5) ’Atela’ 6) All 7) NA 8) 1, 2, 4 9) 1, 4 10) 1,3,4,5 11) 1, 4 5 12) 1, 3, 6 13) 1, 3, 4 14) 1, 2, 3 15) 1, 3, 5 16) 1, 3 17) 1, 2 10.3) How pasturelands are owned in your area? 1) Individually 2) Communally 3) Both 4) Others_______ 5) NA Thank you very much for your cooperation!!!
61
GLOSSARY Birr (ETB) Ethiopian currency (One USD ≈ 9.96 Birr) Kebele A peasant association; it is also the lowest administrative unit in rural
Ethiopia; it has an area of about approximate 800 ha. Mareshsa A traditional implement used for cultivation of the farm by oxen. Teff A main cereal staple grown and used in Ethiopia. Woreda An administrative unit somewhat equivalent to a district. A woreda
consists of several peasant associations (PAs). Zone An administrative unit somewhat having different district. A Zone
consists of several Woredas.
62