assessment of barriers to demand response in the northwest ...€¦ · executive summary vii 1....
TRANSCRIPT

Assessment of Barriers to Demand Response in the
Northwest’s Public Power Sector February 16, 2018
Bonneville Power Administration 905 NE 11th Avenue Portland, OR 97232
Disclaimer on Presented Research Results: Cadmus is the research, development, and evaluation contractor hired by Bonneville Power Administration to provide this body of work. The content is not intended to create, does not create, and may not be relied upon to create any rights, substantive or procedural, enforceable at law by any party in any matter civil or criminal. Opinions or points of view expressed on this report represent a consensus of the authors and do not necessarily represent the official position or policies of Bonneville Power Administration and/or the U.S. Department of Energy. Any products and manufacturers discussed on this site are presented for informational purposes only and do not constitute product approval or endorsement by Bonneville Power Administration and/or the U.S. Department of Energy.

This page left blank.

Prepared by: Hossein Haeri, Ph.D.
Karen Horkitz Hanna Lee Joan Wang
Trent Hardman Hugh Ratcliffe Masumi Izawa
Justin Brant Jeremy Eckstein
Nina Preston Lakin Garth
The Cadmus Group LLC

Table of Contents i
Table of Contents 1. Executive Summary ........................................................................................................................ vii
1.1. Barriers to Demand Response Deployment ........................................................................... viii
1.2. Barriers to Demand Response Adoption .................................................................................. x
1.3. Options for Mitigating Barriers ................................................................................................ xi
1.4. Conclusions .............................................................................................................................xiii
2. Introduction ..................................................................................................................................... 1
2.1. Assessment Background ........................................................................................................... 1
2.2. Assessment Scope and Objectives ............................................................................................ 2
3. Assessment Methodology ................................................................................................................ 4
3.1. Literature Review ...................................................................................................................... 4
3.2. In-Depth Interviews .................................................................................................................. 5
3.3. End-Use Customer Surveys ....................................................................................................... 7
3.4. Workshops .............................................................................................................................. 10
4. Research Findings: DR Deployment ............................................................................................... 11
4.1. Stakeholder Experience, Perceptions, and Visions for DR, DG, and Storage .......................... 12
4.2. Summary of DR Deployment Barriers ..................................................................................... 17
4.3. Economic/Market Barriers and Mitigation Strategies ............................................................ 20
4.4. Organizational/Operational Barriers and Mitigation Strategies ............................................. 26
4.5. Infrastructure/Technology Barriers and Mitigation Strategies ............................................... 31
4.6. Legal/Regulatory Barriers and Mitigation Strategies .............................................................. 36
4.7. Perceptions/Attitude Barriers and Mitigation Strategies ....................................................... 41
4.8. Summary of DR Deployment Barrier Mitigation Strategies .................................................... 45
5. Research Findings: DR Adoption .................................................................................................... 46
5.1. Awareness and Participation .................................................................................................. 46
5.2. Future Interest/Likelihood of Participation in DR, DG, and Storage Programs ...................... 47
5.3. Barriers to Adoption of DR, DG, and Storage .......................................................................... 48
5.4. Mitigation Strategies ............................................................................................................... 51
6. Conclusions .................................................................................................................................... 53
7. Appendix A: Literature Review ...................................................................................................... 55
8. Appendix B: BPA Subject Matter Expert Interview Findings ......................................................... 74

Table of Contents ii
9. Appendix C: Stakeholder Interview Findings ................................................................................. 92
10. Appendix D: DER Service Provider Interview Findings................................................................. 105
11. Appendix E: Power Customer Interview Findings ........................................................................ 115
12. Appendix F: End-Use Customer Survey Findings ......................................................................... 129
13. Appendix G: Data Collection Instruments.................................................................................... 161
14. Appendix H: Literature Review References ................................................................................. 163
List of Tables Table 1. Assessment 2 Completed Interviews .............................................................................................. 7
Table 2. Assessment 2 Completed Barriers Rating Surveys .......................................................................... 7
Table 3. End-Use Customer Survey Sampling ............................................................................................... 9
Table 4. Survey Respondent Count and Percentage of BPA System Peak Load, by Customer Class ............ 9
Table 5. Economic/Market Barriers by Interview Group and DER Category .............................................. 20
Table 6. Organizational/Operational Barriers by Interview Group and DER Category ............................... 26
Table 7. Infrastructure/Technology Barriers by Interview Group and DER Category ................................ 31
Table 8. Legal/Regulatory Barriers by Interview Group and DER Category ................................................ 36
Table 9. Perceived vs. Reported End-Use Customer Barriers to DR Participation ..................................... 43
Table 10. Barrier Mitigation Strategies, by Deployment Barrier Category ................................................. 45
Table 11. Barriers to Residential End-Use Customer Adoption of DR, DG, and Energy Storage ................ 49
Table 12. Barriers to Commercial End-Use Customer Adoption of DR, DG, and Storage........................... 50
Table 13. Mitigation Strategies for Barriers to DR Adoption ...................................................................... 51
Table 14. DR, DG, and Storage Barriers: Regional/BPA Focus .................................................................... 56
Table 15. DR, DG, and Storage Barriers: Public Power Customer Focus .................................................... 61
Table 16. DR, DG, and Storage Barriers: End-Use Customer Focus ............................................................ 69
List of Figures Figure 1. Key Demand Response Deployment Barriers ............................................................................. viii
Figure 2. Barrier Criticality and Relationships ............................................................................................... x
Figure 3. Most Significant Barriers to Participation/Adoption, by Customer Class and Type of DER ......... xi
Figure 4. Options for Mitigating Demand-Side Barriers ............................................................................. xii

Table of Contents iii
Figure 5. Options for Mitigating Supply-Side Barriers ................................................................................xiii
Figure 6. Interrelationship of Project Elements ............................................................................................ 2
Figure 7. Assessment 2 Approach ................................................................................................................. 4
Figure 8. Key DR Deployment Barriers ........................................................................................................ 18
Figure 9. Barrier Relationships .................................................................................................................... 19
Figure 10. Most Familiar DERs, by End-Use Customer Class and DER ........................................................ 46
Figure 11. Likelihood of Participation/Adoption Among End-Use Customers in the Next Two Years ....... 47
Figure 12. Most Significant Barriers to Participation/Adoption by Customer Class and DER .................... 48
Figure 13. BPA Subject Matter Expert Interview Groups............................................................................ 74
Figure 14. A Partial History of DERs at BPA ................................................................................................. 77
Figure 15. Most Familiar DERs Among End-Use Customers ..................................................................... 129
Figure 16. Most Significant Barriers to DER Participation/Adoption, by Customer Class and DER .......... 130
Figure 17. Residential End-Use Customers’ Awareness, Participation, and Adoption of DERs ................ 131
Figure 18. Residential Customers’ Interest in Demand Response Program Participation ....................... 132
Figure 19. Residential End-Use Customer Barriers to Demand Response Participation .......................... 134
Figure 20. Residential End-Use Customer Barriers to DG Participation ................................................... 135
Figure 21. Residential End-Use Customer Barriers to Energy Storage Participation ................................ 136
Figure 22. Residential End-Use Customers’ Capability of Reducing/Shifting Energy Use During High Demand .......................................................................................................................... 137
Figure 23. Residential End-Use Customers’ Willingness to Participate in Demand Response without an Incentive ............................................................................................................................ 137
Figure 24. Characteristics Likely to Increase Residential Participation in Demand Response .................. 138
Figure 25. Residential End-Use Customers’ Acceptable Demand Response Characteristics ................... 139
Figure 26. Characteristics Likely to Increase Residential Participation in DG ........................................... 140
Figure 27. Characteristics Likely to Increase Residential Participation in Energy Storage ....................... 141
Figure 28. Small Commercial End-Use Customers’ Awareness, Participation, and Adoption of DERs ..... 142
Figure 29. Small Commercial End-Use Customers’ Interest in Demand Response Program Participation ............................................................................................................. 143
Figure 30. Small Commercial End-Use Customer Barriers to Demand Response Participation ............... 145
Figure 31. Small Commercial End-Use Customer Barriers to DG Participation ........................................ 146
Figure 32. Small Commercial End-Use Customer Barriers to Energy Storage Participation ..................... 147
Table of Contents iv
Figure 33. Small Commercial End-Use Customers’ Capability of Reducing or Shifting Energy Use During High Demand .............................................................................................................. 148
Figure 34. Small Commercial End-Use Customers’ Willingness to Participate in Demand Response Without an Incentive .............................................................................................................. 149
Figure 35. Characteristics Likely to Increase Small Commercial Participation in Demand Response ...... 150
Figure 36. Small Commercial End-Use Customers’ Acceptable Demand Response Characteristics ........ 151
Figure 37. Characteristics Likely to Increase Small Commercial Participation in DG ................................ 152
Figure 38. Percentage of Upfront Costs that Must be Covered by Power Provided for Small Commercial Installations of Energy Storage Systems............................................................. 153
Figure 39. Characteristics Likely to Increase Small Commercial Participation in Energy Storage ............ 153
Figure 40. Managed Account End-Use Customers’ Awareness, Participation, and Adoption of DERs .... 154
Figure 41. Managed Account End-Use Customer Barriers to Demand Response Participation .............. 156
Figure 42. Managed Account End-Use Customer Barriers to DG Participation ........................................ 157
Figure 43. Managed Account End-Use Customer Barriers to Energy Storage Participation .................... 158

Acknowledgements v
Acknowledgements
This work was sponsored by Bonneville Power Administration. Cadmus would like to thank the invaluable support and guidance from BPA project manager Thomas Brim, technical advisor Frank Brown, the BPA contracting officer’s technical representative Melanie Smith, BPA’s Distributed Energy Resources Program manager Lee Hall, and BPA program staff including Cara Ford, Gwen Resendes, and Lori Barnett. Without their support, Cadmus could not have completed this project. Cadmus also owes a debt of gratitude to the many Power customers, regional stakeholders, DER service providers, and end-use customers who provided data instrumental to this study. Any remaining errors and omissions are Cadmus’.

Acronyms and Abbreviations vi
Acronyms and Abbreviations
Acronym or Abbreviation Definition
AMI Advanced metering infrastructure
AMR Automated meter reading
BPA Bonneville Power Administration
CAISO California Independent System Operator
Council Northwest Power and Conservation Council
DER Distributed energy resource
DG Distributed generation
DLC Direct load control
DR Demand response
EIM Energy Imbalance Market
EM&V Evaluation, measurement, and verification
FERC Federal Energy Regulatory Commission
IDSM initiative Integrated Demand-Side Management initiative
LBNL Lawrence Berkeley National Laboratory
M&V Measurement and verification
PEV Personal electric vehicle
PGE Portland General Electric
PSE Puget Sound Energy
PV Photovoltaic
SME Subject matter expert
TIP Technology Innovation Project

Executive Summary vii
1. Executive Summary
In recent years, the Bonneville Power Administration (BPA) with its partner public power utilities have conducted more than a dozen demand response (DR) pilots and demonstrations, and has shown through these tests DR’s potential effectiveness as a viable capacity measure in the Pacific Northwest. To inform BPA’s resource planning process and non-wires solution initiatives of using DR on a greater scale, BPA sought to understand the costs, potential available quantities of, and barriers to development of DR for public power in BPA’s service territory.
In parallel, in its Seventh Power Plan, the Northwest Power and Conservation Council (Council) recommended that BPA undertake an assessment of achievable DR potential and include that information in the BPA 2017–2018 Resource Program. The Council also recommended that BPA assess barriers to further development of DR by BPA and its Power customers, along with strategies to eliminate or minimize those barriers.
To address the Council’s recommendation and to meet its internal planning needs, BPA contracted with Cadmus to conduct two interrelated assessments. Assessment 1 provides estimates of both technically feasible and realistically achievable DR as well as two supplemental assessments of distributed generation (DG) and storage. Assessment 2 (this study) investigates market barriers that may impede the widespread adoption of DR products in areas served by BPA Power customers and identifies strategies that may help mitigate the identified barriers.
The two assessments provide BPA with an understanding of the magnitude and costs for procuring realistically achievable DR potential within its service area and the potential barriers that may hamper BPA’s ability to deploy the resources in a timely and cost-effective manner.
Although this assessment covers three classes of distributed energy resources (DER[s])—DR, DG, and storage—it mainly focuses on barriers to the deployment and adoption of DR, given its prominence in regional power resource planning. Several barriers applied to all three resources, while others applied only to DR.
The assessment began with a comprehensive literature search of DR barriers. To ensure capturing all relevant perspectives, Cadmus conducted research with representatives from all participant types in the DR market, including BPA subject matter experts, regional stakeholders and interest groups, BPA’s Power customers, and end-use customers. The information from market participants was obtained through 68 structured, in-depth, individual and group interviews with 162 representatives, along with 454 phone surveys and web surveys.
Data gathered from secondary sources, various stakeholders, and market actors indicate several barriers to the DR market’s optimal functioning, on both the demand and supply sides. The identified barriers fit into five broad categories: Economic/Market, Organizational/Operational, Infrastructure/ Technology, Legal/Regulatory, and Perceptions/Attitudes.

Executive Summary viii
1.1. Barriers to Demand Response Deployment The literature review revealed 21 barriers to DR deployment and nine barriers to DR adoption, in five broad categories. The interviews with 162 stakeholders revealed several additional barriers specific to the BPA or the Northwest region; Figure 1 uses an asterisk to denote those identified repeatedly. The figure depicts the most significant barriers identified through Cadmus’ research, including barriers that more than 50% of survey respondents rated as a 4 or 5 in level of significance on a scale of 1 (lowest) to 5 (highest) as well as barriers that emerged as recurrent themes in the interviews.
Figure 1. Key Demand Response Deployment Barriers
Barriers denoted with an asterisk emerged as common themes through the in-depth interviews with BPA subject matter experts, regional stakeholders, market actors, and power customers, but were not initially identified through the literature review or included in the barriers rating survey.
Based on the interview results, Economic/Market barriers emerged as the most critical obstacles to developing and deploying DR: interviewees rated the barriers related to valuation of DR as most

Executive Summary ix
significant. Additionally, because of the lack of a clear method for valuing DR—and therefore for pricing of DR, BPA and its Power customers cannot make a clear business case for investing in the development and deployment of these resources. Without resolving the question of value, it seems unlikely that BPA or its Power customers will be able to establish a rationale for DR and to gain the necessary organizational support, especially at the executive level, to make DR products and services a business priority.
The interview results also pointed to several significant Organizational/Operational, Infrastructural/ Technological, and Legal/Regulatory barriers to developing and deploying DR. Arguably, many of these barriers would be addressed, given adequate economic justification and a business case for BPA and its customers to invest in DR.
Substantial operational, infrastructure, and technology barriers to DR development impact Power customers and end-use customers. These include competition for staff and financial resources and potentially significant investment requirements due to the lack of, for example, a uniform communication protocol.
In addition, barriers related to BPA’s Power customers’ perceptions of and attitudes toward DR further constrain and impede its deployment. These include a perceived lack of long-term commitment to DR from BPA, a perceived lack of end-use customer demand, and perceived end-use customer participation barriers (such as a lack of awareness and concerns about adverse business effects [for commercial and industrial end-use customers]), a lack of comfort or privacy, and a loss of control). These secondary barriers represent real impediments to the region realizing the full potential for DR. The economic barriers will need to be addressed, however, and a clear need for DR must be recognized by the region before these secondary barriers can be fully mitigated.
Figure 2 shows the main categories of DR barriers and the criticality of and relationships between these various DR barrier categories.

Executive Summary x
Figure 2. Barrier Criticality and Relationships
1.2. Barriers to Demand Response Adoption Cadmus surveyed 454 end-use customers of 27 BPA Power customers (294 residential, 147 small commercial, and 13 managed account [i.e., large commercial and industrial] end-use customers) to gather information on their awareness, perceived barriers, and interest in participating in DR, DG, and storage programs.
In general, awareness, participation rates, and adoption of DR, DG, and storage are higher among small commercial and managed accounts than among residential end-use customers. Residential and small commercial end-use customers tend to be most familiar with the same three products: time-of-use rates, solar PV, and lithium-ion batteries. Managed account end-use customers are most familiar with load curtailment DR programs, standby generation, and lead acid batteries. While most end-use customers are aware of DR, DG, and storage, participation and adoption remain very low, mainly reflecting the limited number of BPA Power customers currently offering DR programs and products.
The cost of purchasing the necessary equipment emerged as a significant barrier to participation and adoption across all three end-use customer classes—though more so for DG and storage than for DR, as shown in Figure 3. Specifically, for residential and small commercial end-use customers, cost emerged as the most significant barrier across all three DER categories. Managed account end-use customers rated cost as the most significant barrier for DG and energy storage, but they rated interruptions to business and concerns about product quality as the most significant barriers to DR.

Executive Summary xi
Figure 3. Most Significant Barriers to Participation/Adoption, by Customer Class and Type of DER
Note: Respondents rated the significance of barriers to adopting DR, DG, and storage using a 5-point scale, where 1 means not at all significant and 5 means very significant. Percentages shown here are the total percentage of respondents who rated the barrier as highly significant (a 4 or 5 rating). Overall, residential and small commercial end-use customers perceived barriers to DR program participation as relatively less significant than did large end-use customers. While residential and small commercial end-use customers rated cost as the most significant barrier to adoption, they differed on the next most significant barriers. Residential end-use customers rated concerns about comfort as the second-most significant barrier to DR adoption, whereas small commercial end-use customers were more concerned about business interruptions than with costs.
With respect to barriers to DR participation, residential end-use customers rated concerns about loss of control over equipment or energy use almost as highly as concerns over home comfort. Interestingly, residential end-use customers considered privacy to be less of a concern.
1.3. Options for Mitigating Barriers This assessment’s results indicate that certain options and strategies, if pursued by BPA and/or other regional stakeholders, could effectively address—or lower—barriers identified on the demand-side (Figure 4) and supply-side (Figure 5). The recommended mitigation strategies are based on information gathered from a variety of sources, including interview findings, lessons learned from other states, relevant regional experience with energy efficiency, and expert judgment.

Executive Summary xii
Figure 4. Options for Mitigating Demand-Side Barriers
On the demand side, Economic/Market barriers represent the greatest challenges to DR. Although lack of a DR market and weak demand for DR represent the most challenging DR deployment obstacles, certain instruments can help address or lower these barriers. First, need exists for a formal measurement and verification (M&V) protocol, based on accepted methods, to help validate the DR products’ impacts and to establish their reliability and effectiveness in peak load management. A need also exists for a comprehensive DR valuation framework that allows systematic accounting of DR’s benefits from multiple perspectives. Addressing these barriers also requires effective institutional and organizational frameworks conducive to DR deployment.
Considerable economic barriers also appear to exist that may dampen DR supply in the Northwest. These barriers closely tie to demand-side economic barriers related to DR valuation; if capacity resources’ prices reflected their full values, utilities would likely be willing to pay more to acquire these resources. Many perceptual barriers on the supply side appear to stem from a lack of information

Executive Summary xiii
regarding DR’s potential adverse impacts. DR programs’ performance in other regions suggests these barriers can be reduced through information and education of end-use customers.
Figure 5. Options for Mitigating Supply-Side Barriers
The Northwest’s power market and the infrastructure supporting it are unique in ways important to DR deployment methods. Chief among these is the organization of the public-power sector and BPA’s role and relationship with its Power customers. Policies governing the operation of the region’s power system must factor in the interests of the many public and private entities engaged in the region’s power and conservation markets. Whereas certain barriers fall within BPA’s decision-making domain, many identified barriers can be addressed only through the collective regional action of all stakeholders. The Northwest region’s long history of collaboration on power planning and conservation includes the regional DR Advisory Committee, the Northwest Energy Efficiency Alliance (NEEA), and the Regional Technical Forum. These regional institutions serve as examples of organizations that potentially could address many key DR deployment and adoption barriers effectively.
1.4. Conclusions This assessment’s results point to a wide range of demand-side and supply-side obstacles to DR deployment and adoption. Although many of the same barriers exist in other parts of the country, specific economic and institutional barriers are unique to the Northwest’s power market. The lack of economic and institutional frameworks that provide for proper valuation and trading of DR resources appear to be the predominant impediments and have hampered a functioning DR market in the Northwest:
• The region lacks a region-wide load balancing authority and an organized forward capacity market.
• The abundance of hydroelectric resources and the consequent low avoided capacity costs have made it difficult for BPA, Power customers, and end-use customers to make the business case for DR.
• The weak demand for DR is, however, at least partly due to the absence of a regional framework for valuation of DR resources. A formal framework that establishes guidelines for accounting for all DR potential benefits in avoided or deferred generation, transmission, distribution, and ancillary services benefits could energize the regional DR market.
Economic
Perceptions/Attitudes
End-Use Customer (EUC) Barriers:
• EUC1: Develop and/or source marketing tools, case studies, and proven strategies to more successfully obtain predictable and sufficient DR enrollment and participation
• EUC2: Establish a regional forum to provide information, marketing, and communication resources for public power utilities to facilitate effective customer communication
• EUC3: Have appropriate incentive levels for large accounts
• Equipment Cost• Business Interruption• Product Quality
• Concerns About Comfort and Control
• Awareness, Knowledge

Executive Summary xiv
• A need exists to assess the price signals BPA communicates to its Power customers through contractual frameworks and rate structures; to mitigate economic barriers, those price signals would need to reflect the full value of DR resources, and align BPA Power customers’ interests with BPA’s.
The study results also pointed to several significant organizational, operational, and technology barriers to developing and deploying DR as well as to concerns about the reliability and availability of DR products as a substitute for conventional system capacity. A clearly defined and articulated need for DR, along with sound frameworks for measuring and valuing DR, could pave the way for a more active DR market in the region.
Concerns exist among end-use customers about DR’s costs and its potentially adverse effects on business operations and productivity, comfort, and control. Some of these concerns can be addressed with appropriate program design, education, and dissemination of information. Other concerns, such as costs and business interruptions, might be addressed with adequate incentives, provided there is sufficient value exists for BPA and its Power customers to support them.

Introduction 1
2. Introduction
The Bonneville Power Administration (BPA) has sponsored a comprehensive assessment of opportunities, costs, and barriers to the deployment and adoption of demand resources (DR) in its firm energy service area within the Pacific Northwest region. Although this assessment covers three classes of distributed energy resources (DER[s])—dispatchable DR assets, distributed generation (DG) (consisting of photovoltaics [PV], standby generation, and combined heat and power), and storage—it mainly focuses on barriers to DR’s deployment and adoption due to its prominence in existing regional power resource planning. Several barriers applied to all three resources, while others applied only to DR. Where appropriate, this report distinguishes DR from other DER (DG and storage).
The study was a two-part undertaking: Assessment 1 and Assessment 2. The first part, Assessment 1, focused on estimating realistically achievable quantities and prices of various DR products that will likely be available to BPA and its Power customers in the BPA public power service area over a 20-year planning horizon, from 2016 to 2035.1 Assessment 2 (this document) comprehensively surveyed barriers that might impede DR adoption in the BPA’s public power service area. A complementary document to Assessment 1, Assessment 2’s results inform the evaluation of achievable DR potential.
A separate report, BPA Demand Response Barriers Assessment and Potential Study: Gaps, Limitations, and Uncertainties, describes the gaps, limitations, and uncertainties in the data and estimating methods used for the assessments. The report highlights topics and issues for which no meaningful conclusions could be reached, and provides recommendations for improving data for future evaluations, methods for interviewing customers and stakeholders, and potential future research, field test, and pilot project needs.
2.1. Assessment Background The Pacific Northwest enjoys an abundance of hydroelectric resources, with the built-in capacity to respond quickly to peak power demand. This ability to meet peak loads has provided the region with more-than-adequate resources to meet electricity peak demand. Thus, the region’s public power customers have traditionally planned for new resources based on the need for energy (the long-term power supply over many hours or years) rather than capacity (meeting short-term instant or hourly peaks). However, due to increased constraints in operating the hydro system (to protect endangered fish and for other reasons), and as intermittent resources claim a growing share of the region’s power supply, the region’s public power portion is increasingly focusing its long-term resource adequacy planning to address capacity needs.
As the Northwest Power and Conservation Council (the Council) notes in its 2016 Seventh Northwest Conservation and Electric Power Plan (Seventh Power Plan), “The Northwest power system has gradually 1 In this study, the public power service area is comprised of publicly owned Power customers served by
the BPA.

Introduction 2
become less energy constrained and more capacity constrained.” At the same time, the BPA winter-peaking system has historically experienced a sharp rise in summer demand as the region’s number of summer days with extreme heat continues to climb and air conditioning loads increase, transforming the regional system into a dual-peaking system. The BPA portion of the region also is evolving into a dual-peaking power system.
2.2. Assessment Scope and Objectives In its Seventh Power Plan, the Council recommended that BPA undertake an assessment of achievable DR potential, and include the information from the assessment in the BPA 2017–2018 Resource Program (Council 2016, chap. 4). The Seventh Power Plan also recommended that the assessment include barriers to further development of DR by BPA and its Power customers, along with strategies to eliminate or minimize those barriers.
These two Seventh Power Plan recommendations were addressed through two interrelated assessments. The Assessment 1 Demand Response Potential focused on providing estimates of technically feasible and realistically achievable DR potential. Assessment 2 investigated market barriers that may impede widespread adoption of DR products in areas served by BPA Power customers. Assessment 2’s results also generated the information needed to evaluate achievable amounts of DR potential. Figure 6 illustrates the elements, outcomes, and interrelationships between the two assessments.
Figure 6. Interrelationship of Project Elements
Assessment 2 serves three key objectives: (1) it documents barriers to DR development and implementation in various markets and applications, from both the demand and supply sides of the

Introduction 3
market; (2) it identifies strategies that may help mitigate the identified barriers; and (3) it informs the assessment of achievable DR potential included in Assessment 1.
Although this assessment captured information about all three classes of DER—DR, DG, and storage—it mainly focused on barriers to DR deployment and adoption due to DR’s relative prominence in regional power resource planning. However, the study also documents some barriers unique to DG and storage. Some barriers applied to all three resources, while others applied only to particular DER.
DR’s deployment may be hampered by barriers related to the demand for and supply of DR. On the demand-side, BPA and its Power customers face several economic, contractual, and institutional barriers that may prevent them from acquiring DR. Economic, operational, and attitudinal barriers exist on the supply-side that may prevent end-use customers with the capability to dispatch DR resources from participating in DR programs. For BPA and its Power customers to realize the potential of DR products identified in Assessment 1, BPA and regional power system stakeholders need a comprehensive understanding of the barriers to further development and deployment of DR. This barriers assessment summarizes and catalogues the most critical barriers and identifies strategies to mitigate these barriers.
Assessment Methodology 4
3. Assessment Methodology
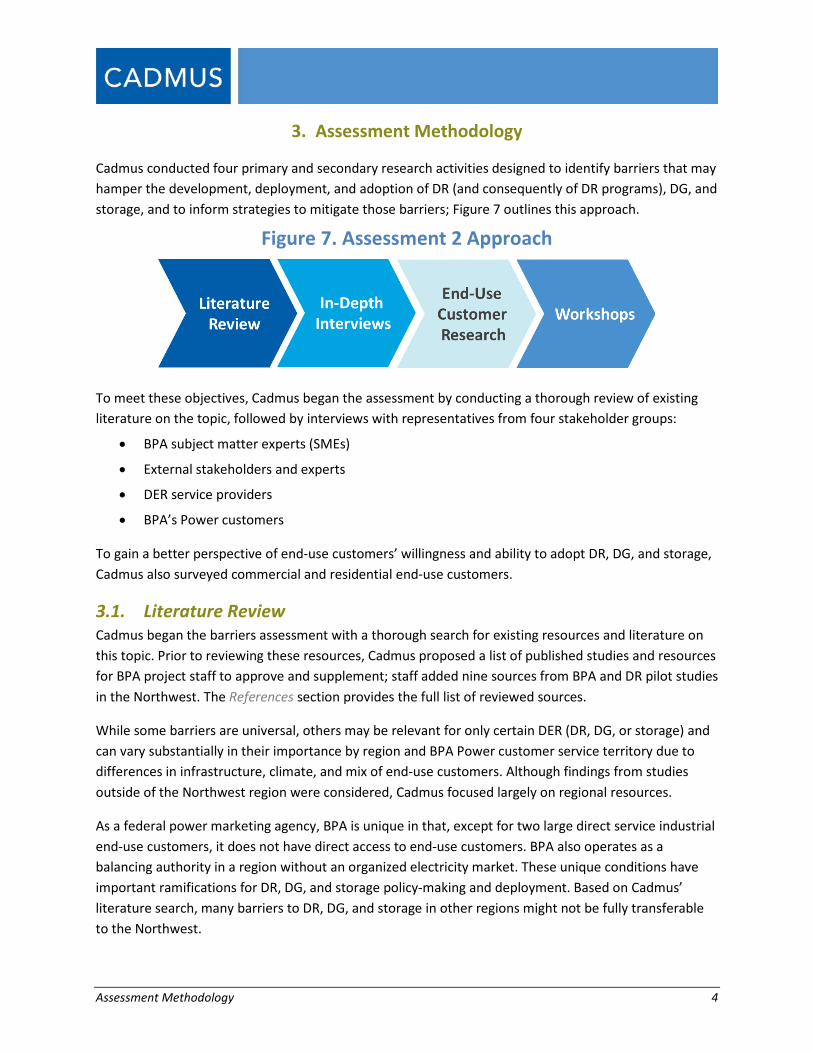
Cadmus conducted four primary and secondary research activities designed to identify barriers that may hamper the development, deployment, and adoption of DR (and consequently of DR programs), DG, and storage, and to inform strategies to mitigate those barriers; Figure 7 outlines this approach.
Figure 7. Assessment 2 Approach
To meet these objectives, Cadmus began the assessment by conducting a thorough review of existing literature on the topic, followed by interviews with representatives from four stakeholder groups:
• BPA subject matter experts (SMEs)
• External stakeholders and experts
• DER service providers
• BPA’s Power customers
To gain a better perspective of end-use customers’ willingness and ability to adopt DR, DG, and storage, Cadmus also surveyed commercial and residential end-use customers.
3.1. Literature Review Cadmus began the barriers assessment with a thorough search for existing resources and literature on this topic. Prior to reviewing these resources, Cadmus proposed a list of published studies and resources for BPA project staff to approve and supplement; staff added nine sources from BPA and DR pilot studies in the Northwest. The References section provides the full list of reviewed sources.
While some barriers are universal, others may be relevant for only certain DER (DR, DG, or storage) and can vary substantially in their importance by region and BPA Power customer service territory due to differences in infrastructure, climate, and mix of end-use customers. Although findings from studies outside of the Northwest region were considered, Cadmus focused largely on regional resources.
As a federal power marketing agency, BPA is unique in that, except for two large direct service industrial end-use customers, it does not have direct access to end-use customers. BPA also operates as a balancing authority in a region without an organized electricity market. These unique conditions have important ramifications for DR, DG, and storage policy-making and deployment. Based on Cadmus’ literature search, many barriers to DR, DG, and storage in other regions might not be fully transferable to the Northwest.

Assessment Methodology 5
Cadmus used the same approach to assess barriers from the Power customer’s perspective, including all barriers found in the literature review, even though some might not be applicable to public power customers served by BPA.
3.2. In-Depth Interviews In June and July 2017, Cadmus conducted 68 in-depth interviews with 162 BPA SMEs, external stakeholders, DER service providers, and Power customer representatives. These interviews accomplished the following:
• Revealed regional barriers to development and implementation of DR, DG, and storage in various markets and applications from multiple perspectives
• Exposed strategies to help mitigate the identified barriers
• Informed the assessment of achievable potential for DR
Each interview lasted approximately one hour.
3.2.1. Research Design and Objectives Through these interviews, Cadmus addressed the following research objectives:
• Understand DR, DG, and storage experience to date (through pilots, research projects, demonstration projects, and existing DR programs)
• Understand DR, DG, and storage perceptions and visions
• Identify perceived barriers
• Assess the perceived severity of regional, Power customer, and end-use customer barriers
• Assess the likelihood for regional development and deployment of specific DR, DG, and storage strategies and technologies (such as for use as a dispatchable DR asset)
• Explore potential strategies to overcome barriers
Each interview guide included open-ended questions to gather deeper and more qualitative insights on DER experience, visions, barriers, and mitigation strategies. Following the interview, participants completed a survey that included a structured set of questions for respondents to rate the significance of barriers to the development and deployment of DR, DG, and storage and the likelihood of the region realizing its potential for these resources.2
Structured Rating Battery Based on the literature review and input from Cadmus SMEs, Cadmus developed a list of 30 regional, Power customer, and end-use customer barriers. SMEs, stakeholders, and Power customers completed a web survey to rate the significance of each of those barriers (DER service providers completed the 2 Cadmus originally planned to ask interviewees to rate barriers during the interviews, but, after a few
interviews, it became evident that the rating exercise consumed too much of the limited interview time.

Assessment Methodology 6
survey over the phone as part of the interview). The survey was comprised of a structured set of questions that allowed respondents to rate the significance of these barriers (on a 1- to 5-point scale, where 1 was not at all significant and 5 was very significant) to the development and deployment of DR, DG, and energy storage products. Cadmus then compiled these ratings to classify and prioritize the deployment barriers.
The guide also included a structured set of questions for Power customer respondents to rate the likelihood of developing and deploying nine DER products and strategies (on a 1- to 5-point scale, where 1 was very unlikely and 5 was very likely). The BPA SMEs, stakeholders, and DER service providers focused on the likelihood of BPA’s portion of the region (where BPA sells firm energy and/or power) realizing optimal potential for the nine DER products and services. Cadmus used these ratings to inform the estimates of achievable potential in Assessment 1.3
3.2.2. Interview Request Process Cadmus developed materials to notify each interview group about the upcoming study and to request their participation. To encourage participation in the assessments, these introductory emails included a value proposition tailored to each group. This highlighted the potential benefits for the region and their organizations. The respondents were also assured of the confidentiality and anonymity of their responses, and that their inputs would only be used for drawing general conclusions.
In addition to the emails to request interview participation, Cadmus conducted two webinars to notify BPA Power customers and to encourage their participation in the interviews. These two webinars—one with BPA Power account executives and BPA energy efficiency representatives and the other with only BPA Power customers—provided an overview of the assessment goals and purpose, answered any questions they had about the research, and encouraged their participation in the study.
3.2.3. Completed Interviews Cadmus conducted interviews by telephone and in person through a mix of individual and small group settings. Table 1 shows the number of interviews completed by interview group. As some interviews included representation of multiple organizations, and there were multiple interviewees per organization in the small group sessions, the table identifies the number of organizations interviewed and the total number of interviewees.
3 The nine DER products and services investigated in this assessment were general DER strategies and do not directly correspond with the more specific products investigated for the BPA DR Potential Assessment. See Appendix G for specific descriptions of the nine DER strategies (question E3).
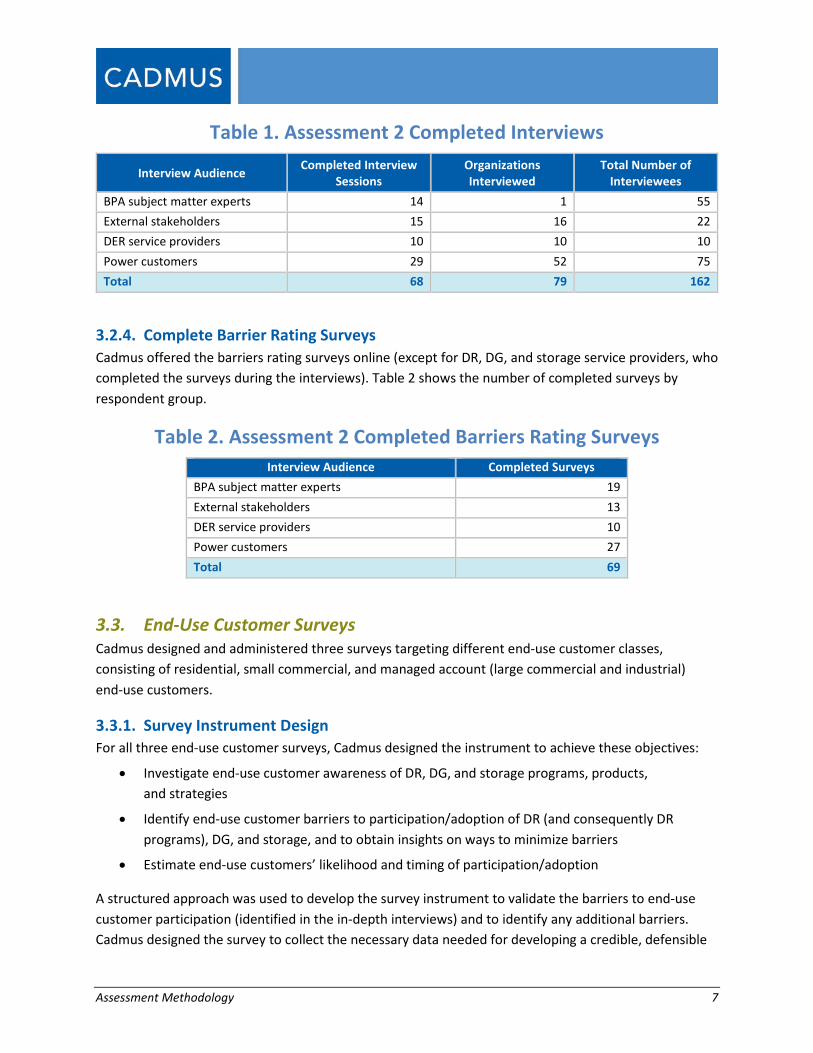
Assessment Methodology 7
Table 1. Assessment 2 Completed Interviews
Interview Audience Completed Interview Sessions
Organizations Interviewed
Total Number of Interviewees
BPA subject matter experts 14 1 55 External stakeholders 15 16 22 DER service providers 10 10 10 Power customers 29 52 75 Total 68 79 162
3.2.4. Complete Barrier Rating Surveys Cadmus offered the barriers rating surveys online (except for DR, DG, and storage service providers, who completed the surveys during the interviews). Table 2 shows the number of completed surveys by respondent group.
Table 2. Assessment 2 Completed Barriers Rating Surveys Interview Audience Completed Surveys
BPA subject matter experts 19 External stakeholders 13 DER service providers 10 Power customers 27 Total 69
3.3. End-Use Customer Surveys Cadmus designed and administered three surveys targeting different end-use customer classes, consisting of residential, small commercial, and managed account (large commercial and industrial) end-use customers.
3.3.1. Survey Instrument Design For all three end-use customer surveys, Cadmus designed the instrument to achieve these objectives:
• Investigate end-use customer awareness of DR, DG, and storage programs, products, and strategies
• Identify end-use customer barriers to participation/adoption of DR (and consequently DR programs), DG, and storage, and to obtain insights on ways to minimize barriers
• Estimate end-use customers’ likelihood and timing of participation/adoption
A structured approach was used to develop the survey instrument to validate the barriers to end-use customer participation (identified in the in-depth interviews) and to identify any additional barriers. Cadmus designed the survey to collect the necessary data needed for developing a credible, defensible
Assessment Methodology 8
estimate of DR, DG, and storage participation and adoption for the full range of scenario assumptions. Survey questions asked about end-use customers’ awareness, interest, ability, and willingness to adopt DR programs and products. The survey design used a structured sequence of questions to estimate the impacts of various DR attributes and capabilities (such as notice periods before a DR event is called or the event’s duration and frequency) on the likelihood of participation, as appropriate to each end-use sector. (Appendix G: Data Collection Instruments provides a copy of the end-use customer survey instruments.)
3.3.2. Survey Mode and Administration For the residential and small commercial end-use customer target audience, Cadmus conducted the surveys online and purchased a sample of contacts through Qualtrics, an online survey software vendor. Cadmus programmed the surveys in the Qualtrics online survey software, and then supplied the vendor with Power customer–approved zip codes to identify a sample of applicable contacts. Cadmus coordinated with BPA Power customers to obtain approval to survey their residential and small commercial end-use customers. Power customers were screened out if they did not grant Cadmus permission to survey their end-use customers. The survey was designed to take 10 to 15 minutes to complete, and end-use customers had up to two weeks to take the survey.
For managed account end-use customers, Cadmus conducted the surveys by telephone, coordinating with Power customers to obtain approval to survey their end-use customers and to collect a list of end-use customer contacts. Prior to contacting the managed account end-use customers, Cadmus prepared prenotification letters for BPA Power customers to share with their managed accounts and created an assessment overview for Power customer call centers and staff, should end-use customers contact them with survey inquiries. Each survey call lasted 20 to 30 minutes, and responses were entered the Qualtrics online survey software.
3.3.3. Sample Disposition Cadmus originally stratified the end-use customer survey sampling by market segment and region to represent the distribution of BPA Power customers. Due to timing constraints and challenges in obtaining approval from each customer, Cadmus adjusted the sampling expectations for all three types of end-use customer surveys. Table 3 shows the original sampling plan (i.e., the target number of completions) and the final sample achieved for each survey.
The final samples exceeded the total target number of completions for the residential and small commercial end-use customer surveys, but did not achieve targets for the managed account end-use customer surveys. The residential and small commercial survey samples achieved 90% confidence and ±10% precision around survey responses for each stratum. The managed account survey results should be interpreted as qualitative and directional.

Assessment Methodology 9
Table 3. End-Use Customer Survey Sampling End-Use
Customer Class Market Segment Region Target Completions Achieved Completions
Residential
Owners West 70 79 Owners East 70 74 Renters West 70 92 Renters East 70 49
Residential Total 280 294
Small Commercial — West 70 93 — East 70 54
Small Commercial Total 140 147
Managed Account
Commercial Buildings Mix of East/West 25 3
Public Buildings Mix of East/West 25 3 Industrial Facilities Mix of East/West 25 6
Agriculture Sites Mix of East/West 25 1 Managed Account Total 100 13
Table 4 shows the region and BPA Power customer peak load representation in the end-use customer survey samples. The BPA Power customers, represented by the residential and small commercial survey respondents, produced 49% of the total BPA system peak load. BPA Power customers represented by the managed account survey respondents accounted for 13% of the total BPA system peak load.
Table 4. Survey Respondent Count and Percentage of BPA System Peak Load, by Customer Class
End-Use Customer Class Count of Power Customers Represented
Percentage of Total System Peak Load East West
Residential 13 14 49%
Small Commercial Managed Account 5 3 13%
3.3.4. Data Analysis After completing the surveys, Cadmus analyzed the survey data using statistical software. Using the Qualtrics text analysis tool, Cadmus analyzed responses to open-end survey questions and, where applicable, tested survey results for significant differences by region (east versus west), Power customer size (large versus small), and homeownership status (owners versus renters), at the 5% (p≤0.05) and 10% (p≤0.10) significance levels.

Assessment Methodology 10
3.4. Workshops Upon completing the research activities and writing a BPA-approved summary of findings, Cadmus organized and facilitated two separate two-hour stakeholder workshops—one in Richland, Washington, and one via webinar—to present and discuss findings from Assessment 2, the barriers assessment.
Approximately 60 attendees from a variety of organizations (including BPA, Power customers, and regional stakeholders) joined the in-person workshop or the webinar.

Research Findings: DR Deployment Stakeholder Experience, Perceptions, and Visions for DR, DG, and Storage 11
4. Research Findings: DR Deployment
Cadmus researched barriers to DR, DG, and storage by obtaining a broad range of stakeholder perspectives on their potential in the BPA Power supplied portion of the region, and the barriers that might impede achieving DR potential. Although stakeholders’ experience with DR, DG, and storage and their future expectations varied, they shared many perceptions about the value of these resources to the region, and about the most significant barriers to deployment and adoption. Although this assessment covered all three classes of DER, the discussion of barriers focuses primarily on DR deployment. The deployment and adoption of DR may be characterized in terms of conventional supply and demand dynamics:
1 Demand for DR (deployment) arises from regional entities such as BPA and its Power customers, which, in effect, are DR end-use customers and which acquire DR services to meet their system planning objectives. Demand also arises from DR service providers which facilitate deployment of DRs on behalf of regional entities.
2 Supply of DR (adoption) arises from end-use customers that agree to curtail or shift their electricity consumption (or have it automatically curtailed) in response to an anticipated demand peak (DR), or who supply power from on-site DG or storage
This report section synthesizes research findings regarding the deployment of DR from the perspective of various participants in the market.4 It begins with a brief summary of stakeholders’ experiences, perceptions, and visions for DR, DG, and storage—by stakeholder groups interviewed, and then discusses research findings on barriers to DR deployment. Five major categories of DR barriers are presented, with a synopsis of each individual barrier, followed by a list of mitigation strategies that BPA and/or regional stakeholders could consider pursuing to address those barriers. The section is organized as follows:
• Stakeholder Experience, Perceptions, and Visions for DR, DG, and Storage (by stakeholder group)
• Synopsis of DR Deployment Barriers
• Economic/Market Barriers and Mitigation Strategies
• Organizational/Operational Barriers and Mitigation Strategies
• Infrastructure/Technology Barriers and Mitigation Strategies
• Legal/Regulatory Barriers and Mitigation Strategies
• Perceptual/Attitudinal Barriers and Mitigation Strategies
Section 5 of this report synthesizes research findings regarding the adoption of DR, DG, and storage, from the perspective of end-use customers.
4 Appendices A through H provide detailed findings from each research activity.

Research Findings: DR Deployment Stakeholder Experience, Perceptions, and Visions for DR, DG, and Storage 12
4.1. Stakeholder Experience, Perceptions, and Visions for DR, DG, and Storage
Cadmus began each stakeholder interview by asking about interviewees’ experience with, perceptions of, and vision for DR, DG, and storage. A summary of findings by stakeholder group follows.
4.1.1. BPA Subject Matter Experts Cadmus conducted 14 small-group interviews with 55 SMEs from BPA, most of whom work in BPA’s Power Services and Transmission Services organizations, along with six BPA corporate and executive representatives. The SMEs’ exposure levels to DR, DG, and storage varied widely, depending on the category (power, transmission, or administration). The DER experts shared the results from numerous past pilots, research and development, field tests, and demonstration projects as well as from information about current projects. Other SMEs from Power Services and Transmission Services generally indicated that they currently planned or were involved in current or past DR pilots and demonstrations.
BPA SMEs generally agreed on several key sources of DR, DG, and storage value to BPA. SMEs almost unanimously noted DR ensuring power and transmission system reliability as DR’s primary value to BPA. SMEs believe these resources could provide valuable ancillary services to balance intermittency caused by growing wind and solar resources, and—in the case of storage systems—to store the oversupply of hydro resources and growing renewable resources and to help balance power generation intermittency. For the transmission system, SMEs indicated an interest in continuing to explore DER as a flexible and scalable deferral (non-wires) alternative to transmission system expansion.
While recognizing the potential value of DR, BPA Power Services and Transmission Services experts raised concerns about BPA’s ability to realize that value. They perceived significant external barriers to investing in DR development, from the absence of an organized commercial DR and capacity market and a lack of capacity needs, to low capacity and energy prices, and the necessity of greater cost control in response to increasing ratepayer concerns. BPA would need to invest in establishing proper valuation, financial modeling, and accounting of DR—as well as in establishing better legal and contractual structures for DR—to achieve DR’s full potential. Faced with the external barriers described above, SMEs do not see a need to invest in developing the legal framework, infrastructure, and organizational capability to deploy DR.
Several BPA SMEs also expressed concerns about the reliability of DR and external commercial DR services, particularly as a means of avoiding or deferring transmission system expansion. Achieving the valuation framework discussed earlier would allow for a more complete accounting of DR benefits and costs to BPA’s power resource and transmission planning as well as to BPA’s Power customers. Interviewees expressed less concern about infrastructure or technology barriers, which would be much easier to overcome if BPA had a clearly defined business case for DR.

Research Findings: DR Deployment Stakeholder Experience, Perceptions, and Visions for DR, DG, and Storage 13
Since 1995, BPA’s operations have been organized in separate business units. This has produced independent planning processes, which, according to SMEs, created an institutional barrier to implementing DR. SMEs indicated that this barrier will likely become less severe due to BPA’s Integrated Planning initiative, launched in 2015, which aims to integrate energy efficiency and DR into BPA’s overall power and transmission planning, systems, and operations as well as bring more consistency to Power and Transmission planning processes.
4.1.2. BPA Power Customers Cadmus conducted 29 individual and small-group interviews with representatives from 52 of BPA’s Power customers, including nine of the largest Power customers (as defined by total annual energy consumption).
BPA Power customers’ experience with DR, DG, and storage varies widely, depending on their distinct operational needs and challenges. Overall, of the three DER categories, Power customers across the residential, commercial, and industrial sectors had the deepest experience with DR, and several had participated in BPA’s pilot DR projects. Regarding DG, the interviewees spoke almost exclusively of solar generation, especially small rooftop or community solar installations, with which they had experience. Among the three DER measure categories investigated, Power customers had the least experience, by far, with storage.
Power customers did not share a common vision for the future deployment of DR—and of DER in general—in the Northwest. This stemmed largely from Power customers’ characteristics varying widely, depending on their size, governance structures, and contractual relationships with BPA, their operational needs, and the availability of human resources. Despite differing visions, interviewees largely agreed that economic barriers, coupled with their end-use customers’ lack of knowledge or interest, are the primary impediments to the future deployment of these resources in the Northwest.
Most Power customers emphasized economic barriers as critical impediments to DR deployment. A common refrain was that it must make “economic sense” to both Power customers and their end-use customers. The economic barriers identified included the lack of a methodology for DR valuation, low power costs, the absence of an organized commercial DR market in the Northwest, and the absence of incentives for DR services in the existing rate structures and contracts with BPA. In 2010, BPA introduced new tiered rates, with an embedded demand charge and load-shaping charge for certain types of BPA Power customers, which created an incentive for those BPA Power customers to manage their load better (this rate only applies to about 125 mostly small and medium Power customers that purchase about 40% of BPA Power sales; about 15 mostly large Power customers with their own generation purchase the remaining 60% of BPA’s firm Power sales, and are not subject to these rates). A handful of small and medium BPA Power customers have started experimenting with DR to reduce their peak demand charges. None have been consistently successful in producing predictable or meaningful demand charge reductions.

Research Findings: DR Deployment Stakeholder Experience, Perceptions, and Visions for DR, DG, and Storage 14
Power customers also believed significant barriers prevent their end-use customers from adopting DR. As one respondent said, in an industry where end-use customers have traditionally “[paid] their bill and not [thought] about it,” anything intrusive to end-use customers is a barrier to implementing DR. Several Power customers said that even if there were a clear business case for DR, DG, or energy storage, they would only offer a program if there was interest among end-use customers.
Other interviewees said end-use customer interest would be only one of multiple important considerations regarding deployment of DR, DG, and storage. Several larger Power customers believed their end-use customers will begin to expect more from their Power provider, as future technological breakthroughs disrupt the Power customer’s traditional business model. These Power customers are frustrated by the pace at which the utility industry is adapting to transformations in energy markets and are keen to “get ahead of the curve” before “grid power is obsolete” by initiating DR pilots, launching programs, and developing their own in-house technical knowledge of DER.
4.1.3. External Stakeholders Cadmus interviewed 16 external stakeholder organizations, representing a diverse range of prominent entities involved in the Northwest’s energy policy and planning, including investor-owned utilities, environmental and end-use customer advocates, and state and federal agencies. These groups’ experience with DER primarily related to DR, although several stakeholders had limited experience with storage and DG projects.
Several of these stakeholders believed the Northwest energy market will likely transform dramatically, which one stakeholder described as a “huge tectonic shift” away from traditional capital-intensive strategies. However, stakeholders’ visions varied, depending on their industry perspectives: market- and technology-oriented stakeholders and long-term planning and advocacy organizations had visions of substantial change, while Power customers and regulatory stakeholders tended to have more conservative visions, predicting more gradual change.
DR deployment in the Northwest is expected to take place in an environment that many stakeholders described as unique and complex. Specific characteristics that stakeholders highlighted included the diversity of BPA’s public power customers, the region’s winter peak demand, the prominence of hydro-power, the Northwest’s interconnection to California’s power market, low-load growth in many Power customer service territories, and the evolving nature of the Northwest’s power market.
Many stakeholders indicated that the Northwest will become increasingly reliant on DR, DG, and storage in the future, offering several indicators as evidence of this trend. They frequently noted that BPA’s recent (May 2017) decision not to build the I-5 corridor transmission reinforcement highlights the significance of DER to alleviate regional transmission constraints. Stakeholders further indicated that the principal factors driving the adoption of these resources will be the retirement of regional coal-fired power plants, future transmission and distribution constraints, the need for resiliency against extreme weather and future climate scenarios, and system reliability.

Research Findings: DR Deployment Stakeholder Experience, Perceptions, and Visions for DR, DG, and Storage 15
Although stakeholders generally recognized the need for DER in the Northwest’s future power system, several stakeholders expressed concerns that regional decision makers do not feel a sense of urgency to develop DER for system resiliency, which might hinder or slow the pace of DER adoption. For the region to achieve DER’s full potential, stakeholders highlighted the need for regional, long-term planning now, ensuring resources will be available to operationalize and build out DER infrastructure when needed. They also suggested that BPA will need to take an end-use customer–focused approach to the energy marketplace, which engages end-use customers in DR, DG, and storage deployment and, consequently, commercial DR product offerings.
4.1.4. DER Service Providers Cadmus interviewed 10 entities that have been engaged in DER implementation in the Northwest, including companies that manufacture DR-related products, companies that develop technologies to enable DR, and DR aggregators. Eight of these entities work in DR, and have primarily provided capacity-oriented DR products in the Northwest (including summer and winter peak demand products with programs designed to reduce capacity in specific locations). Cadmus also interviewed two companies in the energy storage market—one that develops utility-scale projects and one that works on distributed storage that can be aggregated to create virtual power plants. All of the service providers are active in the Pacific Northwest market, though only a few of them have developed specific projects in the Northwest.
DER service providers were generally optimistic about the future of DR and storage in the Northwest and nationally. Although they stated that the Northwest is unlikely to need additional capacity in the short term, service providers believe the need to integrate the growing intermittent renewable resources into the grid will create opportunities for these resources. Both energy storage and DR service providers stated that they expect the business case for these resources to be made based on the value associated with load shifting and ancillary services (such as regulation, reserves, and load following) as well as distribution-level benefits that can help with the integration of renewable resources (such as voltage support and improving power quality.)
The primary DR barriers identified by the service providers included the lack of a defined need for DR, low power prices in the Northwest, and the lack of long-term programs in the region. Service providers believed that BPA and its Power customers have run many pilots and demonstrations, and it is now time to use the lessons learned from these pilots and demonstrations to launch full-scale programs for needs that BPA has identified can be met through DR. Service providers noted that today’s best practice for DR deployment begins by providing a clear definition of the system needs and program requirements, and then by allowing service providers to design product offerings that best meet the defined need over the long term.
To reach DR’s full potential in the Northwest, service providers believed a need exists to educate end-use customers, Power customers, and other stakeholders to ensure an understanding of DR’s potential role and to address some misconceptions about DR (based on old technologies) that no longer reflect

Research Findings: DR Deployment Stakeholder Experience, Perceptions, and Visions for DR, DG, and Storage 16
current market conditions. Several service providers considered the Northwest likely to deploy DR to its full potential over the next 10 to 15 years.
4.1.5. BPA’s Role Cadmus asked interviewees what role, if any, they envisioned for BPA in the development and deployment of DR, DG, and storage. Interviewees’ opinions varied, but they converged on three themes:
• Power customer partner and facilitator of Power customer programs. A BPA energy efficiency expert posited that BPA will facilitate the shared value stacking that may be provided by Power customers’ existing or planned DR, DG, and storage development, but that BPA will not directly engage in deploying DER. Several Power customers also said it is not their role to develop these resources: this group shared the vison of BPA as a leader or “total partner” and want BPA to work collaboratively with Power customers to develop programs and incentive mechanisms to develop and deploy programs. Although these Power customers would like to be involved in developing programs, they stressed, “We should handle the [end-use] customer/load-facing side, and BPA should handle the non-customer-facing side.”
• Provider of clear price signals. A group of smaller BPA Power customers believed that BPA should lead by sending clear price signals to Power customers through their wholesale Power sales contract, demand charges (if applicable), or incentives, and that the Power customer would then decide how to respond.
• Provider of information and technical assistance. A group of smaller BPA Power customers and several external stakeholders envisioned BPA’s role as an educator and disseminator of information that could “help bridge staffing gaps,” act as a “conduit for technical resources,” and “share expertise and its centralized body of knowledge” with Power customers. For example, one Power customer said BPA did a good job in developing an implementation manual for energy efficiency, which provides granular technical and savings data on the energy efficiency technologies, and said they would like a similar manual to be developed for DR, DG, and storage. External stakeholders suggested that BPA could mitigate staffing shortages affecting the implementation of DR programs by small Power customers by providing technical support. A BPA DER expert noted that this is the role for which BPA is most suited and reflects how it currently operates.

Research Findings: DR Deployment Summary of DR Deployment Barriers 17
4.2. Summary of DR Deployment Barriers Through a comprehensive literature review, Cadmus identified 21 barriers to DER deployment and nine barriers to DER adoption, primarily focused on DR, in five broad categories. SMEs, stakeholders, and Power customers completed a web survey to rate the significance of each of these barriers (DER service providers were asked to complete the survey as part of the interview). In addition to those 30 barriers, the interviews revealed several additional barriers specific to BPA or the Northwest region: those referenced repeatedly are denoted with an asterisk in Figure 8. The figure depicts the most significant barriers identified through Cadmus’ research, including those which more than 50% of survey respondents rated as a barrier significance of 4 or 5 on a scale of 1 (lowest) to 5 (highest) and those emerging as recurrent themes in the interviews.
Based on the interview results, Economic/Market barriers emerged as the most critical obstacles to developing and deploying DR: interviewees rated the barriers related to valuation of DR as most significant; additionally, because of the lack of a clear method for valuation of DR, and therefore pricing of DR, BPA and its Power customers are unable to make a clear business case for investing in the development and deployment of these resources. Without resolving the question of value, it seems unlikely that BPA or its Power customers will be able to establish a rationale for DR and gain the necessary organizational support, especially at the executive level, to make DR products and services a business priority.

Research Findings: DR Deployment Summary of DR Deployment Barriers 18
Figure 8. Key DR Deployment Barriers
Barriers denoted with an asterisk emerged as common themes through the in-depth interviews with BPA SMEs, regional stakeholders, market actors, and power customers, but were not initially identified through the literature review or included in the barriers rating survey.
The interview results also pointed to several significant Organizational/Operational, Infrastructural/Technological, and Legal/Regulatory barriers to developing and deploying DR. Arguably, many of these barriers would be addressed given adequate economic justification and a business case for BPA and its Power customers to invest in DR.
There are substantial operational, infrastructure, and technology barriers to DR development that impact Power customers and end-use customers. These include competition for staff and financial resources and the potentially significant investment requirements due to lack of a uniform communication protocol and advanced metering infrastructure (AMI).

Research Findings: DR Deployment Summary of DR Deployment Barriers 19
In addition, there are various awareness, perception, and attitudinal barriers that further constrain and impede the development of DR. These include a perceived lack of long-term commitment to DR from BPA; perceived lack of end-use customer demand; and perceived end-use customer participation barriers such as lack of awareness, concerns about adverse business effects (for commercial and industrial end-use customers), comfort, privacy, and loss of control. These secondary barriers represent real impediments to the region realizing the full potential for DR; however, the economic barriers will need to be addressed, and a clear need for DR must be recognized by the region before these secondary barriers can be fully mitigated.
Figure 9 shows the main categories of barriers to DR and the relationships between the various barrier categories.
Figure 9. Barrier Relationships
The barriers in each of these categories are discussed in detail in Sections 4.3 through 4.7. Each category of barriers has a table with the barriers ratings (from the survey), followed by a narrative description that includes additional barriers and insights that emerged from the in-depth stakeholder interviews.5
5 Cadmus developed the barriers rating surveys prior to conducting the stakeholder interviews. For that reason,
the barriers presented in the ratings tables do not correspond perfectly with the narrative. In addition, while barriers ratings are presented in order of significance rating, the narrative discusses the barriers in an order that reflects criticality.

Research Findings: DR Deployment Economic/Market Barriers and Mitigation Strategies
20
4.3. Economic/Market Barriers and Mitigation Strategies
4.3.1. Barriers Economic barriers are the most critical impediments to DR, DG, storage development, and DR program deployment. The lack of a region wide framework for valuing and pricing DR, prevailing low regional avoided capacity costs, low energy prices, and the absence of an organized commercial DR market were identified as the most critical economic barriers to developing these resources. Without a well-defined framework for the comprehensive accounting of the benefits and costs of DR, DG, and storage from the multiple perspectives of BPA, Power customers, and end-use customers, the market and price signals will be too weak to offset the effects of low regional power prices. And without a sufficient business case for developing DER, the region, BPA, and Power customers are unlikely to invest in DR, DG, and storage and, consequently, realize the potential benefits.
The lack of a clearly defined and articulated need for DR, DG, and storage in the region is another critical barrier to development. Because BPA and most BPA Power customers are not capacity constrained, and current market price signals for DER and DR products and services are weak, they do not see a compelling business case for developing these resources. Moreover, BPA’s Power customers have different power purchase agreements with BPA, limiting their flexibility in reacting to price signals.
Table 5 shows how interviewees rated the significance of the six Economic/Market barriers included in the barriers rating survey. The key economic barriers, based on the barriers rating survey results and in-depth interviews, are summarized below the table.
Table 5. Economic/Market Barriers by Interview Group and DER Category
Barrier Demand Response DG Energy Storage
SME n=17
STK n=12
PC n=25
DSP n=7
SME n=16
STK n12
PC n=25
DSP SME n=16
STK n=12
PC n=24
DSP n=4
Lack of Power customer business case 65% 75% 73% 86% 56% 83% 72% -- 81% 83% 76% 75% Lack of defined need/value to BPA 59% 42% 64% 100% 56% 42% 56% -- 50% 50% 58% 75% Low power costs 56% 46% 70% 71% 59% 92% 85% -- 65% 58% 69% 25% Absence of an organized commercial DR market
61% 54% 59% 57% 13% 23% 24% -- 35% 46% 55% 50%
Cost of development/deployment 50% 46% 68% 29% 59% 77% 67% -- 88% 85% 89% 50% Lack of well-defined measurement and verification framework
46% 18% 35% 14% 33% 27% 14% -- 50% 27% 41% 25%
SME=BPA Subject Matter Experts; STK=Regional Stakeholders; PC=BPA Power Customers; DSP=DER Service Providers. This table shows the percentage of respondents rating the barrier as a 4 or 5 on a 1- to 5-point significant rating scale. Cells with “--” indicate barriers that Cadmus did not ask respondent groups to rate.

Research Findings: DR Deployment Economic/Market Barriers and Mitigation Strategies
21
Lack of Defined BPA Need for and Value of DR Lack of a clearly defined need for and value of DR to BPA was identified as one of the most significant barriers to further development of DER. Many BPA experts believe BPA can only develop and deploy DER that address a clearly defined resource or grid system operational need. Long-term Power planners do not project significant load growth or water shortages in the foreseeable future. As a result, from a long-term planning perspective, BPA does not have an immediate capacity resource need that DR resources can fulfill. Experts in Power operations also expressed that they do not have an explicit operational need for DER, but said if they “really [needed DER], [they would] find a way to do it.” They believe it will be easier to address other operational barriers of integrating DR, DG, and storage in the current infrastructure if an operational need is clearly identified. On the transmission side, planners mentioned that, other than the few areas of seasonal congestion that may be mitigated by localized DER, there is excess capacity and “almost never congestion.” As a result, they believe DR, DG, and storage may only serve small-scale “niche, situational purposes.”
Relevant mitigation strategies: EM1, EM2, EM3
Low Power Costs Low regional energy prices were identified as another key barrier to DER development and deployment. Low power costs have made it difficult to build the business case (to BPA, Power customers, and end-use customers) for DER in the region. Power customers said there is little incentive until the costs for DR, DG, and storage decrease relative to wholesale contract rates and market prices.
Relevant mitigation strategy: EM3
Lack of a Region-Wide Framework for Valuing and Pricing DER The complexity of assigning quantifiable, monetary value to DR, DG, and storage emerged as a primary barrier to the development and deployment of these resources in the Northwest. The region generally—and BPA specifically—does not have a structure in place to adequately value the costs and benefits of DER. The region has not explicitly measured the value of the ancillary services and benefits of DR, DG, and storage (such as DR and storage products helping to vary load to offset the variability of renewable resources). Furthermore, the region currently lacks a benefit/cost distribution or value-stacking structure for these resources (the stacking of various revenue streams provided by DER to fully obtain the maximum return on investment). For example, using the stacked values of ancillary services, added to a primary DR, DG, or storage purpose (as opposed to the value of just one primary service), could make DER more cost-effective. Because of the lack of a clear and comprehensive valuation framework, it is difficult to identify the correct price to pay customers for deploying DR resources and to demonstrate how DR competes with traditional generating resources and market supplies of capacity.
Relevant mitigation strategy: EM1

Research Findings: DR Deployment Economic/Market Barriers and Mitigation Strategies
22
Absence of an Organized Commercial DR Market BPA SMEs, regional stakeholders, and Power customers all identified the absence of an organized commercial DR market as a key barrier to DR development in the Northwest. Without an organized forward capacity market, where DR can be competitively traded as a capacity resource, market signals and capacity requirements for DR can be unclear, and there is no mechanism to easily aggregate and transfer DR assets across balancing authorities. BPA is one of many balancing authorities in the Northwest that operate independently of one another without a central dispatcher, making DR transactions across balancing authorities challenging and costly, as BPA must develop and execute complex additional bilateral contracts with these other balancing authorities.
Relevant mitigation strategy: EM4
Inadequate/Inconsistent Price Signals Without an organized forward capacity market where DR can be competitively traded as a capacity resource, market signals and capacity requirements for DR can be unclear. Most interviewed Power customers did not see a need to reduce their own system load. Several said they had not seriously considered developing DR because they were not incentivized to do so by the rate structure in their contractual relationship with BPA. Furthermore, BPA’s existing Power supply contracts have not communicated clear signals to Power customers—load-following customers may receive some price signals due to weak demand charges, whereas slice/block customers without demand charges have less of an incentive to consider DER for power bill reduction purposes.
Relevant mitigation strategies: EM3, EM4
Cost of Development and Deployment According to SMEs, DR, DG, and storage development and deployment is more expensive than other solutions to BPA needs, especially considering low power costs. The costs of these resources could deter some experts from “even trying to see how [they] can get rid of these barriers to DER.” These experts also mentioned other resources at their disposal that are cheaper than DR, DG, and storage. For example, an expert in Power operations mentioned that resources such as stored water power or thermal generation excess capacity are cheaper balancing reserves than DER. Transmission operations have many similar opinions and options: “The traditional generators [used to reduce congestion through redispatch] are just cheaper.” Changing commercial relationships (e.g., ending sales of unlimited hourly firm and/or non-firm transmission during periods of congestion) are another low-cost and high-impact option. Transmission planners would only use DER that prove cost-effective to defer a transmission project. Furthermore, Power customers said there is little incentive until costs for DR, DG, and storage decrease relative to wholesale contract rates.
Relevant mitigation strategies: EM3, EM4

Research Findings: DR Deployment Economic/Market Barriers and Mitigation Strategies
23
Lack of a Power Customer Business Case Due to a lack of current and expected future capacity constraints and inadequate market and price signals for DR product services, DG, and storage, many Power and Transmission customers lack a business case for further developing these resources.
Relevant mitigation strategies: EM3, EM4
4.3.2. Mitigation Strategies As discussed in Section 4.2, the DR’s optimal development and deployment depends on the existence of a functioning market that reflects the full benefits and costs of those resources. For the desired DR resource levels to be developed and made available, BPA Power customers will need to be able to properly quantify their value to their system and to BPA. Absent an organized commercial DR market, where these resources can be readily traded between balancing authorities, the onus remains on BPA to clearly signal prices for these resources.
Cadmus identified four actions to help mitigate Economic/Market barriers to developing and deploying DR resources. These mitigation strategies draw upon a variety of sources, including interview findings, lessons learned from other states, relevant regional experience with energy efficiency, and expert judgment.
Mitigation Strategy EM1: Establish a comprehensive DR valuation framework for public power that includes benefit stacking
Goal: Enable consistent, comprehensive valuation of DR resources to support a functioning market To establish a functioning market for DR resources, the region requires a well-defined framework for comprehensively accounting for DR benefits and costs from the multiple perspectives of BPA, Power customers, and end-use customers, including an agreed-upon method for stacking DR benefits and ancillary services across BPA, Power customers, and end-use customers. Such a framework, which would allow comprehensive and consistent valuation of DR resources, would serve as a foundation for establishing price signals aligned with value. In the absence of such a framework, BPA and other regional stakeholders should expect the development of DR resources to remain undervalued, falling short of their optimal levels.
Several states with a record of successful DR deployment began the process by developing such valuation frameworks. California, for example, developed a framework and procedures for measuring impacts.6 Massachusetts and Pennsylvania have developed similar frameworks. The Council’s Demand
6 PJM: http://www.pjm.com/~/media/library/reports-notices/demand-response/20170628-pjm-demand-
response-strategy.ashx; ISO New England: https://www.iso-ne.com/markets-operations/markets/demand-resources; CA DR Cost Effectiveness: http://www.cpuc.ca.gov/General.aspx?id=7023

Research Findings: DR Deployment Economic/Market Barriers and Mitigation Strategies
24
Response Advisory Committee provides a good regional forum for discussing and resolving issues related to DR valuation.
Recommended Actions: • Make framework creation a top BPA priority; communicate this priority to the region by BPA
serving as a leader in and dedicating resources to regional efforts.
• Collaborate with the Council’s DR Advisory Committee—which already has identified the lack of a framework as a barrier to optimal DR development—to develop such a framework.
Mitigation Strategy EM2: Identify needs and communicate demand reduction value and goals
Goal: Quantify and communicate demand reduction value and goals Once the value of DR resources has been established from the BPA’s, Power customers’, and end-use customers’ perspectives, BPA will need to identify needs across business units and among Power customers. Since the early 1980s, the region has maintained an effective process for determining energy efficiency opportunities and the costs of capturing those opportunities. Since then, this has resulted in the region developing energy efficiency resources sufficient to meet one-half of the region’s growth in electricity demand over 37 years. BPA’s new Integrated Planning process represents a possible framework for evaluating the potential resource benefits for DR; using supply curves developed as part of Assessment 1, BPA can effectively evaluate DR needs and the value of additional DR.
Recommended Actions: • Quantify demand reduction values and goals via a cross-functional team (as described in
mitigation strategy OO3).
• Communicate and share goals across BPA business units.
• Identify and list peak reduction and capacity supply needs across BPA, along with such needs identified by Power customer utilities.
Mitigation Strategy EM3: Implement power rates that align with DR and capacity values
Goal: Power rates reflect the value of DR resources and capacity Many BPA Power customers and stakeholders noted that they have not seriously considered developing DR resources as the rate structure of their contractual relationship with BPA does not incentivize them to do so. Furthermore, BPA’s existing Power supply contracts have not communicated clear signals to Power customers: load-following customers may receive some price signals due to weak demand charges, whereas slice/block customers without demand charges have less of an incentive to consider DR use for Power bill reduction purposes.
Utilities and BPA, with its existing tiered rate structure and demand charges, already employ price signals such as time-of-use and block rates to encourage energy efficiency, conservation, and load shifting. For these rate strategies, however, to serve as effective price signals that achieve the desired results, the rate design must be well-aligned with the resource value. A recent report on DER planning

Research Findings: DR Deployment Economic/Market Barriers and Mitigation Strategies
25
practices, sponsored by the Washington Utilities and Transportation Commission (WUTC), emphasizes the importance of aligning price signals with resource values and recommends the use of programs and tariffs to fairly compensate customers for the value of their DER.7
Recommended Actions: • Explore alternative contractual frameworks and rate structures that generate price signals for
Power customers that align their interests with BPA’s (per the outcomes of BPA’s Resource Program). Apply these to any public power entity deploying DR.
• Identify a mechanism to increase collaboration and coordination between BPA and its Power customers regarding peak load management and capacity supply.
Mitigation Strategy EM4: Standardize and document measurement and verification and settlement protocols
Goal: Improve confidence in DR impacts to support accurate planning and a well-functioning market According to the 2015 California Demand Response Potential Study (Alstone et al. 2016), effective M&V, often implemented by a third-party evaluator, is vital to valuation of DRs from a resource planning point of view, especially for DR products designed for their contingency value. Proper M&V of DR impacts requires a framework that establishes in advance the procedures for monitoring and validating DR impacts. Regional capacity markets such as PJM Interconnection, ISO New England, and the New York Independent System Operator, where DR resources are bid into future capacity markets, all have well-documented, detailed protocols for how load reductions are validated.
Recommended Actions: • Work with regional stakeholders to develop standardized M&V protocols for verification of DR
performance. These protocols are also needed to support settlement in performance contracts with third-party DR services providers. The region already has long-established methods and procedures for assessing the impacts and performance of energy efficiency measures. DR requires similar types of commonly accepted protocols.
7 WUTC. Report on Current Practices in DER planning. December 31, 2017.
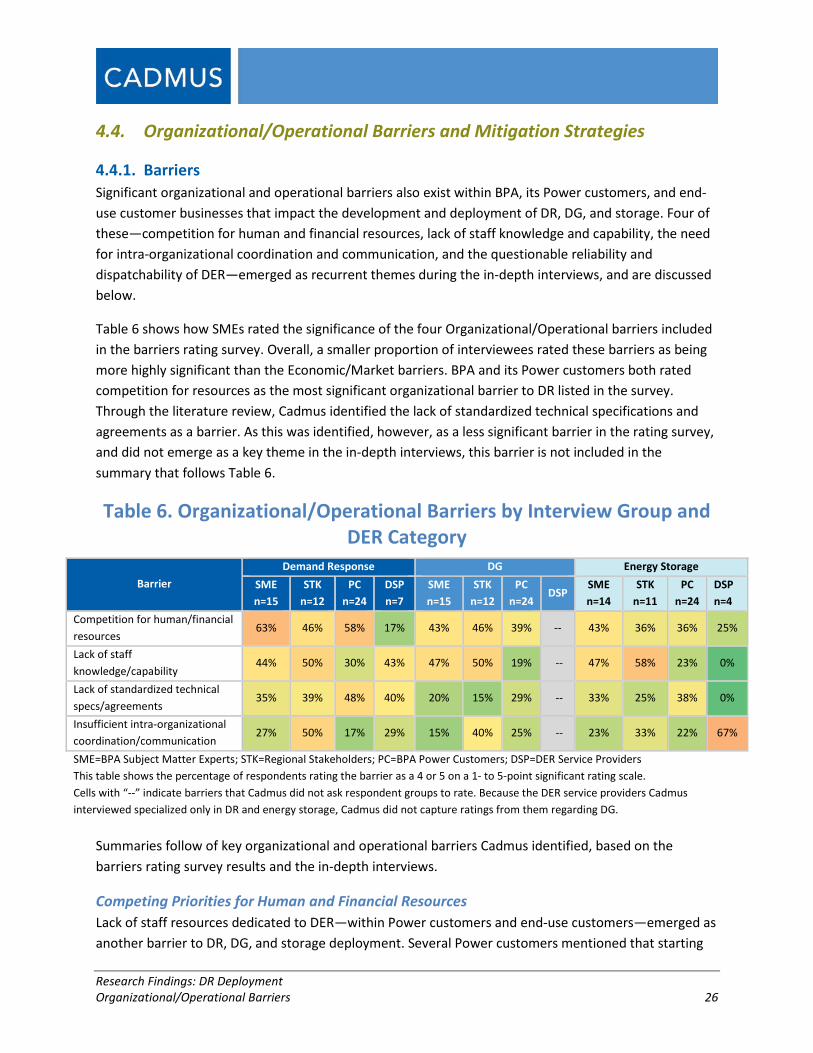
Research Findings: DR Deployment Organizational/Operational Barriers 26
4.4. Organizational/Operational Barriers and Mitigation Strategies
4.4.1. Barriers Significant organizational and operational barriers also exist within BPA, its Power customers, and end-use customer businesses that impact the development and deployment of DR, DG, and storage. Four of these—competition for human and financial resources, lack of staff knowledge and capability, the need for intra-organizational coordination and communication, and the questionable reliability and dispatchability of DER—emerged as recurrent themes during the in-depth interviews, and are discussed below.
Table 6 shows how SMEs rated the significance of the four Organizational/Operational barriers included in the barriers rating survey. Overall, a smaller proportion of interviewees rated these barriers as being more highly significant than the Economic/Market barriers. BPA and its Power customers both rated competition for resources as the most significant organizational barrier to DR listed in the survey. Through the literature review, Cadmus identified the lack of standardized technical specifications and agreements as a barrier. As this was identified, however, as a less significant barrier in the rating survey, and did not emerge as a key theme in the in-depth interviews, this barrier is not included in the summary that follows Table 6.
Table 6. Organizational/Operational Barriers by Interview Group and DER Category
Barrier Demand Response DG Energy Storage
SME n=15
STK n=12
PC n=24
DSP n=7
SME n=15
STK n=12
PC n=24
DSP SME n=14
STK n=11
PC n=24
DSP n=4
Competition for human/financial resources
63% 46% 58% 17% 43% 46% 39% -- 43% 36% 36% 25%
Lack of staff knowledge/capability
44% 50% 30% 43% 47% 50% 19% -- 47% 58% 23% 0%
Lack of standardized technical specs/agreements
35% 39% 48% 40% 20% 15% 29% -- 33% 25% 38% 0%
Insufficient intra-organizational coordination/communication
27% 50% 17% 29% 15% 40% 25% -- 23% 33% 22% 67%
SME=BPA Subject Matter Experts; STK=Regional Stakeholders; PC=BPA Power Customers; DSP=DER Service Providers This table shows the percentage of respondents rating the barrier as a 4 or 5 on a 1- to 5-point significant rating scale. Cells with “--” indicate barriers that Cadmus did not ask respondent groups to rate. Because the DER service providers Cadmus interviewed specialized only in DR and energy storage, Cadmus did not capture ratings from them regarding DG.
Summaries follow of key organizational and operational barriers Cadmus identified, based on the barriers rating survey results and the in-depth interviews.
Competing Priorities for Human and Financial Resources Lack of staff resources dedicated to DER—within Power customers and end-use customers—emerged as another barrier to DR, DG, and storage deployment. Several Power customers mentioned that starting

Research Findings: DR Deployment Organizational/Operational Barriers 27
any new DER program would require significant staff resources. Some anticipated that DR, DG, or storage integration would require staff dedicated to these resources, but they pointed out that staff are usually more than fully occupied with their current job duties and they do not have the resources to focus on DER research and program implementation. Some said they would need to find a way to manage any program offerings without hiring new staff, as they are facing internal budget constraints.
Specific to DR, Power customers acknowledged that DR program development and event notification requires in-house technical staff with adequate time available. In addition, responding to DR events requires that personnel staff the control room at the correct times and during short-term events. One smaller Power customer explained that a barrier to their participation in a BPA pilot arose from penalties associated with the failure to properly respond within 10 minutes to an event; due to staff scarcity, they did not maintain personnel in the control room at all times.
BPA SMEs and Power customers also identified competition for financial resources as a barrier. For Power customers, DR, DG, and storage programs compete for internal resources, and, for some Power customers, other obligations take priority. For example, updating aging infrastructure takes precedence over spending on new DER projects. One Power customer said that, with no pressing need for DR, it has “fallen down the list.”
BPA is resource-constrained and under ratepayer scrutiny, and thus has a very limited budget for DR that only covers staffing resources, without funding left for incentives or project implementation. Many interviewed experts mentioned that—among other factors—low energy prices have eroded BPA’s revenues, and thus have limited its overall operating budget. As a result, they noted, BPA needs to prioritize activities to meet its obligations to Power customers. Representatives from the executive office noted that Power customers are cost conscious and expect BPA to “keep [its] cost under control.” Further, one stakeholder pointed out that rural Power customers are particularly concerned with revenue losses and higher rates if BPA decides to invest in DR. Several experts cited this cost constraint as one reason BPA has not taken the steps to expand past pilots and demonstrations into full-scale programs.
Relevant mitigation strategies: EM1, EM3, OO3
Lack of Staff Knowledge and Capability Both within BPA and Power customers, lack of technical DR, DG, and storage expertise in program design and implementation may be a barrier.
Planners from Power Services and Transmission Services all said they currently do not have usable inputs of DR needs and potential in their planning models. Experts in Power operations stressed that different types of DR (a generating resource versus a negative load) impact operations in different ways. Transmission planners and operators emphasized that they “do not have exposure to what [types of DER] is out there,” and find it challenging to properly model DR in terms of its quantity and availability.

Research Findings: DR Deployment Organizational/Operational Barriers 28
Another expert mentioned that there have not been sufficient analyses of how DR might help mitigate BPA’s normal and systematic risks.
Relevant mitigation strategy: OO3
Insufficient Intraorganizational Coordination/Communication Interviewees identified institutional barriers as an impediment to implementing DER, particularly DR. These barriers emerge principally due to fragmented planning processes within Power customers. Addressing these barriers has been the main motivation for several Power customers, as well as BPA, to adopt integrated demand-side management approaches. To implement DR, BPA program administrators must coordinate with Power Services and Transmission Services as well as other departments to realize the DR’s stacked value, properly communicate DR’s value, and achieve organizational support.
Cadmus’ evaluation of Kootenai Electric Cooperative’s 2010–2011 direct load control (DLC) pilot project illustrated the challenges of both intra- and interorganizational coordination from the local Power customer’s perspective. Implementing the DLC project required extensive interorganization communication: in addition to coordinating the roles of various departments (such as IT, billing, engineering, and marketing), Kootenai Electric needed to coordinate weekly meetings with its AMI system manufacturer and BPA (Cadmus 2011). For many Power customers, particularly smaller ones, these logistical and labor-intensive requirements may present a significant barrier to implementing DR programs.
Relevant mitigation strategies: OO1, OO2
DR Reliability and Dispatchability BPA Power and Transmission experts perceived DR as unreliable and not fully dispatchable. For real-time power hourly trading, experts need DR to respond within 10 minutes of dispatch, a capability they do not believe DR possesses (despite recent BPA demonstration projects proving that DR can reliably respond to a 10-minute notice requirement). A Power transactions expert attributed this perception to one DR pilot in which an industrial end-use customer could not deliver reliable 10-minute-ahead DR. Moreover, an expert explained that, “Power operations does not consider statistical availability, only actual availability.” This conveys that even if DR proves to be statistically reliable (that is, reliable within a statistically acceptable margin of error), Power operations would still hesitate to use DR. Similarly, transmission planners prefer new equipment at the substation or a new line, even if it is more expensive than DER or DR product services, because of its tried-and-tested reliability and because actual equipment installations best comply with stringent North American Electric Reliability Corporation requirements.
System operators also consider DER, including DR product services, as difficult to dispatch. For Power schedulers, dispatching DR translates into the need to use an additional screen in an already complex operating environment. Transmission schedulers also do not perceive DR as products that are “easy, fast, and quick” to dispatch. According to an expert in transmission scheduling, transmission schedulers

Research Findings: DR Deployment Organizational/Operational Barriers 29
are generally reluctant to dispatch DR even when they have the capability to do so. (This is not true, however, for some Power customers in the region that have been using DR for many years, such as Idaho Power.)
Relevant mitigation strategies: OO1, OO3
4.4.2. Mitigation Strategies BPA and its Power customers face significant organizational and operational barriers to the development and deployment of DR, including constrained resources and, in many cases, a lack of knowledge and capability. Moreover, a decision to invest in DR deployment requires executive commitment, strong intra-organizational coordination, and the belief that DR resources provide viable substitutes to traditional generating resources in terms of reliability and dispatchability.
Cadmus identified three strategies that would help to mitigate Organizational/Operational (OO) barriers to the development and deployment of DR resources. These mitigation strategies draw upon a variety of sources, including interview findings, lessons learned from other states, relevant regional experience with energy efficiency, and expert judgment.
Mitigation Strategy OO1: Charge BPA’s cross-functional planning team (the Integrated Planning Team) with establishing DR’s value, goals, and a strategic implementation road map
Goal: Achieve BPA organizational commitment and alignment on DR values and goals, and on an implementation plan Findings from interviews with BPA subject matter experts suggest that, to accomplish the actions identified above to mitigate Economic/Market barriers, BPA would need organization-wide commitment and alignment. Cadmus’ interviews with BPA subject matter experts indicated a lack of communication and alignment between the BPA Transmission and Power organizations as well as a lack of organization-wide commitment to DR.
Although Cadmus considers Economic/Market barriers as most critical, interview findings indicate the Economic/Market mitigation strategies suggested above would be difficult for BPA to pursue without executive-level leadership and cross-functional alignment on the appropriate role and scope of DR resources. A recent report on DER planning practices, sponsored by the WUTC, emphasizes the importance of coordinating distribution planning with other utility planning processes, including integrated resource and capital budget planning.8
Actions: • Gain formal executive commitment and prioritization for an initiative to establish goals and a
strategic implementation plan for DR/DER.
8 WUTC, Report on Current Practices in DER planning. December 31, 2017.

Research Findings: DR Deployment Organizational/Operational Barriers 30
• Establish a cross-functional project team, including representatives from BPA Transmission planning and operations organizations, reporting to the Integrated Planning Team to establish DR values, goals, and a strategic implementation road map.
Mitigation Strategy OO2: Define and implement an approach to integrate DR into the resource planning processes
Goal: Fully integrate DR into the resource planning process Generally, DR resources may be incorporated in the resource planning process, either as load modifiers or as selectable resources, through an optimization process. BPA’s IDSM initiative, led by a cross-organizational steering committee with executive sponsorship from both the Power and Transmission organizations, aimed to create or define the internal processes that would allow BPA Power Services and Transmission Services to consider demand-side and supply-side options equally by 2019. BPA’s Resource Program provides a platform for full integration of DR resources; through the program, BPA has built the modeling capability to better incorporate demand-side resources in economic valuation and load forecasting models.
Actions: • Treat DR as an option comparable to other capacity resources in the resource and transmission
planning processes. This will not only establish the right amount of DR to deploy; it will also help establish the appropriate value (and price) for DR products.
Mitigation Strategy OO3: Disseminate DR information and technical resources to Northwest utilities
Goal: Improve regional DR program development and deployment knowledge and technical capability Like BPA, Power customers face the barrier of significant costs to develop and deploy DR programs, including competition for human and financial resources, lack of staff knowledge and capability, the need for intra-organizational coordination and communication, and the risk associated with DR reliability and dispatchability. Several stakeholders suggested that an appropriate role for BPA would be to provide information and technical assistance, which could help mitigate these barriers.
Action: • Determine a regional entity to establish a regional information and technical forum for DR
program development and deployment.

Research Findings: DR Deployment Infrastructure/Technology Barrier 31
4.5. Infrastructure/Technology Barriers and Mitigation Strategies
4.5.1. Barriers Through the in-depth interviews, literature review, and barriers rating survey, Cadmus identified several DR, DG, and storage deployment barriers related to Infrastructure/Technology. Lack of a uniform communications protocol (and associated interoperability issues), data issues, difficulty integrating DR, DG, and storage with current infrastructure, and lack of back-office systems emerged as the primary technology barriers.
Table 7 shows how interviewees rated the significance of the eight Infrastructure/Technology barriers included in the barriers rating survey. Respondents most frequently identified data issues and lack of back-office systems as significant barriers. A greater proportion of SMEs and DER service providers rated data issues as a significant barrier, which may result from limited regional experience with large-scale DR programs. Two barriers—concerns about cyber security and difficulty integrating DER with current infrastructure—were identified by approximately one-half of Power customer respondents as significant, but other interview groups less frequently rated these as significant.
Table 7. Infrastructure/Technology Barriers by Interview Group and DER Category
Barrier Demand Response DG Energy Storage
SME n=14
STK n=11
PC n=24
DSP n=7
SME n=12
STK n=11
PC n=24
DSP SME n=12
STK n=11
PC n=24
DSP n=4
Data issues (e.g., lack of AMI, poor “big data” tools)
54% 39% 38% 60% 30% 25% 17% -- 50% 25% 30% 67%
Back office systems 50% 60% 52% 0% 46% 30% 39% -- 46% 70% 38% 25% Communication protocols not standard; interoperability issues
36% 50% 48% 0% 18% 18% 17% -- 27% 46% 30% 25%
Difficult integrating DER with infrastructure
24% 23% 54% 20% 33% 31% 19% -- 47% 23% 36% 0%
Concerns about cybersecurity 15% 20% 48% 14% 8% 20% 32% -- 8% 10% 33% 0% Lack of test facilities/infrastructure for communications to distributed devices
23% 27% 30% 0% 23% 18% 22% -- 31% 55% 18% 0%
Ability to control/manage EV charging and discharging
25% 33% 30% 20% 13% 11% 16% -- 14% 40% 30% 0%
Unstable vendor supply chain 39% 25% 29% 20% 18% 17% 21% -- 46% 36% 39% 0% SME=BPA Subject Matter Experts; STK=Regional Stakeholders; PC=BPA Power Customers; DSP=DER Service Providers This table shows the percentage of respondents rating the barrier as a 4 or 5 on a 1- to 5-point significant rating scale. Cells with “--” indicate barriers that Cadmus did not ask respondent groups to rate.
Cadmus identified key Infrastructure/Technology barriers, based on the barriers rating survey results and in-depth interviews, as summarized below.

Research Findings: DR Deployment Infrastructure/Technology Barrier 32
Lack of AMI An important enabling component of the information network, AMI is necessary to effectively operate certain types of DR, such as pricing programs. Although many successful DR programs operate in utility service areas without AMI or do not use existing AMI systems, AMI deployment facilitates DR by allowing two-way communication between the Power customer and end-use customers and by tracking load impacts. Without this visibility into load profiles within customer segments, some Power customers thought they might be unable to determine whether end-use customers responded to DR events. DER service providers that focus on residential end-use customers identified low deployment of AMI infrastructure as a barrier to implementing residential DR programs in the region, especially behavioral DR programs (which require AMI).
Relevant mitigation strategy: IT1
Poor “Big Data” Analytical Tools and Capabilities Lack of data storage and analytic capabilities to plan for and evaluate DR also emerged as a barrier. BPA power planners explained that “demand response is unique because it can have varying duration, frequency, and location.” The desire and ability to monitor these variables in near real time (minute-by-minute or five-minute intervals) for M&V and operational purposes can result in unmanageable data quantities for the utility or aggregator. The associated data computing and storage requirements are so large that the outputs of hourly modeling often cannot be stored. Likewise, Power Services operations receive large data files when dispatching DR, but lack the capability to analyze the data.
Relevant mitigation strategy: IT1
Lack of Uniform Communications Protocol; Interoperability Issues The region does not have a uniform protocol for communication between Power customer operators and DR assets (Ollis 2017). This lack of a uniform communication protocol inhibits development of a fully open market, where vendors can offer the “broadest possible set” of interoperable DR products (Klotz 2016). BPA’s Technology Innovation Project (TIP) #331 for the Snohomish County Public Utility District, which examined coordinating the various services that storage and DR can provide for transmission systems, found that use of “open, non-proprietary standards” for communicating with DER assets (such as Modular Energy Storage Architecture and OpenADR) might provide significant benefits to BPA and participating Power customers by driving down implementation costs and expanding equipment purchase options for participating customers (Snohomish 2016).
Power customers identified the severe time lags between standardizing communication protocols and market adoption as a barrier to their ability to work with customers on DR. Several stakeholders further described challenges from the lack of a uniform communications protocol associated with transacting with end-use customers for DR programs. Without “DR-ready” devices, Power customers require significant additional effort to prepare their end-use customers for participation in DR programs.
Relevant mitigation strategy: IT2, IT3

Research Findings: DR Deployment Infrastructure/Technology Barrier 33
Difficulty Integrating DR with Existing Infrastructure and Back Office Systems Existing back-office systems—including end-use customer information systems—do not adapt easily to new practices brought on by DR. For example, through its DR pilots, the Eugene Water and Electric Board found that DR required new billing calculations that did not dovetail with the legacy billing system (Price 2016). Moreover, it was expensive to set up metering and telemetry systems. A recent Lawrence Berkeley National Laboratory (LBNL) study (Cappers 2016) confirmed that most utilities lack the infrastructural capability to provide detailed and timely insights into location-specific operational and distribution challenges, which negatively affects the utility’s ability to optimize DR resources and programs in place.
Furthermore, several stakeholders said that a lack of visibility into Power customers’ distribution systems, described by one stakeholder as “back-end system monitoring,” presents a barrier to DR development. One stakeholder noted that although transparency exists for “what is happening” on BPA’s transmission system, that visibility greatly reduces at the local distribution system level. Another stakeholder said this lack of visibility is exacerbated for rural BPA Power customers with long distribution lines. According to two stakeholders, this makes it difficult to identify areas where DR projects would generate the greatest value for the local distribution company. One stakeholder said that limitations in local-level infrastructure extend to deployment of meters at the end-use customer level. According to the stakeholder, these meters prove critical for the correct interface between the Power customer and end-use customer, and are necessary to implement several types of DR.
Relevant mitigation strategy: IT1
Need for Investment in Back-End Technologies Multiple DER service providers identified the high cost of investing in back-end technologies as a DR barrier for smaller BPA Power customers. They noted that, for many small BPA Power customers prevalent within BPA’s service territory, the cost of residential DR programs may be too high, as it can be costly for Power customers to invest in the information technology infrastructure to support residential DR programs. This cost can be prohibitive for Power customers with smaller end-use customer bases, as they have limited opportunities to create benefits to offset this investment.
Relevant mitigation strategy: IT1
Other Infrastructure/Technology Barriers Through the literature review, Cadmus identified several other potential DR, DG, and storage deployment barriers, including concerns about cybersecurity, an unstable or inadequate vendor supply chain, difficulty in accommodating and integrating these resources with current infrastructure, and the lack of test facilities and infrastructure for communications with distributed devices. Appendix A through F describe these barriers through detailed findings from each data collection activity.

Research Findings: DR Deployment Infrastructure/Technology Barrier 34
4.5.2. Mitigation Strategies This barrier category, although ultimately important to large-scale DR deployment, is less critical than the Economic/Market and Organizational/Operational barriers identified in this assessment, which are more fundamental to the viability of DR investment and thus critical to overcome first.
Cadmus identified three strategies to mitigate Infrastructure/Technology barriers. These mitigation strategies have been based on a variety of sources, including research findings, relevant regional experience with energy efficiency, and expert judgment.
Mitigation Strategy IT1: Provide information and technical resources to Power customers in response to customer inquiries/requests
Goal: Increase BPA Power customers’ capability to make the business case for DR-supporting Infrastructure/Technology investments BPA Power customers and regional stakeholders consistently indicated that BPA could help support the development and deployment of DR by providing supporting information and technical resources that would save them time and effort in learning about DR technologies and best practices. Although not mentioned specifically in the interviews, BPA could similarly provide resources to facilitate Power customers’ distribution planning and analysis of investments in Infrastructure/Technology needed to support DR deployment. The Federal Energy Regulatory Commission (FERC)-sponsored National Action Plan on DR provides one example of a detailed approach and rationale for these resource types at the national level.9 In the Northwest, BPA and other regional entities, including NEEA, the Council, and Smart Grid Northwest, have successfully served as information and resource clearinghouses for various energy-related information and technical resources. Such approaches could be considered for the Infrastructure/Technology and infrastructure DR barriers discussed above.
Actions: • Develop and disseminate information and technical resources on best practices for DR program
design, marketing, deployment, and integration with existing infrastructure.
• Work with Power customers to explore DR products and technologies that best suit their needs.
• Share information with Power customers on methods for verification and valuation of DR from their perspectives.
Mitigation Strategy IT2: Encourage regional market transformation initiatives for DR technologies
9 https://www.ferc.gov/legal/staff-reports/06-17-10-demand-response.pdf

Research Findings: DR Deployment Infrastructure/Technology Barrier 35
Goal: Accelerate market adoption of a uniform communications protocol for DR and storage devices to ensure they are interoperable A variety of stakeholders noted the lack of a uniform communications protocol as a barrier to large-scale DR deployment and adoption. According to Council staff (Ollis and Jayaweera 2017), the region does not have a uniform protocol for communication between Power customer operators and DR assets. The lack of a uniform communication protocol inhibits a fully open market where vendors can offer the “broadest possible set” of interoperable DER products (Klotz 2016). BPA’s TIP #331 (Snohomish 2016), which examined the issue of coordinating the various services that storage and DR can provide for the transmission systems, found that use of “open, non-proprietary standards” for communicating with DR assets, such as Modular Energy Storage Architecture and OpenADR, might provide significant benefits by driving down implementation costs and expanding equipment purchase options for participating end-use customers.
Action: • Support the efforts of regional organizations that focus on market development and
transformation, such as NEEA and Smart Grid Northwest. NEEA particularly has a long history of harnessing the power of regional entities to exert leverage and influence on manufacturers of emerging technologies.
Mitigation Strategy IT3: Continue field tests of DR-related technologies and infrastructure (including hardware, software, controls, communications, etc.)
Goal: Continue to advance technology development and knowledge of DR infrastructure- and technology-related best practices BPA has a long history of experimentation with new DR products using a mix of innovative technologies and programmatic structures and delivery mechanisms. As the market for DR-enabling technologies evolves, BPA can advance regional knowledge of and experience with infrastructure and technology-related best practices by continuing to conduct field tests using innovative approaches.
Actions: • Continue to identify and prioritize areas that would benefit by additional field tests.
• Coordinate efforts with other regional entities and Power customers.
• Disseminate test results and lessons learned with other regional entities and Power customers.

Research Findings: DR Deployment Legal/Regulatory Barriers 36
4.6. Legal/Regulatory Barriers and Mitigation Strategies
4.6.1. Barriers Cadmus identified two critical Legal/Regulatory barriers to DR development and deployment: the difficulty of trading DR resources across balancing authorities in the Northwest; and the lack of established DR tariffs and contracts.
Table 8 shows how interviewees rated the significance of three Legal/Regulatory barriers included in the barriers rating survey. Consistent with the in-depth interviews, a lack of established tariffs and contracts was most frequently rated as a significant barrier to DER deployment across respondent groups and technologies. More than one-half of Power customer respondents rated concerns about data privacy as a significant barrier to DR deployment, while other respondent groups less frequently rated this barrier as a concern. Respondents least frequently cited issues related to environmental regulation, compliance, permitting, and siting as a significant barrier.
Table 8. Legal/Regulatory Barriers by Interview Group and DER Category
Barrier Demand Response DG Energy Storage
SME n=14
STK n=10
PC n=25
DSP n=7
SME n=15
STK n=10
PC n=24
DSP SME n=13
STK n=10
PC n=23
DSP n=4
Lack of established tariffs and contracts for DER
33% 63% 50% 60% 21% 44% 32% -- 39% 75% 35% 75%
Concerns about data privacy 31% 27% 54% 14% 8% 9% 24% -- 8% 10% 29% 0% Environmental regulation/compliance and permitting/siting issues2
-- -- -- -- 0% 0% 24% -- 33% 42% 18% 0%
SME=BPA Subject Matter Experts; STK=Regional Stakeholders; PC=BPA Power Customers; DSP=DER Service Providers This table shows the percentage of respondents rating the barrier as a 4 or 5 on a 1- to 5-point significant rating scale. Cells with “--” indicate barriers that Cadmus did not ask respondent groups to rate.
Difficulty Buying and Selling DR Resources across Balancing Authorities In the Northwest, utilities engage in bilateral agreements to buy and sell DR resources, but it is difficult to make DR resource transactions across balancing authorities.
According to BPA SMEs and external stakeholders, aggregating DR across balancing authorities is challenging and costly. As BPA Power and Transmission experts pointed out, BPA is one of many balancing authorities in the Northwest, which operate independently of one another without a central dispatcher. Drawing from a DR pilot experience, a power transactions expert found it “expensive and problematic” to make DR transactions across balancing authorities because BPA must draw an additional bilateral contract with the other balancing authority. Transmission attorneys also noted the additional effort operators must make to communicate with the other balancing authority before, during, and after calling DR events.

Research Findings: DR Deployment Legal/Regulatory Barriers 37
Additionally, two external stakeholders mentioned the legal complications, especially for smaller BPA Power customers, restricting Power customers’ ability to buy and sell DR resources. One stakeholder stated that legal barriers prevent public power customers from transacting with one another, and that the BPA rate structure inhibits movement of DR resources within its balancing authority. He also noted that one BPA Power customer could have DR resources but have no need for them, while another could have the need for DR but have no resources; yet the two might face an impossible legal challenge when trying to make a contractual arrangement that would allow them to trade the resource.
Relevant mitigation strategy: LR3, LR4
Lack of Established Tariffs and Contractual Framework for DR BPA serves over 140 local wholesale customers in the Northwest, including port districts, tribes, irrigation districts, and federal agencies (BPA 2017a). These Power customers differ in size, end-use customer demographics, and geography, and they have different purchase agreements with BPA: some Power customers are load-following, full-requirements customers, and others buy blocks of Power from BPA or a “slice” of the federal power system resources.
Different purchase agreements determine how DR programs impact Power customers. For example, according to Power customers, these differing contractual relationships create inconsistent price signals for Power customers. In one interview, Cadmus spoke with representatives of two similarly sized public utility districts: one a load-following customer located east of the Cascades; and the other a slice/block customer without demand charges located in the west. The load-following customer mentioned its demand charges as a driver for DR trials it completed with industrial end-use customers and for the rollout of its AMI meters. This Power customer envisions a greater role for DR in its territory as it considers how to pass on demand charges to its residential end-use customers using AMI data. The Power customer without demand charges did not have past DR experience and said it is “not really looking at demand response” because it does not realize “significant savings” from lowering its peak demand as the other Power customer would.
Slice/Block customers present another difficulty because they suffer a penalty or receive credit, depending on whether their load exceeds or is under the scheduled load. Drawing from a pilot experience, a slice operations representative shared that BPA could not update the scheduled load when dispatching an event, and had to pay the Power customer both the DR incentive and the slice credit whenever the slice Power customer responded to an event (BPA 2016d, 29). If BPA has difficulty registering a slice customer’s load changes because of its own dispatch, this representative questioned whether BPA could register load changes when slice Power customers dispatch DR on their own.
Relevant mitigation strategy: LR2, LR4
Uncertainty about BPA’s Statutory Ability to use DR/DER Resources Uncertainty exists about what BPA Power and Transmission each can and cannot do with DR/DER (e.g., use customer-sourced DR to solve a Transmission need) under their enabling federal statutes and
Research Findings: DR Deployment Legal/Regulatory Barriers 38
applicable Western Electricity Coordinating Council and North American Electric Reliability Corporation standards. Several interviewees identified this uncertainty as a significant and long-standing barrier to development of DR resources.
Other Legal/Regulatory Barriers Cadmus identified several other Legal/Regulatory barriers, including the following: the lack of state and regional DR, DG, and storage policies to guide development of and investment in these resources; BPA’s position as an electricity marketer without access to end-use customers; rules about data privacy; and environmental, permitting, and siting regulations that pertain to DG and storage.
4.6.2. Mitigation Strategies Regional stakeholder research revealed two critical Legal/Regulatory barriers to DR: the difficulty of trading DR resources across balancing authorities in the Northwest; and the lack of established tariffs and power contracts conducive to DR. As both barriers make it difficult to operate a functioning market (i.e., the supply and purchase of resources), they can also be considered Economic/Market barriers.
Cadmus identified four strategies that would help to mitigate these Legal/Regulatory barriers. These mitigation strategies draw upon a variety of sources, including research findings, relevant regional experience with energy efficiency, and expert judgment.
Mitigation Strategy LR1: Define DR dispatch rules that allow BPA and Power customers to access DR resources for economic and emergency dispatch
Goal: Facilitate deployment of DR in a way that meets the needs of both BPA and Power customers BPA’s system load management criteria and priorities do not necessarily coincide with those of its Power customers. Because the number and duration of events for most DR products are predefined, need exists for clear guidelines and rules for assigning the right to dispatch to BPA and Power customers. BPA faces a unique situation in that it lacks the ability to directly call on end-use customers to dispatch DR. In other jurisdictions, such rules and standards are set through regional transmission organizations and independent system operators or through tariffs.
Actions: • Work with Power customers to characterize their systems’ load and coincidence with BPA’s
system profile.
• Work with Power customers to design DR products that meet the needs of the BPA and the Power customer.
• Based on particular features, such as the frequency and duration of events and of DR products, establish rules for how DR can be dispatched by BPA and by the Power customer.

Research Findings: DR Deployment Legal/Regulatory Barriers 39
Mitigation Strategy LR2: Across public power, develop contractual frameworks, model contracts, and rate structures that are more conducive to DR
Goal: Create better alignment between BPA’s peak load management needs and Power customer planning priorities The existence of an appropriate and effective price signal is a necessary condition for proper functioning of the DR market. Although BPA’s existing tiered rates include a demand penalty, this penalty likely does not reflect the full value of peak reduction, and therefore is unlikely to motivate Power customers—and by extension their end-use customers—to curtail their loads when BPA requires the resource. In RTO markets, price signals are generated through the bidding process.
Actions: • Continue to explore rate structures that provide an incentive to Power customers to deploy DR.
• Test performance-based DR programs and auction programs.
Mitigation Strategy LR3: Allow greater flexibility in coordination among the regional balancing authorities on DR development and deployment
Goal: Facilitate trading of capacity resources among regional balancing authorities The existence of an organized future capacity market, such as those developed by national regional transmission organizations and independent system operators, will greatly facilitate effective long-term DR. The presence of multiple load balancing authorities in the Northwest and the absence of clear rules for trading DR resources limit the opportunities for DR in the region.
Actions: • Initiate a process for exploring ways in which regional balancing authorities can coordinate on
DR development, deployment, and possibly trading. The establishment of standard M&V protocols that create a common currency for DR across balancing authorities would be a first step in this direction. However, because balancing authorities operate under the regulations that govern national reliability standards, such coordination might be difficult to achieve.
Mitigation Strategy LR4: Clarify legal boundaries around BPA’s ability to own distributed energy resource assets as well as the procurement/deployment of DR Services
Goal: Identify the specific mitigation actions within BPA’s legal purview DERs are relatively new and growing resources, particularly in the Pacific Northwest, which was not fully anticipated at the time that many statutory frameworks were built. As a result, a legal review of how and under what circumstances these resources can be acquired and deployed is needed.
Action: • Obtain legal opinions on BPA’s authority regarding DR, including statutory constraints and cost
allocation requirements.

Research Findings: DR Deployment Legal/Regulatory Barriers 40
• Clarify the specific-use cases for which BPA can deploy demand response for its power business.
• Clarify the specific-use cases for which BPA can deploy demand response for its transmission business.
• Clarify DER asset types (e.g., storage, DG) that BPA is permitted to own or contract for and under what circumstances.

Research Findings: DR Adoption Awareness and Participation 41
4.7. Perceptions/Attitude Barriers and Mitigation Strategies
4.7.1. Barriers Cadmus identified several Perceptual/Attitude barriers that further constrain and impede the development of DR, DG, and storage, including a perceived lack of long-term commitment to DR from BPA, lack of end-use customer demand for DR, DG, and storage, and perceptions of various end-use customer participation barriers identified by SMEs, BPA Power customers, external stakeholders, and DER service providers.
Summaries follow of the key Perceptual/Attitude barriers Cadmus identified, along with a comparison of end-use customer participation barriers identified by BPA Power customers and DER service providers to those identified by end-use customers. Section 5.3 discusses barriers identified by end-use customers in greater detail.
Perceived Lack of BPA Long-Term Commitment BPA SMEs and DER service providers noted that BPA has been slow to grow DR pilots into full-scale program development initiatives. According to SMEs, Power customers and end-use customers have uncertainties about BPA’s long-term commitment to DR and about their own commitment levels to DR programs, leading to less program participation and lower overall impacts. DER service providers said short-term programs make it difficult to recruit end-use customers for DR programs, as they often may not want to spend the time and resources necessary to participate in a DR program without a guarantee of long-term revenue. Some BPA Power account executives said that Power customers prefer to participate in established DR programs instead of DR pilots and demonstrations, and are more willing to participate if BPA offers DR programs that are “repeatable and institutionalized.”
Interviewed DR project developers said, to realize the full benefit of DR, BPA or other entities would need to develop long-term programs and move away from pilots. BPA Power account executives also found established programs easier to market than one-off opportunities.
In addition, BPA employees have not perceived a clear signal from BPA’s top management that DR is a company priority. According to one executive office representative, in contrast to the substantial buildup of energy conservation capability in the past four decades, no one at BPA has committed to building long-term or near-term sustained BPA DR capability.
Relevant mitigation strategy: Error! Reference source not found.
Weak End-Use Customer Demand for DR, DG, and Storage Programs Some Power customers saw little need for DR, DG and storage programs in the absence of end-use customer demand. Although some Power customers are keen to “get ahead of the curve” in developing their own in-house technical knowledge of DR, DG, and storage, others said that, even if they knew of a financially viable program, they would only offer it under the condition that customer interest existed to “push the utility [Power customer]” to implementation.

Research Findings: DR Adoption Awareness and Participation 42
Relevant mitigation strategies: PA1, PA2
Perceptions of End-Use Customer Participation Cadmus’ research identified a number of end-use customer barriers to participating in and adopting DR, DG, and storage. Demand-side interviewees noted the following participation barriers in DR programs, based on their experience with DR pilots and programs:
• Negative impacts of business interruption. For commercial and industrial DR curtailment programs, these barriers include the impact of business interruptions on productivity and product quality for certain industries.
• Business case. Respondents noted the necessity of having a DR program tailored to businesses’ needs and for which potential participants can make a compelling business case.
• Cost of purchasing equipment. BPA Power customers with residential DR experience noted that equipment purchase costs pose a significant barrier to program participation for end-use customers.
Respondents perceived several other end-use customer DR participation barriers, including concerns about comfort in the home or workplace, privacy and information security, and control.
Table 9 summarizes how BPA Power customers and DER service providers rated the significance of end-use customer barriers to DR participation, compared to end-use customers’ ratings. Power customers correctly perceived the cost of purchasing equipment as the most significant barrier for residential and small business end-use customers, and the impacts of business interruptions as a major barrier to participation by large commercial and industrial end-use customers. Notable differences between perceived and reported end-use customer barrier ratings included project/offer complexity (rated as a more significant issue by Power customers than by small and large commercial and industrial end-use customers); and lack of compatible systems for DR (which small businesses rated as more significant than any other barrier).
Relevant mitigation strategies: PA1, PA2

Research Findings: DR Adoption Awareness and Participation 43
Table 9. Perceived vs. Reported End-Use Customer Barriers to DR Participation
Barrier
Demand Response Demand Side Supply Side
PC n=25
DSP n=7
Res n=275
SC n=130
MA n=10
Lack of business case: high up-front costs/long return on investment/lack of materiality*
84% 50% 66% 35% 57%
Business interruption 72% 75% -- 59% 83% Project/offer complexity 62% 29% -- 39% 30% Customers’ product quality concerns 57% 75% -- 41% 78% Negative perceptions/fears: loss of control, privacy, and comfort 56% 43% 56% 56% 67% Lack of awareness/knowledge 56% 33% 48% 49% 18% Lack of compatible systems for DR/lack of space for DG/storage devices 30% 40% -- 60% -- Communications to distributed devices/lack of broadband internet/lack of Wi-Fi 20% 0% 47% -- -- Human resources issues (such as employee retention, staffing, and training) 14% 25% -- 43% 30% PC=BPA Power Customers; DSP=DER Service Providers; Res=Residential End-Use Customers; SC=Small Commercial End-Use Customers; MA=Managed Account End-Use Customers This table shows the percentage of respondents rating the barrier as a 4 or 5 on a 1- to 5-point significant rating scale. Cells with “--” indicate barriers that Cadmus did not ask respondent groups to rate. * Residential end-use customers rated the barrier of equipment cost, so the percentage shown for residential end-use customers is for the cost of equipment. Small business and managed account end-use customers rated on the lack of business case, which was asked independently of the cost of equipment.
4.7.2. Mitigation Strategies Several Perception/Attitude barriers impede Power customers’ development of DR resources, including a perceived lack of long-term commitment to DR from BPA, a perceived lack of end-use customer demand for DR, and perceived end-use customer participation barriers, such as lack of awareness and concerns about comfort, privacy, and loss of control.
Cadmus identified two strategies to help mitigate Perceptual/Attitude barriers to the development and deployment of DR resources. These mitigation strategies drew upon a variety of sources, including research findings, relevant regional experience with energy efficiency, and expert judgment.
Mitigation Strategy PA1: Disseminate these end-use customer research findings on DR barriers and interest in participating in various programs
Goal: Increase Power customer intelligence on DR program barriers and preferences The end-use customer research conducted for this assessment (along with DR research and evaluation studies conducted in other regions) shows that end-use customer barriers to DR participation can be overcome with effective communication, marketing, and program design. Based on pilot experience in the Northwest, substantial knowledge also exists regarding which end-use customers are most receptive to participation in DR programs. BPA can mitigate Power customers’ perception barriers related to

Research Findings: DR Adoption Awareness and Participation 44
end-use customer barriers by compiling and sharing insights and lessons learned from DR pilots and research.
Actions: • Disseminate this barrier assessment, along with end-use customer research findings on DR
barriers and program participation interest, to public power utilities.
• Compile and disseminate other regional research and available information from utility and aggregator DR experience.
Mitigation Strategy PA2: Provide information and education to Power customers regarding the costs and benefits of DR
Goal: Increase Power customers’ and end-use customers’ knowledge about the costs, benefits, and market potential for various DR products BPA has already implemented several successful demonstration projects and pilot programs around the region. Over recent years, BPA, in close coordination with customer utilities, has hosted a series of roundtables about DR and learnings from the field. This recommendation seeks to extend this forum to include topics on DR economics.
Actions: • Compile and disseminate a summary of lessons learned from regional DR demonstration
projects and pilots to date.
• Develop and share a comprehensive set of DR M&V and valuation protocols.
• Share the results of benchmarking studies of DR (and DERs) at utilities elsewhere in the county.

Research Findings: DR Adoption Summary of DR Deployment Barrier Mitigation Strategies 45
4.8. Summary of DR Deployment Barrier Mitigation Strategies Cadmus identified 16 strategies to mitigate the barriers to DR deployment, as discussed in Sections 4.3 through 4.7. Table 10 lists these strategies by the barrier category that they primarily address. Several of these strategies, however, would mitigate more than one category of barriers. For example, all three strategies identified to address legal and contractual barriers would also mitigate market barriers as they would facilitate trading of DR resources.
Table 10. Barrier Mitigation Strategies, by Deployment Barrier Category
Barrier Mitigation Strategies
Barrier Category
Econ
omic
/
Mar
ket
Org
aniz
atio
nal/
O
pera
tiona
l
Infr
astr
uctu
re/
Tech
nolo
gy
Lega
l/
Regu
lato
ry
Perc
eptio
ns/
Attit
udes
EM1: Establish a comprehensive DR valuation framework for public power that includes stacking of benefits
EM2: Identify needs and communicate demand reduction value and goals EM3: Implement power rates that align with DR and capacity values EM4: Standardize and document M&V and settlement protocols OO1: Charge BPA’s cross-functional planning team (the Integrated Planning Team) with establishing DR’s value, goals, and a strategic implementation road map.
OO2: Define and implement an approach to integrate DR into the resource planning processes
OO3: Disseminate DR information and technical resources to Northwest utilities
IT1: Provide information and technical resources to Power customers in response to customer inquiries/requests
IT2: Encourage regional market transformation initiatives for DR technologies IT3: Continue field tests of DR-related technologies and infrastructure (including hardware, software, controls, communications, etc.)
LR1: Define DR dispatch rules that allow BPA and Power customers access to DR resources for both economic and emergency dispatch
LR2: Across public power, develop contractual frameworks, model contracts, and rate structures that are more conducive to DR
LR3: Allow greater flexibility in coordination among the regional balancing authorities on DR development and deployment.
LR4: Clarify legal boundaries of BPA’s ability to deploy and fund DR PA1: Disseminate end-use customer research findings on DR barriers and interest in participating in various programs
PA2: Provide information and education to Power customers regarding the costs and benefits of DR
EM= Economic/Market; OO=Organizational/Operational; IT=Infrastructural/Technological; LR=Legal/Regulatory; PA=Perceptions/Attitudes

Research Findings: DR Adoption Summary of DR Deployment Barrier Mitigation Strategies 46
5. Research Findings: DR Adoption
Cadmus surveyed 454 end-use customers (residential, commercial, and managed accounts) of BPA Power customers to assess their awareness, adoption barriers, and likely future participation or adoption of DR, DG, and storage.
This report section synthesizes research findings regarding the adoption of DR from the perspective of end-use customers, with a focus on DR. It begins with a summary of end-use customer awareness and participation in DR, DG, and storage programs (by end-use customer group), and then summarizes research findings on DR adoption barriers. The summary of adoption barriers is followed by a list of mitigation strategies that BPA and/or regional stakeholders could consider pursuing to address those barriers. The section is organized as follows:
• Awareness and Participation (in DR, DG, and storage programs, by end-use customer group)
• Future Interest and Likelihood of Participation in DR, DG, and Storage Programs
• DR, DG, and Storage Adoption Barriers
• DR Barrier Mitigation Strategies
5.1. Awareness and Participation Small commercial and managed account end-use customers currently have the most awareness, participation, and adoption of DR, DG, and storage compared to residential end-use customers. As shown in Figure 10, residential and small commercial end-use customers are most familiar with the same three DER products: time-of-use rates, solar PV, and lithium-ion batteries. The managed account end-use customers are most familiar with curtailment DR programs, standby generation, and lead acid batteries. While most end-use customers are aware of DERs, participation and adoption remain very low, reflecting the limited number of BPA Power customers currently offering DR, DG, and storage programs and products, and the limited initiatives of end-use customers.
Figure 10. Most Familiar DERs, by End-Use Customer Class and DER

Research Findings: DR Adoption Future Interest/Likelihood of Participation in DR, DG, and Storage Programs 47
5.2. Future Interest/Likelihood of Participation in DR, DG, and Storage Programs
In the next two years, end-use customers expressed the greatest interest in participating in voluntary usage reduction and time-of-use rate programs (residential and small commercial), installing solar PV, and installing lithium-ion batteries; managed account end-use customers expressed the greatest interest in curtailment DR programs. Some end-use customers would willingly participate in DR programs without a financial incentive, but, for all DERs, offering incentives or lowering product costs would be critical to increasing the likelihood of participation and adoption.
Figure 11 summarizes the incentive amounts, payback periods, and upfront cost coverage that end-use customers said would increase their likelihood of participation and adoption. In open-end responses, end-use customers suggested that financial information and details about how the program or product is implemented would be important for them to participate.
Figure 11. Likelihood of Participation/Adoption Among End-Use Customers in the Next Two Years

Research Findings: DR Adoption Barriers to Adoption of DR, DG, and Storage 48
5.3. Barriers to Adoption of DR, DG, and Storage From the supply point of view, barriers to DR, DG, and storage participation and adoption reflect impediments that prevent end-use customers from participating in DER markets. The survey asked end-use customers to rate each barrier on a 5-point scale, where 5 means very significant and 1 means not at all significant.
Not surprisingly, cost emerged as a significant barrier to DER participation and adoption across all three end-use customer classes—more so for DG and storage than for DR (as shown in Figure 12). Specifically, for residential and small commercial end-use customers, cost emerged as the most significant barrier across all three DER categories. Managed account end-use customers rated cost as the most significant barrier for DG and energy storage, but they also rated interruptions to business and concerns about product quality as the most significant barriers to DR.
Figure 12. Most Significant Barriers to Participation/Adoption by Customer Class and DER
Note: Respondents rated the significance of barriers to adopting DR, DG, and storage using a 5-
point scale, where 1 means not at all significant and 5 means very significant. Percentages shown here are the total percentage of respondents who rated the barrier as highly significant
(a 4 or 5 rating).
Overall, residential and small commercial end-use customers perceive barriers to DR program participation as relatively less significant compared to the perceptions of large end-use customers. While residential and small commercial end-use customers both rated cost as the most significant adoption barrier, they differed on the next-most significant barriers. Residential end-use customers rated concerns about comfort as the second-most significant barrier to DR adoption, while small commercial end-use customers were nearly as concerned about business interruption as they were about cost.
As shown in Table 11 and Table 12, the cost of purchasing the required equipment presents a much more significant barrier for DG and storage than for DR. The other most significant barriers to DG and

Research Findings: DR Adoption Barriers to Adoption of DR, DG, and Storage 49
storage included concerns about maintaining rooftop solar panels and the lack of space or good locations for DG and storage.
With respect to DR participation barriers, residential end-use customers rated concerns about loss of control over equipment or energy use almost as highly as they rated concerns about home comfort. Interestingly, residential end-use customers considered privacy to be less of a concern.
Table 11. Barriers to Residential End-Use Customer Adoption of DR, DG, and Energy Storage
Barrier Demand
Response n=275
DG n=270
Energy Storage n=259
Cost of purchasing required equipment 66% 88% 89% Concerns about maintenance -- 63% -- Lack of space/good location -- 57% 61% Concerns about home comfort 56% -- -- Concerns about loss of control 54% -- -- Lack of awareness and knowledge 48% 43% 54% Lack of broadband internet/Wi-Fi 47% -- -- Lack of knowledge of benefits -- 40% 46% Concerns about privacy 40% -- -- Concerns about safety -- 23% 42% Already own/can purchase cheaper backup generator -- -- 27% This table shows the percentage of respondents who rated the barrier as a 4 or 5 on a 5-point significance scale. Cells with “--” indicate barriers that Cadmus did not ask respondent groups to rate.

Research Findings: DR Adoption Barriers to Adoption of DR, DG, and Storage 50
Table 12. Barriers to Commercial End-Use Customer Adoption of DR, DG, and Storage
Barrier
Demand Response DG Energy Storage Small
Commercial Managed Accounts
Small Commercial
Managed Accounts
Small Commercial
Managed Accounts
(n=130) (n=10) (n=123) (n=12) (n=122) (n=10) Cost of equipment 60% 46% 79% 92% 78% 90% Cheaper alternatives -- -- -- -- 56% 60% Lack of business case 35% 57% 57% 92% 49% 75% Interruption of business operations 59% 83% -- -- -- -- Concerns about comfort 56% 67% -- -- -- -- Impact on product quality 41% 78% -- -- -- -- Compatible facility infrastructure -- -- 60% -- -- -- Lack of awareness and knowledge 49% 18% 47% 0% 55% 30% Lack of space -- -- 48% 31% 53% 55% Lack of capable staff to implement/manage
-- -- 48% 25% 48%
27%
Uncertainty about quality of DG/storage systems
-- -- 46% 36% 44%
36%
Impact on employees 43% 30% -- -- -- -- Negative perceptions about DER 42% 11% 26% 8% 25% 18% DR program complexity 39% 30% -- -- -- -- This table shows the percentage of respondents who rated the barrier as a 4 or 5 on a 5-point significance scale. Cells with “--” indicate barriers that Cadmus did not ask respondent groups to rate.

Research Findings: DR Adoption Mitigation Strategies 51
5.4. Mitigation Strategies Cadmus identified three strategies to help mitigate end-use customer barriers to DR adoption and program participation, based on a variety of sources. These included research findings, relevant regional experience with energy efficiency, and expert judgment. Table 13 outlines these strategies, which are described in greater detail below the table.
Table 13. Mitigation Strategies for Barriers to DR Adoption
Mitigation Strategies
Adoption Barriers
Equi
pmen
t Co
st
Busi
ness
In
terr
uptio
n
Prod
uct
Qua
lity
Com
fort
, Co
ntro
l
Awar
enes
s,
Know
ledg
e
EUC1: Develop and/or source marketing tools, case studies, and proven strategies to more successfully obtain predictable and sufficient DR enrollment and participation
EUC2: Establish a regional forum to provide information, marketing, and communication resources for public power utilities to facilitate effective customer communication
EUC3: Have appropriate incentive levels for large accounts EUC=End-Use Customer
Mitigation Strategy EUC1: Develop and/or source marketing tools, case studies, and proven strategies to more successfully obtain predictable and sufficient DR enrollment and participation
Goal: Facilitate effective marketing and program design The cost of equipment required for DR adoption presented the most significant barrier reported by residential and small business customers. Managed account end-use customers considered the costs associated with interruptions of business operations and negative impacts on product quality (e.g., in the food processing industry) more significant.
BPA cannot directly address equipment costs or business interruptions associated with DR programs, but it can mitigate those barriers by ensuring that BPA Power customers and DR aggregators can access information about program design best practices and the industries most and least receptive to certain types of programs.
Actions: • Compile and share information from around the country on program design and marketing
best practices.
• Offer a forum for BPA Power customers to share information about customers most receptive to different DR products and attributes, the different DR types tested, and what BPA Power customers plan to do with DR/DER in the near-term.

Research Findings: DR Adoption Mitigation Strategies 52
Mitigation Strategy EUC2: Establish a regional forum to provide information, marketing, and communication resources for public power utilities to facilitate effective customer communication.
Goal: Facilitate successful DR program implementation Residential end-use customers indicated that they may be hesitant to participate in DR programs due to concerns about home comfort and loss of control. In addition, many of these customers lack general awareness of DR programs and how they work.
Although residential and small commercial DR programs are not widespread in the Northwest, other regions have abundant experience with these programs, and program administrators, aggregators, and evaluators possess a great deal of information about best practices.
Actions: • Compile and provide information, marketing, and communication resources to
Power customers.
• Identify a forum for Power customers to share effective marketing and communication resources with each other.
Mitigation Strategy EUC3: Have appropriate incentive levels for large accounts
Goal: Ensure that DR program design includes incentives sufficient to compensate large commercial and industrial participants for costs Commercial and industrial end-use customers expressed concerns about the costs associated with interrupting and disrupting their normal business operations. Generally speaking, they must be able to make the business case for participation in a DR program, but they will be willing to participate if they find it in their best interest. Likewise, any equipment cost associated with participation in DR programs would present a barrier to all customer classes. Typically, in structured markets, an incentive is automatically addressed via bidding in the marketplace.
Actions: • Investigate and share information about the incentive levels required to achieve the desired
uptake of DR programs.
• Identify a forum for BPA Power customers to share this information with one another.

Conclusions 53
6. Conclusions
The results of this assessment point to a wide range of demand-side and supply-side obstacles to DR deployment and adoption. Although many of the same barriers exist in other parts of the country, specific economic and institutional barriers are unique to the Northwest’s power market. The lack of economic and institutional frameworks that provide for proper valuation and trading of DR resources appear to be the predominant impediments and have hampered a functioning DR market in the Northwest:
• The region lacks a region-wide load balancing authority and an organized forward capacity market.
• The abundance of hydroelectric resources and the consequent low avoided capacity costs have made it difficult for BPA, Power customers, and end-use customers to make the business case for DR.
• The weak demand for DR is, however, at least partly due to the absence of a regional framework for valuation of DR resources. A formal framework that establishes guidelines for accounting for all DR potential benefits in avoided or deferred generation, transmission, distribution, and ancillary services benefits could energize the regional DR market.
• A need exists to assess the price signals BPA communicates to its Power customers through contractual frameworks and rate structures; to mitigate economic barriers, those price signals would need to reflect the full value of DR resources, and align BPA Power customers’ interests with BPA’s.
The study’s results also pointed to several significant organizational, operational, and technology barriers to developing and deploying DR as well as to concerns about the reliability and availability of DR products as a substitute for conventional system capacity. A clearly defined and articulated need for DR, along with sound frameworks for measuring and valuing DR, could pave the way for a more active DR market in the region.
Concerns exist among end-use customers about DR’s costs and its potentially adverse effects on business operation and productivity, comfort, and control. Some of these concerns can be addressed with appropriate program design, and by education, and dissemination of information. Other concerns, such as cost and business interruptions, might be addressed with adequate incentives, provided there is sufficient value for BPA and its Power customers to support them.

Appendices 54
Appendices Appendix A: Literature Review
Appendix B: BPA Subject Matter Expert Interview Findings
Appendix C: Stakeholder Interview Findings
Appendix D: DER Service Provider Interview Findings
Appendix E: Power Customer Interview Findings
Appendix F: End-Use Customer Survey Findings
Appendix G: Data Collection Instruments
Appendix H: Literature Review References

Appendix A: Literature Review 55
7. Appendix A: Literature Review
Cadmus reviewed 38 reports and studies addressing barriers to development, deployment, and adoption of DR (as listed in References). Specific to the Northwest, Cadmus reviewed Power customer pilot reports and presentations from industry leaders to characterize the status of DR deployment in the region. In addition, Cadmus supplemented the findings through consultations of various national and state studies (including in California), particularly from other balancing authorities.
This section summarizes findings from the literature review and discusses the barriers Cadmus identified, organized by stakeholder groups to which the barriers are most applicable (i.e., regional/BPA stakeholders, Power customers, and end-use customers). For each stakeholder focus, this appendix presents relevant barriers, grouped by type (e.g., regulatory barriers, market barriers, operational barriers). For each barrier, the text provides a brief description, examples from the literature, and examines its relevance to BPA and its Power customers.
7.1. Regional/BPA Focus In the Northwest, in contrast to other regions in the country, the power system has been more energy-constrained than capacity-constrained, given the region’s abundance of hydroelectric generation adequately met peak demands for decades. More recently, however, the region has increasingly relied on additional generation sources, including natural gas–fired generation and wind, which has reduced the hydroelectric generation share of the region’s total resource portfolio. The electric power system has faced increasing capacity constraints, and large increases in intermittent wind generation have increased the need for system flexibility, as BPA must hold more resources in reserve to help balance demand and resources minute to minute (Council 2016).
As a federal power marketing agency, and as an operator of high-voltage transmission lines, BPA has suggested that it needs to increase the system flexibility of its capacity planning. Its recently sharpened focus on DR (and DERs: DR, DG, and storage in general) has been driven by increases in wind integration, constraints on generation capacity, stress on transmission lines, and its Power customers’ interest in capturing the economic benefits possible through DR.
Table 14 lists barriers to DR, DG, and storage identified in the literature review, and further examines barriers most relevant to the Northwest’s public power service area.

Appendix A: Literature Review 56
Table 14. DR, DG, and Storage Barriers: Regional/BPA Focus
Barrier Applicable DER Categories
DR DG Storage Economic/Market Barriers Absence of an organized commercial DR market x x x Diverse stakeholder visions for a DR market x Unclear value of ancillary services and other DR and storage benefits x x Uncertainty about environmental regulation x x x Organizational/Operational Barriers Insufficient intra-organizational coordination and communication x x x Competing priorities for human and financial resources x x x Difficulties for operators x x x Lack of established tariffs and contractual framework x x x Lack of well-defined measurement and verification framework x x Infrastructural/Technological Barriers Lack of uniform communication protocol x Immature communications technology x x Challenging grid integration x x x Concerns for information security x x Legal/Regulatory Barriers Need for coordination between federal, state, and local policies x x x
7.1.1. Economic/Market Barriers
Absence of an Organized Commercial DR Market Without an organized commercial DR market in the Northwest, no mechanism exists to easily aggregate and transfer DR services across balancing authorities. As a result, the region’s DR potential may not be optimized. For example, Cadmus (2016, 15) explained that third-party aggregators will more likely to participate in the market in large geographic areas, cutting across boundaries between the BPA’s balancing authority and its neighboring balancing authorities. However, as each balancing authority maintains the real-time balance of power supply and demand within its jurisdiction, no system currently allows deployed DR outputs to be easily transferred between balancing authorities.
Diverse Stakeholder Visions for a Demand Response Market Many stakeholders are invested in the future of DR in the region, including the Council, BPA, public power customers, investor-owned utilities, balancing authorities, DR service providers, research laboratories, businesses and industries, and individual end-use customers. Every stakeholder has a unique perspective, which DR development must accommodate to ensure regional cohesiveness and adequate functioning of the power system. A study of DR barriers in California (Freeman 2009, 33) revealed that stakeholders did not have a “clear consensus around a DR vision,” particularly around how

Appendix A: Literature Review 57
to market DR (e.g., through bilateral contracts between BPA Power customers and DR service providers or through a wholesale, centralized, forward capacity market). In the Northwest, stakeholders may potentially lobby for different DR market models, which may impede DR development.
Unclear Value of Ancillary Services and Other Demand Response and Storage Benefits In addition to traditional peak shaving, DR offers ancillary services and other potential benefits, such as deferral of transmission and distribution investments (Navigant 2015, 59). The region does not, however, have a consensus on the methods used to measure the value of these ancillary services and benefits, which renders any benefit/cost analysis of these resources inadequate (Navigant 2015, 59). As an example of ancillary services, DR products can help vary loads to offset the variability of renewable resources (Cadmus 2016, 7). The same is true for storage systems. As the region does not have an organized commercial DR market, the value of ancillary services is “absorbed within the system” instead of explicitly measured (Navigant 2015, 59).
Uncertainty about Environmental Regulation and Goals Regional and local environmental compliance strategies (e.g., state Renewable Portfolio Standards, the Clean Power Plan) currently face considerable political uncertainty. The legislative and regulatory environments surrounding these strategies, particularly those built around federal initiatives and directives, remains increasingly fluid and dynamic. A recent LBNL report (Schwartz et al. 2017) stated that DR, DG, and storage programs and resources included in and valued within the context of these strategies can be vulnerable to changes in the political climate.
7.1.2. Organizational/Operational Barriers
Insufficient Intra-Organizational Coordination and Communication Institutional barriers have been identified as major impediments in implementing DR. Addressing these barriers has served as the main motivation for adopting integrated demand-side management approaches by several Power customers as well as by BPA. To implement DR, BPA program administrators must coordinate with Power Services, Transmission Services, and other departments to properly communicate DERs’ value and to achieve “organizational buy-in” (Ollis and Jayaweera 2017; BPA 2012, 76).
For example, Puget Sound Energy’s DR pilots revealed that power system operators’ lack of understanding of DR capabilities posed an important barrier (Markham 2016). The results of a recent DR demonstration project (BPA 2016d, 26) indicated that an operations team member must be involved in the DR project’s “design, implementation, and testing” to ensure operators become comfortable with the reliability of dispatchable demand-side assets.
Competing Priorities for Human and Financial Resources According to staff at Eugene Water and Electric Board (Price 2016), developing DR, DG, and storage programs may require additional organizational resources, such as available staff and financial resources.
Appendix A: Literature Review 58
Difficulties for Operators Depending on DR products’ characteristics, BPA operators may encounter various operational difficulties in dispatching DR events. A Northwest industrial pilot study (BPA 2014, 29) provided several examples.
First, BPA operators found that the DR management system was not “user friendly,” even though it would have made event dispatching more efficient (BPA 2014, 29). Second, if aggregated loads were small, BPA operators might have to administer “more dispatch points to achieve a BPA objective” of load reduction, thus resulting in a more cumbersome workload (BPA 2014, 29). Finally, if the DR product required BPA operators to preschedule events days ahead, the BPA operators might have to switch their mindset from operating “hour-to-hour and within hour” to scheduling events much in advance, which requires more planning and coordination with other operators (BPA 2014, 27).
Lack of Established Tariffs and Contractual Framework BPA serves over 140 local public Power customers in the Northwest, including port districts, tribes, irrigation districts, and federal agencies (BPA 2017a). These Power customers differ in size, end-use customer demographics, geography, governance, charters, financial health, laws, and more. Moreover, they hold different purchase agreements with BPA: some Power customers are load following, full-requirements customers, and others buy blocks of power from BPA or a “slice” of the federal power system resources. Different purchase agreements will determine how DR programs impact Power customers. For example, in a commercial aggregator pilot with Cowlitz, a BPA Power slice product customer received a penalty or credit, depending on whether its load exceeded or ran under the scheduled load; BPA paid Cowlitz both the DR incentive and the slice credit whenever Cowlitz responded to an event (BPA 2016d, 29).
Lack of Well-Defined Measurement and Verification Framework According to the 2015 California Demand Response Potential Study (Alstone et al. 2016), effective M&V is vital to DR valuation from a resource planning point of view. Proper M&V of DR impacts requires a framework that, in advance, establishes the procedures for monitoring and validation of DR impacts. Regional capacity markets (e.g., PJM Interconnection, ISO New England, the New York Independent System Operator), which bid DR resources into future capacity markets, have well-documented, detailed protocols for how to validate load reductions.10 Verifying impacts also relies heavily on AMI. For example, Great River Energy had difficulty completing M&V of DR events due to a lack of AMI on their system (BPA 2016a).
10 For example, see the PJM Manual 18—PJM Capacity Market: http://www.pjm.com/-
/media/documents/manuals/m18.ashx and ISO New England Market Rule 1 Section 13—Forward Capacity Market: https://www.iso-ne.com/static-assets/documents/regulatory/tariff/sect_3/mr1_sec_13_14.pdf

Appendix A: Literature Review 59
7.1.3. Infrastructural/Technological Barriers
Lack of a Uniform Communication Protocol According to the Council staff (Ollis and Jayaweera 2017), the region does not have a uniform protocol for communication between Power customer operators and DR assets. The lack of such a protocol inhibits a fully open market, where vendors can offer the “broadest possible set” of interoperable DR products (Klotz 2016). BPA’s TIP #331 (Snohomish 2016), which examined the issue of coordinating the various services that storage and DR offer the transmission system, found that the use of “open, non-proprietary standards” for communicating with DR assets (such as Modular Energy Storage Architecture and OpenADR) might provide significant benefits by driving down implementation costs and expanding equipment purchase options for participating end-use customers.
Immature Communications Technology More research is needed to further develop and deploy automated systems, both within the Power customer infrastructure and within end-use customer premises. For example, utilities participating in the Pacific Northwest SmartGrid Demonstration Project (2015a) found that asset system communications components used in the project’s Transactive Coordination System were not especially interoperable, requiring customized engineering for integration.
In its Commercial and Industrial Demand Response Pilot Report (BPA 2012, 41–44), BPA documented that issues with the DR automation server, including incorrect configurations and unexpected data surges, were the main drivers of event failures. Furthermore, devices were not yet smart enough to manage tradeoffs between end-use customer comfort and grid needs. The BPA DR experts noted, however, that the DR communications technology has significantly matured over the past few years. For example, they noted that a very recent pilot with Energy Northwest demonstrated great success in integrating and using Energy Northwest’s communications system to support event dispatch and real-time verification of load movement.
Challenging Grid Integration Safely and reliably connecting DR, DG, and storage into the grid remains a complex and challenging process. Beyond the obvious technical and technological challenges posed, the requirements and certification needed to consider DR, DG, and storage for grid integration could potentially hinder DR development. The interconnection process can be costly and laborious, requiring extensive studies and permitting, which can ultimately delay the project for years and add significant costs (Schwartz et al. 2017). Storage and DG resources are the most vulnerable to this barrier, due to lengthy review and siting processes—such as air and water quality tests, and fire prevention, fuel storage, and hazardous waste disposal requirements—which often preclude the resource’s connection to the grid (Schwartz et al. 2017).
Concerns for Information Security The increased interconnectivity of the DR grid communication infrastructure raises serious issues regarding the security of physical data and digital data (Ollis and Jayaweera 2017). Beyond issues

Appendix A: Literature Review 60
concerning the privacy of end-use customers’ data, recent highly publicized exploitations of security flaws in various components of the “internet of things” show the importance and challenges of ensuring adequate cybersecurity mechanisms, particularly in the context of DLC mechanisms (Schwartz et al. 2017). The Commercial and Industrial Demand Response Pilot Report (BPA 2012, 54) noted that facility managers were concerned about protecting their building equipment and Infrastructure/Technology networks against potential breaches of information security.
7.1.4. Legal/Regulatory Barriers
Need for Coordination between Federal, State, and Local Policies According to the FERC (FERC 2016), alignment in federal and state policies and local utility planning needs is a major factor impacting DR adoption. Across the United States, regulatory changes are addressing this issue. The recent Supreme Court ruling on FERC Order 745, which grants FERC jurisdiction over DR practices and pricing in wholesale markets, is an example of how uniform and well-defined regulation will allow enhanced policy coordination and facilitate increased integration of DR resources in organized markets. According to Bade (2016), the ruling also highlights the need for enhanced policy coordination. Had the court ruled against FERC Order 745, a report issued by Greentech Media (Munsell 2017) estimated that DR’s national growth rate would have dropped by about one-half by 2023.
7.2. Public Power Customer Focus BPA Power customers face a diverse set of challenges due to their varying resource planning needs. Some have power supply resources that exceed their retail end-use customers’ demand due to decreases in demand brought about by economic stagnation or effective energy efficiency programs. These Power customers do not have an incentive to acquire new resources above the pool of Tier 1 BPA Power resources.11 In contrast, others seeing significant growth in demand, sometimes due to high-impact loads such as new data centers, may exceed their entitlement to BPA Tier 1 Power supplies and may become subject to state renewable energy use requirements. They also may not be able to serve new large loads (such as a data center) with BPA power and energy due to statutory and contractual constraints.
Public power customers’ barriers to deployment exist beyond an insufficient business case for acquiring DR, DG, and storage. The literature review revealed barriers ranging from market uncertainty and legal
11 In 2011, BPA implemented tiered rates for its wholesale power to the region’s public Power customers. Tier 1
Power sales are based on existing federal power system costs. Tier 2 rates are based on the cost to acquire power supplies from other sources. When a Power customer exceeds its allocation of Tier 1 power, it can elect to buy Tier 2 power from BPA or acquire new resources itself. These rates were expected to provide more direct price signals about the costs of new resources to meet load growth, but, because BPA costs are high, Tier 1 rates are higher than market rates, which can provide Tier 2 power and energy. Thus, Tier 2 rates are actually lower than Tier 1 rates at this time. Source: BPA.

Appendix A: Literature Review 61
barriers to organizational and operational barriers. Table 15 shows barriers to uptake and deployment from the focus of public power customers.
Table 15. DR, DG, and Storage Barriers: Public Power Customer Focus
Barrier Applicable DER Categories
DR DG Storage Economic/Market Barriers Inadequate market and price signals x x x Disconnect between wholesale and retail prices x x x Stringent market requirements x x Market uncertainty x x Price competitiveness/cost-effectiveness x x x Organizational/Operational Barriers Insufficient intra-organizational coordination and communication x x x Unclear definition of DR value streams x x Overly short time horizons for evaluation x x x DR program interactions x x Insufficient knowledge of best practices in program design and implementation
x x x
Unstable or inadequate vendor supply chains x x x Potential disconnect between BPA and its Power customers’ needs x x Inadequate data management and analytical tools x Challenge of spatial DR optimization x Site-Specific Implementation Issues x x x Complexity of Storage modeling x Costly end-use customer education and marketing x x Uncertainty about load reduction impacts x x Technology and Infrastructure Barriers Burdensome infrastructure and back office system integration x x Lack of interoperability in communication equipment x x x Lack of AMI deployment x x Equipment limitations x x x Controlling and managing grid impacts of personal electric vehicles x x Legal/Regulatory Barriers Lengthy ratemaking process x x x Revenue erosion x x Price discrimination concerns/limitations x x Siting and environmental regulations x x x Concerns for data privacy x x Lengthy or complex contracting process x x x

Appendix A: Literature Review 62
7.2.1. Economic/Market Barriers
Inadequate Market and Price Signals Without an organized commercial DR market, where DR can be competitively traded as a capacity resource, market signals and capacity requirements for DR can be unclear. Moreover, some Power customers may not need to reduce their own system loads and would require stronger price signals from BPA to establish a value for DR (Ollis and Jayaweera 2017).
Disconnect between Wholesale and Retail Prices Most end-use customers pay an average rate, rather than the actual marginal price, for electric service. In the absence of real-time, marginal price signals, end-use customers are less likely to participate in the development or deployment of DR, DG, and storage (Monitoring Analytics 2009).
Stringent Market Requirements The increasing penetration of variable, intermittent wind generation in the Northwest has led to a greater need for products with flexible loads. Certain types of DR can provide this flexibility. In some markets, however, stringent requirements have been placed on products that qualify as ancillary services. This can act as a disincentive for investment in DR technology and can impede DR’s deployment. For example, in the California Independent System Operator (CAISO) area, a resource that provides ancillary service must be capable of maintaining its capacity for a specified period of time. In this case, a paper (Nolan 2015) revealed that technologically dated or restrictive ancillary service rules can actually exclude DR and prevent those resources from bidding into the ancillary services markets. According to the same paper, a similar rule exists for the Midcontinent Independent System Operator.
Market Uncertainty According to a recent LBNL report (Schwartz 2017), the market for DG and storage resources continues to evolve, which can make it difficult to sustain a reliable vendor supply chain during periodic market downturns. Additionally, some raw materials used in various types of DG and storage systems—such as lithium batteries, which rely on rare earth materials—can become scarce periodically due to market issues such as rapidly increasing demand or political issues related to countries where raw materials are imported from. Together, these issues can result in uncertainty in the DG and storage market.
Price Competitiveness/Cost-Effectiveness Among other factors, the extent to which Power customers consider DR, DG, and storage will depend on cost-effectiveness: that is, the cost of conventional capacity resources. Low natural gas prices and high DR costs make this more challenging. This poses a particularly important barrier for DG and storage due to additional costs associated with permitting, siting, and program development, and to the lack of standard methods for monetization of energy and non-energy benefits. An additional obstacle arises from the disproportionate difficulty that DG and storage resources face—compared to conventional capacity resources—in terms of securing long-term contracts (Schwartz 2017; Olivine 2014). Third-party DG and storage resources are more likely to be contracted on an annual basis, which considerably increases the risk that they become stranded assets, thus increasing their costs. The fluidity of electric

Appendix A: Literature Review 63
resource prices and the challenges faced by DG and storage in cost-effectiveness tests add to the uncertainty and investment risk faced by Power customers.
7.2.2. Organizational/Operational Barriers
Insufficient Intra-Organizational Coordination and Communication Cadmus’ evaluation of Kootenai Electric Cooperative’s DLC pilot program illustrated the challenges of intra-organizational coordination from the local Power customer focus. Cadmus noted that implementing the DLC program required extensive inter-organization communication. In addition to coordinating the roles of various departments (e.g., IT, billing, engineering, marketing), the Power customer also needed to coordinate weekly meetings with the AMI system manufacturer and BPA (Cadmus 2011). For many Power customers, particularly smaller ones, these logistical and labor-intensive requirements present a significant barrier to implementing DR programs and managing DR, DG, and storage.
Unclear Definitions of Demand Response Value Streams According to Nolan (2015), uncertainty regarding the value of DR resources has created a “chicken and egg” scenario. Without a clear understanding of DR value stream investment, interest in DR is compromised. This leads to a lack of understanding regarding the ideal way to deploy DR programs (due to limited DR experiences), with a consequent shortage of useful data for valuing DR. Lack of investments in valuing DR leads to a lack of clarity regarding how to best represent the DR resource and incorporate it in valuation methodologies; this results in a minimal understanding of DR’s value.
Overly Short Time Horizons for Evaluation When DR programs remain nascent, Power customers may need to allow for longer time horizons to appropriately evaluate the programs’ return on investment. At the 2016 Northwest DR Symposium, the Idaho Public Utilities Commission shared that a long-term outlook and patience prove integral to DR development. For example, even though Idaho Power found itself with potential overdeployment of DR, it maintained its existing portfolio, knowing that it may value and potentially ramp up DR over the long term (Donohue 2016).
Demand Response Program Interactions In a scenario where a single end-use customer can participate in two or more separate DR programs (e.g., DLC and critical peak pricing), coordination between the program providers as well as the system operator will be necessary to ensure that overlap does not occur or that impacts are not double counted. Potential workarounds for such a scenario include: (a) centralizing DR opportunities and events under one organizing body; (b) expressly limiting end-use customer participation in multiple DR programs: or (c) certifying that the offered load reduction does not overlap (Cappers 2016). All three of these pose imperfect options as they may either discourage certain DR services providers and third-party aggregators from participating in the regional/local DR market, or they may inappropriately and indiscriminately limit available DR resources by limiting program participation. Explicit rules and guidelines will need to be established to account for such scenarios.

Appendix A: Literature Review 64
Insufficient Knowledge of Best Practices in Program Design and Implementation Due to quickly advancing technologies and market conditions, Power customers may not have enough DR knowledge to design and implement programs. For example, Flathead Electric, a public power customer participating in the Pacific Northwest Smart Grid Demonstration Project, installed AMI and in-home displays, and found that product models and features changed between the time they were selected and implemented. Furthermore, the project team found that more research is needed on how to best structure end-use customer incentives—for example, whether it is better to use dynamic cost signals in a tariff or to periodically compensate participants, such as with monthly capacity payments, and in which circumstances (Pacific Northwest 2015b, 28).
Unstable or Inadequate Vendor Supply Chain In a rapidly changing market, where companies may go out of business or be bought by others, BPA Power customers can be left without the support they need to successfully implement DR, DG, and storage programs. For example, two utilities that participated in the Pacific Northwest Smart Grid Demonstration Project installed sets of skid-mounted battery energy storage systems. The vendor, however, stopped providing support for these systems when it encountered financial difficulties (Pacific Northwest 2015b). The project also revealed that vendors of small-scale DG, such as wind and solar systems, could not deliver their products or the products never generated sufficient energy.
Potential Disconnect between BPA and its Power Customers’ Needs In developing and implementing DR programs, BPA Power customers may find themselves unable to satisfy their needs without compromising BPA’s programs. For example, Flathead Electric Cooperative—a participant in the Pacific Northwest Smart Grid Demonstration Project—found that “BPA system needs did not frequently coincide with local utility needs” (Rayome-Kelly 2016). As a result, Power customers may need to call their own events in addition to BPA events, requiring additional coordination and negotiation in applicable contracts. BPA Power customers may need to commit to having their end-use customers participate in BPA’s DR programs without any local load reduction need. Later, when they find themselves in need of capacity resources, they may not be able to recruit the same end-use customers for their own DR programs (BPA 2016d, 22).
Inadequate Data Management and Analytical Tools The amount of big data necessary to implement DR programs may be challenging for collection, storage, and analysis. Regarding data collection, utilities in the Pacific Northwest Smart Grid Demonstration Project selected their own AMI system providers, which resulted in varying granularity and quality of the collected end-use customer interval data. In the worst cases, the collected data proved inadequate for M&V purposes (Pacific Northwest 2015b). On the other hand, the large amount of data required for M&V may overload the database. For example, if end-use customers respond within one minute of event notifications, demand data must be collected at one-minute intervals (BPA 2012, 55). In terms of data analysis for the Pacific Northwest Smart Grid Demonstration Project, project analysts found it difficult to review data received from AMI and distribution metering systems. Furthermore, Power customers that participated in the project lacked the tools to synthesize and act upon the large quantity

Appendix A: Literature Review 65
of data they received from the grid, meaning they could not adequately operate and maintain the smart grid equipment.
Challenge of Spatial Demand Response Optimization Traditionally, DR opportunities and events are “done with little to no regard to more specific and localized geographic need on the distribution system” (Cappers 2016). The standard DR program functions as a “one-size-fits-all,” system-wide, capacity management plan, which may fail to account for localized differences in the transmission and distribution system.
For example, when a DR event is called, one area may be capacity constrained while another has sufficient capacity, but if both are managed as part of a single distribution system by the DR provider or the balancing authority, one or even both areas may receive a DR order improperly suited to their specific needs.
Site-Specific Implementation Issues Power customers’ DR and storage programs will face site-specific issues. Programs that focus on large load reductions or shifts from individual end-use customers, which are typically projects focused on the commercial and industrial sector (e.g., cold storage or refrigeration systems), will likely face challenges unique to each specific site. The evaluation of BPA’s TIP #220 (Ecofys 2013) noted that for cold storage systems, some sites were periodically unavailable due to planned and unplanned maintenance, sometimes for weeks at a time, or because of changes in production and operations One site had an unpredicted peak load consumption period due to a particular business schedule (a large inventory arrival required freezing in October).
Complexity of Storage Modeling Given the immaturity of the storage resources, Power customers will be challenged to develop adequate modeling capabilities that include “managing ramp rates for chemical battery resources, identifying state of charge in the day-ahead market, and requiring load schedules to support a known state of charge for the award and dispatch of energy and ancillary services” (Olivine 2014).
Costly End-Use Customer Education and Marketing When a Power customer offers a new DR product or program, end-use customers must be furnished with sufficient information regarding the product or program, so they can make well-informed decisions (Nolan 2015). During the Pacific Northwest Smart Grid Demonstration project, when Avista Utilities launched its load response program controlling residential thermostats, fewer end-use customers than anticipated signed up for the program. Avista Utilities eventually learned that personal contact was the best approach for gaining end-use customer involvement (Pacific Northwest 2015a, 10).
Uncertainty about Load Reduction Impacts DR programs that focus on end-use customer behavioral changes, such as those offered by Opower, must account for significant uncertainty around the resulting load reduction. Some end-use customers may be unresponsive or have erratic behaviors when they participate, making the task of accurately predicting load reduction substantially more difficult.

Appendix A: Literature Review 66
For example, through the Pacific Northwest Smart Grid Demonstration project, several utilities offered AMI to residents with in-home displays and access to an energy web portal, and several utilities found end-use customers did not reliably change their behaviors. On the whole, most behavioral programs succeed, however, as Power customers ramp up DR capacity and rely on it for capacity planning, the ability to accurately predict and measure load reductions from behavioral programs will become increasingly important.
7.2.3. Infrastructural/Technological Barriers
Burdensome Infrastructure and Back Office System Integration Existing back-office systems—including the end-use customer information systems—do not adapt easily to new practices brought on by DR. For example, through its DR pilots, the Eugene Water and Electric Board found that DR requires new billing calculations that did not dovetail with the legacy billing system (Price 2016). It was also expensive to set up metering and telemetry systems. A recent LBNL study (Cappers 2016) confirms that most utilities lack the infrastructural capability to provide detailed and timely insight into location-specific operational and distribution challenges, which negatively affects the utility’s ability to optimize DR resources and programs.
Lack of Interoperability in Communication Equipment Interoperability—the “ability of different proprietary systems to communicate with one another”—is often necessary for DR, DG, and storage deployment, particularly with the absence of consistent and open standards, and with a significantly aging grid infrastructure (Cadmus 2016, 25; Schwartz 2017). Many participating utilities in the Pacific Northwest Smart Grid Demonstration Project reported that the communications capabilities of various system components they installed were not interoperable and were difficult to integrate (Pacific Northwest 2015a).
The utilities tested the following commercially available responsive assets as part of the Smart Grid Demonstration project: distributed generators, battery systems, dynamic voltage management, smart appliances, water heater and air conditioning control, HVAC control, thermostat systems, portals, and in-home displays. Participating utilities found that systems’ communications were not interoperable out of the box, and they needed additional engineering integration (Pacific Northwest 2015b). In its evaluation of Kootenai Electric Cooperative’s DLC pilot program, Cadmus (2011) reported that program participation was constrained by the incompatibility of some DLC-compatible thermostats with certain heating systems. End-use customer satisfaction also was noticeably affected by these issues.
Lack of AMI Deployment AMI serves as an important enabling component of the information network necessary to successfully operate certain types of DR, such as pricing programs. Though AMI systems are not required for many DR types, their deployment facilitates a broader range of DR products (e.g., time of use, critical peak pricing, behavioral programs) by allowing two-way communication between the BPA Power customer and end-use customers and by tracking load impacts.

Appendix A: Literature Review 67
Overall, AMI deployment for public power utilities within BPA’s service territory has been strong, relative to the national average, with some of this happening as a part of the American Recovery and Reinvestment (ARRA) Smart Grid Investment Grant program. Public Power customers in Oregon and Idaho have achieved AMI deployment to over 50% of end-use customers. In Washington, however, AMI has been deployed to 15% to 50% of all end-use customers, and Montana lags farther behind. AMI deployment is typically lower for municipal and cooperative public power customers nationwide than for private utilities (Schwartz 2017).
Equipment Limitations The majority of widely available DR and storage equipment remains prone to technological and implementation issues typical of emerging technologies. These include concerns over reliability, implementation flexibility, and equipment responsiveness. DR and storage programs, especially those new to a BPA Power customer, will require navigating equipment challenges specific to each type of equipment.
BPA’s TIP #220 (Ecofys 2013), which examined the 10-minute notice power load balancing capabilities of certain actively managed loads, encountered several instances of specific equipment limitations. Cold storage systems (which the project found to the most promising technology type of the limited set studied in terms of load reduction) were unexpectedly challenged to meet the required rapid response times to load management signals because the compressors using in these systems required loading and unloading in incremental stages. Hot water heater and furnace DR and storage systems also exhibited issues with rapid response and vulnerability to end-use customers’ Wi-Fi reliability (Ecofys 2013). Each issues was often particular to not only the specific equipment type but also to the equipment brand, which highlighted the inevitable growing pains as new technologies are introduced into Power customer DR and storage programs.
Controlling and Managing Grid Impacts of Personal Electric Vehicles As the number of personal electric vehicles (PEVs) increases in the transportation sector, particularly in Washington and Oregon, Power customers and balancing authorities will need to develop strategies for effectively managing these new dynamic and highly variable small-scale storage systems. PEVs can act as a substantial benefit or challenge to grid load management. Uncontrolled (or unpredictable) PEV charging can “contribute to increased peak electricity demand and evening ramping requirements” and significantly impact distribution lines. In comparison, controlled PEV charging can provide considerable load balancing and DR benefits when two-way, vehicle-to-grid capabilities are established, and when optimized use of DG or storage capacity occurs (such as nighttime charging), both of which can reduce electricity costs and improve grid reliability (Schwartz 2017). PEVs’ net effect of to the grid will depend upon direct and deliberate controlling of policies and system investments by Power customers.

Appendix A: Literature Review 68
7.2.4. Legal/Regulatory Barriers
Lengthy Ratemaking Process or Contracts DR programs that rely on pricing mechanisms, such as critical peak pricing and time-of-use pricing, are still relatively new and untested in the Northwest. The extent to which these programs are successful and cost-effective is partially dependent on the ability to introduce new tariff structures (Cappers et al. 2016). BPA’s Power contracts with the Northwest public Power customers extend through September 2028. This means that substantive or structural changes to demand charges or capacity prices cannot be incorporated into BPA rates until October 2028.
Revenue Erosion Loss of revenue from lower energy sales poses a major concern for Power customers considering DR and DG, especially DG such as rooftop solar. Revenue loss is less of a concern with DR, where loads tend to shift rather than be lost. As a peak load management tool, DR and storage offer direct benefits to BPA Power customers, which are generally large enough to offset small potential lost revenues.
Price Discrimination Concerns and Limitations Regulated Power customers typically differentiate electric rates based on end-use customer class, size, and timing of consumption, but not on location within the distribution system, out of concern for regulatory requirements or laws regarding discriminatory pricing and consumer/ratepayer equity. Although not necessarily bound by specific regulations, public power customers’ ability to set prices based on spatial characteristics may be hindered by adherence to this same policy stance regarding pricing, or by other legal concerns, the result of which would be an impaired ability to optimize DR resources to fit specific spatial distribution needs (Cappers 2016). Public power customers often have an equity provision in their charters or organic laws that can interfere with location-based implementation (e.g., the same incentives must be offered to all end-use customers). See the “Challenge of spatial demand response optimization” barrier in the Organizational and Operational Barriers section for a more detailed discussion of spatial optimization.
Siting and Environmental Regulations BPA’s Power customers must adhere to certain state siting and environmental regulations, which may impede DG and storage development. See the “Challenging DER grid integration” barrier in the Regional/BPA focus. In a recent study (Ardani et al. 2016), the National Renewable Energy Laboratory found that permitting, inspection, and interconnection requirements can add as much as $1,200 to the installed price of a standalone PV system, and, with the addition of storage systems, permitting requirements alone can become the most significant challenge to installation.
Additionally, DG and storage tend to face considerably more institutional and regulatory hurdles than traditional grid resources, which have the advantage of decades’ worth of regulatory design. Puget Sound Energy (2015) noted in its 2015 Integrated Resource Plan that pumped hydro and compressed air energy storage systems can take five to 10 years to go through the permitting process and reach completion, and that large-scale battery storage projects (20+ MW) go through FERC-mandated large

Appendix A: Literature Review 69
generator interconnection processes, which require complex interconnection studies. Establishing equitable regulatory treatment of DG and storage will be important to achieving optimized value streams (Schwartz 2017).
Concerns for Data Privacy In addition to information security issues discussed in the Regional/BPA Focus section, BPA Power customers face the challenge of handling end-use customers’ data. For residential end-use customers, LBNL (Schwartz et al. 2017, 56) noted that use of smart meters in DR “could reveal details on activities inside the home that are reflected in the temporal profile of their electricity usage.” The Power customers’ or external parties’ mishandling of these data may result in data theft, which may pose a risk that Power customers are not willing to take.
Lengthy or Complex Contracting Process In marketing DR services, BPA Power customers find that, because BPA does not have a direct relationship with end-use customers, they must set up bilateral agreements with each party for DR programs: an agreement with BPA and a separate one with the end-use customer. Administering one single trilateral agreement between BPA, the Power customer, and the end-use customer could be a solution, but would be highly complex.
7.3. End-Use Customer Focus Successful DR deployment depends on electricity end-use customers’ willingness to modify—or have their power provider modify—their electricity consumption. Participants in DR events can help smooth load profiles and reduce system costs by adapting their behavior. The overarching DR barriers from the customer’s vantage point are: the length of time an end-use customer’s load can be reduced; and the frequency of the response. Table 16 shows DR barriers from an electricity end-use customer focus.
Table 16. DR, DG, and Storage Barriers: End-Use Customer Focus
Barriers Applicable DER Categories
DR DG Storage Economic/Market Barriers Lack of available programs x x x Ineffective incentives x x x Insufficient flexibility in payment options x x Inadequate distribution of incentives x x x Competing energy or business priorities x x x Risk and uncertainty x x x Organizational/Operational Barriers Lack of technical capability x x x Dissatisfaction with frequency and duration of events x Ineffective event notifications x x Perceptions/Attitudes Barriers

Appendix A: Literature Review 70
Barriers Applicable DER Categories
DR DG Storage Lack of awareness x x x Perception of adverse effects x Portfolio of DR programs is too complex, or not flexible enough x Negative perception of third-party aggregators x
7.3.1. Economic/Market Barriers
Lack of Available Programs With few exceptions, such as programs offered by local investor-owned utilities, few readily available, and mature DR programs are available in the Pacific Northwest. The experience of public power customers in the region tends to be limited to pilots (Council 2016). This lack of available programs prevents end-use customers from participating, even if they are interested. In addition, commercial end-use customers are less enthusiastic about investing in time, training, and other operational costs and inconveniences for programs that may change or not continue (Peck 2017).
Ineffective Incentives Ineffective incentives are a barrier for residential and commercial and industrial end-use customers. For residential end-use customers, savings on electricity bills may not be enough to warrant investment in equipment or to compensate for the inconvenience of participating in DR events, when they may only be required to react on rare occasions (Nolan 2015). For example, EnerNOC found that end-use customers perceived the amount offered by the Tennessee Valley Authority in exchange for participation as too small to compensate for the inconvenience (Global 2011). The study concluded that significant room existed to expand end-use customer incentives while maintaining cost-effectiveness. Five sources—most of which provided evidence in the Northwest—found insufficient incentives posed a barrier for industrial end-use customers (Peck 2017; Cadmus 2016, 21; BPA 2012; McKane 2008; Fry 2006). For industrial end-use customers, electricity consumption levels often directly corresponded to production levels. Therefore, any load shedding or load shifting may result in production losses or costs and risks in changing operations. For example, a Northwest pulp-making facility found that a sudden load drop from a DR event could harm equipment, producing lower-quality products and requiring more manpower and energy to make up for the production loss (BPA 2014, 23). Although DR potentially offers other benefits, such as increased electricity reliability and improved corporate image, industrial end-use customers generally only factor incentives into their cost-effectiveness considerations (Fry 2006, 7-8; McKane 2008, 4).
Insufficient Flexibility in Payment Options Nonresidential end-use customers are heterogeneous in electricity consumption, and have different preferences for methods of DR payment such as bill credits, checks, financing, or lower year-round electricity tariffs (Fry 2006, 7). Having the information systems and marketing offerings to support this diversity of requirements can require significant financial investment, and thus be a barrier.

Appendix A: Literature Review 71
Inadequate Distribution of Incentives If incentives cannot be properly assigned to the end-use customers who consume the electricity, then the end-use customers will be less likely to participate in the DR programs. In the commercial and industrial sector, this means that incentives might be paid to the parent company or corporate branch, while the managers of individual facilities receive minimal compensation for reducing the facilities’ loads (Fry 2006, 8). In residential DR applications, split incentives (i.e., when costs and benefits are imbalanced between tenants and building owners) can act as a substantial barrier to participation (Schwartz 2017).
Competing Energy or Business Priorities Large commercial and industrial end-use customers may already be engaged with various energy-related requirements such as “power factor correction penalties and non-time-differentiated demand charges” (Fry 2006, 1). Energy Northwest reported in the Commercial Aggregator Demonstration Final Report that industrial loads sometimes incurred forced outages, which resulted in an unexpected decrease in load available for DR (BPA 2016d, 23). At the same time, these industrial loads still needed to meet BPA’s reliability requirements. This illustrates a scenario in which adding DR to their agenda sometimes creates conflicts with meeting other priorities. In addition, they may perceive DR as a substitute for or competition to energy efficiency or other energy management practices (Wilcox 2016). For facility managers, administering DR requires large time and capital commitments, which does not always match-up with existing capital projects that also require capital and human resources (BPA 2012, 54).
Risk and Uncertainty Unstable or short-term programs can prevent residential and commercial and industrial end-use customers from making DR, DG, or storage capital investments. Furthermore, high upfront costs coupled with typically long returns on investment make investments risky from the end-use customers’ focuses (Schwartz 2017). For example, an end-use customer’s willingness to install DG or storage equipment may be contingent on the extent to which they view the mechanism for recovering revenue, such as net metering, as reliable throughout the lifespan of the equipment.
7.3.2. Organizational/Operational Barriers
Lack of Technical Capability Home occupants and facility managers may not have enough technical knowledge to integrate DR into the existing energy management systems, or to respond to events (McKane 2008, 32; BPA 2014, 30). For example, participants in the Kootenai Electric Cooperative residential DR pilot program had significant difficulty using the DLC thermostats and changing the programming (Cadmus 2011). Kootenai also found it difficult to locate contractors who could reliably install the DLC technology (Cadmus 2011). For BPA’s TIP #220, Ecofys noted in their evaluation that the facility staff for buildings with cold storage equipment found it technically difficult to simultaneously meet the demands of both the program and of their business, and that by the end of the pilot, many of them had become fatigued (Ecofys 2013).

Appendix A: Literature Review 72
Dissatisfaction with Frequency and Duration of Events The frequency and duration of events are DR product parameters that significantly influence end-use customers’ event participation. For example, a BPA water heater pilot study showed that if the duration of water heater shutdown is too long, then residents may experience “loss of hot water” because of a large rebound in demand after the shutdown (BPA 2012, 42). A survey of diverse commercial and industrial end-use customers in the country also identified concerns related to the frequency and duration of events (Fry 2006, 10). For example, some end-use customers cannot tolerate events on consecutive days, and others refuse to be “’on call’ during the entire peak demand season.” Different commercial and industrial sectors prefer different blocks of time and levels of load shedding. Moreover, some end-use customers dislike the discontinuity of seasonal programs because facility staff may need additional training to refresh their technical capabilities.
Ineffective Event Notifications One common barrier for participating in non-automated DR events is missed notifications. In its Pacific Northwest Smart Grid Demonstration pilot, Flathead Electric Cooperative found that, with in-home display programs, event notifications did not generate significant event participation because they were not reaching the occupants (Rayome-Kelly 2016). Too many notifications can also deter end-use customers from participating in an event (Cadmus 2016, 19). On the industrial side, studies in the Northwest and California (BPA 2012, 48; McKane 2008, 32) have revealed that facility managers could be unavailable, busy, or no longer working at the facilities when the notifications were sent.
7.3.3. Perceptions/Attitudes Barriers
Lack of Awareness End-use customers may not be aware of programs available to them or fully understand the various types of DR and their potential benefits. Moreover, a LBNL study (McKane 2008) revealed that industrial facility managers may not understand the financial implications—either positive or negative—of participating in DR events. For storage and DG systems, in both residential and commercial applications, end-use customers may find it difficult to recognize the added value of these investments. Often, when energy costs are low relative to other costs, it can be difficult to get end-use customers to even pay attention to these resources or seek awareness or additional knowledge (Schwartz 2017).
Perception of Adverse Effects As end-use customers become acquainted with DR programs, various factors can trigger concern. For example, some end-use customers may perceive the term “demand response” as the power provider making a “demand” of them (Cadmus 2016, 16–17). Even common industry terminologies such as “smart grid” or “audit” may cause confusion, alarm, and apathy towards the subject (Rayome-Kelley 2016). In addition, as previously mentioned, end-use customers could perceive issues with information security and data privacy as adverse effects.

Appendix A: Literature Review 73
Portfolio of Demand Response Programs is Too Complex, or Not Flexible Enough Residential and commercial end-use customers have found the types of DR programs and number of options within each program (e.g., different rates) too complex or confusing (Cadmus 2016, 18; McKane 2008, 3–4). The 2011 potential study for the Tennessee Valley Authority (Global 2011) recognized this barrier and recommended to streamline the DR program portfolio by offering only three programs with the greatest DR potential. On the other hand, large commercial and industrial end-use customers may also find the programs not flexible enough in terms of different event or program parameters, such as “discretion over the exact block of time in which they might be asked to shed load” (Fry 2006, 9).
Negative Perception of Third-Party Aggregators If end-use customers are not familiar with the brands of third-party aggregators or are used to power providers’ in-house programs, they may be less willing to work with third-party aggregators (Cadmus 2016, 16). Moreover, some industrial end-use customers—especially those with very large loads—and the power providers that serve them may not appreciate aggregators acting as the middlemen and profiting from the DR value that the end-use customers generate (Peck 2017).

Appendix B: BPA Subject Matter Expert Interview Findings 74
8. Appendix B: BPA Subject Matter Expert Interview Findings
Cadmus conducted 14 small-group interviews with 55 SMEs from BPA, most of who work in BPA’s Power Services and Transmission Services organizations. BPA grouped the SMEs by function, and arranged for Cadmus to conduct the interviews in person at BPA offices in Portland and Vancouver. Each interview lasted about one hour, with one Cadmus representative conducting the interview and another Cadmus representative taking notes. In addition, at least two representatives from the BPA DERs team were present at each interview to facilitate introductions.
In this interview analysis, Cadmus categorized the interviewed SMEs in three main categories as shown in Figure 13: power, transmission, and administration. In the power category, interviewees included power planners, experts involved in power transactions, experts involved in Power operations such as schedulers and traders, Power customer account executives, and experts in energy efficiency and DERs. In the transmission category, interviewees included transmission planners, experts in transmission transactions (i.e., those involved in transmission policy, marketing, and sales), transmission operators, and transmission attorneys. Lastly, the administration category comprised all other SMEs who held significant roles in the development and deployment of DERs in BPA’s Power customer territories, including those in BPA’s executive office and various other corporate representatives.
Figure 13. BPA Subject Matter Expert Interview Groups
8.1. Key Findings Although BPA SMEs demonstrated varying levels of knowledge and exposure to DERs, they generally agreed on several key values that DERs could bring to BPA. Most—if not all—SMEs mentioned DERs’ primary value in potentially reducing peak demand to ensure power and transmission system reliability
Power
Long-term power planning
Resource program planning
Power transactions
Power operations
Power account executives
Energy efficiency
DER
Transmission
Long-term transmission planning
Transmission planning
Transmission transactions
Transmission operations
Transmission attorneys
Administration
Executive office
Corporate representatives

Appendix B: BPA Subject Matter Expert Interview Findings 75
and help balance the increasing saturation of intermittent renewable resources. Specific to the power system, SMEs believed that DERs could provide valuable ancillary services to balance intermittent wind and solar supply, and—in the case of storage systems—to store hydro oversupply. For the transmission system, SMEs continued to explore DERs as a more flexible and scalable non-wires alternative to conventional “wires” transmission projects.
While recognizing the values of DERs, BPA SMEs raised concerns about BPA’s ability to realize these values. They saw significant barriers to developing DERs, ranging from the lack of an organized commercial DR market and lack of capacity needs to low energy prices and increasing ratepayer scrutiny on costs. Under these constraints, SMEs saw limited opportunities to develop the organizational capability to deploy DERs, especially considering BPA’s other priorities competing for the same resources. For example, BPA would have to put much more effort to set up proper valuation, modeling, benefit/cost distribution, and legal structures for DERs. Moreover, several SMEs hesitated to recognize DERs as being as reliable and easily dispatchable as other traditional supply side resources. By contrast, they were less concerned about infrastructure-related or technological barriers because these barriers would be much easier to mitigate if BPA had a clearly defined need for DERs.
Uncertainty about the cost and reliability of DERs was another major concern the SMEs expressed. This concern grows from the relatively long-term planning horizons for transmission capacity system expansion planning, and for resource planning in general. The SME’s expressed that it can be difficult to plan for DERs—particularly DR resources—and to count on their availability over such extended planning horizons.
Considering these barriers, BPA has continued to explore DER options and test DER capability with pilots and demonstrations, and to work on integrating DERs into the existing power and transmission planning frameworks. BPA specifically designed its recently completed Integrated Demand Side Management (IDSM) initiative to fulfill this objective. SMEs also recognized that, despite the initiatives to explore DER options, BPA needs to take a clearer stance on DERs and make a more concerted effort toward addressing the barriers. The agency needs to answer difficult questions regarding its role and the roles of its Power customers in developing and deploying DER products. BPA also needs to consider the value of DERs, particularly DR, not only as means of meeting its resource needs, but as an option for meeting future reliability events.
8.2. DER Experience To set the stage for a discussion about DERs, Cadmus asked the SMEs to share their experience with DERs. The SMEs’ levels of exposure to DERs varied widely, depending on the organization to which they belonged. The DER experts shared results of numerous past DER pilots and demonstrations, as well as information about current pilots. Other SMEs from Power Services and Transmission Services generally indicated that they were currently planning DERs for their respective groups or were involved in past or current DER pilots and demonstrations.

Appendix B: BPA Subject Matter Expert Interview Findings 76
8.2.1. Planning for DERs Different BPA groups have a variety of DER planning activities. Historically, power and transmission planners treated demand-side resources, such as energy efficiency and DERs, as exogenous additions to the results of their planning models. As a result, demand-side resources were not considered in the same way as supply-side solutions to meet future power and transmission needs. To address this and other issues, BPA launched the IDSM initiative. Led by an energy efficiency expert and supported by a cross-functional executive sponsor team, the IDSM initiative created or defined the internal processes which would allow demand side and supply side options to be considered equally by BPA Power and BPA Transmission by 2019. As part of this initiative, BPA is currently building the modeling capability to better include demand-side resources in economic valuation, resource planning, and load forecasting models.
DERs are currently incorporated into BPA’s long-term power plans at varying degrees. In the annual Pacific Northwest Loads and Resources Study (White Book), long-term power planners project power resources and needs 10 years into the future (BPA 2017b). Once every two or three years, they also conduct the Federal System Needs Assessment to determine long-term resource needs for energy and capacity based on retail loads, contract obligations, different streamflow assumptions, and weather (BPA 2016c). Thus, long-term power planners would consider DERs only if specific needs for DERs persist for five to 10 years. After each needs assessment, the resource program planners determine the portfolio of power resources which could best meet the needs identified in the needs assessment at the lowest present-value cost. To consider DERs as a potential resource in the resource program, planners would need to know the total quantity of DER potential and the associated levelized cost.
Long-term transmission planners are also working to integrate DERs into the long-term transmission portfolio. Transmission planners produce a 10-year forecast of BPA transmission projects to meet three general transmission needs: transmission reliability, transmission service requests, and interconnections. Transmission projects are reinforcements or new construction of the physical transmission infrastructure, but there are also non-wires alternatives, which could include DERs, that might help defer or substitute for transmission projects by reducing or shifting load. For the next transmission plan, planners are working to identify locations that have high likelihood of transmission congestion or transmission service expansion. Some of these locations could potentially use DERs such as storage or demand response. In addition, a transmission policy group is working to identify how transmission operations could adapt to and absorb increased use of DERs in the BPA service area, which may include strategies to reduce the telemetry and interconnection costs that BPA Power customers and end use consumers presently incur to develop DERs and connect them to the BPA grid.
8.2.2. BPA DER Pilots and Demonstrations Cadmus gained a comprehensive understanding of BPA’s history with DER by reviewing pilot and demonstration reports, and by interviewing BPA SMEs. These BPA DER efforts are documented in Figure 14.

Appendix B: BPA Subject Matter Expert Interview Findings 77
Figure 14. A Partial History of DERs at BPA
This section highlights two pilots in Figure 14 that were mentioned by many interviewed BPA experts. Case Study A is a current pilot that aims to demonstrate DERs’ transmission deferral value. Case Study B showcases what some experts deemed as a simple and successful use of DERs to serve BPA needs.
Case Study A: South of Allston Bilateral Redispatch Pilot Many SMEs in transmission shared their experience with DERs in the current South of Allston Bilateral Redispatch Pilot (SOA pilot), designed to demonstrate BPA’s ability to manage a transmission constraint using generation redispatch and DERs. The SOA congestion area— north to south flows into Portland/Vancouver metropolitan area—has a transmission constraint in summer afternoons and early evenings. A long-term transmission planner explained that the constraint does not occur often during the year, but could have catastrophic ramifications on transmission reliability. To offer a “robust and reliable solution,” BPA had planned to build a new 500 kV transmission line segment from Castle Rock, WA, to Troutdale, OR. The line would have cost at least $1 billion.
In May 2017, after extensive scoping and analysis for nine years, including a multiyear environmental impact statement process, BPA decided not to build the new transmission line—also known as the I-5 Corridor Reinforcement Project—for a variety of reasons, including slow load growth and changes to the region’s power system, such as the required closing of two coal-fired generators in the I-5 Corridor (Mainzer 2017). Non-wires alternatives and new commercial Transmission products will be relied on to keep the path and SOA congestion area reliable. The SOA pilot represents a shift from the traditional approach of addressing transmission congestion and load service needs with new construction.

Appendix B: BPA Subject Matter Expert Interview Findings 78
Cadmus interviewed several SMEs who are involved in the SOA pilot, including the transmission attorneys involved in the bid selection and contracting, the pilot’s project manager, the expert making the transaction, and the transmission operator working on scheduling and tagging this resource. Interviewees indicated that the goal of the pilot is to test generation dispatch and DERs as an interim transmission deferral option, with the hope to transition them into a permanent deferral solution. Moreover, transmission operators are testing their capabilities to offer advance notices, which could expand the available DR product pool. Launched in July 2017, this two-year, summer-season SOA pilot is expected to produce 115 MW of summer congestion relief from a 200 MW portfolio of generation and DR assets. The DR assets provide 46 MW of the 200 MW.
Case Study B: Alcoa’s Intalco Aluminum Mill Multiple SMEs also discussed their DR experience with one of BPA’s last remaining direct service industrial BPA Power customers: Alcoa’s Intalco aluminum smelter in Ferndale, Washington.
In response to the 2000 energy crisis, BPA engaged with Intalco to achieve summer peak shaving by having it cycle off three of its production lines for 30 minutes at a time. Transmission experts attributed the ad hoc pilot success to its large DR quantity and direct relationship with BPA without any intermediary. Moreover, transmission operators enjoyed its operational simplicity: because Intalco resides in BPA’s balancing authority, there were no scheduling or tagging issues. Various SMEs presented Intalco as an ideal case study for DERs, where BPA and the DR supplier found a mutually beneficial agreement at a competitive price.
8.3. DER Perceptions and Vision BPA SMEs offered a wide range of ideas and visions for the Northwest’s public power service area in general, particularly regarding transmission planning. These are presented below, along with the experts’ ideas about how to realize their visions.
8.3.1. Overall Values and Uses of DERs Most SMEs highlighted the potential and values of energy storage systems, as detailed below.
DERs can reduce peak demand during the hottest and coldest times of the year to ensure system reliability. Many experts in Power Services and Transmission Services recognize the seasonal value of DERs in reducing peak demand, thereby ensuring that BPA can adequately meet power and transmission capacity needs during system peaks.
DERs can provide ancillary services to balance varying wind and solar supply. For example, long-term power planners and power operators said that DERs could provide ancillary services for wind or solar oversupply by shifting load or by storing load to defer consumption.
DERs may be attractive as part of a portfolio with other resources, but are not a panacea. Experts in power and transmission transactions agree that DERs must be mixed with other resources in a portfolio, so that the portfolio can address dynamic needs. For example, DERs have many favorable traits, such as

Appendix B: BPA Subject Matter Expert Interview Findings 79
seasonal and locational flexibility. However, a transmission transactions expert raised the possibility that DERs alone are not enough to address some of the larger transmission congestion problems. Similarly, an executive office representative believed that DERs may only be “niche” solutions that are deployed “situationally.”
Regarding the future development of specific DER products, experts saw potential in energy storage systems, community solar, and DR products such as residential water heating and nonresidential curtailment. They did not specify whether these products are more likely to be developed by BPA or by BPA’s Power customers themselves. DER experts noted that residential water heating may be useful to transmission needs because it can be frequently dispatched, and because cheaper technologies (such as a $40 water-heater timer) may achieve substantial load reduction. To incentivize residential end-use customers beyond financial incentives, another DER expert suggested marketing from the “green angle” or resilience perspective, such as the marketing done for the Orcas Power & Light Cooperative’s Energy Partners peak load reduction pilot from 1994–2002, which focused on increasing power reliability in the San Juan Islands of Washington State.
Storage provides ancillary services such as counterbalancing wind and solar variability and storing hydro oversupply. Power planners and transmission operators recognized the value of energy storage systems in—for example—storing midday solar oversupply for later consumption. In addition, transmission attorneys noted that a large fleet of storage resources could potentially address unusual hydro oversupply during the spring. In the past decade, hydro oversupply occurred a few times during the spring, forcing BPA to pay wind fleets to shut down so the system could consume the excess hydro power. If BPA were to acquire adequate energy storage resources, it could deploy those systems to store the hydro oversupply in such situations, rather than having to pay costly fees to shut down wind fleets.
Storage has the operational advantages of locational flexibility, scalability, and quick dispatchability. An expert in transmission transactions, while comparing storage to other DERs, stated that one can “put storage wherever needed and quickly dispatch it for long durations.” Transmission planners also pointed out the ubiquitous value of storage: “Anywhere we have load service, we could have batteries to reduce load or absorb over-generation”.
8.3.2. Values and Uses for Transmission Corporate representatives, power and transmission long-term planners, operators, and attorneys all agreed that the transmission view on DERs changed after BPA made the decision not to build the I-5 Corridor Reinforcement Project. From the transmission perspective, DERs “should be very important” for BPA because they are part of the non-wires alternatives that could defer transmission build projects. Although significant barriers exist to developing and deploying DERs, experts in transmission recognize the value associated with DERs, as detailed below.
DERs are more flexible and scalable than transmission projects. Transmission’s traditional solution to transmission congestion or service requests is to build more transmission infrastructure. However,

Appendix B: BPA Subject Matter Expert Interview Findings 80
transmission projects are irreversible, time consuming, costly, and often result in overbuild. In contrast, DERs comprise a broader and more manageable distribution of smaller resources with flexible contract terms, and is a “local solution for a local problem.” For example, a long-term transmission planner explained that BPA may build a new transmission line of 500 kV for 200 kV of needed transmission capacity, whereas BPA could acquire just enough DER to meet the 200-kV need. In addition, DERs have a shorter project development time compared to a transmission project, and are more flexible in the face of market uncertainties such as fossil fuel generation plant closures or unexpected new large loads, such as data centers. DERs also offer seasonality as another dimension of flexibility, which matches up well with seasonal transmission congestion that occurs in the summer in Portland or in the winter in Seattle.
DERs can act as backup resources during planned or forced outages. For Transmission Services, DERs can help reduce load during planned outages to alleviate the consequences of the outages. Additionally, Transmission Services is required to plan for n-1 and n-2 contingencies, meaning that the system must be able to operate properly with one or two failed elements of the Transmission system (e.g., lines, substations, transformers, breakers, switchyards). Transmission planners and attorneys agree that DERs can serve as backup resources when forced outages occur in unpredicted n-1 or n-2 events.
DERs could potentially address transmission service problems and contribute to increasing available transmission capacity. In addition to transmission reliability, transmission experts must plan for transmission service to deliver continuous or expanding service to its end-use customers. Several transmission experts gave an example of a load service area in southeast Idaho that was not connected to BPA’s transmission system, but which BPA was obligated to serve. As a result, BPA pays transfer service charges to another transmission system to deliver load to this area. If DERs can help reduce the area’s load during the other transmission system operator’s peak, then BPA can pay less to the other transmission system. To explore this possibility, BPA conducted an irrigation DR pilot with Fall River Rural Electric Cooperative, which—according to the power account executive—was successful and cost-effective in reducing load and BPA’s costs during the other transmission system operator’s peak. The pilot demonstrated the potential for DERs to address transmission service needs, not just transmission congestion relief. A BPA transmission expert is investigating how BPA can use DERs to increase available transmission capacity, enabling it to meet new long-term transmission service requests.
Transmission planners and operators offered three criteria to serve transmission purposes:
• Large quantity: Transmission operators cannot schedule or tag 1 MW to 2 MW of DERs; they would like transmission transactions to be at least 10 MW, and ideally in the 50-to-200 MW range.
• Dispatchability: Transmission operations lack accurate load forecasts needed for DR products with prescheduled or day-ahead notices. Transmission operations require dynamic DR products with fast response.
• Location-specific: Transmission experts singled out this requirement as unique to transmission: “Power Services only needs size and dispatchability for peak-shaving. Transmission Services adds the location element.”

Appendix B: BPA Subject Matter Expert Interview Findings 81
8.3.3. BPA Role in DERs BPA may or may not develop its own DER programs. BPA experts held different opinions on the level of BPA’s involvement in developing DERs. An energy efficiency expert posited that BPA will facilitate DER development by BPA Power customers, but will not directly develop DERs. In contrast, a DER expert believed that, in addition to helping Power customers to develop DER programs, BPA will develop its own DER programs. A power transactions expert explained that BPA would like Power customers to develop DERs themselves, but external stakeholders such as the Council may want BPA to develop DERs. Another DER expert stated that it is not BPA’s intention to create “competition” for BPA Power sales by developing DERs behind the meter. That DER expert suggested that BPA will only extract value for BPA and the region from DERs are made available as the utility industry matures technically and the DER adoption rate for BPA Power customers or end-use customers accelerates.
Experts all acknowledged that BPA must stay one step removed from end-use customers. For example, a transmission operator explained that BPA cannot contract directly with a “0.5 MW gravel pit or a chain of local supermarkets to switch off lights.” Thus, even if BPA develops its own DER programs, it would work with its Power customers and reach end-use customers through local utilities to implement the programs.
To ensure that it has reliable DERs to meet future needs, BPA could start developing DERs now. DER experts and a corporate representative stated their belief that BPA must build the capability to manage contingencies resulting from varying solar and water conditions, and that DERs represent a means for accomplishing this. To that end, experts believe that BPA must start developing DERs now to ensure that DER programs are available and tested for the long run, so that BPA can reliably dispatch DERs whenever needed. Some experts, however, have concerns about whether such needs for DERs exist. A DER expert observed that developing DERs now may seem “like a solution chasing a problem” to those who question the need.
8.4. Perceived Barriers In addition to DER perceptions and values, Cadmus asked the BPA SMEs to identify the barriers to developing and deploying DERs from their points of view. This section presents these barriers in several categories: Economic/Markets, Organizational/Operational, Infrastructural/Technological, Legal/Regulatory, and Perceptions/Attitudes.
8.4.1. Economic/Market Barriers
Absence of an Organized Commercial DR Market Many experts in power mentioned that without an organized commercial DR market in the Northwest, they believe DERs cannot be effectively developed and dispatched. An organized market allows DERs to be marketed at different locational marginal prices, reflecting their locational values more granularly and competitively. Without such a market, power and transmission planners all believed that BPA “can never dispatch DER based on price,” which limits the potential of DERs to reliability use only. Power account executives shared that, from the Power customers’ point of view, BPA demand charges do not

Appendix B: BPA Subject Matter Expert Interview Findings 82
constitute an effective price signal for justifying DER deployment. Several experts expressed their view that the Northwest has low energy prices and not enough price volatility to sustain an organized commercial DR market.
Uncertainty of Market Drivers Market drivers of DERs remain uncertain, which deters BPA from actively developing DERs. In general, experts noted various market uncertainties; for example, new technologies and industries come and go. Long-term power planners pointed out that DERs’ potential in providing ancillary services of balancing variable solar supply largely depends on the growth of solar in the region and in California. For wind, a power transactions expert observed that Portland General Electric (PGE), Puget Sound Energy (PSE), and Avangrid are moving—or have moved—their wind resource into other balancing authorities, which diminishes some of the balancing reserve capacity need that DERs could fulfill for BPA.
Lack of Clearly Defined Grid System Operational Needs and Value to BPA Many SMEs expressed that they see a lack of clearly defined BPA needs for DERs. Many experts believe that BPA can only develop and deploy DERs that address a clearly defined resource or operational need. Long-term power planners do not project significant load growth or near-term water shortages as a result of climate change. As a result, from a long-term planning perspective, BPA does not have an immediate capacity resource need that DERs can fulfill. Similarly, experts in Power operations expressed that they do not have an explicit operational need for DERs, otherwise they would have found a way to use them. They believe that it would be easier to address other operational barriers of integrating DERs in the current infrastructure if an operational need is clearly identified. On the transmission side, planners mentioned that other than the few areas of seasonal congestion that may be mitigated by localized DER, there is excess capacity and “almost never congestion” in the BPA grid. As a result, DERs may only serve “niche, situational purposes.”
Lack of a Region-Wide Framework for Valuing and Pricing DERs Lack of a valuation framework for DERs prevents BPA from making decisions on DER development and deployment. Power and transmission planners pointed out that BPA does not have a structure that adequately values the costs and benefits of DERs. Consequently, they do not know the capacity contribution or the transmission deferral value of DERs. For example, transmission operators were not able to confidently value batteries, and this was a factor inhibiting the use of batteries in the SOA non-wires pilot. Before making decisions on DER development, the executive office noted that BPA must evaluate the risks associated with DERs relative to alternatives. However, an executive office representative was concerned that without a proper valuation structure, decision makers are “left with largely subject-matter-expert judgement as basis for decision,” which is a challenge from the risk management perspective.
Additionally, there is a lack of a benefit/cost distribution or value-stacking structure for DERs. Because DERs could potentially serve multiple objectives and produce multiple value streams, planners and DER experts have found it challenging to come up with a fair and transparent value-stacking method for DERs. For example, although DERs may benefit multiple parties—including Power operations,

Appendix B: BPA Subject Matter Expert Interview Findings 83
transmission operations, Power customers, and end-use customers—they may not agree on a method of sharing the value of an individual DER or DR asset. Without a clearly defined need and carefully analyzed value-stacking structure, BPA Power account executives worried that deploying DERs may result in the misalignment of costs and benefits. Furthermore, in a case in which DERs benefit both BPA’s transmission system and the Power customer’s distribution system, BPA may not have enough information about those distribution systems to properly value the added benefit of DERs, and thus cannot make a reasonable business case for DERs to the Power customer.
Budget Constraint BPA is cost-constrained and under ratepayer scrutiny, and—according to a DER expert—has a very limited budget for DERs. Many interviewed experts mentioned that—among other factors—low energy prices and low load growth have reduced BPA’s revenues, thus reducing BPA’s overall budget and available staff. Because BPA has a lack of resources and staff, it must prioritize activities to meet its business targets and the needs of its public power customers. Representatives from the executive office noted that BPA Power customers are “very conservative” and expect BPA to “keep [its] cost under control.” They pointed out that rural BPA Power customers—such as those in northwestern Montana—are particularly concerned with revenue loss and increased rates if BPA starts developing DERs. Some experts pointed out that this cost-constraint is one of the reasons BPA had only conducted pilots and demonstrations, but had not developed DER programs.
Difficulty in Justifying One-Off Investments It is difficult to justify investments for one-off (occurrences that may not happen over a sustained period of years) DER applications. Experts in power identified several problems that DERs could potentially address, including hydro shortage and hydro oversupply. Hydro shortage in sporadic low-water years can be addressed with load reduction from dispatching multiple DR products over several days or weeks. On the other hand, hydro oversupply during the spring can cause BPA to pay wind fleets to shut down a few times so BPA can sustain its required hydro generation during periods of low loads. Instead of paying fees to shut down wind fleets, BPA may find it more beneficial to deploy energy storage systems to store the hydro oversupply. However, both DER deployment scenarios address unpredictable one-off situations, which might occur only one or two times each decade. Some of these experts believe the problems occur too infrequently to justify long-term DER investments.
Cost of Development and Deployment According to SMEs, DER development and deployment can be more expensive than other solutions for meeting various BPA needs, especially considering low power costs. For example, experts in Power operations stated that they would consider DR if its deployment cost is lower than the avoided capacity cost. Similarly, an expert in transmission operations believes that storage is still too expensive; another pointed out that storage must be maintained and replaced over time. The costs of DERs could deter some experts from “even trying to see how [they] can get rid of these barriers to DER(s).” These experts also mentioned other resources at their disposal that are cheaper than DERs. For example, an expert in Power operations mentioned that resources such as stored water power or thermal generation excess capacity are cheaper balancing reserves than DERs. Transmission operators have a similar opinion: “The
Appendix B: BPA Subject Matter Expert Interview Findings 84
traditional generators [for redispatch] are just cheaper.” Other experts, including a power transactions expert and a corporate representative, believe that “there are cheaper tools to address transmission problems.” Transmission planners will only use DERs to defer a transmission project that are cost-effective.
8.4.2. Organizational/Operational Barriers
Insufficient Intra-Organizational Coordination and Communication Concerns Differences between Power Services and Transmission Services, combined with limited intra-organizational coordination, render it difficult to jointly optimize DER development. A transmission attorney noted that BPA has two parts—Power Services and Transmission Services—separated by a river. To illustrate the difficulty for experts to work across the Power Services and Transmission Services organizations, a transmission operator alluded to challenges of working with different tax systems in Oregon and Washington. The transmission attorneys also highlighted that Power Services and Transmission Services have different customers and business models. For example, Transmission Services is non-discriminatory because it is obligated to provide access to any eligible customer that requests transmission service. Many of Transmission’s largest customers are wind farms, other merchant generation owners, power marketers and exporters such as Powerex, and the region’s investor-owned utilities. In contrast, Power Services focuses on meeting the needs of its preference Power customers, namely the public BPA Power customers.
Regarding DERs, power planners cautioned that Power Services and Transmission Services may have different visions for DERs. For instance, transmission attorneys believe that DERs have potential for Transmission Services, but worry that DERs may compete with Power Services’ revenues by “becoming a disruptor to the wholesale market.” On the other hand, a DER expert posits that some in Power Services could object to the transmission attorneys’ belief.
BPA has an integrated planning team that promotes intra-organizational coordination in power and transmission planning. For example, transmission planners coordinated with power planners to derive resource and load assumptions used in the 2016 Transmission Plan (BPA 2016b). Additionally, transmission planners viewed this DER barriers assessment as another effort in intra-organizational coordination. Nevertheless, several executive office representatives and transmission attorneys believe that this barrier persists to some extent because BPA experts are accustomed to working only within their respective functional teams. BPA is “designed [for people] to work very efficiently within silos.” Even within the Transmission Services organization, an expert noted that the two planning functions within Transmission Services do not always work well together.
Lack of Staff Knowledge and Capability Several planners and operators stated they have insufficient knowledge and capability to estimate DER potential. Power and transmission planners said that they currently do not have usable inputs of DERs’ needs and potential in their planning models. Power operations stressed that different definitions of DERs (“a generating resource or a negative load”) have different impacts on operations. Transmission

Appendix B: BPA Subject Matter Expert Interview Findings 85
planners and operators emphasized that they “do not have exposure to what [DER] is out there,” and find it challenging to select DER-related modeling parameters, such as quantity and duration of DERs. From the risk management perspective, another expert mentioned that there is not enough analysis on how DERs might help mitigate the normal and systematic risks that BPA faces.
Reliability and Dispatchability Concerns Some power and transmission experts perceive DERs as unreliable and not fully dispatchable. For real-time hourly trading in Power Services, experts need DERs to respond within 10 minutes of dispatch, an ability they do not believe DERs possess. A power transactions expert attributed this perception to a DR pilot in which one industrial end-use customer could not deliver reliable 10-minute-ahead DR. However, a DER expert noted that BPA has implemented “several very successful 10-minute-ahead regional DR demonstration projects in recent years.” He saw the power transactions expert’s perception as an indicator of how information on BPA DER and DR project results may not be widely or efficiently communicated across BPA. Another expert explained that “operations does not consider statistical availability, only actual availability.” This conveys that even if DERs prove to be statistically reliable (that is, reliable within a statistically acceptable margin of error), Power operations might still hesitate to use DERs. Similarly, some transmission planners stated a preference for new equipment at the substation or a new line for its tried-and-tested reliability, even if it is more expensive than DERs. Their rationale is that Transmission Services is risk-averse and more constrained with reliability requirements than Power Services, due to the standards set by the North American Electric Reliability Corporation. They explained that, because the Transmission Services organization is “the last stop” in ensuring delivery of load service, “if we take too much risk, the lights go out.” As a result, transmission planners work in a conservative culture of reliability: “The power system is not a laboratory; things have to work because when we need it, we need it.”
Furthermore, for power schedulers, dispatching DERs translates to needing an additional screen in an already complex operating environment. Also, transmission schedulers do not perceive DERs as products that are “easy, fast, and quick” to dispatch. According to an expert in transmission scheduling, transmission schedulers are generally reluctant to dispatch DERs even when they have the capability to do so.
Insufficient Insight into Power Customers’ Perceptions and Actions of DERs Insufficient insight into Power customers’ perceptions and actions of DERs prevents BPA from effectively planning and deploying DERs. The Power Services organization operates to satisfy the needs of its Power customers. However, long-term power planners acknowledged that they do not know how their Power customers perceive DERs, and whether these Power customers have already acquired any DERs or have plans to acquire DERs. This means that DER deployment is not effectively incorporated in BPA’s long-term power plans. Transmission operators and planners echoed the same sentiment. More specifically, they cannot identify and plan for DER potential in specific locations because they do not have in-depth knowledge of the Power customers’ distribution systems or plans.

Appendix B: BPA Subject Matter Expert Interview Findings 86
Potential Disconnect between BPA and its Power Customers’ Needs BPA’s needs for DERs may have adverse effects on their BPA Power customers, and vice versa. Resource program planners posited that DR could significantly change a Power customer’s load. This could have negative consequences for the Power customer, such as reduced revenues or changes in other operating parameters that are important to them. Another potential conflict of needs resides in Tier 2 rates. Power transactions experts and account executives said that Power customers may want to acquire DR on their own to avoid Tier 2 rates. As a result, the DR available for BPA needs may be limited. On the other hand, a power transactions expert mentioned the possibility that BPA may not want to pay its Power customers to acquire DERs, because DERs may help the Power customer reduce demand charges, which currently are a revenue source for BPA.
Slice Power customers—those who pay for a slice of the federal power system resources—present another potential financial impact of Power customers’ DERs on the BPA system. Slice Power customers receive a penalty or credit depending on whether their load exceeds or is under the scheduled load. Drawing from a pilot experience (also mentioned in Appendix A: Literature Review), a slice operations representative shared that BPA was not able to update the scheduled load when dispatching an event, and found itself paying the Power customer both the DR incentive and the slice credit whenever the slice Power customer responded to an event (BPA 2016d, 29). If BPA has difficulty registering a slice Power customer’s load changes as a result of its own dispatch, this representative questioned whether BPA could register load changes when slice product BPA Power customers dispatch DERs on their own.
Costly Telemetry and Interconnection Requirements BPA currently has costly telemetry and interconnection requirements, which deters Power customers and, indirectly, end-use customers from developing DERs, specifically storage and DG. Transmission planners and operators acknowledge that these operational requirements do “not make it easy for utilities [Power customers]” to develop DERs. For example, BPA historically required a revenue meter for resources over 250 kW, which takes six to eighteen months to install and costs at least $80,000. Additionally, any resource over 3 MW requires a telemetry system, which—according to a DER expert and a transmission planner—is very costly ($100,000’s) and time consuming to install. To recover these costs, BPA Power customers may increase rates for their end-use customers, which may result in negative views of DERs in the Power customers’ service areas.
DER Pilots Not Treated as Stepping Stones to Full-Scale Programs BPA has not grown DER pilots into full-scale program development initiatives, as a sustained economic or reliability need for BPA is a necessary prerequisite. An expert in transmission operations recounted his involvement in a DER pilot: “It was just a pilot, but if the DER was used to create available transfer capacity, then we would do a full cost-benefit analysis.” This revealed that transmission operations did not treat the pilot as if it could metamorphose into a real program. This treatment of pilots may have contributed to the concern of some Power customers that BPA does not have a long-term commitment to DERs.

Appendix B: BPA Subject Matter Expert Interview Findings 87
8.4.3. Infrastructural/Technological Barriers
Lack of Data Storage and Analytic Capabilities Power planners explained that DR is unique as it can have varying durations, frequencies, and locations. As a result, modeling for various combinations of DR parameters requires large data computing and storage capabilities in planning models. Power planners said modeling outputs sometimes are too large to be stored. Likewise, BPA Power operations receive large data files when dispatching DR, but lack the capability to analyze the incoming data.
Lack of a Demand Response Management System that Passes Federal Safety Standards for Cybersecurity BPA does not have a DR management system that passes federal safety standards for cybersecurity. The DERs group mentioned that existing pilots had addressed this issue by bypassing the BPA system, building a separate communication system between BPA, the local Power customer, and the DR aggregator.
8.4.4. Legal/Regulatory Barriers
Difficulty Trading DERs across Balancing Authorities According to BPA SMEs, aggregating DR across balancing authorities proves challenging and costly. As pointed out by power and transmission experts, BPA is one of many balancing authorities in the Northwest that operate independently of one another without a central dispatcher. Drawing from a DR pilot experience, a power transactions expert found it “expensive and problematic” to make DR transactions across balancing authorities as BPA must negotiate an additional bilateral contract with the other balancing authority. In addition, transmission attorneys noted the additional effort operators must make to communicate with the other balancing authority. Transmission operators also experienced some issues when scheduling and tagging DR transmission interchanges outside of BPA’s balancing authority.
Lack of DER Policies or Mandates Experts across the Power Services and Transmission Services organizations believe that BPA “is not an early adopter” of DERs. Some experts mentioned that a strong national push for DERs does not exist, nor are there aggressive policies in all states in the region, like those in California. An executive office representative said policymakers in the Northwest perceive interactions with California as risky after negative experiences resulting from working with California in the 2000 energy crisis.
Concern about Legal Statutes Legal statutes add limits and uncertainties to BPA’s ability to develop DERs. According to the transmission attorneys, the 1980 Power Act, for example, did not envision new technologies such as DERs. They explained that BPA may not be able to own assets or resources such as solar PV or storage under these statutes, which could limit BPA’s authority to acquire DERs. As a result, some transmission operators said that BPA can only use the request-for-offer model to acquire DERs from outside sources.

Appendix B: BPA Subject Matter Expert Interview Findings 88
In this model, BPA’s role is to circulate requests for offers to invite Power customers, aggregators, and end-use customers to bid their DERs, then to draft and execute bilateral agreements with the chosen DER suppliers. On the other hand, several experts in the DER group observed that uncertainties continue about how the 1980 Power Act should be interpreted, and that BPA’s legal experts have not provided a clear explanation regarding whether or how BPA could scale DER pilots to programs. For instance, a DER expert noted that different laws and restrictions may apply to Power Services and Transmission Services; thus, Power Services might not be able to develop DERs in the same way that Transmission Services can.
Limitations to Actively Acquiring DERs Contractually, as an electricity wholesaler, BPA must remain one step removed from end-use customers. This limits BPA’s ability to actively acquire DERs. Power planners encountered difficulties in aggregating smaller resources such as DERs as a wholesaler. Transmission operators added that BPA cannot directly ask end-use customers to participate in DER programs. At the same time, they noted that “nobody is knocking on our door to give us DR.” This view mirrors the experience of DR aggregators—as relayed by a transmission expert and a power account executive—who found it more challenging to work through a multiparty sales process (Power customers and end-use customers) to recruit participants, than to do so in other parts of the country. They deemed the wholesaler-Power customer-end-use customer relationship as a unique DER barrier in the Northwest. Account executives and energy efficiency experts confirmed this barrier, stating that Power customers are reluctant to accede control and information to vendors and aggregators due to their long-term relationships with end-use customers, and wanting to ensure high levels of direct customer service.
8.4.5. Perceptions/Attitudes Barriers
Time and Effort Involved in Changing Perceptions/Attitudes Institutionally, BPA requires considerable time and effort to accept new opportunities such as developing and using DERs. Experts in all three categories (power, transmission, and administration) acknowledged that BPA “has been doing the same business for a long time.” Therefore, BPA may have a “path-dependent” approach to decision-making, whereby current practices or solutions follow or are limited by historic practices or solutions. For example, transmission planners are used to examining one set of solutions (e.g., a 500-kV line) in a transmission service study; so they face a new discipline in examining another set of solutions (e.g., five different DERs). Moreover, transmission attorneys observed that sometimes, when senior executives decided to make changes, “people did not necessarily adopt changes right away.” They also noted that transmission planners and operators sometimes revisited risks that attorneys had already addressed, and planners and operators were generally resistant to DERs because they did not understand the broader vision for DERs.
Employees are Unclear Whether DERs are a Priority BPA employees have not perceived a clear signal from BPA’s top management that DERs are a priority for BPA. For example, a DER expert pointed out that BPA employees have different perceptions of how to prepare for contingencies: run programs—such as energy efficiency—continuously; or develop capabilities such as DERs that can be turned on only when needed. An executive office representative

Appendix B: BPA Subject Matter Expert Interview Findings 89
observed that, in contrast to the substantial buildup of energy conservation capability in the past 40 years, no one at BPA has made a long-term commitment to building long-term or near-term DER capability. This perception of an insufficient signal from BPA’s top management further exacerbates the path-dependent barrier to DER development. A corporate representative observed that top management’s signal to “look at” non-wires differs from “actively engaging with” or using non-wires.
Perceived Limited Relevance of Learning from Other Regions As an agency, BPA has a perception that the Northwest is unique and that not all of the lessons learned elsewhere in the country about DER development transfer to Northwest public power. Representatives from the executive office worried about the perception that BPA “isolates itself from the rest of the country and does not learn from others.” In addition, they observed that “there is just not enough interest” in DERs in the Northwest.
Perception of DERs as an Inappropriate Substitute for Conventional Resources Some experts do not perceive DERs to be substitutes for conventional resources. Based on their experience, experts in Power operations and transactions do not believe that BPA can aggregate enough DER or design products in a way that allows DERs to be used as a resource. In addition, outlined below as one of the legal barriers, some transmission attorneys interpret from the BPA statutes that it cannot own DERs. Because of these two constraints, interviewed experts believe that BPA can only deploy DERs to “address an operational need.” But even for an operational need, power operators struggled to see any DERs large enough “to make a difference in power generation.”
Perception that Power Customers Cannot Develop DERs Some BPA experts perceive that smaller Power customers may not have sufficient knowledge and capability to develop DERs. Drawing from the aforementioned pilot experience, some transmission experts raised concerns about the possibility that some smaller BPA Power customers may require additional outreach and training to understand the purpose and logistics of DER programs—including the commitment level required of them. Power account executives also said that some smaller BPA Power customers have limited staff resources and metering infrastructure, which further deters them from considering DERs.
Lack of BPA Long-Term Commitment Power customers and end-use customers have uncertainties about BPA’s long-term commitment to DER and about their own commitment levels to DER programs, leading to less program participation and fewer impacts. Some power account executives said that BPA Power customers prefer to participate in established DER programs rather than DER pilots and demonstrations. For example, experts involved in setting up the SOA pilot said multiple Power customers decided not to participate, but expressed interest in future participation if “BPA is serious about it.” This experience demonstrated that Power customers would be more willing to participate if BPA offers DER programs that are “repeatable and institutionalized.” For power account executives, established programs also are easier to market than one-off opportunities.

Appendix B: BPA Subject Matter Expert Interview Findings 90
8.5. Mitigation Strategies
8.5.1. External Actions The SMEs shared various barriers that BPA faces in developing DERs. Many of these barriers relate to BPA’s role in developing DER, such as whether they need DERs, and how they can develop DERs as a power wholesaler. Many SMEs believe that if BPA receives a stronger mandate to develop DERs from an external perspective, BPA could mitigate its internal barriers more easily. For example, corporate strategists and power and transmission planners believe that stronger state regulations across the region—such as renewable resource standards—could ensure that BPA has a stronger justification to develop DERs.
8.5.2. BPA Actions The SMEs offered several mitigation strategies for some of BPA’s internal barriers to developing and deploying DERs. Starting with top management, DER experts believe that top management must have the foresight to develop DERs to prepare for contingencies. Then, transmission attorneys added that top management must continuously pursue change management—careful reiteration of decisions from top management—until every functional team at BPA fully integrates the decision to develop DERs into their operations.
In power and transmission planning, other than existing efforts such as the ongoing integrated planning initiative and the recently completed IDSM, an expert suggested that BPA consider DERs to address transmission needs even before thinking about a new transmission line: “When people are already thinking of building a line, it’s hard for them to consider deferment.”
Several mitigation strategies exist for power and transmission operations. To mitigate operators’ negative perceptions of dispatching DERs, an expert in transmission scheduling recommended making the operating environment more conducive to dispatching DERs. For example, BPA could update its system to a new DR management system so that DER dispatching merely involves “a visible and effortless button to press.” This expert also suggested making clear notification and settlement procedures for operators, leaving no room for interpretation when it comes time to dispatch DERs for different end uses. Additional training events are also needed.
To entice Power customers to develop DERs, strategies range from providing a better BPA value proposition and program design to more education and creative collaborations.
• Power planners, transmission transactions experts, and energy efficiency experts believe that the most important mitigation strategy to Power customer–level barriers is to find the value proposition for BPA, then show how this value proposition directly translates to benefits for its Power customers. If BPA could use DERs to reduce its operating costs, then it could demonstrate to Power customers that DERs help keep rates low.
• A corporate representative stressed that BPA must ensure that its Power customers feel ownership and the ability to plan for their own needs. To instill Power customers’ confidence in

Appendix B: BPA Subject Matter Expert Interview Findings 91
DER vendors and aggregators, an energy efficiency expert suggested that BPA facilitate a regional vendor network to support more growth of local vendors.
• A transmission operator observed that PGE makes a good business case for its end-use customers to develop standby generation because PGE “agreed to take over the maintenance costs.” In a situation where BPA may not know end-use customers’ potential production loss when engaging in DERs, some lessons learned about regional stakeholders or DER service providers may help BPA identify better incentives for DER.
• To better plan for DERs, BPA must understand how its Power customers use DER. Because of challenges in aggregating or acquiring DERs across balancing authorities, it is especially important for BPA to coordinate with Power customers that share boundaries with other balancing authorities. Transmission operators are currently talking to BPA Power customers that share boundaries with other balancing authorities to ask for DER data on the metered boundary. With this information, transmission operations could improve its load forecast, which enables operators to make DER dispatch decisions more easily.
• To assure DR suppliers—Power customers and end-use customers—that BPA is determined to develop DR programs, transmission experts suggested that requests for proposals clearly and transparently convey BPA’s commitment and needs. Experts concluded that BPA needs to communicate more to ensure that DR suppliers fully comprehend the objectives and parameters of pilots or programs. To accomplish this, transmission experts are making sure to create maps and spreadsheets showing which specific locations need to increase generation or decrease load. In addition, they have developed graphics and communications regarding program logistics, such as the exact number of hours or amount of load that DR suppliers must have available for DR dispatch.

Appendix C: Stakeholder Interview Findings 92
9. Appendix C: Stakeholder Interview Findings
Cadmus conducted 15 individual and small group interviews, with approximately 16 external stakeholder organizations identified by BPA. These stakeholders represented a diverse range of prominent Northwest energy organizations that included investor-owned utility customers implementing DR programs, renewable energy and energy efficiency advocacy groups, trade groups, and state and federal agencies. Each stakeholder group provided a unique perspective about its experience with DER projects, DER development in the Northwest energy market, and barriers to DER development as well as potential strategies to mitigate these barriers.
9.1. Key Findings DER deployment in the Northwest is expected to take place in an environment that many stakeholders have described as unique and complex. Specific characteristics that stakeholders highlighted included the diversity of BPA’s public power customers, the region’s winter peak demand, the prominence of hydro-power, the Northwest’s interconnection to California’s power market, low-load growth in many BPA Power customer service territories, and the evolving nature of the Northwest’s power market.
Many stakeholders believed that the Northwest will become increasingly reliant on DERs in the future, but they highlighted many interrelated barriers to deployment of DERs in the region:
• Regulatory: Regulators and oversight bodies at various levels require BPA Power customers to demonstrate that DER investments are prudent, and they face political pressures to keep energy rates minimal. However, no standardized approach has been developed for how to value the cost and benefits of DERs, and this presents a challenge to regulators and public utility governing boards when reviewing investment proposals. It also is challenging to develop a regional approach for DER regulation. According to stakeholders, the Northwest’s fragmented energy market does not lend itself to unified decision-making.
• Legal: In the Northwest, power market customers engage in bilateral agreements with each other to trade DR resources. Several stakeholders noted that these agreements are complex and difficult to execute.
• Valuation of DER: DERs have the potential for multiple value streams, and cost and benefits can accrue on the distribution or transmission system at each location. However, several stakeholders said no model is currently in place to assign quantified values to DERs, making it difficult for investors to make decisions regarding which DERs to pursue, how to cost share in DER implementation, and complicating project approval.
• Absence of an organized commercial DR market: Several stakeholders suggested that the absence of a wholesale power market presents a development barrier for DER in the Northwest. An organized market could facilitate DER price signals and could reduce burdens on Power customers to trade DR resources. The expansion of the CAISO Energy Imbalance Market (EIM) could address some market-related challenges, according to several stakeholders.

Appendix C: Stakeholder Interview Findings 93
• Limited visibility on the grid: The absence of infrastructure to monitor some BPA Power customers’ distribution systems complicates DER development, according to several stakeholders. Without this visibility, it becomes difficult to identify locations where DERs can provide maximum value.
• Staff resources at public Power customers: Small public BPA Power customers may lack the staff and technical expertise to implement DER programs. Additionally, staff focus on immediate pressing issues, such as cybersecurity, evolving regulations, and declining loads.
• Power customer staff prefer traditional generating resources: Several stakeholders noted that BPA Power customer staff do not believe they can rely on DR resources to meet power needs.
• End-use customer mistrust of power providers: Some end-use customers are reluctant to allow power providers into their homes. In addition, transacting with end-use customers (especially residential end-use customers) proves costly and complex for power providers. While third parties could facilitate the end-use customer–power provider relationship, a stakeholder noted that the vision of smart-home solutions—enabling DR projects through third parties that manage end-use customer devices—has not yet come to fruition.
9.2. DER Experience Cadmus interviewed organizations that conduct a wide range of activities in the Northwest energy industry. Stakeholders described their own experiences in implementing projects or discussed the experiences of their member organizations. These experiences primarily related to DR programs, although some stakeholders had limited experience with storage and DG projects.
9.2.1. Demand Response Stakeholders provided insight into the design of DR programs in the Northwest, drivers for program development, and DR programs’ effects on end-use customer satisfaction.
Demand Response Program Design While stakeholders identified a few Northwest Power customers as having robust DR programs (e.g., Idaho Power’s irrigation and PacifiCorp’s air conditioning cycling summer peak programs), they consistently said that a DR program’s design depends on the characteristics of end-use customer loads, with large interruptible loads being the easiest to manage for DR programs. For example, one stakeholder said that DR programs should be developed based on economic value, starting with large industrial end-use customers and moving toward residential end-use customers. Another stakeholder observed that programs with relatively few aluminum smelters have produced thousands of megawatts of demand reduction, while a Power customer program, with thousands of residential Nest thermostat users, “moves the needle very little” on demand. Stakeholders also noted that some loads, such as campus-style or server farm high-tech loads, may be incompatible with DR programs. In regard to high-tech loads, the stakeholder said “a flicker can ruin a whole day’s work.”
Stakeholders observed that the biggest potential for cost-effective DR programs lies with large industrial processes, where program managers can experience the “biggest reward for the smallest intervention,”

Appendix C: Stakeholder Interview Findings 94
and irrigation loads, which have proven cost-effective when compared to the costs of simple-cycle natural gas peaking plants. However, identifying these larger loads has been challenging.
Pricing and End-Use Customer Satisfaction Challenges A primary difficulty experienced by Power customers in designing cost-effective DR programs arises from finding the price point at which end-use customers become willing to reduce their energy use. A stakeholder with experience implementing DR programs observed that end-use customers are “not interested in not reducing energy,” have ongoing operational needs, and need to be compensated accordingly.” DR programs affect end-use customers’ production in industrial and irrigation programs (and less so for air conditioner cycling programs); so it becomes critical to find the right price point to compensate customers, per the stakeholder. Another stakeholder echoed this observation, noting that the “price offered to [end-use] customers must justify the interruption,” that some operations can withstand interruptions while others would be very affected, that the price offered in DR programs was a “very significant” consideration for [industrial] end-use customers, and that value propositions vary by industry and end-use customer load.
Power customers are concerned about how DR programs can affect end-use customer satisfaction. According to a stakeholder with close knowledge of DR program implementation, these concerns are amplified in residential programs (such as electric hot water heater DR programs), where the scale of end-use customer interaction increases dramatically. Another stakeholder noticed end-use customer fatigue from participating in multiple DR programs implemented for limited durations. He noted that end-use customers needed certainty instead of one- or two-year DR pilot programs, and added that DR program implementers should study “how to generate end-use customer interest and leave DR programs in place for a reasonable number of years.”
9.2.2. Storage and DG Stakeholders noted relatively little direct experience with storage or DG projects. One stakeholder said her organization had participated in offering an RFP for an energy storage project to help demonstrate value streams for storage projects. The RFP specified expected project value streams at five levels: resiliency, frequency regulation, renewable energy integration, behind-the-meter benefits, and voltage support. Another stakeholder noted that storage projects provided a range of benefits, such as flexibility and renewable energy integration, but also said storage projects would not be practical in the Northwest until prices drop.
Regarding DG, one stakeholder noted that BPA Power customers have implemented many projects, including community solar and standby diesel generation. She said that while the Public Utility Regulatory Policies Act had helped drive the development of DG projects, BPA Power customers experienced a lack of need for these resources. Another stakeholder stated that project developers faced difficulties in interconnecting to the transmission system, and BPA could mitigate this difficulty by buying DG resources in larger quantities.

Appendix C: Stakeholder Interview Findings 95
9.3. DER Perceptions and Vision In addition to stakeholders’ experience with DERs, Cadmus asked about their perceptions of DERs’ role in the Northwest. The conversations focused primarily on stakeholders’ vision of a future power system, indicators that the current system is transforming, and the present characteristics of the Northwest energy market.
In addition to describing the evolution of the Northwest’s power system, stakeholders elaborated on DERs’ specific value propositions in the present and future, including supporting grid resiliency, deferring investments in transmission systems or power plants, and reducing peak hour demand.
9.3.1. Vision of Future System Several stakeholders said that the Northwest energy market will likely transform dramatically, with this transition described as a “huge tectonic shift” from “large capital and traditional utility investments to meet future needs toward something that is a non-wires, distributed energy solution.” This stakeholder noted that, in the Northwest, “end-use changes are going to reshape grid needs so that existing assets can meet those needs.” Another stakeholder suggested that the power industry is undergoing a transformation that “has not been seen in a century,” and that DERs can help manage the transition. Yet another stakeholder predicted that the power system will be “almost non-recognizable” in the next five to 10 years, and that things are moving “very quickly.”
Early shifts toward DERs, however, will likely be dominated by DR as the “economics of storage and DG don’t justify deep deployment.” A stakeholder noted that value streams for DG and storage will likely be “proven outside the Northwest and then adopted here.” He noted that the Northwest will not be a “first mover” for these technologies.
Stakeholders’ visions varied, depending on their industry perspective. For example, market- and technology-oriented stakeholders and long-term planning and public advocacy organizations had a vision of substantial change, while Power customers and regulatory stakeholders had a more conservative vision that predicted more gradual change.
9.3.2. Indicators and Drivers of Change Many stakeholders indicated that the Northwest will become increasingly reliant on DERs in the future, and they offered several indicators and drivers for this view. They frequently noted that BPA’s decision not to build the I-5 corridor reinforcement project highlights the significance of DERs to alleviate regional transmission constraints. One stakeholder stated that this decision highlights the need to work “within the current system.” Stakeholders also described public resistance to PGE’s proposed natural gas plant as an indicator that DERs will likely to play a prominent role in meeting future system needs.
Additionally, stakeholders indicated that regional retirements of coal plants, transmission constraints, the need for resiliency against extreme weather and climate scenarios, and system reliability serve as drivers for DER deployment. The most frequently described driver was the 2021/2022 planned coal plant retirements, which one stakeholder described as the upcoming “capacity cliff.” A stakeholder also

Appendix C: Stakeholder Interview Findings 96
observed that pressure against building natural gas plants will require the region to move “far beyond what is planned” in terms of DER development, and expected additional renewable resources will also require more DERs.
Several stakeholders said that fluctuations in weather patterns serve as a driver for DER deployment. One stakeholder noted that extreme weather events have affected system reliability elsewhere, and that it is “unsafe to bet that extreme weather events won’t happen” in the Northwest. Another stakeholder noted it is important to plan for “bad water years,” when the region’s hydro system might be unable to meet the Northwest’s power needs. Another stakeholder echoed this idea, noting that DR is a good planning resource “for a 1-in-20 peak scenario” with unusually high peak demand in a low water year.
Despite describing a perceived need for DERs in the Northwest’s future power system, several stakeholders expressed concerns that regional decision-makers did not feel urgency in developing DERs for system resiliency. Two stakeholders specifically noted that the Eastern United States advanced DER deployment only after having experienced large-scale power outages. One elaborated that the Northwest will experience little movement toward DER deployment until a problem occurs, and added that “people are saying the right things, but change will only come when there is a crisis.” Another stakeholder noted the lack of a “problem statement” and a “lack of urgent need” for BPA Power customers to change what they do and what they ask BPA to do.
9.3.3. Planning for the Future Several stakeholders highlighted the need for regional, long-term planning to ensure that DERs are available when coal plants are retired. They noted that the region ought to focus on operationalizing and building out infrastructure for DR resources now so they will be available when needed. Operationalizing the DR resource, according to another stakeholder, includes generating acceptance within the BPA Power customer’s so that DR can be deployed at scale.
9.3.4. Taking a Customer Focus Discussing the evolution of the Northwest power system, several stakeholders noted that the energy marketplace will need to evolve to take an approach more focused on the end-use customer. One stakeholder stated that “customers will be at the center of the bullseye in the future utility environment,” and a customer focus can be found everywhere in the modern economy, except the energy sector. He noted that “the optimization of the utility system” was “not a natural place for customer attention,” but that customer engagement will be critical for DER development. Another stakeholder highlighted Flathead Electric Cooperative’s successful customer engagement during the implementation of a DR program. The co-op successfully communicated to its end-use customers that reducing peak demand benefitted them.
9.3.5. Enabling Technology for a Transforming Power Industry Several stakeholders discussed technologies that will enable DERs to take a prominent future role. These technologies include: electric charging stations, smart appliances (including DR-ready electric water

Appendix C: Stakeholder Interview Findings 97
heaters), smart thermostats, and AMI technology. Some stakeholders expressed enthusiasm for electric water heaters as DR resources, noting that the Northwest has one of the highest saturations of electric hot water heaters in the country. In regard to PEV charging stations, one stakeholder noted that the Northwest has the opportunity “to do something dramatic.” Regarding AMI, however, another stakeholder noted that, while critical to DR development in the region, BPA Power customers are still “all over the place” in terms of AMI deployment.
9.3.6. Value to Maintaining a Power Customer–Centered Power System While stakeholders expressed a view that the Northwest power system will undergo significant changes in the future, two stakeholders highlighted the importance of ensuring that power customers have a central role in the future system. One stakeholder noted that it is important that DERs be deployed within a functioning power customer (local utility) system, and that end-use customers should continue to “play within the utility system rather than leave.” He highlighted the value of connecting to a reliable electric grid and noted that the cost of remaining on the grid would become high for those remaining, should large numbers of customers choose to leave.
Another stakeholder emphasized that it is critical to “think carefully about the role of a utility in the distributed world” and that it would be “chaos” if some segments of society were to separate from the grid while others were “stranded within the utility system.” He noted that a significant change to the utility system is inevitable, but added that the transition must be managed carefully, and it is important for BPA Power customers to continue to have a central role. An “unmanaged, chaotic transition” would be “bad for the economy and environment.”
9.4. Perceived Barriers Cadmus asked stakeholders to identify specific barriers that prevent DER deployment in the Northwest. Stakeholders provided feedback on a wide range of barriers, which Cadmus organized as Economic (including Market related); Perception and Attitude; Infrastructure/Technology; Operational and Organizational; and Legal/Regulatory. Stakeholders also noted several unique characteristics of the Northwest energy system that could impede deployment of DERs.
9.4.1. Characteristics of Northwest Energy System DER deployment in the Northwest will take place in an environment that many stakeholders described as unique and complex. Specific characteristics highlighted included the region’s diversity of actors (with differing power needs), the region’s winter peak demand, the prominence of hydro-generated electricity, the Northwest’s interconnection to California’s power market, low-load growth for many BPA Power customers, and the evolving nature of the Northwest’s power market.
Diversity of Actors and Needs Stakeholders noted that the Northwest power market is characterized by a large array of local utilities with distinct geographies, load patterns, transmission constraints, generation capabilities, technological capabilities, and regulators. For example, some BPA Power customers face transmission and supply constraints while others do not. Some have an overabundance of generation resources, while others

Appendix C: Stakeholder Interview Findings 98
face shortages. Some have moved toward AMI, while others still use analog systems. Additionally, load and end-use patterns vary greatly across the region.
Stakeholders also noted that the region is distinguished by its public power service area, comprised of more than 140 BPA Power customers with a “fiercely independent streak.” One stakeholder described the BPA Power customer situation as “balkanized,” and several stakeholders noted that many public power customers see flat or declining load growth, offering them few incentives to concern themselves with DER deployment.
Unique Feature of Winter Peak in the Northwest Respondents described winter peak demand as another unique feature of the Northwest power system. Stakeholders described several challenges that winter peak loads present for DR deployment in the region. For example, other parts of the country with DR programs generally have summer peaking systems, meaning that the Northwest “cannot copy strategies from other parts of the country.” Several stakeholders indicated that winter peak demand occurs twice during the day, and expressed concerns about end-use customer fatigue if DR programs were called upon multiple times in the day. Another concern raised was that end-use customer satisfaction could be negatively impacted if DR programs affect space heating during the winter.
Dominance of Hydro Resources Stakeholders highlighted the Northwest’s hydro-dominated power system, serving about 60% of the region’s annual energy load, as a distinguishing feature. They noted that the hydro system potentially impacts the DER deployment in the region in two ways: (1) the hydro system is very flexible, which could make regional DR programs easier to design because they require less precision regarding the timing of resource deployment; and (2) the prominence of the flexible low cost hydro system could lead the region to deploy DERs more slowly than the rest of the country.
Proximity to the California Energy Market An additional key feature affecting DER deployment in the Northwest is the region’s proximity to the California power market, especially given California’s rapid growth in solar energy production and the associated “duck curve,” which one stakeholder characterized as “bigger than expected.” Changes in the California energy market could, according to one stakeholder, significantly affect north-south power flows by reducing them and altering the seasonal and daily flow patterns.
In discussing the Northwest’s proximity to California, many stakeholders noted the potential effects that the expanding CAISO EIM could have on regional deployment of DERs. One stakeholder noted that the region currently is on a “complex path to a new energy market” and that “wherever the dust settles, the market will provide an important value stream” for DERs. Another stakeholder stated that an expansion of the CAISO EIM would facilitate regional DER development by providing flexibility and by allowing Power customers to liquidate and dispatch energy. Another stakeholder noted that regional needs will change with the evolution of the Northwest energy market, and DR could a be transition resource in

Appendix C: Stakeholder Interview Findings 99
moving toward a capacity market open to the CAISO EIM, a suggestion that DR might not be needed to the same extent after the Northwest market has been reshaped.
9.4.2. Economic/Market Barriers Economic/Market barriers identified by stakeholders included the difficulty of valuing and pricing DERs, low regional power rates, the absence of a capacity price, the absence of an organized commercial DR market, and the difficulty that Power customers face in trading DR resources with each other.
Lack of a Region-Wide Framework for Valuing and Pricing DERs The complexity of assigning a quantifiable monetary value to DERs emerged as a primary barrier to DER deployment in the Northwest. Stakeholders discussed the difficulties valuing DERs when benefits and costs occur on both transmission and distribution systems. They also discussed problems with defining value (given the locational benefits of the resources), understanding stacked resource values, identifying price points at which customers will participate in a DR program, and defining a cost-effective value compared to a generating resource.
Regarding benefits and costs accruing at the transmission or distribution level, one stakeholder described DR as a set of “combined resources” from which local BPA Power customers and the transmission system could realize value. He noted that BPA has “no view into the distribution system,” but that Power customers and BPA might be able to call on a DR resource to recognize value. Although both entities would realize value, it is unclear who would pay for the resource.
Several stakeholders elaborated on the need to clearly define the locational values of DERs. According to one stakeholder, there is currently “no locational value model” for DR. He noted it was necessary to examine the DERs’ value at the local level (such as deferring a distribution system upgrade) as well as at broader levels. Another stakeholder stated that “We don’t currently know what the actual value of these resources is” because their value varies “dramatically” by location, geography, and circumstance. For example, he highlighted the value of not overloading a transformer as “almost infinitely valuable.”
Several other stakeholders mentioned the difficulty in assigning value to DERs when the resource applications cover several distinct areas. One stakeholder noted it is necessary to “stack values in order to get a total picture of the resources net benefits.” Another said storage could be deployed for a host of applications, including system flexibility, renewable energy integration, and system resilience. He noted that a “system to value these applications is nonexistent” and this resulted in a lack of financial and economic drivers to develop storage projects.
Because of the lack of clear valuation, several stakeholders said it is difficult to identify the correct price to pay end-use customers for DR resources and to demonstrate how DERs compete with traditional generating resources.
Low Power Costs According to multiple stakeholders, low regional energy prices pose an obstacle to DER development. One stakeholder stated it is “hard to make the business case” for DER development in an environment

Appendix C: Stakeholder Interview Findings 100
of low energy and capacity costs. Another noted that policy and economic incentives do not encourage deployment of DER projects in the BPA territory, when BPA Power customers have flat loads and long-term energy contracts at low rates. Several other stakeholders echoed that low energy costs present a barrier: one said it is difficult to define benefits for the end-use customer in an environment of low rates; another said DER technology has difficulty competing in an environment of flat-load growth and low rates.
Absence of an Organized Commercial DR Market The absence of an organized commercial DR market emerged as a consistent theme when discussing barriers to DER development in the Northwest. One stakeholder stated “the Northwest needs a market mechanism that will value capacity resources on the demand side for both their locational and time-dependent attributes.” Another stakeholder said the Northwest lacks price signals for DER products as well as a market to facilitate price signals. While the CAISO EIM could help to facilitate these price signals, this stakeholder noted that Power customers have concerns about BPA joining that market, including concerns that market benefits would flow to California rather than to the Northwest, and DR resources could be unavailable when needed.
9.4.3. Perceptions/Attitudes Barriers Stakeholders’ comments regarding Attitudes and Perceptions primarily focused on end-use customers’ lack of interest in DERs, end-use customer fatigue with DR pilot projects, the multiplicity of DR service providers, and on a lack of trust and understanding by BPA Power customer staff that DR resources prove reliable.
End-Use Customer Concerns and Lack of End-Use Customer Interest Several stakeholders suggested that DR programs are challenging to implement because end-use customers have privacy concerns, find DR programs intrusive, or generally do not trust the power provider to have control inside their homes. Additionally, one stakeholder noted that generally there is low end-use customer interest in DER programs and, given the low cost of power, there are insufficient price signals to encourage end-use customers to pay attention to changes in the energy system. He noted that successful end-use customer engagement in DR programs would require information sharing, education, and patience.
End-Use Customer Fatigue Stakeholders said it is difficult to engage with industrial end-use customers for DR programs, given past inconsistent implementation of DR projects. Another stakeholder stated that commercial and industrial end-use customers are overwhelmed by the multiplicity of DR offerings, noting that facility managers “do not want to deal with a huge number of providers.” For residential end-use customers, the stakeholder noted that the “promise of the smart-home solution had not come to fruition” and there is a “general fatigue around the value of the smart home solution.”

Appendix C: Stakeholder Interview Findings 101
Lack of Trust in Demand Response by Power Customer Staff Stakeholders listed BPA Power customer staffs’ lack of trust that DR resources work effectively as a DR adoption barrier. One stakeholder noted that transmission and distribution engineers “trust wires and generators,” but would be skeptical of DR resources until “the needle moves on their console.” Another stakeholder noted that although Power customer staff prefer to “know exactly how much and what they are getting” from generating resources, this desire does not reflect reality because Power customers have dealt with uncertainty for a long time. Another stakeholder noted that although Power customer staff are cautious about DR resources’ reliability, some operational teams are very excited to work with DR.
9.4.4. Infrastructure/Technology Barriers
Lack of Visibility into Distribution Systems Several stakeholders said that a lack of visibility into Power customers’ distribution systems, described by one stakeholder as “back-end system monitoring,” presents a barrier to DER development. One stakeholder noted that although the BPA’s transmission system offers transparency as to “what is happening,” that visibility is greatly reduced at the local distribution system level. Another stakeholder said this lack of visibility is exacerbated for rural BPA Power customers with long distribution lines. According to two stakeholders, this makes it difficult to identify areas where DER projects would generate the greatest value for the local distribution company.
Limitation in Local Infrastructure One stakeholder said limitations in local-level infrastructure extend to meter deployment at the end-use customer level. These meters prove critical, according to the stakeholder, for the correct interface between the Power customer and end-use customer, and to enable DER development.
9.4.5. Organizational/Operational Barriers
Lack of Staff Resources and Technical Knowledge In regard to Organizational and Operational barriers to DER development, a lack of technical knowledge and staff resources to implement DER projects emerged for small public power customers. One stakeholder noted that lack of staff prevents implementation of DR programs, even if management is willing to adopt programs. Another noted that technology providers are unlikely to support small public power customers, and are more likely to focus their attention on larger BPA Power customers. Staff attention focuses on many challenging issues, including cybersecurity, flat loads, and new regulations. At the same time, local Power customers often do not have knowledge about the benefits of—and options for—developing DR programs.
Perceived Impact of DERs on Energy Rates and Load One stakeholder identified the impact of DERs on energy rates as a barrier to DER development and deployment. This stakeholder noted that load losses associated with energy efficiency programs have created obstacles to advancing those programs, and DER programs will likely experience similar barriers.

Appendix C: Stakeholder Interview Findings 102
He added that low regional energy rates drive economic growth, and any additional costs incurred by BPA starting or maintaining DR programs will likely be met with resistance.
9.4.6. Legal/Regulatory Barriers
Difficulty Trading Across Balancing Authorities The inability of BPA Power customers to trade DR resources across balancing areas emerged as a frequently cited barrier to DR development. One stakeholder said “a few cases in the region” have occurred in which a host BPA Power customer was reluctant to develop a “good and inexpensive DR resource” because it did not need that resource and could not trade it across the balancing authority boundary. He noted that this caused DR resources to go “unutilized.” Another stakeholder put it this way: “Why would you develop a DR resource if you can’t sell it on a regional market?”
One stakeholder said lack of an organized market in the Northwest made it difficult for DR to “move around” the region. He noted that Power customers must negotiate bilateral contracts to sell DR resources, and these transactions require a great deal of communication. He noted, however, that “folks are not in contact,” and that—in the absence of an organized commercial DR market—traders only engage in bilateral contracts when absolutely necessary. He pointed to the PJM Interconnection, a regional transmission organization, as an example of a market that works more fluidly, with a clear structure, and one in which utilities can offer small amounts of DR.
Lack of Regulations Several stakeholders noted that the region has not yet developed regulations to support DER development. Developing a comprehensive regulatory approach has been hampered, according to one stakeholder, by the region’s fragmented regulatory landscape, in which public utility self-governing elected bodies, appointed State public utility commissions, and BPA impact policies and face political pressures to keep rates down. Complicating matters, the region will have to develop its own unique regulatory approach and will not be able to draw extensively from other areas, given the Northwest’s unique power system, according to another stakeholder. A different stakeholder elaborated that “policy paradigms at national, state, and local levels have decades of maturity,” with all designed to regulate utilities responding to “faster and faster changing circumstances.” He noted a disconnect between the pace at which regulatory reform is taking place and the pace at which DERs will likely be deployed.
Difficulty in Gaining Approval for Investments Some stakeholders described the approval for DER investments as a regulatory barrier. According to one stakeholder, Oregon and Washington regulators are conservative; they ask regulated private utilities to clearly demonstrate the prudency of their investments through “traditional lenses,” making it more difficult to achieve approval for DER projects. Another stakeholder, discussing use of DR programs in extreme weather events, noted that it is “difficult to justify investments that appear like insurance products.”

Appendix C: Stakeholder Interview Findings 103
Legal Complications in Transactions Legal barriers described by stakeholders included challenges to implement DR programs at homes and businesses, and legal complications in transacting business between Power customers. Regarding legal barriers to conducting DR programs with end-use customers, one stakeholder noted the complexity of behind-the-meter programs, and careful scrutiny is given to the legality of program processes whenever implementing a residential program.
Two stakeholders also discussed the legal complications, especially for smaller BPA Power customers, arising from Power customers seeking to bilaterally trade DR resources with one other. One stakeholder stated that legal barriers prevented public power customers from transacting with one other, and the BPA rate structure inhibited movement of DR resources within its balancing authority. He also noted that one BPA Power customer could have DR resources despite having no need for them, while another could need DR but have no resources. Still, the two might face very difficult challenges in making a contractual arrangement that would allow them to trade the resource.
9.5. Mitigation Strategies In addition to asking regional stakeholders about barriers to DER development, Cadmus inquired about potential strategies to address the barriers. Strategies suggested by stakeholders included building DR capabilities into electricity-consuming equipment, developing methods to quantify the value of DERs, finding ways to make DR appear like a generating resource, improving communication between BPA and its Power customers as well as between Power customers and their end-use customers, and providing technical support to local BPA Power customers to help them implement DR programs. These strategies are discussed below.
9.5.1. Build Demand Response Capability into Devices Several stakeholders described challenges associated with transacting with end-use customers for DR programs. Working to ensure that electricity-using equipment is installed with DR functionality, described as a “plug-and-play” approach, could be a way to address this challenge. Several stakeholders suggested taking an upstream approach to encourage the development of DR–ready devices. Equipment standards and building codes could support DR programs as one way to reduce the level of effort required by Power customers to make end-use customers DR–ready, and could make it easier for customers to participate in DR programs, such as through NEST thermostats or smart-phone operated clothes dryers.
9.5.2. Market System Changes Several stakeholders stated that the ongoing evolution of the Northwest energy market could facilitate the deployment of DERs. One stakeholder noted that the expansion of the CAISO EIM could “change the discussion around DERs,” and could, according to another stakeholder “facilitate the ability to utilize DR resources across balancing area boundaries.”
Appendix C: Stakeholder Interview Findings 104
9.5.3. Adjust Appearance of Demand Response for Dispatch Two stakeholders suggested that BPA Power customers could mitigate their staff’s preferences for generating resources by making DR resources appear like a regular dispatchable resource. According to one stakeholder, this could include creating a dispatch screen and price for DR resources, allowing DR to be used like a traditional generator. Another stakeholder noted that a Texas utility has already taken this approach by making DR a “virtual power plant.”
9.5.4. Improve Communication Improved communication about the benefits and needs of DR could help drive the adoption of DR at the Power customer and end-use customer levels. One stakeholder suggested that BPA should have clear communications with its Power customers about the needs for, and benefits of, DR programs. These communications would include a discussion about the reasons for DR programs, as well as a coordinated approach to develop DR policies with BPA Power customers. Another stakeholder suggested, more broadly, that Power customers could help instill a sense of purpose and help to drive participation in DR programs by emphasizing the end-use customers’ role in the “bigger picture” instead of focusing only on the business case. That had been a successful approach in past BPA DR pilots.
9.5.5. Provide Technical Support to Local Power Customers BPA and state authorities could mitigate staffing shortages that discourage the implementation of DR programs at small BPA Power customers by providing technical support. Several stakeholders suggested that BPA could “help bridge staffing gaps,” act as a “conduit for technical resources,” and “share expertise and its centralized body of knowledge” with Power customers. State agencies could also have a supportive role in providing technical resources to smaller BPA Power customers, according to a stakeholder.
Appendix C: Stakeholder Interview Findings 105
10. Appendix D: DER Service Provider Interview Findings
Cadmus conducted 10 DER service provider interviews with individuals at companies engaged in DER implementation in the Northwest, including DR providers and aggregators, technology companies, and project developers. The DER service providers included staff at companies that manufacture products, develop technologies to enable programs, and design and implement residential, commercial and industrial, and behavioral DR programs. In addition, Cadmus interviewed two companies in the energy storage market: one developing utility-scale projects, and one working on distributed storage that can be aggregated to create virtual power plants. All DER service providers are active in the Pacific Northwest market, though only a subset has developed specific projects in the Northwest.
These DER service providers helped identify the range of services that DERs can provide in the Northwest. Additionally, by interviewing a variety of DER service providers, Cadmus gained additional insights into possible major policy, market, economic, and technological barriers to DR deployment in the Northwest. Cadmus also learned of strategies to mitigate barriers to DR implementation from proven stakeholders familiar with national strategies and best practices.
10.1. Key Findings DER service providers were generally positive about DR’s and DERs’ future in the Northwest and nationally. While DER service providers stated that the Northwest will unlikely need additional capacity in the short term, they felt that the need to integrate intermittent renewable resources into the grid would provide opportunities for DERs. Thus, both energy storage and DR DER service providers stated that the business case for these resources will likely address providing load shifting and ancillary services such as regulation, reserves, and ramping as well as distribution-level benefits that can help with the integration of renewable resources such as voltage support and improvements to power quality.
The primary DR barriers identified by the DER service providers included the lack of a defined need for DR, low power prices in the Northwest, and the lack of long-term programs in the region. DER service providers stated that BPA and its Power customers have run a number of short-term pilots, and it is now time to deploy full-scale programs if BPA has identified a need that can be met through DR. DER service providers suggested that best practice programs provide a clear definition of system needs and program requirements, and allow developers to bring different resources to market to meet defined needs over the long term.
To reach DERs’ full potential in the Northwest, DER service providers stated that educating end-use customers, BPA Power customer staff, and other stakeholders will be required. Customers and other stakeholders may not understand the potential role of DR and other DERs, and may have misconceptions about DERs, based on previous technologies that do not reflect the market’s current state. However, even with significant barriers identified by DER service providers, many DER service providers felt the Northwest will likely deploy DERs to their full potential over the next 10 to 15 years.

Appendix C: Stakeholder Interview Findings 106
10.2. DER Experience Cadmus interviewed eight DER service providers who work in DR, all of which are active in the Northwest market. They represented companies working on a variety of DR program components, including manufacturing grid-enabled products such as water heaters, developing platforms to aggregate residential thermostats and other devices, and designing and implementing programs. Cadmus interviewed DER service providers from three companies with experience in implementing BPA DR pilots over the past five years. In addition, Cadmus interviewed several DR DER service providers that have worked directly with BPA Power customers or with investor-owned utilities in the Northwest.
The DER service providers with experience in the Northwest primarily provided capacity-based DR products. These included summer and winter peak demand products, with programs designed to reduce capacity constraints in specific locations. One DER service provider worked with a BPA Power customer outside of a BPA pilot to run a residential DR program aimed at avoiding BPA peak capacity prices. Otherwise, most interviewed DER service providers’ DR experience in the Northwest was directly with BPA pilots, with some DER service providers also having been involved in smaller programs with investor-owned utilities. Several DER service providers, however, noted that investor-owned utilities made multiple large DR procurements over the past six months.
All DR DER service providers worked directly with utilities to implement programs in certain jurisdictions and to bid programs into organized wholesale markets. The markets in which each company had the largest presence varied, including regions such as the Electric Reliability Council of Texas (ERCOT), PJM Interconnection, California ISO, and the upper Midwest. None of the DER service providers considered the Northwest their largest market. The largest markets were driven by areas with high avoided costs, functioning organized markets, and a defined grid need that could be addressed by DR.
Both energy storage DER service providers had pilot projects with investor-owned utilities in the Northwest, although neither worked directly with BPA Power customers. The residential distributed storage DER service provider works with utilities to offer small-scale energy storage devices. Its utility customers can aggregate devices to provide services to the grid—such as voltage support, peak-shifting, and demand-charge management—while providing backup power and the ability to shift energy usage to customers in response to time-varying rates. This DER service provider primarily deploys its systems with solar generation to ease integration of solar power to the grid, but it also has some systems not directly deployed with solar.
Cadmus also interviewed a DER service provider that develops grid-scale energy storage projects. Many of its projects provide frequency regulation to the bulk power system, primarily in wholesale energy markets such as ERCOT and the PJM Interconnection. This DER service provider also develops projects on the distribution grid that offer other services needed by utilities, such as voltage support, real and reactive power, and power quality as well as peak shifting and outage management. This DER service provider has developed a number of utility c-scale renewable energy and energy storage projects, primarily in Texas, where energy storage helps avoid curtailment of production while offering services to

Appendix C: Stakeholder Interview Findings 107
the grid. The DER service provider stated that having an existing point of interconnection, such as at a renewable energy generation project, helps improve the economics of energy storage projects.
10.3. DER Perceptions and Vision
10.3.1. Demand Response All but two interviewed DER service providers considered the Pacific Northwest a viable market for DR, primarily due to significant support for DR from BPA, regulators, policymakers, and utilities. In addition, many DER service providers stated that engaged end-use customers who support sustainability initiatives also provide a good market for DR among residential and commercial and industrial end-use customers. Multiple DER service providers stated that informed and engaged end-use customers are a key component for successful DR programs.
At this time, all of the interviewed DR DER service providers thought that no defined system capacity need exists to drive the DR market in the Northwest. However, given the changing resource mix in the region, environmental pressures to close coal plants and manage the region’s hydro-electric resources differently, most of the interviewed DER service providers stated that capacity needs may arise, leading to more DR in the region. For example, one DER service provider stated, “The technology is moving forward, the momentum is there, the regulators are on board. To implement DR now it is just a matter of time and need.” This shows respondents’ belief that the market for capacity projects will develop.
While demand for capacity-based DR products may arise in the future, many DER service providers said non-capacity products will likely provide the greatest value for DR in the Northwest. These DER service providers thought that DR will be most important in the short term, acting as a flexible resource to integrate intermittent renewable resources in the region by providing services to the grid such as ramping and regulation. DER service providers also stated that using DR to increase load at certain times to avoid curtailing renewable resources presents a potential future function of DR. In addition, many DER service providers expect more programs will target localized issues at specific distribution circuits rather than transmission-scale programs in the short-term. Several DER service providers are developing programs that provide such services in other markets, mostly at the pilot scale rather than full deployments.
Two DR DER service providers said the Northwest may not be a viable market for DR in the short term, based on recent actions by BPA and its Power customers in the region. One of these providers pointed to some BPA Power customers in the region are summer-peaking, and others are winter-peaking, meaning that grid operators do not have a clear, specific, required need that DR can fill. This DER service provider voiced a concern that a good definition of avoided costs for DR was not available, making it difficult to develop a business case for DR. To summarize, this DER service provider said, “If you had asked me six months ago if the Northwest is a viable market for DR, I would have said a resounding yes. However, over the past 30 days a few things have happened that have made me doubt if the Northwest

Appendix C: Stakeholder Interview Findings 108
is a viable market for DR.12 At this time, it is not abundantly clear to us when Power customers need capacity. At the end of the day you are curtailing customers and the value of DR happens at a specific time, and if that is not clear to implementers, there is confusion on requirements, and it is difficult to assess the purpose of DR and sell the business case to customers.”
The other DR DER service provider, who does not consider the Northwest as a viable DR market in the short term, stated that low power costs, combined with a “strong inclination to build new generation and transmission in parts of the Northwest,” do not make it a strong market for DR. This DER service provider also stated lack of coordination between BPA and investor-owned utilities in the region and the lack of a defined need would restrict the market. With these two issues, this DER service provider stated that DR will unlikely play a significant role in the region.
Many residential DR DER service providers stated significant untapped potential for DR may exist in the Northwest residential market, both for behavioral and DLC programs. Other DER service providers discussed significant potential for residential DR programs due to significant deployment of electric heating and water heating in the region. This view, however, was not shared by one DER service provider, who stated that lack of electric heat makes it difficult to run winter peak reduction programs.
Many DER service providers stated that combined energy efficiency and DR programs offer the greatest potential in the Northwest, especially for residential end-use customers. Under such programs, residential thermostats or behavioral programs could be deployed to provide energy efficiency and DR benefits due to, as one DER service provider stated, “cost-effectiveness numbers in the Northwest are so slim that we need every value in order to make programs work.”
10.3.2. Energy Storage Both energy storage DER service providers stated that the Northwest is a viable market for energy storage, driven by regulatory mandates and a strong renewable energy market. One DER service provider claimed these were two key aspects for developing an energy storage market. The distributed energy storage DER service provider thought the market for energy storage in the Northwest will be primarily driven by resiliency concerns for use during outages, but integration of renewable energy and compliance with environmental regulations would also serve as drivers.
Both energy storage DER service providers expected robust growth in the energy storage market, with energy storage increasingly providing a range of services to the electric grid. Both thought that energy storage would also be used more to defer capital investments. In addition, storage products can help meet environmental mandates by providing grid services—such as spinning reserves and ramping—without burning fossil fuels, while allowing fossil generators to work at their rated capacity where maximum efficiency is achieved, rather than needing reserve capacity for unexpected events.
12 This quote was in reference to the service provider’s experience with a recent Puget Sound Energy Commercial DR procurement, which was not successful.

Appendix C: Stakeholder Interview Findings 109
10.4. Perceived Barriers
10.4.1. Economic/Market Barriers
Low Power Costs DER service providers identified low power prices as the primary economic barrier in the Northwest. The providers stated that low power costs make it difficult to build the business case for DR and energy storage in the region. In fact, high power costs were identified by multiple DER service providers as a key driver of successful DR programs, as this significantly increases the ease of recruiting customers. One DER service provider stated that providing incentives to customers of at least $50 per kilowatt-year is required to create robust commercial and industrial DR programs—a difficult proposition, given low power prices in the Northwest.
Lack of Definition for Avoided Costs An additional barrier identified by multiple DER service providers was a lack of definition about avoided costs from DR programs, making it difficult for DER service providers to develop cost-effective programs in the region. This includes a lack of definition regarding how to value locational programs, as identified by one DER service provider.
High Energy Storage Costs The distributed energy storage DER service provider cited high energy storage costs as another deployment barrier. However, this DER service provider noted that costs are declining, and this trend is expected to increase. In addition, the DER service provider identified a lack of time-varying rates as a barrier to energy storage development.
10.4.2. Perceptions/Attitudes Barriers
Lack of Customer and Contractor Awareness and Education Multiple DR DER service providers stated that customer education and awareness presents a barrier to DR in the region. This was cited by DER service providers working with residential, commercial, and industrial end-use customers. In addition, residential DR providers working on space and water heating programs stated that the lack of education and awareness in the contractor community presents a barrier to implementing DR programs, as space and water heaters often are emergency purchases made when an appliance fails. Given this, contractors need education and incentives to encourage customers to install grid-enabled appliances when their appliances fail.
10.4.3. Infrastructure/Technology Barriers DER service providers interviewed generally stated that Infrastructure/Technology barriers can be overcome and do not pose significant barriers to developing DER in the Northwest. DER service providers (active in the residential DR market), however, identified a few specific infrastructure barriers, given the smaller number of participants, and technology barriers more easily overcome in commercial and industrial programs.

Appendix C: Stakeholder Interview Findings 110
High Investment Costs in Back-End Technologies Multiple DER service providers identified the high investment costs in back-end technologies as a barrier to DR for smaller Power customers. They further noted that the prevalence of small utilities, especially BPA Power customers, makes the cost of residential DR programs too high for many utilities in the region, as it can be costly for utilities to invest in the information technology infrastructure to support residential DR programs. This cost can be prohibitive for BPA Power customers with smaller end-use customer bases, as they have limited opportunities to create benefits to offset this investment.
Low Deployment of AMI Infrastructure In addition, DR DER service providers focusing on residential end-use customers identified low deployment of AMI infrastructure as a barrier to implementing residential DR program in the region, especially for behavioral DR programs (which require AMI).
10.4.4. Organizational/Operational Barriers
Lack of a Clearly Defined Need for DR The most significant barrier to DR identified by all interviewed DER service providers is the lack of a clearly defined need for DR. The DER service providers stated that, until utilities or BPA define a long-term need, it will be difficult for DR to serve an important role regionally.
Specifically, all DR DER service providers interviewed stated that, to date, only short-term pilots and demonstration programs have been implemented in the Northwest. Short-term programs make it difficult to recruit end-use customers, who often may not want to spend the time and resources necessary to participate in a DR program without a guarantee of long-term revenue. Interviewed DR project developers said, in order to see the full benefits of DR, BPA or other entities will need to develop long-term programs and move away from pilots and demonstrations.
Burdensome Submission Requirements One DR DER service provider identified submission requirements from previous BPA DR solicitations as a participation barrier. In these solicitations, BPA required very detailed submissions compared with other jurisdictions. In addition, this DER service provider stated that previous solicitations have not used nomenclature consistent with industry vernacular. Together, these issues, in conjunction with a perception of a poorly defined system need, caused this DER service provider to not submit a bid in response to the solicitations.
Limiting Solicitation Requirements The residential DR DER service providers noted that recent solicitations by BPA and utilities in the region do not allow residential DR programs to participate, based on metering and other solicitation requirements.
Small Industrial End-Use Customer Base in the Northwest DER service providers serving the commercial and industrial market stated that, in several recent solicitations in the Northwest, the size of the DR resources that utilities procured did not match the

Appendix C: Stakeholder Interview Findings 111
available resource, making it difficult for certain DER service providers to respond to the solicitations. These DER service providers stated that the Northwest does not have as large of an industrial end-use customer base as regions with more robust DR programs. They stated that better end-use customer segmentation and a better understanding of the ability of end-use customers to participate in DR programs will make it easier to define successful programs in the Northwest.
Difficulty in Coordination with Power Customers Energy storage DER service providers cited a barrier of coordination within utilities as an impediment to energy storage. Utilities often have separate groups for planning around generation and transmission and for interconnecting new load resources to the grid. Because energy storage can be seen as a generating resource and as additional load, utilities often do not have planning processes in place to coordinate among these groups within their companies to plan for and interconnect energy storage.
As one storage asset can provide multiple services to the electric grid, it is important for BPA and its Power customers to establish a process to work across their transmission, planning, and distribution groups to ease review of storage projects. In addition, one DER service provider stated that grid operators may not have good methods for modeling proposed large-scale energy storage projects, since energy storage acts much differently on the grid than uncontrolled load. Existing power flow models often do not have simulation capabilities that can aid in evaluating dynamic grid impacts from energy storage. For example, simulation models can better demonstrate the effects of limiting ramp rates with storage to mitigate variable operations of other DER resources on the grid such as solar PV.
10.4.5. Legal/Regulatory Barriers
Difficulty Trading DERs Across Balancing Authorities DR’s primary legal barrier identified by DER service providers was the balkanization of balancing authorities in the Northwest. With many small balancing authorities and no organized market, it is difficult or impossible to have DR in one balancing authority that serves a capacity need in another balancing authority. As capacity remains a regional need, the difficulty in allowing resources in one balancing authority to serve a need in another can make it difficult to plan effective DR programs and to recruit end-use customers.
Need for Operational Rules and Tariffs The energy storage DER service providers identified many Legal/Regulatory barriers to deployment of energy storage. These DER service providers stated that operational rules and tariffs that allow storage to participate in multiple markets are essential for energy storage deployment. Specifically, operational rules around scheduling, dispatch, and settlement that allow storage to participate in multiple markets. These include allowing sub-hourly bidding in energy and ancillary services markets and allowing storage to exit the recharge market without a penalty. In addition, updating operational rules to ensure that distributed storage resources can be aggregated together will allow developers to deliver the full value of storage to the market. Prohibitions against utilities owning resources behind the meter can also become a barrier to distributed storage development.

Appendix C: Stakeholder Interview Findings 112
10.5. Mitigation Strategies
10.5.1. Demand Response
Organizational/Operational Barriers
Lack of Defined System Need The most important strategy DER service providers identified to mitigate DR barriers are the need for BPA and its Power customers to identify their needs and roll out long-term programs to meet those needs. Residential and commercial and industrial DER service providers stated that long-term programs will allow them to more effectively design cost-effective programs and recruit end-use customers. In addition, DR DER service providers suggested that BPA simplify the submission requirements in future DR solicitations. Markets actors point to programs in California and the PJM region as best practices that clearly define their need and require developers to submit data on the resources they can provide in a spreadsheet form and sign a contract, instead of requiring large customized proposals.
To accurately define the need and resource available, DER service providers stated that greater market segmentation would be helpful. This would allow Power customers to identify the amount of DR available, instead of soliciting more DR than may be available, and allow them to match programs to the types of end-use customers in their service territory.
Program Design Barriers Residential DR DER service providers stated that once a need is defined, programs should be designed with a broad framework that will allow project developers to bring a range of approaches to the market and will not exclude residential resources. As one DER service provider stated, “set the attributes and characteristics that you want from a DR program and make sure the framework is broad enough that all actors can participate.”
In addition, some DER service providers stated that ideally, implementers can ramp up their commitments over time. Thus, a DER service provider can continually recruit participants and slowly increase their commitment rather than requiring a full commitment in year one of a program.
One DER service provider suggested better coordination between BPA, their Power customers, and the investor-owned utilities in the region. This DER service provider suggested that in previous solicitations, the requirements from BPA did not meet the needs of local utilities. They suggested that, in order to deploy successful programs, all entities must agree about program goals and program design.
In addition, DER service providers who work with commercial and industrial end-use customers suggested approaching the largest end-use customers in the BPA service territory and working with them to identify program design characteristics. Based on those characteristics, it could be beneficial to design programs that maximize participation by the largest end-use customers who can offer the largest DR capacity. In addition, one DER service provider suggested that DR programs could be designed to

Appendix C: Stakeholder Interview Findings 113
target specific end-use customer groups or industries. Thus, BPA or a BPA Power customer could run a number of small programs with varying requirements instead of one large program.
DER service providers also stated that programs must be designed with the end-use customer experience in mind. To maximize end-use customer participation, programs must balance the needs of the BPA Power customer with characteristics that will encourage participation. Thus, programs that limit the number of times a resource can be called are often more successful than programs that allow for many potential events. In addition, programs designed to allow an automated response from end-use customers are often the most successful. DER service providers also stated that program design rules must allow them to design programs that offer solutions where both the end-use customer and the BPA Power customer gain benefits, such as the Power customer being able to combine DR and energy efficiency programs and the end-use customer getting to offset some of the upfront costs. DER service providers also pointed out the importance of designing programs for the long term: given that DER technology investments could last for 10 to 15 years, it is important to design programs that will maintain end-use customer participation to ensure that investments are cost-effective over their lifetime.
DER service providers also suggest providing end-use-customer–friendly recruitment. This includes leveraging BPA Power customer relationships to recruit larger end-use customers and providing case studies to potential end-use customers to help them understand the method by which they could participate. In addition, for residential programs, DER service providers stated that the ease of sign up is an important attribute, such as not requiring end-use customers to enter account numbers when enrolling.
10.5.2. Energy Storage
Legal/Regulatory Barriers To mitigate barriers to the development of energy storage, DER service providers cited a supportive regulatory landscape as a key requirement. Specifically, the utility–scale DER service provider stated that incorporating energy storage in the local utility integrated resources planning process, as is being done in Washington, is considered best practice. However, this process will take some time to fully implement and it may be worth identifying alternative planning processes around storage in the short term. Both energy storage DER service providers also cited regulatory and legislative mandates, and an openness to new solutions, as key factors in the development of energy storage projects.
Organizational/Operational Barriers Energy storage DER service providers cited the need to move beyond pilots and demonstrations to allow utilities and developers to implement projects. One DER service provider stated: “There are plenty of states, utilities, and grid operators that are having the same conversations year after year. Once you collect all the information, develop an action plan and move on it. At some point it will be time to execute, and when it is, BPA should provide system and load flow data to the energy storage development community, who can then propose projects that will meet the needs of the region.”

Appendix C: Stakeholder Interview Findings 114
In addition, to promote utility–scale energy storage projects, DER service providers stated that processes are needed to facilitate the review and interconnection of energy storage. As energy storage assets can provide multiple services to the grid, they often require coordination across multiple entities within a utility’s organization or BPA. In addition, the fact that storage can provide services at both the transmission and distribution scale further complicates the issues. DER service providers suggested that establishing processes and lines of communication between the different groups of a utility’s organization ahead of time is a key strategy to overcome this barrier. Specifically, one DER service provider stated that “when talking about transmission or distribution services, versus supply services, those are two very different tracks. Within a utility or system operator, there are often transmission and distribution planning and operations teams, plus a supply team. When it comes to getting resources studied and approved for rates, these are two different proceedings on the regulatory side. When trying to get single asset deployed for two services that cross those lines, there are not processes in place and it’s not an efficient way to deploy a resource. We need both regulators and utility staff to develop processes for storage approval ahead of time to streamline projects.”
In addition, DER service providers cited streamlining of interconnection rules around energy storage as a method to mitigate barriers to the deployment of utility–scale projects. For example, if energy storage and renewable energy are sited together, one DER service provider suggested having a streamlined process for the review of both applications together as best practice.
Customer Education Barriers Finally, education is a mitigation strategy cited by both energy storage and DR DER service providers. This includes educating end-use customers, BPA staff, and regional stakeholders on the benefits of these programs and technologies, including seeking to dispel common misconceptions in the market around these new resources.

Appendix F: End-Use Customer Survey Findings 115
11. Appendix E: Power Customer Interview Findings
Cadmus conducted 29 individual and small group interviews with representatives from 52 BPA Power customers. To ensure a comprehensive and equitable representation from these customers, Cadmus interviewed nine of BPA’s largest Power customers as well as 43 of BPA’s small- and medium-sized Power customers (as defined by total energy consumption), with geographic representation across the BPA service territory. For the small group interviews, BPA and Cadmus grouped Power customers by similar characteristics (e.g., end-use customer mix, size, geographic location).
BPA staff coordinated with BPA Power account executives and energy efficiency representatives to identify appropriate contacts for each Power customer. For each interview, Cadmus requested participants who represent power supply and end-use customer engagement perspectives as significant barriers exist for both Power customers and end-use customers.
11.1. Key Findings Power customers did not share a common vision for future DR and deployment of DERs in the Northwest. This is unsurprising, given Power customers have widely varying characteristics, including size, governance structures, BPA contractual relationships, state and local regulations, operational and human resources, generating resources, end-use customer characteristics, load shapes, and the existence or absence of distribution constraints. Although Power customers did not share a common vision, interviewees largely agreed that economic barriers, coupled with end-use customers’ lack of knowledge or interest, serve as the primary impediments to future DR and DERs in the Northwest.
Most Power customers named economic barriers as critical impediments to DER deployment. A common refrain was that it must make “economic sense” to both Power customers and their end-use customers. Economic barriers identified included how to quantify the value of DERs, low wholesale and retail energy rates, absence of an organized commercial DR market in the Northwest, and a fragmented market created by differing contractual relationships.
In an industry where end-use customers have traditionally “[paid] their bill and not [thought] about it,” Power customers say anything obtrusive to end-use customers creates a barrier to implementing DERs. In extreme cases, Power customers said they would not offer a known, financially viable DER program to an end-use customer unless enough interest existed to “push” the Power customer to implement. Others said they would consider end-use customer requests for DER programs alongside other drivers such as increasing load.
A couple of larger Power customers believe their end-use customers will begin to expect more from the Power customer. Future technological breakthroughs could disrupt Power customers’ traditional business models. These Power customers expressed frustration by the pace of the utility industry, and are keen to “get ahead of the curve” before “grid power is obsolete” by participating in DR pilots, launching DR programs, and developing their own in-house DER technical knowledge.

Appendix F: End-Use Customer Survey Findings 116
Power customers expressed a variety of opinions regarding their own role and BPA’s role going forward. Most think BPA should send clear price signals so Power customers can decide how to react. In this vison, the onus falls on Power customers to decide whether and how to invest in DERs. A smaller group of Power customers saw BPA’s role as an educator and facilitator of information to help bridge staffing and expertise gaps between Power customers. Three Power customers disagreed with the others, saying it is not their role to develop DER. These Power customers shared the vison of BPA as a leader or “total partner,” and they want BPA to work collaboratively with Power customers to develop programs and incentive mechanisms for deploying DERs. Although these three Power customers would like help developing programs, they stressed “we should handle the [end-use] customer-facing side, and BPA should handle the non-customer-facing side.”
11.2. DER Experience BPA Power customers’ experience with DERs varies widely due to their diversity, each with distinct operating characteristics and challenges. Differences include company size, governance structures, BPA contractual relationships, state and local regulations, operational and human resources, generating resources, end-use customer characteristics, load shapes, and the existence or absence of distribution constraints. The following sections summarize Power customers’ experience with DR, DG, and storage, and includes lessons learned.
11.2.1. Demand Response Of the three DER categories, DR experience was the deepest, with the most robust lessons learned. The DR experience of interviewed Power customers primarily comprises commercial and industrial load curtailment DR pilots—led by BPA, EnerNOC, EnergyNW, and the City of Port Angeles—and some Power customer-driven commercial and residential DR programs. DR pilots have tested differing notice periods in a variety of commercial applications, including cold storage, irrigation or wastewater treatment facilities, and residential applications (such as controlling water heaters and smart appliances). A wide range of products have been tested, including fully automated DR, semi-automated DR, and conservation voltage reduction.
Key company characteristics deterring Power customers from participating in further pilots or starting their own in-house DR programs include lack of AMI and Automatic Meter Reading (AMR) systems, lack of sufficient staffing resources and in-house technical staff, BPA contractual relationships that do not reward DR, uninterested end-use customers, risk of increasing end-use customer rates to cover program expenses, stagnant load growth, and lack of capacity constraints. In addition, DR pilots with requirements re viewed as too punitive deter Power customers from participating.
The interviewees representing Power customers with DR experience spoke about how participating in pilots better informed their understanding of their own internal capabilities to participate and implement DR, and that pilot participation has given them deeper knowledge of their end-use customers’ appetite for DR. Power customers said they preferred to deploy DR with nonresidential end-use customers rather than residential end-use customers due to smaller transaction costs (fewer

Appendix F: End-Use Customer Survey Findings 117
people to interact with) and higher returns for their efforts (each user has a larger load instead of aggregating a great deal of small loads). However, after engaging with commercial end-use customers, some Power customers found end-use customers were reluctant or unable to curtail energy use due to adverse production impacts.
Lessons Learned about Demand Response Power customers’ experiences in implementing DR pilots taught them a great deal about their costs and capabilities as well as about perceptions, needs, and experiences of residential and nonresidential end-use customers.
Lessons learned about internal costs and capabilities included the following:
• DR planning and implementation require adequate staffing. Power customers acknowledge DR program development and event implementation require in-house technical staff with adequate available time. According to one Power customer, DER program development works best with leadership, and when it becomes someone’s full-time job, whereas “grass roots program development is harder.” Experienced technical staff are required to make the business case for a DR program. In addition, responding to DR events requires the ability to staff control rooms at correct times and during short-term events. For example, one small Power customer explained that a barrier to the company’s participation in a BPA pilot arose from the penalty associated with failure to properly respond to an event within 10 minutes. This became a concern as the Power customer did not staff the control room at all times.
• Marketing a new DR program and educating customers is costly. Developing DR programs with large managed accounts requires interactions with end-use customers and internal conversations with management, both which use internal resources. Residential DR programs are even more costly for Power customers. One Power customer said the cost to educate and market new DR programs to end-use customers “cannot be underestimated and can be a huge burden for utilities [Power customers] that do not have the experience or manpower [staffing resources].”
• AMI and AMR systems are necessary for aggregation. Deploying AMI is necessary for Power customers to effectively administer residential and small commercial DR programs. As one Power customer said, without AMI, “We can’t see the load profiles within our [end-use] customer segments.” Without this visibility, Power customers cannot determine whether end-use customers have responded to DR events. Power customers with AMI have had varied experiences with its deployment, both positive and negative. That said, one Power customer reported a successful rollout of AMI in its service territory due to strong internal support for the project, development of an effective communication plan (which started 18 months prior to AMI rollout), and continued education.

Appendix F: End-Use Customer Survey Findings 118
Lessons learned about residential end-use customers included the following:
• Demand response programs rely on affluent end-use customers. Lower income end-use customers may not have the disposable income required to participate in DR programs. These end-use customers are less able to buy smart appliances or in-home displays (even if heavily subsidized by the Power customer).
• It may require a substantial investment to include residential equipment in DR events. Water heaters were an often-cited example of residential equipment that Power customers must retrofit to include in DR as it is not currently manufactured with DR equipment.
• Demand response programs rely on interested end-use customers, not correctly sized incentives. In an industry where end-use customers have traditionally “[paid] their bill and not [thought] about it,” Power customers say providing incentives is not necessarily the answer as some “don’t think the value will be there in terms of disruption for the [end-use] customer.” Instead of thinking about correctly sized incentives, one Power customer is thinking of ways to gamify their DR program by rewarding end-use customers with something tangible (such as movie tickets) rather than bill reductions that the end-use customer might not notice.
• Residential end-use customers are concerned about potential adverse effects. According to Power customers, end-use customers are concerned with any potential “loss of comfort, amenity, and convenience.” In addition, Power customers cited specific end-use customer concerns about the security of data transmitted using AMI technology or when employing two-way communications to control household appliances (e.g., smart thermostat DR).
One Power customer—active in a regional residential water heater pilot, a smart appliances pilot, and an in-home display pilot—leveraged lessons learned to launch its own water heater pilot. One lesson was that only the water heater pilot produced material electricity savings. In addition, the Power customer found that the smart appliances pilot was “a nightmare” because customers required technical assistance whenever they changed their router or internet service provider. Furthermore, even heavily subsidized smart appliances were too costly for end-use customers. The in-home display pilot offered a benefit in terms of social change, but the Power customer “could never make a business case for it.” The Power customer has now launched its own water heater pilot, stating: “[I] can’t say it’s a success yet, but we are going to keep going with it.”
Lessons learned about nonresidential end-use customers included the following:
• Nonresidential end-use customers are reluctant to take on any risk to production or margins. Some industries are not well-suited for DR. Power customers found that certain industries may be less inclined to participate in DR programs. Agriculture/irrigation, timber/paper mills, and food production reliant on cold storage facilities have inherent participation barriers to DR because any disruption to electricity supply puts productivity or product quality at risk (or both). Power customers reported that incentives provided to these end-use customers were not “moving the needle” or were not enough to justify the risk of participation.

Appendix F: End-Use Customer Survey Findings 119
Power customers east of the Cascades mentioned concerns unique to their irrigation end-use customers. DR irrigation programs cannot rely on turning off pumps during times of the year when crops are vulnerable, making it very difficult to shed irrigation load during peak summer days. In addition, incentives must be high enough to cover costs of infrastructure improvements (such as storage ponds and variable frequency drives) and to account for possible crop damage. Small irrigation Power customers said programs with high upfront costs are not economically justifiable, given the current market and incentives levels offered to Power customers and end-use customers.
• Sufficient advance notification is required for commercial end-use customers to comply with calls to reduce their demand. Through pilot testing, one Power customer learned that its commercial end-use customers could not provide DR with a one-hour notice; they required a day-ahead notice, which did not match program requirements. Other Power customers have found their nonresidential end-use customers say their systems (controls), staffing, and production needs prevent them from responding to short-notice or nighttime events.
• It may require substantial investment to include nonresidential equipment in DR events. The need to perform costly retrofits on equipment (such as HVAC control systems and lighting controls) can ruin a Power customers’ business case for DR programs. One Power customer said, in their service territory, it is a “missed opportunity” that commercial lighting is not required to be installed with controls since it is costly to add these controls later.
11.2.2. Distributed Generation Regarding DG, interviewed Power customers spoke almost exclusively of solar generation. Most Power customers have experience with small rooftop or community solar installations. Power customers operating in geographies with solar generation targets spoke about meeting those targets. One Power customer only installs solar if requested by an end-use customer, and only because “Oregon state law says we have to.” After targets are met, most Power customers pursuing further solar installations do so due to an adequate business case, given increasing BPA rates, or because the Power customer’s board members, commissioners, or customers are “pro-solar.”
Overall, Power customers have learned that solar most likely is not “the same disruptive technology” in the Northwest as in other places such as California, due to the Northwest’s unique characteristics. These include winter demand peaks, geographical considerations (such as climate and areas with dense tree cover), and regulatory changes to solar tax incentives that have increased end-use customers’ payback periods.
Many Power customer have learned that the payback period they can offer is not good enough to interest end-use customers. Power customers reported that end-use customers who are aware of payback periods for solar in California and Arizona are disappointed to learn that economics are not the same in the Northwest. One Power customer reported that it took one year to sell 300 solar panels with a 21-year payback. Another Power customer reported that 44% of its surveyed end-use customers showed interest in installing rooftop solar, yet only one actually did so. Other Power customers echoed

Appendix F: End-Use Customer Survey Findings 120
this sentiment by reporting that they had some interest in rooftop solar programs, but very little follow through after the end-use customers learn about the economics.
11.2.3. Storage Among the three DER measure categories investigated, Power customers had the sparsest experience with battery storage. Some expressed interest in storage to help provide resiliency and grid stabilization. However, Power customers reported that—due to high storage costs—it is currently more cost-effective to buy diesel generators to handle resiliency concerns than to invest in storage. The few Power customers with battery storage pilot experience agreed that they would not have pursued these opportunities without external funding sources. Those without storage experience are waiting until the economics become more favorable. One large Power customer reported it is “probably 10 years out” until utility-scale battery storage becomes cost-effective. Another interviewee said, as “a small utility [Power customer], we don’t have the capital to invest in battery substation storage; we can just sit and watch till it gets cheaper.”
11.3. DER Perceptions and Vision In addition to discussing Power customers’ experience with DER, Cadmus asked interviewees about their perceptions and visions of DERs’ role in the Northwest. The following sections elaborate on common themes and drivers of these perceptions, including perceived changes to capacity constraints and load growth, changes to future economic drivers, end-use customers’ attitudes about DERs, and Power customers’ perception of their own roles in comparison to BPA’s role.
11.3.1. Capacity Constraints, Load Growth A Power customer’s perceptions of and vision for DERs depends on whether it is capacity constrained or experiencing load growth. “Utilities [Power customers] without capacity constraints, transmission constraints, and adequate power supply” from a Power customer’s point of view did not see “a need to drive demand response” because “we’ve got more than we need.” A Power customer not capacity constrained reported that it would be interested in investing in DERs if a large increase in load occurred that would change the economics for its company (e.g., distributed resources would most likely be cheaper than investing in an $8 million transformer). Another Power customer not experiencing load growth said storage would be beneficial only if it was required to relieve stress at a substation or to avoid transmission line costs. Power customers acknowledged increased costs and difficulties in building new generation as current generation sources go offline. However, those without constraints did not envision that their need or expectations for DERs would change.
Most Power customers reported they were not currently capacity constrained. A few discussing localized capacity constraints in parts of their network said DERs could help alleviate this stress. One large Power customer in Washington reported that DERs could have a small role for specific capacity issues, such as targeting a specific substation. The Power customer explained that it wants to “harness grid value in areas that actually need it.” This DER vision does not encompass Power customer–wide programs, but rather a view that DERs are best suited to help in localized capacity constrained areas.

Appendix F: End-Use Customer Survey Findings 121
11.3.2. Contractual Settings Power customers said changes to their BPA contracts could impact their valuation of DER in the future. “BPA contracts go through 2028, but no one knows what’s going to happen in 2029.” BPA has differing contractual relationships with Power customers that impact these customers’ perception of DERs’ value. Several Power customers without DER experience said they have not seriously considered developing DER as their contractual relationship with BPA includes a rate structure that does not incentivize them to do so. Of Power customers subject to BPA demand charges, some said charges are too low for DR to make economic sense, while others have invested in AMI and DR pilots to avoid the charges.
11.3.3. End-Use Customer Interest Power customers often cited end-use customers’ interest in or appetite for DERs in shaping the Power customer’s vision of DER deployment. In extreme cases, Power customers said they would not offer a known, financially viable DER program to an end-use customer unless enough interest arose to “push the utility [Power customer]” to implement. Others said end-use customers asking for DER programs would be one consideration, alongside other drivers such as increasing loads.
Interviewees expressed competing views of end-use customers’ attitudes. Some Power customers said they are waiting until end-use customers demonstrate an actual need before taking DERs further. Others believed their end-use customers will begin to expect more from their power provider. Future technological breakthroughs—such as battery packs that allow end-use customers to perform arbitrage through storing electricity—could disrupt the Power customer’s traditional business model. These Power customers expressed frustration by the utility industry’s pace and are keen to “get ahead of the curve” before “grid power is obsolete” through participating in DR pilots, launching DR programs, and developing their own in-house DER technical knowledge.
11.3.4. Utility and BPA’s Role in DER Development One-third of Power customers interviewed expressed opinions regarding their own role and BPA’s role in development of DERs in the Northwest. The following text elaborates on the various roles Power customers envision for BPA, in the order of frequency with which they were discussed.
Provider of clear price signals. A group of small Power customers believe BPA should lead by sending clear price signals to Power customers through its wholesale contracts, demand charges (if applicable), or incentives, and they will then decide how to react. For these Power customers, encouragement of DER deployment should come through BPA’s contracting process. One Power customer in this group reported being limited by what it buys outside of its contract with BPA, and wants to work with BPA to expand its contract. Another Power customer in this group said deployment of DERs falls outside of BPA’s business scope.
Provider of education and information. As a facilitator of information, BPA can help bridge staffing and expertise gaps between Power customers. A group comprised of small Power customers and one large Power customer was interested in standardization of information to help Power customers market and run programs. One Power customer said BPA has done a good job in putting together an

Appendix F: End-Use Customer Survey Findings 122
implementation manual that provides granular data on energy efficiency technologies, and said it wanted something similar for DERs. Three public utility districts said they wanted more information on the status of BPA’s transmission lines, including how much DR resource BPA needs to defer investments.
Partner. Three Power customers said it is not the Power customer’s role to develop DERs. This group shared the vison of BPA as a leader or “total partner,” and they want BPA to work collaboratively with Power customers to develop programs and incentive mechanisms to develop and deploy DERs. One Power customer, capacity constrained due to rapid growth of energy needs in central Oregon, said BPA should be responsible for developing programs; so BPA does not have to build additional transmission infrastructure for capacity. Another Power customer expressed interest in having BPA lawyers draft standardized DR response contracts that all Power customers could use to mitigate against potentially lengthy, complex, and expensive contracting processes needed when setting up new DER contractual relationships. A large Power customer in Washington said continuation of pilots is too “piecemeal,” and it wanted BPA to provide a consistent DR product year after year that offers a tangible value (such as reimbursing DR participants for the avoided cost of transmission). Although Power customers in this group wanted help in developing programs, they stressed that “We should handle the [end-use] customer-facing side, and BPA should handle the non-customer-facing side.”
11.4. Perceived Barriers Cadmus asked Power customers to identify specific barriers preventing deployment of DERs in the Northwest. They provided feedback on a wide range of barriers, falling into the following groups: Economic/Market Barriers, Perception/Attitude, Infrastructure/Technology, Operational/Organizational, and Legal/Regulatory.
11.4.1. Economic/Market Barriers Most Power customers cited economic barriers as critical impediments to DER deployment. A common refrain was that it must make “economic sense” to Power customers and their end-use customers. Economic barriers included DER valuation hurdles, low wholesale and retail rates, absence of an organized commercial DR market in the Northwest, and a fragmented market due to inconsistent price signals.
Valuation of DER and DR Pricing Currently, no standard method exists to quantify the monetary value of DERs in the Northwest. One Power customer said it has “been struggling for about five years” to evaluate the value of DERs or DR by “mixing and matching different metrics,” but it has not successfully concluded its value because “it’s a tough nut to crack.” Location presents one complicating factor. For example, Power customers with localized capacity constraints in parts of their network would value DERs highly to alleviate this stress, while those without capacity constraints would not.
It is difficult to determine a rate design without a commonly understood and agreed-upon value of DERs. This affects how Power customers design rates and incentives to encourage end-use customers to participate in DERs. It also affects how BPA charges Power customers for wholesale rates. Power

Appendix F: End-Use Customer Survey Findings 123
customers expressed reluctance to participate in DR unless the program cost is clearly understood and justifiable as it might adversely affect end-use customers’ satisfaction with the power provider.
Low Power Costs Low energy costs make it difficult for Power customers to justify the cost of developing DERs. Power customers said little incentive exists until costs for DR, DG, and storage decrease relative to wholesale contract rates. However, current wholesale rates are locked into long-term contracts through 2028.
Absence of an Organized Commercial DR Market in the Northwest Without an organized electricity market, Power customers reported difficulty in extracting value from DERs. To make DERs compelling for Power customers, an organized regional capacity market must be available. They may provide a DR resource or capacity that is regionally valuable, but not locally valuable. Without an organized capacity market, no mechanism is available to sell or buy these services. One Power customer reported there is no real need for DR without a price signal. For this Power customer, no economic signal exists other than avoiding demand charges. Additionally, the energy market for spot options is well developed; so the Power customer finds it easy and preferable to buy a call option prior to any known extreme weather events. In the absence of price signals, Power customers cannot recover their costs for providing DER benefits.
Differing Contractual Relationships that Create Inconsistent Price Signals BPA holds differing contractual relationships with different Power customer types. This influences Power customers’ perceptions of DERs’ value, and, in turn, leads Power customers to respond to differing signals. In one interview, Cadmus spoke with representatives of two similarly sized public utility districts: one a load-following customer located east of the Cascades; and the other a slice/block customer without demand charges located in the west. The load-following Power customer mentioned demand charges as a driver for DR trials it has completed with industrial end-use customers and the rollout of its AMI meters. This Power customer envisions a greater role for DERs in its territory as it considers how to pass on demand charges to its residential end-use customers using AMI data. The Power customer without demand charges did not have past DER experience and said it is not “really looking at demand response” because it does not get “significant savings” for reducing demand at peaks as the other Power customer would. The slice/block Power customer also mentioned compounding factors making it less likely to deploy DERs apart from demand charges, including that it is not experiencing load growth in its territory and its end-use customers do not have AMI meters.
11.4.2. Perceptions/Attitudes Barriers Power customers’ comments regarding attitudes and perceptions primarily focused on their own end-use customers’ barriers and how these varied by nonresidential and residential end-use customers.
End-Use Customer Barriers (Nonresidential) Power customers that have worked with nonresidential end-use customers have found the incentives they can provide sometimes are inadequate to entice participation. Nonresidential end-use customers are concerned about DERs impinging on their margins or introducing unnecessary risk into their

Appendix F: End-Use Customer Survey Findings 124
operations. Many commercial and industrial end-use customers have tight margins, which cannot support participation in DR programs. Incentives do not always align with commercial risks for end-use customers. In addition, Power customers have found that end-use customers are dissatisfied with the frequency and duration of events. Through pilot testing, one Power customer learned that its commercial end-use customers could not provide DR services with a one-hour notice; they required day-ahead notices, which did not match program requirements.
End-Use Customer Barriers (Residential) Attitudinal barriers to DER participation for residential end-use customers included lack of interest and perception of adverse effects.
As for lack of end-use customer interest, Power customers recognize that time is a factor. Just as it takes much of their own internal staffs’ time and resources to set up a DER program, it requires a great deal of time for their end-use customers to participate. “[End-use] customers don’t want to think about it, they just want it to work,” one interviewee said.
Power customers also reported end-use customers’ concerns about the security of their transmitted data when using AMI technology, or when any two-way communication is needed to control a household appliance (e.g., smart thermostat DR). While implementing a hot water DR pilot, one Power customer received pushback over having control of the end-use customers’ hot water heaters because end-use customers “have a hesitancy to allow Big Brother to watch them.” The Power customer needed to put more resources into end-use customer education than anticipated to assuage end-use customer concerns.
11.4.3. Infrastructure/Technology Barriers Technology barriers derived from not having the technology needed to deploy DERs, lack of experience with the technology, and needing to learn how to use nascent technologies.
Lack of Experience with Technology (Inexperienced Contractors/Installers) Deploying nascent technologies is time- and resource-intensive. One Power customer said it had been “burned by past experience with applying demand response” because the nascent technology “required a lot of human resources to make it work.” In addition, lack of collective knowledge in how to install new technology is “a big issue,” as Power customers have found that installers “don’t know what they are doing.” This has led to safety issues. Power customers also discussed future technology and infrastructure barriers that they currently do not experience. For example, controlling and managing grid impacts from Personal Electric Vehicles (PEVs) will certainly present future barriers. This barrier, however, is not currently present because Power customers have not seen much, if any, adoption of PEVs in their service territories.
Lack of AMI Deployment Power customers without AMI cited AMI deployment costs as prohibitive. Power customers with AMI have had varied experiences with its deployment. Deploying AMI or AMR systems is a multifaceted

Appendix F: End-Use Customer Survey Findings 125
project that may involve the support of multiple internal departments, new technology procurement, IT infrastructure builds, and other factors. One Power customer said new AMI or AMR systems rarely produced the capabilities promised by vendors. This caused the Power customer to develop workarounds and to spend much time, energy, and resources to continue to test and deploy systems. Another Power customer found it burdensome to set up the billing system needed to interact with the meters, and discovered any changes to billing required lengthy IT infrastructure build times. That said, one Power customer reported a successful rollout of AMI in its service territory due to strong internal support for the project, development of an effective communication plan (which started 18 months prior to AMI rollout), and continued education.
Substantial Investment Due to Equipment Limitations and Lack of Uniform Communication Protocol The need to perform costly equipment retrofits may impact the business case for DR programs. Power customers gave examples of current equipment limitations that require them or their end-use customers to make substantial investments to participate in DR. One Power customer said, in their service territory, it is a “missed opportunity” to not insist that commercial lighting be installed with controls. Another reported that end-use customers considering participation in a pilot could not do so because their building setups for HVAC control systems and lighting controls were not suitable. For example, one end-use customer had a grocery store with the potential to reduce some load by controlling its lighting, but it had not installed controls to work with the refrigeration load, which would have required additional investment.
The lack of standardized communication protocols presents an additional barrier to DR, both now and in the future. One Power customer estimated that if the region introduced a uniform communication protocol today, it would still take 17 years before equipment (such as water heaters) would be present in the market and operate using these protocols. Power customers mentioned the severe time lag between standardizing communication protocols and market saturation as a barrier to their ability to work with end-use customers on DR.
11.4.4. Organizational/Operational Barriers When speaking about organizational and operational barriers to DERs, Power customers focused on limited operational resources, competition with financial priorities, a lack of internal technical expertise, the need for end-use customer education and marketing, and risk to their reputations in working with third parties.
Scarcity of Staff Resources Several Power customers said a new DER program would require significant staff resources. Some Power customers said they would need to operate any DER program offerings without hiring new staff. A large Power customer said it is cutting costs internally and is in its second major layoff in five years. Others are already operating with a “bare bones” staff. This does not just present a barrier for smaller Power customers: even for Power customers with sufficient, knowledgeable staff, their teams and individuals have full-time jobs that do not involve thinking about and researching the evolving DER market.

Appendix F: End-Use Customer Survey Findings 126
According to interviewees, DER program development works best when championed by leadership, and when it becomes someone’s full-time job, whereas “grass roots program development is harder.”
Competition for Financial Resources DER programs compete for internal Power customer resources. For some Power customers, other obligations must take priority. For example, updating aging infrastructure takes precedence over spending money on new DER projects. Without a pressing need for DR, one Power customer said DR has “fallen down the list.”
Insufficient Knowledge of Best Practices in Program Design and Implementation Some Power customers said they lacked the expertise needed to implement DER programs and to deploy DR resources without spending money on outside knowledge from technical consultants.
Costly End-Use Customer Education and Marketing One Power customer said the cost to educate and market new DER programs to end-use customers “cannot be underestimated and can be a huge burden for utilities [Power customers] that do not have the experience or manpower [staffing resources].” This large Power customer said it has “spent a lot of money trying to communicate effectively with our members” to market solar PV and water heater DR pilots. This Power customer does not account for marketing expenses within the program budget, but acknowledged it “might not be breaking even” if it “analyzed how much time we put into education and marketing.”
Working with Third Parties Creates Reputational Risk Power customers did not want to rely on third-party systems for aggregation as it would force them to tie their reputations to a third party that end-use customers would view as representative of the Power customer.
Views of Oversight Committee Board members, commissioners, and other members of a Power customer’s governance structure can serve as barriers or supports in deploying DERs. One Power customer said the “political views of commissioners can change our drivers.” Another Power customer said keeping its board engaged is an important part of this process. This larger Power customer has “good in-house technical staff” that can answer all of the board’s questions and keep them from “pulling the plug” on DER programs. This Power customer recognized that a smaller Power customer would not have the resources to do this.
Municipal Power customers have additional oversight from committees to make sure company priorities match the municipality’s priorities. For example, one municipal Power customer explained that the company’s rate structure will change within the larger context of the city’s goals after installing AMI. Part of this oversight requires that any new program’s incentives do not advantage one segment of end-use customers at the expense of other such customers.
Appendix F: End-Use Customer Survey Findings 127
11.4.5. Legal/Regulatory Barriers
Costly Regulations One Power customer mentioned that the burden of complying with costly regulations—such as Washington’s I-937 and BPA’s fish and wildlife remediation—presents a barrier in having enough time or money to implement DERs. The Power customer passes each of these costs on to end-use customers through billing rates. The interviewee was concerned that these rates may rise to comply with regulations that “in most cases push us to do things that we maybe don’t feel our [end-use] customers want or can afford.”
Complexity and Expense of Contractual Relationships Deploying DERs requires setting up new contractual relationships that may involve lengthy, complex, or expensive contracting processes. Power customers viewed a DER project that requires special contracts with BPA as a deterrent. One Power customer said it has not been able to implement a residential DR program with BPA because “We’ve always gotten hung up on the contractual language and who does what.” Another Power customer suggested mitigation for this barrier through the BPA legal department creating standardized DR contracts for all Power customers.
11.5. Mitigation Strategies In addition to asking Power customers to identify barriers to DER development, Cadmus inquired about potential strategies to address the barriers. Power customers suggested ways to think creatively about DR programs and strategies to mitigate the scarcity of operational resources and lack of end-use customer interest, and explained how building DR capabilities into equipment could save Power customers from expensive retrofits.
11.5.1. Think Creatively about Demand Response Power customers mentioned creative ways to overcome barriers specific to DR:
• One Power customer worked with its end-use customers to harness the value of a DR product that initially did not seem valuable to the Power customer. The end-use customer offered a DR product to a Power customer that proves regionally valuable but not locally valuable. This Power customer worked with the end-use customer to shift and flex their load during windy periods and at very low prices.
• Instead of concentrating on how to calculate end-use customer incentives, one Power customer is thinking of ways to “gamify” their DR program by rewarding residential end-use customers with something tangible—such as movie tickets—instead of giving them money off their bills, which end-use customers may not notice. Others are thinking about ways to redesign their end-use customers’ bills, potentially with feedback from end-use customer focus groups, to show the monetary benefit of participating in DR.
• Although some industries may face barriers to participating in DR (e.g., agriculture/ irrigation, timber/paper mills, and food production reliant on cold storage facilities), other industries such

Appendix F: End-Use Customer Survey Findings 128
as water treatment plants, are more easily able to accommodate DR. One Power customer suggested concentrating pilots on the latter industries.
11.5.2. Combat Scarcity of Operational Resources through Information Sharing Power customers suggested combating the scarcity of their operational resources by banding together regionally to share information. Some Power customers also suggested that the BPA support research in the region through the continuation and expansion of pilots and by providing lessons learned; so they can avoid mistakes made by others. This group expressed interest in the standardization of information to help Power customers market and run programs. One Power customer said BPA has done a good job of putting together an implementation manual on the energy efficiency side, providing granular data on energy efficiency technologies, and they said they would like something similar for DERs. Another Power customer is interested in BPA lawyers drafting standardized DR contracts that all Power customers could use to mitigate against potentially lengthy, complex, and expensive contracting processes needed for setting up new DER contractual relationships.

Appendix F: End-Use Customer Survey Findings 129
12. Appendix F: End-Use Customer Survey Findings
Cadmus used the end-use customer surveys to investigate end-use customer awareness of DERs, barriers to DER participation and adoption, and the likelihood of DER participation and adoption. This section presents the overall key findings first, followed by individual findings for residential, small commercial, and managed account end-use customers.
12.1. Key Findings Small commercial and managed account end-use customers currently have the greatest awareness, participation, and adoption of DERs compared to residential end-use customers. As shown in Figure 15, residential and small commercial end-use customers were most familiar with the same three DER products: time-of-use rates, solar PV, and lithium-ion batteries. Managed account end-use customers were most familiar with curtailment, standby generation, and lead acid batteries. While the majority of end-use customers knew of DERs, participation and adoption remained very low, reflecting the limited number of BPA Power customers currently offering DER programs and products.
Figure 15. Most Familiar DERs Among End-Use Customers
Barriers Not surprisingly, cost emerged as a significant barrier to DER participation and adoption across all three end-use customer classes—more so for DG and storage than for DR, as shown in Figure 16. Specifically for residential and small commercial end-use customers, cost emerged as the most significant barrier across all three DER categories. Managed account end-use customers rated cost as the most significant barrier only for DG and energy storage, and managed account end-use customers rated cost as the most significant barrier for DG and energy storage. They rated, however, interruptions to business and concerns about product quality as the most significant barriers to DR.
End-use customers widely differed regarding the second-most significant barriers. Residential end-use customers noted issues of comfort, product maintenance, and lack of space. Small commercial end-use customers noted concerns with interruptions to business, lack of compatible infrastructure, and the

Appendix F: End-Use Customer Survey Findings 130
presence of cheaper alternatives. With importance placed on product quality and a business case for pursuing DER projects, managed account end-use customers’ second-most significant barriers emphasized business operational and financial concerns.
Figure 16. Most Significant Barriers to DER Participation/Adoption, by Customer Class and DER
Note: Respondents rated the significance of barriers to adopting DER using a 5-point scale, where 1 means not at all significant and 5 means very significant. Percentages shown here are the total
percentage of respondents who rated the barrier as highly significant (a 4 or 5 rating).
Future Participation In the next two years, end-use customers said they will be most interested in participating in voluntary usage reduction and rate programs, installing solar PV, and installing lithium-ion batteries. In terms of DR, some end-use customers would be willing to participate without a financial incentive, but, for all DERs, offering incentives or lowering product costs will be key to increasing the likelihood of participation and adoption.
12.1.1. Residential End-Use Customers This section provides findings from the residential end-use customer surveys. In addition to reporting the overall residential end-use customer findings, the text compares survey results by homeownership status (owners versus renters), region (east versus west), and Power customer size (large versus small). Cadmus used total BPA MWh sales to determine whether a Power customer was categorized as large or small; if a given Power customer’s total sales represented 2% or more of BPA’s overall sales, it was categorized as large. Statistically significant findings at only the 5% (p≤0.05) or 10% (p≤0.10) level are reported here.
Current State of Awareness, Participation, and Adoption of DER Figure 17 illustrates residential end-use customers’ current awareness, participation, and adoption for each program or product within the three DER categories. Residential end-use customers’ awareness of DER programs and products widely varied, but participation and adoption were consistently 1% to 2%.

Appendix F: End-Use Customer Survey Findings 131
Figure 17. Residential End-Use Customers’ Awareness, Participation, and Adoption of DERs
Survey questions: “Here are several types of demand response programs. For each one, please
select yes or no, if you have heard of this.” “Which program are you currently participating in?”; “The next set of questions are about DG, also known as on-site power generation. Are you
familiar with DG?” “Does your home have solar PV?” “Do you participate in a community solar program?”; “Here are three home energy storage systems. For each one, please select yes or no,
if you have heard of this.” and “What type of energy storage system does your home have? (select all that apply)”
Among DR programs applicable to residential end-use customers, respondents were most familiar with time-of-use rates and least familiar with DLC. Just 17% of respondents (n=292) had heard of DLC, which the prompt defined as a DR program where “The utility [Power customer] controls a [end-use] customer’s electric space heating, water heating, or central air-conditioning equipment on short notice for a few hours in an agreed-upon number of days during the year. In exchange for participating, the [end-use] customer receives an incentive payment or bill credit.”
Nearly half of respondents had heard of time-of-use rates (46%, n=293), defined as “special electricity rate pricing that varies by time of day and when energy use is in high demand.” A significantly higher proportion of west respondents (51%, n=171) indicated familiarity with time-of-use rates than east respondents (39%, n=122).13
13 Statistically significant difference at 10% level (p≤0.1).

Appendix F: End-Use Customer Survey Findings 132
For DG, the survey asked residential end-use customers whether they had heard of solar PV arrays (“solar cells arranged into modules that convert sunlight into electricity”) and community solar programs (“a project that serves members of a community who may or may not be able to locate solar PV on site”). Most respondents had heard of solar PV arrays (72%, n=293), but not community solar programs (27%, n=293). A significantly higher proportion of east respondents (34%, n=122) indicated familiarity with community solar than west respondents (23%, n=171).14
Among the three types of home energy storage systems, one-half of respondents had heard of lithium-ion batteries (50%, n=293), 38% (n=292) had heard of lead acid batteries, and 11% (n=292) had heard of salt-water batteries. A significantly higher proportion of homeowner respondents (46%|56%, n=153) indicated familiarity with lead acid batteries and lithium-ion batteries, respectively, than renter respondents (30% n=139|43%, n=140).15
Interest in DER When asked which DR programs they were most interested in participating in over the next two years, residential end-use customer respondents said voluntary usage reduction (49%). Respondents showed the least interest in participating in DLC (18%). However, 12% of respondents said they had no interest in participating in any DR program. Figure 18 shows respondents’ participation interest levels across the DR programs.
Figure 18. Residential Customers’ Interest in Demand Response Program Participation
Survey question: “If any, which demand response programs would you be interested in
participating in the next two years? (select all that apply)” (n=294)
14 Statistically significant difference at 10% level (p≤0.10). 15 Statistically significant difference at 5% level (p≤0.05).

Appendix F: End-Use Customer Survey Findings 133
Residential end-use customers had similar interest levels in participating in a community solar project during the next two years as they did in installing solar PV. About one-third of respondents (35%, n=289) said they were interested in installing solar PV, and 38% (n=289) said they were interested in participating in a community solar project.
When asked which home energy storage systems residential end-use customers are most interested in installing in the next two years, respondents said lithium-ion batteries (25%, n=294). Respondents showed the least interest in installing lead-acid batteries (6%, n=294). However, 25% (n=294) of respondents said they have no interest in installing any home energy storage system.
A significantly higher proportion of small Power customer respondents (36%, n=98) indicated interest in installing lithium-ion batteries in the next two years than large Power customer respondents (19%, n=196).16 A significantly higher proportion of small Power customer respondents (10%, n=98) indicated interest in installing lead acid batteries in the next two years than large Power customer respondents (4%, n=196).17 A significantly higher proportion of renter respondents (14%, n=141) indicated interest in installing salt-water batteries in the next two years than homeowner respondents (5%, n=153).18
Barriers to Participation and Adoption Respondents rated the significance of barriers to adopting DERs using a 5-point scale, where 1 means not at all significant and 5 means very significant. The survey asked respondents to rate the barriers to participating in DR programs separately from the barriers to adopting DG and storage resources. Percentages reported in the barriers section represent the total percentage of respondents who rated the barrier as highly significant (a rating of 4 or 5).
Across all three DER categories, respondents rated cost as their most significant barrier to participation and adoption. Rating the cost barrier statistically differed by DER category. More respondents rated the cost of installing solar PV arrays (88%) and a home energy storage system (89%) as more significant than the cost of participating in a DR program (66%).19 A statistically significantly higher proportion of renter respondents (77%, n=125) indicated cost was a barrier to participating in DR programs compared to homeowner respondents (56%, n=1,480).20 The following sections provide barrier rating results by DER category.
Figure 19 shows residential end-use customers’ barrier rating results for participation in a DR program. The cost of purchasing the required equipment (66%) and concerns about feeling comfortable in the
16 Statistically significant difference at 5% level (p≤0.05). 17 Statistically significant difference at 10% level (p≤0.10). 18 Statistically significant difference at 5% level (p≤0.05). 19 Statistically significant difference at 5% level (p≤0.05). 20 Statistically significant difference at 5% level (p≤0.05).

Appendix F: End-Use Customer Survey Findings 134
home (56%) emerged as the top two significant barriers. Concerns about privacy (40%) appeared as the least significant barrier. Notably, in the open-ended responses to what would make DR participation difficult in the future, 30% of respondents (n=284) indicated that nothing would make it difficult for their household to participate in a DR program in the future.
Figure 19. Residential End-Use Customer Barriers to Demand Response Participation
Survey question: “Here are some challenges that customers may face when deciding whether to participate in a demand response program. Using a scale from 1 to 5, where 1 means not at all significant and 5 means very significant, how significant would each of these challenges be in
your decision to participate in a demand response program if your utility offered one?”
Figure 20 shows the residential end-use customers’ barrier rating results to participation in a DG program. The upfront cost of purchasing the required equipment (88%) and concerns about maintenance (63%) emerged as the top two significant barriers. Concerns about safety (23%) appeared as the least significant barrier. Moreover, in the open-end responses to what would make solar PV installation difficult in the future, 23% of respondents (n=302) indicated that being in a housing rental situation would make it difficult for their household to install solar PV arrays. A significantly higher proportion of renter respondents (51%, n=124) indicated that lack of awareness and knowledge about solar PV system costs presented barriers to participating in a DG program compared to homeowner respondents (37%, n=146).21
21 Statistically significant difference at 90% level (p≤0.10).
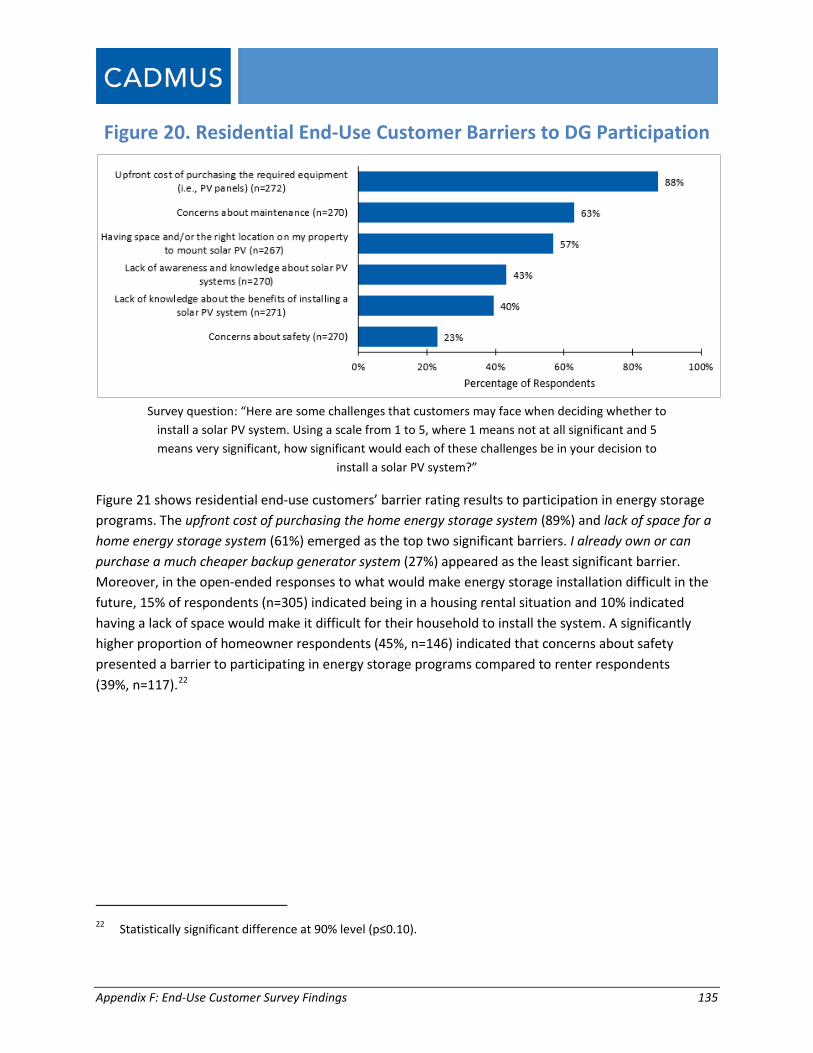
Appendix F: End-Use Customer Survey Findings 135
Figure 20. Residential End-Use Customer Barriers to DG Participation
Survey question: “Here are some challenges that customers may face when deciding whether to
install a solar PV system. Using a scale from 1 to 5, where 1 means not at all significant and 5 means very significant, how significant would each of these challenges be in your decision to
install a solar PV system?”
Figure 21 shows residential end-use customers’ barrier rating results to participation in energy storage programs. The upfront cost of purchasing the home energy storage system (89%) and lack of space for a home energy storage system (61%) emerged as the top two significant barriers. I already own or can purchase a much cheaper backup generator system (27%) appeared as the least significant barrier. Moreover, in the open-ended responses to what would make energy storage installation difficult in the future, 15% of respondents (n=305) indicated being in a housing rental situation and 10% indicated having a lack of space would make it difficult for their household to install the system. A significantly higher proportion of homeowner respondents (45%, n=146) indicated that concerns about safety presented a barrier to participating in energy storage programs compared to renter respondents (39%, n=117).22
22 Statistically significant difference at 90% level (p≤0.10).

Appendix F: End-Use Customer Survey Findings 136
Figure 21. Residential End-Use Customer Barriers to Energy Storage Participation
Survey question: “Here are some challenges that customers may face when deciding whether to
invest in home energy storage systems. Using a scale from 1 to 5, where 1 means not at all significant and 5 means very significant, how significant would each of these challenges be in
your decision to install a home energy storage system?”
Likelihood of Participation and Adoption The survey results showed the likelihood of residential end-use customers’ participation and adoption of DERs tied to cost and homeownership status. Not surprisingly, offering a financial incentive increased these end-use customers’ likelihood of participating in a DR program, while lowering equipment costs increased their likelihood of installing solar and home energy storage systems. However, the open-ended responses revealed that end-use customers’ view homeownership as a prerequisite for DG and energy storage adoption. The following sections describe conditions and factors that would increase residential end-use customers’ participation and adoption likelihood across the DER categories.
One-half of residential end-use customers reported being capable of reducing or shifting their energy usage during high demand times in summer and in winter. As shown in Figure 22, 55% of respondents said they are capable of reducing or shifting their energy usage in the summer; 50% said they are capable in the winter.

Appendix F: End-Use Customer Survey Findings 137
Figure 22. Residential End-Use Customers’ Capability of Reducing/Shifting Energy Use During High Demand
Survey questions: “Is your household capable of reducing or shifting its energy usage during
times of high usage in the summer?” and “Is your household capable of reducing or shifting its energy usage during times of high usage in the winter?”
When asked whether they would be willing to participate in a DR program without a financial incentive, 21% of respondents said yes and 44% said no. Respondents saying yes to participating without a financial incentive showed the most willingness to participate in voluntary usage reduction (69%) and the least willingness to participate in DLC (26%). Figure 23 shows the cross-section of respondents’ willingness to participate in DR without an incentive.
Figure 23. Residential End-Use Customers’ Willingness to Participate in Demand Response without an Incentive
Survey questions: “Would you be willing to participate in a demand response program without a
financial incentive from the utility?” (n=293) and “Which programs would you be willing to participate without a financial incentive? (select all that apply)” (n=62)

Appendix F: End-Use Customer Survey Findings 138
For respondents saying no to participating in DR programs without a financial incentive, the survey asked a follow-up question about how much financial compensation they would need as an incentive to participate (n=129):
• 51% did not know what amount
• 40% specified a dollar amount
• 9% would not participate for any amount
The 48 respondents who specified an incentive dollar amount gave answers ranging from $10 to $1,000, with a mean amount of $189.17.
In terms of what, if anything, would increase residential end-use customers’ likelihood to participate in a DR program in the next two years, open-ended responses revealed the following top three mentions (n=316): having more information (18%); offering an incentive (16%); and providing proof of saving money (15%). Figure 24 shows the motivations for 5% or more of respondents.
Figure 24. Characteristics Likely to Increase Residential Participation in Demand Response
Survey question: “What, if anything, would increase your likelihood to participate in a demand
response program in the next two years?” (n=316 mentions)
Figure 25 shows DR program characteristics that the majority of respondents identified as acceptable.

Appendix F: End-Use Customer Survey Findings 139
Figure 25. Residential End-Use Customers’ Acceptable Demand Response Characteristics
Survey questions: “What is the maximum number of times in a year you would be willing to
reduce or shift electricity usage during peak demand? Would you say …”, “How long would you be willing to reduce or shift electricity usage each time a peak demand event is called by your
utility? Would you say for the duration of…”, “If your utility asked you to reduce electricity usage during the summer, what would be acceptable times for your business to participate? (select all
that apply)”, and “If your utility asked you to reduce electricity usage during the winter, what would be acceptable times for your business to participate? (select all that apply)”
The survey’s DG portion presented residential respondents with two payback scenarios and asked about their likelihood to install solar PV arrays. If the payback period was 10 years or less, 15% of respondents (n=167) said they would install solar PV arrays. When the payback period was five years or less, 20% of respondents (n=142) said they would install solar PV arrays.
A significantly higher proportion of east respondents (26%, n=58) indicated they would install solar PV arrays if the payback period was 10 years or less compared to west respondents (9%, n=109).23 Also in
23 Statistically significant difference at 5% level (p≤0.05).

Appendix F: End-Use Customer Survey Findings 140
contrast, a significantly higher proportion of west respondents (21%, n=99) indicated they would install solar PV arrays if the payback period was five years or less compared to east respondents (16%, n=43).24
For a community solar project, the survey asked respondents what percentage more they would be willing to pay for electricity over their current rate. Respondents’ answers ranged from 2% to 50%, with a mean of 14%.
In terms of what, if anything, would increase residential end-use customers’ likelihood to install solar PV arrays in the next two years, open-ended responses revealed the following top three mentions (n=314): offering low- to no-cost equipment (17%); offering an incentive or tax credit (14%); and having homeownership status (9%). Figure 26 shows motivations for 5% or more of respondents.
Figure 26. Characteristics Likely to Increase Residential Participation in DG
Survey question: “What, if anything, would make it difficult for your household to install a solar
PV system?” (n=314 mentions)
The energy storage portion of the survey presented respondents with cost information about a typical lithium-ion home energy storage system (priced at $2,000) and asked them whether they would be willing to pay for such a system if it provided five to seven hours of backup energy during a power outage. About one-quarter of respondents (24%, n=293) said yes, 45% said no, and 31% said don’t know. Respondents who said no or don’t know received a follow-up question asking whether they would be willing to pay for an energy storage system costing less than $2,000; slightly over one-quarter (27%, n=222) said yes, 30% said no, and 43% said don’t know.
In terms of what, if anything, would increase residential end-use customers’ likelihood to install a home energy storage system in the next two years, open-endrf responses revealed the following top three 24 Statistically significant difference at 5% level (p≤0.05).

Appendix F: End-Use Customer Survey Findings 141
mentions (n=297): offering low- to no-cost equipment (15%); having more information (10%); and having homeownership status (8%). Figure 27 shows motivations for 5% or more of respondents.
Figure 27. Characteristics Likely to Increase Residential Participation in Energy Storage
Survey question: “What, if anything, would increase your likelihood to install a home energy
storage system in the next two years?” (n=297 mentions)
Small Commercial End-Use Customers The following subsections provide findings from the small commercial end-use customer surveys. In addition to reporting the overall small commercial end-use customer findings, Cadmus compared survey results by region (east versus west) and Power customer size (large versus small). Statistically significant findings at only the 5% (p≤0.05) or 10% (p≤0.10) level are reported here.
Current State of Awareness, Participation, and Adoption of DERs Figure 28 illustrates small commercial end-use customers’ current awareness, participation, and adoption for each program or product within the three DER categories. Small commercial end-use customers’ awareness of DER programs and products widely varied as did their participation and adoption, which varied from 1% to 10%.

Appendix F: End-Use Customer Survey Findings 142
Figure 28. Small Commercial End-Use Customers’ Awareness, Participation, and Adoption of DERs
Survey questions: “Here are four types of demand response programs. For each one, please
select yes or no, if you have heard of this.” “Which program is your business currently participating in? (select all that apply)”; “The next set of questions are about DG, also known as
on-site power generation. Are you familiar with DG?” “What type of DG does your business have? (select all that apply)”; “Here are some on-site energy storage systems. For each one,
please select yes or no, if you have heard of this.” “What type of on-site energy storage system does your business have? (select all that apply)”
Small commercial end-use customer respondents were most familiar with time-of-use rates (60%, n=145), defined as “special electricity rate pricing that varies by time of day and when energy use is in high demand,” and were the least familiar with DLC (27%, n=146), defined as a DR program where “The utility [Power customer] controls a [end-use] customer’s electric space heating, water heating, or central air-conditioning equipment on short notice for a few hours in an agreed-upon number of days during the year. In exchange for participating, the [end-use] customer receives an incentive payment or bill credit.” A significantly higher proportion of small Power customer respondents (66%, n=53) indicated familiarity with time-of-use rates than large Power customer respondents (57%, n=92).25
For DG, the majority of small commercial end-use customers had heard of solar PV arrays (65%, n=146), but not community solar programs (33%, n=147).
25 Statistically significant difference at 10% level (p≤0.10).

Appendix F: End-Use Customer Survey Findings 143
Among the three types of energy storage systems, respondents were most familiar with lithium-ion batteries (60%, n=143) and least familiar with vanadium-flow batteries (13%, n=145), while 49% (n=144) had heard of lead acid batteries.
Interest in DER When asked which DR programs small commercial end-use customers would be most interested in participating in over the next two years, respondents said voluntary usage reduction (46%) and time-of-use rates (40%). Respondents showed the least interest in participating in DLC (15%). Twelve percent of respondents said they had no interest in participating in any DR program. A significantly higher proportion of small Power customer respondents (36%, n=55) indicated interest in participating in a DLC with smart thermostat program in the next two years than large Power customer respondents (16%, n=92).26 Furthermore, a significantly higher proportion of small Power customer respondents (56%, n=55) indicated interest in participating in a voluntary usage reduction program in the next two years than large Power customer respondents (39%, n=92).27 Figure 29 shows respondents’ participation interest levels across the DR programs.
Figure 29. Small Commercial End-Use Customers’ Interest in Demand Response Program Participation
Survey question: “If any, which demand response programs would your business be interested in
participating in the next two years? (select all that apply)” (n=147)
26 Statistically significant difference at 5% level (p≤0.05). 27 Statistically significant difference at 10% level (p≤0.10).

Appendix F: End-Use Customer Survey Findings 144
Regarding DG, small commercial end-use customers had more interest in participating in a solar PV project in the next two years than a cogeneration project. One-half of respondents (43%, n=147) said they were interested in installing solar PV, while 23% (n=147) were interested in cogeneration.
When asked which energy storage systems small commercial end-use customers were most interested in installing in the next two years, respondents showed the most interest in lithium-ion batteries (27%, n=146) and the least interest in vanadium-flow batteries (8%, n=146). However, 24% (n=146) of respondents said they had no interest in installing any energy storage system. A significantly higher proportion of small Power customer respondents (42%, n=55) indicated interest in installing lithium-ion batteries in the next two years compared to small Power customer respondents (19%, n=91).28 Furthermore, a significantly higher proportion of east respondents (40%, n=58) indicated interest in installing lithium-ion batteries in the next two years compared to west respondents (19%, n=88).29
Barriers to Participation and Adoption Across all three DER categories, respondents rated cost as their most significant barrier to participation and adoption. The cost barrier rating was statistically significant by DER category. More respondents rated the cost of installing DG (79%) and an energy storage system (78%) as being highly significant than the cost of participating in a DR program (60%).30 The following sections provide the barrier rating results by DER category.
Figure 30 shows small commercial end-use customers’ barrier rating results to participation in a DR program. The cost of purchasing the required equipment (60%) and interruption of business operations (59%) emerged as the top two significant barriers. Lack of business case for demand response participation (35%) appeared as the least significant barrier. Notably, in the open-ended responses to what would make DR participation difficult in the future, 15% of respondent mentions (n=134) indicated that nothing would make it difficult for their business to participate in a DR program in the future. Other common mentions in the open-ended responses included timing (13%) and cost (10%).
A significantly higher proportion of east respondents (67%, n=54) indicated that interruption of business operations was a barrier to participating in DR programs compared to west respondents (53%, n=79).31 In keeping with that finding, a significantly higher proportion of east respondents (68%, n=53) indicated that the cost of purchasing compatible DR equipment was a barrier to participating in DR programs compared to west respondents (55%, n=78).32 Furthermore, a significantly higher proportion of large
28 Statistically significant difference at 5% level (p≤0.05). 29 Statistically significant difference at 5% level (p≤0.05). 30 Statistically significant difference at 5% level (p≤0.05). 31 Statistically significant difference at 5% level (p≤0.05). 32 Statistically significant difference at 5% level (p≤0.05).

Appendix F: End-Use Customer Survey Findings 145
Power customer respondents (52%, n=89) indicated a negative impact on the quality of a product as a barrier to participating in DR programs compared to small Power customer respondents (34%, n=50).33
Figure 30. Small Commercial End-Use Customer Barriers to Demand Response Participation
Survey question: “Here are some challenges that businesses may face when considering whether to participate in a demand response program. Using a scale from 1 to 5, where 1 means not at all
significant and 5 means very significant, how significant would each of these challenges be to your own company’s participation in a demand response program?”
Figure 31 shows small commercial end-use customers’ barrier rating results to participation in a DG program. The cost of purchasing a DG system (79%) and having facility infrastructure that is compatible with DG (60%) emerged as the top two significant barriers. Negative perceptions about DG (26%) appeared as the least significant barrier. The open-ended responses regarding what would make DG installation difficult in the future also reiterated the cost barrier, which was included in 35% of respondent mentions (n=126).
A significantly higher proportion of small Power customer respondents (88%, n=48) indicated that the cost of purchasing a DG system was a barrier to investing in a DG system compared to large Power
33 Statistically significant difference at 10% level (p≤0.10).

Appendix F: End-Use Customer Survey Findings 146
customer respondents (73%, n=78):34 this also presented a barrier for a significantly higher proportion of east respondents (87%, n=52) compared to west respondents (73%, n=74).35
Figure 31. Small Commercial End-Use Customer Barriers to DG Participation
Survey question: “Here are some challenges that businesses may face when considering whether
to invest in DG systems. Using a scale from 1 to 5, where 1 means not at all significant and 5 means very significant, how significant would each of these challenges be to your own business’
decision to invest in DG?”
Figure 32 shows small commercial end-use customers’ barrier rating results to participation in an energy storage program. The cost of purchasing an on-site energy storage system (78%) and cheaper alternative like a standby generator system (56%) emerged as the top two significant barriers. Negative perceptions about on-site energy storage (25%) appeared as the least significant barrier. The open-ended responses to what would make energy storage installation difficult in the future also reiterated the cost barrier, included in 35% of respondent mentions (n=131). Similar to DR, 15% of respondent mentions indicated that nothing would make it difficult for their business to install an energy storage system in the future.
A significantly higher proportion of small Power customer respondents (85%, n=47) indicated that the cost of purchasing an on-site energy storage system was a barrier to investing in energy storage systems compared to large Power customer respondents (73%, n=78):36 this also presented a barrier for a significantly higher proportion of east respondents (87%, n=53) compared to west respondents
34 Statistically significant difference at 10% level (p≤0.10). 35 Statistically significant difference at 5% level (p≤0.05). 36 Statistically significant difference at 10% level (p≤0.10).

Appendix F: End-Use Customer Survey Findings 147
(71%, n=72).37 Furthermore, a significantly higher proportion of east respondents (65%, n=51) indicated that lack of a business case for on-site energy storage as a barrier to investing in energy storage systems compared to west respondents (37%, n=67).38
Figure 32. Small Commercial End-Use Customer Barriers to Energy Storage Participation
Survey question: “Here are some challenges that businesses may face when considering whether
to invest in energy storage systems. Using a scale from 1 to 5, where 1 means not at all significant and 5 means very significant, how significant would each of these challenges be to
your own business’s decision to invest in on-site energy storage?”
Likelihood of Participation and Adoption The survey results showed the likelihood of small commercial end-use customers’ participation and adoption of DERs ties to cost and business operations. Not surprisingly, offering a financial incentive would increase end-use customers’ likelihood of participating in a DR program, while lowering the equipment cost would increase their likelihood of installing solar and energy storage systems. This section describes the conditions and factors that would increase end-use customers’ participation and adoption likelihood across the DER categories.
For DR programs, the same proportion of small commercial end-use customers reported being capable of reducing or shifting their energy usage during high demand times in summer and in winter. As shown 37 Statistically significant difference at 10% level (p≤0.10). 38 Statistically significant difference at 5% level (p≤0.05).

Appendix F: End-Use Customer Survey Findings 148
in Figure 33, 22% of respondents said they are capable of reducing or shifting their energy usage in the summer, and 20% of respondents said they are capable in the winter.
Figure 33. Small Commercial End-Use Customers’ Capability of Reducing or Shifting Energy Use During High Demand
Survey questions: “Is your business capable of reducing or shifting is summer peak electricity
demand?” and “Is your business capable of reducing or shifting is winter peak electricity demand?”
When asked whether they would be willing to participate in a DR program without a financial incentive, 32% of respondents said yes and 44% said no. Respondents who would be willing to participate without an incentive indicated they would be most willing to participate in a time-of-use rates program (51%) and least willing to participate in a DLC program (23%). Figure 34 shows respondents’ willingness to participate in various types of DR programs without an incentive.

Appendix F: End-Use Customer Survey Findings 149
Figure 34. Small Commercial End-Use Customers’ Willingness to Participate in Demand Response Without an Incentive
Survey questions: “Would you be willing to participate in a demand response program without a
financial incentive from your utility?” (n=147) and “Which programs would you be willing to participate without a financial incentive? (select all that apply)” (n=47)
For respondents saying they would not be willing to participate in DR programs without a financial incentive, the survey asked a follow-up question about how much financial compensation they would need as an incentive to participate (n=65):
• 45% did not know what amount
• 22% would not participate for any amount
• 34% provided a response on the incentive amount needed
Of 34% of respondents (n=65) who responded with an incentive amount:
• 5% would require more than $5,000
• 35% would require $1,000 to $5,000
• 20% would require $500 to $1,000
• 15% would require $100 to less than $500
• 25% would require less than $100
The 20 respondents specifying an incentive dollar amount for DR participation gave answers ranging from $10 to $15,000, with a mean dollar amount of $1,769.25.
In terms of what, if anything, would increase small commercial end-use customers’ likelihood to participate in a DR program in the next two years, open-ended responses revealed the following top three mentions (n=136): nothing (15%); having more information (15%); and providing proof of saving money (12%). Figure 35 shows motivations provided by 5% or more of respondents.

Appendix F: End-Use Customer Survey Findings 150
Figure 35. Characteristics Likely to Increase Small Commercial Participation in Demand Response
Survey question: “What, if anything, would increase your likelihood to participate in a demand
response program in the next two years?” (n=136)
Figure 36 shows DR program characteristics that the majority of respondents identified as being acceptable.

Appendix F: End-Use Customer Survey Findings 151
Figure 36. Small Commercial End-Use Customers’ Acceptable Demand Response Characteristics
Survey questions: “What is the maximum number of times in a year you would be willing to
reduce or shift electricity usage during peak demand? Would you say …”, “How long would you be willing to reduce or shift electricity usage each time a peak demand event is called by your
utility? Would you say for the duration of…”, “If your utility asked you to reduce electricity usage during the summer, what would be acceptable times for your business to participate? (select all
that apply)”, and “If your utility asked you to reduce electricity usage during the winter, what would be acceptable times for your business to participate? (select all that apply)”
The DG portion of the survey presented small commercial respondents with various payback scenarios and asked about their likelihood of installing solar PV arrays or cogeneration under these scenarios. Respondents were asked to specify their payback period—the amount of time it takes to recover the full cost of a purchase or investment—for a DG project. Payback levels ranged from two months to six years; however, 41% of respondents (n=29) selected a payback level between five months and two years. At their specified payback level, 83% of respondents would install solar PV (n=30) and 37% would install cogeneration (n=30). Forty-one percent of the 29 respondents selecting a payback period chose between two months and two years.

Appendix F: End-Use Customer Survey Findings 152
A significantly higher proportion of small Power customer respondents (94%, n=17) indicated they would be willing to install solar PV at their identified payback period compared to large Power customer respondents (69%, n=13).39 Similarly, a significantly higher proportion of small Power customer respondents (35%, n=17) indicated they would be willing to install cogeneration at their identified payback period compared to large Power customer respondents (39%, n=13);40 as did a significantly higher proportion of west respondents (33%, n=12) compared to east respondents (39%, n=18).41
When asked what, if anything, would increase small commercial end-use customers’ likelihood to install DG arrays in the next two years, open-ended responses revealed the following top three mentions (n=134): offering an incentive or tax credit (13%); offering low- to no-cost equipment (10%); and having more information (7%). Figure 37 shows motivations for 5% or more of respondents.
Figure 37. Characteristics Likely to Increase Small Commercial Participation in DG
Survey question: “What, if anything, would increase your likelihood to install a DG system in the
next two years?” (n=134)
The survey asked respondents what percentage of upfront costs of a DG resource their power provider would need to pay for the facility to install DG. Thirty percent of respondents (n=47) offered a percentage, and 70% said they don’t know. Respondents who specified a power provider–funded amount gave answers ranging from 25% to 100%, with a mean of 60%. Figure 38 shows respondents’ details.
39 Statistically significant difference at 5% level (p≤0.05). 40 Statistically significant difference at 5% level (p≤0.05). 41 Statistically significant difference at 5% level (p≤0.05).
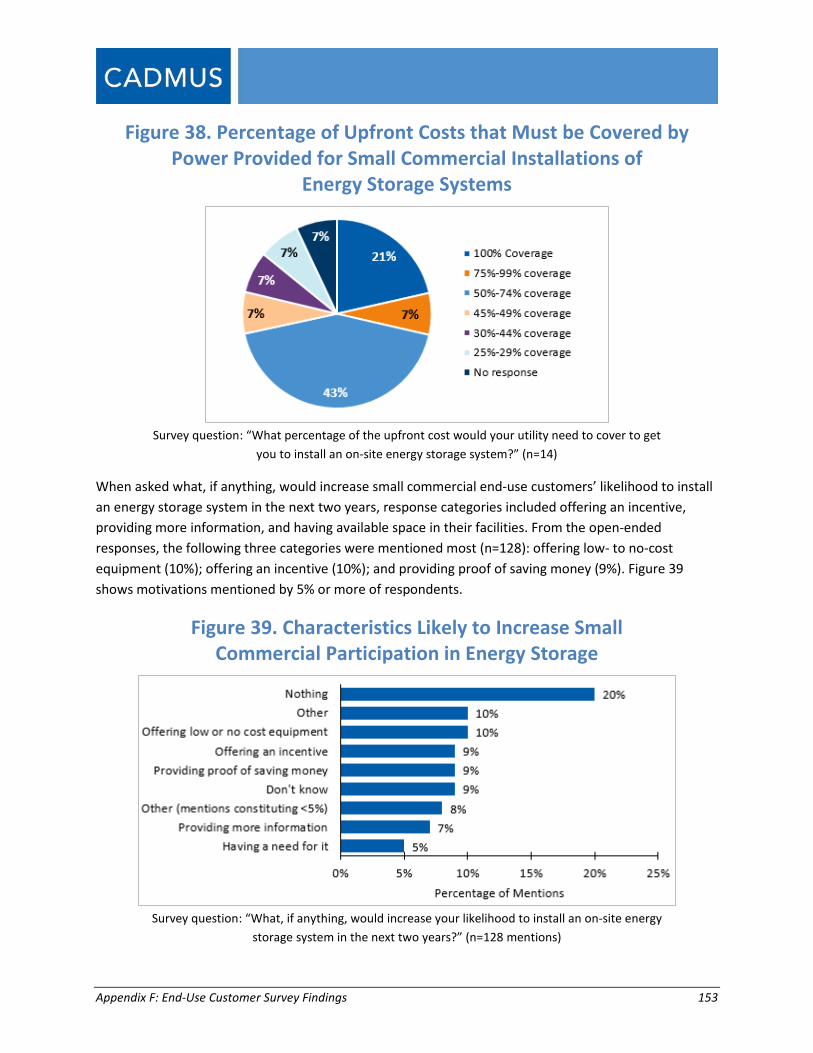
Appendix F: End-Use Customer Survey Findings 153
Figure 38. Percentage of Upfront Costs that Must be Covered by Power Provided for Small Commercial Installations of
Energy Storage Systems
Survey question: “What percentage of the upfront cost would your utility need to cover to get
you to install an on-site energy storage system?” (n=14)
When asked what, if anything, would increase small commercial end-use customers’ likelihood to install an energy storage system in the next two years, response categories included offering an incentive, providing more information, and having available space in their facilities. From the open-ended responses, the following three categories were mentioned most (n=128): offering low- to no-cost equipment (10%); offering an incentive (10%); and providing proof of saving money (9%). Figure 39 shows motivations mentioned by 5% or more of respondents.
Figure 39. Characteristics Likely to Increase Small Commercial Participation in Energy Storage
Survey question: “What, if anything, would increase your likelihood to install an on-site energy
storage system in the next two years?” (n=128 mentions)

Appendix F: End-Use Customer Survey Findings 154
Managed Account End-Use Customers This section provides findings from the managed account (i.e., large commercial and industrial facility account holders) end-use customer surveys. Thirteen managed account end-use customers completed the survey. Due to the small number of respondents, these findings may not be generalizable nor representative views of the managed account population in the Northwest. As a result, Cadmus did not statistically compare survey results by region (east versus west) or power customer size (large versus small). The results presented in the following subsections are summarized by respondent count rather than percentages.
Current State of Awareness, Participation, and Adoption of DERs Figure 40 illustrates managed account end-use customers’ current awareness, participation, and adoption for each program or product within the three DER categories. Managed account end-use customers’ awareness of DER programs and products widely varied as did their participation and adoption of DG and energy storage products.
Figure 40. Managed Account End-Use Customers’ Awareness, Participation, and Adoption of DERs
Survey questions: “Next, I am going to describe two types of demand response programs. For each one, please tell me yes or no, if you have heard of this.” “Which program is your business currently participating in? (select all that apply)”; “The next set of questions are about DG, also
known as on-site power generation. Are you familiar with DG?” “What type of DG does your facility have? (select all that apply)”; “I am going to name seven types of on-site energy storage systems. For each one, please tell me yes or no, if you have heard of this.”, and “What type of
on-site energy storage system does your facility have? (select all that apply)”

Appendix F: End-Use Customer Survey Findings 155
Seven of the 13 managed account respondents had heard of rate-based DR programs, and six had heard of demand curtailment programs. Eleven of 13 respondents had heard of solar PV arrays. Similarly, 11 respondents had heard of standby generation and cogeneration. The one respondent who manages a farm site had heard of a biogas/biomass power system.
The survey asked respondents whether they had heard about seven types of on-site energy storage systems applicable to large commercial and industrial facilities. Most respondents had heard of lithium-ion batteries (11) and lead acid batteries (11), but not many were aware of vanadium-flow batteries (3) and salt-water batteries (4).
Interest in DER When asked which DR programs managed account respondents (n=13) were most interested in participating in over the next two years, six said demand curtailment, four said rate-based DR, and three said none.
When asked which types of DG they were most interested in installing in the next two years, seven of the 13 managed account respondents said solar PV arrays. Three respondents each said they were interested in standby generation and cogeneration. The one respondent who manages a farm site said they were interested in a biogas/biomass power system. While not listed as DG in the survey, two respondents said they were interested in installing wind power.
When asked which types of energy storage the managed account respondents (n=13) were most interested in installing in the next two years, six said none. Of seven respondents who were interested in installing, four said they were interested in lithium-ion batteries. Fewer respondents expressed interest in lead acid batteries (2), vanadium-flow batteries (2), flywheels (2), and salt-water batteries (1).
Barriers to Participation and Adoption For DR, interruption to business operations emerged as the most significant barrier. Meanwhile, respondents rated cost and lack of a business case as the most significant barriers to adoption of DG and on-site energy storage systems. The following sections provide the barrier rating results by DER category.
Figure 41 shows managed account customer barrier rating results to participation in a DR program. Interruption of business operations (83%) and negative impact on the quality of products (78%) emerged as the top two barriers. Negative perceptions about DR (11%) was the least significant barrier. Moreover, the open-ended responses to what would make DR participation difficult in the future corroborated the challenges to business operations. Respondents mentioned that their facilities had round-the-clock production or could never shut down power due to type of business (such as a hospital). Respondents said that knowing the demand time schedule would help them determine early on whether participation was feasible.

Appendix F: End-Use Customer Survey Findings 156
Figure 41. Managed Account End-Use Customer Barriers to Demand Response Participation
Survey question: “Next, I’d like to ask you about various challenges that companies may face when considering whether to participate in a demand response program. Using a scale from 1 to 5, where 1 means not at all significant and 5 means very significant, please tell me how significant each of these
challenges would be to your own company’s participation in a demand response program?”
Figure 42 shows managed account customer barrier rating results to participation in a DG programs. The lack of business case for DG (92%) and cost of purchasing a DG system (92%) emerged as the top two significant barriers. Lack of awareness and knowledge about distributed generation (0%) appeared as the least significant barrier. The open-ended responses to the question, asking what would make DG installation difficult in the future, reiterated cost and business case barriers: 11 of 13 respondents mentioned cost being a hindrance as well as the economic feasibility of a DG project, especially for solar PV arrays.

Appendix F: End-Use Customer Survey Findings 157
Figure 42. Managed Account End-Use Customer Barriers to DG Participation
Survey question: “Next, I’d like to ask you about various challenges that companies may face when considering whether to invest in DG systems. Using a scale from 1 to 5, where 1 means not at all significant and 5 means very significant, please tell me how significant each of these challenges would be to your own company’s decision to
invest in DG?” Figure 43 shows managed account end-use customers’ barrier rating results to participation in an energy storage program. The cost of purchasing an on-site energy storage system (90%) and lack of a business case for on-site generation (75%) emerged as the top two significant barriers. Negative perceptions about on-site energy storage (18%) appeared as the least significant barrier. Notably in the open-ended responses to what would make on-site energy storage system installation difficult in the future, respondents mentioned space (6) more than cost (4). In particular, respondents described the amount of space required for a system, the amount of space their facility had available for such a system, and needing a safe space to store the system for potential hazard.

Appendix F: End-Use Customer Survey Findings 158
Figure 43. Managed Account End-Use Customer Barriers to Energy Storage Participation
Survey question: “Next, I’d like to ask you about various challenges that companies may face when considering whether to invest in on-site energy storage systems. Using a scale from 1 to 5, where 1 means not at all significant and 5 means very significant, please tell me how significant each of these challenges
would be to your own company’s decision to invest in on-site energy storage?”
Likelihood of Participation and Adoption Respondents’ likelihood of participating in a DR program would increase with a 15% annual electric bill incentive amount and by having logistical details of how DR works. If payback period requirements and upfront cost coverages were met, respondents would be more willing to install solar PV, cogeneration, and energy storage systems. This section describes conditions and factors that would increase managed account respondents’ participation and adoption likelihood across the DER categories.
Six of 13 managed account respondents reported being capable of reducing or shifting their energy usage during high demand times in the summer. Four respondents said they were capable in the winter. Of six respondents capable in the summer, one-half indicated a peak load reduction of 25%. Of the four respondents capable of reduction or shifting in winter, respondents’ peak load reduction amount widely varied from 5% to 99%
When asked whether they would be willing to participate in a DR program without a financial incentive, three of 13 respondents said yes, and were willing to participate without an incentive in rate-based DR (2) and demand curtailment programs (2).

Appendix F: End-Use Customer Survey Findings 159
For the nine respondents who said no to participating without an incentive, the survey asked a follow-up question about the percentage of their annual electric bill they would need as an incentive to participate:
• 22% did not know what amount (2)
• 56% specified an amount (5)
• 22% would not participate for any amount (2)
Respondents who specified a percentage amount gave a mean incentive amount of 15% of their annual electric bill to participate in DR programs.
In terms of what, if anything, would increase managed account respondents’ likelihood to participate in a DR program in the next two years, open-ended responses revealed the following top two mentions:
• Offering an incentive or compensation (4)
• Providing logistical information on how DR would work at the facility (4)
Respondents’ lack of having this logistical information helps explain why seven of the 13 respondents did not know what DR program charactistics they would deem as acceptable. These respondents were not able to provide an answer regarding the number of events, duration of events, and timing of events that would be acceptable at their facility.
Most respondents (11 of 13) said they had a required payback period for a DG project. This required payback period ranged from two to 10 years, with the majority around the five- to 10-year mark. If the DG project was to recover the full cost of the investment at their required payback period, most respondents said they would be willing to install cogeneration (9) and solar PV (8) systems. Only three respondents said they would be willing to install standby generation.
When asked what percentage of the upfront cost would need to be covered for respondents to install a DG system, eight of 13 respondents provided an answer, ranging from 40% to 100%. Again, if the upfront coverage was to be met, these respondents said they would be willing to install solar PV (6) and cogeneration (5) systems. Only two respondents said they would be willing to install standby generation.
In terms of what, if anything, would increase respondents’ likelihood to install a DG system in the next two years, open-ended responses emphasized factors related to money. They included evidence of a good return on investments, financial incentives, short paybacks, and low cost of equipment.
The survey asked respondents to name benefits that an on-site energy storage system would need to provide to justify such a purchase. Five of 13 respondents could not name any purchase-justifying benefits. Among the eight who could name benefits, respondents frequently cited a good payback period (three to five years), ability to reduce operating costs, and high reliability of the system.
Next, the survey asked whether respondents would be willing to pay for the entire cost of an energy storage system if it met their benefit needs. Only three of 13 respondents said yes, four said no, and six

Appendix F: End-Use Customer Survey Findings 160
said they did not know. The four respondents who said no received a follow-up question about what percentage of the upfront cost would need to be covered to get them to install an energy storage system. One respondent said 40% of upfront costs must be covered and the remaining respondent said 100% must be covered for a DG system. If the upfront coverage were e met, these two respondents said they would be willing to install lithium-ion, vanadium-flow, and salt-water batteries.
In terms of what, if anything, would increase respondents’ likelihood to install an energy storage system in the next two years, open-ended responses emphasized factors related to money and having more information. They included payback information, financial incentives, and information on implementation.

Appendix G: Data Collection Instruments 161
13. Appendix G: Data Collection Instruments
This appendix contains the data collection instruments listed below. Double-click on the icons below to expand the PDF file.
13.1. BPA Subject Matter Expert Interview Guide
BPA DR Interview Guide - BPA SMEs -
13.2. Stakeholder Interview Guide
BPA DR Interview Guide - Stakeholder
13.3. DER Service Provider Interview Guide
BPA DR Interview Guide _Market Actor
13.4. Power Customer Interview Guide
BPA DR Interview Guide - BPA Custom
13.5. Managed Account End-Use Customer Survey Instrument
BPA DER Large C-I End User Survey_FIN
13.6. Small Commercial End-Use Customer Survey Instrument
BPA DER Small Commercial End Use

Appendix G: Data Collection Instruments 162
13.7. Residential End-Use Customer Survey Instrument
BPA DER Residential End Use

Appendix H: Literature Review References 163
14. Appendix H: Literature Review References
Administrator and Chief Executive Officer Elliot E. Mainzer to parties interested in the I-5 Corridor Reinforcement Project, May 17, 2017. Executive Office, Bonneville Power Administration. Available online: https://www.bpa.gov/Projects/Projects/I-5/Documents/letter_I-5_decision_final_web.pdf
Alstone, Peter, J. Potter, M.A. Piette, P. Schwartz, M. A. Berger, L. N. Dunn, S. J. Smith et al. 2015 California Demand Response Potential Study: Charting California’s Demand Response Future. Lawrence Berkley National Laboratory. November 2016. Available online: http://www.cpuc.ca.gov/General.aspx?id=10622
Ardani, Kristen, E. O’Shaughnessy, R. Fu, C. McClurg, J. Huneycutt, and R. Margolis. Installed Cost Benchmarks and Deployment Barriers for Residential Solar Photovoltaics with Energy Storage: Q1 2016. National Renewable Energy Laboratory. 2016. Available online: https://www.nrel.gov/docs/fy17osti/67474.pdf
Bade, Gavin. “Updated: Supreme Court upholds FERC Order 745, affirming federal role in demand response.” Utility Dive. January 25, 2016. Accessed July 5, 2017. http://www.utilitydive.com/news/updated-supreme-court-upholds-ferc-order-745-affirming-federal-role-in-de/412668/
Bonneville Power Administration. Bonneville Power Administration Commercial and Industrial Demand Response Pilot Report. October 2012.
Bonneville Power Administration. Technology Innovation Project 270: Demand Response Market Demonstration Project Final Report. October 2014. Available online: https://conduitnw.org/_layouts/Conduit/FileHandler.ashx?rid=3002
Bonneville Power Administration. Distributed Energy Resource Benchmarking Report. 2016a. Available online: https://www.bpa.gov/EE/Technology/demand-response/Documents/2016_DERBenchmarkReport.pdf
Bonneville Power Administration. 2016 Transmission Plan. December 2016b. Available online: https://www.bpa.gov/transmission/CustomerInvolvement/AttachmentK/Documents/2016-BPA-Tx-Plan-FINAL.PDF
Bonneville Power Administration. “2015 Pacific Northwest Loads and Resource Study.” January 2016c. Accessed August 24, 2017: https://www.bpa.gov/power/pgp/whitebook/2015/index.shtml
Bonneville Power Administration and Energy Northwest. Energy Northwest and Bonneville Power Administration Commercial Aggregator Demonstration Final Report. 2016d.
Bonneville Power Administration. “BPA facts.” Accessed July 5, 2017a. https://www.bpa.gov/news/pubs/GeneralPublications/gi-BPA-Facts.pdf

Appendix H: Literature Review References 164
Bonneville Power Administration. “2016 Pacific Northwest Loads and Resource Study.” Accessed August 24, 2017b. https://www.bpa.gov/power/pgp/whitebook/2016/index.shtml
Cadmus. Demand Response in the Northwest. Prepared for SmartGrid Northwest. 2016. Available online: http://energy.cadmusgroup.com/demandresponsenw
Cadmus. Kootenai DR Pilot Evaluation: Full Pilot Report. Prepared for Bonneville Power Administration. December 2011. Available online: https://www.bpa.gov/EE/Technology/demand-response/Documents/Final%20Evaluation%20Report%20for%20KEC%20Peak%20Project_28Dec11.pdf
Cappers, Peter, J. MacDonald, J. Page, J. Potter, and E. Stewart. Future Opportunities and Challenges with Using Demand Response as a Resource in Distribution System Operation and Planning Activities. Lawrence Berkley National Laboratory. January 2016. Available online: https://emp.lbl.gov/publications/future-opportunities-and-challenges
Donohue, Stacey. “Demand Response in the NW: Overcoming Barriers.” Presentation at SmartGrid Northwest Demand Response Symposium, Seattle, Washington, 2016. Available online: http://smartgridnw.org/wp-content/uploads/2016/09/DR-Symposium-Stacey-Donohue.pptx
Ecofys. TI 220 Project Evaluation Report: Smart End-Use Energy Storage and Integration of Renewable Energy. Prepared for Bonneville Power Administration. August 2013. Available online: https://www.bpa.gov/EE/Technology/demand-response/Documents/TI_220_Project_Ecofys_Evaluation_Report.pdf
Federal Energy Regulatory Commission. Assessment of Demand Response and Advanced Metering – Staff Report. December 2016. Available online: https://www.ferc.gov/industries/electric/indus-act/demand-response/dr-potential.asp
Freeman, Sullivan & Co. and Energy and Environmental Economics, Inc. California Independent System Operator Demand Response Barriers Study (per FERC Order 719). 2009. Available online: https://www.caiso.com/Documents/DemandResponseBarriersStudy.pdf
Fry, Terry, R. Hinkle, and D. Engel. Demand Response Program Design Preferences of Large Customers: Focus Group Results from Four States. Lawrence Berkeley National Laboratory. 2006. Available online: https://emp.lbl.gov/publications/demand-response-program-design
Global Energy Partners (An EnerNOC Company). Tennessee Valley Authority Potential Study Volume 1: Executive Summary. 2011. Available online: http://152.87.4.98/news/releases/energy_efficiency/GEP_Potential.pdf
Klotz, Jason S. “Open Standards + Interoperability.” Presentation at SmartGrid Northwest Demand Response Symposium, Seattle, Washington, 2016. Available online: http://smartgridnw.org/wp-content/uploads/2016/09/Standards_Interop-Presentation_JSK.pptx
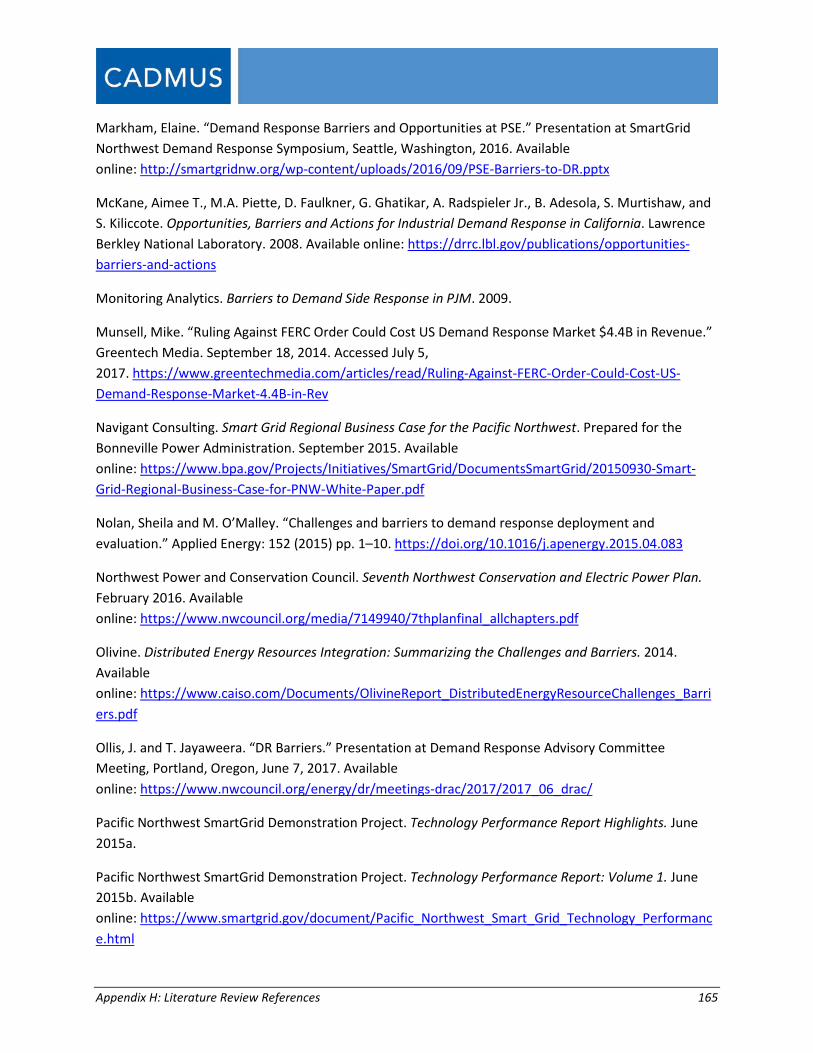
Appendix H: Literature Review References 165
Markham, Elaine. “Demand Response Barriers and Opportunities at PSE.” Presentation at SmartGrid Northwest Demand Response Symposium, Seattle, Washington, 2016. Available online: http://smartgridnw.org/wp-content/uploads/2016/09/PSE-Barriers-to-DR.pptx
McKane, Aimee T., M.A. Piette, D. Faulkner, G. Ghatikar, A. Radspieler Jr., B. Adesola, S. Murtishaw, and S. Kiliccote. Opportunities, Barriers and Actions for Industrial Demand Response in California. Lawrence Berkley National Laboratory. 2008. Available online: https://drrc.lbl.gov/publications/opportunities-barriers-and-actions
Monitoring Analytics. Barriers to Demand Side Response in PJM. 2009.
Munsell, Mike. “Ruling Against FERC Order Could Cost US Demand Response Market $4.4B in Revenue.” Greentech Media. September 18, 2014. Accessed July 5, 2017. https://www.greentechmedia.com/articles/read/Ruling-Against-FERC-Order-Could-Cost-US-Demand-Response-Market-4.4B-in-Rev
Navigant Consulting. Smart Grid Regional Business Case for the Pacific Northwest. Prepared for the Bonneville Power Administration. September 2015. Available online: https://www.bpa.gov/Projects/Initiatives/SmartGrid/DocumentsSmartGrid/20150930-Smart-Grid-Regional-Business-Case-for-PNW-White-Paper.pdf
Nolan, Sheila and M. O’Malley. “Challenges and barriers to demand response deployment and evaluation.” Applied Energy: 152 (2015) pp. 1–10. https://doi.org/10.1016/j.apenergy.2015.04.083
Northwest Power and Conservation Council. Seventh Northwest Conservation and Electric Power Plan. February 2016. Available online: https://www.nwcouncil.org/media/7149940/7thplanfinal_allchapters.pdf
Olivine. Distributed Energy Resources Integration: Summarizing the Challenges and Barriers. 2014. Available online: https://www.caiso.com/Documents/OlivineReport_DistributedEnergyResourceChallenges_Barriers.pdf
Ollis, J. and T. Jayaweera. “DR Barriers.” Presentation at Demand Response Advisory Committee Meeting, Portland, Oregon, June 7, 2017. Available online: https://www.nwcouncil.org/energy/dr/meetings-drac/2017/2017_06_drac/
Pacific Northwest SmartGrid Demonstration Project. Technology Performance Report Highlights. June 2015a.
Pacific Northwest SmartGrid Demonstration Project. Technology Performance Report: Volume 1. June 2015b. Available online: https://www.smartgrid.gov/document/Pacific_Northwest_Smart_Grid_Technology_Performance.html

Appendix H: Literature Review References 166
Peck, Riley. “Industrial Customers of Northwest Utilities: Perspectives on Demand Response.” Presentation at Demand Response Advisory Committee Meeting, Portland, Oregon, 2017. Available online: https://nwcouncil.box.com/s/wx4tt69e5ib6041l3w13q3zp2aogg0qd
Price, Will. “Eugene Waster & Electric Board Barriers to Demand Response in the Pacific Northwest and Strategies to Overcome.” Presentation at SmartGrid Northwest Demand Response Symposium, Seattle, Washington, 2016. Available online: http://smartgridnw.org/wp-content/uploads/2016/09/EWEB-PNW-Smart-Grid-2016-presentation.pdf
Puget Sound Energy. 2015 PSE Integrated Resource Plan. 2015. Available online: https://pse.com/ABOUTPSE/ENERGYSUPPLY/Pages/Resource-Planning.aspx
Rayome-Kelly, Teri. “Flathead Electric Cooperative Demand Response Project Successes and Lessons.” Presentation at SmartGrid Northwest Demand Response Symposium, Seattle, Washington, 2016 Available online: http://smartgridnw.org/wp-content/uploads/2016/09/Flathead-2016-SMART-GRID-NW-ANNUAL-MEETING-and-OPEN-ADR-WORKSHOP.pptx
Schwartz, Lisa, M. Wei, W. Morrow III, J. Deason, S. Schiller, G. Leventis, S. Smith et al. Electricity End Uses, Energy Efficiency, and Distributed Energy Resources Baseline. Energy Analysis and Environmental Impacts Division, Lawrence Berkley National Laboratory. 2017. Available online: https://emp.lbl.gov/publications/electricity-end-uses-energy
Snohomish County Public Utility District No. 1. Using Distribution-Level Energy Assets to Help Optimize Regional Transmission Systems: Final Report. Technology Innovation Project 331. Prepared for Bonneville Power Administration. September 2016.
Wilcox, Marcus. “DR & EE Nexus in the Industrial Sector.” Presentation at the SmartGrid Northwest Demand Response Symposium, Seattle, Washington, 2016. Available online: http://smartgridnw.org/wp-content/uploads/2016/09/DR-Symposium-Cascade-Energy.pptx