assessment of cultch materials for oyster habitat restoration in georgia. authors: justin manley*,...
TRANSCRIPT

Assessment of Cultch Assessment of Cultch Materials for Oyster Habitat Materials for Oyster Habitat
Restoration in Georgia.Restoration in Georgia. Authors: Justin Manley*, Alan Power, Randal L. Authors: Justin Manley*, Alan Power, Randal L. Walker, DorsetWalker, Dorset Hurley, Matthew Gilligan, and Joseph Hurley, Matthew Gilligan, and Joseph Richardson.Richardson.

Map 1. Map of the Duplin River; indicating the project site at N3127.617 W08116.873. * Denotes project site.
*
*

Oyster Spat Recruitment 2005
0
50
100
150
200
250
300
350
400
450
1 2 3 4 5 6 7
Sample Time
Mean
numb
er of
spat
per c
ollec
tor
Flume Dock
Jack Hammock
Marsh LandingsJ une -J uly 2005
Figure 1. Oyster Recruitment (spat/0.01 m2) in the Duplin River, Sapelo Island, Georgia during 2004-2005. *Compliments of Randy Walker.*
Mean Temperature (oC ± S.E.) and Salinity (PSU ± S.E.) in the Duplin River Sapelo Island, Georgia March 2004 - May 2006.
0
10
20
30
40
Mar
-04
May
-04
Jul-0
4
Sep-0
4
Nov-0
4
Jan-
05
Mar
-05
May
-05
Jul-0
5
Sep-0
5
Nov-0
5
Jan-
06
Mar
-06
May
-06
Tem
per
atu
re (
oC
± S
.E.)
an
d S
alin
ity
(PS
U ±
S.E
.)
Temperature
Salinity
April 2004May 2005
Figure 2 . Mean temperature (oC ± S.E.) and salinity (PSU ± S.E.) for the Duplin river recorded at Marsh Landing from March 2004 – May 2005. *Compliments of Patrick Hagan and Sapelo Island National Estuarine Research Reserve.*
Oyster Spat Recruitment 2004
0
50
100
150
200
250
300
350
400
450
1 2 3 4 5 6 7
Sample Time
Mea
n nu
mbe
r of s
pat p
er c
olle
ctor
Flume Dock
Jack Hammock
Marsh LandingsMay-June 2004

81 spat sticks/m2 25 spat sticks/m2
Crab Trap Bags


Statistical AnalysisStatistical Analysis
Non-parametric ANOVA Non-parametric ANOVA Nested design using Duncan’s Nested design using Duncan’s
multiple range test.multiple range test. Significance at the P < 0.05 range.Significance at the P < 0.05 range.

Table 1 and 2. Mean oyster height (H), length (L), height/length ratio (H/L), mortality (M), species richness (SR) and phyla richness (PR) for the 81spat sticks/m2 (81SS), 25 spat sticks/m2 (25 SS), crab trap with whelk shell (WSCT), crab trap with fresh oyster shell (FOSCT), crab trap with washed oyster shell (WOSCT), and plastic mesh bags with fresh oyster shell (FOSPB) treatment types during the 2005 and 2006 sampling periods. Results were evaluated using a non-parametric nested design ANOVA. Outputs from the Duncan’s multiple range test were also given. Treatments with the same letter designation were not significantly different. * Indicates a significance at the P < 0.05 range.
Year: 2005 H (mm) M (%) SR
P 0.0001* 0.0302* 0.00798*
81 SS A77.09 C3.33 B17.0
25 SS B68.18 AB6.91 B18.0
WSCT B67.12 C3.36 AB17.5
FOSCT C50.88 BC3.96 A17.0
WOSCT C53.66 ABC5.0 B14.0
FOSPB D40.34 A9.0 C3.0
Year: 2006 H (mm) M (%) SR
P 0.0001* 0.007* 0.03*
81 SS A85.62 C5.33 AB27.0
25 SS AB78.98 BC9.66 BC26.0
WSCT BC73.87 AB18.66 ABC27.5
FOSCT C68.35 AB15.33 AB27.0
WOSCT C68.69 AB17.66 B26.5
FOSPB D47.35 A34.33 C13.5
Table 1. Table 2.

Oyster Density (± S.E.) per Treatment Type for April 2005 and April 2006
0
1000
2000
3000
4000
5000
6000
Fresh Shell:Trap
WashedShell: Trap
Whelk Shell:Trap
Fresh Shell:Bags
25 spatsticks/m2
81 spatsticks/m2
Me
an
# O
ys
ters
(±
S.E
.) Apr-05
Apr-06
Mean Oyster Height (± S.E.) per Treatment Type for April 2005 and April 2006
0
10
20
30
40
50
60
70
80
90
Fresh Shell:Trap
WashedShell: Trap
Whelk Shell:Trap
Fresh Shell:Bags
25 spatsticks/m2
81 spatsticks/m2
Me
an
Oy
ste
r H
eig
ht
(mm
± S
.E.)
Apr-05
Apr-06
Live Oyster Density: Between yearsLive Oyster Density: Between years
Significant increase for 25 spat sticks/mSignificant increase for 25 spat sticks/m22 p = 0.0205 p = 0.0205 Significant decrease for crab traps with washed shell p = 0.0299 Significant decrease for crab traps with washed shell p = 0.0299
Oyster height (mm) : Between yearsOyster height (mm) : Between years
Oyster height was significantly greater in the second year of Oyster height was significantly greater in the second year of research for all treatments research for all treatments
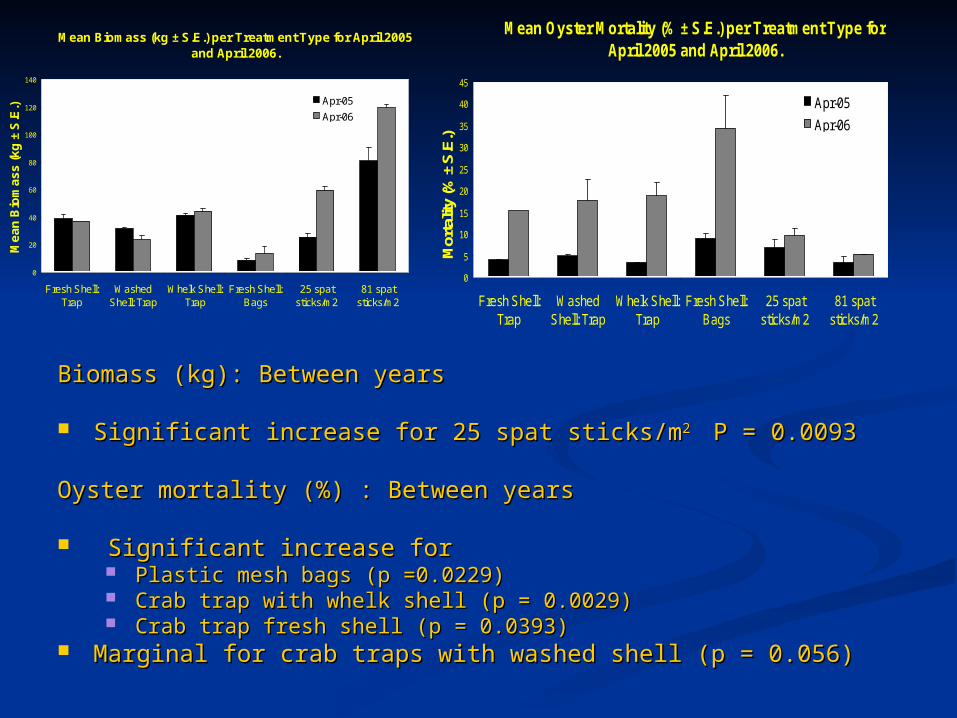
Mean Biomass (kg ± S.E.) per Treatment Type for April 2005 and April 2006.
0
20
40
60
80
100
120
140
Fresh Shell:Trap
WashedShell: Trap
Whelk Shell:Trap
Fresh Shell:Bags
25 spatsticks/m2
81 spatsticks/m2
Me
an
Bio
ma
ss
(k
g ±
S.E
.)
Apr-05
Apr-06
Mean Oyster Mortality (% ± S.E.) per Treatment Type for April 2005 and April 2006.
0
5
10
15
20
25
30
35
40
45
Fresh Shell:Trap
WashedShell: Trap
Whelk Shell:Trap
Fresh Shell:Bags
25 spatsticks/m2
81 spatsticks/m2
Mor
talit
y (%
± S
.E.)
Apr-05
Apr-06
Biomass (kg): Between yearsBiomass (kg): Between years
Significant increase for 25 spat sticks/mSignificant increase for 25 spat sticks/m2 2 P = 0.0093 P = 0.0093
Oyster mortality (%) : Between yearsOyster mortality (%) : Between years
Significant increase for Significant increase for Plastic mesh bags (p =0.0229) Plastic mesh bags (p =0.0229) Crab trap with whelk shell (p = 0.0029)Crab trap with whelk shell (p = 0.0029) Crab trap fresh shell (p = 0.0393)Crab trap fresh shell (p = 0.0393)
Marginal for crab traps with washed shell (p = 0.056)Marginal for crab traps with washed shell (p = 0.056)

Mean Species Richness (# Species ± S.E.) per Treatment Type for April 2005 and 2006
0
5
10
15
20
25
30
Fresh Shell:Trap
WashedShell: Trap
Whelk Shell:Trap
Fresh Shell:Bags
25 spatsticks/m2
81 spatsticks/m2
Me
an
# S
pe
cie
s (
± S
.E.)
Apr-05
Apr-06
Species Richness (# species): Between yearsSpecies Richness (# species): Between years
Significant increase for all treatments P < 0.05.Significant increase for all treatments P < 0.05.

81 spat sticks/m2Crab Trap Bags
25 spat sticks/m2


March 2006

November 2006

March 2006

November 2006

March 2006

November 2006

November 2006


AcknowledgementsAcknowledgements
Thank You!All the Folks at SINERR and MAREX
Ellie CovingtonMarcy MitchellThomas BlissPaul ManleyBrooks Good
Shane KicklighterDanny EllorJason Brown
Carolyn Belcher