assessment of landfill reclamation and the effects of age ... · f. printed on paper containing at...
TRANSCRIPT

NRELfTP-430-7449 • UC Category: 1414 • DE95004002
and the Effects of:�ge on the Combustion of Relbvered M e e I S l ed ,x�m t unlClpa 0 I "IPs e
Gary A. Forster Lancaster Environmental Foundation 221 E. Chestnut Street Lancaster, PA 17602
NREL technical monitor: Philip Shepherd
National Renewable Energy Laboratory 1617 Cole Boulevard Golden, Colorado 80401-3393 A nationa1 1aboratory of the U.S. Department of Energy Managed by Midwest Research Institute for the U.S. Department of Energy under contract No. DE-AC36-83CHlO093
Prepared under Subcontract No. AAT-4-14157-01
January 1995
This publication was reproduced fro!Jl the best available camera-ready copy submitted by the subcontractor and received no editorial review at NREL.
NOTICE
This report was prepared as an account of work sponsored by an agency of the United States government. Neither the United States government nor any agency thereof, nor any of their employees, makes any warranty, express or implied, or assumes any legal liability or responsibility for the accuracy, completeness, or usefulness of any information, apparatus, product, or process disclosed, or represents that its use would not infringe privately owned rights. Reference herein to any specific commercial product, process, or service by trade name, trademark, manufacturer, or otherwise does not necessarily constitute or imply its endorsement, recommendation, or favoring by the United States government or any agency thereof. The views and opinions of authors expressed herein do not necessarily state or reflect those of the United States government or any agency thereof.
...
Available to DOE and DOE contractors from: Office of Scientific and Technical Information (OSTI) P.O. Box 62 Oak Ridge, TN 37831
Prices available by calling (615) 576-8401 Available to the public from:
National Technical Information Service (NTIS) U.S. Department of Commerce 5285 Port Royal Road Springfield, VA 22161 (703) 487-4650
f.� Printed on paper containing at least 50% wastepaper and 10% postconsumer waste

TABLE OF CONTENTS
I. BACKGROUND INFORMATION ..................................... 1
A. LCSWMA Project B. York County Sanitary Landfill Reclamation Project
II. EXCAVATION AND TROMMELING DATA . . . . . . . . . . . . . . . . . . . . . . .. . . . . .. 3
A. Manpower and Equipment B. Material Production Data C. Reclaimed Waste Characteristics D. Unders/Soil Characterizations E. Air Quality at Excavation Site
III. RESOURCE RECOVERY FACILITY IMPACTS • . . . . . . . . . . . . . . . . . . . . . . . .. 60
A. Operational Concems B. Fuel Values C. Effect on Emissions D. Ash Residue and Ferrous Metal Recovery
IV. PROJECT COMPARISONS . . . . . . . . . . . . . . . . . . . . . . . . . . . . . . . . . . . . . . . . 97
V.
VI.
A. Waste Composition/Age B. Chemical Characteristics C. Energy Value D. Air Quality
PROJECT BENEFITS
A. Reclaimed Landfill Space and Cover Soil B. Energy Production C. Recovery of Recyclables D. Clean Closure/Mitigation
RECOMMENDATIONS FOR RECLAMATION OPERATIONS
122
124
VII. RECOMMENDATIONS FOR FURTHER RESEARCH .................... 125
REFERENCES
NOMENCLATURE
LIST OF TABLES
1 LCSWMA Reclamation Weekly Cost Summary . . . ... . . . . .. . . . . .. . .. . . . .. . 5
2 Reclamation Haul Tonnages by Vehicle Type . . . . . . . . . . . . . . . . . . . . . .. 12
3 Reclamation Volumes vs. Trommel Production Hours . . . . . . . . . . . . . . . . . . . . . . 13
4 Trommel Unders Composition by Weight Percent . . . . . '.' . . . . . . . . . . . . . . . . . . 29
5 Analytical Parameters for Unders, Unders Soil Fraction, and Virgin Daily Cover Soil . . . . . . . . . . . . . . . . . . . . . . . . . . . . . . . . . . . . . . . .. 30
6 Cell 1 Total Metals Analyses of Unders, Unders Soil Fraction, and Virgin Daily Cover Soil . . . . . . . . . . . . . . . . . . . . . . . . . . . . . . . . .. 32
7 Cell 1 Target Compound Listn'CLP Analyses for Unders, Unders Soil Fraction, and Virgin Daily Cover Soil (3rd Qtr '93) . . . . . . . .. . .. . . . 33
8 Cell 1 Target Compound Listn'CLP Analyses for Unders, Unders Soil Fraction, and Virgin Daily Cover Soil (4th Qtr '93) . . .. . . ... . . . . .. 34
9 Analytical Parameters for Reclamation Air Monitoring . . . . . . . . . . . . . . . . . . . . . . 49
10 Landfill Air Monitoring Test Results (Area Samples) . . . . . . . . . . . . . . . . . . . . . .. 50
11 Landfill Air Monitoring Test Results (Personal Samples) . . . . . . . . . . . . . . . . . . .. 54
12 Landfill Air Monitoring Test Results (Area Samples) Additional vac Area Testing . . . . . . . . .. ... . . . . . . . . . .. . . .. . .. . .... . . . 58
13 LCSWMA RRF Source Test Emissions . . . . . . . . . . . .. . . ... . . . . . . . . . . . . .. 77
14 RRF Deliveries and Ash Residue/Ferrous Metal Tonnages . . . . . . . . . . . . . . . . . . 89
15 Comparison of LCSWMA and YCSWRA Ash Residue Total Metal Analyses . . . . .. . . . . . . . . . . . . ....... .. ... . . . . . . . ... . . . . . .. . . 90
16 Comparison of LCSWMA and YCSWRA Ash Residue TCLP Analyses . . .. . . . . . 91
17 Unders Soil Test Results: York County Reclamation Project .. . . . .. .. . . . . . . 101
18
19
Soil Test Results: Eastern Lift Test Pit Project (Pits #1-3)
Soil Test Results: Eastern Lift Test Pit Project (Pits #4-7)
102
104
20 York County Air Monitoring Test Results (Area Samples) ... . ... . . . . . . . . . . . 110
21 Eastern Lift Air Monitoring Test Results (Area Samples) . . . . . . . . . . . . . . . . . . . 114
22 Eastern Lift Air Monitoring Test Results (Area Samples) Upward! Downward of Work Site ..... . . . . . . . .. . ... . . . . . . . . . . . . ... . . . . . .. . . 118

LIST OF FIGURES
1 Landfill Reclamation Process . . . . .. . . . . . . . . . . . ... .. . . . . . . .. . . . . . . . ... 6
2 Cell 1 Reclamation Area . . . . . . . . . . . . . . . . . . . . . . . . . . . . . . . . . . . . . . . . . . . . 8
3 Creswell/Frey Farm Landfill - Site Layout . . . . . . . . . . . . . . . . . . . . . . . . . . . . . . . . 9
4 Total Waste Volume Excavated per Trommel Production Hour . . . . . . . . . . . . . . . 15
5 Reclaimed Waste and Unders Tonnages per Trommel Production Hour . . .. . . . . 17
6 Reclaimed Waste Characteristics . . . . . . . . . . . . . . . . .. . . . . . . . . .. . . .. . . . . 21
7 Physical Characteristics of Unders . . . . . . . . . . . . . . . . . . . . . . . . . . .... . .. .. 23
8 Chemical Characterization of Unders, Unders Soil Fraction, and Virgin Daily Cover Soil (1992) . . . . . . . . . . . . . . . . . . . . . . . . . . . . . . . . . . . . . . . 35
9 Chemical Characterization of Unders, Unders Soil Fraction, and Virgin Daily Cover Soil (1993) . . . . . . . . . . . . . . . . . . . . . . . . . . . . . . . . . . . . . . . 37
10 Chemical Characterization of Unders, Unders Soil Fraction, and Virgin Daily Cover Soil (1992) - Additional Parameters . . . . . . . . . . . . . . . . . . . . . 39
11 Chemical Characterization of Unders, Unders Soil Fraction, and Virgin Daily Cover Soil (1993) - Additional Parameters . . . . . . . . . . . . . . . . . . . . . 41
12 Frey Farm Landfill - Cell 1 Reclamation Layout . . . . . . . . . . . . . . . . . . . . . . . . . . 48
13 Waste Stream Heating Values . . . . . . . . . . . . . . . . . . .. .. . . .. ... . .. . .... . 67
14 Waste Stream Heating Values vs. Waste Age . . . . . . . . . . . . . . . . . . . . . . . . . . . 69
15 Reclaimed Waste Stream Heating Value vs. Rainfall at Landfill . . . . . . . . . . . . . . . 71
16 Reclaimed Waste Stream Heating Value vs. Rainfall at Time Refuse Was Landfilled . . . . . . . . . . . . . . . . . . . . . . . . . . . . . . . . . . . . . . . . . . . . . . . . . . 73
17 LCSWMA RRF Quarterly CEM Carbon Monoxide Emission Data . . . . . . . . . . . .. 79
18 LCSWMA RRF Quarterly CEM Hydrochloric Acid Emissions Data . . . . . . . . . . . . . 81
19 LCSWMA RRF Quarterly CEM Nitrogen Oxide Emission Data . . . . . . . . . . . . . . . 83
20 LCSWMA RRF Quarterly CEM Sulfur Dioxide Emission Data . . . . . . . . . . . . . . . . 85
21 Chemical Characterization of Current Mixed Waste Stream Ash, Unders, and Virgin Daily Cover Soil (1992) . . .. . . . . . . . . . . ...... . . . . . . . .. 93
22 Chemical Characterization of Current Mixed Waste Stream Ash, MSW-Only Ash, Unders, and Virgin Daily Cover Soil (1993) . . . . . . . . . . . . . . . . . 95
23 Creswell Landfill - Eastern Existing Grades . .. . . . . . . . . . .. . . . . . . . . .. . . . . . 98

PREFACE
This report summarizes the Lancaster County Solid Waste Management Authority's (LCSWMA) landfill reclamation activities, which have been ongoing since 199 1 . All aspects of the project have been analyzed, from the manpower and equipment requirements at the landfill to the operational impacts felt at the LCSWMA Resource Recovery Facility (RRF), where the material is delivered for processing.
Characteristics of the reclaimed refuse and soil recovered from trommeling operations are discussed, as are results of air monitoring performed at the landfill excavation site and the RRF.
The report also discusses the energy value of the reclaimed material, and compares this value with those obtained for significantly older reclaimed waste streams. The effects of waste age on the air emissions and ash residue quality at the RRF are also provided. The report concludes by summarizing the project benefits and provides recommendations for other landfill reclamation operations and areas requiring further research.
This report was prepared in cooperation with the Lancaster Environmental Foundation and the National Renewable Energy Laboratory (NREL) under Subcontract No. AAT-4-14 157-0 1 . The assistance of NREL's Technical Monitor, Mr. Philip B. Shepherd, was greatly appreciated.
Acknowledgements also need to be given to several LCSWMA personnel who assisted in compiling the data that appears in this report. In particular, Robert Zorbaugh, Robert Eshbach, and Wayne Gore (respectively, Landfill Manager, Superintendent, and Mechanic) kept the reclamation project afloat by providing their operational expertise and keeping accurate daily records. Rachel Rosenzweig directed air monitoring activities at all of the LCSWMA operational sites. Brooks Norris and William Gingrich of LCSWMA's Technical Services Division provided engineering and survey data regarding the volumes of materials that were excavated, trommeled, and relandfilled. Robert L. Garner prepared many of the graphs and figures that appear in the report.
Ogden Martin Systems of Lancaster (OMSL) personnel provided valuable insight into the processing and combustion of the reclaimed material and its impact on the equipment and overall operation of the facility.
Mr. Robert Fahey, a recognized expert in the field of landfill reclamation, peer reviewed the report.
A. Background Information
EXECUTIVE SUMMARY
For the past three (3) years the Lancaster County Solid Waste Management Authority (LCSWMA) has been "mining" waste buried in Cell 1 at its Frey Farm Landfill and delivering it to its Resource Recovery Facility (RRF) for processing. The project's goals are twofold: to extend the life of the landfill by recovering valuable landfill space, and to increase energy production and efficiency at the RRF. By the time the project is completed, approximately 530,000 cubic yards of space will be reclaimed.
The waste excavated from the LCSWMA landfill varies in age from 1 - 5 years. During November and December of 1993 , LCSWMA participated in ajoint project with the York County Solid Waste and Refuse Authority (YCSWRA) to excavate 1 5 - 20 year old trash and deliver it to the Lancaster RRF for processing. The project offered a unique opportunity to assess the impact waste age has on the energy value of reclaimed waste, as well as its impact on air emissions and ash residue quality.
The Authority also conducted test excavations at a portion of a 1 0-year old cell at its Creswell Landfill to characterize the waste and determine its suitability for processing at the RRF.
The following report summarizes the LCSWMA reclamation experience to date and makes comparisons, where applicable, with the other reclamation projects mentioned above.
B. LCSWMA Reclamation Summary
Over 25 1 ,200 tons of refuse were excavated from 1991 through 1993 , which translates to nearly 2,650 tons excavated on a weekly basis. Reclamation activities resulted in the delivery of 1 ,476 tons of screened refuse per week to the RRF for processing. Thus, 56% of the total excavated tons are being converted into fuel for the RRF; 4 1 % of the excavated material is recovered as soil during trommeling operations; and the remaining 3%, or approximately 93 tons per week, are non-combustibles that must be disposed in the landfill. Volumes of excavated material, recovered soil, reclaimed material, and non-combustibles are tracked monthly by field survey methods.
Approximately 33% of the project costs are associated with excavation and trommeling operations at the landfill; 3 1 % of the costs are incurred in transporting reclaimed waste to the RRF and in hauling ash residue created from the combustion of reclaimed waste back to the landfill; the balance of the project costs is associated with processing fees paid to Ogden Martin Systems of Lancaster (OMSL), operators of the RRF, and to the RRF and landfill host communities.
Revenues obtained from the sale of electricity and recovered ferrous metal offset these operating costs, resulting in net revenues of $3 .94 for every ton of reclaimed refuse delivered to the RRF. Additional assets recovered on a weekly basis include cover soil and landfill volume. Therefore, the overall project profit, which includes net revenues and asset additions, amounts to $35 ,200 per week, or approximately $ 13 .30 for every ton of material excavated.

C. Excavation and Trommeling Data
LCSWMA landfill personnel use a Re-Tech 723 trommel with 1 " square screen openings to process the excavated waste. Over the past two (2) years, LCSWMA has m ade several operational and design improvements to its reclamation project to optimize project efficiency. Daily reclamation activities are handled by three (3) equipment operators to excavate the buried refuse, feed the trommel screen, load the transport vehicles, and transport screened soil to other locations at the landfill. The landfill mechanic spends 30 m inutes each day performing a preoperational inspection and greasing all the fittings on the trommel.
Excavation techniques have evolved from the bulk excavation phase to the presently used "stripm ining" techniques. This approach involves cutting a 50' wide by 1 5 0' long swath to a specific depth; once this waste is trommeled, operations move laterally to the next section, where the process is repeated. Excavation is done in this manner so that operations are kept downgradient of the existing cut to aid in storm water control. Temporary berms are also placed around the upper edge of the stripped areas to enhance run-off. The strip-mining method also prevents the accumulation of methane in an excavated pit.
Throughout 1992 and 1993 , a varying combination of from 2 - 4 open-top trailers (transfer trailers with its top removed and replaced with a tarp) and 3 - 5 ash dump trucks (25-yd. tri-axles) were used to deliver reclaimed waste to the RRF. The trailers hauled 72% of the refuse, while the ash trucks and occasionally a 40-yd. roll-off transported the remainder.
Downtime has not sidetracked daily operations. Over the past two (2) years, unscheduled downtime has averaged approximately 45 m inutes per operating day (see Page 1 6 for a detailed discussion). Trommel design improvements have made it possible to operate with one (1) maintenance period per year. Scheduled downtime for 1992 and 1993 has averaged 5 - 1 0 hours per month, or roughly 30 minutes per operating day.
D. Material Characterizations
The three (3) by-products of trommeling excavated waste are reclaimed refuse ("overs"), recovered soil ("unders"), and non-combustible, oversized material ("non-processibles").
Roughly 67% of the overs contained combustible materials such as paper, cloth, wood, cardboard, household refuse, plastics, roofing and insulation. Nearly 30% of the overs consisted of noncombustible material such as soil and rocks. The remaining 3% contained recyclable aluminum, bi-metallic and steel cans.
The age of the trommeled waste from Cell I has ranged from 15 to 48 months. Landfill operators have noticed a m inor amount of decomposition in the refuse. Also, the soil and moisture content of this material has varied significantly, drying out in the Winter and late Spring. However, weather conditions have not negatively compromised reclamation operations, nor have they contributed to a decrease in the higher heating value (HHV) of the waste.
LCSWMA performed several physical characterization studies on the unders. It was found that the percentage of soil and rocks in this material ranged from 80% to 93%. The other main constituents, comprising roughly 9% of the samples, were paper, glass, plastic and linoleum. Additionally, the unders were texturally classified as a sandy loam, with a Unified Classification of "SM". These characteristics qualified the unders to be used as daily cover per the requirements of Pennsylvania's Municipal Waste Management Regulations.
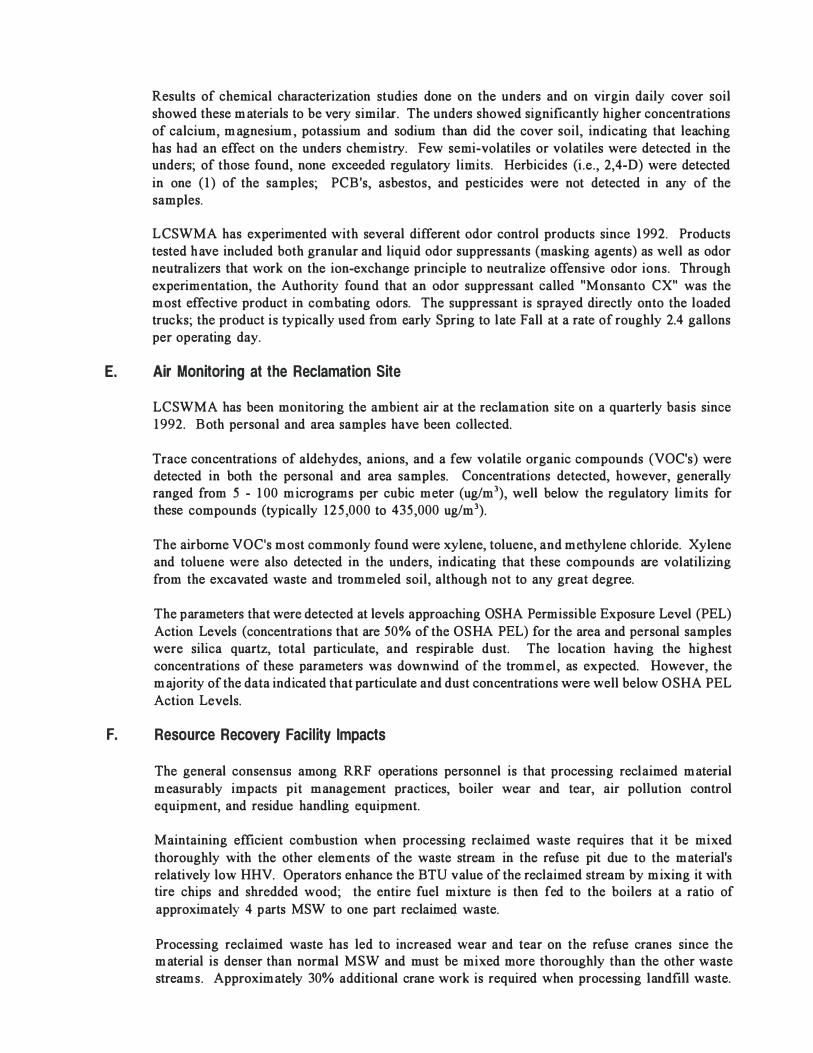
Results of chemical characterization studies done on the unders and on virgin daily cover soil showed these materials to be very similar. The unders showed significantly higher concentrations of calcium, magnesium, potassium and sodium than did the cover soil, indicating that leaching has had an effect on the unders chemistry. Few semi-volatiles or volatiles were detected in the unders; of those found, none exceeded regulatory limits. Herbicides (i .e., 2,4-D) were detected in one (1) of the samples; PCB's, asbestos, and pesticides were not detected in any of the samples.
LCSWMA has experimented with several different odor control products since 1992. Products tested have included both granular and liquid odor suppressants (masking agents) as well as odor neutralizers that work on the ion-exchange principle to neutralize offensive odor ions. Through experimentation, the Authority found that an odor suppressant called "Monsanto CX" was the most effective product in combating odors. The suppressant is sprayed directly onto the loaded trucks; the product is typically used from early Spring to late Fall at a rate of roughly 2.4 gallons per operating day.
E. Air Monitoring at the Reclamation Site
F.
LCSWMA has been monitoring the ambient air at the reclamation site on a quarterly basis since 1992. Both personal and area samples have been collected.
Trace concentrations of aldehydes, anions, and a few volatile organic compounds (VOC's) were detected in both the personal and area samples. Concentrations detected, however, generally ranged from 5 - 1 00 micrograms per cubic meter (ug/m3), well below the regulatory limits for these compounds (typically 125 ,000 to 435,000 ug/m3).
The airborne VOC's most commonly found were xylene, toluene, and methylene chloride. Xylene and toluene were also detected in the unders, indicating that these compounds are volatilizing from the excavated waste and trommeled soil, although not to any great degree.
The parameters that were detected at levels approaching OSHA Permissible Exposure Level (PEL) Action Levels (concentrations that are 50% of the OSHA PEL) for the area and personal samples were silica quartz, total particulate, and respirable dust. The location having the highest concentrations of these parameters was downwind of the trommel, as expected. However, the majority of the data indicated that particulate and dust concentrations were well below OSHA PEL Action Levels.
Resource Recovery Facility Impacts
The general consensus among RRF operations personnel is that processing reclaimed material measurably impacts pit management practices, boiler wear and tear, air pollution control equipment, and residue handling equipment.
Maintaining efficient combustion when processing reclaimed waste requires that it be mixed thoroughly with the other elements of the waste stream in the refuse pit due to the material's relatively low HHV. Operators enhance the BTU value of the reclaimed stream by mixing it with tire chips and shredded wood; the entire fuel mixture is then fed to the boilers at a ratio of approximately 4.parts MSW to one part reclaime4 waste.
Processing reclaimed waste has led to increased wear and tear on the refuse cranes since the material is denser than normal MSW and must be mixed more thoroughly than the other waste streams. Approximately 30% additional crane work is required when processing landfill waste.

The abrasiveness of the reclaimed material (due to its soil content) has caused increased wear on the feed chute hoppers and on the feed tables. These areas have been replated after three (3) years of service, compared to a normal replacement of every five (5) years. Also, the high particulate content of the m ined waste stream has led to premature plugging of the economizers and additional wear and tear on the baghouses. OMSL is paid a fee (per ton of reclaimed m aterial processed) to cover these additional costs. The fee for the past two (2) years has averaged $3 .03 per ton.
The soil content of the reclaimed stream has led to higher ash generation rates at the facility than at comparable facilities that process only MSW, which causes additional wear on the residue handling system . Ash generation rates are roughly 5 - 7% higher than when processing strictly MSW.
G. Energy Values of the Waste Streams
The average HHV of the total fuel mixture for 1993 was 5 ,059 BTU per pound, or approximately 4% higher than that achieved in 1992. This average value was derived from monthly determinations of the waste streams' HHV by using the steam correlation method.
One ( 1 ) 8-hour boiler calorimetry test was conducted on a unit fired with 1 00% reclaimed waste. The HHV of the reclaimed material was found to be 3,084 BTU per pound.
LCSWMA also estimated the HHV of its reclaimed stream on a monthly basis. Assumptions were made regarding the HHV of the various waste streams. Each waste stream 's assumed HHV was then multiplied by the monthly waste stream tonnage (in percent) for each material; the resulting value was then set equal to the HHV of the fuel m ixture as determined using the steam correlation method, and the equation solved for the HHV of the reclaimed waste. The average HHV of the mined waste for 1993 using this calculation method was 3 , 149 BTU per pound.
H. Effect on Emissions
LCSWMA monitors emissions on a continuous basis with the facility's Continuous Emissions Monitoring (CEM) System. Emissions statements are filed with Pennsylvania's Department of Environmental Resources (paDER) on a quarterly basis for emissions of carbon monoxide, hexavalent chromium, nitrogen oxide, and sulfur dioxide.
None of the parameters' quarterly average emissions exceeded permitted levels. However, operators have noticed, over time, that com busting reclaimed waste tends to cause an increase in hydrogen chloride emissions. The chemical characterizations done on the unders revealed it to have high concentrations of sodium, potassium, magnesium, and calcium . Thus, the unders are contributing to, but are not the sole cause, of elevated hydrogen chloride emissions at the facility.
I. Project Comparisons
From m id-November to mid-December 1993, LCSWMA participated in a joint project with the . York County Solid Waste and Refuse Authority (YCSWRA) to excavate and burn a small portion of YCSWRA's landfill that contained 1 5 - 20 year old trash. It was hoped that some conclusions could be drawn regarding the effect waste age had on the energy val\le, air emissions, and ash quality at the RRF.

Physical characterization studies showed the York County waste stream to contain similar percentages of combustible, non-combustible and recyclable materials. The higher degree of decomposition in the York County stream was evidenced by a greater amount of fine granular material. Also, the soil content of the York County mined waste was 24% higher than Lancaster's reclaimed stream, due to greater amounts of cover soil used during original landfilling. Despite its degraded state and soil content, however, the older waste stream was still considered to be trommelable and combustible.
Unders chemical characterization analyses showed the LCSWMA reclaimed stream to have higher total metals concentrations of arsenic, barium, cadmium, lead and mercury. The lower concentrations in the older York waste may indicate that these metals have leached out of the older waste.
Ash residue generation rates when burning the York County reclaimed material were roughly 5 .3% higher than the typical LCSWMA percentages due to the higher soil content of the York m ined stream .
In general, the testing undertaken established that the chemistry of the ash generated from the combustion of 1 5 - 20 year old refuse does not differ markedly from residue resulting from the combustion of refuse mixed with I - 5 year old waste.
The HHV range for the York County reclaimed stream was 1 ,069 to 2,249 BTU per pound, considerably lower than the LCSWMA stream . Several factors contributed to the low value. There was an unusually high amount of rainfall during the project period, and a quarrying type of excavation was used, which resulted in a very dirty, wet end product. LCSWMA feels that, with a few minor improvements, the HHV of the older waste stream could be improved to a level close to that achieved with the LCSWMA waste.
None of the RRF air emissions experienced during the time of the York County project exceeded the facility's air permit. Operators noticed that the older waste stream also produced relatively high hydrogen chloride emissions, similar to levels experienced when processing the Lancaster stream.
The air monitoring tests that were performed at Cell I of the Frey Farm Landfill were also done at the York reclamation site and during the test pit excavations. A greater quantity of VOC's were detected at the Cell I site than at either the York County or Eastern Lift sites, possibly due to the age of the refuse, since gas generation rates decline exponentially after a landfill is closed. It was found, however, that compounds such as methylene chloride, ethylbenzene, Freon-I I , xylene, styrene, and toluene are present at all sites.
The conclusion to be reached regarding reclamation site emISSIons is that excavating and trommeling waste buried for I - 20 years produce ambient concentrations of hazardous air pollutants that are several orders of magnitude below the OSHA permissible exposure levels.
J. Project Benefits
The obvious benefit from reclamation operations is that the space created helps extend the life of the landfilL Reclamation can also be Jlsed to remediate problem sites, such as those that are unlined or ones whose liners are in need of repair. Additionally, the LCSWMA experience has shown that a significant quantity of soil can be recovered and used as daily cover.

Reclaimed material can be successfully processed at a modern-day resource recovery facility as long as it is mixed well with other refuse streams. The relatively low HHV reclaimed stream can be offset by the combustion of higher HHV supplementary fuels. The additional tonnage provided by the m ined waste can be used to maximize boiler efficiency, power production and electrical revenues.
K. Recommendations for Reclamation Operations
LCSWMA has the following recommendations related to reclamation operations at a landfill and resource recovery facility:
• Plan the excavation site properly so that storm water can be properly controlled, and that methane pockets and equipment relocation can be minimized.
• Ensure that reliable methods are in place for measuring volumes and tons of reclaimed waste, cover soil and non-combustibles; track volumes by field survey methods.
• Make daily observations of the reclaimed waste (try to have the same person make the observations); record data on moisture content, waste composition, waste age, soil content of refuse, rainfall, weather and odor.
• Minimize personnel exposure to the actual reclamation site during trommeling operations; require respirator use (if deemed necessary by tests) if prolonged exposure will occur downwind of the trommel or in the area where the refuse is first unearthed.
• Use odor control when average daytime temperatures exceed 70°F.
• At the resource recovery facility, experiment to find the optimum mix of MSW and reclaimed waste to maximize combustion efficiency. Supplement the reclaimed stream with materials having high HHV's. Feed only well-mixed refuse to the boilers.
• Air monitoring tests should be conducted at the reclamation site. Obtain area and personal samples; monitor the site on a daily basis for methane, oxygen and volatile organic chemicals, and establish action levels for each parameter.
• Perform quarterly physical and chemical characterization studies on the unders and overs.
• Conduct periodic boiler calorimetry tests to determine the HHV of the entire fuel mixture. Perform at least one (1) test on a unit fired with 1 00% reclaimed waste to establish a baseline HHV for the reclaimed material.
• Perform quarterly air monitoring on the tipping floor; require respirator use if tests warrant.
• Test ash residue quarterly for the full range of total and TCLP metals, moisture content, pH, percent carbon, and chlorides.

L. Recommendations for Further Research
Based on its experience to date, LCSWMA believes that the following topics merit further research:
• Determine the reasons for elevated chloride emissions experienced when reclaimed waste is co-combusted with MSW.
• Compare the HHV data from this project to reclaimed wastes from landfills in more temperate climates to further characterize the effect decomposition has on the material's energy value.
• Determine if there is a direct correlation between measured HHV values of reclaimed waste and measured (or predicted) energy content of landfill gases generated during decomposition.

ASSESSMENT OF LANDFILL RECLAMATION AND THE EFFECTS OF AGE ON THE COMBUSTION OF RECOVERED MUNICIPAL SOLID WASTE
I. Background Information
A. LCSWMA Project
One of Lancaster County's most significant resources is farmland, and therefore it seems logical that one of the main goals of the Lancaster County Solid Waste Management Authority (LCSWMA) is to protect land by preserving space needed for landfilling. To achieve this goal, the Authority built a Resource Recovery Facility (RRF) to significantly reduce the volume of waste entering the Frey Farm Landfill and coordinated recycling and waste reduction programs. As a result of resource recovery and recycling, less than 1 2% of the volume of municipal waste generated in Lancaster County now ends up at the Frey Farm Landfill for disposal.
In February 199 1 , with the RRF in start-up operations, the Authority took another step in preserving landfill space by excavating and incinerating waste buried in the Frey Farm Landfill's first cell, whose 1 8 acres were filled to capacity during the 16 months prior to the RRF's start-up. This landfill reclamation project began on a small scale, with only a few hundred tons of waste reclaimed each week. From its experimental start, landfill reclamation has since evolved into an operation that utilizes all Authority ash trucks and two open-top transfer trailers to haul more than 1 ,475 tons of reclaimed waste to the resource recovery facility on a weekly basis. Though the project has grown tremendously, the goals remain the same: reclaiming landfill space and extending the lifespan of the landfill; increasing energy production and efficiency at the resource recovery facility; and recovering ferrous metals and cover soil.
Since the project's beginning, the Authority and Ogden Martin Systems of Lancaster, Inc. (OMSL), the resource recovery facility's operator, have jointly determined the most efficient and cost-effective manner in which to excavate and process the waste reclaimed from the Frey Farm Landfill. In the first phase of the project, the Authority excavated waste from the landfill and delivered it directly to the RRF without trommeling it, where it was mixed with municipal solid waste (MSW) at various ratios and burned. Because of the large amount of cover soil material in the reclaimed waste and its moisture content, OMSL, during phase two, began supplementing the mixture of reclaimed waste and MSW with other fuels, primarily propane gas, wood, and tire chips to increase its energy value.
In phase three, the Authority purchased a rotary trommel and used it to screen the majority of the cover material from the reclaimed waste. After eight months, the Authority bought a larger trommel with additional screening capability to improve the screening process.
As a result of the work at the Frey Farm Landfill and the RRF, the Authority learned that landfill reclamation is possible under phases one and two as described above, but that trommeling the waste makes the most economic and operational sense. Because of the amount of soil found in untrommeled waste and its negative effect on combustion characteristics, the amount of such waste processible at the resource recovery facility is limited. Removing cover material from the waste produces a cleaner, more efficient fuel.
1
In addition, trommeling the waste produces reusable landfill cover material and maximizes the efficiency of vehicles that haul reclaimed waste to the RRF and transport ash residue to the landfill on the return trip.
By the time this project is completed, approximately 530,000 cubic yards of spac� will be reclaimed from the Frey Farm Landfill.
With substantial net revenues and approximately 2,480 cubic yards of space gained each week, the project makes sound financial sense. The Authority expects its reclamation project to provide a model for other communities interested in adding capacity to their landfills and for those that need to mitigate or reduce the size of problem landfill sites.
B. York County Sanitary Landfill Reclamation Project
In October 1 993 in neighboring York County, the York County Solid Waste and Refuse Authority (YCSWRA) expressed interest in evaluating the feasibility of reclaiming a portion of its unlined landfill located in Hopewell Township. The unlined, 170-acre section is filled with 1 5- to 20-year-old trash. This unlined section has been listed on the federal Superfund List of toxic waste sites since 1987 because of contamination discovered in groundwater wells located on neighboring properties. If studies indicate that reclaiming this area of the landfill would be feasible and would not compromise regulatory standards, YCSWRA could possibly use reclamation as a final cleanup plan and extend the lifespan of the landfill beyond its expected closing date of 1997.
In November, YCSWRA, in cooperation with LCSWMA through the Lancaster Environmental Foundation, began a test excavation on one-third of an acre of the unlined portion of the landfill. Approximately 4,800 tons of waste were excavated and processed by the test's completion in December. YCSWRA used the same trommeling equipment utilized initially in Lancaster's project. Although York County hosts a resource recovery facility, it was decided that Lancaster County's facility would be used to process the material since operators were more familiar with handling reclaimed waste streams. Additionally, the same protocols for sampling and testing reclaimed material and ash residue could be used in order to expand the existing database.
Through this cooperative effort, LCSWMA was able to learn more about the impact waste age has on the BTU value of reclaimed waste. Data collected from the York County test on the waste buried since 1977 was compared to data generated from the Frey Farm Landfill's reclaimed waste buried since 1989. In addition, LCSWMA dug seven (7) test pits at the Eastern Lift of its Creswell Landfill, which is adjacent to the Frey Farm Landfill. The waste buried in this portion of the landfill is approximately ten ( 10) years old. In the report that follows, data from these three (3) reclamation studies will be compared for characteristics including soil/moisture content, air quality and energy value.
2

II. Excavation and Trammeling Data
A. Manpower and Equipment
1. Landfill Manpower and Equipment
Since February 1991 , LCSWMA has been reclaiming waste previously landfilled in Cell 1 at its Frey Farm Landfill. Waste is excavated by a Caterpillar (CAT) D8N bulldozer and stockpiled near a Linkbelt hydraulic excavator. The excavator loads the refuse into a Re-Tech 723 rotary trommel so that entrained soil can be screened from the waste. The resulting product is then loaded into Authority dump trucks and open-top transfer trailers for transport to the Resource Recovery Facility.
At the inception of its reclamation project, LCSWMA delivered untrommeled waste to the RRF. Plant operators discovered almost immediately that the material was unacceptable for processing due to the high soil content of the refuse. In October 1991 , LCSWMA began trommeling the waste with a Re-Tech 720 trommel, and the end product improved substantially.
In June 1992, the Authority began using a Re-Tech 723 trommel to screen the reclaimed waste. The new trommel offered several design improvements: 5' of extra barrel length to accommodate an additional screening section; decreased incline of belt feeder from 1 r to 10° to prevent clogging and to allow material to be more easily fed into the drum; screen drum incline lowered from 8° to 6° so that the material could spend a slightly longer time in the drum, thus producing a cleaner end product; and the drum and feeder motor speeds were now set electrically, not hydraulically, for better operational control.
In the late Spring of 1993, several design changes were made to the trommel which made operations considerably smoother. The most significant modification was the welding of the drive sprocket to the drum with the drive chain going around the sprocket. Previously, the sprocket would frequently become misaligned and require repositioning. The second design change involved moving the thrush wheel to the intake end of the trommel, relieving significant pressure on the barrel. The final improvement involved the installation of a planetary drive system on the refuse feeder belt, which made the belt run smoother and was more easily adjusted. Other minor modifications that helped to decrease downtime including making the barrel cleaning brush brackets adjustable and lengthening the bristles on the brushes. These modifications served to greatly reduce unscheduled trommel downtime, as discussed below in Section II.B.4.
During 1993, the Authority trommeled waste in response to the refuse demands of the RRF. Operations throughout the year became more or less routine, and manpower requirements were cut to a m inimum. The equipm<?nt and manpower used on the project consisted of the following: one ( 1 ) operator to run the CAT D8N bulldozer to excavate the waste and push it toward the excavator; one ( 1 ) operator for the Linkbelt hydraulic excavator, used for feeding the trommel and sorting out non-combustible items; one (1) person to operate a CAT 973 front-end loader to load the transport vehicles (generally the same operator who runs the
3

CAT D8N) and to load the unders and non-combustibles into a CAT D350 articulated dump truck for transport to other areas of the landfill; one ( 1 ) operator for the D350 dump truck; and one (1) mechanic to perform a 30-45 minute preoperational inspection each day to pinpoint any trouble areas and to grease all the fittings on the trommel.
During 1993, the operating hours and fuel consumed per piece of equipment were tracked by landfill personnel on daily log sheets. The operational data is as follows (46-week project period):
(a)
(b) (c) (d) (e)
Trommel: 1 ,530 hours (6,384 gallons) Linkbelt hydraulic excavator: 1 ,423 hours ( 1 0,752 gallons) CAT D8N bulldozer: 874 hours (8,948 gallons) CAT 973 loader: 1 ,76 1 hours ( 13,549 gallons) CAT D350 articulated dump truck: 604 hours ( 1 ,525 gallons)
Weekly costs for the excavating and sorting equipment decreased 20.6% from 1992 to 1993 as operations became more efficient and routine. Trommel operating costs also fell 32% from 1992 to 1993 since the function of supervising trommel operations was shifted from a dedicated landfill Compliance Officer to the operators of the Linkbelt excavator and the front-end loader.
Weekly operating hours and fuel consumption for the reclamation equipment were. also lower in 1993 than in 1992 due to RRF operational constraints. From m idAugust through mid-October, production levels were curtailed to 300 tons per day due to refuse pit inventories at the RRF.
LCSWMA has also kept track of other reclamation project costs. The average weekly operational costs for the equipment described above is shown below. These costs are weekly averages for a 2-year period ( 1992 and 1993) and include equipment, labor, and fuel costs.
Trommel Linkbelt CAT 973 Loader CAT D8N Dozer CAT D350 Dump Ash Dump Trucks Open-top Trailers
TOTAL =
$lWeek $ 1 ,305 $ 1 ,52 1 $ 1,2 1 9 $ 1 ,1 03
$740 $580 $875
$7,343 ($4.97 per reclaimed ton)
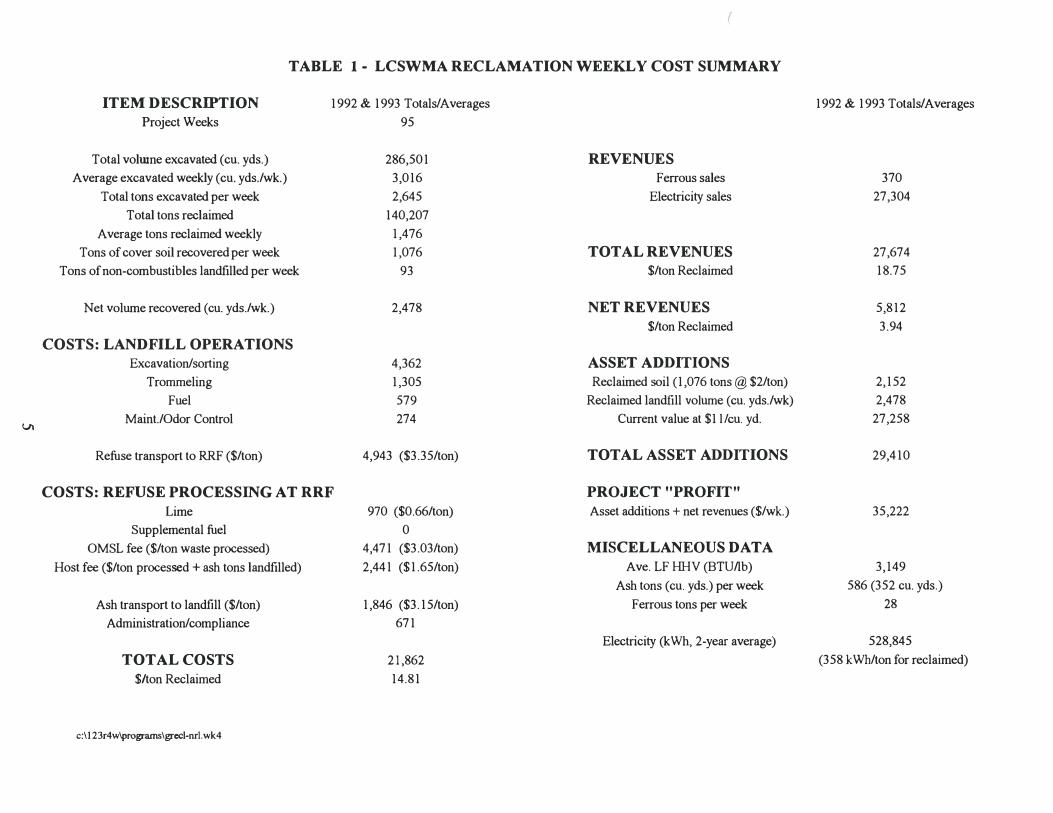
Production data, project costs, and project revenues for the 1992 - 1993 period are summarized in Table 1 and the accompanying flow chart (Figure 1 ).
2. Logistics
Reclamation activItIes at the landfill must be closely coordinated with the landfilling of non-combustible materials and ash residue produced at the RRF.
4
C' ( \
TABLE 1- LCSWMA RECLAMATION WEEKLYCOST SUMMARY
ITEM DESCRIPTION 1992 & 1993 Totals! Averages 1992 & 1993 Totals!Averages
Project Weeks 95
Total volwne excavated (cu. yds.) 286,501 REVENUES
Average excavated weekly (cu. yds.lwk.) 3,016 Ferrous sales 370
Total tons excavated per week 2,645 Electricity sales 27,304
Total tons reclaimed 140,207
Average tons reclaimed weekly 1,476
Tons of cover soil recovered per week 1,076 TOTAL REVENUES 27,674
Tons of non-combustibles landfilled per week 93 $/ton Reclaimed 18.75
Net volume recovered (cu. yds.lwk.) 2,478 NET REVENUES 5,812
$/ton Reclaimed 3.94
COSTS: LANDFILL OPERATIONS
Excavation/sorting 4,362 ASSET ADDITIONS
Trommeling 1,305 Reclaimed soil (1,076 tons @ $2/ton) 2,152
Fuel 579 Reclaimed landfill volume (cu. yds.lwk) 2,478
VI Maint.lOdor Control 274 Current value at $1 lieu. yd. 27,258
Refuse transport to RRF ($/ton) 4,943 ($3.35/ton) TOTAL ASSET ADDITIONS 29,410
COSTS: REFUSE PROCESSING AT RRF PROJECT "PROFIT"
Lime 970 ($0.66/ton) Asset additions + net revenues ($/wk.) 35,222
Supplemental fuel 0
OMSL fee ($/ton waste processed) 4,471 ($3.03/ton) MISCELLANEOUS DATA
Host fee ($/ton processed + ash tons landfilled) 2,441 ($1.65/ton) Ave. LF HHV (BTUllb) 3,149
Ash tons (cu. yds.) per week 586 (352 cu. yds.)
Ash transport to landfill ($/ton) 1,846 ($3. 15/ton) Ferrous tons per week 28
Administration/compliance 671
Electricity (kWh, 2-year average) 528,845
TOTAL COSTS 21,862 (358 kWh/ton for reclaimed)
$/ton Reclaimed 14.81
c:\1 23r4w\programs\grecl-nrl. wk4

Q'\
Landfill Reclamation Process (average weekly data from January 1992 through December 1993)
Excavate
2,645 Tons . � 3016 CY
NetVo/unu:
Reclaimed ... Non-combustibles .. Ash ...
c:\hg3'data\gr\lanrecpr.prs
Sort . ..
(+) 3,016 cu. yds. (-) 186 cu. yds. (-) 352 cu. yds.
Trammel 2,552 Tons
( + ) 2,478 cu. yds.lweek
r ..
"-
I
Non-Combustibles
& Oversize 93 Tons
186 CY
Cover . Soil ....... 1,076 tons
1,076 CY
Reclaimed
r Refuse 1,476 Tons
Supplemental
Fuel
Figure 1
..J ,
r- Stockpile � Landfill
( A.h 1 586 Tons
352 CY � �
Resource . r
Recovery ..
. f ,
r Electricity , ( Ferrous ) �528,845 KWh � l 28 Tons )
J 1/
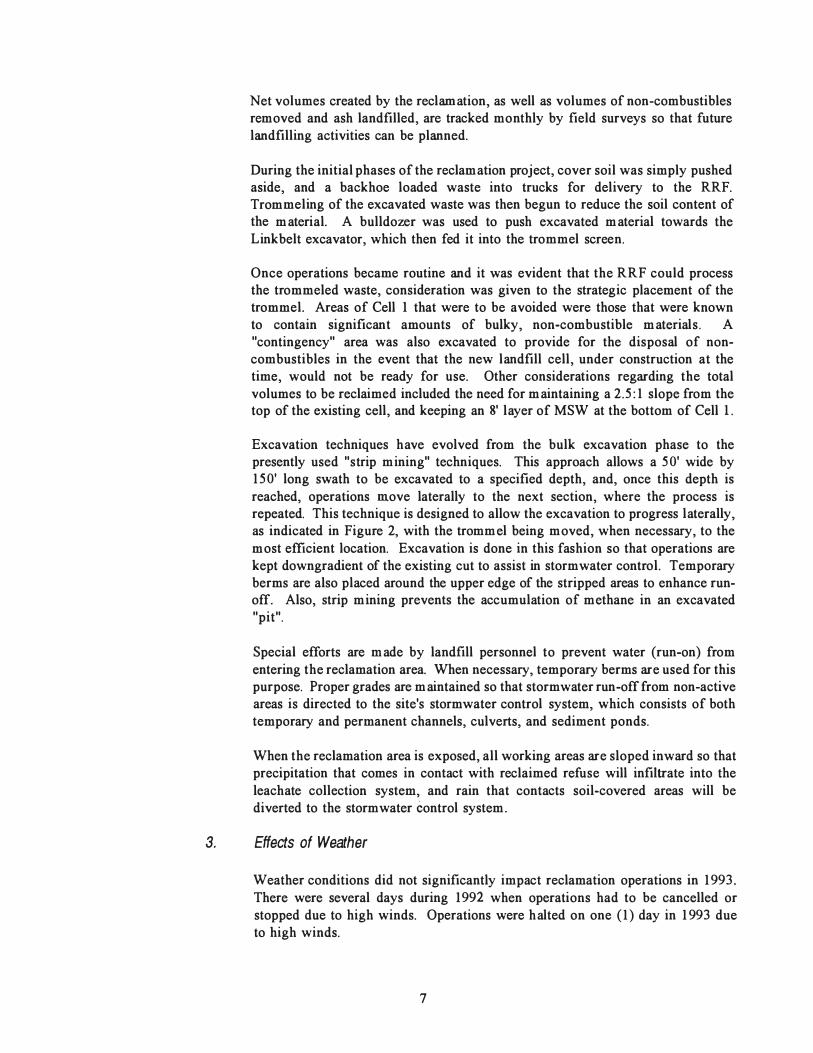
Net volumes created by the reclamation, as well as volumes of non-combustibles removed and ash landfilled, are tracked monthly by field surveys so that future landfilling activities can be planned.
During the initial phases of the reclamation project, cover soil was simply pushed aside, and a backhoe loaded waste into trucks for delivery to the RRF. Trommeling of the excavated waste was then begun to reduce the soil content of the material. A bulldozer was used to push excavated material towards the Linkbelt excavator, which then fed it into the trommel screen.
Once operations became routine and it was evident that the RRF could process the trommeled waste, consideration was given to the strategic placement of the trommel. Areas of Cell 1 that were to be avoided were those that were known to contain significant amounts of bulky, non-combustible materials. A "contingency" area was also excavated to provide for the disposal of noncombustibles in the event that the new landfill cell, under construction at the time, would not be ready for use. Other considerations regarding the total volumes to be reclaimed included the need for maintaining a 2.5: 1 slope from the top of the existing cell, and keeping an 8' layer of MSW at the bottom of Cell l .
Excavation techniques have evolved from the bulk excavation phase to the presently used "strip mining" techniques. This approach allows a 5 0' wide by 1 5 0' long swath to be excavated to a specified depth, and, once this depth is reached, operations move laterally to the next section, where the process is repeated. This technique is designed to allow the excavation to progress laterally, as indicated in Figure 2, with the trommel being moved, when necessary, to the most efficient location. Excavation is done in this fashion so that operations are kept downgradient of the existing cut to assist in storm water control. Temporary berms are also placed around the upper edge of the stripped areas to enhance runoff. Also, strip mining prevents the accumulation of methane in an excavated "pit".
Special efforts are made by landfill personnel to prevent water (run-on) from entering the reclamation area. When necessary, temporary berms are used for this purpose. Proper grades are maintained so that stormwater run-offfrom non-active areas is directed to the site's storm water control system, which consists of both temporary and permanent channels, culverts, and sediment ponds.
When the reclamation area is exposed, all working areas are sloped inward so that precipitation that comes in contact with reclaimed refuse will infiltrate into the leachate collection system, and rain that contacts soil-covered areas will be diverted to the storm water control system.
3. Effects of Weather
Weather conditions did not significantly impact reclamation operations in 1993. There were several days during 1992 when operations had to be cancelled or stopped due to high winds. Operations were halted on one ( 1 ) day in 1 993 due to high winds.
7
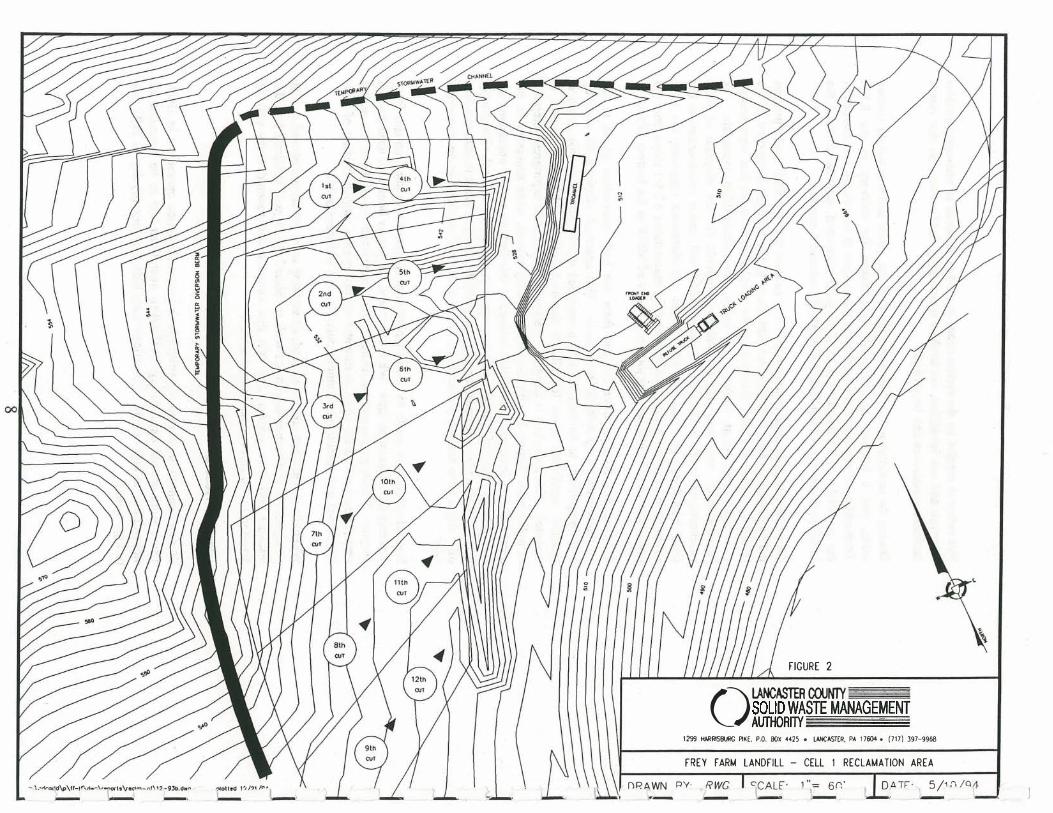
FIGURE 2 ()LANCASTER COUNTY SOLID WA§STE�MANA�G�E�ME�NT AUTHORI1Y =
1299 HARRISBURG PIKE. P.O. BOX •• 25 • LANCASlER. PA 1 760<1 . (717) 397-9968
FREY FARM LANDFILL - CELL 1 RECLAMATION AREA
n R A WN Py· R WG (:- C'eAL�' 1 ",= 6(',' DA Te· , 5/1 ['.

"-'-
'-
\0
\adc:odd'\p\ff-lt\dwQ\repor!s\r.clm-qf\,o-sile.dwlj'j �tt� 12/21 /9"
. 1
" . '.
'.
SVS, 0</</Y"1'k 'tr
,
, '. ''''"' "
'-
-?/t--f'..y '-
"
, ,
, ,
, ,
'- '-
, ,
CENTRAL lin
'-" -.../'>, /' " .' "" /./ \,/
" ', " " .
./ / "
"
FIGURE 3 () LANCASTER COUNTY SOLID WA.�ST�E M�AN�AGiliE�ME�NT AlffiiORITY _
./
1299 HARRISBURG PIKE, P.O. BOX .. 25 • [)NOSTER, PA 1 7604 . (717) 397-9968
CRESWELL / FREY FARM LANDFILL - SITE LAYOUT
DRAWN BY: RWG SCALE: 1 " = 800' DAT E : 4 / 1 5/9 4
Increased rainfall at the landfill, however, led to sloppier conditions and a slightly wetter end product, although the elevated moisture content did not affect the heating value of the material. The higher amounts of rainfall did, however, tend to lead to occasional clogging of the openings on the trommel screen. When this happened, landfill operators used high-pressure compressed air to remove the dirt.
4. Transport Vehicles
During the first two (2) months of this project, all excavated waste was delivered to the RRF using four (4) 25 -yard tri-axle dump trucks. The trucks backhauled the material after dumping their loads of ash residue from the RRF. The only drawback to this approach, however, was that each ash truck could only haul five (5) instead of the customary six (6) loads of ash per day to the landfill.
Beginning in April 199 1 , LCSWMA began using a 65 cubic yard structurallyreinforced open-top transfer trailer (transfer trailer with its top removed and replaced with a tarp) to haul the reclaimed material, since the ash trucks time became more dedicated to removing ash residue from the RRF. Over the next three (3) months, three (3) more open-top trailers were added to the transport fleet. Throughout 1992 and into 1993, a varying combination of from 2 - 4 opentop trailers and 3 - 5 ash dump trucks were used to deliver reclaimed waste to the RRF depending upon truck availability and the need to remove ash from the RRF.
On average, each open-top can haul 1 8 tons per load, while each ash dump truck can transport roughly 8 tons per load. During 1993, the open-top trailers delivered nearly 49,000 tons of reclaimed waste to the RRF, or 7l .6% of the total tons delivered for processing. The open-tops averaged 5 8 trips per week. The ash dump trucks hauled 17,500 tons, or 25 .6% of the total, averaging 48 trips per week. The remaining 2.8% (1 ,930 tons) was hauled by a 40 cubic yard roll-off vehicle on occasions when it could spare a trip to the facility. These haul tonnages are listed in Table 2.
In 1993 , the open-top trailers consumed 28,139 gallons delivering reclaimed material, or roughly 586 gallons per week. The ash trucks used 37,635 gallons, or approximately 784 gallons per week. - Total transport costs for 1993 were $3 .43 per reclaimed ton, or approximately 5% higher than in 1992 due to the increased use of the ash trucks in hauling the refuse.
B. Material Production Data
1. Survey Data/Volume Balance
The Authority has found that the best way to keep track of excavated waste volumes is by field survey methods. On a monthly basis, the LcsWMA surveyor obtains data on volumes excavated during reclamation operations. Other information tracked on a monthly basis include total volume of non-combustibles that are re-Iandfilled, volume of cover soil recovered, and reclaimed material ("overs") transported to the RRF. Volumes of non-combustibles and recovered soil are estimated by the number of loads of each material hauled per day to other
1 0
2.
areas of the landfill by the CAT D350 dump truck. Tons of reclaimed material delivered to the RRF are recorded by the Weighmaster program .
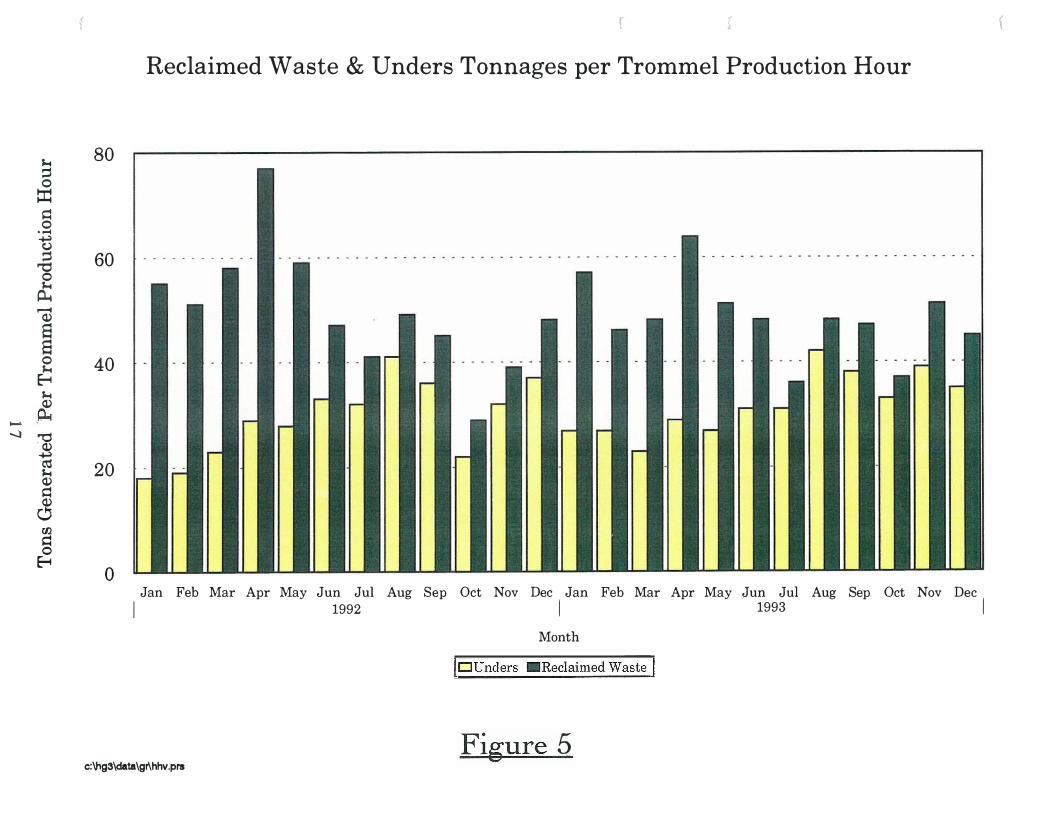
In mid-1992, LCSWMA received a new Re-Tech 723 trommel, which, in the long run, improved operational efficiencies, resulting in a cleaner end-product. Volume excavation rates with the Re-Tech 720 rotary trommel averaged 143 cubic yards per trommel production hour. The new 723 trommel, having a barrel 5 ' longer than its predecessor and an additional screening section, processed only 1 08 cubic yards of excavated material per hour, but this decrease can be attributed to the material spending a longer time in the drum. Throughout 1993, total volume excavated on a weekly basis ranged from 39 to 103 cubic yards per production hour, for an average of 73 cubic yards per hour. This data is summarized in Table 3 . Figures 4 and 5 show average monthly waste volumes excavated, tons delivered to the RRF, and unders tons per trommel production hour for the 1992 - 1993 period.
In the past two (2) years, a total volume of 286,500 cubic yards has been excavated from Cell l . On a weekly basis, this amounts to roughly 3,0 1 6 cubic yards excavated per week. Subtracting for the volumes occupied by noncombustible materials and ash residue resulting from waste processing, the net landfill volume achieved by reclamation activities is 2,478 cubic yards per week.
Waste Production
Over the past two (2) years, the rate of production of reclaimed waste has varied from 30 to 63 tons per trommel production hour. In 1993 , landfill operations generated, on average, 45 tons of reclaimed material for every hour the trommel operated. Reclamation operations have managed to deliver an average of 1 ,476 tons of material per week to the RRF over the past 24 months. For every ton that was excavated, approximately 0.56 tons of reclaimed fuel was produced. This total represents approximately 19% - 2 1 % of the refuse input to the RRF.
3. UnderslNon-Combustible Production
The increased operational efficiency of the Re-Tech 723 is borne out by the "unders" production data. The older trommel produced unders at a rate of 23 tons per production hour, whereas the newer one was capable of producing 33 tons per hour, a 43% increase in efficiency.
In 1993, unders production rates varied from 23 to 45 tons per hour, averaging 32 tons per hour, the same rate achieved during the latter half of 1992. On a tonnage basis, an average of 1 ,075 tons of unders were produced weekly, amounting to 4 1 % of total tons excavated. Over the past two years, this translates to an average of 1 ,076 cubic yards of unders produced per week, or 36% of the total weekly volume excavated.
1 1

TABLE 2 - RECLAMATION HAUL TONNAGES BY VEHICLE TYPE
(Number of truck loads in brackets)
. MONTI! OPEN-TOP TONS DUMP lRUCK ROLL-OFF TONS TOTAL BIH TONS TONS
12/28/92 - Jan. 93 7,979 [400] 470 [ 65] 205 [ 1 3 ] 8,654 [478]
February 5,472 [302] 0 1 45 [ 10] 5 ,6 1 7 [3 1 2]
March 4,685 [256] 1 ,575 [20 1 ] 1 3 5 [ 8] 6,395 [465]
April 4, 1 59 [225] 3 ,559 [438] 448 [25] 8 , 166 [688]
May 4, 1 99 [226] 2,206 [30 1 ] 665 [24] 7,070 [55 1 ]
June 6,437 [349] 1 ,269 [ 1 52] 1 56 [ 10] 7,862 [5 1 1 ]
July 3 ,254 [ 1 79] 1 ,836 [237] 0 5 ,090 [ 4 1 6]
August 5,239 [287] 1 ,574 [ 1 9 1 ] 0 6,8 1 3 [478]
September 3,270 [ 1 83 ] 2 ,085 [263] 0 5,355 [446]
October 1 ,767 [ 1 0 1 ] 609 [ 73] 0 2,376 [ 1 74]
November 1 ,504 [ 1 09] 939 [ 1 30] 0 2,443 [239]
Dec. - Jan. 3, '94 1 ,003 [ 53] 1 ,385 [ 162] 1 77 [ 10] 2,565 [225]
TOTAL 48,968 [2,670] 1 7,507 [2,2 1 3 ] 1 ,93 1 [ 1 00] 68,406 [4,983]
WEEKLY 1 ,065 [58] 3 8 1 [48] 42 [ 2] 1 ,487 [ 1 08] AVERAGE (I)
% of TOTAL 7 1 .6 25.6 2.8 ----
Tonnage per load 1 8. 3 7.9 1 9.3 1 3 .7
NOTES : (1) Based on 46 weeks
c:\wpwin\data\lf\grcl-trk.093 1 2
I •
- '
-'
.J
J I
J
TABLE 3 - REClAMATION VOLUMES VS. TROMMEL PRODUCTION HOURS
Survey Period Month Vol. Production Yds per Unders Tons Excavated Hours Prod. Hr. per Prod. Hr.
(yds)
1 2128/92- 1 /7/93 ; January '93 1 5,5 1 4 1 50.5 1 03 . 1 35 .9 1 18 - 212/93
2/3 - 3/1/93 February 9,927 1 36.5 72.7 3 3 .8
312 - 3/30 March 1 1 ,407 1 70.0 67. 1 22.8
3/3 1 - 4128 April 1 1 ,669 1 62 .75 7 1 .7 29.2
4/29 - 5127 May 9,755 1 69.75 57.5 25.8
5128 - 6/30 June 1 5 , 1 94 1 65.25 9 1 .9 28.6
7/1 - 7/30 July 6,666 1 69.25 3 9.4 29.0
7/3 1 - 8/3 1 August 1 0,729 144.0 74.5 42.7
911 - 9129 September 8,226 1 1 1 . 5 73 .8 40.2
9/30 - 1 0127 October 5 ,473 54.5 1 00.4 43 .6
1 0128 - 1 1 /30 November 3 ,737 38.75 96.4 44.6
1 2/ 1 - 1 13/94 December 3 ,743 62.5 59.9 3 3 .3
TOTALS 1 1 2,040 1 ,535 .25 73 .0 32 .2
Weekly 2,436 3 3 .3 8 Average (b)
NOTES: (a)
(b) January totals include the 1 2128/92 through 1 /7/93 time period, which was 2,539 ydsJ Based on 46 weeks of production.
c:\wpwin\data\lf\greclprod.hr 1 3
Reel. Tons per
Prod. Hr.
57.5
4 1 .2
37.6
50.2
4 1 .6
47.6
30. 1
47.3
48.0
43 .6
63 .0
4 1 .0
44.6

] ..c � 0 . ... ..., g "8 a .-(1) s s � � (1) 0-00 "0 � ;>. � . ... .g S "0
- � VI � �
� (1) ..., � � � s = �
{
200
150
100
50
o
r f (
Total Waste Volume Excavated per Trommel Production Hour
r (
Jun Jul Aug Sep Oct Nov Dec Jan Feb Mar Apr May Jun Jan Feb Mar Apr May Jun Jul Aug Sep Oct Nov Dec ·
I 1992 I 1993 I Month
[iii Total Excavated Volume I
Figure 4 c:\hg3\data\gr\hlw.prs
\

{
� � 0
p:: � 0 • .-4 1) � "'C 0 �
P-t I""""'f CD S S 0 � E-4 � CD P-4 .-
-...) '''d ' CD .+J c:s � CD � CD 0 w. � 0 E-4
80
60
40
20
o
r r r
Reclaimed Waste & Unders Tonnages per Trommel Production Hour
Jan Feb Mar Apr May Jun Jul Aug Sep Oct Nov Dec Jan Feb Mar Apr May Jun Jul Aug Sep Oct Nov Dec
I 1992 I 1993 I Month
IOUnders .Reclaimed Waste I
Figure 5 c:\hg3\data\gr\hhv.prs
,

The majority of the non-combustible materials are separated from the excavated waste by the operator of the Linkbelt hydraulic excavator. In 1992, an average of 1 23 tons of non-combustibles were removed each week from the excavated material. In 1993, this average dropped 52% to 59 tons per week. The marked difference can likely be attributed to "cleaner" sections of the landfill where reclamation activities occurred. Over the past two (2) years roughly 93 tons, or 1 86 cubic yards, of non-combustibles have been re-Iandfilled during weekly reclamation production activities. This average represents only 6% of the total weekly volume excavated.
4. Downtime
Unscheduled trommel downtime for the first six (6) months of 1993 was due primarily to repairing and replacing bearings, belts, hoses and seals on the drum and conveyors; fixing the sprocket on the unders conveyor; welding bands on the rotary drum; fixing damaged screens; repairing hydraulic leaks; cleaning material from the trommel brushes; and unclogging blockages from the unders stacking conveyor. During 1992 and 1993 , unscheduled downtime averaged 1 0.7 hours per month, or approximately 45 minutes per operating day .
With the addition of several design changes discussed in Section II.A. l , unscheduled downtime was reduced 68% during the latter half of 1993. I t was also thought in early 1993 that semi-annual maintenance periods were necessary to keep the trommel functioning. The design improvements have made it possible to operate with one (1) maintenance period per year. The only major problem that persists is that the laces on the unders and refuse feeder conveyor belts tend to wear out from continued use.
Scheduled downtime consisted primarily of a daily pre-operational maintenance check by the landfill mechanic. This preventive maintenance check normally took 30 - 45 minutes. Over the past two (2) years, scheduled downtime has averaged 5 - 10 hours per month. Clean-up activities at the end of each operating day typically took one (1) hour. The design changes made in mid- 1993 led to a 35% reduction in scheduled downtime during the last six (6) months of 1 993 .
There were two (2) scheduled maintenance periods in 1 993 . The first one occurred in March and consumed 1 20 manhours. The trommel screens were removed and repaired, or replaced where necessary. Other routine maintenance tasks were performed. The second maintenance period was taken in July. A reinforcing band on the trommel drum was repaired, and other required maintenance was performed. Total downtime time consumed 65 manhours.
There have been an average of 200 trommel operating days per year for the past two (2) years . There were 4. 1 operating days per week in 1992, and 4.2 operating days per week in 1993 .
1 9


N -
r (
Reclaimed Waste Characteristics Combustibles
67.0%
Figure 6
Recyclables 3.0%
Non-Combustible 30.0%


(
100.0
Q) ......
� 10.0 00 ca � 0 � � 0 1 .0 �
ib .....
� tv £ w � 0. 1
0 .0
1993 York County (for waste dated
1993 LCSWMA (for waste dated Apr '90)
c:\hg3\data\gr\hhv.prs
(
Physical Characteristics of U nders
Soil 93.2
74.3
Rocks 2 .0
1 1 .0
P 1 . 3
5 .6
Glass 2.6
2.4
D 1993 York County (for waste dated 1977) . 1993 LCSWMA (for waste dated Apr '90)
Remainder: ShinglestTar/Asphalt,Wood,Meta1s,Organics(leaves,grass),and Styrofoam.
Plastic 0. 1
1 .4
Linoleum 0.0
1 .3
Remainder 0.8
4.0
Note: LCSWMA results above are based on four composite samples consisting offive daily grab 8I}.Illples each; York County results are based on one composite sample made from five daily grab samples.
Figure 7

C. Reclaimed Waste Characteristics
1. Material Characteristics
The three (3) by-products of trommeling excavated waste are reclaimed waste ("overs"), recovered soil ("unders"), and non-combustible, oversized material ("non-processibles"). This section addresses the physical characteristics of tne "overs"; the following section discusses the physical and chemical characteristics of the "unders".
LCSWMA landfill personnel conducted three (3) "overs" physical characterization studies in 1993 to determine the percentage of combustible, non-combustible and recyclable materials in this waste stream. The protocol governing the sampling specified that 5 -day's worth of material (one 55-gallon drum sample taken each day) be obtained. The five (5) samples were then sorted by hand using a 1 " mesh screen that had been used previously on the rotary trommel. Each o f the 5-day samples weighed from 800-1 ,000 pounds.
Sample results indicated that approximately 67% of the "overs" contained combustible material, as shown in Figure 6. Items comprising this category included paper, cloth, wood, cardboard, household trash, plastics, roofmg, insulation, newspapers and magazines. Nearly 30% of the samples contained non-combustible material consisting of soil, rocks ( 1 " - 3" and 4" - 6" rocks), non-processible construction/demolition waste, scrap porcelain, and assorted siftings that penetrated the 1 " mesh. The remaining 3% consisted of recyclable items such as aluminum, bi-metallic, and steel cans.
2. Age/State of Decomposition
During 1992, the age of the trommeled waste ranged from 1 5 to 32 months; the older waste tended to have a lower putrescible content but a higher percentage of decomposed material than the younger waste.
In 1993, the excavated waste ranged in age from 32 to 48 months. Daily logs kept by landfill operational personnel indicated that the trommeled m aterial appeared to contain 70% - 85% household trash. The operators described some noticeable decomposition during August, where the age of the excavated material was approximately three (3) years.
3. SoiVMoisture Content
As expected, the soil and moisture content of the reclaimed material varied significantly, and was fairly dependent on weather conditions. The landfill assistant manager is responsible for
· keeping the daily logs and documents
characteristics of the trommeled waste.
2 5
The trommeled material was described as being damp, with a moderate soil content, for five out of the past twelve months. Naturally, the damp observations coincided with months having substantial rainfall . The waste tended to dry out from October through January, and again in the months of May and June. The relatively high percentage of "damp" waste descriptions can be directly traced to the 82% increase in annual rainfall at the landfill from 1992 to 1993 .
Figures 1 5 and 16 show rainfall at the landfill during excavation operations and during the time the waste was initially placed in the cell.
4. Odor Control
LCSWMA first began using odor control at the Cell 1 reclamation site in 1992. Several products were tried initially. The most effective odor suppressant was found to be Neutron Industry's Lemon Squeeze. Typically, the reclaimed refuse was sprayed in the truck beds just prior to their leaving the landfill site. The odor control agent was used primarily in the Spring, Summer and Fall months when the odor was the most noticeable.
LCSWMA worked with a local manufacturer to develop a method of spraying the reclaimed material with odor suppressant as it exited the trommel barrel. A small portable spray unit was placed at the end of the trommel where the refuse fell onto the conveyor belt. Although an interesting concept, this method had no noticeable impact on controlling the material's odor.
Although the Lemon Squeeze product was tried with some success, it was found that, as the spray dried, the fragrance weakened and lost its ability to mask the odor.
In 1993 , the Authority experimented with a product from Pioneer Research called "Refresh" . This odor suppressant was used for one ( 1 ) week before it was determined that the product was ineffective and expensive.
On April 27, 1993 the Authority began using an odor suppressant from Monsanto called "Monsanto CX", and found that this product worked the best to control odors. The product was sprayed directly onto the loaded trucks, and was used with success until the second week in November, when ambient temperatures were sufficiently low and odor was no longer a problem . Average usage was roughly 40 gallons per month at a cost of approximately $700.
D. Unders/soil Characterizations
1. Physical Characterizations
LCSWMA performed quarterly physical characterizations during 1993 on the unders. Samples were taken over a five (5) consecutive day period and then composited. Sampling and analytical procedures followed a protocol developed by the Authority, which was modeled along the guidelines of EPA's SW -846. Following compo siting, the sample was then hand-sorted to physically characterize the material.
2 6

During this time period, the percentage of soil and rocks in the unders ranged from 80% to 93%, averaging 87%. The other main constituents of the unders, comprising roughly 9% of the samples, were paper, glass, plastic and linoleum.
The weight percents of materials sorted from the unders are shown in Table 4 and graphically in Figure 7.
LCSWMA also had soil classification and grain size analyses performed on the unders as well as on the virgin daily cover soil. The unders were texturally classified as a sandy loam, with a Unified Classification of "SM". The virgin daily cover soil was classified as a brown loam, having a Unified Classification of "GM". The unders physical characteristics qualified it to be used as daily cover soil per the requirements of Section 273 .232 of Pennsylvania's Municipal Waste Management Regulations, which states that daily cover must fall within the USDA textural classes of sandy loam , loam, sandy clay loam, silty clay loam, loamy sand, or silt loam. Additionally, the combustible or coal content of the daily cover material may not exceed 12% by weight.
2. Chemical Analyses
LCSWMA used an independent testing laboratory to chemically characterize the unders, the unders soil fraction, and the virgin daily cover soil. The unders soil fraction is the soil that results following the hand-sorting · activities described above. During the first two (2) quarters of 1993, LCSWMA tested the unders, the soil fraction, and daily cover soil for total metals (those listed on PaDER Form 40). The test parameters were expanded during the latter half of 1993 to include TCLP metals, asbestos, target compound list (TCL) and TCLP volatile organic compounds (VOC's), semi-volatiles, pesticideslPCB's, and other miscellaneous parameters. The expanded set of parameters are listed in Table 5 .
O n a total metals basis, the recovered unders and unders soil fraction were found to have similar chemical profiles, as expected. These materials are primarily composed of aluminum, barium, calcium, iron, magnesium, manganese, potassium, sodium, and zinc. The chemistry of the virgin daily cover soil was also fairly similar to the unders and its soil fraction, with the exception of the metal salts (calcium, magnesium, potassium, and sodium) and zinc. A comparison of the test results indicates that leaching has had an effect on the unders and the unders soil fraction. Concentrations of magnesium, potassium and sodium are 2 - 1 00 times higher in the unders/under soil fraction than in the virgin cover soil; zinc levels are 6-1 1 times higher in unders/soil fraction than cover soil, while calcium concentrations are 45-50 times higher. Chloride levels in the unders and under soil fraction ranged from 200 - 225 mg/l, but were not detected in the daily cover soil. Test results are presented in Table 6 .
Target Compound List and Toxicity Characteristic Leaching Procedure (TCLP) tests for volatile and semi-volatile compounds yielded little information. Trace concentrations of certain TCL volatile and semi-volatile compounds (butyl benzyl phthalate, bis(2-ethylhexyl)phthalate, toluene, and xylene) were detected in the unders soil fraction. Acetone, 2-butanone, toluene, and xylene were detected in the unders sample taken during the 4th quarter of 1993, but were not detected in
2 7

the unders soil fraction. It is likely that these compounds volatilized during the physical hand-sort and hence were not found. Test results are summarized in Tables 7 and 8 and in Figures 8 through 1 1 .
It is not surprising to find little evidence of semi-volatiles or volatiles in the unders. These materials are produced in an open atmosphere, and have had sufficient time to volatilize during excavation activities. AMitionally, the absence of these compounds reflect the nature of the refuse that was placed in this cell.
None of the detected concentrations exceeded regulatory limits for VOC's or metals. Herbicides (i .e., 2,4-D) were detected in the unders and unders soil fraction in the sample for the 3n1 Quarter of 1993 . PCB's, asbestos, and pesticides were not detected in any of the samples.
The chemistry of the unders as it relates to air emissions at the RRF are discussed in the next section. A comparison of the unders constituents as they relate to waste age is provided in Section IV.
2 8
N 1.0
TABLE 4 - lROMMEL UNDERS COMPOSmON BY WEIGHT PERCENT
(Average percentages of 5 consecutive daily samples, except as noted)
-----
I MATERIAL I 4th '9 1 (a) 1 st Qtr '93 (b) 2nd Qtr '93 (c) 3rd Qtr '93 (d)
Soil 79.08 64.24 78. 5 1 76 .54
Rocks 1 4.39 1 5 .05 7.75 1 1 .32
Paper 1 .48 8.50 5 .85 4.62
Textiles 1 .73 0 .36 0.2 1 0 . 1 4
Plastic 0.68 3 .20 0.96 0.90
Glass 1 .04 3 . 1 0 1 .72 3 . 1 5
Wood 0.4 1 0.78 0.79 0.77
Organics 0.55 1 .04 0.36 0 .39
Linoleum 0.25 1 .77 1 .52 0.80
StringlRope 0. 1 8 0.00 0.06 0.02
Metals 0. 1 4 1 .68 0.32 0.34
Ceramics 0.05 0.24 0. 1 9 0.27
Battery 0.00 0 .00 0.00 0.00
Other 0.02 0 .04 1 .76 0.74
NOTES: (a) Samples taken on 1 01 1 5/9 1 , and from 1 0122 - 1 0125/9 1 . Refuse age - 0 .5 - 1 year (b) Samples taken from 1 1 1 8 - 1 122/93 . Refuse age - 2 years I I months (c) Samples taken from 4126 - 4/30/93 . Refuse age - 3 years (d) Samples taken from 7/9 - 71 1 5/93 . Refuse age - 3 years 6 months (e) Samples taken from 10125 - 1 0129/93 . Refuse age - 3 years 7 months (f) Samples taken from 1 1 129 - 1 21 1 /93 , and 1 2/8 - 1 2/9/93 . Refuse age - 1 6 years
c:\wpwin\data\unders\gyorkundr.cmp
4th Qtr '93 (0)
78 .00
1 0.06
3 .32
0. 1 8
0.34
1 .56
0.46
0.42
1 .2 1
0.0 1
0. 1 6
0 .00
2.4 1
1 .87
r'
Averages YORK COUNTY (I)
75.3 93 .23
1 1 .7 1 .98
4.8 1 .25
0.5 0.04
1 .2 0 . 1 1
2. 1 2.6 1
0.6 0 .09
0.6 0 .35
1 . 1 0 .00
0. 1 0.00
0.4 0.09
0.2 0 .00
0.5 0.00
0.9 0.25
TABLE 5
ANALYTICAL PARAMETERS FOR UNDERS, UNDERS SOIL FRACTION, & VIRGIN DAILY COVER SOIL
l . Total Metals Analyses (Method 60 1 0 except as noted below) ( Method 7060 for As; 7471 for Hg; 76 1 0 for K; 7740 for Se; 7770 for Na)
AI, Sb, As, Ba, Be, Cd, Ca, Cr, Co, Cu, Fe, Pb, Mg, Mn, Hg, Mo, Ni, K, Se, Ag, Na, TI, V, Zn
2. TCLP Analyses (Method 8270 for BaselNeutrals; 8260 for Volatile Organics; 60 1 0 for Inorganics; 8080 for pesticides; SM 509B for herbicides)
TCLP Analytical Group without Matrix Spike for Soil/Solid Waste (per page 22 of Wright Lab Services' "Analytical Services Fee Schedule", effective July 1 , 1 992), including corrosivity, ignitability, and reactivity.
3 . Miscellaneous Parameters: pH, ammonia-nitrogen, chloride, % carbon, BOD, COD, total solids, total volatile solids
(Method 1 50. 1 for pH; 3 50 .3 for NH3-N; SM 507 for BOD; 325 . 3 for chloride; 4 1 0.4 for COD, 1 60.3 for total solids, 1 60.4 for total volatile solids)
4. Asbestos Parameters (Bulk Identification by Polarized Light Microscopy)
Chrysotile, amosite, crocidolite, anthophyllite, tremolite, actinolite, fibrous and nonfibrous components
5 . Target Compound List (TCL) Volatile Organics (Method 8260)
Acetone Chloroethane cis- l,3-Dichloropropene Benzene Chloroform trans- l,3-Dichloropropene Bromodichloromethane Chloromethane Ethylbenzene Bromoform Dibromochloromethane 2-Hexanone Bromomethane 1,1-Dichloroethane Methylene Chloride 2-Butanone 1,2-Dichloroethane 4-Methyl-2-pentanone (MIBK) Carbon Disulfide 1,1-Dichloroethene Styrene . Carbon Tetrachloride trans-l ,2-Dichloroethene 1,1,2,2-Tetrachloroethane Chlorobenzene 1,2-Dichloropropane
c:\wpwin\data\el\gtable-a.rcl 3 0
Tetrachloroethene Toluene 1,1,1-Trichloroethane 1,1,2-Trichloroethane Trichloroethene Vinyl Acetate Vinyl Chloride Xylenes, Total

\.
TABLE 5
Page Two
6. TeL Semi-Volatiles (Method 8270)
Acenaphthene 4-Chloro-3-Methylphenol Di-n-octyl Phthalate
Acenaphthylene 2-Chloronaphthalene 2,4-Dinitrophenol
Anthracene 2-Chlorophenol 2,4-Dinitrotoluene
Benzoic Acid 4-Chlorophenyl Phenyl Ether 2,6-Dinitrotoluene
Benzo(a)anthracene Chrysene Fluoranthene
Benzo(b )fluoranthene Dibenzo(a,h)anthracene Fluorene
Benzo(ghi)perylene Dibenzofuran Hexachlorobenzene
Benzo(k)fluoranthene 1,2-Dichlorobenzene Hexachlorobutadiene
Benzo( a )pyrene 1,3-Dichlorobenzene Hexachlorocyciopentadiene
Benzyl Alcohol 1 ,4-Dichlorobenzene Hexachloroethane
Bis(2-chloroethoxy )methane 3,3 '-Dichlorobenzidine Indeno( I ,2,3-cd)pyrene Bis(2-chloroethyl)ether 2,4-Dichlorophenol Isophorone
Bis(2-chloroisopropye )ether Diethyl Phthalate 2-Methyl-4,6-Dinitrophenol
Bis(2-ethylhexyl)phthalate 2,4-Dimethylphenol 2-Methylnaphthalene
4-Bromophenyl Phenyl Ether Dimethyl Phthalate 2-Methylphenol
Butyl Benzyl Phthalate Di-n-butyl Phthalate 4-Methylphenol
4-Chloroaniline
7. TCL Pesticides/PCB I s (Method 8080) Aldrin 4,4 '-DDE Endrin Ketone PCB- 1232
alpha-BHC 4,4 '-DDT Heptachlor PCB-I 242
beta-BHC Dieldrin Heptachlor Epoxide PCB- 1 248
gamrna-BHC (Lindane) Endosulfan I Methoxychlor PCB- 1254
delta-BHC Endosulfan II PCB- 1016 PCB-1260
Chlordane Endosulfan Sulfate PCB- 1 22 1 Toxaphene
4-4 '-DDD Endrin
Naphthalene
2-Nitroaniline
3-Nitroaniline 4-Nitroaniline
Nitrobenzene 2-Nitrophenol
4-Nitrophenol
N-Nitrosodi-n-propylamine
N-Nitrosodiphenylamine
Pentachlorophenol
Phenanthrene
Phenol
Pyrene
1,2,4-Trichlorobenzene
2,4,5-Trichlorophenol
2,4,6-Trichlorophenol
8 . Physical Characterizations: Unders physical characterization by LCSWMA staff; unders soil classification and grain size analyses.
3 1

TABLE 6 - FREY FARM LANDFILL CELL 1 TOTAL METALS ANALYSIS OF UNDERS,
UNDERS SOIL FRACTION, AND VIRGIN DAILY COVER SOIL
QUARTERLY AVERAGES FOR 1993
(Units: mglkg, dry weight basis)
PARAMETER UNDERS UNDERS SOIL FRACTION VIRGIN COVER SOIL
Aluminum 14,7.50 17,000 1 5,750
Antimony < 20 I < 18 < 18
Arsenic 1 1 .7 8.7 7.2
Barium 72..5 62.4 37
Beryllium 1.0 0.90 0.90
Cadmium 2.7 1.9 3.6
Calcium 20,2.50 18,670 413
Chromium 41 27.4 18.5
Cobalt 12.3 1 1 . .5 2 1.3
Copper 6 1.8 .5.5.1 21
Iron 37,250 36,000 39,2.50
Lead 88 . .5 53 . .5 2.5.8
Magnesium .5,17.5 3,067 1,06.5
Manganese 333 287 323
Mercury 0.63 0.46 0.24
Molybdenum < 13 < 12 < 12
Nickel 24 16 12
Potassium 1,600 1,47.5 800
Selenium < 0.70 < 2.4 < 0.63
Silver < .5.3 < 4.9 < 4.8
Sodium 1,218 1,043 14.5
Thallium 3.5 44 30
Vanadium 2 1 19 19
Zinc 33.5 6.5.5 58
pH 6.88 7.42 6. 13
I % Moisture I 23.9 I 17 . .5 I 16.2
% Carbon .
5.4 4.6 0.20
BOD (mg/kg) • 5,350 4,860 162
COD (mgll) ' 2,6.50 775 < 50
I Chloride-ASTM Leach. (mgll) • I 22.5 I 200 I < 5
NOTE: 1. Samples were a .5-day composite for unders & unders soil fraction obtained in Janull!)', April, July, and October. 2. Averages for parameters marked with an asterisk are for 2 quarters only.
c:\wpwin\data\unders\gundrav93.tbl 3 2
I I I
I
I

VJ VJ
r
TABLE 7 - FREY FARM LANDFILL CELL 1 TARGET COMPOUND LISTffCLP ANALYSES FOR
UNDERS, UNDERS SOIL FRACTION, AND VIRGIN DAILY COVER SOIL
(Units: as noted)
PARAMETER UNDERS UNDERS SOIL FRACTION
3n1 QUARTER 1993
TCL SEMI-VOLATILES (mg/kg)
Butyl benzyl phthalate 1 ,400 82
Bis (2-ethylhexyl) phthalate 200 260
TCL VOLA TILE ORGANICS (ug/kg)
Acetone 1 70
Total Xylenes 67
TCLP SEMI-VOLA TILES (ug/l)
m/p-Cresol 44
TCLP HERBICIDES (ug/l)
2,4-D 1 00 I I
TCLP METALS (mg/l)
I Arsenic 0.0 1 2 0.007
I Barium 0.30 0.39
I Cadmium 0 .0 1
I Chromium 0.03
NOTE: I . Samples were obtained from a 5-day composite for the unders & unders soil fraction.
c :\wpwin\data \unders\gundr3r93. voc
VIRGIN COVER REGULA TORY LIMITS SOIL
0.36
200,000
10,000
5.0
0 .39 I 1 00.0
I 1 .0
I 5 .0

VJ .J::..
TABLE 8 - FREY FARM LAND FILL CELL 1 TARGET COMPOUND LISTtrCLP ANALYSES FOR
UNDERS, UNDERS SOIL FRACI10N, AND VIRGIN DAILY COVER SOIL
(Units: as noted)
PARAMETER UNDERS UNDERS SOIL FRACTION
4th QUARTER 1993
TCL SEMI-VOLATILES (mg/kg)
Butyl benzyl phthalate 460 60
Bis (2-ethylhexyl) phthalate 3 50 1 40
Diethy Iphthalate 25
Fluoranthene 6
Napthalene 1 1
TCL VOL ORGANICS (ug/kg)
Acetone 8,800
2-Butanone 24,000
Toluene 1 ,000 430
Total Xylenes 1 ,900 I 1 90
TCLP METALS (mg/I) I Arsenic 0.006 0.0 1
Barium 0.28 0.4 1
I Cadmium I 0 .02 I 0.04
I Chromium I 0.03 I 0.06
I Lead I 0 . 1 7 I 0 . 1 4
NOTE: 1 . Samples were obtained from a 5-day composite for the unders & unders soil fraction.
) c:\w� ... ;n\1ata\ul'rI��\yndr4r'l"l unr
VIRGIN COVER SOIL
REGULA TORY LIMITS (mg/l)
5.0
0.3 1 1 00.0
I I 1 .0
I I 5.0
I I 5.0
I
I I I

� '$ � � bE � j
:;. V\ � 0 . ,..., � " b � Q) u � 0 C,)
r
Chemical Characterization of Unders, Unders Soil Fraction, and Virgin Cover Soil
50,000
40,000
-30,000
-20,000
10 ,000
° AI
c:\hg3\dat&\gr\hhv.prs
1 992
Ca Fe Mg K
IOUnders DUl'l.d��; Soil Fraction .Virgin Cover Soil I
Figure 8 Notes: Moisture Content:
Na
Unders=22% Unders Soil Fraction=2'1 '� Virgin Cover Soik 1 7(1·

� fn . "", ; �
� 1 § :Q � � g C)
( r
Chemical Characterization of Unders , Unders Soil Fraction, and Virgin Cover Soil
1993
50,000
40,000
30,000
20 ,000 - - - - - - - - - - - - - r-----I- - - - - - - - -
10,000
o
AI Ca Fe Mg K [Du;-d;�D-Unders Soil Fr�ti�-;'-.Virgin Cover Soil I
c:\ilg3\data\gr\hhv.prs Figure 9 Notes: Moisture Content:
Na
Unders=24% Unders Soil Fractiond 7 fY�. Virgin Cover Soil: \().2��

-
� bJl - ,... � � bE � � !
\0 � o � ce
� � Q
r
Chemical Characterization of Unders , Unders Soil Fraction, and Virgin Cover Soil
1992 400
300
200
100
o
Sb As Ba Cd Cr Co Cu Pb Mn Hg Mo Ni Ag Tl v Zn
I DUnders DUnd ers Soil Fraction .Virgin COVel' Soil I
c:\hg3\daUl.\gr\hhv.prs Figure 1 0 Notes: Moisture Content:
Unders=22% Unders Soil Fractiol1"'�� I (� Virgin Ctlv�r Soi l " J '7/f.

'Z' � ·s � �
� i � '-"
d 0 :jj C":j
� 8 § Q
(
Chemical Characterization of Unders , Unders Soil Fraction, and Virgin Cover Soil
1993 700
600
500
400
300
200
100
o
Sb As Ba Cd Cr Co Cu Pb Mn Hg Mo Ni Ag TI v Zn IDUnders DUnders Soil Fraction -Virgin Cover Soil I
e:\hg3\data\gr\hhv.prs Figure 1 1 Notes: Moisture Content:
Unders=24% Unders Soil Fraction.'17 fj'i! Virgin Cover Soil", 1 G.:?>'}!

E. Air Quality at Excavation Site
1. Initial Air Monitoring Tests
LCSWMA performed preliminary air monitoring at the Cell 1 reclamation site during May of 1992 to determine the identities and concentration levels of airborne contaminants to which workers were potentially exposed. Both area and personal samples were obtained to determine the presence of airborne volatile organic compounds (VOC's), inorganic acids/gases, and ammonia. This testing was recommended following a survey of the site by an industrial hygienist.
None of the parameters exceeded OSHA Permissible Exposure Levels (PEL's). Trace amounts of VOC's (orders of magnitude below the OSHA PEL's) were detected in both the personal and area samples, and trace levels of ammonia were detected in the personal samples. Butanoic acid (alkyl esters) was present in the highest concentration of the detected VOC's. The butanoic acid compounds are used in the manufacture of artificial rum, perfume, and artificial pineapple.
On the recommendation of the industrial hygienist who performed the original survey, LCSWMA provided reclamation employees with either full or half-face respirators fitted with organic vapor/acid gas high-efficiency particulate filters. A more thorough sampling plan was also recommended.
In October 1992, LCSWMA began a program of obtaining quarterly personal and area air samples from the reclamation site. Sampling parameters included airborne anions, ammonia and VOC's. Personal samples were collected on the operator of the CAT D8N bulldozer, and area samples were collected downwind of the trommel.
Airborne hydrochloric acid was detected in two (2) samples. The personal sample had a concentration of 1 5 0 micrograms per cubic meter of air (ug/m\ while the concentration of the area sample was 130 ug/m3 (OSHA PEL = 7,000 ug/m3). No airborne ammonia was detected. Several VOC's were detected: the highest concentrations found were methylene chloride at 37 ug/m3 (OSHA PEL = 5 00,000 ug/m3) and xylene at 27 ug/m3 (OSHA PEL of 435,000 ug/m3), which, as can be seen, were several orders of magnitude below the regulatory limits. Personal samples were again obtained in January of 1993 with results similar to the area samples taken in October 1992.
In March 1993 , the Authority reevaluated its air monitoring strategies, since health and safety concerns had been voiced regarding operations at the Authority's Transfer Station and at the Tipping Floor of the RRF. In late May 1993, LCSWMA finalized its air monitoring plans following site surveys by an industrial hygienist.
The plan consisted of the following: a) at a mlDlmum, continue quarterly monitoring at the Cell 1 reclamation site, and institute special provisions in the event a hazardous substance (i.e., asbestos, PCB's, drum or large quantity of solvent, waste or acid) was encountered; b) begin quarterly personal and area
4 3
monitoring at the Transfer Station and on the Tipping Floor at the RRF for the same parameters as had been gathered previously for Cell 1 .
The complete set of analytical parameters for the Cell 1 air monitoring is shown in Table 9. For the remainder of 1993 , LCSWMA obtained both personal and area samples in July, September, October and December. The personal samples were gathered on the operators of the Linkbelt excavator and the CAT 973 loaderID8N dozer; area samples were obtained downwind of the trommel. Additional VOC monitoring (area samples) was also performed at the areas of the Linkbelt excavator and at the "upper" excavation site, where unprocessed refuse is initially unearthed and pushed toward the Linkbelt (see Figure 1 2). The additional VOC testing was begun in September. The test results are presented in Tables 10 - 12 .
2. Personal Samples
Results of the personal samples indicated the presence of trace amounts of aldehydes (acetaldehyde, acrolein, and formaldehyde), anions (hydrochloric, nitric and sulfuric acids), barium, and several VOC's, as shown in Table 1 1 . The VOC's present in the highest concentrations were xylene, toluene, and 1 ,2,4-Trimethylbenzene. Concentrations detected were between 5 - 85 ug/m3; regulatory limits for these compounds range from 125,000 to 435,000 ug/m3 •
Of these VOC's, xylene and toluene were detected in the unders and unders soil fraction, indicating that these compounds are volatilizing from the excavated waste and trommeled soil, although not to any great degree. However, it is interesting to note that relatively high concentrations of acetone, 2-butanone, toluene and xylene were detected in the unders during sampling performed in late October 1993. Acetone and 2-butanone were not found in any of the personal or area samples obtained throughout 1993 at Cell 1 . Detected concentrations of toluene and xylene were found to be highest in the areas where initial excavating occurs, which is at the upper excavation site and in the vicinity of the Linkbelt excavator. Area concentrations at these locations have been 2 - 1 5 times higher than concentrations downwind of the trommel or in the cabs of the operating equipment, yet they still remain orders of magnitude below OSHA PEL's. Thus, volatilization is occurring, but operator exposure is not a problem .
The parameters that were detected at levels approaching OSHA PEL Action Levels (concentrations 50% of the OSHA PEL) for the personal samples were respirable dust, silica quartz, and total particulate. Silica quartz was found in two (2) of the four (4) samples taken at concentrations of from 47 - 78 ug/m3, or slightly higher than the OSHA Action Level, which is 50 ug/m3• Respirable dust was detected at concentrations ranging from 300 - 7 1 0 ug/m3, or roughly one tenth of the OSHA limit of 5 ,000 ug/m3• Total particulate concentrations varied from 300 - 1 ,000 ug/m3, well below the OSHA PEL of 1 5 ,000 ug/m3•
3. Area Samples
Results for the area samples were similar to the personal samples. Trace concentrations of aldehyde and acrolein were detected downwind of the trommel
4 4
in four (4) of the 30 samples taken. Low concentrations of hydrochloric and sulfuric acids were detected in three (3) out of 42 samples. Several VOC's were found, as indicated in Tables 1 0 and 12 . The parameters having the highest concentrations were methylene chloride, xylene, and toluene but, as with the personal samples, were detected at concentrations well below the OSHA PEL.
One (1) result exceeded the OSHA PEL. This was for silica quartz, which was detected downwind of the trommel at 190 ug/m3 (OSHA PEL = 100). Maximum total particulates detected in the area samples were 600 ug/m3, considerably below the OSHA PEL of 15 ,000 ug/m3. These results can be considered as "worst case" results since they were obtained downwind of the operating trommel.
Detectable VOC concentrations at the upper excavation site and in the area of the Linkbelt were similar, as shown in Table 12 . Concentrations of xylene, toluene, and methylene chloride were found in the greatest concentrations, but were again orders of magnitude below the regulatory limit. In general, concentrations for these parameters were, in most cases, 40% - 1 00% higher at these locations than in the downwind area and personal samples, indicating that some volatilization takes place upon initial excavation of the landfilled refuse.
In summary, then, the Cell 1 air monitoring results indicate that excavating and trommeling waste does not cause the release of a significant amount of semivolatile �r volatile compounds into the atmosphere. Many of the contaminants detected such as toluene, xylene, methylene chloride, acetone, and acrolein were also detected in the atmosphere at the Transfer Station (see Section 4 below). Cell 1 excavation and reclamation activities release a greater amount of airborne contaminants than at either the Transfer Station or the RRF, but concentration levels do not pose a threat to the health and safety of the workers.
Of greatest concern, from a health and safety standpoint, are the potential levels of total and respirable particulate that can be experienced. LCSWMA presently staffs its daily reclamation operations with two (2) personnel. These equipment operators are provided with full respiratory protection equipment, and are required to wear them when deemed necessary by the test results.
From the start of LCSWMA's reclamation project, landfill personnel have taken daily methane and oxygen readings at the reclamation site. There have been no methane exceedances to date, and oxygen readings below 19.5% have never been recorded.
In January 1994, landfill personnel began monitoring for VOC's at several locations at the reclamation site (Sites # 1 through #7 on Figure 1 2) using an HNU Model DN-1 0 1 photoionization analyzer, which provides a direct reading of a variety of ionizable gases. Typical readings to date have ranged from 0.3 to 3 . 1 ppm. The LCSWMA Trommel Operational Plan requires that respiratory protection be used if VOC levels persist above 5 ppm. The highest readings were recorded at Sites # I and #2, where the refuse is initially unearthed, and at Site #4, which is downwind of the trommel. It is interesting to note that a felt-tip marker placed near the tip of the meter causes it to go completely off-scale, which is pre-set at 200 ppm.
4 5
4. Air Quality at the Transfer Station and RRF Tipping Floor
Air monitoring was also conducted at the Authority's Transfer Station and at the RRF Tipping Floor in 1993. Personal and area samples were collected quarterly at each location.
The Transfer Station tipping area is essentially an open area, but is partially enclosed on three (3) sides, providing frontal access to the refuse pits. There is relatively free air movement throughout the ti�ping area. Trace concentrations of acetone, Freon- 1 l3 , xylene, and toluene were detected in the personal samples. Also, total particulates were detected at a concentration of 500 ug/m3, which is close to concentrations obtained for the Cell 1 personal samples.
Three (3) substances were found in the area samples. Acrolein concentrations were detected at 0.05 parts per million (ppm), which is 50% of the OSHA PEL of 0 . 1 0 ppm. Acrolein was also detected in the Cell 1 area and personal sam pies, indicating that this substance is present in MSW and not solely in reclaimed · waste (acrolein is used in the manufacture of plastics and perfumes). PCB's were found at a concentration of 14 ug/m3, which is below the regulatory limit of 1 ,000 ug/m3. Formaldehyde was also found at a concentration of 0.009 ppm, well below the OSHA PEL of 1 5 ppm. This compound was also detected in two (2) of the Cell 1 personal samples at similar concentrations.
The tipping floor at the RRF is a fully-enclosed area, with doors at either ends of the building for truck access. Combustion air is drawn from the tipping floor air space, and maintains the area at a slightly negative pressure when the access doors are closed.
Personal samples at the RRF yielded some interesting results. Concentrations of arsenic, barium, cadmium, chromium, lead and nickel were detected during the last sampling event, ranging from 0.70 - 20 ug/m3. These concentrations are well below the OSHA PEL with the exception of lead, which was measured at 19.5 ug/m3 (OSHA PEL = 50 ug/m3). Of these metals, only barium was detected at Cell 1 , and none of the metals were detected at the Transfer Station. The metals are apparently present in the refuse that is delivered directly to the RRF by private haulers. Low concentrations of VOC's such as methyl chloroform, methylene chloride, Freon- l l , toluene, and xylene were detected. Similar concentrations of these compounds, with the exception of toluene, were detected in the Cell 1 personal samples. Toluene concentrations at Cell 1 were, on average, 13 times higher than the tipping floor results, . indicating that this compound has volatilized by the time the waste reaches the RRF.
The air contaminants found in the highest concentrations in the personal samples were total and respirable dust. Respirable dust concentrations ranged from 5 00 to 3,200 ug/m3, which, for one (1) sampling event, exceeded the OSHA Action Level. Ranges for total particulates were 1 ,300 to 1 1 ,200 ug/m3, exceeding the recommended OSHA Action Level of 7,500 ug/m3 on two (2) occasions. The highest reading occurred during an extremely dry period in early March when the tipping floor dust suppression system was inoperable.
4 6

\
, l L
( L
! l
Tipping floor area sample results showed low concentrations of acetaldehyde, acrolein, benzaldehyde, and isovaleraldehyde, as well as hydrochloric acid. These substances were also detected at Cell 1 . Respirable dust levels were detected at 800 ug/m3 •
4 7
$
_ttrml.dW
SITE o
REQAIIM:D 500l
STOCKPILE AREA
() LANCASTER coutm' SOLID WA�STEijMAjjNijAGiiEMjiE�NT AUTHORrrY _
1299 tWlR1SElJR(; PII<[. P.O. BOX 4425 • LmCASTER, PA 1 7604 . (717) 397-9968
FREY FARM LANDFILL - CELL 1 RECLAMATION LAYOUT
_�_---"t_y_:_r')"'�d��� r� c O ' I � rTE : -, / 1 6/9 "
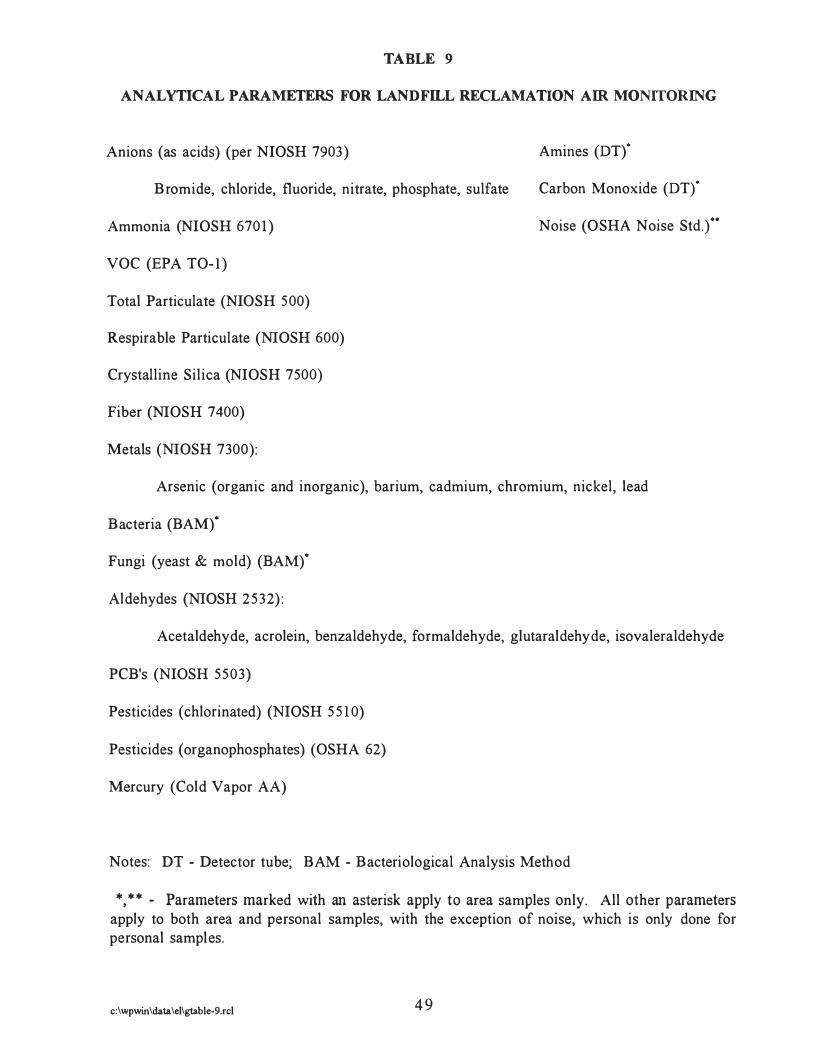
l
TABLE 9
ANALYTICAL PARAMETERS FOR LANDFILL RECLAMATION AIR MONITORING
Anions (as acids) (per NIOSH 7903) Amines (DT)"
Bromide, chloride, fluoride, nitrate, phosphate, sulfate Carbon Monoxide (DT)·
Ammonia (NIOSH 670 1 ) Noise (OSHA Noise StdY·
VOC (EPA TO-I )
Total Particulate (NIOSH 500)
Respirable Particulate (NIOSH 600)
Crystalline Silica (NIOSH 7500)
Fiber (NIOSH 7400)
Metals (NIOSH 7300):
Arsenic (organic and inorganic), barium, cadmium, chromium, nickel, lead
Bacteria (BAM)·
Fungi (yeast & mold) (BAM)"
Aldehydes (NIOSH 2532) :
Acetaldehyde, acrolein, benzaldehyde, formaldehyde, glutaraldehyde, isovaleraldehyde
PCB's (NIOSH 5503)
Pesticides (chlorinated) (NIOSH 5 5 1 0)
Pesticides (organophosphates) (OSHA 62)
Mercury (Cold Vapor AA)
Notes: DT - Detector tube; BAM - Bacteriological Analysis Method
* , * * - Parameters marked with an asterisk apply to area samples only. All other parameters apply to both area and personal samples, with the exception of noise, which is only done for personal samples.
c:\wpwin\data\el\gtabJe-9.rcl 4 9
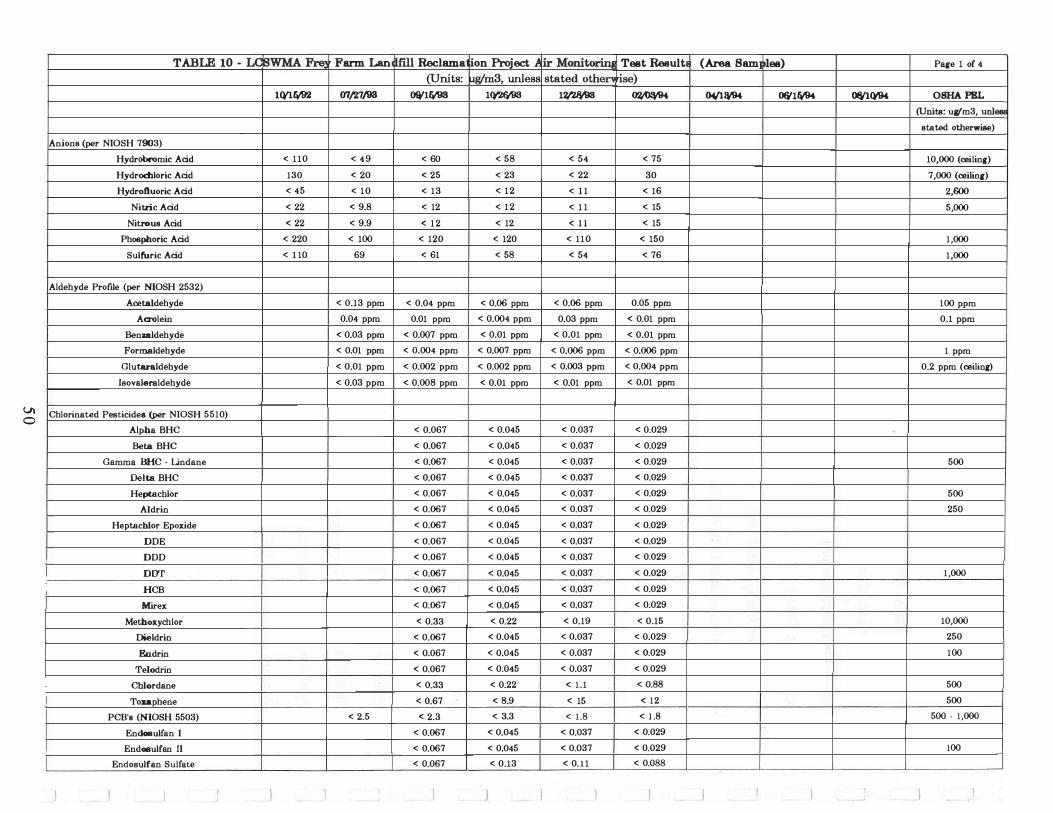
U\ o
! I
TABLE 10 - LC
Anions (per NIOSH 7903)
Hydrobromic Acid
Hydrochloric Acid
Hydrofluoric Acid
Nitric Acid
Nitrous Acid
Phosphoric Acid
Sulfuric Acid
Aldehyde Profile (per NIOSH 2532)
Acetaldehyde
Acrolein
Benzaldehyde
Formaldehyde
Glutaraldehyde
Isovaleraldehyde
Chlorinated Pesticides (per NIOSH 5510)
Alpha BHC
Beta BHC
Gamma BHC - Lindane
Delta BHC
Heptachlor
Aldrin
Heptachlor EpOxide
DDE
DDD
DDT
HCB
Mirex
Methoxychlor
Dieldrin
Endrin
TeIodrin
Chlordane
To_phene
PCB's (NIOSH 5503)
EndoBulfan I
EndG8ul fan II
Endosulfan Sulfate --------- --
�WMA � Farm Lan �ll Reclama (Units:
UVllV'92 07m/93 OIVIM18
< 110 < 49 < 60
130 < 20 < 25
< 45 < 10 < 13
< 22 < 9.8 < 12
< 22 < 9.9 < 12
< 220 < 100 < 120
< l lO 69 < 61
< 0.13 ppm < 0.04 ppm
0.04 ppm 0.01 ppm
< 0.03 ppm < 0.007 ppm
< 0.01 ppm < 0.004 ppm
< 0.01 ppm < 0.002 ppm
< 0.03 ppm < 0.008 ppm
< 0.067
< 0.067
< 0.067
< 0.067
< 0.067
< 0.067
< 0.067
< 0.067
< 0.067
< 0.067
< 0.067
< 0.067
< 0.33
< 0.067
< 0.067
< 0.067
< 0.33
< 0.67
< 2.5 < 2.3
< 0.067
< 0.067
< 0.067
ion Project }, � Monitorlnj Teet Result (Area Sam lee) Page 1 of 4
uglm3, unless stated othen rise) l� l� 0'JI0lV94 04/l� 0fV1� 0!Vl� OSHA PBL
(Unita: ugm3, unl_
stated otherwise)
< 58 < 54 < 75 10,000 (ceiling)
< 23 < 22 30 7,000 (ceiling)
< 12 < l l < 16 2,600
< 12 < 1 1 < 15 5,000
< 12 < l l < 15
< 120 < 110 < 150 1 ,000
< 58 < 54 < 76 1,000
< 0.06 ppm < 0.06 ppm 0.05 ppm 100 ppm
< 0.004 ppm 0.03 ppm < 0.01 ppm 0.1 ppm
< 0.01 ppm < 0.01 ppm < 0.01 ppm
< 0.007 ppm < 0.006 ppm < 0.006 ppm 1 ppm
< 0.002 ppm < 0.003 ppm < 0.004 ppm 0.2 ppm (ceiling)
< 0.01 ppm < 0.01 ppm < 0.01 ppm
< 0.045 < 0.037 < 0.029
< 0.045 < 0.037 < 0.029
< 0.045 < 0.037 < 0.029 500
< 0.045 < 0.037 < 0.029
< 0.045 < 0.037 < 0.029 500
< 0.045 < 0.037 < 0.029 250
< 0.045 < 0.037 < 0.029
< 0.045 < 0.037 < 0.029
< 0.045 < 0.037 < 0.029
< 0.045 < 0.037 < 0.029 1 ,000
< 0.045 < 0.037 < 0.029
< 0.045 < 0.037 < 0.029
< 0.22 < 0.19 < 0.15 10,000
< 0.045 < 0.037 < 0.029 250
< 0.045 < 0.037 < 0.029 100
< 0.045 < 0.037 < 0.029
< 0.22 < 1 .1 < 0.88 500
< 8.9 < 15 < 12 500
< 3.3 < 1 .8 < 1 .8 500 · 1,000
< 0.045 < 0.037 < 0.029
< 0.045 < 0.037 < 0.029 100
< 0.13 < 0.1 1 < 0.088
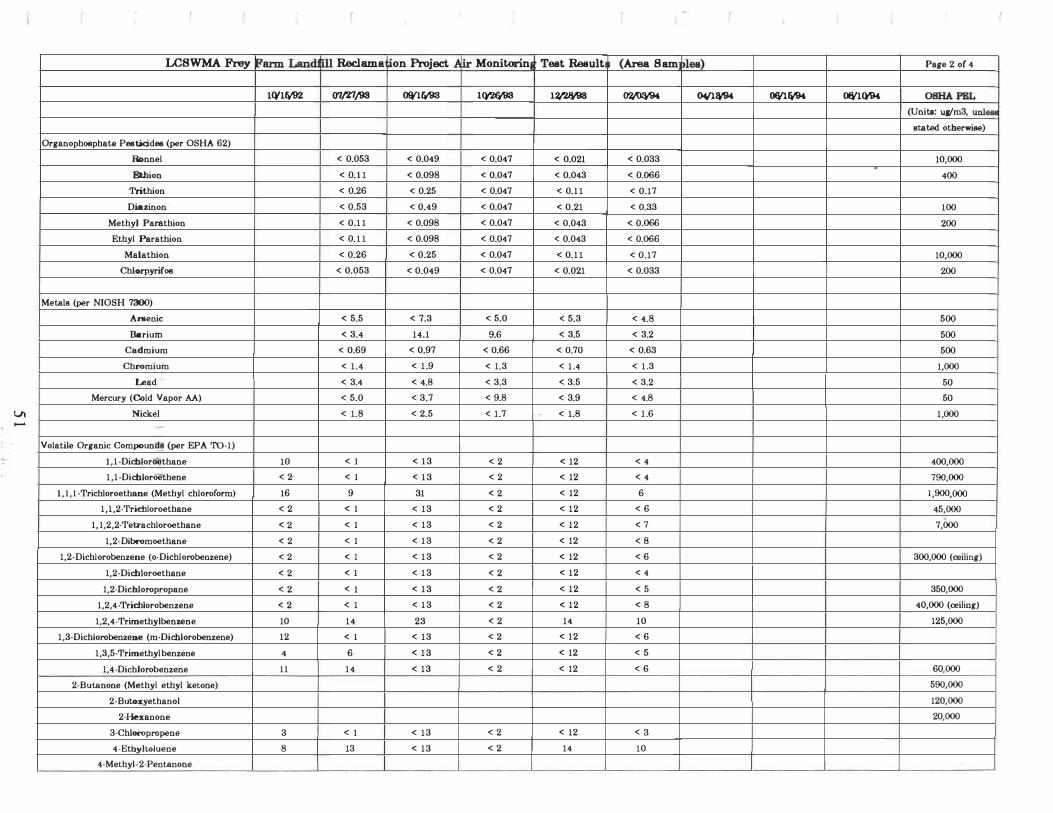
U\ -
LCSWMA Frey
Organophosphate Pesticides (per OSHA 62)
Ronnel
Ethion
Trithion
Diuinon
Methyl Parathion
Ethyl Parathion
Malathion
Chlorpyrifos
Metals (per NIOSH 73(0)
Arsenic
Barium
Cadmium
Chromium
Lead
Mercury (Cold Vapor AA) Nicker
-
Volatile Organic Compounas (per EPA TO·1)
l ,l ·Dichloroethane
1,l·Dichloroethene
l ,I , I ·Trichloroethane (Methyl chloroform)
l,l,2·Tridlloroethane
1, I,2,2·Tetzachloroethane
1,2·Dibromoethane
1,2·Dichlorobenzene (o·Dichlorobenzene)
l,2·Dicbloroethane
1,2·Dichloropropane
1,2,4·Trichlorobenzene
1,2,4·Trimethylbenzene
1,3·Dichlorobenzene (m·Dichlorobenzene)
1,3,5·Trimethyl benzene
1,4·Dichlorobenzene
2·Butanone (Methyl ethyl ketone)
2·Butoxyethanol
2·Hexanone
3·Chloropropene
4·Etbyltoluene
4·Methyl-2·Pentanone
Farm LandJ �ll Reclama ion Project },
1<V11V92 CfT/'J:1f9S 0!Vl1V9S
< 0.053 < 0.049
< 0.1 1 < 0.098
< 0.26 < 0.25
< 0.53 < 0.49
< 0.1 1 < 0.098
< 0.1 1 < 0.098
< 0.26 < 0.25
< 0.053 < 0.049
< 5.5 < 7.3
< 3.4 14.1
< 0.69 < 0.97
< 1.4 < 1 .9
< 3.4 < 4.8
< 5.0 < 3.7
< 1.8 < 2.5
10 < I < 1 3
< 2· < I < 1 3
16 9 31
< 2 < I < 13
< 2 < I < 13
< 2 < I < 1 3
< 2 < I < 1 3
< 2 < I < 1 3
< 2 < I < 1 3
< 2 < 1 < 1 3
10 14 23
12 < I < 13
4 6 < 1 3
II 14 < 13
3 < I < 13
8 13 < 13
r
[ir Monitorin Test Result (Area Sam �les) Page 2 of 4
1� 1� � «W1� 1MV1� OfVlIVIK OSHA PEL
(Units: ug/m3, unle81
ststed otherwise)
< 0.047 < 0.021 < 0.033 10,000
< 0.047 < 0.043 < 0.066 400
< 0.047 < 0.1 1 < 0.17
< 0.047 < 0.21 < 0.33 100
< 0.047 < 0.043 < 0.066 200
< 0.047 < 0.043 < 0.066
< 0.047 < 0.1 1 < 0.17 10,000
< 0.047 < 0.021 < 0.033 200
< 5.0 < 5.3 < 4.8 500
9.6 < 3.5 < 3.2 500
< 0.66 < 0.70 < 0.63 500
< 1.3 < 1 .4 < 1 .3 1,000
< 3.3 < 3.5 < 3.2 50
< 9.8 < 3.9 < 4.8 50
< 1.7 < 1.8 < 1 .6 1,000
< 2 < 12 < 4 400,000
< 2 < 12 < 4 790,000
< 2 < 12 6 1,900,000
< 2 < 12 < 6 45,000
< 2 < 12 < 7 7,000
< 2 < 12 < 8
< 2 < 12 < 6 300,000 (ceiling)
< 2 < 12 < 4
< 2 < 12 < 5 350,000
< 2 < 12 < 8 40,000 (ceiling)
< 2 14 10 125,000
< 2 < 12 < 6
< 2 < 12 < 5
< 2 < 12 < 6 60,000
590,000
120,000
20,000
< 2 < 12 < 3
< 2 14 10
.-

VI tv
I
LCSWMA Frey
cis-l,2-Dichloroethene
cis-l,3-Dichloropropene
trans-l,3-Dichloropropene
Acetone
Benzene
Benzyl Chloride
Bromodichloromethane
Bromofonn
Bromomethane
Butanoic acid, alkyl ester
Butanoic acid, ethyl ester
Butanoic acid, propyl ester
Camphene
Carbon Disulfide
Carbon Tetrachloride
Chlorobenzene
Chloroethane
Chlorofonn (Trichloromethane)
Chloromethane
Dibromocl!loromethane
Dichloromethane (Methylene Chloride)
Ethylbenzene
Freon-I I (Trichlorofluoromethane)
Freon-12 (Dichlorodifluoromethane)
Freon-1 13 (l,1,2-Trichloro-l,2,2-trifluoroethane)
Freon-1 14 (1,2-Dichlorotetrafluoroethane)
Hexachlorobutsdiene
Limonene
m!p-Xylene (1,:Yl,4-Dimethylbenzene)
o-Xylene (l,2-Dimethylbenzene)
Xylenes (Total)
Styrene
Tetrachloroethene
Toluene
Trichloroethene
Vinyl Acetste
Vinyl Chloride
Farm LandJ �ll Reclama ion Project ),
1<V1� OOm19S OWICV"93
< 2 < 1 < 1 3
< 2 < 1 < 1 3
< 2 < 1 < 1 3
2 < 1 < 13
< 2 < 1 < 13
< 1 < 13
< 2 < 1 < 13
< 2 < 1 < 13
< 1 < 13
< 2 < 1 15
< 1 < 13
37 27 23
8 8 18
58 22
< 1 < 13
11 1 1 4 25
< 1 < 13
< 2 < 1 <13
18 23 45
9 8 18
27 31 63
8 4 19
8 2 14
15 38 1 10
5 2 44
< 1 <13
ill" Monitorinf Test Result (Area Sam �les) Page 3 of 4
IIVlEV98 l� � 1W1� 0IVlfV94 0IVl1VIU OSHA PEL
(Units: ur/m3, unl_
stated otherwise)
< 2 < 12 < 4
< 2 < 1 2 < 5
< 2 < 12 < 5
I,BOO,OOO
< 2 < 12 < 3 3,250
< 2 < 12 < 6 5,000
5,000
< 2 < 12 < 4
12,000
< 2 < 12 < 7 12,600
< 2 < 12 < 5 350,000
< 2 < 12 < 3
< 2 < 12 < 5 9,780
< 2 < 12 < 2
< 2 < 12 8 500,000
< 2 17 10 435,000
< 2 < 12 < 6 5,SOO,OOO (ceiling)
< 2 < 12 5 4,950,000
< 2 < 12 < 8 7,600,000
< 2 < 12 < 8
< 2 < 12 < 12 240
3 51 25 435,000
< 2 17 10 435,000
3 68 35 435,000
< 2 < 12 10 215,000
< 2 < 12 < 7 170,000
4 75 76 375,000
< 2 < 12 < 6 270,000
30,000
< 2 < 12 < 3 1 ppm --- --- --
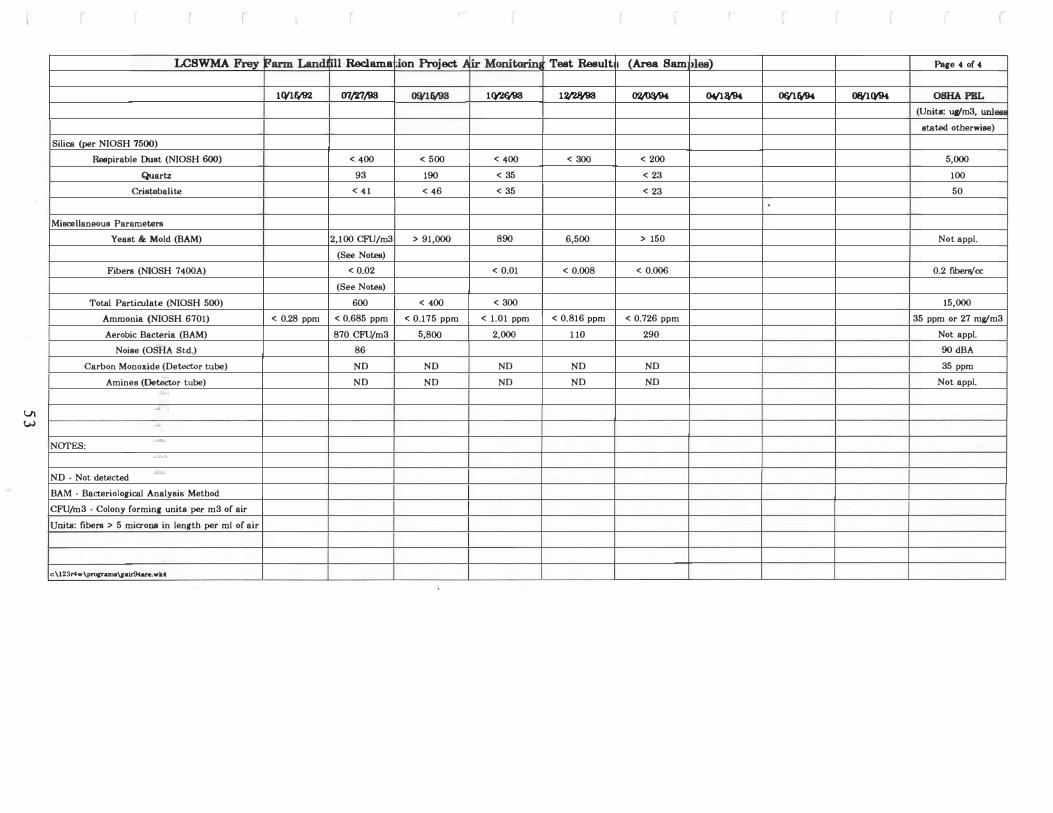
Ul (,;J
LCSWMA Frey
Silica (per NIOSH 7500)
Respirable Dust (NIOSH 6(0) Quartz
Criatobalite
Miscellaneous Parameters
Yeast & Mold (BAM)
Fibers (NIOSH 7400A)
Total Particulate (NIOSH 5(0)
Ammonia (NIOSH 6701)
Aerobic Bacteria (BAM)
Noise (OSHA Std.)
Carbon Monoxide (Detector tube)
Amines (Detector tube)
--
NarES: --. �
ND - Not detected
BAM - Bacteriological Analysis Method
CFU/m3 - Colony forming units per m3 of air
,U nits: fibers > 5 microns in length per ml of air
c:\123"',,\proeraDUl\a"aiJ"94are.wk4
Farm LandJ III Reclama ion Project )
IIVlIV92 CYTp:T198 0I¥1�
< 400 < 500
93 190
< 4 1 < 46
2,100 CFU/m3 > 91,000
(See Notee)
< 0.02
(See Notee)
600 < 400
< 0.28 ppm < 0.685 ppm < 0.175 ppm
870 CFU/m3 5,800
86
NO ND
NO NO
(
� Monitorlnj Test Result (Area Sam �les) Page 4 of 4
l� l� � 0fIllV94 0IV1� 0fV1!V94 OSHA PEL
(Units: u�m3, unl_
stated otherwise)
< 400 < 300 < 200 5,000
< 35 < 23 100
< 35 < 23 50
890 6,500 > 150 Not appl.
< 0.01 < 0.008 < 0.006 0.2 fibenVcc
< 300 15,000
< 1.01 ppm < 0.816 ppm < 0.726 ppm 35 ppm or 27 m�m3
2,000 1 10 290 Not appl.
90 dBA
NO NO NO 35 ppm
NO NO NO Not appl.
---- ----
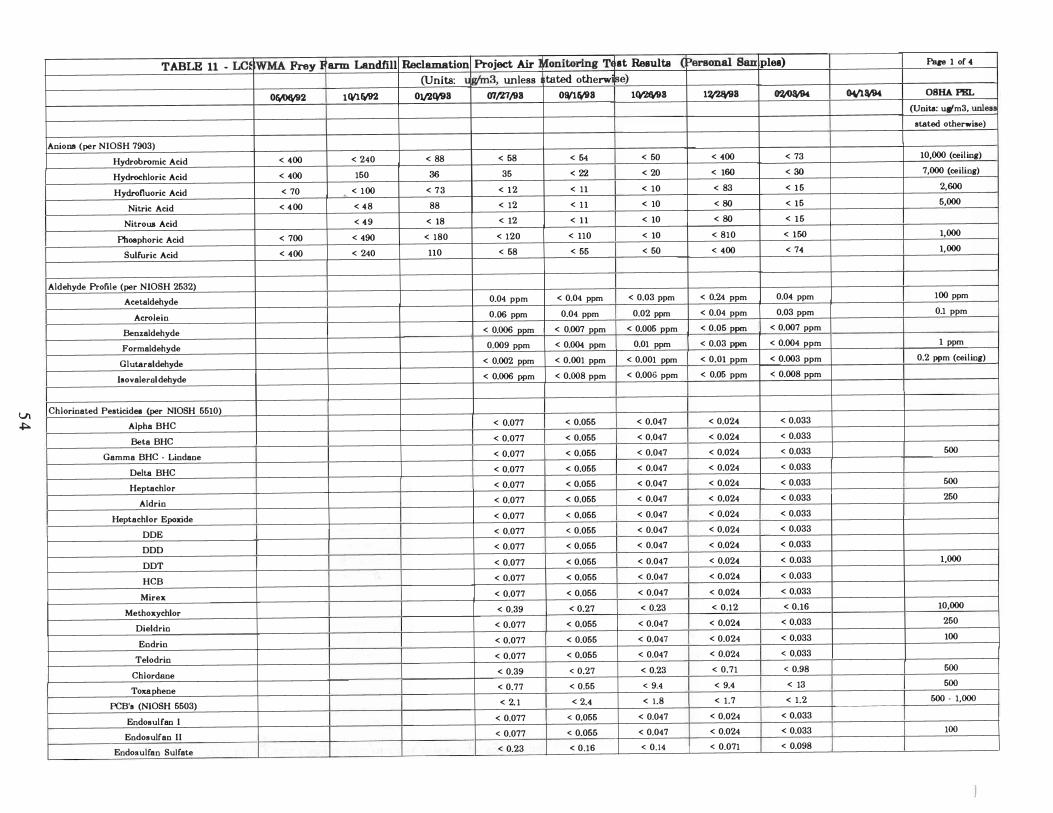
Ul +--
TABLE 11 - LC.
Anions (per NIOSH 7903)
Hydrobromic Acid
Hydrochloric Acid
Hydrofluoric Acid
Nitric Acid
Nitrous Acid
Phosphoric Acid
Sulfuric Acid
Aldehyde Profile (per NIOSH 2532)
Acetaldehyde
Acrolein
Benzaldehyde
Formaldehyde
Glutaraldehyde
Isovaleroldehyde
Chlorinated Pesticides (per NIOSH 5510)
Alpha BHC
Beta BHC
Gamma BHC . Lindane
Delta BHC
Heptachlor
Aldrin
Heptachlor Epoxide
DDE
DDD
DDT
HCB
Mirex
Methoxychlor
Dieldrin
Endrin
Telodrin
Chlordane
Toxaphene
PCB's (NIOSH 5503)
Endo8 ul fan I
Endosulfan II
Endosulfan Sulfate
IWM.A Frey I arm Landfill
O�2 1CVl�
< 400 < 240
< 400 150
< 70 < 100
< 400 < 48
< 49
< 700 < 490
< 400 < 240
Reclamation Project Air �onitoring T (Units: t g/m3, unless tated otherw
01l21V98 07/27/98 09(11V98
< 88 < 68 < 64
36 35 < 22
< 73 < 12 < 11
88 < 12 < 11
< 18 < 12 < 11
< 180 < 120 < 110
110 < 68 < 55
0.04 ppm < 0.04 ppm
0.06 ppm 0.04 ppm
< 0.006 ppm < 0.007 ppm
0.009 ppm < 0.004 ppm
< 0.002 ppm < 0.001 ppm
< 0.006 ppm < 0.008 ppm
< 0.077 < 0.055
< 0.077 < 0.055
< 0.077 < 0.055
< 0.077 < 0.055
< 0.077 < 0.055
< 0.077 < 0.055
< 0.077 < 0.055
< 0.077 < 0.055
< 0.077 < 0.055
< 0.077 < 0.055
< 0.077 < 0.055
< 0.077 < 0.055
< 0.39 < 0.27
< 0.077 < 0.055
< 0.077 < 0.055
< 0.077 < 0.065
< 0.39 < 0.27
< 0.77 < 0.55
< 2. 1 < 2.4
< 0.077 < 0.055
< 0.077 < 0.056
< 0.23 < 0.16
at Results ( Personal San plea) Pal" l of 4
�e) 1�3 1112&'98 � 0f/llV94 08HA PBL
(Units: uw'm3, unlosl stated otherwise)
< 50 < 400 < 73 10,000 (ceiling)
< 20 < 160 < 30 7,000 (ceiling)
< 10 < 83 < 15 2,600
< 10 < 80 < 15 5,000
< 10 < 80 < 15
< 10 < 810 < 150 1,000
< 50 < 400 < 74 1,000
< 0.03 ppm < 0.24 ppm 0.04 ppm 100 ppm
0.02 ppm < 0.04 ppm 0.03 ppm 0.1 ppm
< 0.005 ppm < 0.05 ppm < 0.007 ppm
0.01 ppm < 0.03 ppm < 0.004 ppm 1 ppm
< 0.001 ppm < 0.01 ppm < 0.003 ppm 0.2 ppm (ceiling)
< 0.006 ppm < 0.05 ppm < 0.008 ppm
< 0.047 < 0.024 < 0.033
< 0.047 < 0.024 < 0.033
< 0.047 < 0.024 < 0.033 500 < 0.047 < 0.024 < 0.033
< 0.047 < 0.024 < 0.033 500 < 0.047 < 0.024 < 0.033 250
< 0.047 < 0.024 < 0.033
< 0.047 < 0.024 < 0.033
< 0.047 < 0.024 < 0.033
< 0.047 < 0.024 < 0.033 1,000
< 0.047 < 0.024 < 0.033
< 0.047 < 0.024 < 0.033
< 0.23 < 0.12 < 0.16 10,000
< 0.047 < 0.024 < 0.033 250
< 0.047 < 0.024 < 0.033 100
< 0.047 < 0.024 < 0.033
< 0.23 < 0.71 < 0.98 500
< 9.4 < 9.4 < 13 500
< 1.8 < 1.7 < 1.2 500 . 1,000
< 0.047 < 0.024 < 0.033
< 0.047 < 0.024 < 0.033 100
< 0.14 < 0.071 < 0.098
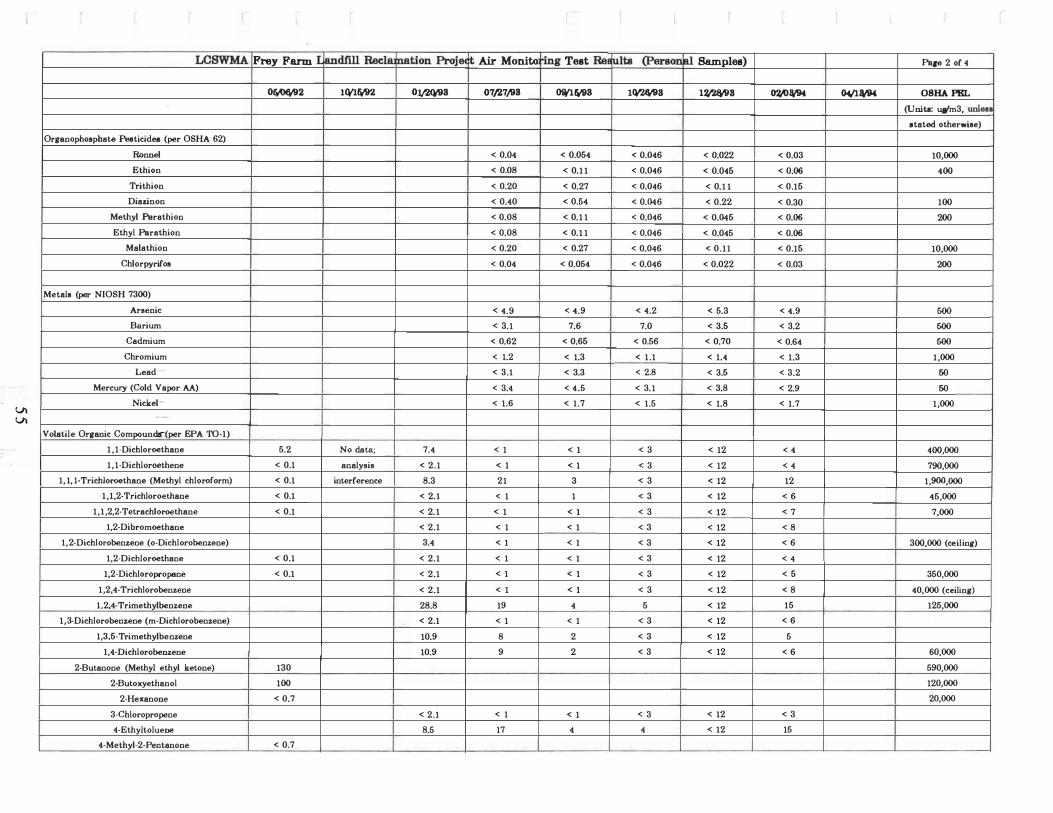
U\ U\
r
LCSWMA
Organ.oph.osphata Pesticides (per OSHA 62)
Ronnel
Ethi.on
Trithi.on
Diaueon
Methyl Parathi.on
Ethyl Parathion
Malathion
Chlorpyrifos
Metals (per NIOSH 7300)
Arsenic
Barium
Cadmium
Chromium
Lead
Mercury (Cold Vapor AA) Nickel-
--
Volatile Organic Compounds-(per EPA T().1)
1 . 1·Dichloroethane
1. 1-Dichloroothene
1. 1. I-Trichloroethane (Methyl chloroform)
1.1.2-Trichloroethane
1.1.2.2-Tetrachloroethane
1.2-Dibromoethane
1.2-Dichlorobenzene (o-Dichlorobenzene)
1.2·Dichloroethane
1.2-Dichl.oropropane
1.2.4-Trichlorobenzene
1.2.4-Trimethylbenzene
1.3-Dichlorobenzene (m-Dichlorobenzene)
1.3.6-Trimethylbenzene
1.4-Dichlorobenzene
2-Butanone (Methyl ethyl ketone)
2-Butoxyethanol
2-Hexanone
3-Chloropropene
4-Ethyltoluene
4-Methyl-2-Pentanone
Frey Farm I
0�2
5.2
< 0.1
< 0.1
< 0.1
< 0.1
< 0.1
< 0.1
130
100
< 0.7
< 0.7
�dfill Reclill nation Projei � Air Monito
HVl!V92 0l/llV98 07/27/98
< 0.04
< 0.08
< 0.20
< 0.40
< 0.08
< 0.08
< 0.20 '
< 0.04
< 4.9
< 3. 1
< 0.62
< 1.2
< 3.1
< 3.4
< 1.6
No data; 7.4 < 1
analysis < 2 . 1 < 1
interference 8.3 21
< 2. 1 < 1
< 2. 1 < 1
< 2.1 < 1
3.4 < 1
< 2.1 < 1
< 2.1 < 1
< 2.1 < 1
28.8 19
< 2.1 < 1
10.9 8
10.9 9
< 2.1 < 1
8.5 17
iing Test Res ulta (person III Samples)
0iVl1V98 IlVl6t'98 1�8
< 0.054 < 0.046 < 0.022
< 0.1 1 < 0.046 < 0.046
< 0.27 < 0.046 < 0.1 1
< 0.54 < 0.046 < 0.22
< 0.1 1 < 0.046 < 0.046
< 0.1 1 < 0.046 < 0.045
< 0.27 < 0.046 < 0.11
< 0.054 < 0.046 < 0.022
< 4.9 < 4.2 < 5.3
7.6 7.0 < 3.6
< 0.66 < 0.56 < 0.70
< 1.3 < 1 .1 < 1.4
< 3.3 < 2.8 < 3.6
< 4.5 < 3. 1 < 3.8
< 1.7 < 1.5 < 1.8
< 1 < 3 < 12
< 1 < 3 < 12
3 < 3 < 12
1 < 3 < 12
< 1 < 3 < 12
< 1 < 3 < 12
< 1 < 3 < 12
< 1 < 3 < 12
< 1 < 3 < 12
< 1 < 3 < 12
4 5 < 12
< 1 < 3 < 12
2 < 3 < 12
2 < 3 < 12
< 1 < 3 < 12
4 4 < 12
�lV94 0411lV9'
< 0.03
< 0.06
< 0.16
< 0.30
< 0.06
< 0.06
< 0.16
< 0.03
< 4.9
< 3.2
< 0.64
< 1.3
< 3.2
< 2.9
< 1.7
< 4
< 4
12
< 6
< 7
< 8
< 6
< 4
< 6
< 8
15
< 6
5
< 6
< 3
15
Pa,e 2 .of 4
08HA PBL (Units: u .... m3. unIea,
stated .otherwise)
10.000
400
100
200
10.000
200
600 600 600
1.000
60
60
1.000
400.000
790.000
1.900.000
45.000
7.000
300.000 (ceiling)
360.000
40.000 (ceiling)
125.000
60.000
590.000
120.000
20.000

U\ 0\
LCSWMA
cis-l,2-Dic:hloroethene
cia-l,3-Diehloropropene
trans-l,3-Di<:hloropropene
Acetone
Benzene
Benzyl Chloride
Bromooichloromethane
Bromoform
Bromomethane
Butanoic acid, alkyl ester
Butanoic acid, ethyl ester
Butanoic acid, propyl ester
Camphene
Carbon Disulfide
Carbon Tetrachloride
Chlorobenzene
Chloroethane
Chloroform (Trichloromethane)
Chloromethane
Dibromochloromethane
Dichloromethane (Methylene Chloride)
Ethylbenzene
Freon-11 (Trichlorofl uoromethane)
Freon-12 (Dichlorodifluoromethane)
Freon-113 (1,1,2-Trichloro-l,2,2-trifluoroethane)
Freon-114 (1,2-Dichlorotetrafluoroethane)
Hexachlorobutadiene
Limooene
rrv'p-Xylene (1,;V1,4-Dimethylbenzene)
o-Xylene (1,2-Dimethylbenzene)
Xylenes (Total)
Styrene
Tetrachloroethene
Toluene
Trichloroethene
Vinyl Acetate
Vinyl Chloride
Frey Farm I andfill Reela: !nation Projec � Air Monito
O� UV1� OJll(V93 07j'J:1/98
< 2_1 < 1
< 0.1 < 2.1 < 1
< 0.1 < 2.1 < 1
10
1.4 4.2 < 1
< 2.1 < 1
< 0.1
< 0.1
< 1
300
71
53
66
0.3
< 0.1 < 2.1 < 1
< 0.1 < 2.1 < 1
< 2.1 < 1
< 0.1 < 2.1 < 1
< 2.1 < 1
< 0.1
11 11.6 2
1 1 18.8 20
7 21
< 1
2.8 7
< 1
< 2.1 < 1
70
25.9 44
25.5 15
38 51.4 59
4.8 8 6.7 5
7.6 12.9 14
85 16.8 35
2.4 5.8 2
< 0.7
< 2.1 < 1
ing Test Rei ult& (penon �l Samples) Page 3 of 4
09/11V98 1�8 1�8 �lV94 0411lV94 08HA FBL (Units: Ult'm3, unIe,"
stated otherwise)
< 1 < 3 < 12 < 4
< 1 < 3 < 12 < 5
< 1 < 3 < 12 < 5
1,800,000
3 8 < 12 6 3,250
< 1 < 3 < 12 < 6 5,000
5,000
< 1 < 3 < 12 < 4
12,000
< 1 < 3 < 12 < 7 12,600
3 < 3 < 12 < 5 350,000
< 1 < 3 < 12 < 3
< 1 < 3 < 12 < 5 9,780
8 < 12 < 2
< 1 < 3 < 12 16 600,000
5 4 < 12 10 435,000
1 < 3 < 12 12 5,600,000 (ceiling)
< 3 < 12 25 4,950,000
< 1 < 3 < 12 56 7,600,000
< 3 < 12 < 8
< 1 < 3 < 12 < 12 240
6 13 < 12 40 435,000
3 < 3 < 12 10 435,000
9 13 < 12 50 435,000
4 6 < 12 10 215,000
2 < 3 < 12 < 7 170,000
9 24 26 76 375,000
1 < 3 < 12 < 6 270,000
30,000
<1 < 3 < 12 < 3 1 ppm
U\ --l
LCSWMA
Silica (per NIOSH 7500)
Respirable Dust (NIOSH 600)
Quartz
Cristobalite
Miscellaneous Parameters
Fibers (NIOSH 7400A)
Total Particulate (NIOSH 500) Ammonia (NIOSH 6701)
Noise (OSHA Std.)
e:\123r4w\prof'ramI\aair94.pn.w1i.40
Frey Farm I ancIrill Reela
O� 11Vlrv'92
0.70 mwm3 < 0.57 ppm
nation Projec � Air Monito ing Te8t Re!
Ol/l«V93 07/27/93 0Wl1V93
< 400 < 300
78 < 34
< 39 < 34
< 0.006
600 < 1.5 mWm3 < 0.773 ppm < 0.158 ppm
82 87
ulta (penon !al Sample8) Page 4 of 4
1CVltV93 1�3 �lV94 CWllV94 08HA PBL (Units: uw'm3, unless
stated otherwise)
710 Sampling 300 5,000
< 66 Problems 47 100
< '1:1 . < 23 50
< 0.007 < 0.007 < 0.005 0.2 fibero,lcc
700 300 1000 15,000
< 0.55 ppm < 4.54 ppm < 0.906 ppm 35 ppm or '1:1 mWm3
90 dBA

U\ 00
TABLE 12 · LC Additional VOC Area Testing
Volatile Organic Compounds (per EPA TO·1)
1 , I·Dichloroethane
1,1· Dichloroethene
1,1,1·Trichloroethane (Methyl chloroform)
1,1 ,2·Trichl oroethane
1,1,2,2· Tetrachloroethane
1,2·Dibromoethane
.1,2·Dichlorobenzene (o·Dichlorobenzene)
1,2·Dichloroethane
1,2·Dichloropropane
1,2,4·Trichlorobenzene
1,2,4·Trimethylbenzene
1,3·Dichlorobenzene (m·Dichlorobenzene)
1,3,5·Trimethylbenzene
1,4·Dichlorobenzene
2·Butanone (Methyl ethyl ketone)
2·Butoxyethanol
2·Hexanone
3·Chloropropene
4·Ethyltoluene
4·Methyl-2·Pentanone
cis·l ,2·Dichloroethene
cis·l,3·Dichloropropene
trans·l ,3·Dichloropropene
Acetone
Benzene
Benzyl Chloride
Bromodichloromethane
Bromoform
Bromomethane
Butanoic acid, alkyl ester
Butanoic acid, ethyl ester
Butanoic acid, propyl ester
Camphene
Carbon Disulfide
Carbon Tetrachloride
SWMA � Farm Lan
0IV1MlS Ilftl&'9S At Linkbelt At Linkbelt
< 13 < 1 4
< 13 < 14
< 13 24
< 13 < 14
< 13 < 14
< 13 < 14
< 13 < 14
< 13 < 14
< 13 < 14
18 < 14
43 19
< 13 < 14
21 < 14
< 13 < 14
< 13 < 14
48 23
< 13 < 14
< 13 < 14
< 13 < 14
< 13 < 14
< 13 < 14
< 13 < 14
< 13 < 14
�ll Reclamll ion Project AJ Monitoring Teat Result! (Area Sam lea) Pap 1 of 2
(Units: ug/m3, u nless stated othen ise)
1� l� � � 04/l� 1MV1� Wl� OSHA PEL
At Linkbelt At Upper Excav. At Linkbelt At Upper Excav. (Units: ug/m3, unles
stated otherwise)
< 13 < 12 < 4 < 4 400,000
< 13 < 12 < 4 < 4 790,000
< 13 < 12 < 6 < 6 1,900,000
< 13 < 12 < 6 < 6 45,000
< 1 3 < 1 2 < 7 < 7 7,000
< 1 3 < 1 2 < 8 < 8
< 13 < 12 < 6 < 6 300,000 (ceiling)
< 13 < 12 < 4 < 4
< 13 < 12 < 5 < 5 350,000
< 13 < 12 < 8 < 8 40,000 (ceiling)
< 13 < 12 < 5 < 5 125,000
< 13 < 12 < 6 < 6
< 13 < 12 < 5 < 5
< 13 < 12 < 6 < 6 60,000
590,000
120,000
20,000
< 13 < 12 < 3 < 3
< 13 < 12 < 5 < 5
< 13 < 12 < 4 < 4
< 13 < 12 < 5 < 5
< 1 3 < 12 < 5 < 5
1,800,000
< 13 < 12 < 3 < 3 3,250
< 13 < 12 < 6 < 6 5,000
I 5,000
< 13 < 12 < 4 < 4
12,000
< 13 < 12 < 7 < 7 12,600
VI \0
LCSWMI
Additional VOC Area Testinr
Cblorobenzene
Cbloroetbane
Cbloroform (Trichlorometbane)
Cbloromethane
Dibromocbloromethane
Dichlorometbane (Methylene Cbloride)
Ethylbenzene
Freon·l l (Trichlorofluoromethane)
Freon·12 (Dichlorodifluorometbane)
Freon·113 (1,1,2-Trichloro-1,2,2-trifluoroethane)
Freon-1l4 (l,2-Dicblorotetrafluoroethane)
Hexachlorobutadiene
Limonene
nVp-Xylene (1,W1,4-Dimethylbenzene)
o-Xylene (1,2-Dimethylbenzene)
Xylenes (Total)
Styren�
Tetrachloroetbene
Toluene
Trichloroetbene
Vinyl Ace�te
Vinyl Chloride
c:\123r4w\programs\gaddl-voc.wk4
Frey F8I'Il Landfill R eclamation P
0!VlCv'93 1� 1� At Linkbelt At Linkbelt At Linkbelt
< 13 < 1 4 < 13
< 13 < 1 4 < 13
< 13 < 1 4 < 13
< 13 < 1 4 < 13
20 2 1 2 3
25 22 < 1 3
1 8 120 < 13
< 13 20 < 13
< 13 < 1 4 < 13
< 13 < 1 4 < 13
< 13 < 14 < 13
65 73 25
24 24 < 13
89 97 25
33 20 < 13
< 13 31 < 13
210 170 58
< 13 < 14 < 13
< 13 < 14 < 13
roject Air Mon toring Test ilesulta (Are Samples) Pare 2 of 2
1� � ()']JO.'V94 0fIl� 0IVliW' 0EVl� OSHA PEL At Upper Excav. At Linkbelt At Upper Excav. (Unita: ugfm3, unles
stated otherwise)
< 12 < 5 < 5 350,000
'" 12 < 3 < 3
< 12 < 5 < 5 9,780
< 12 < 2 < 2
30 < 4 < 4 500,000
< 12 < 5 < 5 435,000
< 12 < 6 54 5,600,000 (ceiling)
< 12 < 5 < 5 4,950,000
< 12 < 8 < 8 7,600,000
< 12 < 8 < 8
< 12 < 12 < 12 240
27 10 5 435,000
< 12 < 5 < 5 435,000
27 10 5 435,000
< 12 < 5 < 5 215,000
< 12 < 7 < 7 170,000
56 28 20 375,000
< 12 < 6 < 6 270,000
30,000
< 12 < 3 < 3 1 ppm
III. Resource Recovery Facility Impacts
Ogden Martin Systems of Lancaster (OMSL) has a 20-year contract with the Authority to operate the RRF. OMSL management and operations personnel were consulted to determine how processing reclaimed waste has affected the facility. The general consensus is that processing this material impacts pit management practices, boiler wear and tear, air pollution control equipment, and residue handling equipment.
A. Operational Concerns
1 . Pit Management/Combustion
In addition to its normal MSW waste stream, the Lancaster RRF processes 25 -30 tons per day of shredded tires (higher heating value (HHV) = 12,000 to 15 ,000 BTU/pound) and wood chips (HHV = 8,000 BTU/pound) to enhance the BTU value of the reclaimed waste. Maintaining efficient combustion when processing reclaimed waste requires that it be mixed thoroughly with the other elements of the waste stream in the refuse pit due to its relatively low heating value. Normal MSW and reclaimed waste is presently mixed in the pit by the crane operator and burned at a ratio of approximately 4: 1 by weight.
One irrefutable aspect of processing reclaimed waste at this facility is that the refuse cranes have been overstressed. This is due to two (2) factors : a) the weight (density) of the material is higher than normal MSW due to its soil and moisture content; b) the amount of mixing required by the reclaimed material translates into more wear and tear on the cranes.
The refuse cranes at the Lancaster facility have a 22,000 pound capacity; the crane weight alone is 13 ,500 pounds, which leaves 8,500 pounds as the device's maximum load. It has not been uncommon, operators say, to have grapple loads of landfill weigh from 1 0,000 - 1 2,000 pounds when mixing and feeding reclaimed material. The excess weight has taken its toll on the gear boxes for both cranes' holding and closing motors. All four (4) gear boxes, which have a normal service life of 1 0 years, will be rebuilt after three (3) years of service. There has also been excessive wear on the bridge and trolley wheels. OMSL estimates that 30% additional crane work is required when processing landfill waste.
OMSL operators have been processing reclaimed waste for the past three (3) years and have become accustomed to the material. It is common knowledge to all OMSL operations staff that this waste stream must be mixed thoroughly in the pit prior to it being charged to the furnaces . There are no reports, however, that the material has led to combustion problems, despite its relatively high soil and moisture content. The practice of mixing the reclaimed waste in an approximate 4 : 1 ratio with the other components of the RRF's waste stream (MSW, tire chips, wood chips, and selected residual wastes) has proven to be an effective com bustion practice.
6 0

2. Boiler Wear and Tear
OMSL reports that reclaimed refuse has lead to increased wear on the feed chute hoppers, the feed tables, and at certain points in the flue gas paths.
OMSL's Maintenance Supervisor has noticed increased wear in the areas where the MSW-reclaimed material . mixture impinges on metal surfaces prior to combustion - i.e., in the feed chute hoppers and on the feed tables. It is believed that the abrasiveness of this material, due to its soil and partially decomposed refuse content, is responsible for the erosion of metal. The feed chute hoppers and feed tables on all three (3) units at the facility have been replated after approximately three (3) years of service, compared to a normal replacement of every five (5) years.
Another factor causing boiler wear is stoker operational run time. OMSL states that the grate run time is 1 0% - 1 5% higher when the landfill-MSW mix is being processed because refuse bed depths on the grates tend to build up due to the density of the material. Interestingly enough, however, is that there has not been a noticeable increase in wear on the grate bars. This may be due, in part, to the material properties of the bars. The increased stoker run time, nevertheless, will have a cumulative effect over time (i.e., decrease in service life). Longer stoker run time will also entail higher maintenance costs.
OMSL also feels that the landfill material, with its high particulate content, has contributed to plugging of the economizers and fly ash build-up in the gas paths and baghouses. On several occasions OMSL has had a subcontractor on-site to perform on-line cleaning of the economizers. Although the landfill material adds to the particulate loading in these areas, it is not the sole contributor. The furnace lime injection system also contributes to the added particulate loading. There has also been additional wear in the areas of the refractory, temperature thermocouples, and overfire air nozzles.
3. Air Pollution Control (APC) Equipment
The higher particulate loading on the APe system caused by processing reclaimed waste has lead to higher than normal wear on the spray dryer absorber and the baghouses.
OMSL maintenance personnel have noticed that increased levels of particulates have eroded vanes on the "hanging cone", or the lower portion of the atomizer.
OMSL also estimates that expenses for baghouse maintenance (i.e., bag replacement) were 35% higher than at two (2) other comparable Ogden plants due to the increased particulate loading from the landfill material. This, in tum, may require a complete replacement of bags every two years instead of every three years.
6 1
4. Residue Handling System
OMSL reports that expenses for repairs to the residue handling system at this facility are 50% higher than at two other comparable facilities due to erosion of conveying equipment by the abrasive ash. The erosion cannot, however, be solely blamed on reclaimed material.
The Lancaster RRF is one of two (2) Ogden facilities that employ fumace lime injection for control of acid gases. This naturally leads to an ash residue that has a higher lime content than other facilities. Lime is an abrasive, corrosive material. The soil content of reclaimed waste contributes to the abrasiveness of the residue, but is not the sole factor. However, the soil content of reclaimed waste does account for the higher ash generation rates experienced at the facility. Ash generation rates for 1993 were 29. 1 % of processed refuse, which is roughly 5% - 7% higher than at facilities that process strictly MSW. The end result is that the conveying systems are experiencing additional wear. The most noticeable erosion occurred on the main vibrating conveyor. The conveyor was replaced after l .5 years of service. Under normal operating conditions, the main conveyor should last 3-4 years.
B. Fuel Values
1 . Energy Value of the Fuel Mixture
One of the most important aspects of any reclamation project is to attempt to determine, as accurately as possible, the higher heating value (HHV) of the reclaimed waste stream .
Ogden Martin Systems of Lancaster (OMSL), operators of the LCSWMA's Resource Recovery Facility, use a method known as the "Specific Steam Correlation Method" for calculating the HHV of the entire fuel mixture processed by the boilers. ! This method is currently used monthly to determine the HHV of the fuel mix processed at the Lancaster facility.
A total of 383,975 tons of refuse were accepted at the facility during 1993 . Approximately 1 ,625 tons were judged to be non-processible; thus, 382,350 tons of acceptable waste were processed, an increase of 5 .8% over 1992. Roughly 1 7.7% of this total, or 67,488 tons, were delivered from Cell 1 of the Authority's Frey Farm Landfill. The reclaimed tonnage is 12 .4% lower than in 1992 due to a 6% decrease in the number of operating weeks and to production limitations imposed by RRF refuse pit inventories. An additional 4,768 tons (l .2%) of reclaimed material were delivered from the York County Landfill during the test bum of this material (see discussion in Section IV). Of the remaining tons, 70.8% was municipal solid waste (MSW), 6.7% was wood and processible construction/demolition (C/O) waste, 2 . 1% was tire chips, l .2% was residual/pharmaceutical waste, and 0.3% was paper. These percentages are similar to those achieved in 1992, with the exception of the residual/pharmaceutical category. MSW deliveries in 1992 accounted for 70.9% of deliveries. Other percentages were as follows: reclaimed = 2 l .3%; tire chips = l .8%; wood/proc. C/O = 5 .5%; paper = 0.3%; and residuals = 0.2%.
6 2

The average HHV of the entire fuel mixture for 1993, as calculated by OMSL using the steam correlation method, was 5 ,059 BTU per pound. This value is roughly 4% higher than that achieved in 1992. Waste stream heating values are shown graphically in Figure 13 .
OMSL also performed three (3) 8-hour boiler-as-a-calorimeter tests (BCT) to determine the HHV of the refuse mixture of regular MSW, reclaimed waste, shredded tires and wood chips. The BCT method is based on the concept of a bomb calorimeter, which is used for the laboratory determination of a material's heating value. The average HHV of the fuel mixture from the three tests was 5 , 12 1 BTU per pound, or roughly 1 .2% higher than the HHV of the fuel mixture using the steam correlation method.
2. Energy Value of Reclaimed Waste by the BCT Method
In February 1993 , OMSL conducted an 8-hour boiler calorimetry test in a unit that was fired with 100% reclaimed waste. The HHV of the reclaimed waste was found to be 3,084 BTU per pound. This value is 2 . 1% less than the average value for 1993 calculated as described below in Section 3 .
An additional boiler calorimetry test was attempted on a unit dedicated to processing 1 00% reclaimed waste. The HHV obtained during this test was only 1 ,897 BTU per pound. However, the test was aborted after five (5) hours due to operational problems. The refuse mix continued to bum past the normal combustion zone, in the transition between the last grate run and the clinker roller. The test was halted to reduce the possibility of damage to the stoker. It is believed that an unusually high soil content of the material led to the combustion difficulties.
3. Calculation of Reclaimed Waste HHV
Throughout 1993 , LCSWMA used a program it devised to estimate the HHV of material currently being reclaimed from Cell 1 of its Frey Farm Landfill. This program was also used to estimate the HHV of the waste reclaimed from the York site. A brief description of the program is given below.
Each month, the LCSWMA Weighmaster Program provides a detailed printout of all of the materials that are accepted at each of its facilities. For the purposes of determining the monthly reclaimed waste HHV, it is assumed that the refuse accepted at the facility is comprised of the following material types: MSW; reclaimed waste; wood and processible CID debris; tire chips; paper; residuals; pharmaceuticals; and non-processibles.
Further assumptions are also made concerning the HHV for each of these waste streams. The HHV for residuals, pharmaceuticals, wood, and processible CID is assumed to be 8,000 BTU per pound (wood is normally in the 7,000 - 9,000 range; residuals and pharmaceuticals range from 4,700 to 1 8,000). The HHV of tire chips is assumed to be 12,500 BTU per pound, and the HHV of paper is assumed to be 6,500 BTU per pound. These assumptions are based on information contained in published texts .2•M
6 3
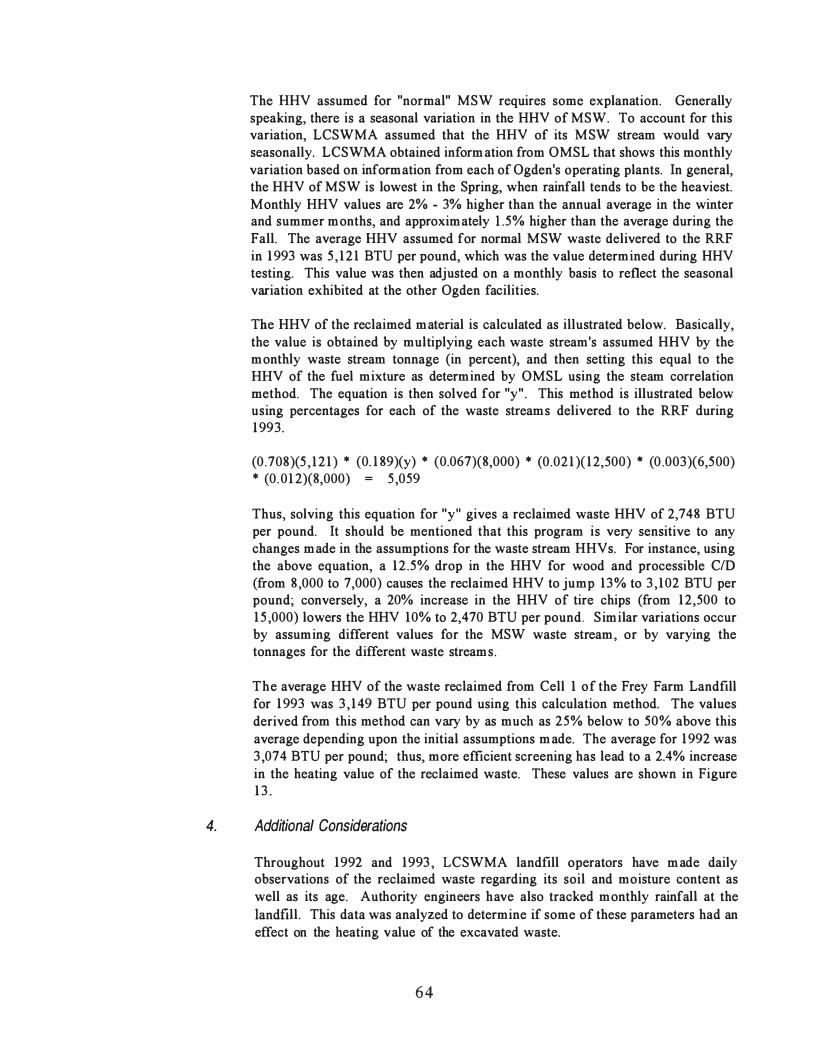
The HHV assumed for "normal" MSW requires some explanation. Generally speaking, there is a seasonal variation in the HHV of MSW. To account for this variation, LCSWMA assumed that the HHV of its MSW stream would vary seasonally. LCSWMA obtained information from OMSL that shows this monthly variation based on information from each of Ogden's operating plants. In general, the HHV of MSW is lowest in the Spring, when rainfall tends to be the heaviest. Monthly HHV values are 2% - 3% higher than the annual average in the winter and summer months, and approximately l .5% higher than the average during the Fall. The average HHV assumed for normal MSW waste delivered to the RRF in 1993 was 5 , 12 1 BTU per pound, which was the value determined during HHV testing. This value was then adjusted on a monthly basis to reflect the seasonal variation exhibited at the other Ogden facilities.
The HHV of the reclaimed material is calculated as illustrated below. Basically, the value is obtained by multiplying each waste stream's assumed HHV by the monthly waste stream tonnage (in percent), and then setting this equal to the HHV of the fuel mixture as determined by OMSL using the steam correlation method. The equation is then solved for "y" . This method is illustrated below using percentages for each of the waste streams delivered to the RRF during 1993.
(0 .708)(5 , 12 1 ) * (0. 1 89)(y) * (0.067)(8,000) * (0.02 1 )( 12,500) * (0 .003)(6,500) * (0.01 2)(8,000) = 5 ,059
Thus, solving this equation for "y" gives a reclaimed waste HHV of 2,748 BTU per pound. It should be mentioned that this program is very sensitive to any changes made in the assumptions for the waste stream HHVs. For instance, using the above equation, a 12 .5% drop in the HHV for wood and processible CID (from 8,000 to 7,000) causes the reclaimed HHV to jump 13% to 3 , 102 BTU per pound; conversely, a 20% increase in the HHV of tire chips (from 12,500 to 1 5 ,000) lowers the HHV 10% to 2,470 BTU per pound. Similar variations occur by assuming different values for the MSW waste stream, or by varying the tonnages for the different waste streams.
The average HHV of the waste reclaimed from Cell 1 of the Frey Farm Landfill for 1993 was 3 , 149 BTU per pound using this calculation method. The values derived from this method can vary by as much as 25% below to 50% above this average depending upon the initial assumptions made. The average for 1992 was 3,074 BTU per pound; thus, more efficient screening has lead to a 2.4% increase in the heating value of the reclaimed waste. These values are shown in Figure 1 3 .
4. Additional Considerations
Throughout 1992 and 1993 , LCSWMA landfill operators have made daily observations of the reclaimed waste regarding its soil and moisture content as well as its age. Authority engineers have also tracked monthly rainfall at the landfill. This data was analyzed to determine if some of these parameters had an effect on the heating value of the excavated waste.
6 4

There appears to be no correlation between the HHV of reclaimed waste and rainfall at the time of waste excavation; there is also no correlation between the material's HHV and rainfall at the time the waste was initially landfilled. These relationships are plotted in Figures 1 5 and 1 6.
There is an apparent relationship between reclaimed refuse HHV and waste age (see Figure 14). This trend was more evident during the latter half of 1993, as the waste age approached four (4) years. The calculated landfill HHV was roughly 1 8% lower during the last six (6) months of 1993 than the first six (6) months; the average age of the refuse during this time period was 24% older than the previous six (6) months. The relationship between waste age and reclaimed waste HHV is discussed further in Section IV.
6 5


,-... rJJ. "'0 � ro rJJ. � 0 ,..q E-4 '-"
..0 � -� .+J � (]) � ...-I
0\ ro -....J :>-
b.O .S .+J ro (]) ::q
6
5
4
3
2
1
o
WASTE STREAM HEATING VALUES
-. .� . . � . .• . . � . . �:-e e e· . ..---. . •. -� . .
+" -* ,-t
. , -tc
/' ;f-.
. �-\
_ _ _ _ / . ' ........ + ...1- --+ / + + - , - - - --t: - -� -+ " ./ \
- - - - - - - - - - \ -
/ � -f . . ... . . ' '1'- - :k - -
+ - +. - -
- - - -'+ \
/ \ - M I - -
- J -/
\ I \ /
- - , +
\
•
Sep Oct Nov Dec Jan Feb Mar Apr May Jun Jul Aug Sep Oct Nov Dec Jan Feb Mar Apr May Jun Jul Aug Sep Oct Nov Dec 1991 I 1992 I 1993
Month
• HHV of total waste stream using Steam Correlation Method i-trHV ofrec1aimed waste stream using LCSWMA calculation method .Measured HHV of total waste stream using Boiler Calorimetry Method .Measured HHV ofrec1aimed waste stream using Boiler Calorimetry Method • York County LF HHV (15-20 yr. old waste)
Notes: 1 . ) HHV's assumed as follows in Btu'sllb. - Current MSW - 5,121 - Tires - 1 2,500 - Wood - 8,000
Paper - 6,500 - Residuals - 8,000
c:\hg3\data\gr\hhv.prs Figure 1 3
( I

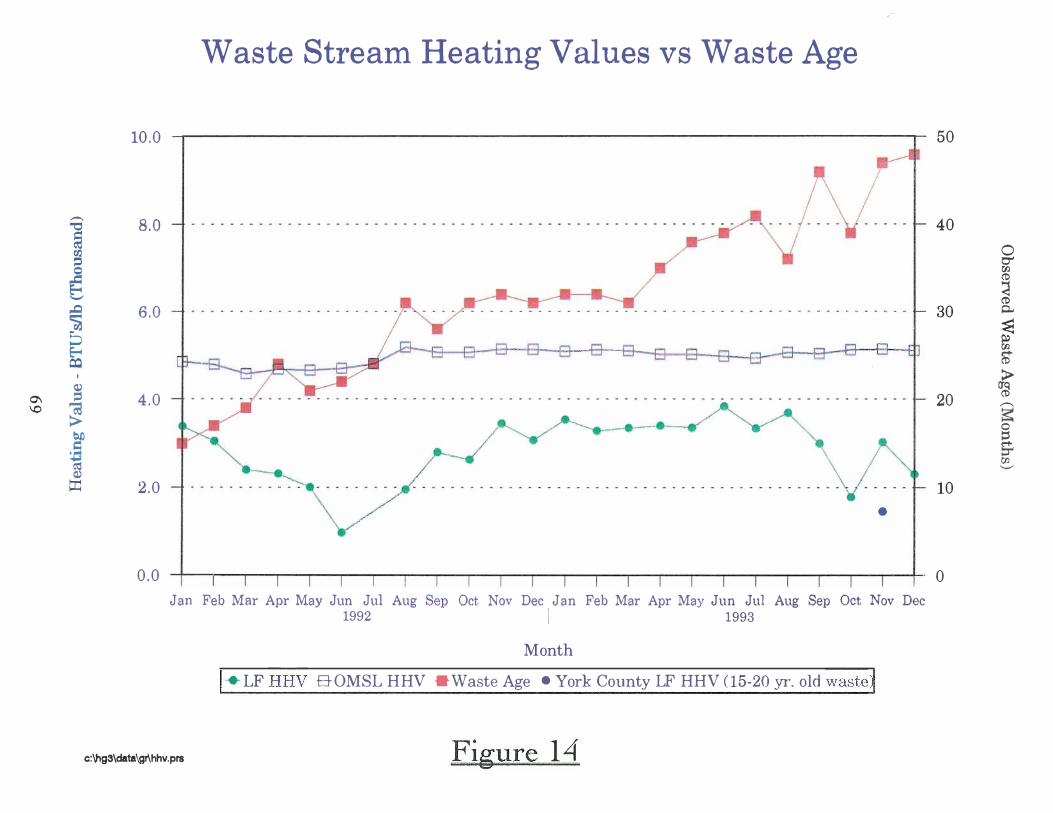
0\ 1.0
,-.. 1 � � � � �
I
� � J � Q,) ::r:1
(0 ,-
Waste Stream Heating Values VB Waste Age
10 .0 50
B .O
6 . 0
4 . 0
2 . 0
0 . 0
Jd--&-B--G G -D 0 0 -0 D n . � 8 0 --s--
.,-�-tr
,/ •
Jan Feb Mar Apr May Jun Jul Aug Sep Oct Nov Dec Jan Feb Mar Apr May Jun Jul Aug Sep Oct Nov Dec 1992 I 1993
Month / .. LF HHV B-OMSL HHV .Waste Age . York County LF HHV ( 15-20 yr. old waste]
40
30
20
10
o
c:\hg3\data\gr\hhv.prs Figure 14
o 0'" 00
S � 0..
� 00 S-� �
g= � rn '-"

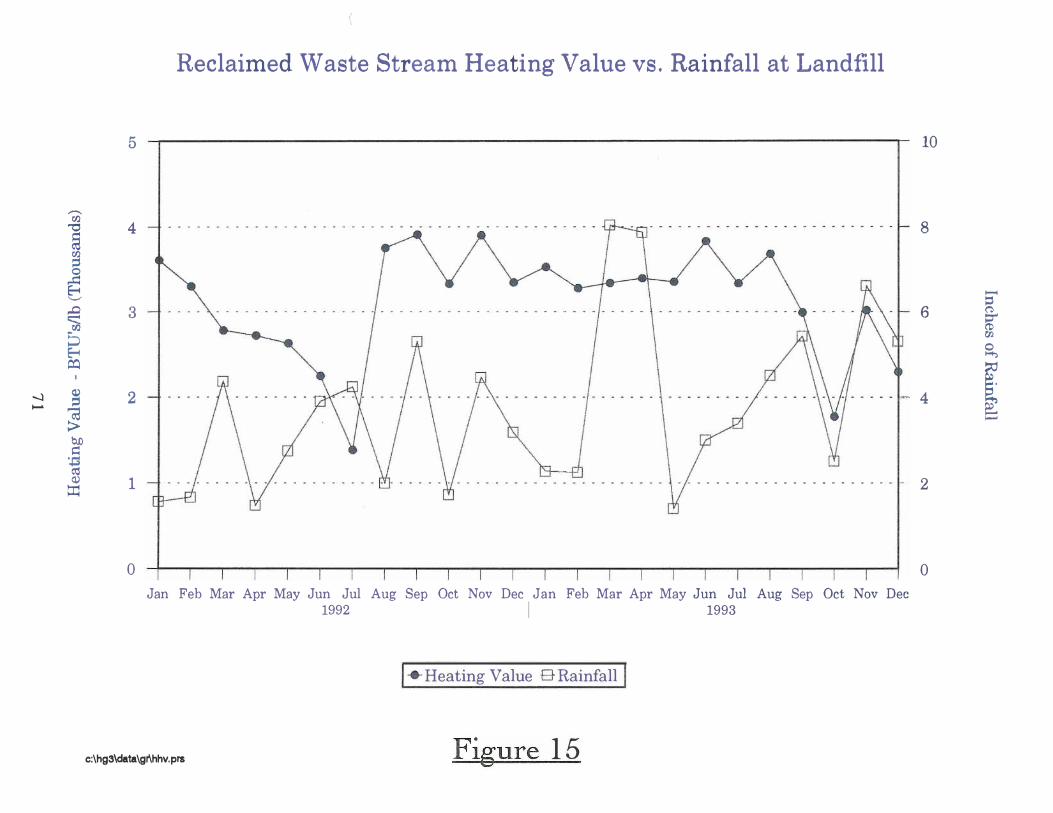
,........ (/.) '"0 § (/.) g � '-"
,.Q � � �
......:J � - � bJJ � '.+j � (1) ::r:1
I
5
4
3
2
1
o
{ /
Reclaimed Waste Stream Heating Value vs . Rainfall at Landfill
10
8
6
4
- ,- - - - - - - - - - - - - - - - - - - - - - .- 2
Jan Feb Mar Apr May Jun Jul Aug Sep Oct Nov Dec Jan Feb Mar Apr May Jun Jul Aug Sep Oct Nov Dec 1992 I 1993
r. Heating Value B Rainfall I
o
c:\hg3\data\gr\hhv.prs Figure 1 5
( 00 o I-t')
[ �

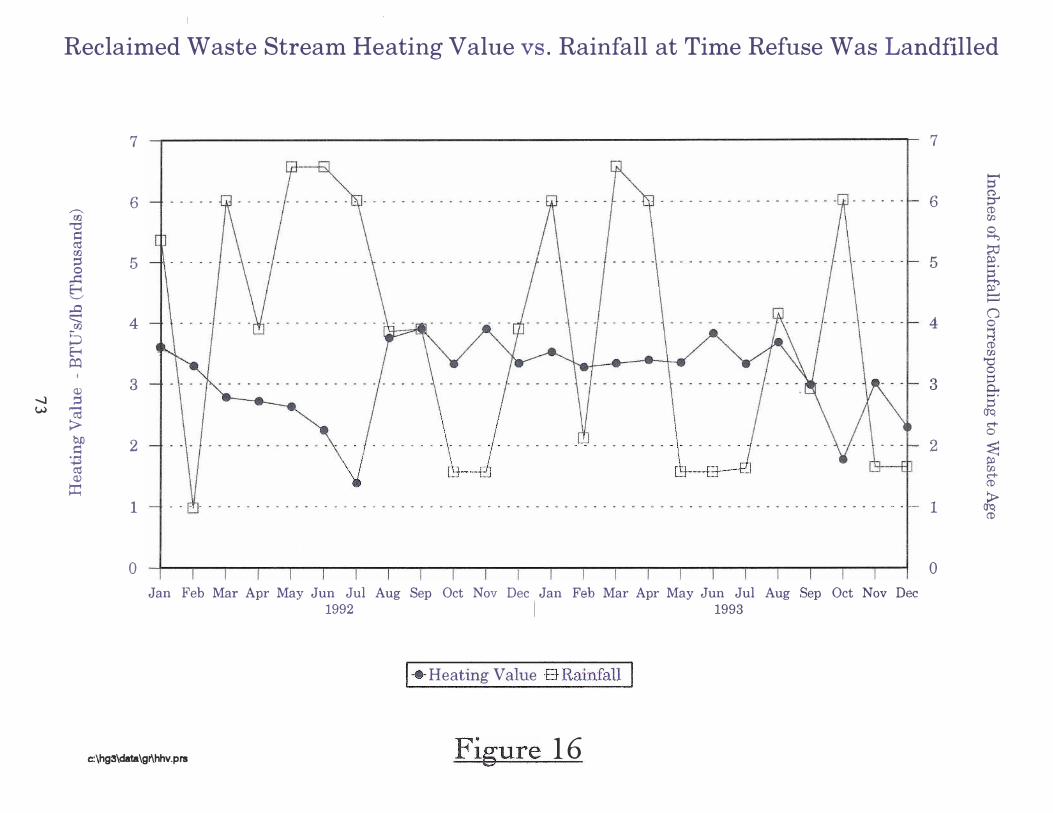
--..l w
r ; ' , I � � \ , \ ;' r { , ( ') / f i ( r Reclaimed Waste Stream Heating Value vs . Rainfall at Time Refuse Was Landfilled
,--.. en.
'"0 � m en. ::l 0 ..c: 8 '-"
..0 c::; en. EJ 8 (:l:l <D ::l ...... m
>-� '.,'3 m <D �
7
6
jl 5 - - -4
3
2 . . . . . . . . . . . . . . . . . . . . . /. . . . . . . \ . . ·1- - - - - - - - -� - - - - - - - - -\- - - - - - - f - - - - - - - � - , - -
\j ' � -E rk-�
7
6
5
4
3
2
1 - - t!.l- - - - - - - - - - - - - - - - - - - - - - - - - - - - - - - - - - - - - - - - - - - - - - - - - - - - - - - - - - - - - - - - - - - - - - - - - - 1-- 1
o Jan l;'eb Mar Apr May Jun Jul Aug Sep Oct Nov Dec Jan Feb Mar Apr May Jun Jul Aug Sep Oct Nov Dec
C:\hg3\data\gl\hhv.prs
1992 I 1993
----------------- - 1 1* Heating Value E:lRainfal�
Figure 1 6
o
I---( :::; 9-(1) rJ;J � � � ..... . � ....... ....... o o � (1) 00
� o [ ..... . � Mo
� 00 M(1) > (To, (1)

C. Effect on Emissions
1 . Source Test Results
Source testing for emissions of heavy metals such as arsenic, beryllium, cadmium, hexavalent chromium, lead, mercury and nickel has been conducted at the facility on a semi-annual basis since April 199 1 . Tests for particulate (TSP and PM I0) are also done; testing for dioxins and furans is done on an annual basis.
The quarterly emissions are presented in Table 13 . The values shown for each combustion unit are averages of three (3) test runs for each pollutant. None of the particulate or dioxin/furan emissions exceed the facility's permitted levels for these parameters. During certain quarters, emission concentrations of arsenic, beryllium, hexavalent chromium, and mercury exceeded PaDER's Best Available Technology (BAT) criteria listed at the top of the table. It should be stressed that these criteria do not apply presently to the Lancaster facility. However, average quarterly emissions for all parameters, with the exception of mercury, are below the BAT limits .
In general, cadmium, hexavalent chromium, lead, and nickel emissions have trended upward since April 1 992. This trend cannot be solely attributed to the reclaimed waste stream based on the air monitoring, unders and ash test results to date, but rather reflects the chemistry of the entire fuel mixture. Average emissions for all three (3) units for these parameters during the upward trending period (April 1 992 - October 1993) are the following, in units of ug/m3 corrected to 7% oxygen : a) Cd = 2.94; b) Hex. Cr = 1 .4; c) Pb = 8 .55 ; d) Ni = 9. 1 8 . None of these concentrations exceed PaDER's BAT criteria.
Cell 1 air monitoring and unders total metals analyses show that reclaimed waste does not negatively affect emissions of heavy metals as determined by source testing. The RRF tipping floor air monitoring results (personal samples), in fact, were the only ones where significant levels of metals were detected. The metals levels are indicative of the chemistry of the entire waste stream.
2. Continuous Emission Monitoring (CEM) System Results
The LCSWMA facility is equipped with a fully redundant CEM system that provides round-the-clock monitoring of emissions of carbon monoxide (CO), hydrogen chloride (HCI), sulfur dioxide (S02) and nitrogen oxide (N0x)' Quarterly emissions (in tons per quarter) for these parameters for all three (3) combustion units are illustrated in Figures 1 7 through 20. These emissions are reported to PaDER on a quarterly basis.
The graphs indicate several trends. . One obvious trend is that none of the parameters exceed permitted levels. The second trend is that CO emissions, indicators of efficient combustion, have remained, on average, 80% below the permitted level. S02 emissions are also well below the permitted concentrations, attesting to the efficiency of the furnace lime injection and dry scrubber systems. NOx concentrations remain relatively high, but cannot be attributed to the
75

reclaimed waste stream based on information from the OMSL plant operators. HCI emissions, on the other hand, can be directly tied to the reclaimed refuse.
As mentioned above, the chemistry of the unders showed the material to be high in the metal salts of sodium, potassium, magnesium, and calcium . The concentrations for these parameters were found to be 2 - 100 times higher in the unders than in the virgin daily cover soil. Thus, the unders are contributing to the HCI emissions at the RRF. Also, hydrochloric acid is known to be present in the trommeled waste, since it was detected in both the Cell 1 area and personal samples. The other indicator is that OMSL operators have noticed, over time, that burning reclaimed waste tends to cause an increase in HCI emissions at the facility. However, chlorides are one of the main constituents of several types of plastic that routinely end up in household trash. Thus, although the reclaimed waste stream contributes to the HCI emissions, it is not the sole cause.
7 6

TAl �LE 18 - LQSWMA mF Source !eat Bminioll . (unit.: . u.g/d ICDl at '1960: ; TSP/pMI0 f gr/dacf at % 02; Diom �1lIlB '"' Ili fNm8 at 7% 0 :z Toxic Bquival �nta) ( ermit Limts or TSP = 0.0 2 gr/dscf at 7 *' 02; PMlO = O.OlO gr/dSI at 7% 02; Jioxiruvfurans - 2.0 ng/Nm at 7% 02) (paDER BAT L mits (uIVm3): As = 7.2; Be - 0.2; Cd = 1 .8; Hex Cr = 2.3; Ni = 25; rt> = 166; Hg - 1 1 4 or 8O'lt rem. eff.; Oio UnNFurans - o ngldscm)
UNIT '1 Quarter Id Be Cd Hex. Cr Pb Hg Ni TSP PMI0 Dioxinr,IFurIlDll
April 91 1.217 NO 3.074 NO 34.737 262.629 NO 0.00428 0.00988 0.278
Oct. 91 0.088 0.400 1.800 0.030 8.800 120.200 4.400 0.00030 0.00050
April 92 0.410 0.056 0.899 0.551 2.219 35 1 .519 8.510 0.00120 0.00250 0.214
Oct 92 40.426 0.133 0.592 0.630 1 1. 122 230.604 5.074 0.00098 0.00262
April 93 0.525 0.052 5.253 2.049 lO.506 250.016 10.506 0.001 17 0.00254 1 .100
Oct. 93 1 .304 0.061 6.149 1 .646 12.231 323.541 12.298 0.00214 0.00149
UNIT N2 Quarter Id Be Cd Hex. Cr Pb Hg Ni TSP pMI0 Dioxinr/Fur1lDll
April 91 NO NO 0.809 NO 6.123 274.859 NO 0.000063 0.00716 0.208
Oct. 91 0.200 0.400 3.000 0.029 17.500 90.700 4.200 0.00840 0.00120
April 92 0.252 0.063 0.210 0.270 0.315 336.908 13.642 0.00033 0.00010 0.272
Oct 92 29.608 0.097 0.632 0.605 10.691 213.251 5.674 0.00054 0.00254
-...J -...J April 93 0.689 0.047 4.713 2.385 lO.067 300.877 9.427 0.00138 0.00252 0.681
Oct. 93 0.823 0.053 5.265 2.920 10.529 213.632 10.529 0.00181 0.00244
UNIT *3 Quarter As Be Cd Hex. Cr Pb Hg Ni TSP PMI0 Dioxinr/Fur1lIlB
April 91 NO NO 0.31 1 NO NO 643.975 NO 0.00022 0.00530 0.063
Oct. 9 1 0.100 0.500 1 .900 0.033 9.800 91.700 4.600 0.00060 O.ooolO
April 92 0.217 0.050 0.301 0.316 0.459 198.068 7.502 0.00043 0.00010 0.300
Oct 92 13.305 0.091 0.676 0.674 12.454 179.138 5.857 0.00257 0.00263 i April 93 1 .280 0.053 5.365 1 .731 10.729 180.788 10.729 0.00100 0.00252 0.576
Oct. 93 1 .355 0.053 5.264 2.967 10.528 157.487 lO.528 0.00196 0.00262
LCSWMA Avg. 5.100 0.1 17 2.567 0.935 . 9.934 245.550 6.860 0.00163 0.00271 0.4 10
YORK COUNTY
Nov. 30 - Dec. 2 93 1 .143 0.049 1.290 Not analyzed 5.790 9.550 3.020 0.00168 Not analyzed 0.122
NO - Not detected :\123r4w_ fmo\p<.· .... k4

� rn. s:::: 0 +J
'-'
,....,
Q)
6) � "'0 Q)
......:J � \0 � rn.
� Q)
�
f
Figure 1 7 Quarterly CEM Carbon Monoxide Emission Data
Lancaster County Resource Recovery Facility 12 .00
Permit Level = 50 ppm, 8-hr average
10.00 - - - - - - - - - - - - - - - - - - - - - - - - - - - - - - - - - - - - - - - - - - - - - - - - - - - - - - - - - - - - - - - - - - - - - - - - - -
8 .00 - - - - - - - - - - - - - - - - - - - - - - - - - - - - - - - - - - - - - - - - - - - - - - - - - - - - - - - - - - - - - - - - - - - - - - - - - -
6.00 - - - - - - - - - - - - - - - - - - - - - - - - - - - - - - - - - - - - - - - - - - - - - - - - - - - - - - .. - - - - - - - - - - - - - - - - - - -
4.00 - - - - - - - - - - - - - - - - - - - - - - - - - - - - - - - - - - - - - - - - - - - - -
2 .00 -
0.00
ri � C':> N � - $n,..:; ril I-r-
- [ �"" ""�
d;<'
I:> � � C\] N �I�
..;: -ri r
-I �""
{'5 d;<'
C':> � "<I' �
ffiJ OJOJ�
�'\. 0::
-�- o o -ri C':> C':> � [
N � - -� � 8 g C':> � ri ri
ffij Fr<' l I
�OJ� d;<' OJOJ�
'\. IJ;<'
;:g C\i
r-
<b oo ri o
rn l OJOJ<l:J
'\. �
1D � I:> � � "<I' � � � N ri � 'H-"" N -� �
l' 1 �<l:J {'5
d;<' �OJ<l:J �
o§b t?' ""� �OJ�
d;<' �<>b <l:J<,b t?' ""� �<>b <l:J<,b
c: \'bg3\data \I'rf\rrfemit.prs
Reporting Period DUnit 1 DUnit 2 Unit 3
Note: l.)Permit level emission was calculated at design flue gas rates, 7% oxygen and over a 24 hour period, 30 days per month and 3 months per quarter.
N ;:g - "<I' -· 10 -• ri N ri •
rn:
�<l:J '\-� d;<'
t?'
2.) Measured level emissions are based upon actual operating conditions based upon continuous emission monitoring data.

� 00. � 0 .+J '-'
....... � � ...:l
� � 00 M
- � 00. ce � �
I} r
Figure 18 Quarterly CEM Hydrochloric Acid Emission Data
Lancaster County Resource Recovery Facility 10.00
8.00
6.00
4.00
2.00
0.00
Permit Level = 30 ppm, I-hr average
- - - - - - - - - - - - - - - - - - - - - - - - - - - - - - - - - - - - - - - - - - - - - - - - - -
- - - - - - - - - - - - - - - - - - - - - - - -
- - - - - - - - - - - - - .. - - - - - - - - - - - - - - - - - - - - - - - - - - - - - - - - - - - - - - - - - - - - - - - - - - - - - - - - - -
0 r-- 00 � <.C r--0 .f. r-- ... co <.C I"" C'-l .f. • C'-l co .f. ..... .f. ... . .f. '" .f. r- r- "'� 10 c- '" 00 - 1'"" ' ... 0 <.C <.C <'"5 :-;:"' 1O� <.C r--- - - - - - - - - ,;; - - � - -....:. o ;� c.;-� � - <'"5 - � -
r::-:: co co �1 C'-l . '. _ <.C C'-l r-- C'-l � <'"5_ ,....( �{,.. - ..... ..... ..... . 00 <'"5j • co ... 00 0') �� c- ';\;! <'"5 ,.;� <'"5 <'"5 cor-r-- c-4 r- .. r- : ; I'""r::: -c-4 10 ' . ;.t. =:7 . .l � - C'-l - . � 7(1
-� , ... -", ;:i: ... .'-:. r-- 4- ..
:>:-. n
�i �� :� ��-
- _ _ � _ _ <0 _
.�!J �" - "' - , . .;..: ..... � ..-< , ti f ,� 11< •• � - ..... r- m-: 10 ¥ W i'( . ; C'-l o cq .� . ' .. .. � �;, ;;. t- 'tV; ,� ::�, Il! :,!-' -::'i <.C o . ,tj it.:' . 0
fi �; �, t .. r- , : :t� ";J . "
�:�. -.,' �;; :�� r r ..; T� ' , ...
'.;', "
f?' "
OJOJ"'" ".; ��
� �OJ � OJOJ�
�".; � �OJ�
�� ��b
�OJ� �<,
'O-<,b ..."OJOJ
� �� ..."OJOJ
'O �-<, ..."OJOJ
'O �-<,
��b ..."OJOJ
'O ��
'O-<,b ?:J'O
...,,OJ � t?' 'O-<,b t?' ...,,?J' ""':so- ...,,?J'
Reporting Period DUnit 1 DUnit 2 ClUnit 3
c:\bg3 \data\rrf\rrfemit,prs Note: l.)Permit level emission was calculated at design flue gas rates, 7% oxygen and over a 24 hour period, 30 days per month and 3 months per quarter.
2,) Measured level emissions are based upon actual operating conditions based upon continuous emission monitoring data.

,..-, 00 � 0
� '--'
..... � :> � � '"C �
00 M W ::; 00
C\$ � �
\
120.00
100.00
80.00
60.00
40.00
20.00
0 .00
I
Figure 1 9 Quarte rly CEM Nitrogen Oxide Emission Data
Lancaster County Resource Recovery Facility
Permit Level = 300 ppm, daily average
- � � - - - - - - - - - - - - - - - - - - - - - - - - - - - - - - - - - - - - - - - - - - - - - - - - - - - - - - - - - - - .. - - - -
-
-
-
-
-
-
-
-
-
-
-
-
-
- -
-r-<:'I 0 1(.)
r-
<X> <:'I tD <:'I � O) r- ai 1(.)
� -
:..: , . : • .• 1
. .:� i .,
�
- - - - -
1(.) O) ,..; � -;:g -,..; 1(.) <:'1 f- C! 1(.) -.j<
�-
�
...... Ql .... <X>
":":" ...... � 1(.) c<i <:'I t--1(.) r-:-00 1(.) - � �g;:-:, -
...
i �
�I I . .
""OJOJ"" d:l' ""OJOJ
"" � �
OJOJ� ;.,;
(j;.(,. -$OJ�
� ":!.(,.� ""� �<>�
1(.) -.j< 0 � ::; ;: l :- -t
�4 �.t � �\
.� �.
...... <X> -.j< <:'l eO o C! t-- t---I» -.j< 1(.) - -
c<.;�-Ql c<i t--[2 t--1O:'\ t-- ",
- ,. - " , - 1(.) -.j<
- , 0 � - -. -
.. , .' W d. �1 � . . � ..... 'r
rE. i �, -til ;0 � � � �
I � ,, ' ,-" ¥
- - -
1(.) � r-: �
-
0 Ql <X> � '7
* ,..; : 1(.) -r- - ;
�! ¢;; � .
:J. f.� 1.<l M ... 3.t J..< �: .;i:
;... � ([" � ¥
OJOJ� ;.,;
r:j;.(,. ":!.(,.�
""OJOJ�
� OJOJ":! �;.,; � ""� '>,�
Reporting Period DUnit 1 DUnit 2 DUnit 3
OO -.j< � -.j< � . 00 <:'1
_ <X> � � <X> I
0 t--c-
, ':,
"
�.�,\ .,::
, -,,- I f� :�}' �� � .;t,,;
t'" .. : --' :i: ';' � :i
, .
<X> -.j< o � - e<I -c<i� t--r-
0) 1(.) r-: -.j< .' ,' - �.
:� . ..,; 'f!. '.� ... :!(: .... �<r:'. � �: �. I � :
-$OJ":! (j;.(,.
�<>� OJOJ":! ;.,;
r:j;.(,. ":!.(,.�
t-- OO o C! ' 00 � � ,....r"'"
- � � 0 1(.)
-
K· �" ... .��: . ..... \.:. �., �:�:' t. 1: .
""OJOJ":! (j;.(,.
'>,�
c:\hg3\data \rrf\l'rfemit.prs Note: l.)Permit level emission was calculated at design flue gas rates, 7% oxygen and over a 24 hour period, 30 days per month and 3 months per quarter.
2.) Measured level emissions are based upon actual operating conditions based upon continuous emission monitoring data.


� 00 I=l 0 .+J '-'
....... CD :::-CD �
""C CD
00 � VI ::; 00
� CD
�
20.00
15.00
10.00
5.00
0.00
{
Figure 20 Quarterly CEM Sulfur Dioxide Emission Data Lancaster County Resource Recovery Facility
"" C'! "" ..... c-lnc-l "" .
• c-l .....
�"" ""OS
d:;-<' �"" �'" � � � d:;-<'
Permit Level = 30 ppm, I-hr average
�'" �'" �'" �":> �":> �":> � ""OS ""OS � � � � d:;-<' d:;-<' d:;-<' d:;-<' d:;-<'
..... 00
�":> ""OS d:;-<'
,,:>-<.0 J5' ""� �:� q; ,,:>-<.0 tx.� ""� f;>0 q; ,,:>-<.0 J5'
Reporting Period DUnit 1 OUnit 2 Unit 3
c:\hg3\data \rrf\rl'femit.prs Note: l.)Permit level emission was calculated at design flue gas rates, 7% oxygen and over a 24 hour period, 30 days per month and 3 months per quarter.
2.) Measured level emissions are based upon actual operating conditions based upon continuous emission monitoring data.

D. Ash Residue and Ferrous Metal Recovery
1. Generation Rates VS. Processed Tons
As stated above in Section III.B, 382,350 tons of acceptable refuse were delivered to the LCSWMA Resource Recovery Facility for processing during 1993 , of which 1 8 .9% was reclaimed waste. The total amount of ash residue generated during this period was 1 1 1 ,086 tons.
The residue generated was 29. 1 % per processed ton. This generation rate is 5 -
7 percentage points higher than at comparable resource recovery facilities that do not process reclaimed waste. At Ogden Martin's Pasco, Florida facility, for instance, the ash generation rate is roughly 23 . 8% per processed ton. Similar percentages are also seen at other MSW -only facilities. Thus, processing refuse mixed with reclaimed waste at LCSWMA's present feed ratio of 4.3 parts MSW to one part reclaimed m aterial produces 1 8% more ash than at a comparable MSW-only plant. Roughly speaking, if the reclaimed waste stream is 20% of the refuse input to the RRF, one can expect 20% more ash residue to be generated. The higher percentage is attributable to the soil content of the material.
The ash generation rate of 29 . 1% per processed ton is 4% lower than the 1 992 generation rate, indicating that trommeling operations have become more efficient in removing entrained soil.
Ferrous metal recovery rates at the facility averaged 1 .7% of processed tons in 1993, the same percentage as was achieved in 1992. Ferrous recovery at the Pasco facility has averaged 1 .9% per ton processed, which is a comparable number to Lancaster's. Thus, it does not appear that reclaimed waste contains an overabundance of ferrous metal.
Delivered tons, as well as ash residue and ferrous metal generation rates, are shown in Table 14 .
2. Ash Residue Quality
LCSWMA has performed a considerable amount of testing of its ash residue stream since operations began in early 199 1 . Thus, all residue generated to date, with the exception of the time period during Acceptance Testing (March - April 1 99 1), has resulted from the combustion of MSW and reclaimed waste. Its chemical characteristics then, are representative of the ash stream that operators of mass-burn incinerators could expect from processing a waste stream containing 1 9% - 2 1 % reclaimed refuse having an age of 1 - 5 years.
LCSWMA currently performs weekly ash testing on composite samples obtained from each residue load that is transported to the landfill. The ash stream is tested daily for pH; TCLP analyses are done on each weekly composite sample for cadmium, chromium and lead. Once per month, TCLP and total metals analyses
are performed on t!le composite sample for the following metals: aluminum, antimony, arsenic, barium, cadmium, chromium, copper, lead, mercury,
8 7
molybdenum, nickel, selenium, silver and zinc. The moisture content of the ash residue is also determined for each weekly sample.
Tables 1 5 and 1 6, as well as Figures 2 1 and 22, show the results of total metals and TCLP testing performed on the LCSWMA ash residue stream as well as test results from another mass-bum incinerator that processes only MSW. Results were fairly comparable. Total metals concentrations were similar, with the exception of arsenic, selenium, and molybdenum, which were approximately twice as high in the LCSWMA ash stream . The pH of the ash from both facilities ranged from 1 1 .4 to 1 1 .7.
A comparison of the TCLP test results in Table 16 indicates that neither ash stream exceeds regulatory limits for the metals for which limits are established (i.e., arsenic, barium, cadmium, chromium, lead, mercury, selenium and silver). The LCSWMA ash stream's TCLP leachate (with the LCSWMA reclaimed refuse) was considerably higher than the MSW-only facility's ash in barium, chromium, and silver; however, none of the test data (air, ash or unders) suggests that the reclaimed material contributes to higher concentrations of these metals. Mercury concentrations for the ash from the MSW-only facility were ten times
higher than the LCSWMA ash.
A discussion of the quality of the ash residue resulting from the combustion of the older York County waste stream is given below in Section IV.B.
3. Ash ResiduelUnders Chemistry
As stated above, total metals analyses were performed on the ash residue, as well as on the trommeled unders and the virgin daily cover soil. A comparison of these results would indicate whether or not the entrained soil is affecting the chemistry of the ash residue.
'
Figures 2 1 and 22 illustrate the total metals results for these m aterials. One item that is immediately apparent is the similarity in the graphs for 1 992 and 1 993, which indicate very little variation in the chemistry of these m aterials. Table 6 shows that selenium, molybdenum, and silver were not detected in the unders or the cover soil. A further comparison of this data with the unders chemistry presented in Table 6 shows that the unders are not negatively contributing to the chemistry of the LCSWMA ash stream .
8 8

00 \0
TABLE 14 - RRF DELIVERIES AND ASH RESIDUFJFERROUS METAL TONNAGES
----- ---- - ---------- ------- -- -----
LF AS e;. TONS LF TONS OF
MONTH DELIVERED (A) PROCD. PROCD.
JANUARY '93 3 1 , 1 58 7,975 25.6
FEBRUARY 25,6 1 4 5,6 1 7 2 1 .9
MARCH 3 1 ,290 6,395 20.4
APRll. 3 5,295 8, 1 66 23 . 1
MAY 3 2,376 7,070 2 1 .8
JUNE 34,843 7,862 22.6
JULY 3 1 ,786 5,097 1 6.0
AUGUST 34,867 6,8 1 3 1 9.5
SEPTEMBER 3 3 ,559 5,354 1 6.0
OCTOBER 28,624 2,376 8.3
NOVEMBER 3 1 ,602 4,856 (6) 1 5 .4
DECEMBER 3 1 ,336 4,676 (0) 14 .9
TOTA LS 3 82,350 72,257 (F) 18 .9
MON'I1ll.Y AVERAGE 3 1 ,863 6,02 1 ----
WEEKLY AVERAGE (G) 7,353 1 ,445 - - - -
(A) (C) (E) (G)
Assumption made that tons delivered = tons processed Includes 347 tons delivered to the York Landfill Includes 1 ,078 delivered to the York Landfill Based on 50 weeks for reclaimed; 52 weeks for others
c:\wpwin\data\lf\gash-ferr.093
----
ASH
8,722 ,
9, 165
8,2 1 7
1 0,469
1 0,044
10,430
8,701
1 0,342
9,322
7 , 123
9, 1 65 (C)
9,386 (E)
1 1 1 ,086
9,257
2 , 136
(B) (D)
(F)
FERROUS AS ASH AS % OF e;. OF
PROCD. FERROUS PROCESSED
28.0 430 1 .4
35 .8 384 1 .5
26.3 430 1 .4
29.7 60 1 1 .7
3 1 .0 535 1 .7
29.9 63 1 1 .8
27.4 559 1 .8
29.7 389 1 . 1
27.8 637 1 .9
24.9 537 1 .9
29.0 608 1 .9
29.9 620 2.0
29. 1 6,36 1 1 .7
---- 530 ----
---- 122 ----
Includes 2,4 1 3 from York County (York). Includes 2,3 55 from York Includes 4,768 from York
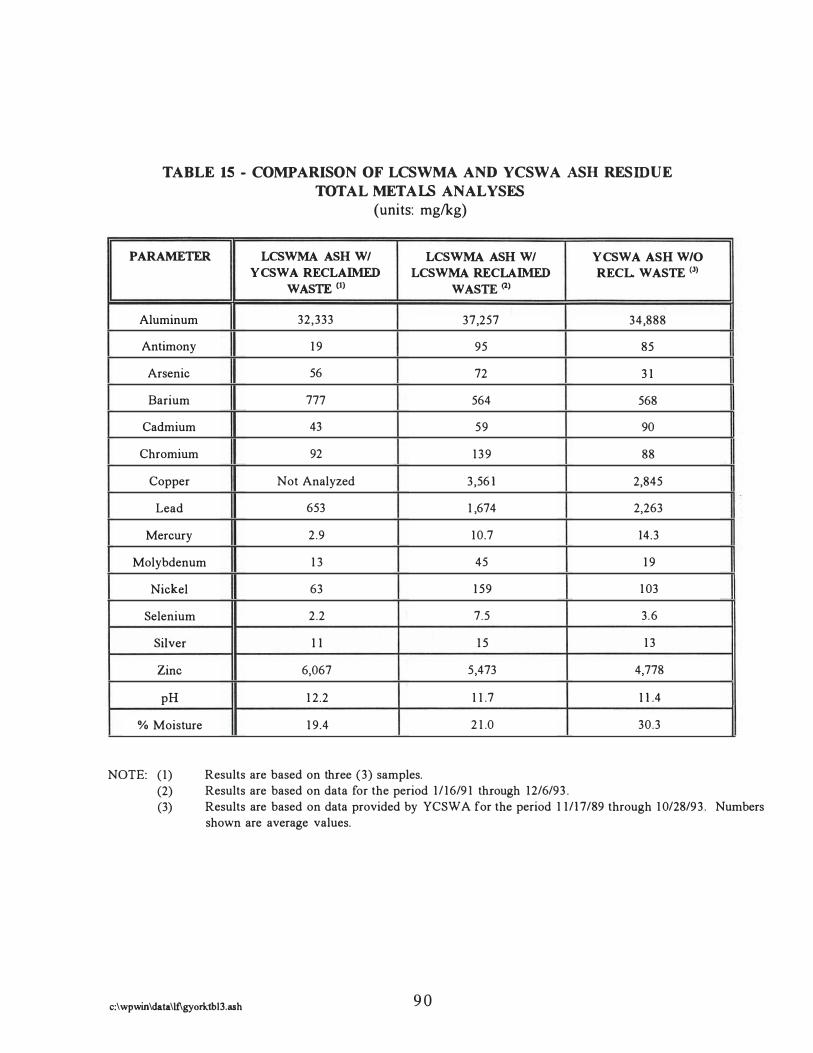
TABLE 15 - COMPARISON OF LCSWMA AND YCSWA ASH RESIDUE
TOTAL METALS ANALYSES
(units: mg/kg)
PARAMETER LCSWMA ASH WI LCSWMA ASH WI YCSWA ASH W/O YCSWA RECLAIMED LCSWMA RECLAIMED RECL WASTE (3)
WASTE (I) WASTE (2)
Aluminum 32,333 37,257 34,888
Antimony 1 9 95 85
Arsenic 56 72 3 1
Barium 777 564 568
Cadmium 43 59 90
Chromium 92 1 3 9 88
Copper Not Analyzed 3 ,56 1 2,845
Lead 653 1 ,674 2,263
Mercury 2.9 1 0.7 14.3
Molybdenum 1 3 45 1 9
Nickel 63 1 59 1 03
Selenium 2.2 7.5 3.6
Silver 1 1 1 5 1 3
Zinc 6,067 5,473 4,778
pH 1 2.2 1 1 .7 1 1 .4
% Moisture 1 9.4 2 1 .0 30.3
Results are based on three (3) samples. Results are based on data for the period 1 1 16/9 1 through 1 2/6/93 .
NOTE: ( 1) (2) (3) Results are based on data provided by YCSWA for the period 1 1 11 7/89 through 1 0/28/93 . Numbers
shown are average values.
c:\wpwin\data\lf\gyork.th13.ash 9 0

PARAMETER
Aluminum
Antimony
Arsenic
Barium
Cadmium
Chromium
Copper
Lead
Mercury
Molybdenum
Nickel
Selenium
Silver
Zinc
TABLE 16 - COMPARISON OF LCSWMA AND YCSWA
ASH RESIDUE TCLP ANALYSES
(units: mg/l)
LCSWMA ASH WI LCSWMA ASH WI YCSWA ASH WIO YCSWA RECLAIMED LCSWMA RECLAIMED RECL WASTE (3)
WASTE (I) WASTE (2)
69.9 22.4 1 6.59
0. 1 07 0.74 0.55
0 .0 1 9 0.056 0.07
l .05 3 .55 0.79 -
0.32 0.64 0.89
0.2 1 0.33 0 .06
Not analyzed 0.43 0.43
2 .3 2.68 3 .27
0.003 0.00096 0.0097
0.09 0.38 0. 1 2
0. 1 4 0.36 0 .47
0.008 0.043 0.045
0.036 0 . 1 3 0.0 1
35 .7 56.6 57.8
Results are based on four (4) samples. Results are based on data for the period 11 16/9 1 thorugh 1 2120/93.
REGULATORY LIMITS
5.0
1 00.0
l .0
5.0
5.0
0.20
l .0
5.0
NOTE: ( 1) (2) (3)
. Results are based on data provided by YCSWA for the period 1 1 1 1 7/89 through 1 0/28/93 . Numbers shown are average values.
c:lwpwinldatallf\gyorictbI4.ash 9 1

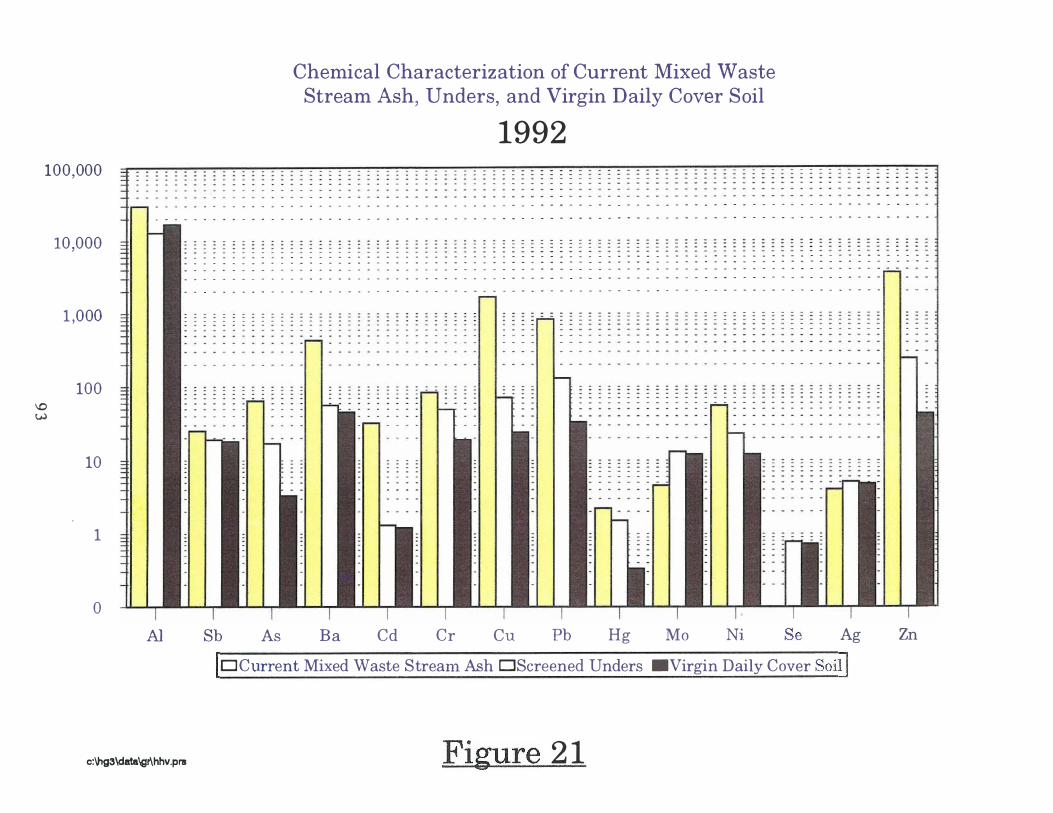
(
100,000
ID W
10 ,000
1 ,000
100
10
1
o
l' !
Chemical Characterization of Current Mixed Waste Stream Ash, U nders, and Virgin Daily Cover Soil
1992
. - - - - - - - - - - - - - - - - - - - - - - - - - - - - - - - - - - - - - - - - - - - - - - - - - - - - - - - - - - - - - - - - - - - - - - - - - - -- - - - - - - - - - - - - - - - - - - - - - - - - - - - . - - - - - - - - - - - - - - - - - - - - - - - - - - - - - - - - - - - - - - - - - - - - - - - - - - - -
- - - - - - - - - - - - - - - - - - - - - - - - - - - - - - - - - - - - - - - - - - - - - - - - - - - - - - - - - - - - - - - - - - - - - - - - - - - - - -- - - - - - - - - - - - - - - - - - - - - - - - - - - - - - - - - - - - - - - - - - - - - - - - - - - - - - - - - - - - - - - - - - - - - - - - - - - - -- - - - . - - - - - - - - - - - - - - - - - - - - - - - - - - - - - - - - - - - - - - - - - - - - - - - - - - - - - - - - - - - - - - - - - - - -
- - - - - - - - - - - - - - - - - - - - - - - - - - - - - - - - - - - - - - - - - - - - - - - - - - - - .. - - - - - - - - - - - - - - - - - - - -- - - - - - - - - - - - - - - - - - - . - - - - - - - - - - - - - - - - - - - - - - - - - - - - - - - - - - - - - - - - - - - - - - - - - - - - -
AI Sb As Ba Cd Cr Cu Pb Hg Mo Ni Se Ag Zn I DCurrent Mixed Waste Stream Ash DScreened Unders .Virgin Daily Cover Soil]
e:\hg3\data\gl\hlw.pra Figure 2 1

\0 VI
(
100,000
10,000
1 ,000
100
10
1
o
Chemical Characterization of Current Mixed Waste Stream Ash, MSW -Only Ash, Unders, and Virgin D aily Cover Soil
1 993 � -
- - - - - - - - - - - - - - - - --
- - - - - - - - - - - - - - - - - - -- - - - -
- - - - - - - - - - - - - - - - - - - - - - - - - - - -
- - - - - - - - - - -- - - - - - - - - - - - - - - - - - - - - - - - - - - - - - --
- - - - - - - - - - - - - - - - - - - - - - - - - - - - - - - - - - - - - - - -- - - - - - - - - - -- - - - - - - - - - - - - - - - - - - - - - - - - - - - - - - - - - - - - - -
- - - - - - - - - - -- - -
- - - - - - - - - - - - - - - - - - - - -
- - - - - - - -- - - - - - - - - - - - - - - - - - - - - - - - - - - - - - - - - - - - -
- - - - - - - - - - - - - - - - - - - - - - - - - - - - - - - - - - - - - - - - - - - -- - - - - - - - - - - - - - - - - - - - - - - - - - - - - - - - - - - - - - - - - - - - - - - - - - - - - - - - - - - - - - - - - - - - - - - - - - - - - - - -
- - - - - - - - - - - - --
- - - - - --
- - - - - - - - - - - - - - - - - - - - - - - - - - - - - - - - - - - - - - - - - - - - - - - - - - - - - - - - -- - - - - - - - - - - - - - - - - - - - - - - - - - - - - - - - - - - - - - - - - - - - - - - - - - - - - - - - - - - - - - - - - - - - - - - - - - - -
- - - - - - - - - - - - - - - - - - - - - - - - - - - - - - - - -- - - - - - - - - - - - - - - - - - - - - - - - - - - - - - - - - - - - - - - - - - - -- - - - - - - - - - - - - - - - - - - - - - - - - - - - - - - - - - - - - - - - - - - - - - - - - - - - - - - - - - - - - - - - - - - - - - - - - -
- - -- - - - - - - - - - - . - - - - - - - - - - - - - - - - - - - �- - - - - - - - - - - - - - - - - - - - - - - - - - - - - - - - - - -
- - - - - -
- - - - - - - - - - - - - - - - - - - - - - - - - - - - - - - -- - - - - - - - - - - - - -- - - - - - - - -
- - - - - -- - - - - - - - - - - -
- - - - -- - - - - - - - - - - - - - - - - - - - - - - - - - -- - - - - - - - - - - - - - - - - - - - - - - - - - - - - - - - - - - - -
- - - -- - - - - - - _ . _ - - - - - - _ .. ... .. - - - - - - - - - - - - - -- - - - - - - - - - - - - - - - - - - - -
- - - - - - - - - - - - -- - - - - - -
AI Sb As Ba Cd Cr Cu Pb Hg Mo Ni Se Ag Zn
.Current Mixed Waste Stream Ash DScreened Unders .Virgin Daily Cover Soil DMSW - Only Ash
c:\hg3\data\gr\hhv.pra Figure 22
(

L
IV. Project Comparisons
This section will address the similarities and differences between the LCSWMA reclamation project and the 5-week York County Sanitary Landfill reclamation project. Where applicable, comparisons will also be made to the test pit excavation LCSWMA performed at the Eastern Lift of its Creswell Landfill, where the buried refuse is approximately ten ( 10) years old.
A. Waste Composition/Age
The age of refuse buried in Cell 1 at the Frey Farm Landfill varies from 1 - 4 years; the age of refuse excavated during the York County project varied from 1 5 - 20 years.
Physical characterizations were performed on the York County reclaimed m aterial in the same fashion as was done for the LCSWMA waste. Several similarities exist between the two (2) waste streams. Both streams contained 30% non-combustible material, and the LCSWMA refuse had 67% combustible content, compared to York's 65%. The remaining 3% of the LCSWMA stream consisted of recyclables such as aluminum, bimetallic, and steel cans; the York recyclable content was 4. 8%, and contained similar materials.
The person that performed both characterizations noticed that the York material was more friable than LCSWMA's, probably due to its age. He also noted that the York soil contained very few rocks or stones, and had a sandy texture. The texture could again be due to the presence of decomposed materials.
The characterizations revealed that both waste streams, as expected, contained considerable amounts of household waste such as paper, cloth, newspaper, and insulation . The York waste, surprisingly enough, contained little or no wood.
The overall conclusion was that the York County reclaimed waste was more decomposed but still represented a waste stream that was trommelable and combustible.
Physical characterizations were also performed on m aterial excavated from seven (7) test pits at the Eastern Lift of the Authority's Creswell Landfill. This project was undertaken to determine the nature of the waste buried in this cell. Results of the excavation would then be used to determine the feasibility of reclaiming this waste stream .
To obtain a good cross-section of the landfilled waste, seven (7) locations were selected at various locations on the site, as shown in Figure 23. The results of the characterization showed that 7 1% of the material removed from the pits was considered to be noncombustible, primarily because it consisted of a large amount of "fines" due to decomposition and was bulky and oversized. Approximately 26% of the m aterial appeared to be combustible in that it consisted of household trash, cardboard, fiberglass, and some plastic. The recyclable portion was 3%, and consisted of aluminum cans and assorted metals.
9 7
\0 ($)
o
or> " '"
) o ?- 520 �
� /' � L I ( ....
AREA I q I 7/ :::;::>-«;;<7- �.J//�t;::;>===--(."\\\\\\ ///) N 7,750
r:Ji I' �� £.OO£.
� // �. / / -- /
.
�
/ ?AO
�� //
.\
��
NOTES:
1 . . CONTOUR IN TERVAL IS TWO FEET.
2. E XI STING TOPOGRAPHY SURVEYED BY L .C .S .W. M . A. PERSONNEL ON 1 1 /4/93.
�p\ff-I l�rtl\r.c I:?:: d."" I plotted . f!- �I-
/V
\ �, ( I ''>,:-:---'" "> ...... >- :::::::<::::, -- ./ :;;> C:;;> ,/ 1>,/ N 7,250
FIGURE 23 () lANCASTER COUNTY SOLID WA.�ST�E MAN�AGiiE�ME�NT AUTHORITY�
1m HNlR15I3URC PIKE. P.O. BOX ��25 • L-4NCASTER, PA 17601 . (717) 397-9968
CRESWELL LANDFILL - EASTERN LIFT, EXISTING GRADES
L- , _ _ _ .L- 1- DR/lIM� 1 Sf' ' ' '�" - 1 £0 ' "yE: 1 1 /8/0 <' �:

I , '-'
The Eastern Lift, therefore, would not be a good choice for a reclamation project if the intent were to obtain fuel for use in a mass-bum incinerator.
A comparison of the LCSWMA and York County unders physical characteristics shows that the "soil" content of the York material is 24% higher than the LCSWMA unders (see Table 4), but that the percentage of rocks in the Lancaster unders is nearly 500% higher than York. The higher soil content of the York unders could be due to greater amounts of cover soil used during landfilling, and to the advanced state of decomposition of the cell's contents.
B. Chemical Characteristics
1. Unders
A comparison of the total metals detected in the LCSWMA and York County unders shows the LCSWMA material to have higher concentrations of arsenic, barium, cadmium, lead and mercury (compare Table 6 to Table 1 7). Chromium, selenium and silver concentrations were roughly the same. The reason for the higher metal concentrations in the LCSWMA unders cannot be fully determined, although one would suspect that the metals have, over time, leached out of the York material.
Results of TCLP testing indicate, in fact, that certain metals have the potential to leach from the unders . Arsenic, barium, cadmium, chromium and lead were detected at low concentrations in the TCLP leachate from the LCSWMA unders (see Tables 7 and 8); barium and lead were detected in the York TCLP leachate.
No TCL or TCLP volatiles or semi-volatiles were detected in the York unders.· Very few of these compounds were found in the Lancaster unders, as shown in Tables 7 and 8. The reason for the presence of these m aterials is unclear, except that some of the compounds, most notably xylene and toluene, were detected in the air sampling done at the Transfer Station and the RRF tipping floor, indicating that they are present in the normal refuse stream .
Additional unders and soil samples were obtained from the York County site to determine if their chemistry varied with depth. The samples were taken from the excavated pit and beneath the trommel during daily operations. Results shown in Table 1 7 indicate very little variation between the chemistry of the unders and soil samples taken from 10' and 20' depths.
Tests for percent carbon were done to determine the relative degree of decomposition in the unders. The results show, as expected, that the younger unders had a higher carbon content. The LCSWMA unders had nearly 4 times the carbon content as the York unders. The LCSWMA unders had an average carbon content of 5%, whereas York's average content was 1 .3%.
"Soil" samples were also taken from the excavated pits at the Eastern Lift, more from a standpoint of waste characterization than for comparison to trommeled unders. The test results, listed in Tables 1 8 and 19, show that only two (2) volatile/semi-volatile compounds were detected - methyl ethyl ketone (MEK) and
9 9

m/p-Cresol. MEK is used as a solvent in paint removers and adhesives, and cresol is a mixture of isomers obtained from coal tar or petroleum. It is not surprising to find these compounds at the Eastern Lift, since it appeared that a good proportion of the waste excavated from the pits came from local industrial sources.
Arsenic, barium, cadmium, and chromium were detected in the TCLP leachate at very low concentrations. Lead was the only metal detected that exceeded regulatory limits; the sample from test pit #6, at a depth of 23', had a TCLP concentration of 6.7 mg/l.
.
1 0 0
-o -
r f ( (
TABLE 17 - UNDERS SOILS TEST RESULTS (1 1/29/93 - 12/9/93): YORK COUNlY LANDFILL RECLAMATION PROJECT
(Units: mg/kg, dry weight basis or as stated otherwise)
PARAMETER WHOLE UNDERS VIRGIN UNDERS UNDERS SOIL FROM PIT SOIL FROM PIT
UNDERS DIRT FRACTION OOVER SOIL (5 - 10' deplh) (10 - 15' deplh) (5 - 10' deplh) (15 - 10' deplh) TCLP SEMI-VOLATILES
(ug/l)
m/p-Cresol 140
TOTAL METALS
(mglkg, dry weight basis) Arsenic < 3.9 5.2 < 3.9 < 3.9 1 .6 l . l < 4.4
Barium 3 1 26 20 32 32 1 2 1 9
Cadmium < 1 .3 < 1 .2 7.8 < 1 .3 < 1.3 < 1 .2 < 1 .5
Chromium 23 32 20 1 3 1 6 1 1 2 1
Lead < 13 < 12 < 13 < 13 , < 13 < 12 < 15
Mercury 0.32 0.22 0.20 < 0. 1 5 < 0. 1 6 < 0. 1 5 < 0 . 1 8
Selenium < 0.64 < 0.62 < 0.65 < 0.64 < 0.66 < 0.62 < 0.74
Silver < 5. 1 < 4.9 < 5.2 < 5 . 1 < 5.3 < 5.0 < 5.9
TCLP METALS (mg/l) Barium 0.41 0.3 1 0. 19 0.90 0.66 0.48 0.59
Lead 0.66 0. 1 7 0.22
MISe PARAMETERS
% Moisture 22.23 19. 1 3 23.32 22.32 24.07 1 9.70 32. 10
% Carbon 1 .8 1 .7 0.0 1 3 1 . 3 1 .6 0.35 1 .3
PesticideslHerbicideslPCB's NO NO NO NO NO NO NO & Asbestos
pH ( I : 1 slurry)' 7.65 7. 1 5 6.25 6.08 6.59 4.79 5.57 ---- - -
NOTES: • A I : 1 slurry consists of 25 grams of sample and 25 ml of deionized water.
c:\wpwin\data\unders\gyorkundr.093
I I
..-o N
I TABLE 18 - SOIL TEST RESULTS : LCSWMA EASTERN LIFI' TEST PIT PROJECT: TEST PITS #1 - #3
(Units: mglkg, dry weight basis or as stated otherwise)
PARAMETER I #1 - 1 0 ' I #1 - 19' I #2 - 10' #2 - 24' #3 - 10' #3 - 20' REGULA TORY LIMIT
TCLP SEMI-VOLA TILES (ug/l)
m/p-Cresol 88 860 1 70 200,000
TCLP VOLA TILE ORGANICS
ND
TOTAL METALS (mg/kg, dry
weight basis)
ArsenIc 1 0 1 .7 9 .3 3 . 5 1 .8 3 .5
Barium 58 3 7 1 20 60 46 55
Cadmium 3 .5 3 .5 5 3 .6 7 3 .5
Chromium 1 10 7 86 3 8 1 5 20
Lead 1 60 < 1 2 470 56 < 1 2 < 1 2
Mercury 0.25 < 0 . 1 4 0. 1 5 < 0. 1 4 < 0. 1 4 < 0 . 1 4
Selenium < 0.58 < 0.58 < 3 . 1 < 0 .60 < 0.58 < 0.58
Silver < 4.6 < 4.6 < 5.0 < 4.8 < 4.7 < 4.7
c:lwpwinldatalellgeltpsoiI. 1-3
..... o l.>.)
r
TCLP METALS (mg/I) #1 - 1 0 ' #1 - 1 9 ' #2 - 1 0 ' #2 - 24'
Arsenic ND ND 0 .0 1 3 0.008
Barium 0.67 0 .59 0.60 0.56
Cadmium ND 0 .04 ND 0.04
Chromium 0.08 ND ND ND
Lead ND ND 0.32 0 .26
Mercury ND ND ND ND
Selenium ND ND ND ND
Silver ND ND ND ND
MIsCELLANEOUS PARAMETERS
--% Moisture 1 3 .7 1 1 3 .88 1 9.48 16 .76
--_.
% Carbon 3 .9 0 . 1 2 7.0 2 .9
PesticideslHerbicideslPCB's & ND ND ND ND Asbestos
pH ( l : 1 slurry)" 7.59 4 .83 7.28 6.73
NOTES: * A I : I slurry consists of 25 grams of sample and 25 ml of deionized water
c:\wpwin\data\el\geltpsoil. l -3
( r
I #3 - 10' #3 - 20' REGULA TORY LIMIT I
0.009 ND 5.0
0.63 0.57 1 00.0
0.04 0.04 1 .0
0.02 ND 5.0
ND ND 5.0
ND ND 0.20
ND ND 1 .0
ND ND 5.0
1 4.3 1 4.28
1 .8 2.2
ND Amosite Amosite is a type of asbestos ( 1 5%)
7.86 7.47

-o ,J:.
TABLE 19 - SOIL TEST RESULTS : LCSWMA EASTERN LIFT TEST PIT PROJECf: TEST PITS #4 - #7
(Units: mg/kg, dry weight basis or as stated otherwise)
PARAMETER #4 - 10' ##4 - 23' #5 - 10' ##5 - 24' #6 - 10' ##6 - 23' ##7 - 10' #7 - 17' REGULATORY LIMIT
TCLP SEMI-VOLATILES (ug/I)
m/p-Cresol 450 200,000
TCLP VOLA TILE ORGANICS (ug/l)
Methyl Ethyl Ketone (MEK) 1 ,600 200,000
TOTAL METALS (mg/kg, dty
weight basis)
Arsenic 1 .2 3 .2 2.4 2.9 1 .9 1 .9 2.3 2 .2
Barium 56 86 7 1 72 64 63 57 55
Cadmium < 1 .2 < 1 .2 . I I < 1 .3 < 1 .2 9.4 1 . 3 2.6
Chromium 1 7 34 3 1 25 22 33 20 1 9
Lead 2 1 < 1 2 47 < 1 3 < 1 2 84 49 42
Mercury < 0. 1 5 < 0. 1 5 < 0 . 1 4 < 0. 1 5 5.6 < 0. 14 0. 1 9 < 0. 1 5
Selenium < 0.6 1 < 0.6 1 < 0 .60 < 0 .63 < 0.62 1 .2 < 0.63 < 0.64
Silver < 4.9 < 4.9 < 4.8 < 5.0 < 5.0 < 4.7 < 5 . 1 < 5 . 1 ------ -- -----
c:\wpwin\data\el\geltpsoiI.4-7
I

...-o U\
(
TCLP METALS (mgll) #4 - 10' #4 - 23 ' #5 - 1 0 ' #5 - 24'
Arsenic ND 0.008 ND ND
Barium 0.76 0 .84 0 . 5 5 0.80
Cadmium ND ND ND ND
Chromium 0.02 ND 0.02 ND
Lead ND ND ND 0. 1 1
Mercury ND ND ND ND
Selenium ND ND ND ND
Silver ND ND ND ND
MISCELLANEOUS
PARAMETERS
. • % Moisture 1 8 .09 1 8.49 1 6.8 20.53
_ _ % Carbon 1 . 1 9 .2 8.3 3 . 5
PesticideslHerbicideslPCB's & ND ND ND ND Asbestos
pH ( 1 : 1 slurry)" 7.37 6.56 7.20 7.83
NOTES : * A I : 1 slurry consists of 25 grams of sample and 25 ml of deionized water
c:lwpwinldatalellgeltpsoiI.4-7
#6 - 1 0 ' # 6 - 2 3 ' # 7 - 10' #7 - 17' REGULATORY LIMIT
ND 0.0 1 1 ND ND 5.0
0.87 0.66 0.45 0 .86 1 00.0
ND ND ND ND 1 .0
ND 0 .02 ND ND 5 .0
ND 6.7 ND 0 . 1 4 5.0
ND ND ND ND 0.20
ND ND ND ND 1 .0
ND ND ND ND 5.0
1 9.29 1 4.45 20.93 22.24
4.0 2 1 6 . 9 l . 9
ND ND ND ND
6.99 7.3 1 7 . 1 6 7.73 -_. - ---------

2. Ash Residue Quality/Quantity
The RRF processed 4,768 tons of reclaimed waste from the York County Sanitary Landfill from mid-November to mid-December, 1 993 . During this time period, 34,705 tons of acceptable refuse were delivered for processing, and 9,786 tons of ash residue were produced.
Ash residue generation rates when burning the York County reclaimed material averaged 28.2% per processed ton, or very similar to the 29. 1% experienced at the LCSWMA facility for 1993. Using typical percentages for ash generation at facilities that process normal refuse (24%, by weight), LCSWMA estimates that the ash generated from the York County reclaimed waste stream is 48%, by weight, of the tons of processed reclaimed m aterial. This is approximately 5 .3% higher than the values obtained for the LCSWMA reclaimed stream due to the higher soil content of the York material.
Tables 1 5 and 1 6 provide a good comparison of ash residue resulting from three (3) slightly different waste streams: the LCSWMA waste stream with Cell 1 reclaimed m aterial; the LCSWMA waste stream with York County reclaimed material; and the York County waste stream (MSW only).
The tables show the results of total metals and TCLP analyses. A comparison of the two (2) reclaimed waste streams showed similar total metals concentrations of aluminum, arsenic, barium, cadmium, silver and zinc. The LCSWMA ash stream had higher total metal concentrations of antimony, chromium, lead, mercury, molybdenum, nickel, and selenium .
An analysis of the TCLP test results showed that none of the ash streams exceeded regulatory limits for the metals for which limits are established. Results for the regulated metals showed the Lancaster residue to be considerably higher than the York County residues (without reclaim) in barium, chromium, molybdenum and silver; the York County residues (with and without reclaim) were significantly higher in mercury. TCLP concentrations for antimony, arsenic,
barium, cadmium, molybdenum, nickel, selenium and silver in the LCSWMA ash stream were 2 - 5 times higher than the York reclaimed ash stream, possibly suggesting that these metals have leached from the York reclaimed waste stream over time.
However, it appears that the chemistry of ash generated from the combustion of waste mixed with 15 - 20 year old refuse does not differ markedly from residue resulting from the combustion of refuse mixed with 1 - 4 year old waste.
C. Energy Value
The most reliable method of determi�ing a waste stream's HHV is to perform a boiler calorimetry test while the combustion unit is processing 1 00% of the specified waste stream. To date, boiler calorimetry test results have produced reliable values for the HHV
of the total LCSWMA fuel mixture (5 , 1 2 1 BTU per pound) and for the LCSWMA
reclaimed waste stream (3 ,084 BTU per pound).
1 0 6
The LCSWMA method for calculating the HHV of its reclaimed refuse provides, at best, a reasonable estimate of the material's heating value. The method, however, is very sensitive to fluctuations in the tons of reclaimed material delivered and to the initial assumptions made concerning the HHV of each waste constituent. The average calculated reclaimed waste HHV value for 1 993 was 3 , 149 BTU per pound, or 2 . 1 % higher than the value obtained from the boiler calorimetry test.
The average HHV of the waste reclaimed from the York County Sanitary Landfill using the LCSWMA calculation method was 1 ,45 1 BTU per pound. S ince the project occurred in November and December of 1993, a range of HHV's can be calculated based on the different HHV values for MSW for November and December, and by varying the HHV of the other waste constituents. The HHV range for the York reclaimed stream was calculated to be 1 ,069 to 2,249 BTU per pound. By comparison, the average LCSWMA reclaimed waste HHV for November and December was 2,654 BTU per pound. The HHV of the entire RRF fuel mixture for the project period as determined by the steam correlation method was 5 ,004 BTU per pound. Boiler calorimetry tests performed during the project period produced unreliable results due to crane load cell failure.
LCSWMA believes that several factors contributed to the relatively low HHV value for the York County reclaimed stream . One factor, of course, was the unusually high amount of rainfall experienced during the project period. The other contributing factor was the method of excavation used, whereby a large pit was dug (quarrying type of operation) and trash fed to the trommel directly from the pit. Water tended to lay in the pit, making the end product (screened refuse) very wet and dirty. Another factor was that some loads were delivered directly to the facility without being trommeled.
LCSWMA feels that, given additional operating experience with reclamation and by redesigning the excavation, that the HHV of the York County reclaimed waste could be raised to a level close to that achieved by LCSWMA, since it was noted that a large percentage of the waste that was excavated was good, burnable household waste. LCSWMA has found that its "strip mining" technique works well in allowing the excavation to proceed laterally in an orderly fashion across the face of the laridfill. The method provides for adequate storm water control, and prevents the accumulation of methane and rainfall in a pit, which would occur using quarrying-type of excavation techniques. The experience at Cell 1 and York County shows that, by using proper excavation and trommel cleaning techniques (use of compressed air to remove caked on dirt), the heating value of the material can be significantly enhanced.
D. Air Quality
Results from the CEM system for the period during the York County reclamation project show that emissions of carbon monoxide, hydrogen chloride, sulfur dioxide, and nitrogen oxide were not markedly different from when LCSWMA landfill material is being processed. Carbon monoxide emissions ranged from 3 . 1 to 1 8 .7 ppm; hydrogen chloride emissions varied from 8 .0 to 26.4 ppm; sulfur dioxide concentrations ranged from 0. 1 to 1 5 .7 ppm; and nitrogen oxide emissions were between 2 1 4.4 and 282.6 ppm . Average facility emission ranges for all three (3) units for the fourth quarter of 1993, which encompasses the time period of the York project, were as follows : carbon monoxide =
8.9 - 1 0 . 1 ppm; hydrogen chloride = 1 5 .7 - 1 7.9 ppm; sulfur dioxide = 2.4 - 5 .0 ppm; and nitrogen oxide = 1 87.4 - 256.8 ppm . None of the emissions experienced during the time
1 0 7
of the York County project exceeded the facility's air permit. OMSL operators noticed
that York's 1 5 - 20 year old reclaimed waste also produced relatively high HCL emissions, siro ilar to levels experienced when processing the Lancaster stream .
A comparison of the source test emissions provided in Table 13 showed that concentrations from the York County waste were lower in arsenic, beryllium, cadmium, lead, mercury, and nickel. One might conclude then, that the LCSWMA reclaimed material, or "younger" waste, has higher concentrations of these metals than the "older" York waste. This conclusion cannot be made, however, due to insufficient evidence.
Emissions of dioxins and furans from the York County reclaimed waste were roughly 70% lower than average emissions for these parameters at the LCSWMA RRF for the April 1991 through October 1 993 time period.
The air monitoring tests (area samples only) that were performed at the Cell I reclamation site were also done at the York reclamation site and during the test excavations at the Eastern Lift. The results show that many of the gases found at Cell 1 were also found at the York County and Eastern Lift sites. The results are presented in Tables 20 through 22.
HCI was detected in similar concentrations at the Cell 1 and at the upwindldownwind locations of the test pits at the Eastern Lift. The maximum HCI concentration from the Eastern Lift work site samples (ones closest to the excavated pits) was 540 ug/m3, which is over 3 times the maximum concentration found at Cell l .
Of the metals, only barium was detected at Cell 1 ; concentration ranges were 1 0 - 14 ug/m3, with an OSHA PEL of 500 ug/m3• The Eastern Lift was the only location where chlorinated pesticides were detected, possibly indicative of the disposal practices of 1 0 years ago.
A greater quantity of VOC's were detected at the Cell 1 site than at either the York County or Eastern Lift sites, possibly due to the age of the refuse, since gas generation rates decline exponentially after a landfill is closed.s However, the compounds that predominate at all sites are methylene chloride, ethylbenzene, Freon-l l , xylene, styrene and toluene; these compounds are present at sites where refuse is decomposing. The Cell 1 (downwind of trommel) and Eastern Lift concentrations were similar; concentrations of ethylbenzene, methylene chloride, xylene, and toluene at the York County site were 2 -1 0 times higher than the Cell i or Eastern Lift sites. The reason for this is unclear, since one would expect the concentrations in the more decomposed refuse to be lower.
Cell 1 VOC concentrations at the upper excavation sites were higher than the samples taken downwind of the trommel; it has already been demonstrated that there is greater volatilization at the sites where the landfilled refuse is first excavated.
Elevated particulate concentrations at the York County site were not detected, owing to the wet conditions during the project time period. One ( 1 ) test result at the Eastern Lift
site produced respirable silica quartz concentrations of 1 70 ug/m3, exceeding the OSHA PEL of 1 00 ug/m3.
1 0 8
The conclusion reached is that the compounds detected at all three (3) sites can be expected to be present in varying concentrations at any landfill and, by extension, any landfill reclamation site where refuse is decomposing. The York County data is based on only three (3) sample points and needs to be investigated further. But the overall conclusion is that excavating and trommeling waste buried for 1 - 20 years produce ambient concentrations of hazardous air pollutants that are several orders of magnitude below the OSHA PEL.
1 0 9
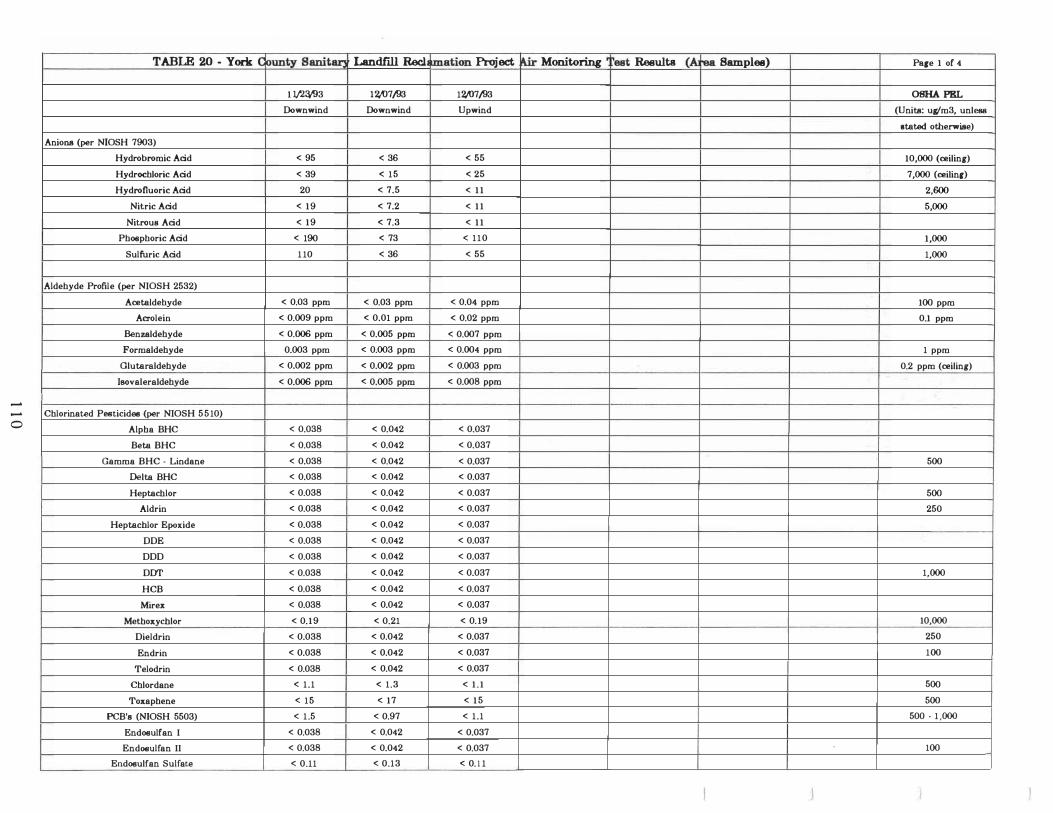
TABLE 20 - York C ounty Sanit8I1 Landf"ill Reel lID.ation Project � Monitoring �est Results (AI rea Samples) Pare 1 of 4
1 l/2;W3 .1z..tl7/93 1?JU7/93 OSHA PEL Downwind Downwind Upwind (Units: ugm3, unless
stated otherwise)
Anions (per NIOSH 7903)
Hydrobromic Acid < 95 < 36 < 55 10,000 (ceiling)
Hydrochloric Acid < 39 < 15 < 25 7,000 (ceilin,)
Hydrofluoric Acid 20 < 7.5 < 1 1 2,600
Nitric Acid < 19 < 7.2 < 1 1 5,000
Nitrous Acid < 19 < 7.3 < 1 1
Phosphoric Acid < 190 < 73 < 110 1,000
Sulfuric Acid 1 10 < 36 < 55 1,000
Aldehyde Profile (per NIOSH 2532)
Acetaldehyde < 0.03 ppm < 0.03 ppm < 0.04 ppm 100 ppm
Acrolein < 0.009 ppm < 0.01 ppm < 0.02 ppm 0.1 ppm
Benzaldehyde < 0.006 ppm < 0.005 ppm < 0.007 ppm
Formaldehyde 0.003 ppm < 0.003 ppm < 0.004 ppm 1 ppm
Glutaraldehyde < 0.002 ppm < 0.002 ppm < 0.003 ppm 0.2 ppm (ceiling)
180valeraldehyde < 0.006 ppm < 0.005 ppm < 0.008 ppm
--.... Chlorinated Pesticides (per NIOSH 5510) o Alpha BHC < 0.038 < 0.042 < 0.037
Beta BHC < 0.038 < 0.042 < 0.037
Gamma BHC . Lindane < 0.038 < 0.042 < 0.037 500
Delta BHC < 0.038 < 0.042 < 0.037
Heptachlor < 0.038 < 0.042 < 0.037 500
Aldrin < 0.038 < 0.042 < 0.037 250
Heptachlor Epoxide < 0.038 < 0.042 < 0.037
DDE < 0.038 < 0.042 < 0.037
DDD < 0.038 < 0.042 < 0.037
DDT < 0.038 < 0.042 < 0.037 1,000
HCB < 0.038 < 0.042 < 0.037
Mirex < 0.038 < 0.042 < 0.037
Methoxychlor < 0.19 < 0.21 < 0. 19 10,000
Dieldrin < 0.038 < 0.042 < 0.037 250
Endrin < 0.038 < 0.042 < 0.037 100
Telodrin < 0.038 < 0.042 < 0.037
Chlordane < 1.1 < 1.3 < 1 . 1 500
Toxaphene < 15 < 17 < 1 5 500
PCB's (NIOSH 5503) < 1 .5 < 0.97 < 1.1 500 · 1 ,000
Endosulfan I < 0.038 < 0.042 < 0.037
End08ulfan II < 0.038 < 0.042 < 0.037 100
Endosulfan Sulfate < 0.11 < 0.13 < 0. 1 1
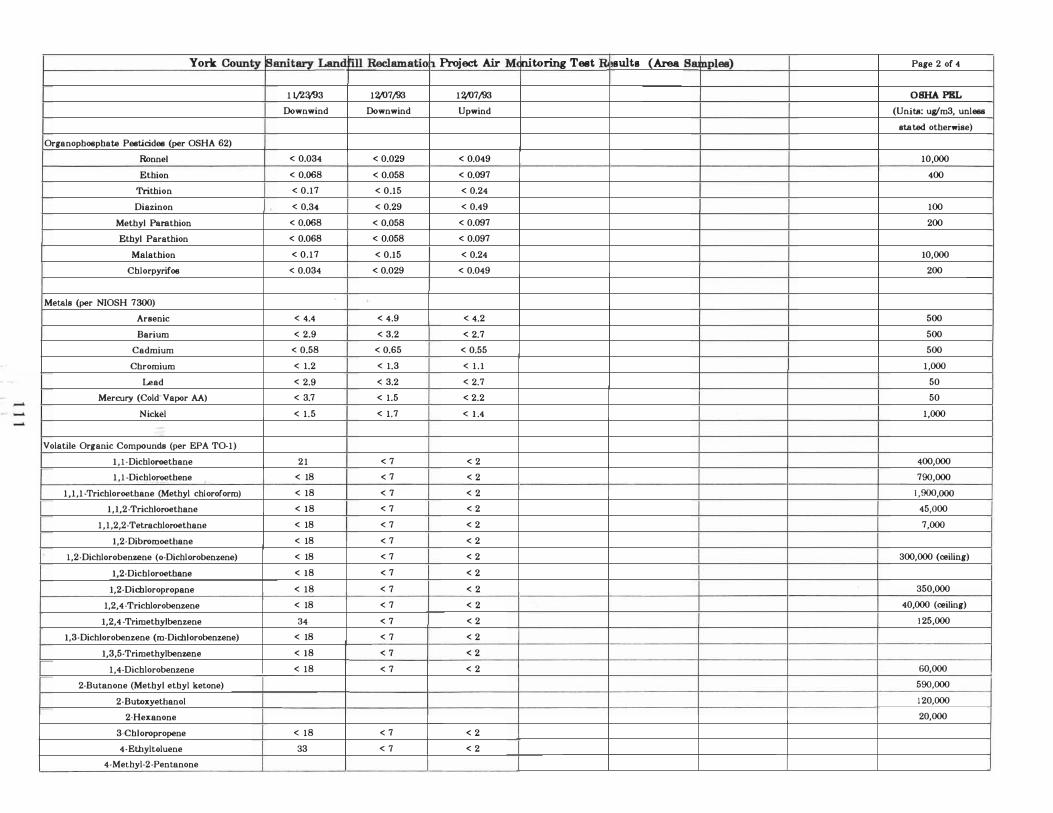
r
York County �anitary Land �ll Reclamatio � Project Air M( nitoring Test R suIts (Area Sw �ples) Page 2 of 4
1 1/l:y93 1�7/93 1�7/93 OSHA PRL
Downwind Downwind Upwind (Units: ug/m3, unless
stated otherwise)
Organophosphate Pesticides (per OSHA 62)
Ronnel < 0.034 < 0.029 < 0.049 10,000
Ethion < 0.068 < 0.058 < 0.097 400
Trithion < 0.17 < 0.15 < 0.24
Diazinon < 0.34 < 0.29 < 0.49 100
Methyl Parathion < 0.068 < 0.058 < 0.097 200
Ethyl Parathion < 0.068 < 0.058 < 0.097
Malathion < 0.17 < 0.15 < 0.24 10,000
Chlorpyrifos < 0.034 < 0.029 < 0.049 200
Metsls (per NIOSH 7300)
Arsenic < 4.4 < 4.9 < 4.2 500
Barium < 2.9 < 3.2 < 2.7 500
Cadmium < 0.58 < 0.65 < 0.55 500
Chromium < 1.2 < 1.3 < 1 . 1 1,000
Lead < 2.9 < 3.2 < 2.7 50
- Mercury (Cold-Vapor AA) < 3.7 < 1.5 < 2.2 50
Nickel < 1.5 < 1.7 < 1 .4 1,000
Volatile Organic Compounas (per EPA TO·1)
1 , I ·Dichloroethane 2 1 < 7 < 2 400,000
1 , I ·Dichloroethene < 18 < 7 < 2 790,000
1,1,1 ·'l'richloroethane (Methyl chloroform) < 18 < 7 < 2 1 ,900,000
1,1,2·Trichloroethane < 18 < 7 < 2 45,000
1,1,2,2·Tetrachloroethane < 18 < 7 < 2 7,000
1,2·Dibromoetbane < 18 < 7 < 2
1,2·Dichlorobenzene (o·Dichlorobenzene) < 18 < 7 < 2 300,000 (ceiling)
1,2·Dichloroethane < 18 < 7 < 2
1,2·Dichloropropane < 18 < 7 < 2 350,000
1,2,4·Trichlorobenzene < 18 < 7 < 2 40,000 (ceiling)
1,2,4·Trimethylbenzene 34 < 7 < 2 1 25,000
1,3·Dichlorobenzene (m·Dichlorobenzene) < 18 < 7 < 2
1,3,5·'l'rimethylbenzene < 18 < 7 < 2
1,4·Dichlorobenzene < 18 < 7 < 2 60,000 I
2·Butanone (Methyl ethyl ketone) 590,000
2·Butoxyetbanol 1 20,000
2·Hex.anone 20,000
3-Chloropropene < 18 < 7 < 2
4·Ethyltoluene 33 < 7 < 2
4·Methyl·2·Pentanone

York County Sanitary Land 'ill Reclamatio :l Project Air M nitoring Test R.. �ultB (Area Sw nples) Pare 3 of 4
1 1/l�3 1�/93 1�7/93 OSHA PRL Downwind Downwind Upwind (Units: ullm3, unless
stated otherwise)
cis-l,2-Dichloroethene < 18 < 7 < 2
cis-l ,3-Dichl oropropene < 18 < 7 < 2
trans-l ,3-Dichl oropropene < 18 < 7 < 2
Acetone 1,800,000
Benzene < 18 9 < 2 3,250
Benzyl Cbloride < 18 < 7 < 2 5,000
Bromodichlorometbane
Bromofonn 5,000
Bromometbane < 18 < 7 < 2
Butanoic acid, alkyl ester
Butanoic acid, etbyl ester
Butanoic acid, propyl ester
Campbene
Carbon Disulfide 12,000
Carbon Tetrachloride < 18 < 7 < 2 12,600
Cblorobenzene < 18 < 7 < 2 350,000
Cbloroetbane < 18 < 7 < 2 -- Chloroform (Trichlorometbane) < 18 < 7 < 2 9,780
N Cblorometbane < 18 < 7 < 2
Dibromochlorometbane
Dichlorometbane (Metbylene Chloride) 350 < 7 < 2 500,000
Ethylbenzene 82 < 7 < 2 435,000
Freon-ll (Trichlorofluoromethane) < 18 < 7 < 2 5,600,000 (ceiling)
Freon-12 (Dichlorodifluorometbane) 22 < 7 < 2 4,950,000
Freon-1 13 (1,1 ,2-Trichloro-I ,2,2-trifluoroetbane) < 18 < 7 < 2 7,600,000
Freon-1 14 (l,2-Dichlorotetrafluoroethane) < 18 < 7 < 2
Hexachlorobutsdiene < 18 < 7 < 2 240
Lirnonene
nVp-Xylene (1,:Vl,4-Dimethylbenzene) 170 17 < 2 435,000
o-Xylene (1,2-Dimetbylbenzene) 45 < 7 < 2 435,000
Xylenes (Total) 215 17 < 2 435,000
Styrene < 18 < 7 < 2 215,000
Tetrachloroethene < 18 < 7 < 2 170,000
Toluene 330 24 < 2 375,000
Trichloroethene < 18 < 7 < 2 270,000
Vinyl Acetste 30,000
Vinyl Chloride < 18 < 7 < 2 1 ppm ---

....... - ....... _ w
York County
Silica (per NIOSH 7500)
Respirable Dust (NIOSH 600)
Quartz
Cristobalite
Miscellaneous Parameters
Yeast & Mold (BAM)
Fibers (NIOSH 7400A)
Totsl Particulate (NIOSH 500)
Ammonia (NIOSH 6701)
Aerobic Bacteria (BAM)
Noise (OSHA Std.)
Carbon Monoxide (DT = detector tube)
Amines (IYI')
Hydrogen Sulfide (IYI')
Nitrogen Dioxide (IYI')
Sulfur Dioxide (IYI')
NOTES:
ND - Not detected
BAM . Bacteriological Analysis Method
CFU/m3 - Colony forming units per rn3 of air
Units: fibers > 5 microns in length per ml of air
c: \ 123 ... w\protrr ..... \aYorl<are •. wk' -_.
. 1
�anitary Land
1 l/.!;:W3
Downwind
< 200
< 23
< 23
< 0.005
(See Notes)
< 300
< 0.60 ppm
ND
ND
ND
ND
ND
�ll Reclamatio 11 Project Air Me nitoring Test Ro �ult8 (Area Sa: Inples) Page 4 of 4
12/tY7j93 1 Ml7j93 OSHA PEL
Downwind Upwind (Units: ug/m3, unless
stated otherwise)
< 300 < 300 5,000
< 26 < 28 100
< 26 < 28 50
300 840 Not appl.
(See Notes)
< 0.006 < 0.006 0.2 fiber!V'cc
< 300 < 200 15,000
< 0.63 ppm < 0.68 ppm 35 ppm or 27 mg/m3
600 570 Not appl.
90 dBA
ND ND 35 ppm
ND ND Not appl.
ND ND 10 ppm
ND ND 1 ppm (STEL)
ND ND 2 ppm
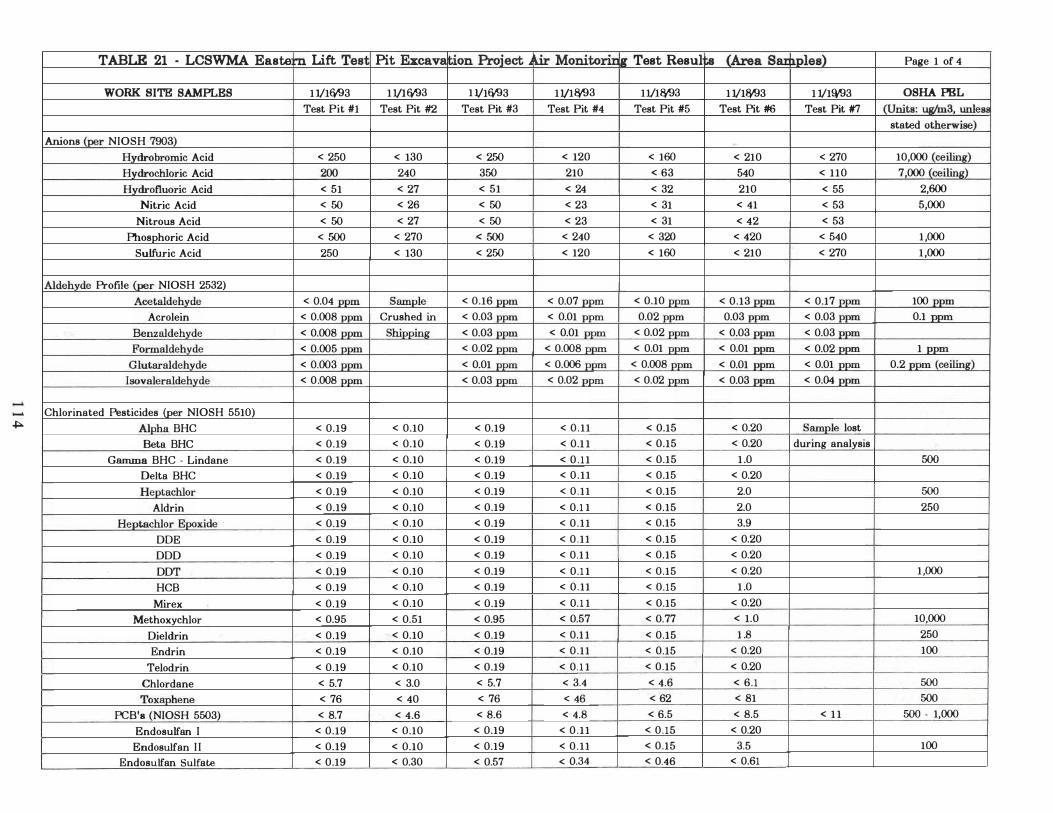
TABLE 21 - LCSWMA Easta m Lift Test Pit Excav8 �on Project � MonitoriI: g Test Resul I;s (Area Saz lples) Page 1 of 4
WORK SITE SAMPLES 1 1/1&93 1 VI &93 1 1/1&93 1V1&93 11/1&93 1 1/1&'93 1 1/1!t'93 OSHA PBL Test Pit #1 Test Pit #2 Test Pit #3 Test Pit #4 Test Pit #5 Test Pit #6 Test Pit #7 (Units: ug/m3, wlleS!
stated otherwise)
Anions (per NIOSH 7903) , Hydrobromic Acid < 250 < 130 < 250 < 120 < 160 < 210 < 270 10,000 (ceiling)
Hydrochloric Acid 200 240 350 210 < 63 540 < 110 7,000 (ceiling)
Hydrofluoric Acid < 51 < 27 < 51 < 24 < 32 210 < 55 2,600
Nitric Acid < 50 < 26 < 50 < 23 < 31 < 41 < 53 5,000
Nitrous Acid < 50 < 27 < 50 < 23 < 31 < 42 < 53
Phosphoric Acid < 500 < 270 < 500 < 240 < 320 < 420 < 540 1 ,000
Sulfuric Acid 250 < 130 < 250 < 120 < 160 < 210 < 270 1 ,000
Aldehyde Profile (per NIOSH 2532)
Acetaldehyde < 0.04 ppm Sample < 0.16 ppm < 0.07 ppm < 0.10 ppm < 0.13 ppm < 0.17 ppm 100 ppm Acrolein < 0.008 ppm Crushed in < 0.03 ppm < 0.01 ppm 0.02 ppm 0.03 ppm < 0.03 ppm 0.1 ppm
Benzaldehyde < 0.008 ppm Shipping < 0.03 ppm < 0.01 ppm < 0.02 ppm < 0.03 ppm < 0.03 ppm Formaldehyde < 0.005 ppm < 0.02 ppm < 0.008 ppm < 0.01 ppm < 0.01 ppm < 0.02 ppm 1 ppm
Glutaraldehyde < 0.003 ppm < 0.01 ppm < 0.006 ppm < 0.008 ppm < 0.01 ppm < 0.01 ppm 0.2 ppm (ceiling)
lsovaleraldehyde < 0.008 ppm < 0.03 ppm < 0.02 ppm < 0.02 ppm < 0.03 ppm < 0.04 ppm
...... Chlorinated Pesticides (per NIOSH 5510) � Alpha BHC < 0.19 < 0.10 < 0.19 < 0 .11 < 0.15 < 0.20 Sample lost
Beta BHC < 0.19 < 0.10 < 0.19 < 0.1 1 < 0.15 < 0.20 during analysis
Gamma BHC - Lindane < 0.19 < 0.10 < 0.19 < 0 . 1 1 < 0.15 1 .0 500 Delta BHC < 0.19 < 0.10 < 0.19 < 0 .11 < 0.15 < 0.20
Heptachlor < 0.19 < 0.10 < 0.19 < 0 .11 < 0.15 2.0 500 Aldrin < 0.19 < 0.10 < 0.19 < 0.1 1 < 0.15 2.0 250
Heptachlor Epoxide . < 0.19 < 0.10 < 0.19 < 0 . 11 < 0.15 3.9
DOE < 0.19 < 0.10 < 0.19 < 0 .11 < 0.15 < 0.20
DOD < 0.19 < 0.10 < 0.19 < 0.1 1 < 0.15 < 0.20
DDT < 0.19 < 0.10 < 0.19 < 0.1 1 < 0.15 < 0.20 1 ,000
HCB < 0.19 < 0.10 < 0.19 < 0 .11 < 0.15 1 .0
Mirex < 0.19 < 0.10 < 0.19 < 0.1 1 < 0.15 < 0.20
Methoxychlor < 0.95 < 0.51 < 0.95 < 0.57 < 0.77 < 1.0 10,000
Dieldrin < 0.19 < 0.10 < 0.19 < 0.1 1 < 0.15 1 .8 250
Endrin < 0.19 < 0.10 < 0.19 < 0 .11 < 0.15 < 0.20 100
Telodrin < 0.19 < 0.10 < 0.19 < 0. 1 1 < 0.15 < 0.20
Chlordane < 5.7 < 3.0 < 5.7 < 3.4 < 4.6 < 6.1 500 Toxaphene < 76 < 40 < 76 < 46 < 62 < 81 500
PCB's (NIOSH 5503) < 8.7 < 4.6 < 8.6 < 4.8 < 6.5 < 8.5 < 1 1 500 - 1,000
Endosulfan I < 0.19 < 0.10 < 0.19 < 0 . 11 < 0.15 < 0.20
Endosulfan I I < 0.19 < 0.10 < 0.19 < 0 . 11 < 0.15 3.5 100
Endosulfan Sulfate < 0.19 < 0.30 < 0.57 < 0.34 < 0.46 < 0.61

....... ....... U\
I I
LCSWMA Eastern Lift
WORK SITE SAMPLES
Organophosphate Pesticides (per OSHA 62)
Ronnel Ethion
Trithion Diazinon
Methyl Parathion Ethyl Parathion
Malathion Chlorpyrifos
Metals (per NIOSH 7300) Arsenic
Barium Cadmium
Chromium Lead
Mercury (Cold Vapor AA) Nickel
�
Volatile Organic CompoUnds (per EPA TO-I) 1 ,1 -Dicliloroethane 1 ,1 -Dicltloroethene
l , l , l-Trichloroethane (Methyl chloroform) 1 ,1 ,2-Trichloroethane
1 ,1 ,2,2-Tetrachloroethane
1,2-Dibromoethane 1 ,2-Dichlorobenzene (0-Dichlorobenzene)
1 ,2-Dichloroethane 1 ,2-Dichloropropane
1,2,4-Trichlorobenzene 1 ,2,4-Trimethylbenzene
1,3-Dichlorobenzene (m-Dichlorobenzene) 1 ,3,5-Trimethylbenzene
1,4-Dichlorobenzene
2-Butanone (Methyl ethyl ketone) 2-Butoxyethanol
2-Hexanone 3-Chloropropene 4-Ethyltoluene
4-Methyl-2-Pentanone
Test Pit El cavation 11: oject Air Mo
1 1/1W-}3 1 1/1W-}3 1 1/lW-}3 Test Pit #1 Test Pit #2 Test Pit #3
< 0.17 < 0.091 < 0.17 < 0.34 < 0.18 < 0.34 < 0.85 < 0.45 < 0.85 < 1 .7 < 0.90 < 1 .7
< 0.34 < 0.18 < 0.34 < 0.34 < 0.18 < 0.34 < 0.85 < 0.45 < 0.85 < 0.17 < 0.091 < 0. 17
< 25 < 1 3 < 25 < 17 < 8.8 < 17 < 3.3 < 1 .8 < 3.3 < 6.6 < 3.5 < 6.6 < 17 < 8.8 < 17 < 22 < 12 < 22 < 8.6 < 4.6 < 8.6
< 26 < 12 < 1 1 < 26 < 12 < 1 1 < 26 < 12 < 1 1 < 26 < 12 < 1 1 < 26 < 12 < 1 1 < 26 < 12 < 1 1 < 26 < 12 < 1 1
< 26 < 12 < 1 1 < 26 < 12 < 1 1
< 26 < 12 < 1 1 < 26 < 12 < 1 1 < 26 < 12 < 1 1 < 26 < 12 < 1 1
< 26 < 12 < 1 1
< 26 < 12 < 1 1 < 26 < 12 < 1 1 < 26
r \
�toring Test Results (Arl a Samples) Page 2 of 4
1 1/1�3 1 1/1�3 1 1/1�3 1 1/1!f93 OSHA PBL Test Pit #4 Test Pit #5 Test Pit #6 Test Pit #7 (Units: uglm3, unles!
stated otherwise)
< 0.10 < 0.13 < 0.18 < 0.23 10,000 < 0.20 < 0.27 < 0.36 < 0.45 400
< 0.50 < 0.67 < 0.89 < 1 .1 < 1 .0 < 1.3 < 1.8 < 2.3 100
< 0.20 < 0.27 < 0.36 < 0.45 200 < 0.20 < 0.27 < 0.36 < 0.45 < 0.50 < 0.67 < 0.89 < 1 . 1 10,000 < 0.10 < 0.13 < 0.18 < 0.23 200
< 1 1 < 14 < 19 < 26 500 < 7.1 < 9.5· < 13 < 17 500 < 1 .4 < 1.9 < 2.5 < 3.4 500 < 2.8 < 3.8 < 5.0 < 6.8 1 ,000 < 7.1 < 9.5 < 13 < 17 50 < 9 < 12 < 16 < 20 50
< 3.7 < 5.0 < 6.5 < 8.9 1 ,000
< 5 < 6 < 8 < 4 400,000 < 5 < 6 < 8 < 4 790,000
< 5 < 6 < 8 < 4 1 ,900,000 < 5 < 6 < 8 < 4 45,000 < 5 < 6 < 8 < 4 7,000 < 5 < 6 < 8 < 4 < 5 < 6 < 8 < 4 300,000 (ceiling)
< 5 < 6 < 8 < 4 < 5 < 6 < 8 < 4 350,000
< 5 < 6 < 8 < 4 40,000 (ceiling) < 5 41 < 8 < 4 125,000
< 5 < 6 < 8 < 4 < 5 17 < 8 < 4
< 5 < 6 < 8 < 4 60,000
590,000 120,000 20,000
< 5 < 6 < 8 < 4
< 5 57 9 < 4
-.-0\
LCSWMA Eastern Lift
WORK SITE SAMPLES
cis-I,2-Dichloroethene
cis-1 ,3-Dichloropropene
trans-I ,3-Dichloropropene
Acetone
Benzene Benzyl Chloride
Bromodichloromethane
Bromoform
Bromomethane
Butanoic acid, alkyl ester
Butanoic acid, ethyl ester
Butanoic acid, propyl ester
Camphene Carbon Disulfide
Carbon Tetrachloride
Chlorobenzene
Chloroethane Chloroform (Trichloromethane)
Chloromethane Dibromochloromethane
Dichloromethane (Methylene Chloride)
Ethvlbenzene Freon- l l (Trichlorofluoromethane)
Freon- I2 (Dichlorodifluoromethane)
Freon -113 (1 , 1 ,2-Trichloro- l ,2,2-trifluoroethane)
Freon - 114 (1,2-Dichlorotetrafluoroethane)
Hexachlorobutadiene
Limonene
aVp-Xylene O ,S11,4-Dimethylbenzene)
o-Xylene ( l ,2-Dimethylbenzene)
Xylenes (Total)
Styrene
Tetrachloroethene Toluene
Trichloroethene Vinyl Acetate
Vinyl Chloride
Test Pit El cavation PI !oject Air Mo
1 1/1&'93 1 1/1&'93 1 1/1&'93 Test Pit #1 Test Pit #2 Test Pit #3
< 26 < 12 < 1 1 < 26 < 12 < 1 1 < 26 < 12 < 1 1
< 26 < 12 < 1 1 < 26 < 12 < 1 1
< 26 < 12 < 1 1
< 26 < 12 < 1 1 < 26 < 12 < 1 1 < 26 < 12 < 1 1 < 26 < 12 < 1 1 < 26 < 12 < 1 1
< 26 15 < 1 1 < 26 < 12 < 1 1 < 26 < 12 14 < 26 < 12 < 1 1 < 26 75 < 1 1
< 26 < 12 < 1 1
< 26 < 12 < 1 1
< 26 < 12 16
< 26 < 12 < 1 1 < 26 < 12 16 < 26 < 12 13 < 26 < 12 < 1 1
< 26 15 45
< 26 < 12 < 1 1
< 26 < 12 < 1 1
rltoring Test Results (ArE a Samples) PaKe 3 of 4
1 1/1&93 1 1/1&93 1 1/1&93 1 1/1�3 OSHA PEL Test Pit #4 Test Pit #5 Test Pit #6 Test Pit #7 (Units: ug/m3, unleS!
stated otherwise) < 5 < 6 < 8 < 4 < 5 < 6 < 8 < 4 < 5 < 6 < 8 < 4
1 ,800,000 < 5 < 6 < 8 < 4 3,250 < 5 < 6 < 8 < 4 5,000
5,000 < 5 < 6 < 8 < 4
12,000 < 5 < 6 < 8 < 4 12,600 < 5 < 6 < 8 < 4 350,000 < 5 < 6 < 8 < 4 < 5 < 6 < 8 < 4 9,7SO < 5 < 6 < 8 < 4
< 5 < 6 < 8 < 4 500,000 < 5 46 31 < 4 435,000 9 20 120 < 4 5,600,000 (ceiling)
< 5 < 6 150 < 4 4,950,000 < 5 < 6 < 8 < 4 7,600,000 < 5 < 6 < 8 < 4 < 5 < 6 < 8 < 4 240
10 73 93 5 435,000
< 5 24 29 < 4 435,000 10 97 122 5 435,000
< 5 7 < 8 < 4 215,000
6 9 8 < 4 170,000
30 190 ISO 12 375,000
< 5 < 6 < 8 < 4 270,000 30,000
< 5 < 6 - < 8 -- --_.-
< 4 _ _ I ppm

...... ...... -.l
LCSWMA Eastern Lift
WORK SITE SAMPLES
Silica (per NIOSH 7500)
Respirable Dust (NIOSH 600)
Quartz Cristobalite
Miscellaneous Parameters Yeast & Mold (BAM)
Fibers (NIOSH 7400A)
Total Particulate (NIOSH 500)
Ammonia (NIOSH 6701) Aerobic Bacteria (BAM)
Noise (OSHA Std.) Carbon Monoxide (Detector tube = OT)
Hydrogen Sulfide (DT) NitroK�n Dioxide (OT)
Sulfur Dioxide (OT)
<,
NOTES: � -
ND - Not detected
BAM - Bacteriological Analysis Method
CFU/m3 - Colony forming units per m3 of air
Units: fibers > 5 microns in length per ml of air
c: \ 123r4 w \programs \geastwork.wk4
Test Pit E cavation PI oject Air Mo
1 1/1&93 1 1/1&93 1 1/1&93 Test Pit #1 Test Pit #2 Test Pit #3
< 400 1 ,040 < 1 ,400
< 40 < 74 < 140
< 40 < 74 < 14
240 CFU/m3
(See Notes) < 0.04 < 0.02 < 0.04
(See Notes)
< 1 ,000 < 700 < 1 ,000
< 3.67 ppm < 1.95 ppm < 3.67 ppm 2,150 CFU/m3 70 CFU/m3
ND ND ND
ND ND ND NO ND ND NO ND ND
r
ptoring Test !Results (An a Samples) Page 4 of 4
1 1/1&'93 1 1/1&'93 1 1/1&'93 11/1!f93 OSHA PEL Test Pit #4 Test Pit #5 Test Pit #6 Test Pit #7 (Units: ug/m3, unless
stated otherwise)
< 600 < 800 1,100 < 1,400 5,000 < 61 170 < 1 10 < 140 100 < 61 < 82 < 1 10 < 140 50
Not appl.
< 0.01 < 0.02 < 0.02 < 0.03 0.2 fiber&'cc
< 600 < 800 < 1 ,000 < 1 ,000 15,000
< 1 .8 ppm < 2.36 ppm < 3.1 1 ppm < 4.02 ppm 35 ppm Not appl. 90 dBA
NO NO ND ND 35 ppm
NO NO ND ND
NO NO ND ND
NO NO NO 3 ppm
TABLE 22 - LCSWMA Eastern Lift Test Pit �xcavation Pre
UPWINIVOOWNWIND OF WORK SITE I V1q.93 1 V1q.93 Test Pits #1 - 3 Test Pits #1 - 3
Upwind Downwind Anion8 (per NIOSH 7903)
Hydrobromic Acid < 58 < 42 Hydrochloric Acid 47 34 Hydrofluoric Acid < 12 < 8.7
Nitric Acid < 12 < 8.4 Nitrous Acid < 12 < 8.4
Phosphoric Acid < 120 < 85 Sulfuric Acid < 59 < 42
Aldehyde Profile (per NIOSH 2532)
Acetaldehyde < 0.04 ppm < 0 .04 ppm Acrolein <: 0.007 ppm < 0.008 ppm
Benzaldehyde < 0.007 ppm < 0.008 ppm Formaldehyde < 0.004 ppm < 0.005 ppm
Glutaraldehyde < 0.003 ppm < 0.003 flpm Isovaleraldehyde < 0.008 ppm < 0.008 ppm
-- Chlorinated Pesticides (per NIOSH 5510) 00 Alpha BHC < 0.043 < 0.061
Beta BHC < 0.043 < 0.061 Gamma BHC - Lindane < 0.043 < 0.061
Delta BHC < 0.043 < 0.061 Heptachlor < 0.043 < 0.061
Aldrin < 0.043 < 0.061 Heptachlor Epoxide < 0.043 < 0.061
DOE < 0.043 < 0.061 DOD < 0.043 < 0.061
DDT < 0.043 < 0.061 HCB < 0.043 < 0.061
Mirex < 0.043 < 0.061 Methoxychlor < 0.22 < 0.30
Dieldrin < 0.043 < 0.061 Endrin < 0.043 < 0.061
Telodrin < 0.043 < 0.061
Chlordane < 1 .3 < 1 .8 Toxaphene < 17 < 24
PCB's (NIOSH 5503) < 1 .6 < 2.6 Endosulfan I < 0.043 < 0.061 Endosulfan I I < 0.043 < 0.061
Endosulfan Sulfate < 0.13 < 0.18
Iject Air Monit
1 V1&93
Test Pits #4 - 6
Upwind
< 46 28
< 9.7 < 9.3 < 9.4 < 95
< 47
< 0.03 ppm < 0.006 ppm < 0.006 ppm < 0.003 ppm < 0.002 ppm < 0.006 ppm
< 0.038 < 0.038 < 0.038 < 0.038 < 0.038
< 0.038 < 0.038 < 0.038 < 0.038
< 0.038 < 0.038
< 0.038 < 0.19
< 0.038 < 0.038 < 0.038
< 1 .1 < 15
< 1 .4 < 0.038 < 0.038 < 0.11
loring Test Re�
1 V1&93 Test Pits #4 - 6
Downwind
< 35 < 14 < 7.2 < 7
< 7 < 71
< 35
< 0.03 ppm < 0.006 ppm < 0.007 ppm < 0.004 ppm < 0.003 ppm < 0.007 ppm
< 0.036 < 0.036 < 0.036 < 0.036
< 0.036
< 0.036 < 0.036
< 0.036 < 0.036
< 0.036 < 0.036
< 0.036 < 0.18
< 0.036 < 0.036
< 0.036
< 1 . 1 < 14 < 1 .6
< 0.036 < 0.036
ults (Area Sa
1 V1!W3
Test Pit #7 Upwind
< 240 < 98
< 50 < 48 < 48
< 480 < 240
< 0.16 ppm < 0.03 ppm
< 0.03 ppm < 0.02 ppm < om ppm < 0.03 ppm
Samples during
< 7.4
< 0.1) _ __
mp!es) Page 1 of 4
1 V1!W3 OSHA PEL Test Pit #7 (Unit8: ug/m3, unle88
Downwind stated otherwise)
< 190 10,000 (ceiling) < 77 7,000 (ceiling)
< 40 2,600 < 38 5,000 < 38
< 390 1,000 < 190 1,000
< 0.19 ppm 100 ppm < 0.04 ppm 0.1 ppm < 0.04 ppm < 0.02 ppm 1 ppm < 0.01 ppm 0.2 ppm (ceiling) < 0.04 ppm
lost analysis
500
500 250
1 ,000
10,000 250 100
500 500
< 8.9 500 - 1,000
100
I--' -\0
LCSwMA Eastern Lift '1
UPWINQIDOWNWIND OF WORK SITE
Organophosphate Pesticides (per OSHA 62)
Ronnel Ethion
Trithion Diazinon
Methyl Parathion Ethyl Parathion
Malathion Chlorpyrifo
's
Metals (per NIOSH 7300) Arsenic Barium
Cadmium Chromium
Lead Mercury (Cold Vapor AA)
- Nickel
Volatile Organic Comlxfunds (per EPA TO- I)
l , l -Dichloroethane 1 ,1-Dichloroethene
1 ,1 ,1 · Trichloroethane (Methyl chloroform) 1 ,1 ,2-Trichloroethane
1,1 ,2,2-Tetrachloroethane l,2-Dibromoethane
1 ,2· Dichloro benzene (0' Dichlorobenzene)
l ,2-Dichloroethane 1 ,2-Dichloropropane
1,2,4-Trichlorobenzene 1 ,2,4-Trimethylbenzene
l ,3·Dichlorobenzene (m-Dichlorobenzene) 1 ,3,5-Trimethylbenzene
l ,4-Dichlorobenzene
2·Butanone (Methyl ethyl ketone) 2-Butoxyethanol
2·Hexanone 3-Chloropropene 4-Ethyltoluene
4·Methyi·2·Pentanone
r
est Pit Excavf tion Project A
1 1/1/:W3 11/1/:W3 Test Pits #1 - 3 Test Pits #1 - 3
Upwind Downwind
< 0.04 < 0.053 < 0.079 < 0 .11 < 0.20 < 0.27 < 0.40 < 0.53
< 0.079 < 0 .11 < 0.079 < 0.11 < 0.20 < 0.27 < 0.04 < 0.053
< 5.4 < 5.7 < 3.6 < 3.8
< 0.71 < 0.76 < 1 .4 < 1 .5 < 3.6 < 3.8 < 2.8 < 4.8 < 1 .9 < 2.0
< 6 < 10 < 6 < 10 < 6 < 10
< 6 < 10 < 6 < 10
< 6 < 10 < 6 < 10
< 6 < 10 < 6 < 10
< 6 < 10 < 6 < 10
< 6 < 10 < 6 < 10
< 6 < 10
< 6 < 10 < 6 < 10
lr Monitoring rest Results ( !Area Samples Page 2 of 4
1 1/1�3 1 1/1�3 1 1/1!t93 1 1/1!t93 OSHA PEL Test Pits #4 - 6 Test Pits #4 - 6 Test Pit #7 Test Pit #7 (Units: ulrlm3, unless
Upwind Downwind Upwind Downwind stated otherwise)
< 0.035 < 0.032 < 0.18 < 0.18 10,000 < 0.069 < 0.065 < 0.36 < 0.35 400 < 0.17 < 0.16 < 0.89 < 0.88 < 0.35 < 0.32 < 1 .8 < 1 .8 100
< 0.069 < 0.065 < 0.36 < 0.35 200 < 0.069 < 0.065 < 0.36 < 0.35 < 0.17 < 0.16 < 0.89 < 0.88 10,000
< 0.035 < 0.032 < 0.18 < 0.18 200
< 4.2 < 4.8 < 21 < 26 500 < 2.7 < 3.2 < 14 < 17 500
< 0.55 < 0.63 < 2.8 < 3.4 500 < 1 . 1 < 1 .3 < 5.6 < 6.9 1 ,000 < 2.7 < 3.2 < 14 < 17 50 < 2.4 < 4.3 < 13 < 23 50 < 1 .4 < 1 .6 < 7.3 < 8.9 1 ,000
< 5 < 4 < 6 < 1 1 400,000 < 5 < 4 < 6 < 1 1 790,000 < 5 < 4 < 6 < 1 1 1 ,900,000 < 5 < 4 < 6 < 1 1 45,000 < 5 < 4 < 6 < 1 1 7,000 < 5 < 4 < 6 < 1 1 < 5 < 4 < 6 < 1 1 300,000 (ceiling) < 5 < 4 < 6 < 1 1
< 5 < 4 < 6 < 1 1 350,000
< 5 < 4 < 6 < 1 1 40,000 (ceiling) < 5 < 4 < 6 < 1 1 125,000 < 5 < 4 < 6 < 1 1 < 5 < 4 < 6 < 1 1
< 5 < 4 19 < 1 1 60,000 590,000 120,000 20,000
< 5 < 4 < 6 < 1 1
< 5 < 4 < 6 < 1 1
..... tv o
LCSWMA Eastern Lift '1
UPWINLVOOWNWIND OF WORK SITE
cis-1 ,2-Dichloroethene
cis-1 ,3-Dichloropropene trans-1,3-Dichloropropene
Acetone Benzene
Benzyl Chloride Bromodichloromethane
Bromoform Bromomethane
Butanoic acid, alkyl ester
Butanoic acid, ethyl ester Butanoic acid, propyl ester
Camphene Carbon Disulfide
Carbon Tetrachloride Chloro benzene Chloroethane
Chloroform (Trichloromethane)
Chloromethane Dibromochloromethane
Dichloromethane (Methylene Chloride) Ethylbenzene
Freon-1 1 (Trichlorofluoromethane)
Freon -12 (Dichlorodifluoromethane) Freon- 113 (1 ,1 ,2-Trichloro-l ,2,2-trifluoroethane)
Freon - 114 (1 ,2-Dichlorotetrafluoroethane) Hexachlorobutadiene
Limonene nVp-Xylene (1 ,'VI ,4-Dimethylbenzene)
o-Xylene (1 ,2-Dimethylbenzene) Xylenes (Total)
Styrene Tetrachloroethene
Toluene Trichloroethene
Vinyl Acetate Vinyl Chloride
est Pit Excav� tion Project A � Monitoring
11/lfW3 1 1/1fW3 1 1/llW3
Test Pits #1 - 3 Test Pits #1 - 3 Test Pits #4 - 6
Upwind Downwind Upwind < 6 < 10 < 5
< 6 < 10 < 5
< .6 < 10 < 5
< 6 < 10 < 5
< 6 < 10 < 5
< 6 < 10 < 5
<' 6 < 10 < 5 < 6 < 10 < 5 < 6 < 10 < 5 < 6 < 10 < 5
< 6 < 10 < 5
< 6 < 10 < 5 < 6 12 < 5
< 6 < 10 < 5 < 6 < 10 < 5
6 20 < 5
< 6 < 10 < 5
< 6 < 10 < 5
< 6 24 < 5
< 6 < 10 < 5 < 6 24 < 5
< 6 < 10 < 5
< 6 < 10 < 5
1 1 120 < 5
< 6 < 10 < 5
< 6 < 10 --'--- < 5
rest Results ( Area Samples Page 3 of 4
1 1/llW3 11/l�3 11/l�3 OSHA PEL Test Pits #4 - 6 Test Pit #7 Test Pit #7 (Units: ug/m3, unless
Downwind Upwind Downwind stated otherwise) < 4 < 6 < 1 1
< 4 < 6 < 1 1 < 4 < 6 < 1 1
1 ,800,000 < 4 < 6 < 1 1 3,250
< 4 < 6 < 1 1 5,000
5,000 < 4 < 6 < 1 1
12,000
< 4 < 6 <: 1 1 12,600 < 4 < 6 < 1 1 350,000 < 4 < 6 < 1 1 < 4 7 < 1 1 9,780 < 4 < 6 < 1 1
< 4 89 < 1 1 500,000 5 < 6 < 1 1 435,000
18 < 6 < 1 1 5,600,000 (ceiling)
18 < 6 < 1 1 4,950,000 < 4 230 < 1 1 7,600,000
< 4 < 6 < 1 1 < 4 < 6 < 1 1 240
14 8 < 1 1 435,000
< 4 < 6 < 1 1 435,000
14 8 < 1 1 435,000
< 4 < 6 < 1 1 215,000
< 4 < 6 < 1 1 170,000
29 20 15 375,000
< 4 < 6 < 1 1 270,000 30,000
< 4 < 6 < 1 1 1 ppm
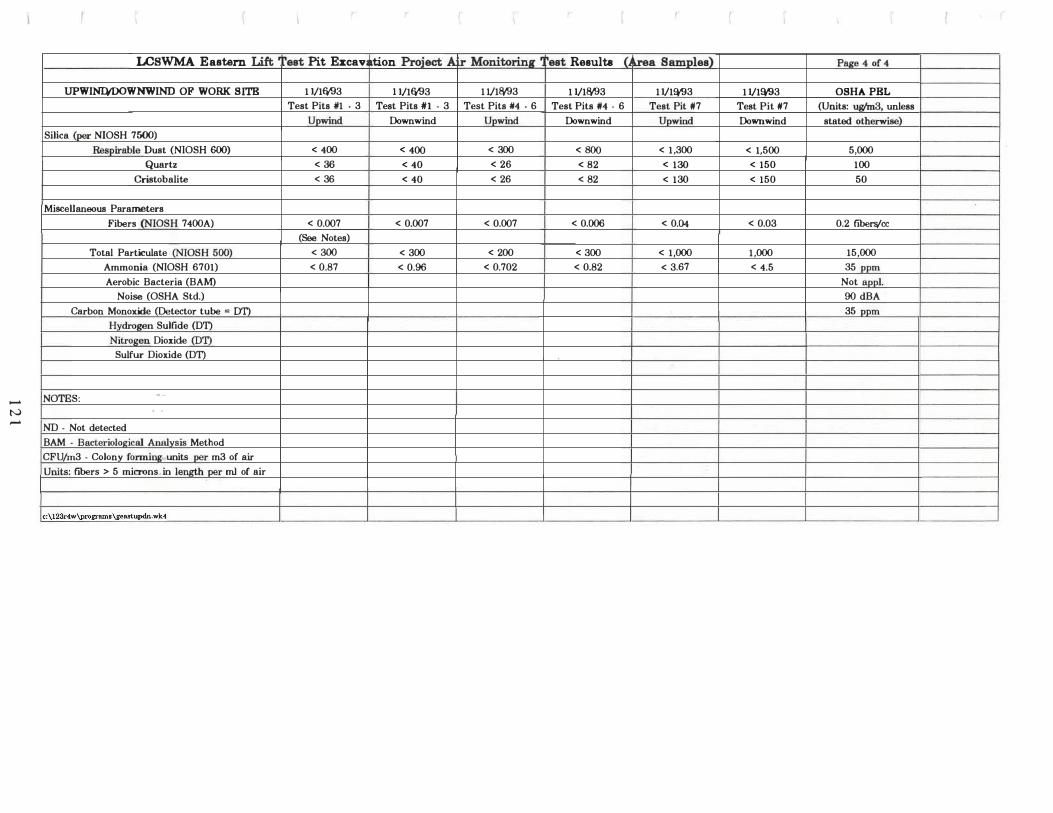
LCSWMA Eastern Lift ' "est Pit ElI:cav tion Project A lr Monitoring � �est Results (, u-ea Bamples) PIlJI'e 4 of 4
UPWINM>OWNWIND OF WORK SITE 1 1/1&'93 1 1/1&'93 1 1/1&'93 1 1/1&'93 1 1/1!W3 1 1/1\W3 OSHA PEL
Test Pits N1 . 3 Test Pits 'I . 3 Test Pits '4 . 6 Test Pits #4 . 6 Test Pit #7 Test Pit #7 (Units: uJ(/m3, unless Upwind Downwind Upwind Downwind Upwind Downwind stated otherwise)
Silica (per NIOSH 7500) Respirable Dust (NIOSH 600) < 400 < 400 < 300 < 800 < 1 ,300 < 1,500 5,000
Quartz < 36 < 40 < 26 < 82 < 130 < 150 100 Cristobalite < 36 < 40 < 26 < 82 < 130 < 150 50
Miscellaneous Parameters Fibers (NIOSH 7400A) < 0.007 < 0.007 < 0.007 < 0.006 < 0.04 < 0.03 0.2 fibeny'cc
(See Notes) Total Particulate (NIOSH 5(0) < 300 < 300 < 200 < 300 < 1,000 1 ,000 15,000
Ammonia (NIOSH 6701) < 0.87 < 0.96 < 0.702 < 0.82 < 3.67 < 4.5 35 ppm Aerobic Bacteria (BAM) Not app!.
Noise (OSHA Std.) 90 dBA Carbon Monoxide (Detector tube = on 35 ppm
Hydrogen Sulfide (OT) Nitrogen Dioxide (DT)
Sulfur Dioxide (OT)
,...... NOTES: � .
N . . ,...... NO . Not detected
BAM . Bacteriological Analysis Method • CFU/m3 . Colony forming units per m3 of air I Units: fibers > 5 microns.in lenJrth per ml of air
I c:\123r.w\program.\g ..... updn.wk. '---�-----

V. Project Benefits
A. Reclaimed Landfill Space and Cover So/I
Table 1 , shown again on the following page for reference, presents a summary of the essential reclamation project operational and fiscal data for the 1 992 - 1993 period. Over the past two years, Frey Farm Landfill reclamation operations have excavated a total volume of 286,500 cubic yards of material. Trommeling at the landfill produces burnable waste, non-combustibles and recovered soil. Processing at the RRF produces ash residue. Subtracting for the ash and non-combustible volumes leaves a net volume recovery of nearly 2,500 cubic yards of space per week from reclamation activities. For every 1 00 tons excavated, 56 tons of combustible waste, 4 1 tons of recovered soil, and 3 tons of non-processibles are produced.
The obvious benefit from these operations is that the space created helps extend the life of the landfill . The project also provides operational flexibility at the landfill by creating space to permit the landfilling of different materials, should the need arise. Reclamation can also be used to remediate problem sites, such as those that are unlined or ones whose liners are in need of repair.
Cell 1 reclamation operations from 1992 to 1993 have produced an average of 1 ,076 tons of recovered soil per week, or roughly one ton of soil for every ton delivered to the RRF. At present, this material meets PaDER regulations for daily cover soil. Other reclamation projects should be able to recover similar percentages of soil if they employ techniques and equipment used at the Cell 1 site, and past landfilling practices paralleled those used at the Authority's landfill.
8. Energy Production
The LCSWMA experience has proven that its reclaimed m aterial can be processed at the RRF with few negative combustion effects if the fuel is mixed in an approximate ratio of 4: 1 with MSW. When the unit is fired with 1 00% reclaimed m aterial, test results show that the waste processing rate can be 35% higher than the recommended maximum stoker rating of 440 tons per day (with a minimum fuel HHV of 3 ,800 BTU per pound). Refuse bed thicknesses can be noticeably greater than desired, and furnace roof temperatures are generally lower due to the low BTU waste stream; auxiliary fuel may be required, at times, to keep furnace temperatures above permitted minimums. Elevated levels of HCI can also be experienced.
HHV test results from 1993 show that the monthly fuel mixture of MSW, reclaimed waste, tire chips, shredded wood, and permitted residual wastes closely approximates that of pure MSW. Thus, the relatively low HHV reclaimed stream is offset by the combustion of the higher HHV supplementary fuels.
1 2 2
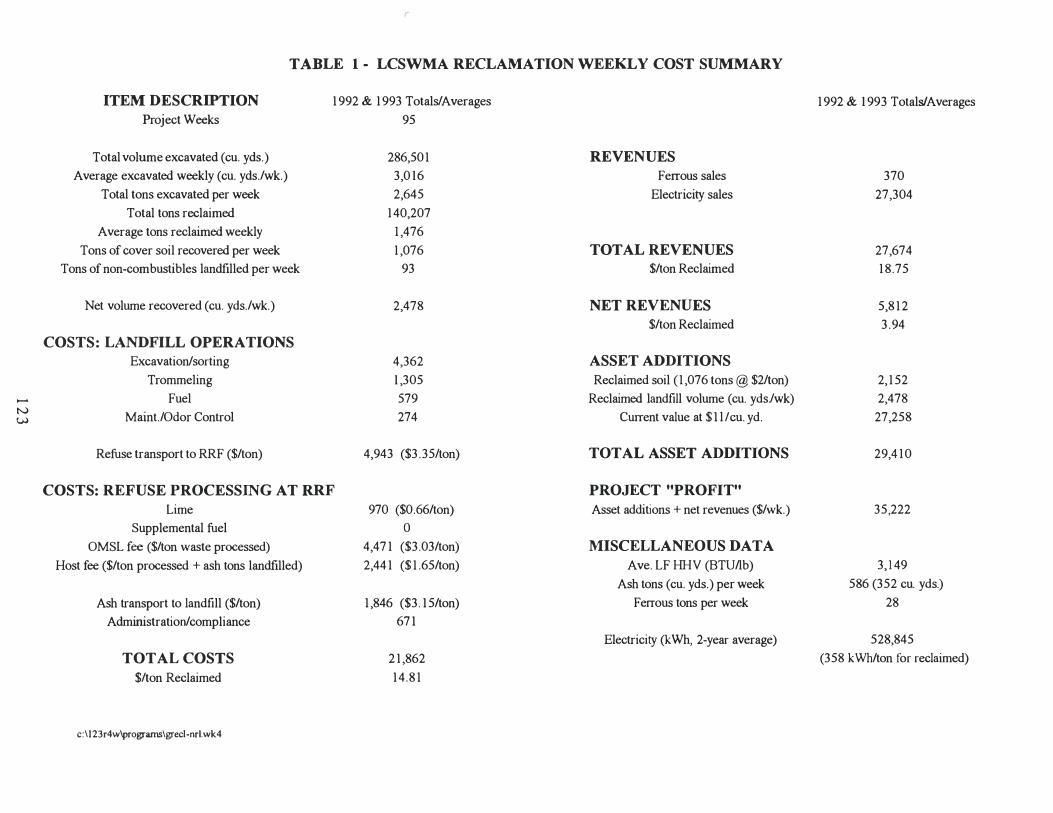
...... tv W
r
TABLE 1 - LCSWMA RECLAMATION WEEKLY COST SUMMARY
ITEM DESCRIPTION
Project Weeks
Total volume excavated (cu. yds.)
Average excavated weekly (cu. yds./wk.)
Total tons excavated per week
Total tons reclaimed
Average tons reclaimed weekly
Tons of cover soil recovered per week
Tons of non-combustibles landfilled per week
Net volume recovered (cu. yds./wk.)
COSTS: LANDFILL OPERATIONS
Excavation/sorting
Trommeling
Fuel
Maint.lOdor Control
Refuse transport to RRF ($/ton)
1992 & 1993 Totals! Averages
95
286,501
3,0 1 6
2,645
140,207
1,476
1,076
93
2,478
4,362
1 ,305
579
274
4,943 ($3.35/ton)
COSTS: REFUSE PROCESSING AT RRF Lime
Supplemental fuel
OMSL fee ($/ton waste processed)
Host fee ($/ton processed + ash tons landfilled)
Ash transport to landfill ($/ton)
Administration/compliance
TOTAL COSTS
$/ton Reclaimed
c:\123r4w\programs\grec1-nrl.wk4
970 ($0.66/ton)
o 4,471 ($3.03/ton)
2,441 ($1.65/ton)
1,846 ($3.15/ton)
671
21,862
14.81
REVENUES
Ferrous sales
Electricity sales
TOTAL REVENUES
$/ton Reclaimed
NET REVENUES
$/ton Reclaimed
ASSET ADDITIONS
Reclaimed soil (1,076 tons @ $2/ton)
Reclaimed landfill volume (cu. yds'/wk)
Current value at $1 lieu. yd.
TOTAL ASSET ADDITIONS
PROJECT "PROFIT"
Asset additions + net revenues ($/wk.)
MISCELLANEOUS DATA
Ave. LF HHV (BTUllb)
Ash tons (cu. yds.) per week
Ferrous tons per week
Electricity (kWh, 2-year average)
f
1992 & 1 993 Totals!Averages
370
27,304
27,674
18.75
5,812
3.94
2,152
2,478
27,258
29,410
35,222
3, 1 49
586 (352 cu. yds.)
28
528,845
(358 kWh/ton for reclaimed)

Towards the latter half of 1 993, it was noticed that the calculated reclaimed stream's HHV was trending downward, possibly due to the age of the refuse. This conclusion could certainly be supported by the HHV values calculated for the York County waste stream . However, on closer inspection, it w� found that although waste age influences the material's heating value to a degree, a more important factor is the method of excavation used. The York County quarrying method was clearly inadequate, and led to extremely dirty waste. Waste observations m ade at the site showed that much of the York County reclaimed stream contained burnable household refuse; less than efficient reclamation procedures produced a substandard fuel.
Over the past two years, the electricity produced from the LCSWMA landfill m aterial has averaged 3 5 8 kilowatt-hours per ton. Table 1 shows that electricity sales have averaged $27,304 per week, or approximately S 1 8 .50 per ton of waste processed �t the RRF. The additional tonnage provided by the reclaimed stream also allowed the facility to maintain a three-unit operation throughout 1992 and 1 993, thereby m aximizing boiler efficiency, power production, and electrical revenues.
C. Recovery of Recyclables
The results of the overs physical characterization studies for the Cell 1 and Eastern Lift sites showed the waste streams to contain roughly 3% recyclable m aterial; the recyclable
content of the York County landfill waste was 4 .8%. One would expect the York County percentage to be higher since recycling was not done to any great degree 1 5 - 20 years ago.
Table 1 shows that for the past two (2) years approximately S370 per week are generated from the sale of marketable ferrous metal from the reclaimed stream.
D. Clean ClosureiMitigation
The potential for landfill site mitigation via reclamation is apparent, based on LCSWMA's experience. The Cell 1 operations have demonstrated that significant volumes of material can be effectively screened to recover combustible material and cover soil. These same techniques could also be applied to sites where relocation or removal of contents is desired. Appropriate stormwater controls must be maintained, and equipment relocation can be kept to a minimum if the excavation is properly designed.
VI. Recommendations For Reclamation Operations
LCSWMA has the following recommendations related to reclamation operations at a landfill and resource recovery facility:
• Plan the excavation site properly so that storm water can be properly controlled, and that methane pockets and equipment relocation can be minimized.
• Ensure that reliable methods are in place for measuring volumes and tons of reclaimed waste, cover soil and non-combustibles; track volumes by field survey methods.
1 2 4

• Make daily observations of the reclaimed waste (try to have the same person make the observations); record data on moisture content, waste composition, waste age, soil content of refuse, rainfall, weather and odor.
• Minimize personnel exposure to the actual reclamation site during trommeling operations; require respirator use (if deemed necessary by tests) if prolonged exposure will occur downwind of the trommel or in the area where the refuse is first unearthed.
• Use odor control when average daytime temperatures exceed 70°F.
• At the resource recovery facility, experiment to find the optimum mix of MSW and reclaimed waste to maximize combustion efficiency. Supplement the reclaimed stream with materials having high HHV's. Feed only well-mixed refuse to the boilers.
• Air monitoring tests should be conducted at the reclam'ation site. Obtain area and personal samples; monitor the site on a daily basis for methane, oxygen and volatile organic chemicals, and establish action levels for each parameter.
• Perform physical quarterly and chemical characterization studies on the unders and overs.
• Conduct periodic boiler calorimetry tests to determine the HHV of the entire fuel mixture. Perform at least one ( 1 ) test on a unit fired with 100% reclaimed waste to establish a baseline HHV for the reclaimed material.
• Perform quarterly air monitoring on the tipping floor; require respirator use if tests warrant.
• Test ash residue quarterly for the full range of total and TCLP metals, moisture content, pH, percent carbon, and chlorides.
VII. Recommendations For Further Research
Based on its experience to date, LCSWMA believes that the following topics merit further research:
• Determine the reasons for elevated chloride emissions experienced when reclaimed waste is co-combusted with MSW.
• Compare the HHV data from this project to reclaimed wastes from landfills in more temperate climates to further characterize the effect decomposition has on the m aterial's energy value.
• Determine if there is a direct correlation between measured HHV values of reclaimed waste and measured (or predicted) energy content of landfill gases generated during decom position.
1 2 5
REFERENCES
1 . Semanyshyn, Z. ; Deduck, S .G. ( 1992). "Long Term HHV Determination of Municipal Solid Waste -A Practical Approach." Presented at the ASME Waste Processing Conference, Detroit, Michigan.
2 . Avallone, E .A. ; Baumeister, T. ( 1986). Marks ' Standard Handbook for Mechanical Engineers.
Ninth Edition. McGraw-Hill Book Company.
3 . Tchobanoglous, G . ; Theisen, H.; Vigil, S .S . ( 1993). Integrated Solid Waste Management -
Engineering Principles and Management Issues. McGraw-Hill Book Company.
4. Tillman, D.A.; Rossi, AJ.; Vick, K.M. ( 1989). Incineration of Municipal and Hazardous Solid
Wastes. Academic Press, Inc . .
5 . Eppich, J . ; Cosulich, J . (July-August 1993). "Collecting and Using Landfill Gas as a Boiler Fuel," Solid Waste & Power (VII: 4), pp. 27-34 .

APC
L BAT BCT BTU CAT CEM C/D grldscf HCI HHV LCSWMA MEK MSW ng/Nm3
NIOSH NOx NREL OMSL OSHA PaDER PCB PEL PM I 0 ppm RRF S02 TCL TCLP TSP ug/dscm VOC YCSWRA
NOMENCLA lURE
air pollution control (system) best available technology boiler-as-a-calorimeter test British Thermal Unit Caterpillar, Inc. continuous emission monitoring (system) construction/demolition waste grains per dry standard cubic foot hydrogen chloride higher heating value Lancaster County Solid Waste Management Authority methyl ethyl ketone municipal solid waste nanograms per normal cubic meter National Institute for Occupational Safety and Health nitrogen oxides National Renewable Energy Laboratory Ogden Martin Systems of Lancaster, Inc.
, Occupational Safety and Health Administration Pennsylvania Department of Environmental Resources polychlorinated biphenyl OSHA permissible exposure limit particulate matter having an aerodynamic diameter of less than 10 microns parts per million LCSWMA Resource Recovery Facility sulfur dioxide Target Compound List Toxicity Characteristic Leaching Procedure total suspended particulate micrograms per dry standard cubic meter volatile organic compound York County (Penna.) Solid Waste and Refuse Authority

REPORT DOCUMENTATION PAGE Form Approved OMS NO. 0704-0188
Public reporting burden for this collection. of information is estimated to av�e 1 hour per r�nse, including the time for reviewing instructions, searching existing data source�thering and mamtammg the data needed, and cornple�=ewmg the collectIOn of information. Sen COIM1enl! regarding this burden cstunate or any other ":li::ct of this collection of ' ormation, including s�estlOns for reducmg ��� to W Headquarters SCMces, D1!"i�te for rn:;,:,",a�t: OperatIOns and Reports, 12 15 Jefferson Davis 'ghway, Suite 1 204, Arlington, V A 22202-430 , and to the Office of ement and B Paperworlc Reduction Project 0704-0188 Wa:; �n, DC 20503. 1 . AGENCY USE ONLY (Leave blank) 2. REPORT DATE 3. REPORT TYPE AND DATES COVERED
January 1 995 Final subcontract report
4. TITLE AND SUBTITLE 5. FUNDING NUMBERS
Assessment of Landfill Reclamation and the Effects of Age on the Combustion of Recovered Municipal Solid Waste (C) AAT-4-1 41 57-D1 (TA) WM51 1 0 1 0
6. AUTHOR(S)
Gary A. Forster r
7. PERFORMING ORGAN IZATION NAME(S) AND ADDRESS(ES) 8. PERFORMING ORGAN IZATION REPORT NUMBER
Lancaster Environmental Foundation 221 E. Chestnut Street DE95004002 Lancaster, PA 1 7602
9. SPONSORING/MONITORING AGENCY NAME(S) AND ADDRESS(ES) 1 0. SPONSORING/MONITORING AGENCY REPORT NUMBER
National Renewable Energy Laboratory 1 6 1 7 Cole Boulevard NRELlTP-430-7449 Golden, CO 80401 -3393
1 1 . SUPPLEMENTARY NOTES
1 2a. DISTRIBUTION/AVAILABILITY STATEMENT 1 2b. DISTRIBUTION CODE
National Technical Information Service UC-1 414 U.S. Department of Commerce 5285 Port Royal Road Springfield, VA 221 61
1 3. ABSTRACT (Maximum 200 words)
For the past three years the Lancaster County Solid Waste Management Authority has been mining waste buried at one of its landfills and delivering it to its resource recovery facility for processing. The project's goals are twofold: extend the life of the landfill by recovering valuable landfill space, and to increase energy production and efficiency at the RRF. By the time the project is completed, approximately 530,000 cubic yards of space will be reclaimed. The report summarizes Lancaster's reclamation experience to date and makes comparison where applicable with other reclamation projects.
1 4. SUBJ ECT TERMS 15. NUMBER OF PAGES
air quality, municipal solid waste management, landfill, resource recover facility,waste to energy 1 06
1 6. PRICE CODE
A06
1 7. SECURITY CLASSIFICATION 1 8. SECURITY CLASSIFICATION 19. SECURITY CLASSIFICATION 20. LIMITATION OF ABSTRACT OF REPORT OF THIS PAGE OF ABSTRACT U L
U NCLASS IFIED UNCLASSIFIED UNCLASSIFIED
-
-
-j - 1 J
J I J
J I .-l
j I J
NSN 7540-01 -280-5500 Standard Form 298 (Rev. 2-89) Prescribed by ANSI std. Z39·-298-1