assessment of the 2017 tax reform for acceleration and ... · pdf fileor omments suestions or...
TRANSCRIPT
For comments, suggestions or further inquiries please contact:
Philippine Institute for Development Studies Surian sa mga Pag-aaral Pangkaunlaran ng Pilipinas
The PIDS Discussion Paper Series constitutes studies that are preliminary and subject to further revisions. They are being circulated in a limited number of copies only for purposes of soliciting comments and suggestions for further refinements. The studies under the Series are unedited and unreviewed.
The views and opinions expressed are those of the author(s) and do not necessarily reflect those of the Institute.
Not for quotation without permission from the author(s) and the Institute.
The Research Information Department, Philippine Institute for Development Studies 18th Floor, Three Cyberpod Centris – North Tower, EDSA corner Quezon Avenue, 1100 Quezon City, Philippines Tel Nos: (63-2) 3721291 and 3721292; E-mail: [email protected] visit our website at https://www.pids.gov.ph
August 2017
Assessment of the 2017 Tax Reformfor Acceleration and Inclusion
DISCUSSION PAPER SERIES NO. 2017-27
Rosario G. Manasan

Assessment of the 2017 Tax Reform for Acceleration and Inclusion
Rosario G. Manasana/ b/
----------------------------- a/ Research Fellow II b/ The author wishes to acknowledge the excellent and valuable research assistance of Miro Frances Capili
and Lovely Tolin.

i
Table of Contents
List of Figures ................................................................................................................................................ i
List of Boxes .................................................................................................................................................. i
List of Tables ................................................................................................................................................. i
List of Annexes ............................................................................................................................................. ii
Abstract ................................................................................................................................................... iii
I. INTRODUCTION .................................................................................................................................. 1
II. IMPLICATIONS OF HOUSE BILL 4774, HOUSE BILL 5636 AND SENATE BILL 1408 .............. 3
A. Personal income tax .................................................................................................................... 3
B. Value-Added Tax ...................................................................................................................... 12
C. Excise tax on petroleum products ............................................................................................. 16
D. Excise tax on automobiles......................................................................................................... 18
E. Excise tax on sugar sweetened beverages ................................................................................. 20
III. SUMMARY AND CONCLUSIONS ................................................................................................... 23
REFERENCES ........................................................................................................................................... 37
List of Figures
Figure 1. Average retail sales prices and excise tax rates of selected petroleum products, 1997-2016 (in
PhP per liter) ............................................................................................................................. 16
Figure 2. Petroleum excise tax rates for gasoline and diesel in selected countries (2012) ....................... 17
List of Boxes
Box 1. The personal income tax system in the Philippines .................................................................... 6
Box 2. Two cases to illustrate the horizontal inequity that results from the proposal to tax SEPs with
gross sales/ receipts below PhP 3 million at 8% of their gross sales/ receipts ............................ 9
Box 3. The value-added tax system in the Philippines ......................................................................... 13
List of Tables
Table 1. Comparative statutory tax rates in the ASEAN region (2014) ................................................... 4
Table 2. Comparative tax liability and effective tax rates when the tax rate schedule of different
ASEAN countries are applied to selected gross personal income levels (adjusted for
purchasing power parity) ............................................................................................................ 5
Table 3. Comparison of PIT rate schedule under existing regime vis HB 4774/ HB 5636/ SB 1408 ...... 7

ii
Table 4. Change in the PIT burden if HB 4776/ HB 5636 were enacted, by income decile, by type of
income (in million pesos) .......................................................................................................... 10
Table 5. Winners and losers from PIT reform under HB 4774 and HB 5636 (year 3 of implementation)
.................................................................................................................................................. 11
Table 6. Effective tax rate (i.e., ratio of tax liability to taxable income),* across income deciles .......... 11
Table 7. Change in VAT burden due to TRAIN expressed as a percentage of household income and in
absolute peso terms, by income decile ...................................................................................... 15
Table 8. Petroleum excise tax rates under the current system and the proposed schedule under HB
4774/ HB 5636 and SB 1408 .................................................................................................... 17
Table 9. Change in petroleum excise tax burden due to TRAIN expressed as a percentage of household
income and in absolute peso terms, by income decile .............................................................. 19
Table 10. Excise tax rates on automobiles, current and proposed under HB 4774, HB 5636 and SB 1408
.................................................................................................................................................. 19
Table 11. Revenue impact of HB 5636 (in million pesos) ........................................................................ 23
Table 12. Tax to GDP ratio, semestral, 2008-2017 ................................................................................... 24
Table 13. Change in the tax burden due to HB 5636 as a percentage of household income across income
deciles, 2020 onwards ............................................................................................................... 25
Table 14. Distribution of change in tax burden due to HB 4774, 2020 onwards ...................................... 26
Table 15. Change in aggregate tax buden for each decile and average tax burden per household due to
HB 5636 .................................................................................................................................... 26
List of Annexes
Annex 1. Illustrative computations of tax liability and ETR (relative to net income) of SEPs with
alternative levels of gross sales/ receipts, assuming alternative profit margins ........................ 27
Annex1.a. Illustrative computation of tax liability and ETR (relative to net income) of SEPs with
gross sales/ receipts equal to PhP 1 million, assuming alternative profit margins .................... 27
Annex1.b. Illustrative computation of tax liability and ETR (relative to net income) of SEPs with
gross sales/ receipts equal to PhP 1.5 million, assuming alternative profit margins ................. 27
Annex 1.c. Illustrative computation of tax liability and ETR (relative to net income) of SEPs with
gross sales/ receipts equal to PhP 2 million, assuming alternative profit margins .................... 28
Annex 2. How the value-added tax works .................................................................................................. 29
Annex Table 2.2. Illustrative example* if all sales are VAT-able at 10% except that of the
manufacturer, who is tax-exempt (if seller is not able to shift input VAT forward to buyers) . 31
Annex Table 2.3. Illustrative example* if all sales are VAT-able at 10% except that of the
manufacturer, who is tax-exempt (if seller is able to shift input VAT forward to buyers) ....... 32
Annex 3. Impact of changing the VAT treatment of indirect exporters from zero-rated to VAT-able ...... 33
Annex 4. Methodology for estimating the price effect of the proposed increase in petroleum excise tax
rates under HB 4774, HB 5636 and SB 1408 ........................................................................... 35
iii
Abstract
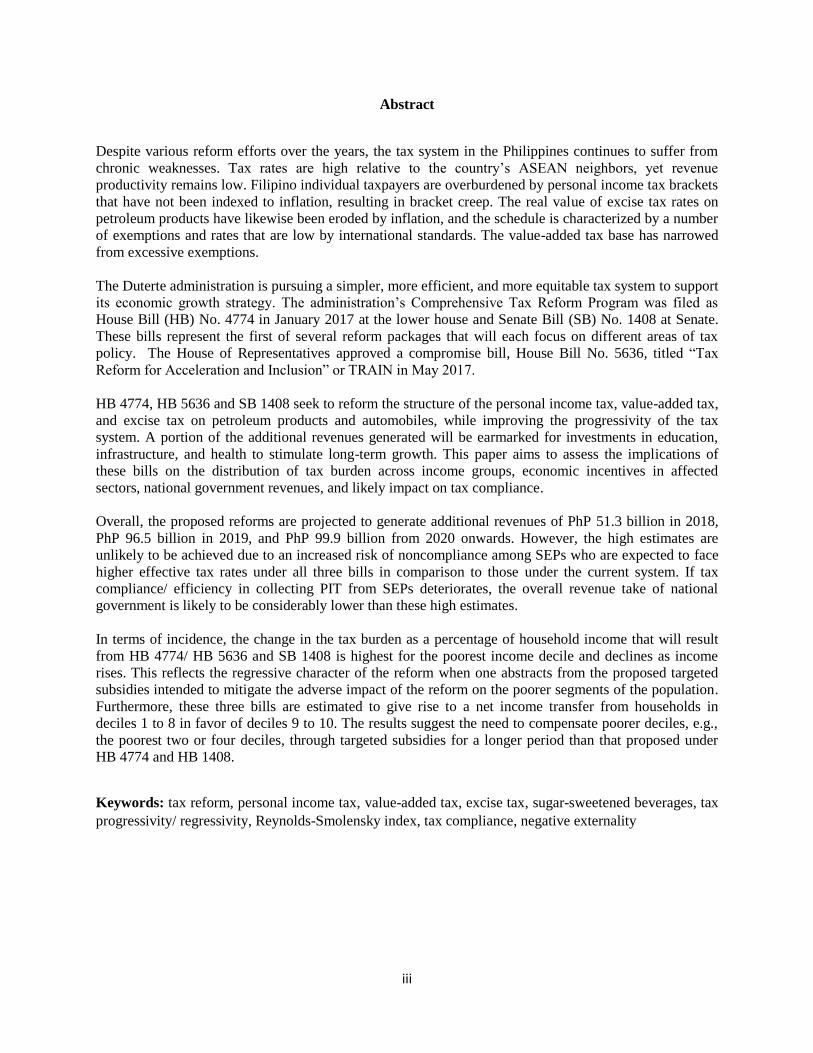
Despite various reform efforts over the years, the tax system in the Philippines continues to suffer from
chronic weaknesses. Tax rates are high relative to the country’s ASEAN neighbors, yet revenue
productivity remains low. Filipino individual taxpayers are overburdened by personal income tax brackets
that have not been indexed to inflation, resulting in bracket creep. The real value of excise tax rates on
petroleum products have likewise been eroded by inflation, and the schedule is characterized by a number
of exemptions and rates that are low by international standards. The value-added tax base has narrowed
from excessive exemptions.
The Duterte administration is pursuing a simpler, more efficient, and more equitable tax system to support
its economic growth strategy. The administration’s Comprehensive Tax Reform Program was filed as
House Bill (HB) No. 4774 in January 2017 at the lower house and Senate Bill (SB) No. 1408 at Senate.
These bills represent the first of several reform packages that will each focus on different areas of tax
policy. The House of Representatives approved a compromise bill, House Bill No. 5636, titled “Tax
Reform for Acceleration and Inclusion” or TRAIN in May 2017.
HB 4774, HB 5636 and SB 1408 seek to reform the structure of the personal income tax, value-added tax,
and excise tax on petroleum products and automobiles, while improving the progressivity of the tax
system. A portion of the additional revenues generated will be earmarked for investments in education,
infrastructure, and health to stimulate long-term growth. This paper aims to assess the implications of
these bills on the distribution of tax burden across income groups, economic incentives in affected
sectors, national government revenues, and likely impact on tax compliance.
Overall, the proposed reforms are projected to generate additional revenues of PhP 51.3 billion in 2018,
PhP 96.5 billion in 2019, and PhP 99.9 billion from 2020 onwards. However, the high estimates are
unlikely to be achieved due to an increased risk of noncompliance among SEPs who are expected to face
higher effective tax rates under all three bills in comparison to those under the current system. If tax
compliance/ efficiency in collecting PIT from SEPs deteriorates, the overall revenue take of national
government is likely to be considerably lower than these high estimates.
In terms of incidence, the change in the tax burden as a percentage of household income that will result
from HB 4774/ HB 5636 and SB 1408 is highest for the poorest income decile and declines as income
rises. This reflects the regressive character of the reform when one abstracts from the proposed targeted
subsidies intended to mitigate the adverse impact of the reform on the poorer segments of the population.
Furthermore, these three bills are estimated to give rise to a net income transfer from households in
deciles 1 to 8 in favor of deciles 9 to 10. The results suggest the need to compensate poorer deciles, e.g.,
the poorest two or four deciles, through targeted subsidies for a longer period than that proposed under
HB 4774 and HB 1408.
Keywords: tax reform, personal income tax, value-added tax, excise tax, sugar-sweetened beverages, tax
progressivity/ regressivity, Reynolds-Smolensky index, tax compliance, negative externality

1
ASSESSMENT OF THE 2017 TAX REFORM FOR ACCELERATION AND
INCLUSION
I. INTRODUCTION
Despite various reform efforts over the years, the tax system in the Philippines is weighed down by
persistent weaknesses. Tax rates are high relative to the country’s ASEAN neighbors yet revenue
productivity remains low. Filipino individual taxpayers are overburdened by personal income tax brackets
that have not been indexed to inflation, resulting in bracket creep. The corporate income tax rate is
among the highest in the ASEAN region, adversely affecting the private sector’s competitiveness,
especially in the face of ASEAN integration and increasing globalization. The fiscal incentive system is
plagued by redundant incentives that result in sizable foregone revenues (Medalla 2002), and as such need
to be rationalized. The base of the value-added tax has become too narrow because of numerous
exemptions. Inflation has eroded the real value of peso-denominated petroleum excise tax rates, and the
regime generally suffers from efficiency issues. Finally, taxation of financial instruments lacks neutrality
as rates vary according to the type of instrument, maturity, currency, and residency of depositor/
transacting party.
As a result, the tax system has continually failed to meet known benchmarks on revenue collection and
constrained the national government’s ability to finance inclusive growth (Reside and Burns 2016).
Amidst strong macroeconomic fundamentals and improved credit ratings in recent years, job creation and
poverty reduction have remained elusive as low tax effort and weak public investment management
reduced government spending on infrastructure, education, and health (World Bank 2014). A
comprehensive tax reform effort appears to be well-justified not only in light of these issues but also of
the piecemeal character of past reforms to the tax system.
In response to these issues, the Duterte administration is pursuing a simpler, more efficient, and more
equitable tax system to finance its 10-point socioeconomic agenda. The redesigned tax system is
envisioned to be characterized by low rates and a broad base to promote investments, job creation, higher
and sustained growth, and poverty reduction. The comprehensive tax reform effort will be undertaken in
stages and consists of five packages. Each package will focus on specific area/s of tax policy, while
contributing to the overall objectives of tax reform and at the same time protecting the government’s
aggregate revenue take.
Package 1 of the administration’s Comprehensive Tax Reform Program was filed as House Bill (HB) No.
4774 in January 2017. Titled “Tax Reform for Acceleration and Inclusion” (TRAIN), HB 4774 seeks to:
(i) repeal current provisions on the personal income tax (i.e., address bracket creep, shift to a modified
gross income PIT regime for simplicity, and reduce the top marginal rate to 25% over time); (ii) broaden
the base of the value-added tax (i.e., by eliminating a number of exemptions and limiting zero-rating to
direct exporters); (iii) increase the excise tax on petroleum products and automobiles; (iv) reduce the
estate tax and the donor’s tax); and (v) earmark a portion of the incremental revenues generated from the
reform to fund targeted subsidies for the poor and vulnerable sectors.1.
1 For instance, Section 31-F of HB 4774 states: “Forty% (40%) of the first-year incremental revenues generated from the
petroleum excise tax under Section 21 of this Act shall be allocated to fund highly targeted transfer programs and subsidies to
public utility vehicles for one year from the effectivity of this Act. An inter-agency committee led by the Department of Finance,
and comprising the Department of Social Welfare and Development, Department of Energy, Department of Budget and
Management, and the National Economic and Development Authority shall prepare the transfer programs using the National
Household Targeting System for Poverty Reduction, as the basis, as well as the subsidy for public utility vehicles. The remaining
sixty% (60%) of the incremental revenue [in the first year], and incremental revenues in succeeding years shall be allocated for infrastructure, health, education, and social protection expenditures.”
2
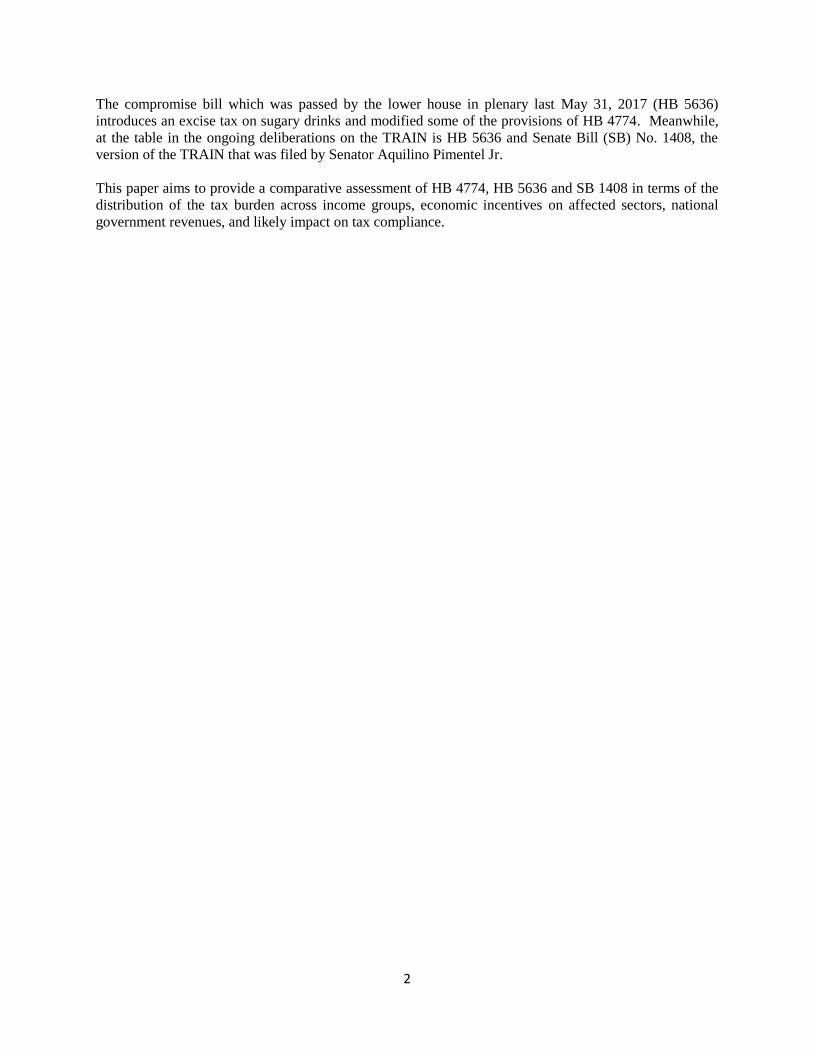
The compromise bill which was passed by the lower house in plenary last May 31, 2017 (HB 5636)
introduces an excise tax on sugary drinks and modified some of the provisions of HB 4774. Meanwhile,
at the table in the ongoing deliberations on the TRAIN is HB 5636 and Senate Bill (SB) No. 1408, the
version of the TRAIN that was filed by Senator Aquilino Pimentel Jr.
This paper aims to provide a comparative assessment of HB 4774, HB 5636 and SB 1408 in terms of the
distribution of the tax burden across income groups, economic incentives on affected sectors, national
government revenues, and likely impact on tax compliance.

3
II. IMPLICATIONS OF HOUSE BILL 4774, HOUSE BILL 5636 AND SENATE BILL 1408
This section assesses the implications of the provisions of HB 4774, HB 5636 and SB 1408 pertaining to:
(i) the personal income tax, (ii) the value-added tax; (iii) excise taxes on petroleum products, (iv) excise
taxes on automobiles, (v) excise tax on sugar sweetened beverages, and (vi) estate and donor’s taxes. The
discussion is organized as follows. For each type of tax, an overview of current provisions is provided,
followed by the issues associated with the same. The provisions of proposed reforms are then presented.
Each sub-section concludes with an assessment of the impact of the proposals on equity, national
government revenues, and wherever possible, economic efficiency, and likely impact on tax compliance.
A. Personal income tax
The rationale to reform the personal income tax (PIT) system has been anchored on two issues, namely:
(i) the non-indexation of tax brackets to inflation, resulting in bracket creep; and (ii) the high tax burden
of Filipino taxpayers relative to their ASEAN counterparts.
Bracket creep. The proposal to amend the personal income tax rate schedule is anchored largely on the
need to address bracket creep. The PIT tax brackets have remained unchanged since 1997 as the upper
and lower boundaries of the tax brackets have not been indexed to inflation. This implies that taxpayers
whose nominal incomes have increased in the interim may have been pushed into higher tax brackets
even if their real incomes have not gone up, a phenomenon known as bracket creep.
Manasan (2016) provides a scenario of bracket creep at work: ‘Assuming that taxpayers pay the correct
taxes, individual income taxpayers whose pre-tax incomes rose at the same rate as inflation between 1998
and 2014, such that the purchasing power of their income in 2014 is approximately the same as that in
1998, have had to pay higher taxes in 2014 (not just in peso terms but also in terms of effective tax rates2)
simply because their taxable income in 2014 have been pushed into the next higher income tax bracket
relative to their situation in 1998.’ The same analysis finds that the relative increase in the tax burden is
also higher for individual income taxpayers belonging to the lower taxable income brackets compared to
those in higher income tax brackets. In this sense, perpetuating bracket creep tends to be regressive as the
non-indexation of tax brackets to inflation discriminates against taxpayers in lower income brackets
(Manasan 2016).
High marginal tax rates relative to ASEAN neighbors. The proposal to amend the Philippine personal
income tax system is also prompted by the need to ease the tax burden on Filipino individual income
taxpayers, who are arguably the most heavily taxed in the ASEAN region (Table 1). The Philippines’ top
marginal personal income tax rate of 32% is higher than that of all the ASEAN member countries except
Thailand and Vietnam, and 3.4 percentage points higher than the average for the ASEAN-5 (including
Malaysia, Indonesia, Philippines, Thailand, and Singapore).
Manasan (2016) also emphasizes the importance of the tax rate schedule and allowable personal
exemptions and deductions in determining how much higher the PIT burden is for Filipino taxpayers
compared to their ASEAN counterparts. The study simulates the effects of applying the various personal
income tax rate schedules of ASEAN countries to several alternative gross personal income levels by
expressing the same in peso terms using the 2014 purchasing power parity (PPP) exchange rates.3 The
analysis finds that both the effective tax rates (i.e., the ratio of tax liability to taxable income) and the
nominal peso tax liability for most gross personal income levels are higher when the Philippine rate
2 The effective tax rate (ETR) is the ratio of tax liability to taxable income. 3 The simulations were performed for an individual income taxpayer who is assumed to have two dependents and who is assumed to be the sole income earner in the family (Manasan 2016).

4
schedule is applied relative to those of other ASEAN member countries. Table 2 shows that the
Philippines is only second to Lao PDR in terms of effective tax rates applicable to per capita GNI, and
that the marginal tax rate applicable to the per capita GNI of each ASEAN member country is also highest
in the Philippines.
Table 1. Comparative statutory tax rates in the ASEAN region (2014)
Note. Adapted from “Assessment of proposals to amend the personal income tax,” by R.G. Manasan, 2016, Revised
Version of PIDS Discussion Paper 2015-48, 7. 2016 by “Philippine Institute for Development Studies”.
Features of the proposed reforms to personal income tax
To address persistent bracket creep and high tax burden faced by Filipino taxpayers compared to their
ASEAN neighbors, HB 4774, HB 5636 and SB 1408 all propose to adopt a different PIT regime for (i)
compensation income earners (CIEs), and (ii) self-employed and. or professionals (SEP). To have a better
appreciation of the changes proposed these bills, a brief overview of the present system is described in
Box 1.
Regime for compensation income earners. All three bills propose to tax compensation income on the
basis of modified gross income. That is, CIEs will no longer be allowed to deduct from their gross
income personal and additional exemptions and deductions that are allowed under the current system to
arrive at their taxable. However, the exclusion of 13th month pay and other benefits and GSIS/ SSS,
PhilHealth and Pag-ibig contributions in reckoning gross income of CIEs under the existing legislation is
retained.
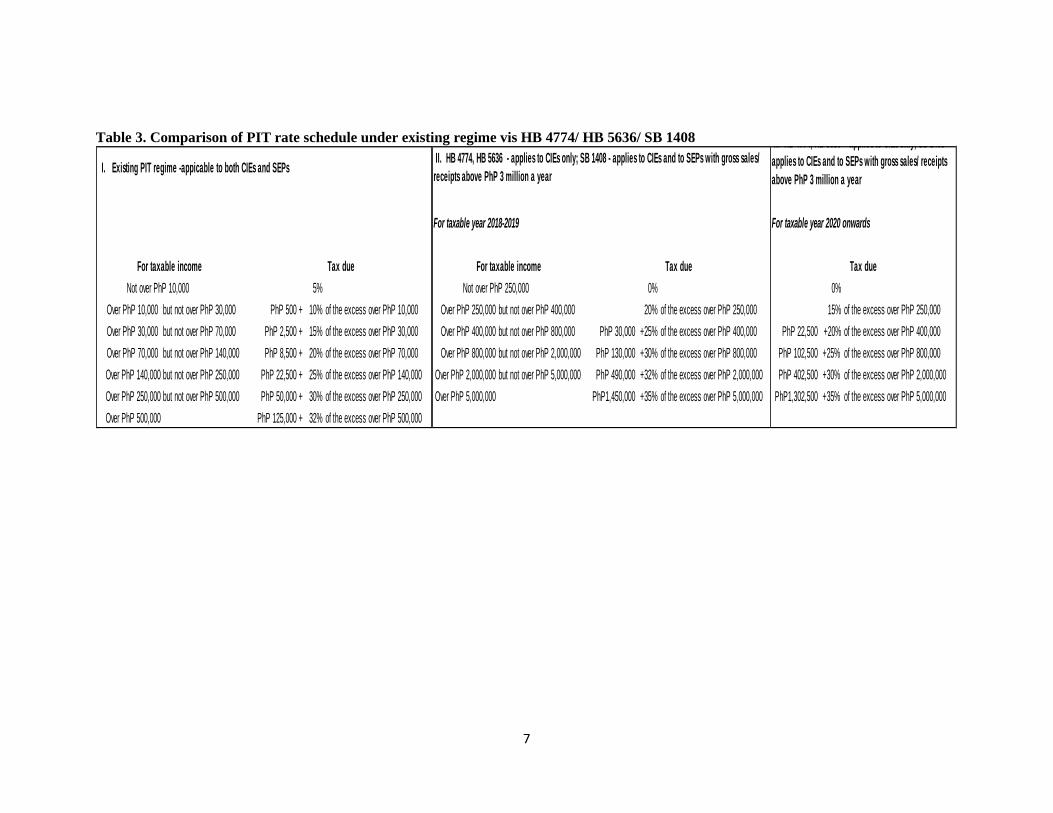
The number of income tax brackets in graduated rate schedule that is applied on the taxable income of
CIEs will be reduced from the present seven to six under all three bills. Under these bills, annual
compensation income below PhP 250,000 will be exempted from the PIT. Said bills will adjust the
income tax brackets such that a lower marginal tax rate than that under the existing system will be
applicable on comparable taxable income levels with the exception of annual taxable income greater than
PhP 5 million which will be subject to a higher marginal tax rate of 35% (Table 3). However, while HB
4774 and SB 1408 proposes to automatically index the taxable income levels in the rate schedule to the
consumer price index (CPI) once every five years, HB 5636 proposes to do so once every three years.
Top marginal
rate
Number of
tiers
Brunei Darussalam a/ a/ 20% n/a
Cambodia 20% 5 20% 10%
Indonesia 30% 4 25% 10%
Lao PDR 24% 7 24% 10%
Malaysia 26% 7 25% 6%
Myanmar 25% 6 25% b/
Philippines 32% 7 30% 12%
Singapore 20% 9 17% 7%
Thailand 35% 8 20% 7%
Vietnam 35% 7 22% 10%
Source: Ernst and Young 2014; KPMG 2014
a/ no personal income tax in Brunei
Personal Income TaxCorporate
Income TaxVAT/GST
b/ turnover tax ; no s tandard rate

5
Table 2. Comparative tax liability and effective tax rates when the tax rate schedule of different
ASEAN countries are applied to selected gross personal income levels (adjusted for purchasing
power parity)
Note. Adapted from “Assessment of proposals to amend the personal income tax,” by R.G. Manasan, 2016, Revised Version of
PIDS Discussion Paper 2015-48, 8. 2016 by “Philippine Institute for Development Studies”.
Selected gross
income levelsPhilippines Cambodia Lao PDR Indonesia Malaysia Myanmar Singapore Thailand Vietnam
Tax liability( in pesos)
9,000 - - 107 - - - - -
18,000 - - 557 - - - - -
40,000 - - 2,629 - - - - -
95,000 - - 9,588 - - - - -
210,000 16,500 6,505 49,474 2,687 - - - - -
390,000 62,000 24,505 69,743 11,237 1,691 9,371 - - -
525,000 102,500 38,005 102,143 28,955 5,539 28,358 - 6,250 3,242
1,500,000 413,000 141,425 336,143 187,400 172,798 159,659 12,866 138,516 252,267
3,000,000 893,000 414,907 696,143 583,704 562,510 485,751 202,192 505,552 865,629
6,000,000 1,853,000 1,014,907 1,416,143 1,483,704 1,342,510 1,235,751 715,065 1,398,513 1,915,629
12,000,000 3,773,000 2,214,907 2,856,143 3,283,704 2,902,510 2,735,751 1,894,852 3,493,323 4,015,629
Effective tax rates
9,000 - - 1% - - - - - -
18,000 - - 3% - - - - - -
40,000 - - 7% - - - - - -
95,000 - 0% 10% - 0% 0% - - -
210,000 8% 3% 24% 1% 0% 0% - - -
390,000 16% 6% 18% 3% 0% 2% - 0% -
525,000 20% 7% 19% 6% 1% 5% - 1% 1%
1,500,000 28% 9% 22% 12% 12% 11% 1% 9% 17%
3,000,000 30% 14% 23% 19% 19% 16% 7% 17% 29%
6,000,000 31% 17% 24% 25% 22% 21% 12% 23% 32%
12,000,000 31% 18% 24% 27% 24% 23% 16% 29% 33%
Per capita GNI 4% - 9% 2% 1% 3% - -
Marginal tax
rate applicable
to per capita
GNI 15% 0% 12% 5% 6% 7% 0% 0%
Author's estimates

6
Box 1. The personal income tax system in the Philippines
The present form of the personal income tax system was enacted through RA 8424 or the National Internal
Revenue Code (NIRC) of 1997. The PIT schedule has seven tax brackets with marginal tax rates that range from
5% to 32% that is applicable to both compensation earners (CEs) and self-employed and professionals (SEPs).
The system is de jure progressive, i.e., statutory tax rates rise with income. Moreover, RA 8424 does not include
any provision for the indexation of the PIT brackets to inflation.
Compensation income is taxed on a gross income basis, net of exemptions and deductions. Each wage and
salaried worker is entitled to a PhP 50,000 personal exemption and a PhP 25,000 additional exemption for each
dependent (up to a maximum of four) .4 The additional exemption for dependents may be may be claimed only
one of the spouses in the case of married individuals. In addition, the following are excluded in reckoning gross
income: retirement benefits, pensions, and gratuities, 13th month pay and other benefits not exceeding PhP
82,000,5 and GSIS, SSS, PhilHealth, Pag-ibig, union dues, and other mandatory contributions. Minimum wage
earners have been exempt from income taxes since RA 9504 was signed into law in 2008.
On the other hand, SEPs are taxed on the basis of net income, with the following items being allowed as
deductions from gross income: (i) ordinary and necessary expense directly attributable to the development,
management, operation, and/ or conduct of trade, business or exercise of profession; (ii) depreciation allowance;
(iii) research and development expenditures, (iv) interests and taxes paid, and (v) losses and bad debt incurred in
connection with the taxpayer’s profession, trade, or business; and (vi) charitable and other contributions,
Taxpayers may opt for an optional standard deduction equivalent to 40% of gross sales or receipts in lieu of the
itemized deductions enumerated above. SEPs are also allowed to deduct personal and additional exemptions
from their gross income after deducting allowable expenses.
Regime for self-employed and professionals. HB 4774, HB 5636 and SB 1408 all proposes to divide
SEPs into two groups depending on the size of their gross sales or gross receipts, i.e., (i) SEPs with gross
sales/ receipts below the VAT threshold,6 and (ii) SEPs with gross sales/ receipts above the VAT
threshold. On the one hand, SEPs with gross sales/ receipts below than the VAT threshold will be taxed
at 8% of gross sales/ receipts in lieu of the VAT and other percentage taxes. On the other hand, SEPs
with gross sales/receipts above PhP 3 million will face a tax rate of 30% based on their net income, i.e.,
they will be taxed in the same manner as corporations under HB 4774 and HB 5636. In contrast, SB 1408
proposes to tax SEPs with gross sales/ receipts above PhP 3 million using the tax rate schedule that will
be applicable to CIEs.7 Meanwhile, all three bills propose to reduce the optional standard deduction to
20% from the current 40% of gross income.
Implications of PIT provisions under HB 4774, HB 5636 and SB 1408
Tax treatment of CIEs.
CIEs with annual taxable income not exceeding PhP 5 million will pay lower PIT under HB 4774/ HB
5636 and SB 1408 than under the existing PIT regime, while the opposite is true for those with taxable
income in excess of PhP 5 million. For instance, the PIT liability of an entry-level DepEd teacher who
earns around PhP 20,000 per month will become zero under HB 4774 compared with PhP 22,500 under
the existing PIT regime (if she/he has two children) or PhP 35,000 (if she/he has no children).
4 The personal exemption and additional exemption levels were last adjusted in 2009. 5 RA 10653 increased the ceiling on tax-free bonuses from PhP 30,000 to PhP 82,000 in 2016. 6 Under the 3 bills, the VAT threshold will be raised from PhP 1.5 million to PhP 3 million. 7 This point is not quite apparent in SB 1408 as filed but the clarification is made by the staff of Senator Koko Pimentel.
7
Table 3. Comparison of PIT rate schedule under existing regime vis HB 4774/ HB 5636/ SB 1408
I. Existing PIT regime -appicable to both CIEs and SEPs
For taxable year 2018-2019 For taxable year 2020 onwards
Not over PhP 10,000 5% Not over PhP 250,000 0% 0%
Over PhP 10,000 but not over PhP 30,000 PhP 500 + 10% of the excess over PhP 10,000 Over PhP 250,000 but not over PhP 400,000 20% of the excess over PhP 250,000 15% of the excess over PhP 250,000
Over PhP 30,000 but not over PhP 70,000 PhP 2,500 + 15% of the excess over PhP 30,000 Over PhP 400,000 but not over PhP 800,000 PhP 30,000 +25% of the excess over PhP 400,000 PhP 22,500 +20% of the excess over PhP 400,000
Over PhP 70,000 but not over PhP 140,000 PhP 8,500 + 20% of the excess over PhP 70,000 Over PhP 800,000 but not over PhP 2,000,000 PhP 130,000 +30% of the excess over PhP 800,000 PhP 102,500 +25% of the excess over PhP 800,000
Over PhP 140,000 but not over PhP 250,000 PhP 22,500 + 25% of the excess over PhP 140,000 Over PhP 2,000,000 but not over PhP 5,000,000 PhP 490,000 +32% of the excess over PhP 2,000,000 PhP 402,500 +30% of the excess over PhP 2,000,000
Over PhP 250,000 but not over PhP 500,000 PhP 50,000 + 30% of the excess over PhP 250,000 Over PhP 5,000,000 PhP1,450,000 +35% of the excess over PhP 5,000,000 PhP1,302,500 +35% of the excess over PhP 5,000,000
Over PhP 500,000 PhP 125,000 + 32% of the excess over PhP 500,000
II. HB 4774, HB 5636 - applies to CIEs only; SB 1408 - applies to CIEs and to SEPs with gross sales/
receipts above PhP 3 million a year
II. HB 4774, HB 5636 - applies to CIEs only; SB 1408 -
applies to CIEs and to SEPs with gross sales/ receipts
above PhP 3 million a year
For taxable income Tax due For taxable income Tax due Tax due

8
Tax treatment of SEPs
First, under the proposed bills, SEPs with annual net income between PhP 3 million and PhP 8.95 million
will be taxed more heavily than compensation income earners with comparable income levels from 2020
onwards. The opposite will be true for SEPs with annual net income above PhP 8.95 million.
Second, the proposed tax treatment of SEPs with gross sales/ receipts below PhP 3 million under HB
4774, HB 5636 and SB 1408 introduces severe horizontal inequity in the PIT system with small-/
medium-scale enterprises (SMSEs) with lower profit margins likely to get less favorable tax treatment
under these bills than many professionals who tend to enjoy higher profit margins. More specifically, the
effective tax rates (i.e., the ratio of tax liability to net income) faced by SEPs with gross sales/ receipts
below PhP 3 million under these bills depends on their “profit margin,” i.e., the ratio of their net income
to their gross sales/ receipts. SEPs with lower profit margins (e.g., small store owners, food service
providers, public transport operators, small contractors, and small/ medium scale entrepreneurs, in
general) will have higher ETRs than SEPs with higher profit margins (e.g., lawyers, doctors, accountants,
and consultants). In other words, these three bills will tend to treat SEPs with higher profit margins more
favorably than SEPs with lower profit margins. Box 2 below illustrates this point with two examples.
Moreover, SEPs with profit margins greater than 27% will have ETRs lower than 30%, placing them in a
favorable situation tax-wise compared to SEPs with yearly gross sales/ receipts above PhP 3 million.
Also, SEPs with gross sales/receipts between PhP 1.5 million and Php 3 million and with profit margins
higher than 60% will get better tax treatment than wage income earners with comparable income as well
as SEPs with gross sales/receipts greater than PhP 3 million. (Refer to Annex Table 2 for the
computations that support these points.)
Impact on government revenues from the PIT
Personal income tax revenues from compensation income are projected to decline by 1.5% of GDP in the
third year of implementation of PIT reform under HB 4774 and HB 5636 (Table 4). Meanwhile, PIT
revenues from SEP income are projected to increase by 0.6% of GDP assuming that the 2015 collection
efficiency level would persist in the outer years. Thus, overall, PIT revenues are estimated to contract by
0.9% of GDP.
Distribution of the tax burden across different income groups
The change in the tax burden expressed in absolute peso terms (i.e., the total PIT liability) of CIEs is
projected to be negative or to decline for all income deciles if HB 4774/ HB 5636 were enacted into law
based on calculations using the 2015 Family Income and Expenditure Survey. In contrast, the PIT
liability of SEPs is projected to be positive or to increase for all income deciles with the passage of either
one of these two bills. When CIEs and SEPs are considered as one group, the total PIT liability of all
personal income taxpayers belonging to deciles 1-5 is estimated to positive while that of all personal
income taxpayers belonging to deciles 6-10 is estimated to be negative due to the PIT provisions of HB
4776 and HB 5636 (Table 4). Moreover, the Reynolds-Smolensky (RS) index8 is estimated to decline
from 0.017 under the present PIT regime to 0.005 in years 1 and 2 of the implementation of either one of
HB 4776 or HB 5636 and to 0.004 in year 3 of their implementation, indicating that the PIT provisions of
these two bills are not pro-poor.
8 The RS index is a summary measure of the redistributive capacity of the tax system. It is computed as the difference between
the Gini coefficient of the pre-tax distribution of income and the after-tax distribution of income, where perfect equality would
yield a Gini coefficient of 0 and perfect inequality would yield a Gini coefficient of 1. A positive RS index indicates that the
after-tax distribution of income is more equal than the pre-tax distribution of income and that the tax is progressive.

9
Box 2. Two cases to illustrate the horizontal inequity that results from the proposal to tax SEPs with gross
sales/ receipts below PhP 3 million at 8% of their gross sales/ receipts
Case 1.
Consider the case of a store owner/ retailer with annual gross sales of PhP 1.5 million or gross sales of PhP 4,800
per day. Assume that his profit margin is 20%. This implies that his net income is PhP 300,000 per year or PhP
960 per day. The personal income tax liability of this store owner for the year under HB 4774, HB 5636 and SB
1408 will be PhP 120,000 (or 8% of 1,500,000). This amount is equal to 40% of the net income of this store
owner, even higher than the 30% tax on net income that SEPs with gross sales/ receipts above PhP 3 million are
supposed to pay under TRAIN.
Now, compare the tax liability of this store owner with that of a government employee whose annual gross
income (net of the 13th month pay and other benefits) is equal to PhP 300,000. Under HB 4774, HB 5636 and SB
1408, the tax liability of this particular government employee will be PhP 7,5009 or PhP 2.5% of his gross
income.
Clearly, the government employee gets better tax treatment than the store owner under TRAIN in this particular
example.
Case 2.
Second, take the case of a freelance consultant with annual gross receipts of PhP 1.5 million or gross receipts of
PhP 4,800 per day. Assume his profit margin is 80%. This implies that his net income is PhP1.2 million per year
or PhP 3,800 per day. The personal income tax liability of this freelance consultant for the year under TRAIN
will be PhP 120,000, the same as that of the store owner in the example above. This amount is equivalent to 10%
of the net income of this freelance consultant.
Now, compare the tax liability of this freelance consultant with that of a government employee whose annual
gross income (net of the 13th month pay and other benefits) is equal to PhP 1.2 million per year. Under TRAIN,
the tax liability of this particular government employee will be PhP 202,500 or 16.9% of his gross income.
In this particular case, the freelance consultant certainly receives more favorable treatment tax-wise in
comparison to the government employee as well as the store owner/ retailer in Case 1 above.
9 The tax rate schedule for year 3 of implementation of HB 5636 is used to arrive at this number. If the rate schedule for years 1
and 2 of implementation, the tax liability of the government employee would have been PhP 10,000.
10
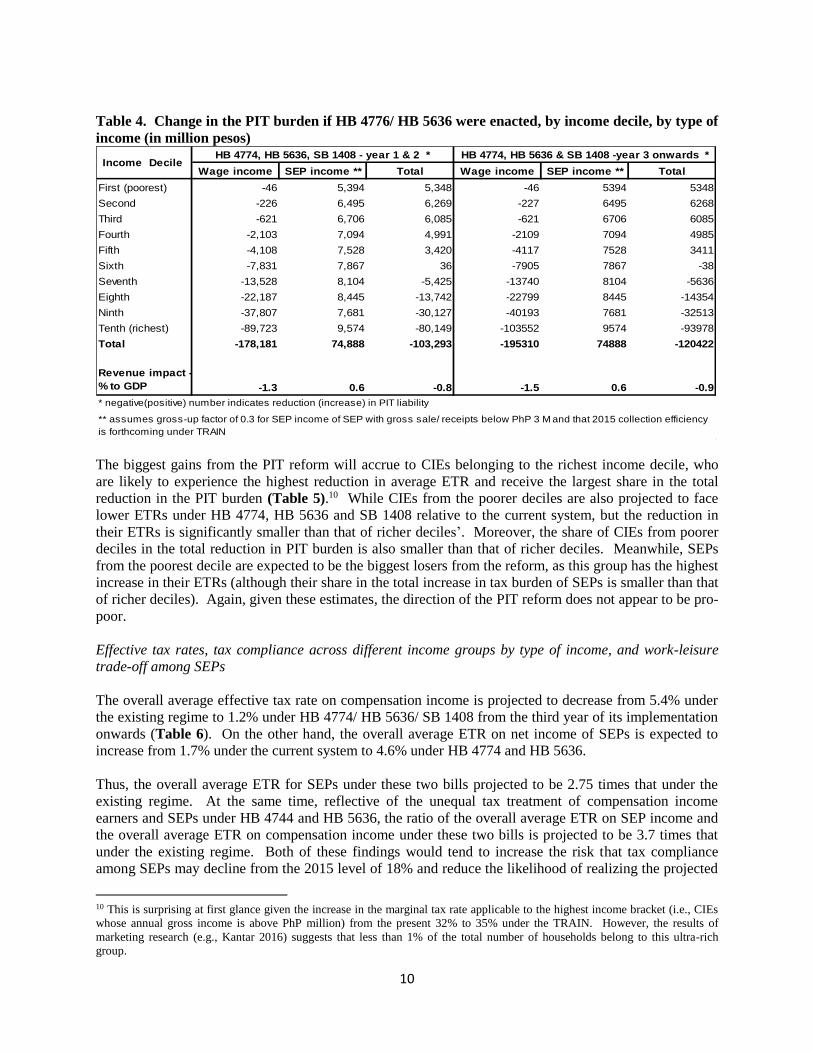
Table 4. Change in the PIT burden if HB 4776/ HB 5636 were enacted, by income decile, by type of
income (in million pesos)
The biggest gains from the PIT reform will accrue to CIEs belonging to the richest income decile, who
are likely to experience the highest reduction in average ETR and receive the largest share in the total
reduction in the PIT burden (Table 5).10 While CIEs from the poorer deciles are also projected to face
lower ETRs under HB 4774, HB 5636 and SB 1408 relative to the current system, but the reduction in
their ETRs is significantly smaller than that of richer deciles’. Moreover, the share of CIEs from poorer
deciles in the total reduction in PIT burden is also smaller than that of richer deciles. Meanwhile, SEPs
from the poorest decile are expected to be the biggest losers from the reform, as this group has the highest
increase in their ETRs (although their share in the total increase in tax burden of SEPs is smaller than that
of richer deciles). Again, given these estimates, the direction of the PIT reform does not appear to be pro-
poor.
Effective tax rates, tax compliance across different income groups by type of income, and work-leisure
trade-off among SEPs
The overall average effective tax rate on compensation income is projected to decrease from 5.4% under
the existing regime to 1.2% under HB 4774/ HB 5636/ SB 1408 from the third year of its implementation
onwards (Table 6). On the other hand, the overall average ETR on net income of SEPs is expected to
increase from 1.7% under the current system to 4.6% under HB 4774 and HB 5636.
Thus, the overall average ETR for SEPs under these two bills projected to be 2.75 times that under the
existing regime. At the same time, reflective of the unequal tax treatment of compensation income
earners and SEPs under HB 4744 and HB 5636, the ratio of the overall average ETR on SEP income and
the overall average ETR on compensation income under these two bills is projected to be 3.7 times that
under the existing regime. Both of these findings would tend to increase the risk that tax compliance
among SEPs may decline from the 2015 level of 18% and reduce the likelihood of realizing the projected
10 This is surprising at first glance given the increase in the marginal tax rate applicable to the highest income bracket (i.e., CIEs
whose annual gross income is above PhP million) from the present 32% to 35% under the TRAIN. However, the results of
marketing research (e.g., Kantar 2016) suggests that less than 1% of the total number of households belong to this ultra-rich
group.
Wage income SEP income ** Total Wage income SEP income ** Total
First (poorest) -46 5,394 5,348 -46 5394 5348
Second -226 6,495 6,269 -227 6495 6268
Third -621 6,706 6,085 -621 6706 6085
Fourth -2,103 7,094 4,991 -2109 7094 4985
Fifth -4,108 7,528 3,420 -4117 7528 3411
Sixth -7,831 7,867 36 -7905 7867 -38
Seventh -13,528 8,104 -5,425 -13740 8104 -5636
Eighth -22,187 8,445 -13,742 -22799 8445 -14354
Ninth -37,807 7,681 -30,127 -40193 7681 -32513
Tenth (richest) -89,723 9,574 -80,149 -103552 9574 -93978
Total -178,181 74,888 -103,293 -195310 74888 -120422
Revenue impact -
% to GDP -1.3 0.6 -0.8 -1.5 0.6 -0.9
* negative(positive) number indicates reduction (increase) in PIT liability
** assumes gross-up factor of 0.3 for SEP income of SEP with gross sale/ receipts below PhP 3 M and that 2015 collection efficiency
is forthcoming under TRAIN
Income Decile HB 4774, HB 5636, SB 1408 - year 1 & 2 * HB 4774, HB 5636 & SB 1408 -year 3 onwards *
11
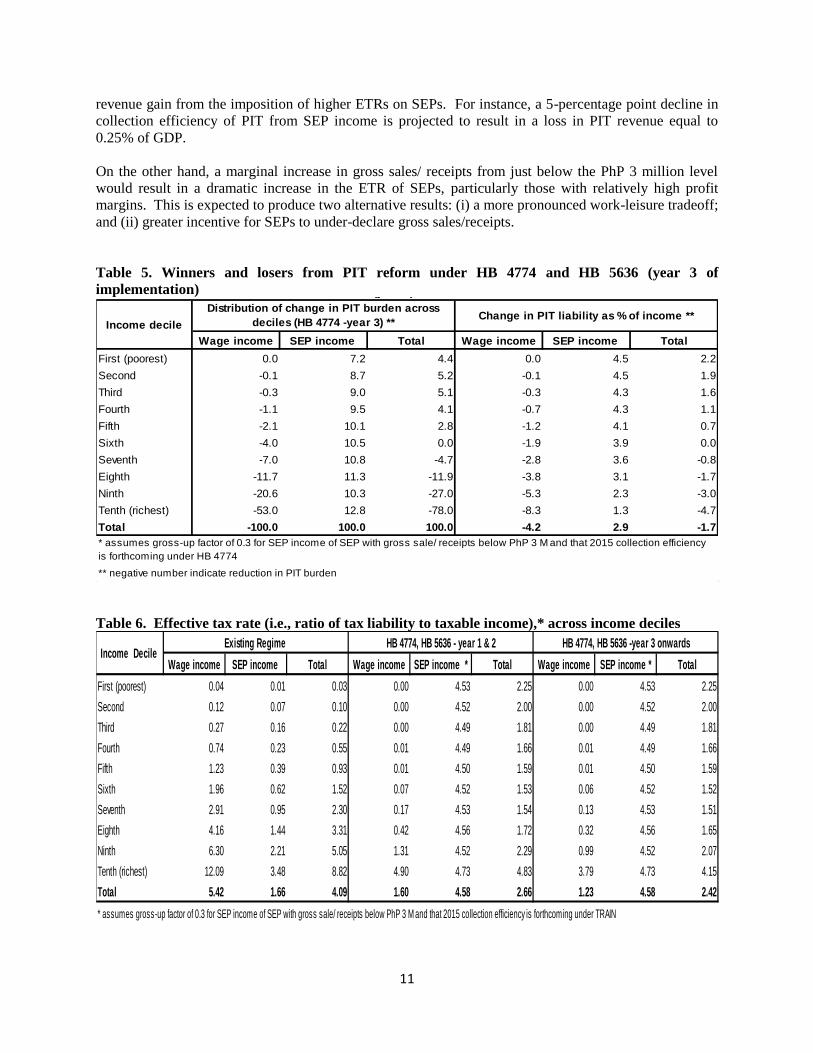
revenue gain from the imposition of higher ETRs on SEPs. For instance, a 5-percentage point decline in
collection efficiency of PIT from SEP income is projected to result in a loss in PIT revenue equal to
0.25% of GDP.
On the other hand, a marginal increase in gross sales/ receipts from just below the PhP 3 million level
would result in a dramatic increase in the ETR of SEPs, particularly those with relatively high profit
margins. This is expected to produce two alternative results: (i) a more pronounced work-leisure tradeoff;
and (ii) greater incentive for SEPs to under-declare gross sales/receipts.
Table 5. Winners and losers from PIT reform under HB 4774 and HB 5636 (year 3 of
implementation)
Table 6. Effective tax rate (i.e., ratio of tax liability to taxable income),* across income deciles
Winners and losers from PIT reform under HB 4774 (year 3) *
Wage income SEP income Total Wage income SEP income Total
First (poorest) 0.0 7.2 4.4 0.0 4.5 2.2
Second -0.1 8.7 5.2 -0.1 4.5 1.9
Third -0.3 9.0 5.1 -0.3 4.3 1.6
Fourth -1.1 9.5 4.1 -0.7 4.3 1.1
Fifth -2.1 10.1 2.8 -1.2 4.1 0.7
Sixth -4.0 10.5 0.0 -1.9 3.9 0.0
Seventh -7.0 10.8 -4.7 -2.8 3.6 -0.8
Eighth -11.7 11.3 -11.9 -3.8 3.1 -1.7
Ninth -20.6 10.3 -27.0 -5.3 2.3 -3.0
Tenth (richest) -53.0 12.8 -78.0 -8.3 1.3 -4.7
Total -100.0 100.0 100.0 -4.2 2.9 -1.7
* assumes gross-up factor of 0.3 for SEP income of SEP with gross sale/ receipts below PhP 3 M and that 2015 collection efficiency
is forthcoming under HB 4774
** negative number indicate reduction in PIT burden
Income decile
Distribution of change in PIT burden across
deciles (HB 4774 -year 3) **Change in PIT liability as % of income **
Wage income SEP income Total Wage income SEP income * Total Wage income SEP income * Total
First (poorest) 0.04 0.01 0.03 0.00 4.53 2.25 0.00 4.53 2.25
Second 0.12 0.07 0.10 0.00 4.52 2.00 0.00 4.52 2.00
Third 0.27 0.16 0.22 0.00 4.49 1.81 0.00 4.49 1.81
Fourth 0.74 0.23 0.55 0.01 4.49 1.66 0.01 4.49 1.66
Fifth 1.23 0.39 0.93 0.01 4.50 1.59 0.01 4.50 1.59
Sixth 1.96 0.62 1.52 0.07 4.52 1.53 0.06 4.52 1.52
Seventh 2.91 0.95 2.30 0.17 4.53 1.54 0.13 4.53 1.51
Eighth 4.16 1.44 3.31 0.42 4.56 1.72 0.32 4.56 1.65
Ninth 6.30 2.21 5.05 1.31 4.52 2.29 0.99 4.52 2.07
Tenth (richest) 12.09 3.48 8.82 4.90 4.73 4.83 3.79 4.73 4.15
Total 5.42 1.66 4.09 1.60 4.58 2.66 1.23 4.58 2.42
* assumes gross-up factor of 0.3 for SEP income of SEP with gross sale/ receipts below PhP 3 M and that 2015 collection efficiency is forthcoming under TRAIN
Income Decile Existing Regime HB 4774, HB 5636 - year 1 & 2 HB 4774, HB 5636 -year 3 onwards

12
B. Value-Added Tax
The proposal to reform the current value-added tax system is anchored on the need to eliminate numerous
exemptions that have significantly narrowed the VAT base (Box 3), resulted in numerous breaks in the
VAT chain, thereby making it more difficult to collect the VAT efficiently and resulted in a substantial
tax gap (i.e., the difference between actual and potential tax revenues). The World Bank (2016) estimates
that the average VAT gap from 2006 to 2013 represented almost 63% of potential VAT revenues. Of this,
28% percent was a result of legal exemptions and special treatment while 35% may be associated with
noncompliance. The same study found that some exemptions under the current VAT system tend to
create economic distortions. For instance, the VAT-exempt treatment of cooperatives tends to provide an
incentive for corporations to restructure themselves as cooperatives in order to reduce tax liability even if
such an action is not economically efficient. Further, the study argues that the exemption for cooperatives
may be redundant as small cooperatives are already protected by the VAT threshold.
Features of the VAT provisions of HB 4774, HB 5636 and SB 1408
HB 4774, HB 5636 and SB 1408 all seek to expand the VAT base by lifting some of the prevailing
exemptions from the VAT including that of the sales of agricultural cooperatives duly registered with the
Cooperatives Development Authority (CDA) and their importation of direct farm inputs, machineries and
equipment; gross receipts from lending of credit and multi-purpose cooperatives duly registered with the
CDA; sales of non-agri, non-credit and non-electric cooperatives duly registered with the CDA; sale of
real property utilized for socialized and low-cost housing; lease of residential property with monthly
rental not exceeding PhP 10,000; and sale of power generated using renewable sources of energy. All
three bills also propose to change the VAT treatment of indirect exports from zero-rated to VAT-able. On
the other hand, while HB 4774 and SB 1408 propose to change the VAT treatment of sale of power or
fuel generated from renewable energy sources from zero-rated to VAT-exempt, HB 5636 does not. At the
same time, all three bills would increase the VAT threshold from PhP 1.9 million to PhP 3 million of
gross sales/ receipts.11
Implications of VAT provisions of HB 4774, HB 5636 and SB 1408
On cooperatives. All three TRAIN bills seek to change the VAT treatment of sales of agricultural, non-
agricultural, non-credit, non-electric coops from VAT exempt to VAT-able. Given the nature of the
VAT, this move will likely: (i) increase the price that final consumers of these products pay; and (ii)
encourage enterprises which use said products as intermediate inputs to buy the same from cooperatives
because they can now claim a tax credit for the input VAT paid on said inputs. Thus, the repeal of the
VAT exemption of the sales of agri-, non-agri- and multipurpose cooperatives will likely promote the
growth of these cooperatives if their products are inputs to other products rather than for final
consumption. (Refer to Annex 2 for a better appreciation of this point.)
Note, however, sale of agricultural food products in their original state by cooperatives will continue to be
VAT-exempt because agricultural food products in their original state are VAT-exempt regardless of the
seller.12 Moreover, “small” agricultural cooperatives (i.e., those with gross sales/receipts below the VAT
threshold) have the option not to be VAT-registered and will continue to be exempt from payment of the
3% “other percentage tax” on their gross sales/receipts.
11 BIR Revenue Regulation No. 3-2012 raised the VAT threshold from PhP 1,500,000 to PhP 1,919,500. 12 Refer to Section 109 (1) (A) of HB 4774, HB 5636 and SB 1408.

13
Box 3. The value-added tax system in the Philippines
The Philippine VAT system has three regimes: VAT-exempt, zero-rated, and VAT-able. The 12% percent VAT
rate applies to all goods and services except those that are VAT-exempt or zero-rated under the NIRC. The VAT
liability of VAT-able firms is computed using the tax credit or "invoice" method. That is, firms are entitled to
subtract the input VAT they paid on all their VAT-able input purchases including that of capital goods from the
output VAT due on their sales of VAT-able output. However, credits are allowed only if they were supported
by invoices from their suppliers. The VAT is, thus, said to have a self-policing feature as each firm is required to
supply evidence regarding taxes that should have been paid by all its suppliers. VAT-exempt firms do not pay
VAT on their sales nor can they claim credit for the VAT for their input purchases. In contrast, zero-rated firms
pay zero VAT on their sales and claim credit for the VAT on their input purchases. That is, zero-rated firms are
effectively entitled to a refund of the VAT they paid on input purchases. (See Annex 2 for a more detailed
discussion on how the value-added tax works.)
Firms with gross sales/ gross receipts below PhP 1,9million per year (i.e., the VAT threshold) are not required to
register for VAT. If they elect to be exempted from the VAT, they are required to pay “other percentage tax”
(OTP) equivalent to 3% of their annual gross sales/ gross receipts. On the other hand, firms that produce zero-
rated products can apply for a VAT refund on their inputs. In practice, however, these refunds are difficult to
obtain, and the government now issues tax credit certificates in lieu of refunds (World Bank 2016). The
government has also extended the zero-rating to suppliers of export businesses (i.e., so-called indirect exporters).
Moreover, firms are allowed to apply for a tax credit certificate for excess input tax credit within two years of the
quarter in which they were issued, though these credits cannot be directly redeemed for a VAT refund. The
Bureau of Internal Revenue collects VAT on sales of goods and services in the domestic market, while the
Bureau of Customs collects VAT on imports.
The VAT was first introduced in the country 1988 with the issuance of Executive Order (EO) 273 in 1987. It
replaced a host of taxes including annual fixed taxes, sales tax on manufacturers/producers, turnover tax on
subsequent sellers, advance sales tax / compensating tax on importation of goods, millers' tax, percentage tax on
contractors, lessors of property, lessors/distributors of cinematographic films and excise tax on certain articles
(Manasan 2002). The Philippine VAT is a consumption type VAT. Thus, in determining their tax liability, firms
are allowed to deduct all business purchases including purchases of capital goods from their sales. As such, the
VAT does not distort the timing of firms’ investment decisions nor does it discriminate against capital-intensive
methods of production. At the same time, it minimizes the imposition of a tax on tax (or tax cascading) that is
characteristic of the turnover tax and is, thus, neutral with respect to production and distribution methods.
Being levied on the basis of the destination principle, i.e., goods and services are taxes on the basis of
where they are consumed rather than where there are produced, imports and domestically produced goods are
treated symmetrically and, thus, compete on an equal footing with each other. On the other hand, exports are
zero rated which means that exports are allowed to receive credit for VAT paid on their inputs even as they pay
zero output VAT. Thus, in principle, the VAT helps ensure that exports compete on an even playing field with
their counterparts in the international market.
In 1994, RA 7716 (or the Expanded VAT Law) expanded the coverage of the VAT to include the following: (1)
intangibles (e.g., patents, copyrights, trademarks, and other property rights); (2) sale and lease of real property
held primarily for sale/ lease in the ordinary course of trade or business; (3) certain items that were previously
exempt (e.g., imported meat, pesticides, imported cane sugar and specialty feed); (4) proprietors, restaurants, and
other eating places, hotels, motels, rest houses, pension houses, and resorts; (5) operators of taxicabs, utility cars
for rent or hire driven by lessee, tourist buses and other common carriers by land, air and sea relative to their
transportation of cargo; (6) international cargo vessels, airlines, and freight forwarders; (7) franchise grantees of
telephone, telegraph, radio and television broadcasting; (8) dealers in securities and lending investors; (9) banks
and non-bank financial intermediaries and finance companies; (10) insurance premium with respect to services of
non-life insurance companies (except crop insurance); (11) printing, publication, importation or sale of books and
any newspaper, magazine, review or bulletin; (12) services of actors, actresses, singers, professional athletes; and
(13) services performed in the exercise of profession or calling and professional services performed by registered
general professional partnerships. On the other hand, RA 7716 exempted from the VAT (1) the sale of real
property utilized for low- cost and socialized housing as defined under the Urban Development and Housing Act

14
of 1992; (2) the services rendered by regional or area headquarters established in the Philippines by multinational
corporations which act as supervisory , communications and coordinating centers for their affiliates, subsidiaries
or branches in the Asia-Pacific Region but which do not earn or derive income from the Philippines; (3) keepers
of garages, and common carriers by land, air or water for the transportation of passengers; (4) grantees of electric,
gas or water utility franchises; and (3) life insurance and foreign insurance agents,
In 1996, RA 8241 provided for the VAT exemption of (1) agricultural cooperatives, electric cooperatives, lending
activities of multi-purpose and credit cooperatives registered with the CDA; (2) educational services of private
education institutions accredited by the Commission on Higher Education (CHED); (3) overseas dispatch,
messages or communication originating from the Philippines; (4) grantees of radio and television broadcasting
franchises with annual gross receipts not exceeding PhP 10 million; (5) international carriers doing business in
the Philippines; (6) lease of residential units subject to rent control law; (7) printing, publication, importation or
sale of books and any newspaper, magazine, review or bulletin.
In 2005, RA 9337 (commonly known as the E-VAT Law), the VAT base was broadened to include (1) the sale or
importation of coal and petroleum products; (2) sale of electricity by generation, transmission and distribution
companies; and (3) sale of nonfood agricultural and marine and forest products in their original state. The same
law, however, introduced key provisions that were primarily intended to reduce the tax burden on poor
households and effectively narrowed the VAT base by (1) expanding the coverage of the term “simple processes”
that define whether agricultural food products are in their original state to include broiling and roasting and
expanding the coverage of the term ‘original state’ to include molasses; and (2) exempting the importation of
meat, the sale or importation of coal and natural gas in whatever form or state; the sale of educational services
rendered by private educational institutions duly accredited by the TESDA; and the gross receipts of banks and
non-bank financial intermediaries performing quasi-banking functions. Mitigating measures pertaining to other
areas of tax policy were also included to offset the price effects of expanding the VAT coverage. These include
(1) the reduction of the excise tax rates on diesel, kerosene and bunker fuel oil (as diesel-powered vehicles are
more frequently used in public transportation and bunker fuel oil is used for vessels that transport cargo); (2) the
removal of the 3% franchise tax on power distribution utilities to reduce the price increment of the VAT on
electricity; and (3) the removal of the franchise tax under the charters of domestic carriers by air, which were
fully covered by VAT as a result of the reform. Finally, the E-VAT Law imposed a 70% cap on input VAT credit,
extended the input VAT claim on capital goods exceeding PhP 1 million over five years, and imposed a uniform
5% final withholding VAT on government purchases.
In addition to the exemptions from the VAT enumerated above, numerous other exemptions from the VAT are
provided by a number of special laws.
On indirect exporters. The change in the VAT treatment of indirect exporters will likely have a perverse
effect in promoting backward linkage of export activity but will have no impact on revenues.13 Given the
difficulty of using tax credits, this will tend to increase the cost of money borne by direct exporters as it
will likely increase the tax credit due them for the VAT on their inputs. The proposed change appears to
be driven by the concern that zero-rating of indirect exports results in tax leakage, particularly in the case
of indirect exporters registered with the Board of Investments (BOI) and/ or indirect exporters serving
direct exporters registered with the BOI. Note that this concern might be misplaced in the case of indirect
exporters which are PEZA locators given controls exercised by PEZA when goods are moved out of
PEZA-controlled “customs territory”. In the case of BOI affiliated indirect exporters, this is clearly a case
where policymakers have to carefully consider the trade-off between the enhancing backward linkage of
exports and the use of tax policy to correct what is apparently a tax administration problem.
13 See Annex 3 for a more detailed representation of the VAT liability of direct and indirect exporters under the present system vis HB 4744, HB 5636 and SB 1408.

15
On developers of socialized and low cost housing. Subjecting the sale of real property utilized for
socialized and low cost housing will tend to increase the cost of socialized and low cost housing units and
less affordable to consumers. From a social perspective, government support to target beneficiaries of
socialized and low cost housing appears to be warranted. However, the remaining question that may be
asked: what is the more appropriate form of government support in this regard - VAT exemption or direct
subsidy?
On producers of power or fuel generated from renewal sources of energy. The zero-rating of power/ fuel
generated from renewable sources of energy under the existing tax regime helps bring down the cost of
the same and assists in improving the affordability of renewable sources of energy vis non-renewable
sources. This is certainly good for the environment. However, this might be an opportune time to revisit
the overall policy regime (tax and otherwise) for renewable sources of energy and study the interaction of
the VAT zero-rating of and the application of feed-in tariff on renewable sources of energy and their
impact on the overall cost of power in the country.
Impact on government revenues from the VAT
VAT revenues are projected to increase by PhP 31.3 billion as a result of the proposed expansion of the
VAT base under HB 4774, HB 5636 and SB 1408. This estimate is derived by applying the net VAT
rate for alternative tax regimes (which are derived from the input-output table) to GDP-based estimates of
sectoral output.
Distribution of the tax burden across different income groups
The VAT under HB 4774/ HB 5636/ SB 1408 is found to be slightly more regressive than the existing
VAT system, as suggested by the Reynolds-Smolensky index (Table 7). While the change in the
effective VAT rates due to these three bills is estimated to be largest for the two poorest deciles, the share
of the various income deciles in the total increase in the VAT burden borne by households increases as
household per capita income rises.
Table 7. Change in VAT burden due to TRAIN expressed as a percentage of household income and
in absolute peso terms, by income decile
Existing HB 5636Change in VAT
burden
First 8.12 8.55 0.432 1,041 3.8
Second 7.63 8.03 0.406 1,342 4.9
Third 7.41 7.81 0.395 1,516 5.6
Fourth 7.29 7.68 0.391 1,769 6.5
Ffith 7.37 7.77 0.396 2,060 7.6
Sixth 7.37 7.77 0.397 2,451 9.0
Seventh 7.20 7.59 0.390 2,809 10.3
Eighth 7.12 7.51 0.388 3,348 12.3
Ninth 7.00 7.39 0.384 4,186 15.4
Tenth 6.09 6.42 0.332 6,669 24.5
Total 6.95 7.32 0.376 27,190 100.0
RS index -0.0029 -0.0030 -0.0001
* VAT borne by households as % of household income
Income decile
VAT burden as % of HH income Change in VAT
burden (in
million pesos)
Change in VAT
burden (%
distribution)

16
C. Excise tax on petroleum products
Since 1997, excise tax rates on petroleum products have either been fixed in nominal peso terms (e.g.,
gasoline, avturbo/ jet fuel) or reduced to zero in the interim (e.g., diesel, kerosene and bunker fuel oil in
2005).14 As such, the revenue take from the source has contracted over time due to the erosion of the
peso denominated tax rates by inflation even as retail prices of petroleum prices have risen at a faster than
inflation (Figure 1). Consequently, country’s excise tax rates on petroleum products are significantly
lower than international standards (Figure 2). In particular, the excise tax on premium unleaded gasoline
in most OECD countries amount to 25% - 40% of the pump price, compared with 9% in the Philippines
(World Bank 2016). Given this perspective, the proposed increase in the in the petroleum excise tax rates
in a staggered manner over three years starting in 2018 under HB 4774, HB 5636 and SB 1408 appears to
be well justified (Table 8).15
Figure 1. Average retail sales prices and excise tax rates of selected petroleum products, 1997-2016
(in PhP per liter)
Source of basic data: Department of Energy
Note: Updated and adapted from “Philippine Economic Update,” by The World Bank, Philippine Economic
Update 2016, 35. 2016 by “World Bank Office Manila”.
14 Liquefied petroleum gas (LPG) has been exempt from the excise tax since 1997. 15 Originally, under HB 4774, the proposal is to implement the first phase of the increase in July 2017.
0
5
10
15
20
25
30
35
40
45
50
55
60
1997
1998
1999
2000
2001
2002
2003
2004
2005
2006
2007
2008
2009
2010
2011
2012
2013
2014
2015
2016
Premium unleaded gasoline RSP Premium unleaded excise tax rateRegular unleaded gasoline RSP Regular unleaded excise tax rateDiesel RSP Diesel excise tax rate

17
Figure 2. Petroleum excise tax rates for gasoline and diesel in selected countries (2012)
Note. Adapted from “Philippine Economic Update,” by The World Bank, Philippine Economic Update 2016, 37. 2016 by “World Bank Office Manila”.
Table 8. Petroleum excise tax rates under the current system and the proposed schedule under HB
4774/ HB 5636 and SB 1408
Implications of the petroleum excise tax provisions of HB 4774, HB 5636 and SB 1408
Economic implications
The proposed amendments are also likely to have positive economic efficiency implications: (i) reducing
road congestion and pollution from public and private transportation; and (ii) reducing the use of
relatively more pollutive fuel as the tax on diesel increases from zero.16 However, the increase is
16 In other countries, the excise tax rates for diesel are close to that of premium unleaded gasoline (World Bank 2016). The
exemption of diesel from the excise tax effectively contributed to the reversal of the diesel consumption trend from -1.4% to
3.4% between 2006 and 2013, likely working against the government’s efforts to encourage the use of cleaner energy resources
(ibid 2016).
2018 2019 2020
Diesel 9,137,285 0.00 3.00 5.00 6.00
Fuel oil 2,297,332 0.00 3.00 5.00 6.00
Gasoline * 4,716,642 4.35 7.00 9.00 10.00
LPG 2,359,695 0.00 3.00 5.00 6.00
Kerosene 128,954 0.00 3.00 5.00 6.00
Aviation turbo, jet fuel 558,751 3.67 7.00 9.00 10.00
Others 1,330,352 2.74 5.72 7.72 8.72
* refers to the tax rate for unleaded gasoline
Source of basic data: Department of Energy
Type of fuel Demand (liters)
2015
Current
tax (P/L)
Excise tax proposal

18
expected to increase inflation – an additional 0.6% increase in inflation in 2018, an additional increase of
0.4% increase in inflation in 2019 and an additional increase of 0.2% increase in inflation in 2020.17
Impact on government revenues from the petroleum excise tax
Assuming that the demand for petroleum products remains at the 2015 level (Table 8), the proposal to
increase petroleum excise tax rates is projected to generate incremental revenues of PhP 30 billion in the
second half of 2017, PhP 101.3 billion in 2018, and PhP 121.7 billion from 2019 onwards.
Distribution of tax burden across income groups
Contrary to conventional wisdom, the incidence of the excise tax on petroleum products is mildly
progressive as indicated by the positive Reynolds-Smolensky index (last row of Table 9). The tax
incidence analysis undertaken for this study also suggests that the proposed increase in the excise tax rates
on petroleum products under HB 4774, HB 5636 and SB 1408 will make the tax even more progressive
than it is at present. Although the change in the excise tax burden when expressed as a percentage of
household income does not monotonically increase as household per capita income rises from decile 1 to
decile 9, it does so from deciles 2 to 9 (columns 4 to 6 of Table 9). Nonetheless, the share of the various
income deciles in the total increase in the excise tax burden increases as household per capita income
rises.
D. Excise tax on automobiles
The excise tax on automobiles is levied on the basis of the net selling price of the manufacturer or
importer of the same. At present, the schedule has four brackets with marginal tax rates ranging from 2%
to 60%. HB 4774 and SB 1408 propose a new schedule that will at least double the excise tax on
automobiles with larger increases applicable to higher priced automobiles (Table 10). In contrast, while
HB 5636 proposes to double the excise tax applicable to the first two price brackets (i.e., the two least
expensive brackets) just like HB 4474 and SB 1408, it proposes smaller increases in the excise tax
applicable to the top three brackets.
Implications of proposed increase in excise tax on automobiles
Economic implications
All three bills are likely to have a negative impact on government’s Comprehensive Automotive
Resurgence Strategy (CARS) program which was established in 2015. The program aims to provide time-
bound, and performance-based fiscal support to attract strategic investments in the manufacturing of
motor vehicles and parts. To date, two auto manufacturers have signed up to participate in the program:
Mitsubishi and Toyota. Mitsubishi is scheduled to start production in 2017.
While some may be skeptical of the prospects of the CARS program, the proposal to double the excise tax
that will applicable on the very models that will be produced under the program (i.e., those in first two
brackets of the tax rate schedule) is indicative of policy reversal that foreign investors are wary about.
But beyond bad signaling, the higher taxes under the TRAIN will surely dampen demand for automobiles
and work against the objectives of the CARS program. This represents a classic case of government
taking away with its left hand what it has given with its right hand.
17 The methodology used to estimate the impact on inflation of the increase in petroleum excise tax is described in Annex 3.

19
Table 9. Change in petroleum excise tax burden due to TRAIN expressed as a percentage of household income and in absolute peso terms,
by income decile
Table 10. Excise tax rates on automobiles, current and proposed under HB 4774, HB 5636 and SB 1408
ExistingHB 5636
(year 2)
Change* in
excise tax -
year 2
HB 5636
(year 3)
Change* in
excise tax -
year 3
In year 2 of
implemen-
tation
% distribution -
year 2
In year 3 of
implemen-
tation
% distribution -
year 3
First 0.29 1.42 1.13 1.65 1.36 2,726 3.1 3,279 3.1
Second 0.28 1.37 1.09 1.59 1.31 3,602 4.1 4,333 4.1
Third 0.29 1.39 1.10 1.61 1.33 4,231 4.9 5,089 4.9
Fourth 0.29 1.40 1.12 1.63 1.34 5,051 5.8 6,076 5.8
Ffith 0.31 1.49 1.19 1.73 1.43 6,170 7.1 7,423 7.1
Sixth 0.32 1.53 1.22 1.78 1.46 7,512 8.6 9,036 8.6
Seventh 0.32 1.54 1.23 1.79 1.47 8,825 10.1 10,616 10.1
Eighth 0.32 1.57 1.25 1.82 1.50 10,747 12.3 12,928 12.3
Ninth 0.32 1.58 1.25 1.83 1.51 13,665 15.7 16,438 15.7
Tenth 0.32 1.55 1.23 1.79 1.48 24,675 28.3 29,683 28.3
Total 0.31 1.52 1.21 1.76 1.45 87,204 100.0 104,901 100.0
RS index 0.0001 0.0003 0.0002 0.0004 0.000
* positive (negative) change indicates increase (decrease) relative to existing levels
Income decile
Excise tax burden as % of HH income Change* in excise tax burden (in million pesos)
Present HB 4774, SB 1408 HB 5636 - year 1 HB 5636 - year 2
up to PhP 600,000 2% 4% 3% 4%
over PhP 600, 000 to PhP 1.1 millionPhpP 20,000 + 20% of
excess over PhP 600,000
PhpP 24,000 + 40% of
excess over PhP 600,000
PhP 18,000 + 30% of excess
over PhP 600,000
PhP 24,000 + 40% of excess
over PhP 600,000
over PhP 1.1 million to PhP 2.1 millionPhP 112,000 + 40% of
excess over PhP 1.1 million
PhP 224,000 + 100% of
excess over PhP 1.1 million
PhP 168,000 + 50% of excess
over PhP 1.1 million
PhP 224,000 + 60% of excess
over PhP 1.1 million
Over PhP 2.1 million to PhP 3.1 million)PhP 512,000 +60% of excess
over PhP 2.1 million
PhP 1,224,000 +200% of
excess over PhP 2.1 million
PhP 668,000 + 80% of excess
over PhP 2.1 million
PhP 824,000 + 100% of
excess over PhP 2.1 million
Over PhP 3.1 millionPhP 1,468,000 + 90% of
excess over PhP 3.1 million
PhP 1,824,000 + 120% of
excess over PhP 3.1 million
Excise taxManufacturer's or importers net selling price

20
Impact on government revenues from the excise tax on automobiles
The Department of Finance (DOF) estimates the revenue impact of the proposed increase in the excise tax
on automobiles at PhP 24 billion a year. Due to lack of access to data on automobile sales by price
bracket, this study is unable to arrive at an independent estimate of revenue impact of the propose
increase in the excise tax on automobiles.
Distribution of tax burden across income groups
The incidence of the proposed increase in excise tax on automobiles is expected to be progressive. The
2015 FIES shows that only the richest 4 income deciles are actually able to afford to buy new cars.
Moreover, the excise tax on automobiles has been tagged as a luxury tax. As such, one would expect that
the proposed change in the tax under TRAIN will make the tax even more progressive than it is now.
While this is true of HB 4774 and SB 1408, it is not so in the case of HB 5636.
E. Excise tax on sugar sweetened beverages
The imposition of the excise tax on sugar sweetened beverages was not originally part of the Package 1 of
the TRAIN, and thus, not included in HB 4774 and SB 1408. It was introduced during the House
deliberations on the TRAIN.
HB 5636 proposes to impose an excise tax equal to PhP 10 per liter of sugar sweetened beverages (SSBs).
Under this bill, sugar sweetened beverage refers to non-alcoholic beverage which may be sold in liquid
form, syrup or concentrate, or a solid mixture that is added to water that contains caloric sweeteners, or
artificial/ non-caloric sweeteners.
Proponents of a SSB tax, not only in the Philippines but also in other parts of the globe, argue that its
imposition will help reduce the consumption of SSBs and reduce, thereby, the risk of obesity and
associated diseases like diabetes, cardiovascular diseases and some types of cancer.18
Economic justification for the introduction of an excise tax on sugar sweetened beverages
The science behind it
A good number of studies provide empirical evidence linking higher SSB intake, on the one hand, and
weight gain, diabetes, metabolic syndrome, and lower intakes of healthier diet options, on the other.19
A meta-analysis of 32 original articles (20 in children and 12 in adults) on the SSB - weight gain
relationship found (i) reductions in body mass index (BMI) gain when SSBs are reduced in
randomized control trials (RCTs) in children, (ii) showed increases in body weight when SSBs
18 A number of countries have imposed a SSB tax – Norway in 2017, Mexico in 2014, France in 2012, and Finland and Hungary
in 2011. A soda tax will take effect in Ireland and the United Kingdom in 2018. A soda tax has also been in place in a number of
US cities including Berkeley, San Francisco, Oakland, Albany in California, Boulder in Colorado, Seattle in Washington, Cook
County in Illinois and Philadelphia.
19 Metabolic syndrome is a cluster of conditions - increased blood pressure, high blood sugar, excess body fat around the waist,
and abnormal cholesterol or triglyceride levels - that occur together, increasing your risk of heart disease, stroke and diabetes
(http://www.mayoclinic.org/diseases-conditions/metabolic-syndrome/home/ovc-20197517 accessed Aug 24, 2017).

21
were added in RCTs in adults, and (iii) more pronounced benefits in preventing weight gain in
SSB substitution trials in RCTs in children (Malik VS, Pan A, Willett WC, and Hu FB 2013).
A random-effects meta-analysis of cohort studies comparing SSB intake in the highest to lowest
quantiles in relation to the risk of metabolic syndrome and type 2 diabetes found that (i)
individuals in the highest quantile of SSB intake (most often 1-2 servings/day) had a 26% greater
risk of developing type 2 diabetes than those in the lowest quantile of SSB intake (none or than 1
serving per month), and (ii) individuals in the highest quantile of SSB intake had a 20% greater
risk of developing metabolic syndrome than those in the lowest quantile of SSB intake (Malik
VS, Popkin BM, Bray GA, Després JP, Willett WC, and Hu FB 2010).
A meta-analysis of 88 studies on the association between SSB intake and nutrition and health
outcomes found clear associations between SSB intake and (i) increased energy intake and body
weight, (ii) lower intakes of milk, calcium, and other nutrients and with an increased risk of
several medical problems like diabetes (Vartanian LR, Schwartz MB, and Brownell KD 2007).
Moreover, this study documents larger effect sizes in studies with stronger methods (longitudinal
and experimental vs cross-sectional studies).
Importance obesity, diabetes and cardiovascular disease in the Philippines
In 2013, 8.3% of children aged 10-19 and 31.1% of all adults are either overweight or obese
based on the WHO BMI classification (FNRI 2015). Prevalence of overweight/ obesity among
adults increased persistently from 16.6% in 1993 to 31.1% in 2013.
In 2013, about 66% of the female adult population exhibits a high waist to hip ratio (WHR) which
is indicative of android obesity or adiposity which is a major risk factor in the development of
non-communicable diseases. Moreover, the percentage of female adults with high WHR
increased from 39.5% in 1998, to 63.2% in 2013. In contrast, the prevalence of high WHR
among male adults went up from 6.9% in 2011 to 8.0% in 2013 (FNRI 2013).
Diseases of the heart and diseases of the vascular system ranked first and second and diabetes
sixth among the 10 leading causes of mortality in the Philippines in 2013. On the other hand,
hypertension ranked third among the 10 leading causes of morbidity in 2013 (DOH 2013).
Negative externality of SSB consumption to justify imposition of tax on SSB
For an SSB tax to be justifiable on economic grounds, it is not enough to establish the link between SSB
intake, on the one hand, and weight gain, diabetes, metabolic syndrome and cardiovascular disease, on the
other hand; it is essential as well that SSB consumption create negative externality/ ies. That is,
consumption of SSBs does not only result in health problems for the consumers themselves but also cause
the wider public to bear the burden of the economic costs of the same.
Some analysts have argued that such negative externality is absent in the Philippines primarily because a
large part of health care cost is borne by households themselves in the form of out-of-pocket expense.
While this is true, it should be pointed out that the burden of non-communicable diseases associated with
weight gain and SSB intake is also borne by the taxpayers in general to the extent that the majority of the
less well-off population rely on the public health system. At the same, the national government has been
paying for the health insurance premiums of indigents and senior citizens since 2013. This move has
allowed the Philhealth to broaden its coverage from 82% in 2011 to 91% in 2016 with 55% of all
22
Philhealth beneficiaries accounted for indigents and senior citizens. The national government has set
aside PhP 37 billion for the health insurance premium of indigents and PhP 13 billion for senior citizens
in 2017.20 Furthermore, excessive consumption of SSBs and the associated higher prevalence of the
various non-communicable diseases (NCDs) also results in loss in economy-wide productivity in terms of
absenteeism and overall ill-health of the workforce.
Effectiveness of SSB tax in reducing SSB consumption and regressivity of SSB tax
Evidence from the Mexico experience suggests that (i) consumption of SSB is responsive to the SSB tax
(i.e., the 10% SSB tax resulted in a 10% reduction in consumption); and (ii) the elasticity of demand for
SSBs is greatest among the poor. Arguably, the latter finding would tend to mute the regressive impact of
the SSB tax to the extent that “if the poor consume much less soda when its price increases, the poor pay
less in tax revenue and will suffer fewer health care costs” (Pratt 2016).
However, international experience also indicates that the SSB tax will be more effective if the tax is
imposed on the sugar content of SSBs rather than volume of liquid.
Impact on government revenues from the proposed excise tax on sugar sweetened beverages under HB
5636
The DOF estimates revenue gain from the introduction of this tax to be equal to PhP 47 billion per year.
This study is unable to arrive at an independent estimate of the revenue impact of this proposal.
20 Admittedly, however, the poor’s utilization of social health insurance remains limited to date due to various implementation
issues.

23
III. SUMMARY AND CONCLUSIONS
The overarching objective of HB 4774 is laudable. It seeks to improve the fairness, efficiency, and
simplicity of the tax system while at the same time protecting the national government’s aggregate
revenue take. The package is a mix of revenue increasing and revenue losing measures. As such, the risk
of Congress enacting solely the revenue losing measures is minimized. The inclusion of compensatory
measures (i.e., targeted subsidies) for adversely affected sectors is also worth noting.
Overall, the proposed reforms are expected to generate additional revenues of PhP 51.3 billion in 2018,
PhP 9.65 billion in 2019, PhP 99.9 billion in 2020 onwards (Table 11). These estimates of the
incremental revenues from the TRAIN are just about half of the official estimates initially. Moreover, as
discussed earlier, the high estimates are unlikely to be achieved due to poor incentives for SEPs to
improve tax compliance. These developments provide a more conservative view on the ability of the
TRAIN to fund the present administration’s ambitious “build, build, build” program.
Table 11. Revenue impact of HB 5636 (in million pesos)
The risk of decline in compliance is even more worrisome given a recent downturn in the performance of
key tax administration agencies. Table 12 shows no improvement in the revenues collected by the BOC
from the second semester of 2015 relative to the same period in 2016 and, then again, from the first
semester of 2016 to the first semester of 2017. The BIR, meanwhile, reported a slight decrease collection-
to-GDP ratio in the first semesters of the present administration. This highlights the need for stricter
2018 2019 2020
PIT on wage income a/(178,181) (178,181) (195,310)
PIT on income of SEPs b/74,888 74,888 74,888
PIT (103,293) (103,293) (120,422)
VAT 31,273 31,273 31,273
Excise tax on petroleum prod 60,097 101,155 121,684
Other percentage tax c/ (3,784) (3,784) (3,784)
Excise tax on automobiles 20,000 24,100 24,100
Excise tax on "sugary" beverages d/47,000 47,000 47,000
Total 1 (high estimate) 51,294 96,452 99,852
% to GDP 0.4 0.7 0.8
5 percentage point reduction in coll eff of
PIT on SEP (32,950) (32,950) (32,950)
Total 2 (low estimate) 18,344 63,502 66,901
% to GDP 0.1 0.5 0.5
a/ high probability of being realized
b/ subject to uncertainty
below VAT ceiling for "small enterprises" due to HB 5636
d/ based on DOF estimates
c/ reduction in revenues from "other percentage tax" collected from entities with gross sales/ receipts
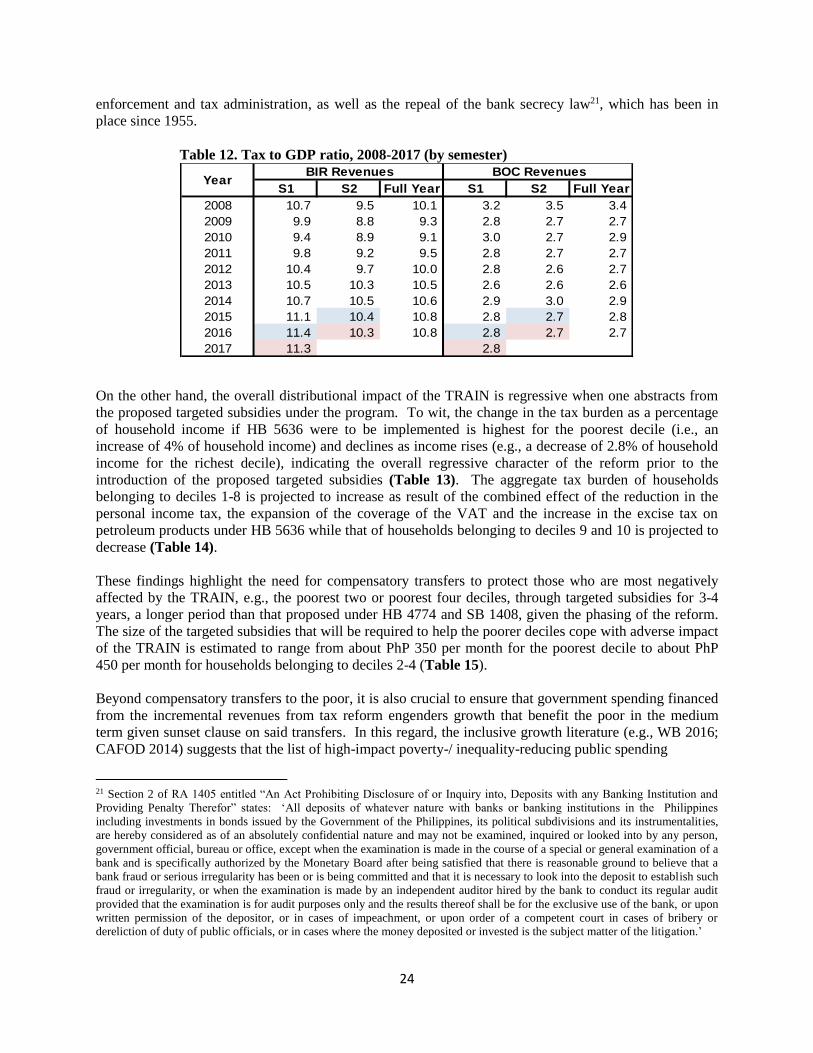
24
enforcement and tax administration, as well as the repeal of the bank secrecy law21, which has been in
place since 1955.
Table 12. Tax to GDP ratio, 2008-2017 (by semester)
On the other hand, the overall distributional impact of the TRAIN is regressive when one abstracts from
the proposed targeted subsidies under the program. To wit, the change in the tax burden as a percentage
of household income if HB 5636 were to be implemented is highest for the poorest decile (i.e., an
increase of 4% of household income) and declines as income rises (e.g., a decrease of 2.8% of household
income for the richest decile), indicating the overall regressive character of the reform prior to the
introduction of the proposed targeted subsidies (Table 13). The aggregate tax burden of households
belonging to deciles 1-8 is projected to increase as result of the combined effect of the reduction in the
personal income tax, the expansion of the coverage of the VAT and the increase in the excise tax on
petroleum products under HB 5636 while that of households belonging to deciles 9 and 10 is projected to
decrease (Table 14).
These findings highlight the need for compensatory transfers to protect those who are most negatively
affected by the TRAIN, e.g., the poorest two or poorest four deciles, through targeted subsidies for 3-4
years, a longer period than that proposed under HB 4774 and SB 1408, given the phasing of the reform.
The size of the targeted subsidies that will be required to help the poorer deciles cope with adverse impact
of the TRAIN is estimated to range from about PhP 350 per month for the poorest decile to about PhP
450 per month for households belonging to deciles 2-4 (Table 15).
Beyond compensatory transfers to the poor, it is also crucial to ensure that government spending financed
from the incremental revenues from tax reform engenders growth that benefit the poor in the medium
term given sunset clause on said transfers. In this regard, the inclusive growth literature (e.g., WB 2016;
CAFOD 2014) suggests that the list of high-impact poverty-/ inequality-reducing public spending
21 Section 2 of RA 1405 entitled “An Act Prohibiting Disclosure of or Inquiry into, Deposits with any Banking Institution and
Providing Penalty Therefor” states: ‘All deposits of whatever nature with banks or banking institutions in the Philippines
including investments in bonds issued by the Government of the Philippines, its political subdivisions and its instrumentalities,
are hereby considered as of an absolutely confidential nature and may not be examined, inquired or looked into by any person,
government official, bureau or office, except when the examination is made in the course of a special or general examination of a
bank and is specifically authorized by the Monetary Board after being satisfied that there is reasonable ground to believe that a
bank fraud or serious irregularity has been or is being committed and that it is necessary to look into the deposit to establish such
fraud or irregularity, or when the examination is made by an independent auditor hired by the bank to conduct its regular audit
provided that the examination is for audit purposes only and the results thereof shall be for the exclusive use of the bank, or upon
written permission of the depositor, or in cases of impeachment, or upon order of a competent court in cases of bribery or dereliction of duty of public officials, or in cases where the money deposited or invested is the subject matter of the litigation.’
S1 S2 Full Year S1 S2 Full Year
2008 10.7 9.5 10.1 3.2 3.5 3.4
2009 9.9 8.8 9.3 2.8 2.7 2.7
2010 9.4 8.9 9.1 3.0 2.7 2.9
2011 9.8 9.2 9.5 2.8 2.7 2.7
2012 10.4 9.7 10.0 2.8 2.6 2.7
2013 10.5 10.3 10.5 2.6 2.6 2.6
2014 10.7 10.5 10.6 2.9 3.0 2.9
2015 11.1 10.4 10.8 2.8 2.7 2.8
2016 11.4 10.3 10.8 2.8 2.7 2.7
2017 11.3 2.8
YearBIR Revenues BOC Revenues

25
includes those related to: (i) early childhood development interventions, (ii) universal access to quality education,
(iii) universal health coverage, (iv) conditional cash transfers to poor families,22 and (v) basic rural infrastructure,
particularly in roads, transport and electrification. Related to the item (v) above, the World Bank (2006)
points out that “there is solid evidence that infrastructure investments broaden opportunities for people
and communities by integrating them into regional and national systems of production and commerce,
and by improving their access to public services”. However, poverty reduction and inequality are not
always a consideration in deciding the location of infrastructure investments and some affirmative action
may be needed in this regard, e.g., by combining conventional criteria like vehicular traffic and
population density with the size of the poor population in the catchment area of the specific road that will
be constructed so as to allow relevant road infrastructure serving poverty areas to be upgraded to a level
that will allow connection to a main road network (Hettige 2006).
Finally, it is equally important to guard against the dissipation of the revenue gains from tax reform in
favor of specific programs that will cater to specific collectives at the expense of more strategic public
investment programs/ projects.
Table 13. Change in the tax burden due to HB 5636 as a percentage of household income
across income deciles, 2020 onwards
22 A rigorous impact evaluation (which applied the randomized control trial (RCT) method) of the conditional cash transfer
(CCT) program, otherwise known as the Pantawid Pamilyang Pilipino Program or 4Ps, found that the program has a strong
impact on (i) school enrollment of young children as evidenced by higher rates of enrollment of children aged 3-11 years in
Pantawid areas relative to non-Pantawid areas (by 10 percentage points for children 3-5 years old and by 4 percentage points for
children 6-11 years old), (ii) on nutritional status of children 6-36 months old as indicated by the lower prevalence of stunting in
Pantawid areas relative to non-Pantawid areas (by 10 percentage points), and (iii) household spending on health and education.
Change* in tax burden due to HB 4774 as % of HH income, 2020 onwards
Income decile PIT VAT
Excise tax on
petroleum
productsTotal
First 2.22 0.43 1.36 4.01
Second 1.90 0.41 1.31 3.62
Third 1.59 0.40 1.33 3.31
Fourth 1.10 0.39 1.34 2.83
Ffith 0.66 0.40 1.43 2.48
Sixth -0.01 0.40 1.46 1.86
Seventh -0.78 0.39 1.47 1.08
Eighth -1.66 0.39 1.50 0.22
Ninth -2.98 0.38 1.51 -1.09
Tenth -4.68 0.33 1.48 -2.87
Total -1.67 0.38 1.45 0.16
* positive (negative) sign indicates increase (decrease) in tax burden

26
Table 14. Aggregate change in tax burden of each decile as a result of TRAIN, by type of tax (2020
onwards)
Table 15. Change in aggregate tax burden of each decile and average
tax burden per household due to HB 5636
Income decilePIT
(million pesos)% distn - PIT VAT
(million pesos)% distn - VAT
Excise tax on
petrol (million
pesos)
% distn - excise
on petrol
All tax changes
(million pesos)
% distn - All
taxes
First 5,348 4.4 1,041 3.8 3,279 3.1 9,668 82.8
Second 6,268 5.2 1,342 4.9 4,333 4.1 11,943 102.3
Third 6,085 5.1 1,516 5.6 5,089 4.9 12,690 108.7
Fourth 4,985 4.1 1,769 6.5 6,076 5.8 12,831 110.0
Ffith 3,411 2.8 2,060 7.6 7,423 7.1 12,893 110.5
Sixth (38) 0.0 2,451 9.0 9,036 8.6 11,449 98.1
Seventh (5,636) -4.7 2,809 10.3 10,616 10.1 7,789 66.7
Eighth (14,354) -11.9 3,348 12.3 12,928 12.3 1,922 16.5
Ninth (32,513) -27.0 4,186 15.4 16,438 15.7 (11,888) -101.9
Tenth (93,978) -78.0 6,669 24.5 29,683 28.3 (57,626) -493.8
Total (120,422) 100.0 27,190 100.0 104,901 100.0 11,669 100.0
* positive (negative) sign indicates increase (decrease) in tax burden
Income decile
Aggregate
change in tax
burden for the
decile (in
million pesos)
Change in
average tax
burden per
household per
year (in pesos)
Change in
average tax
burden per
household per
month (in
pesos)
First 9,668 4,259 355
Second 11,943 5,261 438
Third 12,690 5,590 466
Fourth 12,831 5,652 471
Ffith 12,893 5,680 473
Sixth 11,449 5,044 420
Seventh 7,789 3,431 286
Eighth 1,922 847 71
Ninth -11,888 -5,237 -436
Tenth -57,626 -25,386 -2115
Total 11,669 5,141 428

27
ANNEXES
Annex 1. Illustrative computations of tax liability and ETR (relative to net income) of SEPs with
alternative levels of gross sales/ receipts, assuming alternative profit margins
Annex1.a. Illustrative computation of tax liability and ETR (relative to net income) of SEPs with
gross sales/ receipts equal to PhP 1 million, assuming alternative profit margins
Annex1.b. Illustrative computation of tax liability and ETR (relative to net income) of SEPs with
gross sales/ receipts equal to PhP 1.5 million, assuming alternative profit margins
Gross sales (GS)/
receipts (GR)
Profit margin
= ratio of net
income to
GS/ GR
Net income
Tax liability
(TL) of SEP =
8% tax on GS/
GR
Ratio of TL to
net income
(%)
Tax liability if
net income
were wage
income
Equivalent
ETR if net
income were
wage income
1,000,000 0.1 100,000 80,000 80.0 0 0
1,000,000 0.2 200,000 80,000 40.0 0 0
1,000,000 0.267 267,000 80,000 30.0 2,550 1.0
1,000,000 0.3 300,000 80,000 26.7 7,500 2.5
1,000,000 0.45 450,000 80,000 17.8 32,500 7.2
1,000,000 0.5 500,000 80,000 16.0 42,500 8.5
1,000,000 0.6875 687,500 80,000 11.6 80,000 11.6
1,000,000 0.7 700,000 80,000 11.4 82,500 11.8
1,000,000 0.8 800,000 80,000 10.0 102,500 12.8
1,000,000 0.9 900,000 80,000 8.9 127,500 14.2
Gross sales (GS)/
receipts (GR)
Profit margin
= ratio of net
income to
GS/ GR
Net income
Tax liability
(TL) of SEP =
8% tax on GS/
GR
Ratio of TL to
net income
(%)
Tax liability if
net income
were wage
income
Equivalent
ETR if net
income were
wage income
1,500,000 0.1 150,000 120,000 80.0 0 0
1,500,000 0.2 300,000 120,000 40.0 7,500 2.5
1,500,000 0.267 400,500 120,000 30.0 22,600 5.6
1,500,000 0.3 450,000 120,000 26.7 32,500 7.2
1,500,000 0.45 675,000 120,000 17.8 77,500 11.5
1,500,000 0.5 750,000 120,000 16.0 92,500 12.3
1,500,000 0.591 886,500 120,000 13.5 119,800 13.5
1,500,000 0.6 900,000 120,000 13.3 127,500 14.2
1,500,000 0.7 1,050,000 120,000 11.4 165,000 15.7
1,500,000 0.8 1,200,000 120,000 10.0 202,500 16.9
1,500,000 0.9 1,350,000 120,000 8.9 240,000 17.8

28
Annex 1.c. Illustrative computation of tax liability and ETR (relative to net income) of SEPs with
gross sales/ receipts equal to PhP 2 million, assuming alternative profit margins
Annex 1. d. Illustrative computation of tax liability and ETR (relative to net income) of SEPs with
gross sales/ receipts equal to PhP 2.99 million, assuming alternative profit margins
Gross sales (GS)/
receipts (GR)
Profit margin
= ratio of net
income to
GS/ GR
Net income
Tax liability
(TL) of SEP =
8% tax on GS/
GR
Ratio of TL to
net income
(%)
Tax liability if
net income
were wage
income
Equivalent
ETR if net
income were
wage income
2,000,000 0.1 200,000 160,000 80.0 0 0
2,000,000 0.2 400,000 160,000 40.0 22500 5.6
2,000,000 0.267 534,000 160,000 30.0 49300 9.2
2,000,000 0.3 600,000 160,000 26.7 62500 10.4
2,000,000 0.4 800,000 160,000 20.0 102500 12.8
2,000,000 0.515 1,030,000 160,000 15.5 160000 15.5
2,000,000 0.6 1,200,000 160,000 13.3 202500 16.9
2,000,000 0.7 1,400,000 160,000 11.4 252500 18.0
2,000,000 0.8 1,600,000 160,000 10.0 302500 18.9
2,000,000 0.9 1,800,000 160,000 8.9 352500 19.6
Gross sales (GS)/
receipts (GR)
Profit margin
= ratio of net
income to
GS/ GR
Net income
Tax liability
(TL) of SEP =
8% tax on GS/
GR
Ratio of TL to
net income
(%)
Tax liability if
net income
were wage
income
Equivalent
ETR if net
income were
wage income
2,999,999 0.1 300,000 240,000 80.0 7,500 2.5
2,999,999 0.2 600,000 240,000 40.0 62,500 10.4
2,999,999 0.267 801,000 240,000 30.0 102,750 12.8
2,999,999 0.3 900,000 240,000 26.7 127,500 14.2
2,999,999 0.45 1,350,000 240,000 17.8 240,000 17.8
2,999,999 0.5 1,500,000 240,000 16.0 277,500 18.5
2,999,999 0.6 1,799,999 240,000 13.3 352,500 19.6
2,999,999 0.7 2,099,999 240,000 11.4 432,500 20.6
2,999,999 0.8 2,399,999 240,000 10.0 522,500 21.8
2,999,999 0.9 2,699,999 240,000 8.9 612,500 22.7

29
Annex 2. How the value-added tax works
The value-added tax is a tax on consumption. It is an indirect tax collected at various stages of the
production and distribution chain, much like the turnover tax or multi-stage sales tax. However, the VAT
does not result in tax cascading (i.e., tax-on-tax) that is characteristic of the latter. The seller of any good
liable to a multi-stage turnover tax pays government the turnover tax rate times the value of its output. If
said good (good A) is an input to another product, the tax “content” of this second product (good B) not
only includes the turnover tax directly levied on it but also the turnover tax previously levied on its inputs.
Tax cascading distorts the way of doing business, and provides undue incentive for vertical integration of
business activity.
Under the current VAT system, a good/service is subject to one of three regimes: (i) VAT-able; (ii) a
VAT-exempt; or (iii) zero-rated.
A. VAT-able good/service
The seller of a VAT-able good pays government the VAT on its output (i.e., VAT rate times selling price
before VAT) less the sum of VAT on all its VAT-able inputs (Annex Table 2.1). Typically, the invoice
issued by the seller indicates the value of the good sold before tax and the amount of VAT levied on the
said good. This signals that VAT on output is passed on (or shifted) to the buyer. VAT borne by
producers is zero as (i) the VAT on their output is shifted forward to their buyers, and (ii) they are able to
claim credit for the VAT they paid when they purchased their inputs. The VAT borne by the final
consumer of a VAT-able good is equal to the VAT levied on the selling price before VAT.
B. VAT-exempt good/service
The seller of a VAT-exempt good does not pay the government any VAT on its output, but he is not able
to claim credit for the VAT he paid on his VAT-able inputs. If the seller of VAT-exempt goods is not able
to shift the VAT he paid on his VAT-able inputs forward to his buyers (Annex Table 2.2): (i) there is no
change in the price of the VAT-exempt good; and (ii) the profit of producers of VAT-exempt goods goes
down by the amount of the VAT on its inputs. On the other hand, if the seller of VAT-exempt goods is
able to shift the VAT he paid on his VAT-able inputs forward to his buyers (Annex Table 2.3): (i) the
price of a VAT-exempt good goes up by the amount of VAT on its inputs; (ii) producers who make use of
a VAT-exempt good as intermediate input will not be able to claim credit for the VAT embedded in the
price of their VAT-exempt inputs; (iii) there will be less incentive for these producers to use VAT-exempt
inputs or to buy inputs from VAT-exempt sellers, resulting in tax cascading; (iv) final consumers of
VAT-exempt goods will bear the burden of the VAT paid on the VAT-able inputs going into the
production of the VAT-exempt good; and (v) the price of output of intermediate users of VAT-exempt
goods and all producers/sellers down the production-distribution chain rises.
Exempting goods/services from the VAT will tend to result in administrative difficulties and encourage
non-compliance (e.g., a multi-product firm will have to “allocate” the VAT credit on its VAT-able inputs
to the production of its VAT-exempt product and VAT-able product). Meanwhile, VAT-exempt
transactions (e.g., VAT exemption of sales of drugs and medicines, restaurant meals, etc. to senior
citizens) tend to complicate the system even further.

30
C. Zero-rated goods/services
The seller of a zero-rated VAT-able good does not pay government any VAT on its output and is also
able to claim credit/refund/rebate for the VAT he paid on his VAT-able inputs. For example, exports are
zero-rated under the current VAT system.
Annex Table 2.1. Illustrative example* if all sales are VAT-able at 10%
ILLUSTRATIVE EXAMPLE* - ALL SALES ARE VAT-ABLE AT 10%
Primary
producer
(P)
Manufac-
turer (M)
Wholesa-
ler (W)
Retailer
(R)
1. Sales 400 1,200 1,400 2,000
2. Purchases (inputs) - 400 1,200 1,400
3. Value-added 380 800 200 600
Wages 350 750 190 560
Capital income 20 50 10 40
1. Sales (or output) net of VAT 400 1,200 1,400 2,000
2.1. Purchases (or inputs) - VAT inclusive - 440 1,320 1,400
2.2. Purchases (or inputs) - net of VAT credit - 400 1,200 1,260
3. Value-added 380 800 200 600
Wages 350 750 190 560
Capital income 20 50 10 40
Output sales before VAT 400 1200 1400 2000
Output sales inclusive of VAT 440 1320 1540 2200
1. Output VAT 40 120 140 200
2. Input VAT 0 40 120 140
3. Net tax paid by seller to govt 40 80 20 60
* adapted from Cnossen (2011)
A. Transactions exclusive of VAT
B. If all sales are VAT-able at 10%
Memo item:
VAT

31
Annex Table 2.2. Illustrative example* if all sales are VAT-able at 10% except that of the
manufacturer, who is tax-exempt (if seller is not able to shift input VAT forward to buyers)
Primary
producer
(P)
Manufac-
turer (M)
Wholesa-
ler (W)
Retailer
(R)
1. Sales 400 1,200 1,400 2,000
2. Purchases (inputs) - 400 1,200 1,400
3. Value-added 380 800 200 600
Wages 350 750 190 560
Capital income 20 50 10 40
1. Sales (or output) net of VAT 400 1200 1400 2000
2.1. Purchases (or inputs) - VAT inclusive 0 440 1200 1540
2.2. Purchases (or inputs) - net of VAT credit 0 440 1200 1400
3. Value-added 380 760 200 600
Wages 350 750 190 560
Capital income 20 10 10 40
Output sales before VAT 400 1200 1400 2000
Output sales inclusive of VAT 440 1200 1540 2200
1. Output VAT 40 0 140 200
2. Input VAT 0 0 0 140
3. Net tax paid by seller to govt 40 0 140 60
* adapted from Cnossen (2011)
ILLUSTRATIVE EXAMPLE* - ALL SALES ARE VAT-ABLE AT 10% EXCEPT THAT OF
MANUFACTURER WHO IS VAT-EXEMPT
VAT
A. Transactions exclusive of VAT
manufacturer assumed not to be able to shift VAT on inputs to wholesaler
B. If sales of manufacturer is VAT-exempt but all other sales are VAT-able at 10%;
Memo item:

32
Annex Table 2.3. Illustrative example* if all sales are VAT-able at 10% except that of the
manufacturer, who is tax-exempt (if seller is able to shift input VAT forward to buyers)
Primary
producer
(P)
Manufac-
turer (M)
Wholesa-
ler (W)
Retailer
(R)
1. Sales 400 1,200 1,400 2,000
2. Purchases (inputs) - 400 1,200 1,400
3. Value-added 380 800 200 600
Wages 350 750 190 560
Capital income 20 50 10 40
1. Sales (or output) net of VAT 400 1240 1440 2040
2.1. Purchases (or inputs) - VAT inclusive 0 440 1240 1584
2.2. Purchases (or inputs) - net of VAT credit 0 440 1240 1440
3. Value-added 380 800 200 600
Wages 350 750 190 560
Capital income 20 50 10 40
Output sales before VAT 400 1240 1440 2040
Output sales inclusive of VAT 440 1240 1584 2244
1. Output VAT 40 0 144 204
2. Input VAT - 0 0 144
3. Net tax paid by seller to govt 40 0 144 60
* adapted from Cnossen (2011)
Memo item:
VAT
ILLUSTRATIVE EXAMPLE* - ALL SALES ARE VAT-ABLE AT 10% EXCEPT THAT OF
MANUFACTURER WHO IS VAT-EXEMPT
A. Transactions exclusive of VAT
B. If sales of manufacturer is VAT-exempt but all other sales are VAT-able at 10%;
manufacturer assumed to be able to shift VAT on inputs to wholesaler
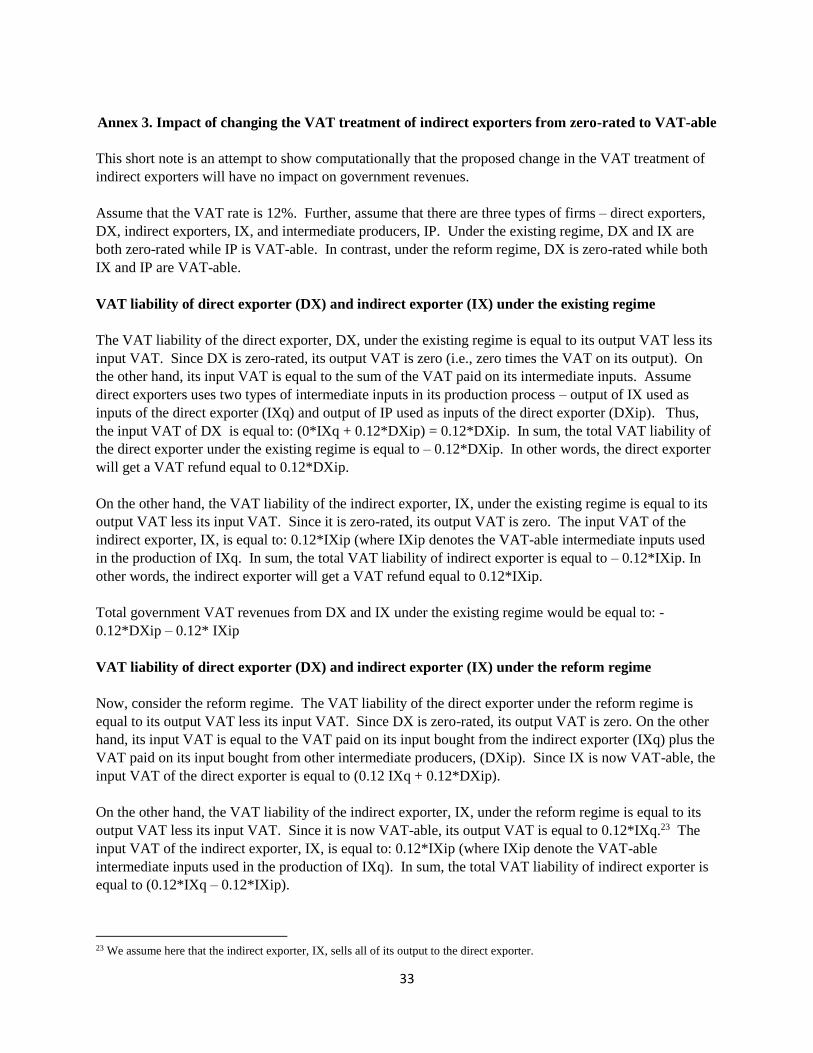
33
Annex 3. Impact of changing the VAT treatment of indirect exporters from zero-rated to VAT-able
This short note is an attempt to show computationally that the proposed change in the VAT treatment of
indirect exporters will have no impact on government revenues.
Assume that the VAT rate is 12%. Further, assume that there are three types of firms – direct exporters,
DX, indirect exporters, IX, and intermediate producers, IP. Under the existing regime, DX and IX are
both zero-rated while IP is VAT-able. In contrast, under the reform regime, DX is zero-rated while both
IX and IP are VAT-able.
VAT liability of direct exporter (DX) and indirect exporter (IX) under the existing regime
The VAT liability of the direct exporter, DX, under the existing regime is equal to its output VAT less its
input VAT. Since DX is zero-rated, its output VAT is zero (i.e., zero times the VAT on its output). On
the other hand, its input VAT is equal to the sum of the VAT paid on its intermediate inputs. Assume
direct exporters uses two types of intermediate inputs in its production process – output of IX used as
inputs of the direct exporter (IXq) and output of IP used as inputs of the direct exporter (DXip). Thus,
the input VAT of DX is equal to: (0*IXq + 0.12*DXip) = 0.12*DXip. In sum, the total VAT liability of
the direct exporter under the existing regime is equal to – 0.12*DXip. In other words, the direct exporter
will get a VAT refund equal to 0.12*DXip.
On the other hand, the VAT liability of the indirect exporter, IX, under the existing regime is equal to its
output VAT less its input VAT. Since it is zero-rated, its output VAT is zero. The input VAT of the
indirect exporter, IX, is equal to: 0.12*IXip (where IXip denotes the VAT-able intermediate inputs used
in the production of IXq. In sum, the total VAT liability of indirect exporter is equal to – 0.12*IXip. In
other words, the indirect exporter will get a VAT refund equal to 0.12*IXip.
Total government VAT revenues from DX and IX under the existing regime would be equal to: -
0.12*DXip – 0.12* IXip
VAT liability of direct exporter (DX) and indirect exporter (IX) under the reform regime
Now, consider the reform regime. The VAT liability of the direct exporter under the reform regime is
equal to its output VAT less its input VAT. Since DX is zero-rated, its output VAT is zero. On the other
hand, its input VAT is equal to the VAT paid on its input bought from the indirect exporter (IXq) plus the
VAT paid on its input bought from other intermediate producers, (DXip). Since IX is now VAT-able, the
input VAT of the direct exporter is equal to (0.12 IXq + 0.12*DXip).
On the other hand, the VAT liability of the indirect exporter, IX, under the reform regime is equal to its
output VAT less its input VAT. Since it is now VAT-able, its output VAT is equal to 0.12*IXq.23 The
input VAT of the indirect exporter, IX, is equal to: 0.12*IXip (where IXip denote the VAT-able
intermediate inputs used in the production of IXq). In sum, the total VAT liability of indirect exporter is
equal to (0.12*IXq – 0.12*IXip).
23 We assume here that the indirect exporter, IX, sells all of its output to the direct exporter.

34
Total government VAT revenues from DX and IX under the reform regime is then to ( -0.12*DXip - 0.12
IXq) plus (0.12*IXq – 0.12*IXip) which is equal to ( - 0.12*DXip – 0.12%IXip).
Thus, the difference between total government revenues under reform regime, on the one hand, and total
government under the existing regime, on the other hand, is thus equal to zero as shown in the table
below.
where:
IXq denote output of indirect exporters which are used as intermediate inputs of direct exporters,
IXip denote intermediate inputs used in the production of IXo, and
DXip denote other intermediate inputs used in the production of direct exports.
VAT regime Direct Exporter (DX) Indirect Exporter (IX) Total = (DX) + (IX)
Existing regime (1) - 0.12 (DXip) - 0.12 (IXip) - 0.12 (DXip) - 0.12 (IXip)
Reform regime (2) - 0.12 (IXq) - 0.12 (DXip) 0.12 (IXq) – 0.12 (IXip) - 0.12 (DXip) – 0.12 (IXip)
Difference = (2) - (1) - 0.12 (IXq) 0.12 (IXq) 0

35
Annex 4. Methodology for estimating the price effect of the proposed increase in petroleum excise
tax rates under HB 4774, HB 5636 and SB 1408
The methodology has two major steps. First, price-cost analysis was used to estimate the price effect of
the increase in petroleum excise tax. The 2006 Input-Output (I-O) table was utilized for the analysis. The
second step involved computing total household expenditures on items relevant to petroleum products.
Source of the data for total expenditures was the 2012 Family Income and Expenditure Survey (FIES).
Selected variables from the FIES were later on mapped to the IO sectors. Finally, to arrive at the tax take,
the sectoral price effect was multiplied to the corresponding FIES expenditure data of the mapped items.
A more detailed explanation of the two steps are provided in the next sections.
Price cost analysis. The methodology for the price cost analysis was adapted from Mijares and Samson
(1980). Main data set used for this analysis is the 2006 Input-Output table. The method assumes that
output prices of a particular sector would adjust to offset the increase in input prices. This is shown in the
following equation:
(1) 1( ') ( ')p I A wl v
Where p represents price, wl represent wages and labor, v are the value added items, and (I-A)
corresponds to the identity matrix less the technology matrix. The inverse of the transposed (I-A) would
account for both direct and indirect output needed to satisfy final demand.
In terms of percentage change in prices with no assumed increase in wages, Equation 1 is equivalent to
the following matrix notation form:
(2)
1 11 21 1 1
2 12 22 2 2
3 1 2
n
n
n n nn n
p r r r v
p r r r v
p r r r v
Where p refers to the change in price, v is the change in value added, and rij represents the
coefficients of the inverse of the (I-A) matrix. Since we are only concerned with the impact of the price
increase in petroleum, we could already set ∆𝑣=0 for other sectors. For the petroleum sector (code 107 in
the I-O table), ∆𝑣 is computed as:
(3)
Using the computed value of 107v , the impact of the change in the price of petroleum by sector could
now be simply estimated through the following equation:
(4) ,107 107i ip r v 1,2,..., 240.i
107107
107,107
pv
r
36
Where ip refers to the change in price of sector i, and ,107ir represents the coefficient of sector i in
column 107 (manufacture of petroleum) of the inverse of the transposed (I-A).
Note that the price effect was computed for each year indicated in the schedule. The weighted average of
the change in excise tax rates by petroleum type was used to estimate 107p in Equation 3; changes were
relative to existing tax rates and prices of petroleum products in 2015. Meanwhile, the weights were
derived from 2015 petroleum consumption data from the Department of Energy (DOE). The same method
was employed to compute for the baseline price effect; however, it was assumed here that initial excise
tax on petroleum is zero for all products.
Mapping of the FIES to the Input-Output tables of 2006. The value of household consumption of goods
relevant to petroleum products was generated from the 2015 Family Income and Expenditure Survey
dataset. The data was further broken down into income deciles to determine whether the new taxes are
progressive or regressive.
The selected variables from the FIES were then mapped with the IO sectors. The IO sectors that have no
equivalent match in FIES variables were dropped. After the matching process, the computed price effects
were multiplied with the structure of household consumption derived from the FIES.

37
REFERENCES
Manasan, R. (2016). Comparative Assessment of Proposals to Amend the Personal Income Tax Law (Revised
version of PIDS Discussion Paper No. 2015-48). Retrieved from the Philippine Institute for Development
Studies website: http://dirp3.pids.gov.ph/websitecms/CDN/PUBLICATIONS/pidsdps1548_rev4.pdf
Medalla, E. (2002). Fiscal incentives revisited. Philippine Journal of Development, 54(2), 1-26.
Quimbo, S. and Javier, X. (2015). Rethinking the taxation of compensation income in the Philippines. The
Philippine Review of Economics, 52(1), 1-22.
Reside, R. and Burns, L. (2016). Comprehensive Tax Reform in the Philippines: Principles, History and
Recommendations (Discussion Paper No. 2016-10). Retrieved from the UP School of Economics website:
http://www.econ.upd.edu.ph/dp/index.php/dp/article/view/1497
World Bank (2014). Philippine Economic Update August 2014. World Bank Office Manila, Philippines.
World Bank (2016). Philippine Economic Update October 2016. World Bank Office Manila, Philippines.