assessment of the coastal vulnerability index in an area
TRANSCRIPT

geosciences
Article
Assessment of the Coastal Vulnerability Index in anArea of Complex Geological Conditions on the KrkIsland, Northeast Adriatic Sea
Igor Ružic , Sanja Dugonjic Jovancevic * , Cedomir Benac and Nino Krvavica
Faculty of Civil Engineering, University of Rijeka, Radmile Matejcic, 3, 51000 Rijeka, Croatia;[email protected] (I.R.); [email protected] (C.B.); [email protected] (N.K.)* Correspondence: [email protected]
Received: 28 March 2019; Accepted: 11 May 2019; Published: 14 May 2019�����������������
Abstract: This study presents a vulnerability assessment methodology that was developed toanalyze the Croatian Eastern Adriatic Coast (CEAC), which has extremely complex geomorphology.Local coastal retreat, slope instability phenomena, and the influence of marine erosion play asignificant role in coastal geohazards in the southeastern coastal area of the Krk Island (Kvarner area,northeastern channel part of the Adriatic Sea). Recent studies emphasize the need to develop anadequate methodology to monitor its evolution and define adequate risk management strategies.The vulnerability analysis was performed on the basis of the available data, taking into account localgeological and oceanographic conditions. The coastal vulnerability analysis of the CEAC presents anadaptation of the existing methodology, emphasizing the significance of the geological factor, andproviding novel elements of the parameter analysis (i.e., coastal slope, beach width, and significantwave height). This methodology was adapted and improved for the local rocky coast, but can beused on other complex rocky coasts worldwide. The calculated Coastal Vulnerability Index (CVI)around the Stara Baška settlement should be considered to have priority over the vulnerable areas infurther monitoring and investigations.
Keywords: geohazard; coastal processes; Coastal Vulnerability Index; karst; flysch; Adriatic Sea
1. Introduction
Coastal areas are dynamic and complex multi-functional systems, with a large number of oftenconflicting socioeconomic activities, ecological and natural values, and high habitat and biologicaldiversity. These aspects are all fundamental for sustainable coastal management and for providingecosystem services, which are essential for human well-being [1]. Continental and marine processesalong coastal areas change the landscape [2], and climate change adds additional pressure to Europeancoastal systems by increasing the vulnerability of already highly vulnerable areas. The main impactsof climate change in coastal zones are related to meteorological changes, primarily sea-level rise [3].
Current methodologies for coastal vulnerability analyses use index-based methods [4–11], anindicator-based approach, GIS-based decision support systems [12], and dynamic computer models [13].The assessment of the coastal vulnerability is a complex process that is usually simplified andapproximated because it includes a great number of parameters, where some may interact resultingin various outcomes. The main parameters usually considered in vulnerability assessments are:geomorphology, coastal slope, shoreline erosion/accretion rates, emerged beach width, dune width,relative sea-level change, mean significant wave height, mean tide range, and the width of vegetationbehind the beach [14]. In addition to these natural or geophysical factors, some methodologiesalso include socioeconomic or anthropological influences quantified by such parameters as land-use,
Geosciences 2019, 9, 219; doi:10.3390/geosciences9050219 www.mdpi.com/journal/geosciences

Geosciences 2019, 9, 219 2 of 17
manmade structures and interventions, and water management, and finally by calculating the IntegratedCoastal Vulnerability Index [15]. A rating of the vulnerability analysis’s key parameters is often basedon the Analytic Hierarchy Process [9,16].
Unlike most European Union countries, mapping of the coastal vulnerability, assessments ofgeological hazards, and coastal zone management are completely unknown concepts in Croatia [1,17].Coastal geohazard strategies on the Croatian Eastern Adriatic Coast (CEAC) are currently implementedonly by means of reconstruction and remediation works after the coastal retreat and occurrence oflocal instabilities. Problems of coastal vulnerability induced by marine erosion in the Kvarner areahave been described in several previous studies, and are therefore better understood and documentedthan in other coastal parts of Croatia. The results of the recent research have shown vulnerabilityin the southeastern coast of Krk Island, near Stara Baška (Figure 1) [18–24]. Marine erosion andproblems of coastal vulnerability in the wider area of Stara Baška have been described in several recentstudies [20,21,25]. However, a Coastal Vulnerability Index (CVI) has never been calculated for theCroatian coast. In contrast, the coastal vulnerability of the nearby northern Italian coast has beencovered by many investigations [12]. Coastal vulnerability studies in the Mediterranean are relativelyrare in relation to the coastal length and socioeconomic importance [14,26–29].
Geosciences 2019, 9, x FOR PEER REVIEW 2 of 18
Geosciences 2019, 9, x; doi: FOR PEER REVIEW www.mdpi.com/journal/geosciences
manmade structures and interventions, and water management, and finally by calculating the
Integrated Coastal Vulnerability Index [15]. A rating of the vulnerability analysis’s key parameters is
often based on the Analytic Hierarchy Process [9,16].
Unlike most European Union countries, mapping of the coastal vulnerability, assessments of
geological hazards, and coastal zone management are completely unknown concepts in Croatia
[1,17]. Coastal geohazard strategies on the Croatian Eastern Adriatic Coast (CEAC) are currently
implemented only by means of reconstruction and remediation works after the coastal retreat and
occurrence of local instabilities. Problems of coastal vulnerability induced by marine erosion in the
Kvarner area have been described in several previous studies, and are therefore better understood
and documented than in other coastal parts of Croatia. The results of the recent research have shown
vulnerability in the southeastern coast of Krk Island, near Stara Baška (Figure 1)[18–24]. Marine
erosion and problems of coastal vulnerability in the wider area of Stara Baška have been described in
several recent studies [20,21,25]. However, a Coastal Vulnerability Index (CVI) has never been
calculated for the Croatian coast. In contrast, the coastal vulnerability of the nearby northern Italian
coast has been covered by many investigations [12]. Coastal vulnerability studies in the
Mediterranean are relatively rare in relation to the coastal length and socioeconomic importance
[14,26–29].
CEAC is predominantly steep, rocky coast, mostly formed of karstified carbonate rocks. For this
reason, the geomorphology of this coastal area is more complex and diverse, comprising of different
coastal forms on a small scale [30]. Intensive morphogenetic processes caused by tectonic movements
and rapid sea-level changes, as well as climatic changes, resulted in the present shape of the Kvarner
area, as well as the shape of the Krk Island (Figure 1). A larger segment of the Kvarner coast is
submerged karst relief [31]. Relatively resistant sedimentary Cretaceous and Palaeogene carbonate
rocks (limestone, carbonate limestone, and carbonate breccias) prevail, whereas outcrops of less-
resistant Paleogene siliciclastic rocks (marls and flysch) are rare. Pleistocene and Holocene deposits
partially cover this bedrock substrate. Due to the geological setting, hydrogeological conditions, and
direct exposure to the waves, the investigated coastal zone is in a fragile geodynamic equilibrium.
Over the past few decades, the expansion of urbanization (mainly for tourism purposes), and a lack
of appropriate infrastructure (drainage system), caused an increase of erosion processes and local
instabilities.
Figure 1. Location of the research area around Stara Baška on Krk Island.
The aim of this paper is to propose a suitable methodology for calculating the CVI considering
the previously mentioned specific characteristics of the CEAC. In the preliminary analysis, several
existing methodologies were considered on a selected segment of the coast near Stara Baška (Figure
Figure 1. Location of the research area around Stara Baška on Krk Island.
CEAC is predominantly steep, rocky coast, mostly formed of karstified carbonate rocks. Forthis reason, the geomorphology of this coastal area is more complex and diverse, comprising ofdifferent coastal forms on a small scale [30]. Intensive morphogenetic processes caused by tectonicmovements and rapid sea-level changes, as well as climatic changes, resulted in the present shape ofthe Kvarner area, as well as the shape of the Krk Island (Figure 1). A larger segment of the Kvarnercoast is submerged karst relief [31]. Relatively resistant sedimentary Cretaceous and Palaeogenecarbonate rocks (limestone, carbonate limestone, and carbonate breccias) prevail, whereas outcrops ofless-resistant Paleogene siliciclastic rocks (marls and flysch) are rare. Pleistocene and Holocene depositspartially cover this bedrock substrate. Due to the geological setting, hydrogeological conditions, anddirect exposure to the waves, the investigated coastal zone is in a fragile geodynamic equilibrium.Over the past few decades, the expansion of urbanization (mainly for tourism purposes), and alack of appropriate infrastructure (drainage system), caused an increase of erosion processes andlocal instabilities.
The aim of this paper is to propose a suitable methodology for calculating the CVI consideringthe previously mentioned specific characteristics of the CEAC. In the preliminary analysis, several

Geosciences 2019, 9, 219 3 of 17
existing methodologies were considered on a selected segment of the coast near Stara Baška (Figure 1).The vulnerability was analyzed on the basis of the available data sets, which include the most relevantparameters directly or indirectly influencing the vulnerability of the coastal system in the researcharea: geological setting, wave height, wind, tide, sediment transport, sediment supply from rivers tothe sea, hydrogeological setting, relative sea-level change, land use, present infrastructure (buildings,ports, barriers), surface flow regulation, and land cover. In contrast to existing methodologies, whichare based on assignment of vulnerability values to the costal segments, the analysis presented in thispaper is based on the calculations of vulnerability at individual coastal points, which is more suitablefor complex coastal environments. The existing methodology was adapted emphasizing the influenceof the geological factor and giving accent to the novel approach in the parametric analysis, applicableat the international level: (i) a detailed calculation of the coastal slope, defined as a maximal slopewithin the 50 m segment, due to the coastal slope variability, (ii) a new approach for the beach widthcalculation at a single coastal point, and (iii) a definition of the significant wave height at a singlecoastal point based on Simulating WAves Nearshore (SWAN) numerical model results.
2. Study Area
The research area is Stara Baška on the Krk Island located in the Kvarneric Bay in the northernAdriatic. Kvarneric Bay is a relatively enclosed northeastern channel part of the Adriatic Sea, withlimited fetch areas (Figure 1). The study area is exposed to wind-generated waves from the southwest(SW), south (S) and southeast (SE) directions, with a largest significant wave height of 3 m, as reportedfrom the measurements taken in the Rijeka Bay [32]. The highest waves from the SE direction areusually accompanied by storm surges. This is a micro-tidal environment, with a tidal range between20 and 50 cm. Numerical wave simulations in the Kvarner area, with a constant SE wind direction,have shown that Rab Island protects the coastal area of the Krk Island from the SE wind waves.
The terrain elevations around Stara Baška are formed in Upper Cretaceous and Paleogenelimestone, dolomitic limestone, and dolomitic breccias. This carbonate rock mass has a different degreeof fissuring and karstification and forms the typical bare karstic landscape. Paleogene siliciclastic rocksare situated in a relatively narrow tectonically squeezed coastal zone. This rock mass consists of marlsand flysch (siltstones and thin beds of sandstones). Despite bare karst in surrounding altitudes, a largepart of this rock mass is covered by Quaternary sediments: the western part of the investigated area iscovered by talus breccias and the eastern part by breccia and colluvial deposits (a mixture of silty clayand carbonate rock fragments) (Figure 2). Outcrops of siliciclastic rock mass are visible sporadically inthe narrow coastal zone [20,21,33].
Coastal cliffs formed in talus breccias have an average height of 5 to 6 meters. The top layer atthe subsurface, of about 1 m thickness, is completely weathered and has properties of residual soil.The erosional processes have reduced surrounding elevations and formed gravelly beaches with grainsizes between 2 and 20 mm. The karstified carbonate rock mass has a high permeability. On the otherhand, the siliciclastic rock mass is impermeable and subsurface (hypodermic) groundwater flows areformed through permeable talus breccia toward the sea. Reflecting this complex geological setting, theinvestigated coastline has pocket beaches, headlands, cliffs, cliff undercuts, rock piles, and landslidesin a small area. A rockfall, which happened during a calm summer night on 18 July 2009, caused atragic loss of life of a tourist at this site [34].
Stagnation of the sea level rise occurred in the last 5000 years, after the rapid LatePleistocene–Holocene rise in the Adriatic Sea [35,36]. Erosional processes were reduced, marineerosion/abrasion increased, and gravely alluvial fans have been formed along the coast. The combinationof these geomorphologic factors enabled the formation of a relatively wide marina terrace in theinvestigated area.
The Stara Baška settlement dates from the 14th century. It has a population of 113 people, whichexpands more than 10 times during the touristic season. Due to the tourism development in StaraBaška, many houses have been built during the last half-century. This settlement expansion was not

Geosciences 2019, 9, 219 4 of 17
followed by adequate infrastructure and land-use planning. Many houses were built in potentiallyunstable zones.
Geosciences 2019, 9, x FOR PEER REVIEW 3 of 18
Geosciences 2019, 9, x; doi: FOR PEER REVIEW www.mdpi.com/journal/geosciences
1). The vulnerability was analyzed on the basis of the available data sets, which include the most
relevant parameters directly or indirectly influencing the vulnerability of the coastal system in the
research area: geological setting, wave height, wind, tide, sediment transport, sediment supply from
rivers to the sea, hydrogeological setting, relative sea-level change, land use, present infrastructure
(buildings, ports, barriers), surface flow regulation, and land cover. In contrast to existing
methodologies, which are based on assignment of vulnerability values to the costal segments, the
analysis presented in this paper is based on the calculations of vulnerability at individual coastal
points, which is more suitable for complex coastal environments. The existing methodology was
adapted emphasizing the influence of the geological factor and giving accent to the novel approach
in the parametric analysis, applicable at the international level: (i) a detailed calculation of the coastal
slope, defined as a maximal slope within the 50 m segment, due to the coastal slope variability, (ii) a
new approach for the beach width calculation at a single coastal point, and (iii) a definition of the
significant wave height at a single coastal point based on Simulating WAves Nearshore (SWAN)
numerical model results.
2. Study Area
The research area is Stara Baška on the Krk Island located in the Kvarnerić Bay in the northern
Adriatic. Kvarnerić Bay is a relatively enclosed northeastern channel part of the Adriatic Sea, with
limited fetch areas (Figure 1). The study area is exposed to wind-generated waves from the southwest
(SW), south (S) and southeast (SE) directions, with a largest significant wave height of 3 m, as
reported from the measurements taken in the Rijeka Bay [32]. The highest waves from the SE direction
are usually accompanied by storm surges. This is a micro-tidal environment, with a tidal range
between 20 and 50 cm. Numerical wave simulations in the Kvarner area, with a constant SE wind
direction, have shown that Rab Island protects the coastal area of the Krk Island from the SE wind
waves.
The terrain elevations around Stara Baška are formed in Upper Cretaceous and Paleogene
limestone, dolomitic limestone, and dolomitic breccias. This carbonate rock mass has a different
degree of fissuring and karstification and forms the typical bare karstic landscape. Paleogene
siliciclastic rocks are situated in a relatively narrow tectonically squeezed coastal zone. This rock
mass consists of marls and fly
Figure 2. A simplified engineering geological map of the analyzed area. Figure 2. A simplified engineering geological map of the analyzed area.
3. Methodology
In this study, the vulnerability analysis of the narrow coastal area implies the potential degreeof change that some coastal segment can sustain due to the presence or impact of different naturalinfluences defined by considered parameters. Index-based approaches express coastal vulnerability bymeans of a one-dimensional CVI proposed by Gornitz [4,37]. The method is based on a segmentationof a coastline, and assignment of vulnerability values to each coastal segment. The CVI may be definedas the square root of the product of the ranking factors divided by the number of parameters [38],the geometric average of the ranking factors [39], the sum of the value of each variable divided bythe number of variables [40], or by taking the sum of the considered variables with the rank of eachmultiplied by their corresponding weights [41].
A segment of the coastline can be vulnerable considering different parameters, but only if exposedto a certain hazardous phenomenon or impact. On the other side, different anthropogenic measurescan provide a certain vulnerability reduction (e.g., coastline structures, natural offshore cliffs or islets),and should be considered in the resulting CVI (Figure 3).
Geosciences 2019, 9, x FOR PEER REVIEW 4 of 18
Geosciences 2019, 9, x; doi: FOR PEER REVIEW www.mdpi.com/journal/geosciences
Coastal cliffs formed in talus breccias have an average height of 5 to 6 meters. The top layer at the
subsurface, of about 1 m thickness, is completely weathered and has properties of residual soil. The
erosional processes have reduced surrounding elevations and formed gravelly beaches with grain sizes
between 2 and 20 mm. The karstified carbonate rock mass has a high permeability. On the other hand, the
siliciclastic rock mass is impermeable and subsurface (hypodermic) groundwater flows are formed
through permeable talus breccia toward the sea. Reflecting this complex geological setting, the
investigated coastline has pocket beaches, headlands, cliffs, cliff undercuts, rock piles, and landslides in a
small area. A rockfall, which happened during a calm summer night on 18 July 2009, caused a tragic loss
of life of a tourist at this site [34].
Stagnation of the sea level rise occurred in the last 5000 years, after the rapid Late Pleistocene–
Holocene rise in the Adriatic Sea [35,36]. Erosional processes were reduced, marine erosion/abrasion
increased, and gravely alluvial fans have been formed along the coast. The combination of these
geomorphologic factors enabled the formation of a relatively wide marina terrace in the investigated area.
The Stara Baška settlement dates from the 14th century. It has a population of 113 people, which
expands more than 10 times during the touristic season. Due to the tourism development in Stara Baška,
many houses have been built during the last half-century. This settlement expansion was not followed by
adequate infrastructure and land-use planning. Many houses were built in potentially unstable zones.
3. Methodology
In this study, the vulnerability analysis of the narrow coastal area implies the potential degree of
change that some coastal segment can sustain due to the presence or impact of different natural influences
defined by considered parameters. Index-based approaches express coastal vulnerability by means of a
one-dimensional CVI proposed by Gornitz [4,37]. The method is based on a segmentation of a coastline,
and assignment of vulnerability values to each coastal segment. The CVI may be defined as the square
root of the product of the ranking factors divided by the number of parameters [38], the geometric average
of the ranking factors [39], the sum of the value of each variable divided by the number of variables [40],
or by taking the sum of the considered variables with the rank of each multiplied by their corresponding
weights [41].
A segment of the coastline can be vulnerable considering different parameters, but only if
exposed to a certain ha
Figure 3. The framework of the Coastal Vulnerability Index assessment.
The CVI calculated for the wider area of Stara Baška covers a linear coastal transect of 4342 m, and a
total coastline of 7720 m, with a respective coastal ratio of 1.78. A stretch of the coast is divided into 1545
5-m wide segments, represented by a single point (Figure 4). CVI analyses based on cross-sectional
profiles are not suitable in this case because of the complex morphology with numerous pocket beaches,
headlands, and cliffs. Furthermore, cross-sectional analyses would take much more time and effort, with
Figure 3. The framework of the Coastal Vulnerability Index assessment.
Geosciences 2019, 9, 219 5 of 17
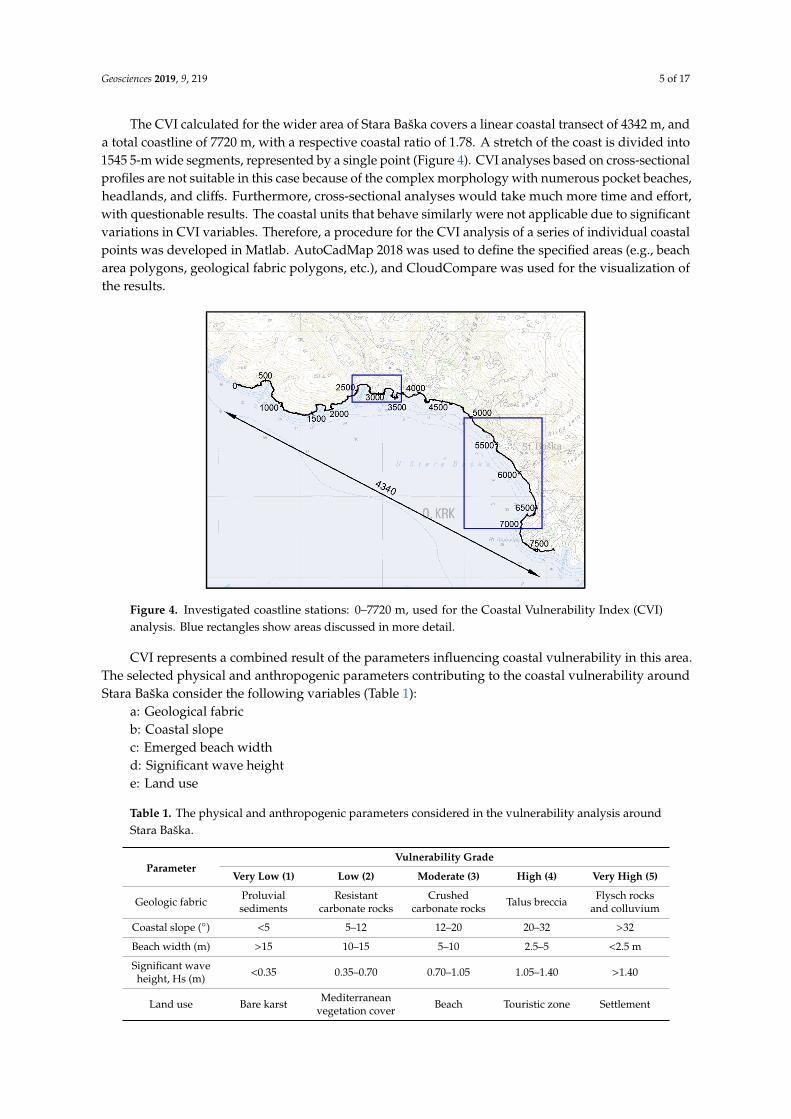
The CVI calculated for the wider area of Stara Baška covers a linear coastal transect of 4342 m, anda total coastline of 7720 m, with a respective coastal ratio of 1.78. A stretch of the coast is divided into1545 5-m wide segments, represented by a single point (Figure 4). CVI analyses based on cross-sectionalprofiles are not suitable in this case because of the complex morphology with numerous pocket beaches,headlands, and cliffs. Furthermore, cross-sectional analyses would take much more time and effort,with questionable results. The coastal units that behave similarly were not applicable due to significantvariations in CVI variables. Therefore, a procedure for the CVI analysis of a series of individual coastalpoints was developed in Matlab. AutoCadMap 2018 was used to define the specified areas (e.g., beacharea polygons, geological fabric polygons, etc.), and CloudCompare was used for the visualization ofthe results.
Geosciences 2019, 9, x FOR PEER REVIEW 5 of 18
Geosciences 2019, 9, x; doi: FOR PEER REVIEW www.mdpi.com/journal/geosciences
questionable results. The coastal units that behave similarly were not applicable due to significant
variations in CVI variables. Therefore, a procedure for the CVI analysis of a series of individual coastal
points was developed in Matlab. AutoCadMap 2018 was used to define the specified areas (e.g., beach
area polygons, geological fabric polygons, etc.), and CloudCompare was used for the visualization of the
results.
Figure 4. Investigated coastline stations: 0–7720 m, used for the Coastal Vulnerability Index (CVI)
analysis. Blue rectangles show areas discussed in more detail.
CVI represents a combined result of the parameters influencing coastal vulnerability in this area. The
selected physical and anthropogenic parameters contributing to the coastal vulnerability around Stara
Baška consider the following variables (Table 1):
a: Geological fabric
b: Coastal slope
c: Emerged beach width
d: Significant wave height
e: Land use
Sea-level rise and tidal range, which are usually considered to be important parameters in other
coastal vulnerability studies, were not considered, since their influence in the analyzed area is
uniform. Additionally, tide influence is negligible due to the steep coast and a micro-tidal regime.
Shoreline erosion/accretion rates were not defined because the coastal changes are lower than the
precision of the available maps [42]. The only significant changes were evidenced on the camping
resort’s coastline, defined through the geological fabric parameter.
Data used in the analysis included available aerial photographs, topographic and orthophoto
maps on a scale of 1:5000, and geological maps of different scales. However, a detailed cognition of
the cost, several site visits, and geomorphological field mapping were crucial in assigning the rating
values for the coastline segments. A rating of the five key parameters is generally based on a semi-
quantitative score, described in five levels, from very low to very high. Finally, the key parameters
are integrated into one single CVI, which represents the general vulnerability of the coastal area. The
CVI has been computed using a modified formulation by Gornitz [4,37] as the square root of the
vulnerability scores assigned to each variable product divided by the total number of variables,
emphasizing the geological fabric’s importance:
CVI = �(�� ∙ � ∙ � ∙ � ∙ �)/6. (1)
Table 1. The physical and anthropogenic parameters considered in the vulnerability analysis around
Stara Baška.
Figure 4. Investigated coastline stations: 0–7720 m, used for the Coastal Vulnerability Index (CVI)analysis. Blue rectangles show areas discussed in more detail.
CVI represents a combined result of the parameters influencing coastal vulnerability in this area.The selected physical and anthropogenic parameters contributing to the coastal vulnerability aroundStara Baška consider the following variables (Table 1):
a: Geological fabricb: Coastal slopec: Emerged beach widthd: Significant wave heighte: Land use
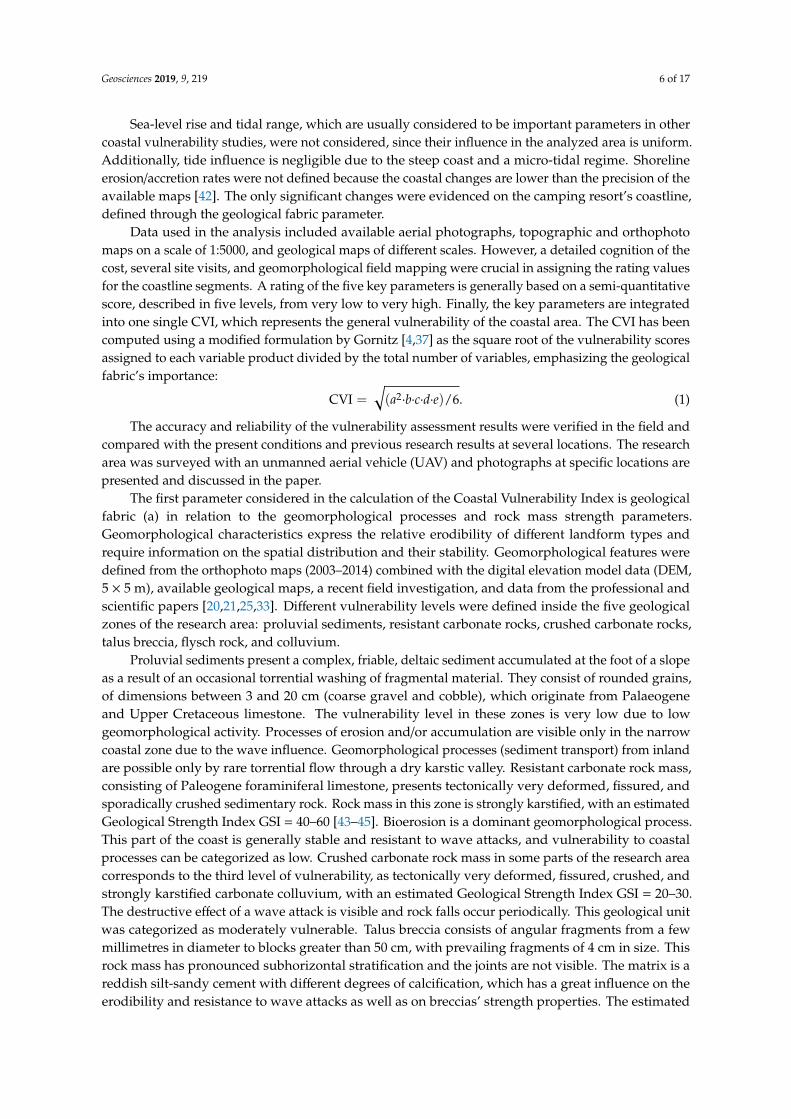
Table 1. The physical and anthropogenic parameters considered in the vulnerability analysis aroundStara Baška.
ParameterVulnerability Grade
Very Low (1) Low (2) Moderate (3) High (4) Very High (5)
Geologic fabric Proluvialsediments
Resistantcarbonate rocks
Crushedcarbonate rocks Talus breccia Flysch rocks
and colluvium
Coastal slope (◦) <5 5–12 12–20 20–32 >32
Beach width (m) >15 10–15 5–10 2.5–5 <2.5 m
Significant waveheight, Hs (m) <0.35 0.35–0.70 0.70–1.05 1.05–1.40 >1.40
Land use Bare karst Mediterraneanvegetation cover Beach Touristic zone Settlement
Geosciences 2019, 9, 219 6 of 17
Sea-level rise and tidal range, which are usually considered to be important parameters in othercoastal vulnerability studies, were not considered, since their influence in the analyzed area is uniform.Additionally, tide influence is negligible due to the steep coast and a micro-tidal regime. Shorelineerosion/accretion rates were not defined because the coastal changes are lower than the precision of theavailable maps [42]. The only significant changes were evidenced on the camping resort’s coastline,defined through the geological fabric parameter.
Data used in the analysis included available aerial photographs, topographic and orthophotomaps on a scale of 1:5000, and geological maps of different scales. However, a detailed cognition of thecost, several site visits, and geomorphological field mapping were crucial in assigning the rating valuesfor the coastline segments. A rating of the five key parameters is generally based on a semi-quantitativescore, described in five levels, from very low to very high. Finally, the key parameters are integratedinto one single CVI, which represents the general vulnerability of the coastal area. The CVI has beencomputed using a modified formulation by Gornitz [4,37] as the square root of the vulnerability scoresassigned to each variable product divided by the total number of variables, emphasizing the geologicalfabric’s importance:
CVI =√(a2·b·c·d·e)/6. (1)
The accuracy and reliability of the vulnerability assessment results were verified in the field andcompared with the present conditions and previous research results at several locations. The researcharea was surveyed with an unmanned aerial vehicle (UAV) and photographs at specific locations arepresented and discussed in the paper.
The first parameter considered in the calculation of the Coastal Vulnerability Index is geologicalfabric (a) in relation to the geomorphological processes and rock mass strength parameters.Geomorphological characteristics express the relative erodibility of different landform types andrequire information on the spatial distribution and their stability. Geomorphological features weredefined from the orthophoto maps (2003–2014) combined with the digital elevation model data (DEM,5 × 5 m), available geological maps, a recent field investigation, and data from the professional andscientific papers [20,21,25,33]. Different vulnerability levels were defined inside the five geologicalzones of the research area: proluvial sediments, resistant carbonate rocks, crushed carbonate rocks,talus breccia, flysch rock, and colluvium.
Proluvial sediments present a complex, friable, deltaic sediment accumulated at the foot of a slopeas a result of an occasional torrential washing of fragmental material. They consist of rounded grains,of dimensions between 3 and 20 cm (coarse gravel and cobble), which originate from Palaeogeneand Upper Cretaceous limestone. The vulnerability level in these zones is very low due to lowgeomorphological activity. Processes of erosion and/or accumulation are visible only in the narrowcoastal zone due to the wave influence. Geomorphological processes (sediment transport) from inlandare possible only by rare torrential flow through a dry karstic valley. Resistant carbonate rock mass,consisting of Paleogene foraminiferal limestone, presents tectonically very deformed, fissured, andsporadically crushed sedimentary rock. Rock mass in this zone is strongly karstified, with an estimatedGeological Strength Index GSI = 40–60 [43–45]. Bioerosion is a dominant geomorphological process.This part of the coast is generally stable and resistant to wave attacks, and vulnerability to coastalprocesses can be categorized as low. Crushed carbonate rock mass in some parts of the research areacorresponds to the third level of vulnerability, as tectonically very deformed, fissured, crushed, andstrongly karstified carbonate colluvium, with an estimated Geological Strength Index GSI = 20–30.The destructive effect of a wave attack is visible and rock falls occur periodically. This geological unitwas categorized as moderately vulnerable. Talus breccia consists of angular fragments from a fewmillimetres in diameter to blocks greater than 50 cm, with prevailing fragments of 4 cm in size. Thisrock mass has pronounced subhorizontal stratification and the joints are not visible. The matrix is areddish silt-sandy cement with different degrees of calcification, which has a great influence on theerodibility and resistance to wave attacks as well as on breccias’ strength properties. The estimated

Geosciences 2019, 9, 219 7 of 17
Geological Strength Index is GSI = 20–30. The destructive effect of a wave attack is obvious, andwave-cut notches provoke frequent rock fall and slump phenomena, so the described locations arehighly vulnerable. Paleogene flysch rock mass consists of marls and siltstone with thin layers ofsandstone. It is tectonically very deformed, fissured, and strongly weathered rock mass in the surfacezone. The bedrock is covered by colluvium formed of coarse-grained fragments and blocks originatingfrom higher-elevation carbonate slopes, mixed with silty clay from the weathered flysch zone. Thethickness of the colluvium is approximately several meters. The estimated Geological Strength Indexof the flysch rock mass is GSI = 25–35. Flysch rock mass has low resistance to wave attacks, and rockfalls are frequent in these areas. Further on, in a few locations, active erosion, rock falls, and dormantlandslides can be found, assigning these zones with the very high vulnerability grade.
The second parameter considered in the analysis is a coastal slope (b), as an indicator of the relativevulnerability to inundation, coastal stability, and the potential coastline retreat. The coastal slope hasbeen determined from the DEM obtained from the orthophoto scale of 1:5000 [42]. It was defined as amaximal slope from the coastline up to 50 m inland, and calculated every 5 meters because of the coastalslope’s variability. The coastal slope varies from a few degrees on beaches to very steep or vertical oncliffs and carbonate rocks. The standard geomorphological classification for slope inclination was usedand adapted according to the author’s previous experience in the Kvarner area. Very low vulnerabilitywas determined on slopes to be <5%, low vulnerability on slopes 5–12%, moderate vulnerability onslopes 12–20%, high vulnerability on slopes 20–32%, and very high vulnerability on slopes >32%,where extreme erosion or rock falls are possible.
Emerged beach width (c) is a parameter related to the ability to dissipate wave energy. Beachareas were defined and marked with polygons (Figure 5). A code in Matlab was developed to calculatethe beach width every 5 m, for each analyzed polygon. It calculates the perpendicular distance fromthe defined coastline to the beach inland boundary at the defined coastline station. A wider beach has agreater ability to dissipate the wave energy and to reduce the impact of the extreme events (e.g., stormsurges); therefore, the vulnerability of beach bodies >15 m wide is very low. Beaches from 10–15 mpresent low vulnerability, 5–10 m moderate vulnerability, 2.5–5 m high vulnerability, and 0–2.5 m veryhigh vulnerability to coastal changes.
Geosciences 2019, 9, x FOR PEER REVIEW 7 of 18
Geosciences 2019, 9, x; doi: FOR PEER REVIEW www.mdpi.com/journal/geosciences
and strongly weathered rock mass in the surface zone. The bedrock is covered by colluvium formed
of coarse-grained fragments and blocks originating from higher-elevation carbonate slopes, mixed
with silty clay from the weathered flysch zone. The thickness of the colluvium is approximately
several meters. The estimated Geological Strength Index of the flysch rock mass is GSI = 25–35. Flysch
rock mass has low resistance to wave attacks, and rock falls are frequent in these areas. Further on,
in a few locations, active erosion, rock falls, and dormant landslides can be found, assigning these
zones with the very high vulnerability grade.
The second parameter considered in the analysis is a coastal slope (b), as an indicator of the
relative vulnerability to inundation, coastal stability, and the potential coastline retreat. The coastal
slope has been determined from the DEM obtained from the orthophoto scale of 1:5000 [42]. It was
defined as a maximal slope from the coastline up to 50 m inland, and calculated every 5 meters
because of the coastal slope’s variability. The coastal slope varies from a few degrees on beaches to
very steep or vertical on cliffs and carbonate rocks. The standard geomorphological classification for
slope inclination was used and adapted according to the author’s previous experience in the Kvarner
area. Very low vulnerability was determined on slopes to be <5%, low vulnerability on slopes 5–12%,
moderate vulnerability on slopes 12–20%, high vulnerability on slopes 20–32%, and very high
vulnerability on slopes >32%, where extreme erosion or rock falls are possible.
Emerged beach width (c) is a parameter related to the ability to dissipate wave energy. Beach
areas were defined and marked with polygons (Figure 5). A code in Matlab was developed to
calculate the beach width eve
Figure 5. Analysis of the beach width parameter: (a) Defined beach polygons with corresponding
beach width; (b) The calculated cross-shore beach width every 5 m.
Significant wave height HS (d) has been simulated with the SWAN numeric model, which is the
third generation model for application in coastal areas, based on Euler's equilibrium equation of a
spectral waveform [46]. A JONSWAP wave spectrum with the parameter γ = 3.3 was used. A
numerical simulation of waves was carried out in the wider area of Kvarnerić Bay, for waves from
the NW (“tramuntana”) and SE (“jugo”) directions, for the 50-year return period. Relevant wind
strengths for the numerical simulation (SE: 27.4 m/s, NW: 22.2 m/s) were taken from the wind climate
study of the nearby Vinodol channel [47]. Figure 6 shows a significant wave height for a 50-year
return period HS50 from the SE and NW directions. Numerical simulations were carried out on two
different scales, on a larger scale for a deep-water wave prediction (45 × 50 km, numerical cell 50 × 50
m) and for a local nearshore wave prediction (520 × 335 m, 10 × 10 m) on a smaller scale. This study
Figure 5. Analysis of the beach width parameter: (a) Defined beach polygons with correspondingbeach width; (b) The calculated cross-shore beach width every 5 m.
Significant wave height HS (d) has been simulated with the SWAN numeric model, which isthe third generation model for application in coastal areas, based on Euler’s equilibrium equationof a spectral waveform [46]. A JONSWAP wave spectrum with the parameter γ = 3.3 was used. Anumerical simulation of waves was carried out in the wider area of Kvarneric Bay, for waves from theNW (“tramuntana”) and SE (“jugo”) directions, for the 50-year return period. Relevant wind strengths

Geosciences 2019, 9, 219 8 of 17
for the numerical simulation (SE: 27.4 m/s, NW: 22.2 m/s) were taken from the wind climate study ofthe nearby Vinodol channel [47]. Figure 6 shows a significant wave height for a 50-year return periodHS
50 from the SE and NW directions. Numerical simulations were carried out on two different scales,on a larger scale for a deep-water wave prediction (45 × 50 km, numerical cell 50 × 50 m) and for a localnearshore wave prediction (520 × 335 m, 10 × 10 m) on a smaller scale. This study used significantwave height because the major impact on the investigated coastline has high-impact, low-probabilityevents [48], and the measured wave data were unavailable.
Geosciences 2019, 9, x FOR PEER REVIEW 8 of 18
Geosciences 2019, 9, x; doi: FOR PEER REVIEW www.mdpi.com/journal/geosciences
used significant wave height because the major impact on the investigated coastline has high-impact,
low-probability events [48], and the measured wave data were unavailable.
Figure 6. SWAN numerical simulations of the significant wave height (HS): (a) Southeast (SE) and (b)
Northwest (NW) wind directions, 50-year return period.
The relevant HS for the estimation of the CVI is defined from the numerical wave simulations at
a distance of 15 m from the defined coastline (Figure 7). At the same point, the largest of the two wave
heights from different directions (SE and NW) was taken into the further CVI assessment (Figure 7b).
Based on these calculations, the significant wave height’s influence on the coastal vulnerability was
divided into five levels of vulnerability: very low (0–0.35 m), low (0.35–0.70 m), moderate (0.7–1.05
m), high (1.05–1.40 m), and very high (above 1.40 m).
Figure 7. (a) The SE Significant wave height (HS); (b) 15 m from the coastline and its values associated
with the defined coastline station.
Human intervention affects the coastal vulnerability, unfortunately mostly in a negative sense.
Urbanization often includes poor construction, poor storm water drainage and wastewater disposal,
traffic load, the load of different facilities, unplanned terrain and vegetation cutting, an increase of
surface runoff along artificial materials, etc. This all increases the coastal vulnerability and makes this
anthropological parameter the most difficult to assess. The land use parameter (e) was considered
inside five levels of vulnerability to present anthropological factors influencing the coastal
vulnerability. The classes were divided into: urban areas, touristic zones (i.e., a camping resort),
beaches, areas covered by the Mediterranean vegetation type, and bare karst. Considering that the
degree of vulnerability increases with the presence of an unfavourable human influence, the highest
rate of vulnerability is in urban areas, decreasing to the bare karst areas. Bare karst areas are
Figure 6. SWAN numerical simulations of the significant wave height (HS): (a) Southeast (SE) and (b)Northwest (NW) wind directions, 50-year return period.
The relevant HS for the estimation of the CVI is defined from the numerical wave simulations at adistance of 15 m from the defined coastline (Figure 7). At the same point, the largest of the two waveheights from different directions (SE and NW) was taken into the further CVI assessment (Figure 7b).Based on these calculations, the significant wave height’s influence on the coastal vulnerability wasdivided into five levels of vulnerability: very low (0–0.35 m), low (0.35–0.70 m), moderate (0.7–1.05 m),high (1.05–1.40 m), and very high (above 1.40 m).
Geosciences 2019, 9, x FOR PEER REVIEW 8 of 18
Geosciences 2019, 9, x; doi: FOR PEER REVIEW www.mdpi.com/journal/geosciences
used significant wave height because the major impact on the investigated coastline has high-impact,
low-probability events [48], and the measured wave data were unavailable.
Figure 6. SWAN numerical simulations of the significant wave height (HS): (a) Southeast (SE) and (b)
Northwest (NW) wind directions, 50-year return period.
The relevant HS for the estimation of the CVI is defined from the numerical wave simulations at
a distance of 15 m from the defined coastline (Figure 7). At the same point, the largest of the two wave
heights from different directions (SE and NW) was taken into the further CVI assessment (Figure 7b).
Based on these calculations, the significant wave height’s influence on the coastal vulnerability was
divided into five levels of vulnerability: very low (0–0.35 m), low (0.35–0.70 m), moderate (0.7–1.05
m), high (1.05–1.40 m), and very high (above 1.40 m).
Figure 7. (a) The SE Significant wave height (HS); (b) 15 m from the coastline and its values associated
with the defined coastline station.
Human intervention affects the coastal vulnerability, unfortunately mostly in a negative sense.
Urbanization often includes poor construction, poor storm water drainage and wastewater disposal,
traffic load, the load of different facilities, unplanned terrain and vegetation cutting, an increase of
surface runoff along artificial materials, etc. This all increases the coastal vulnerability and makes this
anthropological parameter the most difficult to assess. The land use parameter (e) was considered
inside five levels of vulnerability to present anthropological factors influencing the coastal
vulnerability. The classes were divided into: urban areas, touristic zones (i.e., a camping resort),
beaches, areas covered by the Mediterranean vegetation type, and bare karst. Considering that the
degree of vulnerability increases with the presence of an unfavourable human influence, the highest
rate of vulnerability is in urban areas, decreasing to the bare karst areas. Bare karst areas are
Figure 7. (a) The SE Significant wave height (HS); (b) 15 m from the coastline and its values associatedwith the defined coastline station.
Human intervention affects the coastal vulnerability, unfortunately mostly in a negative sense.Urbanization often includes poor construction, poor storm water drainage and wastewater disposal,traffic load, the load of different facilities, unplanned terrain and vegetation cutting, an increase ofsurface runoff along artificial materials, etc. This all increases the coastal vulnerability and makes this
Geosciences 2019, 9, 219 9 of 17
anthropological parameter the most difficult to assess. The land use parameter (e) was considered insidefive levels of vulnerability to present anthropological factors influencing the coastal vulnerability. Theclasses were divided into: urban areas, touristic zones (i.e., a camping resort), beaches, areas coveredby the Mediterranean vegetation type, and bare karst. Considering that the degree of vulnerabilityincreases with the presence of an unfavourable human influence, the highest rate of vulnerability is inurban areas, decreasing to the bare karst areas. Bare karst areas are accompanied by islets and cliffsas measures of natural vulnerability adaptation, which decreases the influence of wave attacks onthe coastline.
4. Results and Discussion
The degree of coastal erosion and, therefore, coastal retreat depends on different parametersrelated to the complex geological condition, coastal zone dynamics, anthropogenic influences, andextreme events, such as storms and storm surges. A separate analysis of each parameter on a pointraster every 5 m enables an understanding of their importance for the narrow coastal zone as well astheir joint influence on the overall coastal vulnerability.
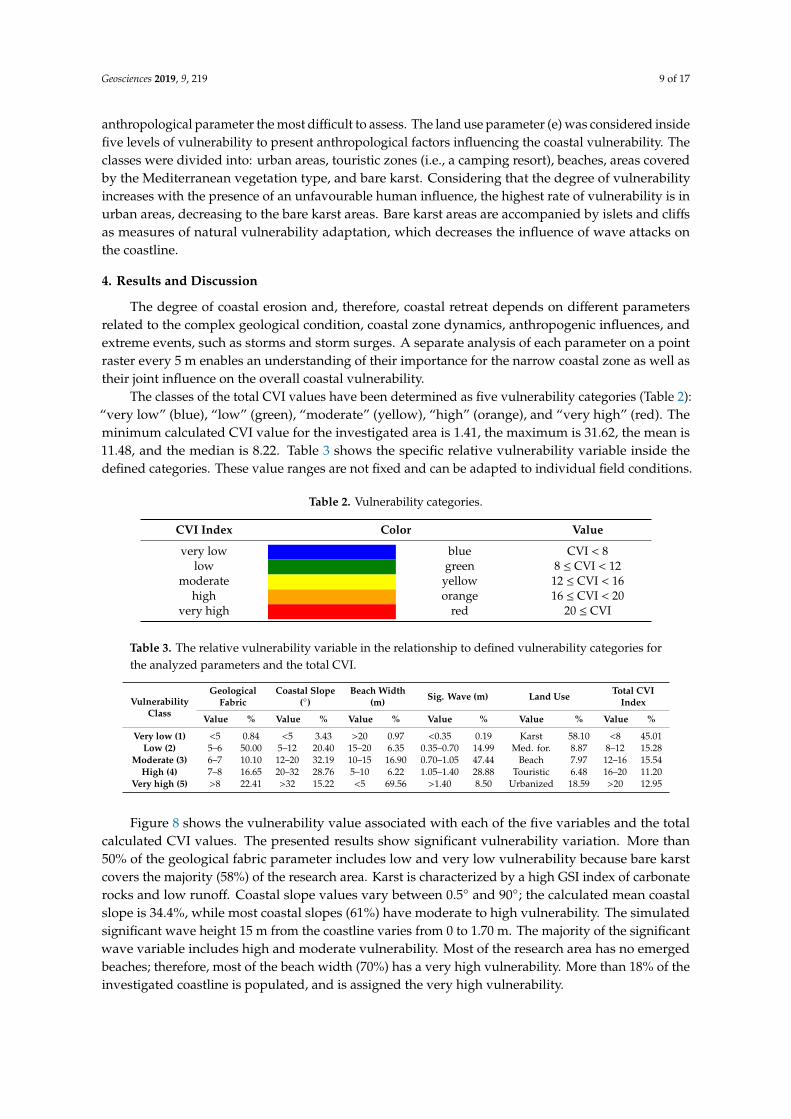
The classes of the total CVI values have been determined as five vulnerability categories (Table 2):“very low” (blue), “low” (green), “moderate” (yellow), “high” (orange), and “very high” (red). Theminimum calculated CVI value for the investigated area is 1.41, the maximum is 31.62, the mean is11.48, and the median is 8.22. Table 3 shows the specific relative vulnerability variable inside thedefined categories. These value ranges are not fixed and can be adapted to individual field conditions.
Table 2. Vulnerability categories.
CVI Index Color Value
very low blue CVI < 8low green 8 ≤ CVI < 12
moderate yellow 12 ≤ CVI < 16high orange 16 ≤ CVI < 20
very high red 20 ≤ CVI
Table 3. The relative vulnerability variable in the relationship to defined vulnerability categories forthe analyzed parameters and the total CVI.
VulnerabilityClass
GeologicalFabric
Coastal Slope(◦)
Beach Width(m) Sig. Wave (m) Land Use Total CVI
Index
Value % Value % Value % Value % Value % Value %
Very low (1) <5 0.84 <5 3.43 >20 0.97 <0.35 0.19 Karst 58.10 <8 45.01Low (2) 5–6 50.00 5–12 20.40 15–20 6.35 0.35–0.70 14.99 Med. for. 8.87 8–12 15.28
Moderate (3) 6–7 10.10 12–20 32.19 10–15 16.90 0.70–1.05 47.44 Beach 7.97 12–16 15.54High (4) 7–8 16.65 20–32 28.76 5–10 6.22 1.05–1.40 28.88 Touristic 6.48 16–20 11.20
Very high (5) >8 22.41 >32 15.22 <5 69.56 >1.40 8.50 Urbanized 18.59 >20 12.95
Figure 8 shows the vulnerability value associated with each of the five variables and the totalcalculated CVI values. The presented results show significant vulnerability variation. More than50% of the geological fabric parameter includes low and very low vulnerability because bare karstcovers the majority (58%) of the research area. Karst is characterized by a high GSI index of carbonaterocks and low runoff. Coastal slope values vary between 0.5◦ and 90◦; the calculated mean coastalslope is 34.4%, while most coastal slopes (61%) have moderate to high vulnerability. The simulatedsignificant wave height 15 m from the coastline varies from 0 to 1.70 m. The majority of the significantwave variable includes high and moderate vulnerability. Most of the research area has no emergedbeaches; therefore, most of the beach width (70%) has a very high vulnerability. More than 18% of theinvestigated coastline is populated, and is assigned the very high vulnerability.

Geosciences 2019, 9, 219 10 of 17
Geosciences 2019, 9, x; doi: FOR PEER REVIEW www.mdpi.com/journal/geosciences
Figure 8. Relative coastal vulnerability value associated with the considered parameters: (a) Geological fabric; (b) Coastal slope; (c) Emerged beach width; (d) Significant
wave height; (e) Land use; and (f) total CVI index (f).
Figure 8. Relative coastal vulnerability value associated with the considered parameters: (a) Geological fabric; (b) Coastal slope; (c) Emerged beach width; (d)Significant wave height; (e) Land use; and (f) total CVI index (f).
Geosciences 2019, 9, 219 11 of 17
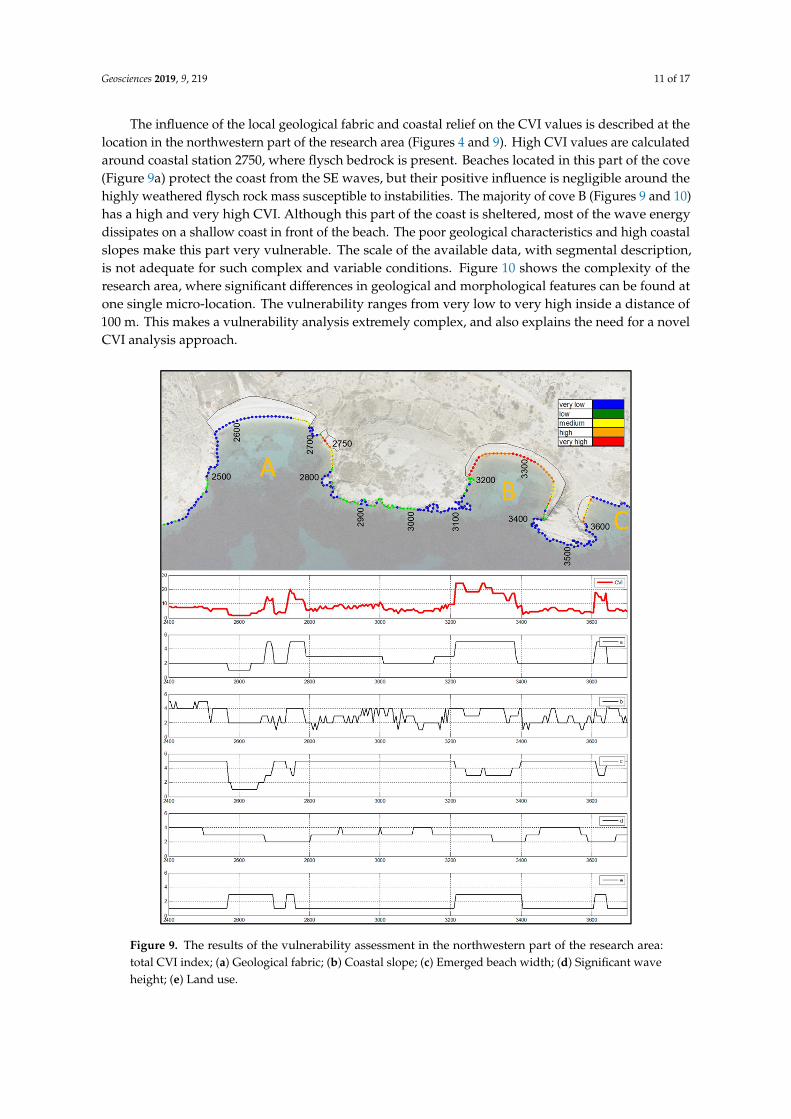
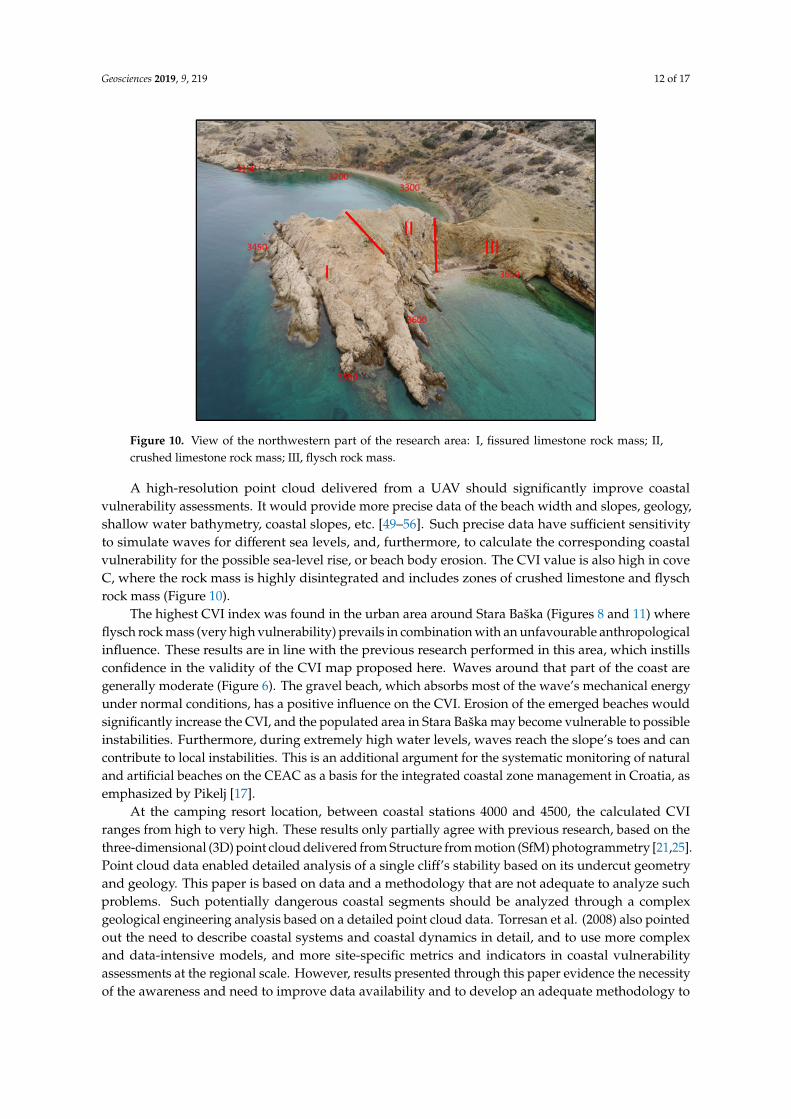
The influence of the local geological fabric and coastal relief on the CVI values is described at thelocation in the northwestern part of the research area (Figures 4 and 9). High CVI values are calculatedaround coastal station 2750, where flysch bedrock is present. Beaches located in this part of the cove(Figure 9a) protect the coast from the SE waves, but their positive influence is negligible around thehighly weathered flysch rock mass susceptible to instabilities. The majority of cove B (Figures 9 and 10)has a high and very high CVI. Although this part of the coast is sheltered, most of the wave energydissipates on a shallow coast in front of the beach. The poor geological characteristics and high coastalslopes make this part very vulnerable. The scale of the available data, with segmental description,is not adequate for such complex and variable conditions. Figure 10 shows the complexity of theresearch area, where significant differences in geological and morphological features can be found atone single micro-location. The vulnerability ranges from very low to very high inside a distance of100 m. This makes a vulnerability analysis extremely complex, and also explains the need for a novelCVI analysis approach.
Geosciences 2019, 9, x; doi: FOR PEER REVIEW www.mdpi.com/journal/geosciences
Figure 9. The results of the vulnerability assessment in the northwestern part of the research area:
total CVI index; (a) Geological fabric; (b) Coastal slope; (c) Emerged beach width; (d) Significant wave
height; (e) Land use.
Figure 9. The results of the vulnerability assessment in the northwestern part of the research area:total CVI index; (a) Geological fabric; (b) Coastal slope; (c) Emerged beach width; (d) Significant waveheight; (e) Land use.
Geosciences 2019, 9, 219 12 of 17
Geosciences 2019, 9, x FOR PEER REVIEW 13 of 18
Geosciences 2019, 9, x; doi: FOR PEER REVIEW www.mdpi.com/journal/geosciences
Figure 10. View of the northwestern part of the research area: I, fissured limestone rock mass; II,
crushed limestone rock mass; III, flysch rock mass.
The highest CVI index was found in the urban area around Stara Baška (Figures 8 and 11) where
flysch rock mass (very high vulnerability) prevails in combination with an unfavourable
anthropological influence. These results are in line with the previous research performed in this area,
which instills confidence in the validity of the CVI map proposed here. Waves around that part of
the coast are generally moderate (Figure 6). The gravel beach, which absorbs most of the wave’s
mechanical energy under normal conditions, has a positive influence on the CVI. Erosion of the
emerged beaches would significantly increase the CVI, and the populated area in Stara Baška may
become vulnerable to possible instabilities. Furthermore, during extremely high water levels, waves
reach the slope’s toes and can contribute to local instabilities. This is an additional argument for the
systematic monitoring of natural and artificial beaches on the CEAC as a basis for the integrated
coastal zone management in Croatia, as emphasized by Pikelj [17].
At the camping resort location, between coastal stations 4000 and 4500, the calculated CVI ranges
from high to very high. These results only partially agree with previous research, based on the three-
dimensional (3D) point cloud delivered from Structure from motion (SfM) photogrammetry [21,25].
Point cloud data enabled detailed analysis of a single cliff’s stability based on its undercut geometry
and geology. This paper is based on data and a methodology that are not adequate to analyze such
problems. Such potentially dangerous coastal segments should be analyzed through a complex
geological engineering analysis based on a detailed point cloud data. Torresan et al. (2008) also
pointed out the need to describe coastal systems and coastal dynamics in detail, and to use more
complex and data-intensive models, and more site-specific metrics and indicators in coastal
vulnerability assessments at the regional scale. However, results presented through this paper
evidence the necessity of the awareness and need to improve data availability and to develop an
adequate methodology to monitor relevant parameters, in order to define adequate risk management
strategies and to consider their advancement with time.
Figure 10. View of the northwestern part of the research area: I, fissured limestone rock mass; II,crushed limestone rock mass; III, flysch rock mass.
A high-resolution point cloud delivered from a UAV should significantly improve coastalvulnerability assessments. It would provide more precise data of the beach width and slopes, geology,shallow water bathymetry, coastal slopes, etc. [49–56]. Such precise data have sufficient sensitivityto simulate waves for different sea levels, and, furthermore, to calculate the corresponding coastalvulnerability for the possible sea-level rise, or beach body erosion. The CVI value is also high in coveC, where the rock mass is highly disintegrated and includes zones of crushed limestone and flyschrock mass (Figure 10).
The highest CVI index was found in the urban area around Stara Baška (Figures 8 and 11) whereflysch rock mass (very high vulnerability) prevails in combination with an unfavourable anthropologicalinfluence. These results are in line with the previous research performed in this area, which instillsconfidence in the validity of the CVI map proposed here. Waves around that part of the coast aregenerally moderate (Figure 6). The gravel beach, which absorbs most of the wave’s mechanical energyunder normal conditions, has a positive influence on the CVI. Erosion of the emerged beaches wouldsignificantly increase the CVI, and the populated area in Stara Baška may become vulnerable to possibleinstabilities. Furthermore, during extremely high water levels, waves reach the slope’s toes and cancontribute to local instabilities. This is an additional argument for the systematic monitoring of naturaland artificial beaches on the CEAC as a basis for the integrated coastal zone management in Croatia, asemphasized by Pikelj [17].
At the camping resort location, between coastal stations 4000 and 4500, the calculated CVIranges from high to very high. These results only partially agree with previous research, based on thethree-dimensional (3D) point cloud delivered from Structure from motion (SfM) photogrammetry [21,25].Point cloud data enabled detailed analysis of a single cliff’s stability based on its undercut geometryand geology. This paper is based on data and a methodology that are not adequate to analyze suchproblems. Such potentially dangerous coastal segments should be analyzed through a complexgeological engineering analysis based on a detailed point cloud data. Torresan et al. (2008) also pointedout the need to describe coastal systems and coastal dynamics in detail, and to use more complexand data-intensive models, and more site-specific metrics and indicators in coastal vulnerabilityassessments at the regional scale. However, results presented through this paper evidence the necessityof the awareness and need to improve data availability and to develop an adequate methodology to

Geosciences 2019, 9, 219 13 of 17
monitor relevant parameters, in order to define adequate risk management strategies and to considertheir advancement with time.Geosciences 2019, 9, x FOR PEER REVIEW 14 of 18
Geosciences 2019, 9, x; doi: FOR PEER REVIEW www.mdpi.com/journal/geosciences
Figure 11. The results of the vulnerability assessment around the urbanized area of Stara Baška: total
CVI index; (a) Geological fabric; (b) Coastal slope; (c) Emerged beach width; (d) Significant wave
height; (e) Land use.
5. Conclusions
This paper proposed a methodology for CVI formulation at the CEAC, which is characterized
by a complex geomorphology. Due to data availability, it considers only five variables. The presented
methodology detected the most vulnerable coastal segments, which is essential to implementation of
appropriate spatial and temporal monitoring. Furthermore, novel elements for the parametric
Figure 11. The results of the vulnerability assessment around the urbanized area of Stara Baška: totalCVI index; (a) Geological fabric; (b) Coastal slope; (c) Emerged beach width; (d) Significant waveheight; (e) Land use.
Geosciences 2019, 9, 219 14 of 17
5. Conclusions
This paper proposed a methodology for CVI formulation at the CEAC, which is characterized bya complex geomorphology. Due to data availability, it considers only five variables. The presentedmethodology detected the most vulnerable coastal segments, which is essential to implementation ofappropriate spatial and temporal monitoring. Furthermore, novel elements for the parametric analysis(shoreline slopes, emerged beach width, and significant wave height) were presented for the coastalenvironment of CEAC, with possible applications to similar complex rocky slopes all over the world.
Complex geological features, coastal morphology, and active marine erosion in some parts of theinvestigated area called for adaptation of the existing approaches. The presented CVI calculation givespriority to the geological fabric as the most important driver of negative coastal changes. The proposedformulation takes the square of the geological fabric, enabling us to split it into two vulnerabilityfactors (e.g., cliff and slope stability conditioned on the mechanical parameters of the rock and shorelineerosion/accretion rates) in a more detailed analysis. However, the presented results point out theimportance of the joint effect of all considered parameters in an analysis of their single importance onthe coastal vulnerability. This research also emphasizes the lack of wave measurements and precisegeological and coastal data.
In the investigated area, higher coastal slopes were found to be more vulnerable than the lowerones, which was evidenced in previous studies of the investigated location. The vulnerability ofcoastal areas lower than 1.5 m is negligible. These are mostly gravel beaches that have good hydraulicresistance to wave action. Because of that fact, the predicted sea level rise will not have a significantimpact on coastal flooding. A sea-level rise and an increase in the rainfall intensity might destabilizecoastal slopes and make the coastal area more vulnerable, especially the steep and weathered flyschrock mass and unstable breccias.
The presented CVI map’s reliability was tested by comparing the results to previous fieldinvestigations. In the majority of the investigated area, the results are in line with observed fieldconditions, as shown in the presented areal images of the selected locations. The CVI map’s uncertaintywas detected on a coastal segment with notched cliffs. Additional investigations based on a 3D pointcloud are needed in such locations.
The presented methodology for CVI assessment was adapted to the specific natural conditions ofthe research area on the southeastern coast of Krk Island and presents a valuable contribution to thedevelopment of a strategy for coastal zone management, which will be especially important due toexpected climate changes. The results suggest that there is a need to establish coastal monitoring of theurbanized zone of the Stara Baška settlement where landslides may occur as a result of a progressivecoastal erosion.
Author Contributions: Conceptualization, I.R., S.D.J., and C.B.; Formal analysis, I.R., S.D.J., C.B., and N.K.;Investigation, C.B.; Methodology, I.R. and S.D.J.; Software, I.R. and N.K.; Validation, I.R. and C.B.; Visualization,I.R., S.D.J., and N.K.; Writing—original draft, I.R., S.D.J., C.B., and N.K.; Writing—review & editing, I.R., S.D.J.,C.B., and N.K.
Funding: This research was funded by the University of Rijeka, grant uniri-tehnic-18-97 1232., as well as grantnumber 18.06.2.1.01. “Analysis of the rock mass and instability occurrence on the karst-flysch contact” andgrant number 17.06.2.1.02 “Sea and river interaction in the context of climate change”. This work has also beensupported in part by the Ministry of Science, Education and Sports of the Republic of Croatia under the projectResearch Infrastructure for Campus-based Laboratories at the University of Rijeka, number RC.2.2.06-0001. Theproject has been co-funded by the European Fund for Regional Development (ERDF).
Acknowledgments: The authors would like to thank the Department of Geophysics, Faculty of Science, Universityof Zagreb, for providing the Bakar tide gauge data, and also the University of Rijeka for funding this research.
Conflicts of Interest: The authors declare no conflict of interest. The funders had no role in the design of thestudy; in the collection, analyses, or interpretation of data; in the writing of the manuscript, or in the decision topublish the results.

Geosciences 2019, 9, 219 15 of 17
References
1. Ramieri, E.; Hartley, A.; Barbanti, A.; Santos, F.D.; Gomes, A.; Hilden, M.; Laihonen, P.; Marinova, N.;Santini, M. Methods for Assessing Coastal Vulnerability to Climate Change; ETC CCA Technical Paper 1/2011;European Environment Agency (EEA): Copenhagen, Denmark, 2011.
2. De Pippo, T.; Donadio, C.; Pennetta, M.; Petrosino, C.; Terlizzi, F.; Valente, A. Coastal hazard assessment andmapping in Northern Campania, Italy. Geomorphology 2008, 97, 451–466. [CrossRef]
3. Richards, J.A.; Nicholls, R.J. Impacts of Climate Change in Coastal Systems in Europe. PESETA-Coastal SystemsStudy; Publications Office of the European Union: Luxembourg, 2009.
4. Gornitz, V. Vulnerability of the East Coast, U.S.A. to future sea level rise. J. Coast. Res. 1990, 201–237.Available online: https://www.jstor.org/stable/44868636 (accessed on 14 May 2019).
5. Cooper, J.A.G.; McLaughlin, S. Contemporary Multidisciplinary Approaches to Coastal Classification andEnvironmental Risk Analysis. J. Coast. Res. 1998, 14, 512–524.
6. Özyurt*, G.; Ergin, A. Improving Coastal Vulnerability Assessments to Sea-Level Rise: A New Indicator-BasedMethodology for Decision Makers. J. Coast. Res. 2010, 26, 265–273. [CrossRef]
7. Benassai, G.; Di Paola, G.; Aucelli, P.P.C. Coastal risk assessment of a micro-tidal littoral plain in response tosea level rise. Ocean Coast. Manag. 2015, 104, 22–35. [CrossRef]
8. Di Paola, G.; Aucelli, P.P.C.; Benassai, G.; Rodríguez, G. Coastal vulnerability to wave storms of Sele littoralplain (southern Italy). Nat. Hazards 2014, 71, 1795–1819. [CrossRef]
9. Mani Murali, R.; Ankita, M.; Amrita, S.; Vethamony, P. Coastal vulnerability assessment of Puducherry coast,India, using the analytical hierarchical process. Nat. Hazards Earth Syst. Sci. 2013, 13, 3291–3311. [CrossRef]
10. Le Cozannet, G.; Garcin, M.; Bulteau, T.; Mirgon, C.; Yates, M.L.; Méndez, M.; Baills, A.; Idier, D.; Oliveros, C.An AHP-derived method for mapping the physical vulnerability of coastal areas at regional scales. Nat.Hazards Earth Syst. Sci. 2013, 13, 1209–1227. [CrossRef]
11. Shanganlall, A.; Ferentinou, M.; Karymbalis, E.; Smith, A. IAEG/AEG Annual Meeting Proceedings, SanFrancisco, California, 2018—Volume 6. In Proceedings of the IAEG/AEG Annual Meeting Proceedings, SanFrancisco, CA, USA, 17–21 September 2018.
12. Torresan, S.; Critto, A.; Rizzi, J.; Marcomini, A. Assessment of coastal vulnerability to climate change hazardsat the regional scale: The case study of the North Adriatic Sea. Nat. Hazards Earth Syst. Sci. 2012, 17,2347–2368. [CrossRef]
13. Mcleod, E.; Poulter, B.; Hinkel, J.; Reyes, E.; Salm, R. Sea-level rise impact models and environmentalconservation: A review of models and their applications. Ocean Coast. Manag. 2010, 53, 507–517. [CrossRef]
14. Pantusa, D.; D’Alessandro, F.; Riefolo, L.; Principato, F.; Tomasicchio, G.R. Application of a coastalvulnerability index. A case study along the Apulian Coastline, Italy. Water 2018, 10, 1218. [CrossRef]
15. De Serio, F.; Armenio, E.; Mossa, M.; Petrillo, A.F. How to Define Priorities in Coastal VulnerabilityAssessment. Geosciences 2018, 8, 415. [CrossRef]
16. Bagdanaviciute, I.; Kelpšaite, L.; Soomere, T. Multi-criteria evaluation approach to coastal vulnerability indexdevelopment in micro-tidal low-lying areas. Ocean Coast. Manag. 2015, 104, 124–135. [CrossRef]
17. Pikelj, K.; Ružic, I.; Ilic, S.; James, M.R.M.R.; Kordic, B. Implementing an efficient beach erosion monitoringsystem for coastal management in Croatia. Ocean Coast. Manag. 2018, 156, 223–238. [CrossRef]
18. Benac, C.; Ružic, I.; Žic, E. Ranjivost obala u podrucju Kvarnera. Pomor. Zb. 2007, 44, 201–214.19. Juracic, M.; Benac, C.; Pikelj, K.; Ilic, S. Comparison of the vulnerability of limestone (karst) and siliciclastic
coasts (example from the Kvarner area, NE Adriatic, Croatia). Geomorphology 2009, 107, 90–99. [CrossRef]20. Benac, C.; Jovancevic Dugonjic, S.; Ružic, I.; Vivoda, M.; Peranic, J. Marine erosion and slope movements: SE
coast of the Krk island. In Landslide Science for a Safer Geoenvironment; Springer: Cham, Switzerland, 2014;Volume 3, pp. 563–567.
21. Ružic, I.; Marovic, I.; Benac, C.; Ilic, S. Coastal cliff geometry derived from structure-from-motionphotogrammetry at Stara Baška, Krk Island, Croatia. Geo-Marine Lett. 2014, 34, 555–565. [CrossRef]
22. Ružic, I.; Benac, C. Vulnerability of the rab island coastline due to sea level rise. Hrvat. Vode 2016, 24, 203–214.23. Ružic, I.; Benac, C.; Ilic, S.; Krvavica, N.; Rubinic, J. Geomorphological changes in a miniature beach in the
karst. Hrvat. Vode 2018, 26, 27–34.24. Benac, C. Recentni geomorfološki procesi i oblici u podrucju Rijeckog zaljeva. Croat. Geogr. Bull. 1992, 54,
1–18.
Geosciences 2019, 9, 219 16 of 17
25. Ružic, I.; Benac, C.; Marovic, I.; Ilic, S. A stability assessment of coastal cliffs using digital imagery. ActaGeotech. Slov. 2015, 12, 25–35.
26. Archetti, R.; Romagnoli, C. Analysis of the effects of different storm events on shoreline dynamics of anartificially embayed beach. Earth Surf. Process. Landf. 2011, 36, 1449–1463. [CrossRef]
27. Gaki-Papanastassiou, K.; Karymbalis, E.; Poulos, S.E.; Seni, A.; Zouva, C. Coastal vulnerability assessmentto sea-level rise bαsed on geomorphological and oceanographical parameters: The case of Argolikos Gulf,Peloponnese, Greece. Hell. J. Geosci. 2010, 45, 109–122.
28. Vousdoukas, M.I.; Wziatek, D.; Almeida, L.P. Coastal vulnerability assessment based on video wave run-upobservations at a mesotidal, steep-sloped beach. Ocean Dyn. 2012, 62, 123–137. [CrossRef]
29. Karymbalis, E.; Chalkias, C.; Chalkias, G.; Grigoropoulou, E.; Manthos, G.; Ferentinou, M. Assessment of thesensitivity of the southern coast of the Gulf of Corinth (Peloponnese, Greece) to sea-level rise. Cent. Eur. J.Geosci. 2012, 4, 561–577. [CrossRef]
30. Pikelj, K.; Juracic, M. Eastern Adriatic Coast (EAC): Geomorphology and Coastal Vulnerability of a KarsticCoast. J. Coast. Res. 2013, 29, 944–957. [CrossRef]
31. Benac, C.; Juracic, M. Geomorphological indicators of the sea level changes during Upper Pleistocene (Würm)and Holocene in the Kvarner region. Acta Geogr. Croat. 1998, 33, 27–45.
32. Loncar, G.; Carevic, D.; Paladin, M. Analysis of wave deformations before Zagrebacka obala – Port of Rijeka.Hrvat. Vode 2014, 22, 327–336.
33. Benac, C.; Juracic, M.; Maticec, D.; Ružic, I.; Pikelj, K.; Benac, T.; Juracic, M.; Maticec, D.; Ružic, I.; Pikelj, K.Fluviokarst and classical karst: Examples from the Dinarics (Krk Island, Northern Adriatic, Croatia).Geomorphology 2013, 184, 64–173. [CrossRef]
34. Jutarnji list Odron kamenja ubio Mađara na divljoj plaži (In Croatian). Available online: https://www.jutarnji.hr/vijesti/crna-kronika/odron-kamenja-ubio-madara-na-divljoj-plazi/2824958/ (accessed on 26 March 2019).
35. Antonio Pirazzoli, P. A review of possible eustatic, isostatic and tectonic contributions in eight late-Holocenerelative sea-level histories from the Mediterranean area. Quat. Sci. Rev. 2005, 24, 1989–2001. [CrossRef]
36. Suric, M.; Juracic, M. Late Pleistocene – Holocene environmental changes – records from submergedspeleothems along the Eastern Adriatic coast (Croatia). Geol. Croat. 2010, 63, 155–169. [CrossRef]
37. Gornitz, V. Global coastal hazards from future sea level rise. Palaeogeogr. Palaeoclimatol. Palaeoecol. 1991, 3,379–398. [CrossRef]
38. Thieler, E.R.; Hammar-Klose, E.S. National Assessment of Coastal Vulnerability to Sea-Level Rise: PreliminaryResults for the U.S. Atlantic Coast; U.S. Geological Survey: Woods Hole, MA, USA, 1999; pp. 99–593.
39. Arkema, K.; Guannel, G.; Verutes, G.; Wood, S.; Guerry, A.; Ruckelshaus, M.; Kareiva, P.; Lacayo-Emery, M.;M Silver, J. Coastal habitats shield people and property from sea-level rise and storms. Nat. Clim. Chang.2013, 3, 913–918. [CrossRef]
40. Hegde, A.; Radhakrishnan Reju, V. Development of Coastal Vulnerability Index for Mangalore Coast, India.J. Coast. Res. 2007, 23, 1106–1111. [CrossRef]
41. Kakani, N.R.; Subraelu, P.; Venkateswara Rao, T.; Malini, B.; Ramakrishnan, R.; Bhattacharya, S.S.; Rajawat, A.;Prof, A. Sea-level rise and coastal vulnerability: An assessment of Andhra Pradesh coast, India throughremote sensing and GIS. J. Coast. Conserv. 2008, 12, 195–207.
42. State Geodetic Directorate Geoportal. Available online: https://geoportal.dgu.hr/ (accessed on12 February 2019).
43. Marinos, V.; Marinos, P.; Hoek, E. The Geological Strength Index: Applications and limitations. Bull. Eng.Geol. Environ. 2005, 64, 55–65. [CrossRef]
44. Marinos, P.; Hoek, E. Estimating the geotechnical properties of heterogenous rock masses such as flysch.Bull. Eng. Geol. Environ. 2001, 60, 85–92. [CrossRef]
45. Hoek, E.; Brown, E. Empirical strength criterion for rock masses. J. Geotech. Eng. Div. ASCE 1980, 106,1013–1035.
46. Booij, N.; Ris, R.C.; Holthuijsen, L.H. A third-generation wave model for coastal regions 1. Model descriptionand validation. J. Geophys. Res. Ocean. 1999, 104, 7649–7666. [CrossRef]
47. Croatian Meteorological and Hydrological Service. Wind Climate for the Area at Dubracina Mouth in Crikvenica;Croatian Meteorological and Hydrological Service: Zagreb, Croatia, 2006.
48. Sánchez-Arcilla, A.; Mösso, C.; Sierra, J.P.; Mestres, M.; Harzallah, A.; Senouci, M.; Raey, M. El Climaticdrivers of potential hazards in Mediterranean coasts. Reg. Environ. Chang. 2011, 11, 617–636. [CrossRef]

Geosciences 2019, 9, 219 17 of 17
49. Brunier, G.; Fleury, J.; Anthony, E.J.; Gardel, A.; Dussouillez, P. Close-range airborne Structure-from-MotionPhotogrammetry for high-resolution beach morphometric surveys: Examples from an embayed rotatingbeach. Geomorphology 2016, 261, 76–88. [CrossRef]
50. Pikelj, K.; Ružic, I.; James, M.R.; Ilic, S. Structure-from-Motion (SfM) monitoring of nourished gravel beachesin Croatia. Proc. Inst. Civil Eng. 2014, 167, 173–191.
51. James, M.R.; Robson, S. Mitigating systematic error in topographic models derived from UAV andground-based image networks. Earth Surf. Process. Landf. 2014, 39, 1413–1420. [CrossRef]
52. Turner, I.L.; Harley, M.D.; Drummond, C.D. UAVs for coastal surveying. Coast. Eng. 2016, 114, 19–24.[CrossRef]
53. Bagheri, O.; Ghodsian, M.; Saadatseresht, M. Reach scale application of UAV+SfM method in shallow rivershyperspatial bathymetry. Int. Arch. Photogramm. Remote Sens. Spat. Inf. Sci. - ISPRS Arch. 2015, 40, 77–81.[CrossRef]
54. Wiggins, M.; Scott, T.; Masselink, G.; Russell, P.; McCarroll, R.J. Coastal embayment rotation: Responseto extreme events and climate control, using full embayment surveys. Geomorphology 2019, 327, 385–403.[CrossRef]
55. Orford, J.D.; Forbes, D.L.; Jennings, S.C. Organisational controls, typologies and time scales of paraglacialgravel-dominated coastal systems. Geomorphology 2002, 48, 51–85. [CrossRef]
56. Harwin, S.; Lucieer, A. Assessing the accuracy of georeferenced point clouds produced via multi-viewstereopsis from Unmanned Aerial Vehicle (UAV) imagery. Remote Sens. 2012, 4, 1573–1599. [CrossRef]
© 2019 by the authors. Licensee MDPI, Basel, Switzerland. This article is an open accessarticle distributed under the terms and conditions of the Creative Commons Attribution(CC BY) license (http://creativecommons.org/licenses/by/4.0/).