assessment of the level of building damage induced by ... · arising from tunnel construction, is...
TRANSCRIPT
International Journal of Applied Engineering Research ISSN 0973-4562 Volume 11, Number 16 (2016) pp 8882-8891
© Research India Publications. http://www.ripublication.com
8882
Assessment of the Level of Building Damage Induced by Tunnel
Construction in Soft Soil
Nouaman Tafraouti1, Rhali Benamar1 and Nouzha Lamdouar1
1ERSIM Laboratory, Mohammadia Engineering School, Mohammed V University, Rabat, Morocco.
Abstract
This paper investigate the building response to ground
deformations which happen during tunnel construction in
terms of damage level. Firstly, ground movements resulting
from tunnelling are evaluated assuming greenfield conditions,
i.e. ignoring the presence of the overlying structure, by using
the empirical methods of Peck 1969 and O'Reilly & New
1982. Therefore, assessment of the potential building damage
is performed by using various approach’s namely, the limiting
tensile strain method, the method’s of Rankin 1988, Potts &
Addenbrooke 1997 and Franzius 2003, in order to obtain an
assessment of the building damage level. The results obtained
indicate that the limiting tensile strain method and Rankin
1988 method, leads to conservative damage assessment
compared to the method’s of Potts & Addenbrooke 1997 and
Franzius 2003.
Keywords: Tunnel, building damage level, settlement trough,
ground movements.
INTRODUCTION
Expanding urbanization, has resulted in a crucial reduction of
available urban space, leading to an increase in the use of the
underground space as alternative solution for mitigating the
shortage of surface area.
But, tunnel construction in urban environment is generally
carried out in bounded zones with a lot of surface structures
located in the influence zone of the tunnel, with various types
of foundation.
In the other hand, tunnel construction induces ground
movements that may affect and distort the neighboring
buildings in surface, leading generally to aesthetic or
serviceability damage and in some cases to structural building
damage. Hence, costly repairs, construction delay and
increase in operating cost of tunnel project can result from
such problem.
Consequently, assessment of the level of building damage
arising from tunnel construction, is one of the more important
aspects of the tunnel design. Because, based on this level,
protective measures can be taken previously in order to reduce
the risk of damage of neighboring buildings in surface.
PRESENTATION OF THE PROBLEM UNDER
CONSIDERATION
In the problem under investigation, the tunnel have a circular
section with a diameter D = 6m, a depth Z0 = 20m and its
excavated in clayey soil. The soil have the following
properties: The unit weight is ϒ=18 kN/m3, the Young’s
Modulus is E=20 Mpa, the cohesion is c=10 Kpa and the
internal friction angle is ϕ =22°.
The tunnel lining is constituted by reinforced concrete
segments with a thickness of 30 cm.
The neighboring building at surface, is a one level concrete
frame structure, the building width is B = 20m and the
length of building is 10m .The distance from the midpoint of
the building to the tunnel centerline is 8m.The analysis of
building potential damage that can be induced by tunnelling is
carried out by using various methods.
The methods used in practice for the assessment of damage to
buildings caused by settlements due to tunnelling are
generally based on two separate and distinct procedures
[1,2].In the first step, the ground movements due to tunnel
excavation are evaluated without taking into account the
presence of the building. Then, the obtained settlement trough
is applied to the building for evaluating the potential building
damage [3].
EVALUATION OF GREENFIELD GROUND
MOVEMENTS INDUCED BY TUNNELLING
In this work, we use different methods, in order to evaluate
the level of building damage that can be induced by
tunnelling.
But, firstly we need to evaluate the greenfield ground
movements, for the reason that, their magnitude is a key issue
in urban environments [4] and particularly the resulting
ground settlements which is a vital step in assessing the
potential impact of tunnelling [5].
In the first step we determinate the surface settlement. For the
assessment of the greenfield (without presence of any building
in surface) settlement trough due to tunnelling ,we use Peck’s
1969 method in which the shape of the settlement trough is
supposed to approximate closely a normal Gaussian
distribution curve, because this method is the most common
available methods for the assessment of the greenfield
settlement due to tunnelling.
Effectively, it has been found that the shape of the surface
settlement troughs developing during tunnel construction is
reasonably well represented by a Gaussian distribution [6], so
greenfield settlements are generally approximated empirically
by a Gaussian curve in a direction perpendicular to the tunnel
axis [7,8]. Furthermore, this method has been intensively used
all over the world [9].
Peck 1969 proposed that the formula for the assessment of
surface settlement can be expressed as [10]:
International Journal of Applied Engineering Research ISSN 0973-4562 Volume 11, Number 16 (2016) pp 8882-8891
© Research India Publications. http://www.ripublication.com
8883
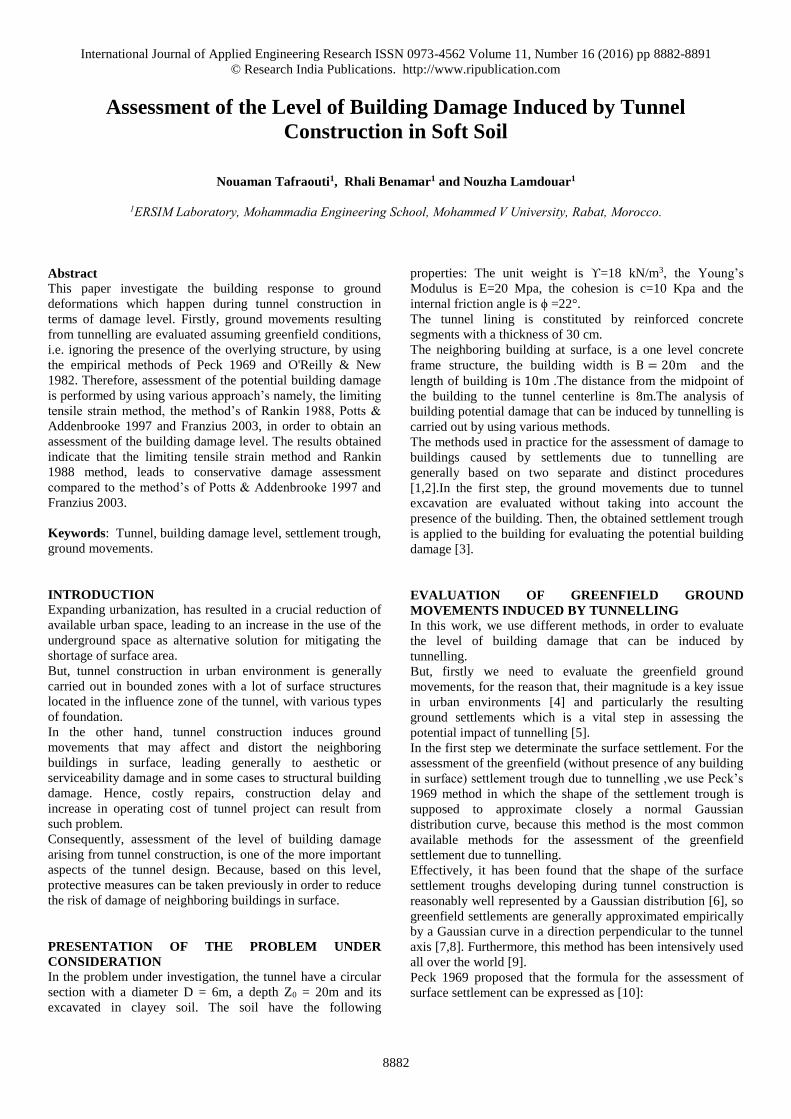
S(x) = Smax exp (−x2
2i2) (1)
With:
S(x): Settlement in surface at a given horizontal distance x
Smax: Maximum surface settlement
x : horizontal distance from the tunnel centerline
i : Trough width parameter, this is the horizontal distance
from the tunnel centerline to the point of inflection on the
settlement trough
One of the important parameter for evaluating ground
movements caused by tunnelling, is the volume loss "Vl"
defined as the volume of the settlement trough per linear
meter "Vs" divided by the volume of the tunnel per linear
meter:
Vl =4 Vs
π D2 (2)
The volume of settlement trough per linear meter "Vs" is
[22]:
Vs = ∫ S(x) dx+∞
−∞ = √2π i Smax (3)
Consequently, in the method of Peck 1969, the volume loss
can be expressed as:
Vl = √32
π i Smax
D2 (4)
In the literature, there is a large number of empirical
relationships for estimating the trough width parameter “i”.
The best known of them is the relationship proposed by
O'Reilly & New 1982.
In 1982, O'Reilly and New had proposed to estimate the
trough width parameter, the following empirical relationship
[11].
i = k Z0 (5)
With Z0 is depth to tunnel axis and k is a coefficient,
depending on the nature of the soil.
O'Reilly and New reported that k = 0.5 is an appropriate value
for clay [12] and Rankin found in 1988, that
k = 0.5 was a reasonable value to fit most of the field
measurements above tunnels [13].
After Mair et al 1993 [6], it is reasonable to estimate the
trough width parameter by the formula presented above, so we
adopt the relationship proposed by O'Reilly & New 1982 to
estimate this parameter.
In our case, the depth of tunnel is 20 m and the kind of soil is
clay, so the coefficient k can be taken as 0.5
thus i = 10 m.
In terms of volume loss "Vl" ,it mainly depends on the type of
soil, the excavation method, the support and the quality of
works [14].
Several authors have estimated values that can be taken for
the volume loss Vl.
According to Attewell 1977 volume loss lies in the range 1%
and 5% and after O'Reilly and New 1982, volume loss Vl lies
in the range 0.5% and 3% [15].
McCabe et al 2012 [11] have proposed the following
empirical relationships to estimate the volume loss due to
tunnelling in Irish ground:
Vl = 0,008 (Z0
D) (6) in fine soils
Vl = 0,011 (Z0
D) (7) in coarse soils
With D=6m and Z0 = 20m ,we find Vl = 2,6% by using
McCabe et al 2012 method .
Augarde 1997 [2] state that the magnitude of volume loss, for
tunnelling in clay is usually in the range 1% to 3% and
according to Burd et al 2000 [7] a volume loss of 2% , is
typical of real tunnelling operations.
So in our case, we adopt for volume loss a value of Vl = 2%.
The maximum surface settlement, can be determined from
equation n°4, so:
Smax = √π
32 Vl D2
i (8)
Therefore, we find Smax = 22,56 mm .
The greenfield settlement trough evaluated by using Peck
1969 method is reported in the graph below.
International Journal of Applied Engineering Research ISSN 0973-4562 Volume 11, Number 16 (2016) pp 8882-8891
© Research India Publications. http://www.ripublication.com
8884
Figure 1: Surface settlement trough obtained by the Peck 1969 method
Other important aspect of ground movements induced by
tunnelling, is the horizontal surface soil displacements,
because, damage of buildings can arise from horizontal
ground displacements [16] and despite the fact that horizontal
movements often do not receive as much attention as
settlements, but they can be equally damaging to buildings
[17].
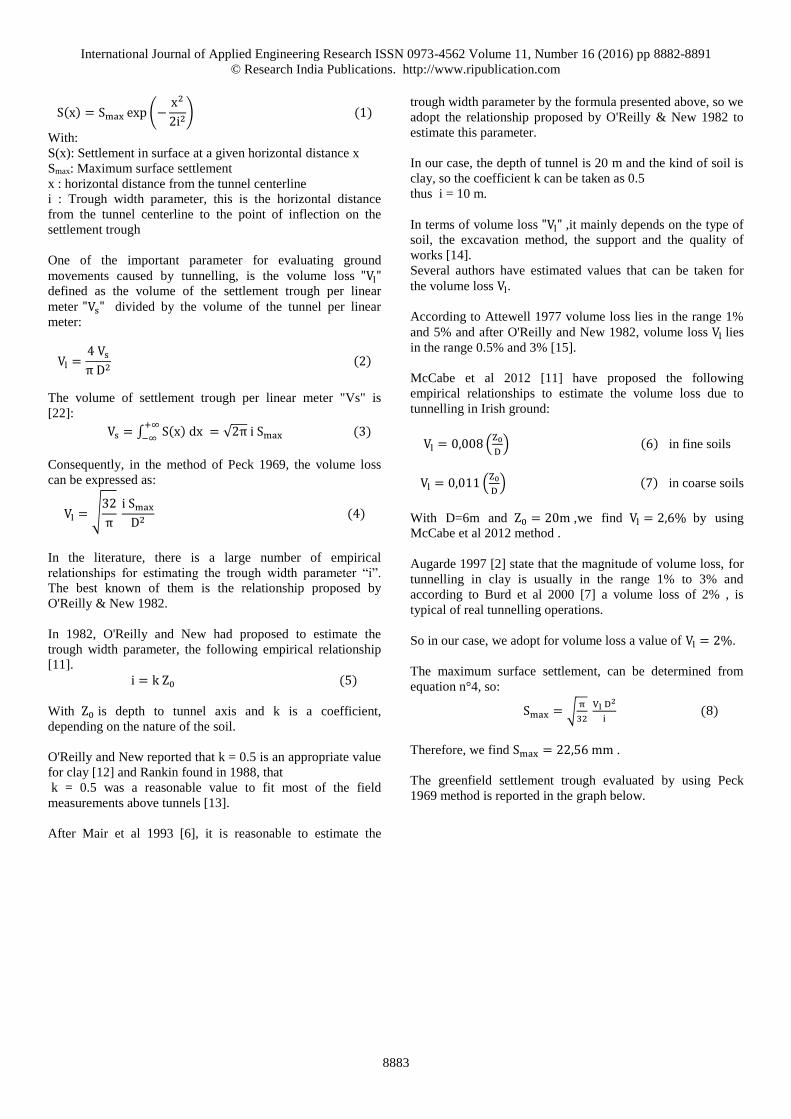
O'Reilly & New 1982 showed that the horizontal surface soil
displacement in the transverse direction can be determined by
using the following formula [12].
Sh(x) = −x
Z0
S(x) (9)
With
Sh(x): horizontal soil surface displacement
S(x) : Settlement in surface
x : horizontal distance from the tunnel centerline
Z0: Tunnel depth
The horizontal surface displacement is reported in the graph
below.
Figure 2: Greenfield horizontal surface displacement profile
-25
-20
-15
-10
-5
0-50 -40 -30 -20 -10 0 10 20 30 40 50
Settlement (mm)
Offset from tunnel centreline (m)
Greenfieldsettlement (Peck…
-8
-6
-4
-2
0
2
4
6
8
-50 -40 -30 -20 -10 0 10 20 30 40 50
Distance to tunnel centreline (m)
Greenfield horizontal surfacedisplacement (mm)
Horizontal surface displacement(O'Reilly & New 1982 method)
International Journal of Applied Engineering Research ISSN 0973-4562 Volume 11, Number 16 (2016) pp 8882-8891
© Research India Publications. http://www.ripublication.com
8885
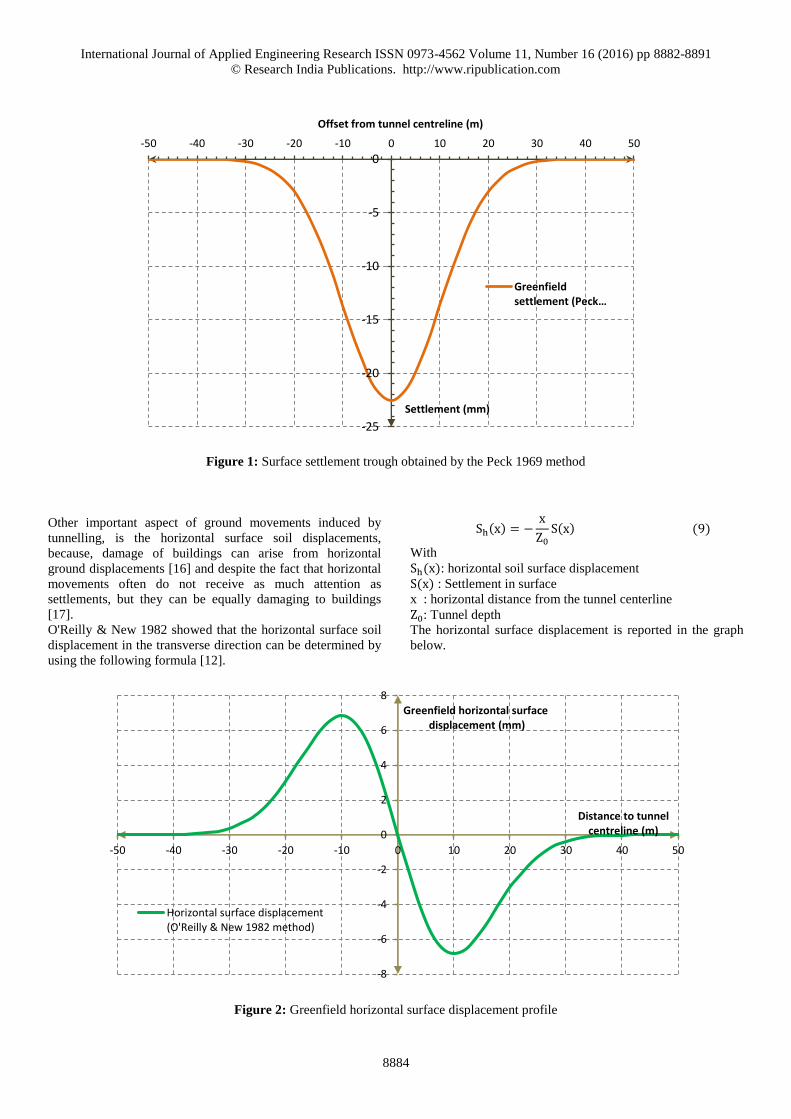
Also, we need to evaluate the horizontal strain, because the
horizontal strains induced by tunneling interact with the
neighboring structure in surface and can lead to severe
building damage [18;19].
The horizontal strain in the transverse direction is obtained by
differentiating the horizontal displacement with respect to x
[12] .
εh(x) =dSh
dx= (
x2
i2− 1)
S(x)
Z0
(10)
The horizontal strain profile is reported in the graph below.
Figure 3: Profile of greenfield horizontal strain
ASSESSMENT OF POTENTIAL BUILDING DAMAGE
INDUCED BY TUNNELLING BY MEANS OF
DIFFERENT APPROACH’S
We have determined the ground movements induced by
tunnelling, so we can use these results to assess the potential
building damage by mains of various methods.
Rankin’s 1988 method
In 1988 Rankin proposed a method for preliminary
assessment of building damage. This method is based on two
parameters, the first is the building settlement and the second
parameter is the slope of building which is according to
Franzius 2003 [12] describes the change in gradient of the
straight line defined by two reference points embedded in the
structure.
Based on the method of Rankin 1988, for a building
experiencing a maximum slope 𝛳 less than 1/500 and a
maximum settlement less than 10 mm, the building damage
category is 1. Besides, for a building experiencing a maximum
slope 𝛳 comprising between 1/500 to 1/200 and a maximum
settlement between 10 mm to 50 mm, the building damage
category is 2. [20]
In our case and using the settlement trough profile determined
previously, the maximum magnitude of settlement is Smax = 22,6 mm while the maximum building slope is θ = 1/1000,
so the building damage category is 2 and the description of the
degree of damage is slight.
The limiting tensile strain method:
Burland and Wroth 1974 [21], showed that the beginning of
visible cracking is related to a critical tensile strain. They
applied a concept of limiting tensile strain to elastic beam
representing building.
In the limiting tensile strain method, the elastic beam
representing building is characterized by an equivalent axial
stiffness (EA) and equivalent bending stiffness (EI).
In this approach the building is supposed to follow the
greenfield settlement, and a deflection ratio Δ L⁄ was defined
to study the building deformation.
In the method of Burland and Wroth 1974, the maximum
bending strain εbmax and the maximum diagonal strain εdmax
are related to deflection ratio Δ L⁄ , according to the following
equations [22]:
𝛥
𝐿= (
𝐿
12𝑡+
3𝐼
2𝑡𝐿𝐻 𝐸
𝐺) 𝜀𝑏𝑚𝑎𝑥 (11)
-0.0012
-0.0010
-0.0008
-0.0006
-0.0004
-0.0002
0.0000
0.0002
0.0004
0.0006
-40 -20 0 20 40Distance to tunnelcentreline (m)
Horizontal strain
Greenfiled horizontal strain

International Journal of Applied Engineering Research ISSN 0973-4562 Volume 11, Number 16 (2016) pp 8882-8891
© Research India Publications. http://www.ripublication.com
8886
𝛥
𝐿= (1 +
𝐻𝐿2
18𝐼 𝐺
𝐸) 𝜀𝑑𝑚𝑎𝑥 (12)
With
L : Width of building in sagging / hogging E
G⁄ : Ratio between Young’s modulus and shear modulus of
the building
H : height of building
t : The furthest distance from the neutral axis to the edge
of the equivalent beam
I : Moment of inertia
In the sagging we have I = H3 12⁄ (13)
and t = H 2 ⁄ (14) [23]
In the hogging we have I = H3 3⁄ (15)
and t = H (16) [23]
For the ratio between Young’s modulus and shear modulus of
the building E G⁄ = 12,5 for framed building [24].
We have studied in the precedent part, the greenfield
deformations of ground and we have plotted the
corresponding graphics.
The deflection ratios are calculated in both hogging and
sagging zones which are partitioned by the point of inflexion
of the settlement trough.
Figure 4: Definition of hogging and sagging modes of
deformation, after Loganathan 2011 [20].
Based on the settlement trough obtained by using Peck 1969
formula. The deflection in sagging and hogging are
respectively 𝛥𝑠𝑎𝑔 = 2,98 𝑚𝑚 and 𝛥ℎ𝑜𝑔 = 0,61 𝑚𝑚 . The
length of building in the sagging and hogging zone are
respectively 𝐿𝑠𝑎𝑔 = 12𝑚 and 𝐿ℎ𝑜𝑔 = 8𝑚 .
Hence, we find that the maximum bending strain is :
εbmax = 1,7151 10−4 in sagging
εbmax = 2,9716 10−5 in hogging
The maximum diagonal strain is:
εdmax = 1,3399 10−4 in sagging
εdmax = 6,9646 10−5 in hogging
The Burland and Wroth approach was improved by Boscardin
and Cording 1989, by including horizontal tensile strain in the
analysis.
The resultant bending strain εbr and the resultant diagonal
strain εdr are given by the equations below [12,22]:
εbr = εbmax + εh (17)
εdr = εh (1 − ν)
2+ √εh
2 (1 − ν
2)
2
+ εdmax2 (18)
With εh horizontal strain and ν the poisson's ratio.
The poisson's ratio is taken equal to ν = 0,2.
In the previous part of this paper, we have plotted the
horizontal strain profile, so:
εh = 1,128 10−3 in sagging
εh = 5,03 10−4 in hogging
Hence, the resultant bending strain is:
εbr = 1,2995 10−3 in sagging
εbr = 5,3271 10−4 in hogging
And the resultant diagonal strain is:
εdr = 9,2187 10−4 in sagging
εdr = 4,1411 10−4 in hogging
The larger value of εbr and εdr defines the critical tensile
strain
εcritical = max(εbr; εdr) (19)
So:
εcritical = 1,2995 10−3 in sagging
εcritical = 5,3271 10−4 in hogging
Hence, the maximal critical tensile strain is
εcritical,max = 1,2995 10−3
Now, we can determine the damage level of building by
comparing the maximal critical strain to the criteria given in
literature.
Boscardin and Cording 1989 have proposed a classification of
category of building damage by using the limiting tensile
strain as damage criterion.
International Journal of Applied Engineering Research ISSN 0973-4562 Volume 11, Number 16 (2016) pp 8882-8891
© Research India Publications. http://www.ripublication.com
8887
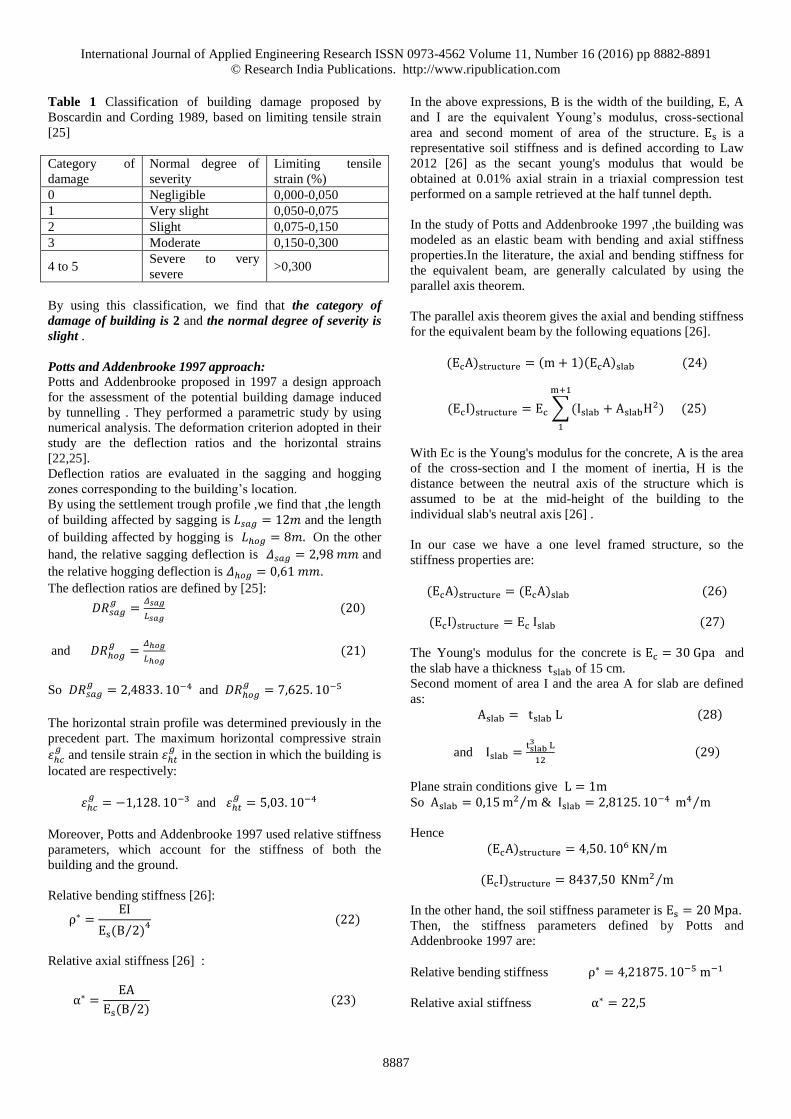
Table 1 Classification of building damage proposed by
Boscardin and Cording 1989, based on limiting tensile strain
[25]
Category of
damage
Normal degree of
severity
Limiting tensile
strain (%)
0 Negligible 0,000-0,050
1 Very slight 0,050-0,075
2 Slight 0,075-0,150
3 Moderate 0,150-0,300
4 to 5 Severe to very
severe >0,300
By using this classification, we find that the category of
damage of building is 2 and the normal degree of severity is
slight .
Potts and Addenbrooke 1997 approach:
Potts and Addenbrooke proposed in 1997 a design approach
for the assessment of the potential building damage induced
by tunnelling . They performed a parametric study by using
numerical analysis. The deformation criterion adopted in their
study are the deflection ratios and the horizontal strains
[22,25].
Deflection ratios are evaluated in the sagging and hogging
zones corresponding to the building’s location.
By using the settlement trough profile ,we find that ,the length
of building affected by sagging is 𝐿𝑠𝑎𝑔 = 12𝑚 and the length
of building affected by hogging is 𝐿ℎ𝑜𝑔 = 8𝑚. On the other
hand, the relative sagging deflection is 𝛥𝑠𝑎𝑔 = 2,98 𝑚𝑚 and
the relative hogging deflection is 𝛥ℎ𝑜𝑔 = 0,61 𝑚𝑚.
The deflection ratios are defined by [25]:
𝐷𝑅𝑠𝑎𝑔𝑔
=𝛥𝑠𝑎𝑔
𝐿𝑠𝑎𝑔 (20)
and 𝐷𝑅ℎ𝑜𝑔𝑔
=𝛥ℎ𝑜𝑔
𝐿ℎ𝑜𝑔 (21)
So 𝐷𝑅𝑠𝑎𝑔𝑔
= 2,4833. 10−4 and 𝐷𝑅ℎ𝑜𝑔𝑔
= 7,625. 10−5
The horizontal strain profile was determined previously in the
precedent part. The maximum horizontal compressive strain
𝜀ℎ𝑐𝑔
and tensile strain 𝜀ℎ𝑡𝑔
in the section in which the building is
located are respectively:
𝜀ℎ𝑐𝑔
= −1,128. 10−3 and 𝜀ℎ𝑡𝑔
= 5,03. 10−4
Moreover, Potts and Addenbrooke 1997 used relative stiffness
parameters, which account for the stiffness of both the
building and the ground.
Relative bending stiffness [26]:
ρ∗ =EI
Es(B 2)⁄ 4 (22)
Relative axial stiffness [26] :
α∗ =EA
Es(B 2⁄ ) (23)
In the above expressions, B is the width of the building, E, A
and I are the equivalent Young’s modulus, cross-sectional
area and second moment of area of the structure. Es is a
representative soil stiffness and is defined according to Law
2012 [26] as the secant young's modulus that would be
obtained at 0.01% axial strain in a triaxial compression test
performed on a sample retrieved at the half tunnel depth.
In the study of Potts and Addenbrooke 1997 ,the building was
modeled as an elastic beam with bending and axial stiffness
properties.In the literature, the axial and bending stiffness for
the equivalent beam, are generally calculated by using the
parallel axis theorem.
The parallel axis theorem gives the axial and bending stiffness
for the equivalent beam by the following equations [26].
(EcA)structure = (m + 1)(EcA)slab (24)
(EcI)structure = Ec ∑ (Islab + AslabH2)
m+1
1
(25)
With Ec is the Young's modulus for the concrete, A is the area
of the cross-section and I the moment of inertia, H is the
distance between the neutral axis of the structure which is
assumed to be at the mid-height of the building to the
individual slab's neutral axis [26] .
In our case we have a one level framed structure, so the
stiffness properties are:
(EcA)structure = (EcA)slab (26)
(EcI)structure = Ec Islab (27)
The Young's modulus for the concrete is Ec = 30 Gpa and
the slab have a thickness tslab of 15 cm.
Second moment of area I and the area A for slab are defined
as:
Aslab = tslab L (28)
and Islab =tslab
3 L
12 (29)
Plane strain conditions give L = 1m
So Aslab = 0,15 m2 m⁄ & Islab = 2,8125. 10−4 m4 m⁄
Hence
(EcA)structure = 4,50. 106 KN m⁄
(EcI)structure = 8437,50 KNm2 m⁄
In the other hand, the soil stiffness parameter is Es = 20 Mpa.
Then, the stiffness parameters defined by Potts and
Addenbrooke 1997 are:
Relative bending stiffness ρ∗ = 4,21875. 10−5 m−1
Relative axial stiffness α∗ = 22,5

International Journal of Applied Engineering Research ISSN 0973-4562 Volume 11, Number 16 (2016) pp 8882-8891
© Research India Publications. http://www.ripublication.com
8888
In addition, we have e B⁄ = 0,4, with “e” is the eccentricity
,which is the offset between building and tunnel centerlines.
So, we can use the design curves established by Potts and
Addenbrooke 1997 to assess the modifications factors.
Figure 5: Design curves established by Potts and
Addenbrooke 1997, for modification factors of deflection
ratio (Ref [27])
Figure 6: Design curves established by Potts and
Addenbrooke 1997, for modification factors of maximal
horizontal strain (Ref [27])
By using the design curves of Potts and Addenbrooke
1997,we have the following modification factors.
Modification factors of deflection ratio:
( MDRsag = 1,06 ; MDRhog = 1,24)
Modification factors for the maximum horizontal strain:
(Mεhc = 0 ; Mεht = 0)
The modification factors introduced by Potts and
Addenbrooke 1997 characterize the maximum deflection
ratios and horizontal strains in the structure in relation to
greenfield situation.
MDRsag =DRsag
DRsagg (30) MDRhog =
DRhog
DRhog
g (31)
Mεhc =εhc
εhc
g (32) Mεht =εht
εht
g (33)
The deformation criteria of the building can be calculated by
multiplying the greenfield deformation criteria with the
corresponding modification factors:
DRsag = MDRsag . DRsagg
(34)
DRhog = MDRhog . DRhogg
(35)
εhc = Mεhc . εhcg
(36) εht = Mεht . εhtg
(37)
So , we find : DRsag = 2,632. 10−4, DRhog = 9,455. 10−5 and εhc = εht = 0
By using the diagram established by Burland 1995, we can
evaluate potential damage caused by tunnel construction in
existing building.
Figure 7: Diagram of Burland 1995, showing the relationship
of damage category to deflection ratio and horizontal tensile
strain for hogging (Ref [26])
Therefore, we find that the building damage category is 0,
and that means that the normal degree of severity is
negligible.
Franzius 2003 approach:
Franzius 2003 [12] have introduced some modifications to the
original approach of Potts and Addenbrooke 1997.
He show that the influence of building width B in the original
definition of relative bending stiffness 𝜌∗ was overestimated
and the tunnel depth 𝑍0 was not sufficiently weighted [27]
So, Franzius 2003 proposes refining the relative bending
stiffness to:
𝜌𝑚𝑜𝑑∗ =
𝐸𝐼
𝐸𝑠𝑍0𝐵2𝐿 (38)
with L is the length of building in the longitudinal direction.
Besides, Franzius 2003 modified the expression of relative
axial stiffness to take into consideration the length of building
in the longitudinal direction “L”.
International Journal of Applied Engineering Research ISSN 0973-4562 Volume 11, Number 16 (2016) pp 8882-8891
© Research India Publications. http://www.ripublication.com
8889
𝛼𝑚𝑜𝑑∗ =
𝐸𝐴
𝐸𝑠 𝐵 𝐿 (39)
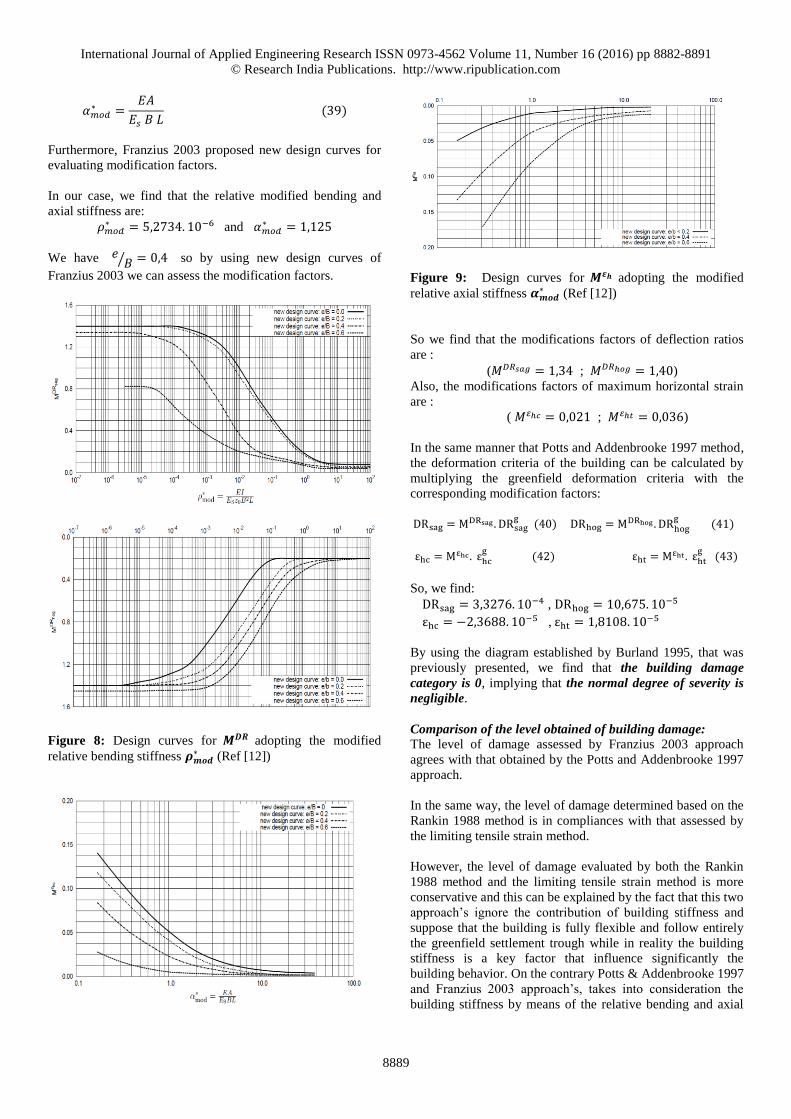
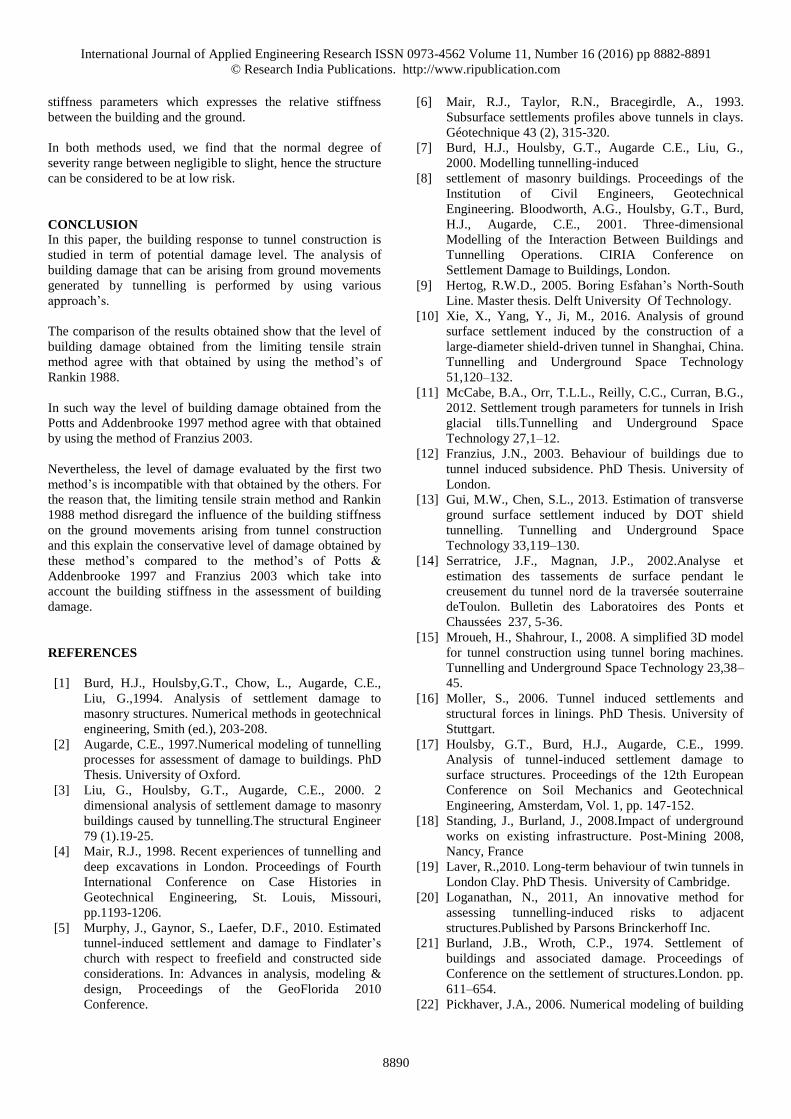
Furthermore, Franzius 2003 proposed new design curves for
evaluating modification factors.
In our case, we find that the relative modified bending and
axial stiffness are:
𝜌𝑚𝑜𝑑∗ = 5,2734. 10−6 and 𝛼𝑚𝑜𝑑
∗ = 1,125
We have 𝑒𝐵⁄ = 0,4 so by using new design curves of
Franzius 2003 we can assess the modification factors.
Figure 8: Design curves for 𝑴𝑫𝑹 adopting the modified
relative bending stiffness 𝝆𝒎𝒐𝒅∗ (Ref [12])
Figure 9: Design curves for 𝑴𝜺𝒉 adopting the modified
relative axial stiffness 𝜶𝒎𝒐𝒅∗ (Ref [12])
So we find that the modifications factors of deflection ratios
are :
(𝑀𝐷𝑅𝑠𝑎𝑔 = 1,34 ; 𝑀𝐷𝑅ℎ𝑜𝑔 = 1,40)
Also, the modifications factors of maximum horizontal strain
are :
( 𝑀𝜀ℎ𝑐 = 0,021 ; 𝑀𝜀ℎ𝑡 = 0,036)
In the same manner that Potts and Addenbrooke 1997 method,
the deformation criteria of the building can be calculated by
multiplying the greenfield deformation criteria with the
corresponding modification factors:
DRsag = MDRsag . DRsagg
(40)
DRhog = MDRhog . DRhogg
(41)
εhc = Mεhc . εhcg
(42) εht = Mεht . εhtg
(43)
So, we find:
DRsag = 3,3276. 10−4 , DRhog = 10,675. 10−5
εhc = −2,3688. 10−5 , εht = 1,8108. 10−5
By using the diagram established by Burland 1995, that was
previously presented, we find that the building damage
category is 0, implying that the normal degree of severity is
negligible.
Comparison of the level obtained of building damage:
The level of damage assessed by Franzius 2003 approach
agrees with that obtained by the Potts and Addenbrooke 1997
approach.
In the same way, the level of damage determined based on the
Rankin 1988 method is in compliances with that assessed by
the limiting tensile strain method.
However, the level of damage evaluated by both the Rankin
1988 method and the limiting tensile strain method is more
conservative and this can be explained by the fact that this two
approach’s ignore the contribution of building stiffness and
suppose that the building is fully flexible and follow entirely
the greenfield settlement trough while in reality the building
stiffness is a key factor that influence significantly the
building behavior. On the contrary Potts & Addenbrooke 1997
and Franzius 2003 approach’s, takes into consideration the
building stiffness by means of the relative bending and axial
International Journal of Applied Engineering Research ISSN 0973-4562 Volume 11, Number 16 (2016) pp 8882-8891
© Research India Publications. http://www.ripublication.com
8890
stiffness parameters which expresses the relative stiffness
between the building and the ground.
In both methods used, we find that the normal degree of
severity range between negligible to slight, hence the structure
can be considered to be at low risk.
CONCLUSION In this paper, the building response to tunnel construction is
studied in term of potential damage level. The analysis of
building damage that can be arising from ground movements
generated by tunnelling is performed by using various
approach’s.
The comparison of the results obtained show that the level of
building damage obtained from the limiting tensile strain
method agree with that obtained by using the method’s of
Rankin 1988.
In such way the level of building damage obtained from the
Potts and Addenbrooke 1997 method agree with that obtained
by using the method of Franzius 2003.
Nevertheless, the level of damage evaluated by the first two
method’s is incompatible with that obtained by the others. For
the reason that, the limiting tensile strain method and Rankin
1988 method disregard the influence of the building stiffness
on the ground movements arising from tunnel construction
and this explain the conservative level of damage obtained by
these method’s compared to the method’s of Potts &
Addenbrooke 1997 and Franzius 2003 which take into
account the building stiffness in the assessment of building
damage.
REFERENCES
[1] Burd, H.J., Houlsby,G.T., Chow, L., Augarde, C.E.,
Liu, G.,1994. Analysis of settlement damage to
masonry structures. Numerical methods in geotechnical
engineering, Smith (ed.), 203-208.
[2] Augarde, C.E., 1997.Numerical modeling of tunnelling
processes for assessment of damage to buildings. PhD
Thesis. University of Oxford.
[3] Liu, G., Houlsby, G.T., Augarde, C.E., 2000. 2
dimensional analysis of settlement damage to masonry
buildings caused by tunnelling.The structural Engineer
79 (1).19-25.
[4] Mair, R.J., 1998. Recent experiences of tunnelling and
deep excavations in London. Proceedings of Fourth
International Conference on Case Histories in
Geotechnical Engineering, St. Louis, Missouri,
pp.1193-1206.
[5] Murphy, J., Gaynor, S., Laefer, D.F., 2010. Estimated
tunnel-induced settlement and damage to Findlater’s
church with respect to freefield and constructed side
considerations. In: Advances in analysis, modeling &
design, Proceedings of the GeoFlorida 2010
Conference.
[6] Mair, R.J., Taylor, R.N., Bracegirdle, A., 1993.
Subsurface settlements profiles above tunnels in clays.
Géotechnique 43 (2), 315-320.
[7] Burd, H.J., Houlsby, G.T., Augarde C.E., Liu, G.,
2000. Modelling tunnelling-induced
[8] settlement of masonry buildings. Proceedings of the
Institution of Civil Engineers, Geotechnical
Engineering. Bloodworth, A.G., Houlsby, G.T., Burd,
H.J., Augarde, C.E., 2001. Three-dimensional
Modelling of the Interaction Between Buildings and
Tunnelling Operations. CIRIA Conference on
Settlement Damage to Buildings, London.
[9] Hertog, R.W.D., 2005. Boring Esfahan’s North-South
Line. Master thesis. Delft University Of Technology.
[10] Xie, X., Yang, Y., Ji, M., 2016. Analysis of ground
surface settlement induced by the construction of a
large-diameter shield-driven tunnel in Shanghai, China.
Tunnelling and Underground Space Technology
51,120–132.
[11] McCabe, B.A., Orr, T.L.L., Reilly, C.C., Curran, B.G.,
2012. Settlement trough parameters for tunnels in Irish
glacial tills.Tunnelling and Underground Space
Technology 27,1–12.
[12] Franzius, J.N., 2003. Behaviour of buildings due to
tunnel induced subsidence. PhD Thesis. University of
London.
[13] Gui, M.W., Chen, S.L., 2013. Estimation of transverse
ground surface settlement induced by DOT shield
tunnelling. Tunnelling and Underground Space
Technology 33,119–130.
[14] Serratrice, J.F., Magnan, J.P., 2002.Analyse et
estimation des tassements de surface pendant le
creusement du tunnel nord de la traversée souterraine
deToulon. Bulletin des Laboratoires des Ponts et
Chaussées 237, 5-36.
[15] Mroueh, H., Shahrour, I., 2008. A simplified 3D model
for tunnel construction using tunnel boring machines.
Tunnelling and Underground Space Technology 23,38–
45.
[16] Moller, S., 2006. Tunnel induced settlements and
structural forces in linings. PhD Thesis. University of
Stuttgart.
[17] Houlsby, G.T., Burd, H.J., Augarde, C.E., 1999.
Analysis of tunnel-induced settlement damage to
surface structures. Proceedings of the 12th European
Conference on Soil Mechanics and Geotechnical
Engineering, Amsterdam, Vol. 1, pp. 147-152.
[18] Standing, J., Burland, J., 2008.Impact of underground
works on existing infrastructure. Post-Mining 2008,
Nancy, France
[19] Laver, R.,2010. Long-term behaviour of twin tunnels in
London Clay. PhD Thesis. University of Cambridge.
[20] Loganathan, N., 2011, An innovative method for
assessing tunnelling-induced risks to adjacent
structures.Published by Parsons Brinckerhoff Inc.
[21] Burland, J.B., Wroth, C.P., 1974. Settlement of
buildings and associated damage. Proceedings of
Conference on the settlement of structures.London. pp.
611–654.
[22] Pickhaver, J.A., 2006. Numerical modeling of building

International Journal of Applied Engineering Research ISSN 0973-4562 Volume 11, Number 16 (2016) pp 8882-8891
© Research India Publications. http://www.ripublication.com
8891
response to tunnelling. PhD Thesis. University of
Oxford.
[23] Liu, G., 1997. Numerical modeling of damage to
masonry buildings due to tunnelling. PhD Thesis.
University of Oxford.
[24] Smit, G.,2010. The behaviour of modern flexible
framed structures undergoing differential settlement.
PhD Thesis. University of Southampton.
[25] Chatzigogos, C.S.T., 2002. Effects of existing surface
structures on settlements induced by tunnelling. Master
thesis. Massachusetts Institute of Technology.
[26] Law, R.H.C., 2012. Effect of existing building on
tunnelling-induced ground movements. Master thesis.
Massachusetts Institute of Technology
[27] Franzius, J.N., Potts, D.M., Burland, J.B.,2006. The
response of surface structures to tunnel construction.
Proceedings of the Institution of Civil Engineers.
Geotechnical Engineering 159, 3-17.
[28] Bloodworth, A.G., 2002. Three-dimensional analysis of
tunnelling effects on structures to develop design
methods. PhD Thesis. University of Oxford.
[29] Dimmock, P.S., Mair, R.J., 2008.Effect of building
stiffness on tunnelling-induced ground movement.
Tunnelling and Underground Space Technology 23,
438–450.
[30] Do, N.A., Dias, D., Oreste, P., Maigre, I.D., 2013. 3D
Modelling for mechanized tunnelling in soft ground-
influence of the constitutive model. American Journal
of Applied Sciences 10 (8), 863-875.
[31] Hor, B., Caudron, M., Al Heib, M., 2011. Experimental
analysis of the impact of ground movements on surface
structure. Published in "64. Canadian geotechnical
conference - 14. Pan-America conference on soil
mechanics and geotechnical engineering. Toronto,
Canada"
[32] Mroueh, H., Shahrour, I., 2003. A full 3-D finite
element analysis of tunnelling–adjacent structures
interaction. Computers and Geotechnics 30, 245–253.
[33] Keshuan, M., Lieyun, D., 2008. Finite element analysis
of tunnel–soil–building interaction using displacement
controlled model. Proceedings of international
conference on applied computer & applied
computational science, China, pp.306-311.
[34] Liu, J., Qi, T., Wu, Z., 2012. Analysis of ground
movement due to metro station driven with enlarging
shield tunnels under building and its parameter
sensitivity analysis. Tunnelling and Underground Space
Technology 28, 287–296.
[35] Pickhaver, J.A., Burd, H.J., Houlsby, G.T., 2010. An
equivalent beam method to model masonry buildings in
3D finite element analysis.Computers and Structures
88, 1049–1063.
[36] Wang, S., Luna, R., Yang, J., The Influence of Tunnel
Construction on the Performance of Shallow
Foundation Bridge. North American Tunnelling 2008
Conference Proceedings, San Francisco, California.
[37] Zymnis, D.M., 2009. Evaluation of analytical methods
to interpret ground deformations due to soft ground
tunnelling. Master thesis. Massachusetts Institute of
Technology.