assessment of the statusof nestucca river winter...
TRANSCRIPT

2003-01
Assessment of the Status of Nestucca and Alsea Winter Steelhead, 2002
Assessment of the Status of Nestucca and Alsea River Winter Steelhead, 2002
G. L. Susac S.E. Jacobs
Oregon Department of Fish and Wildlife P.O. Box 59
Portland, Oregon 97207
June 2003 This work was financed in part by the Sport Fish and Wildlife Restoration Program administered by the U.S. Fish and Wildlife Service, Projects F-181-D-03 and F-162-R-07.
CONTENTS
ABSTRACT……………………………………………………………………………………………….ii
INTRODUCTION............................................................................................................. 1
STUDY AREA................................................................................................................. 1
METHODS ...................................................................................................................... 1
RESULTS ....................................................................................................................... 3
Spawning Timing....................................................................................................... 3
Detection of Hatchery Strays.................................................................................... 4
Spawning Distribution............................................................................................... 6
Redd Abundance ....................................................................................................... 6
DISCUSSION.................................................................................................................. 9
ACKNOWLEDGEMENTS............................................................................................. 11
REFERENCES.............................................................................................................. 12

ii
ABSTRACT
We used a random probability design to estimate spawner abundance of winter steelhead (Oncorhrynchus mykiss) in the Nestucca and Alsea Basins during the 2002 return year. Redds were cumulatively counted in randomly selected stream reaches over the course of the spawning season as our metric of spawner abundance. We used a relationship between spawner abundance and redd counts obtained at calibration sites along the Oregon Coast to convert redd counts to estimates of spawner abundance. Using these procedures, we estimated that in 2002, 11,500 and 4,200 adult winter steelhead naturally spawned in the Nestucca Basin and Alsea Basins, respectively. Based on the timing of spawning of returning hatchery fish in each basin, as many as 10% of the natural spawners in the Nestucca Basin and as many as 50% of the Alsea Basin natural spawners could have originated from hatchery smolt releases. However, observations of the occurrence of fin-marks on natural spawners indicated that the actual proportions of natural spawners originating from hatcheries were probably lower. Our results suggest that the productivity of winter steelhead Nestucca Basin is higher than that in the Alsea Basin. Despite these differences in productivity, wild broodstock collection programs in either basin had insignificant impacts on natural seeding.

1
INTRODUCTION This report presents results of a status assessment of winter steelhead (Oncorhrynchus mykiss) in the Alsea and Nestucca basins for 2002. This assessment is in response to concerns about the potential effects of wild broodstock development in these basins on the natural populations of winter steelhead. Starting in 2001, programs were initiated in each basin to develop hatchery smolt programs using wild parents. Studies were initiated in February 2001 in the Nestucca Basin (Susac and Jacobs 2002). In 2002, studies in the Nestucca Basin were continued and studies were initiated in the Alsea Basin. The goal of these studies was to characterize the condition of these runs. Methods employed followed those developed by the Coastal Salmonid Inventory Project of the Oregon Department of Fish and Wildlife. Information was obtained on the spawn timing, distribution and abundance of the adult spawning run, and the contribution of hatchery origin fish to the natural spawning population. This report documents findings during the 2001-2002 spawning year (2002 brood year).
STUDY AREA
The Nestucca and Alsea Basins drain the west slope of the coast range of Oregon (Figure 1). The Nestucca Basin is located on the North Oregon coast near the towns of Pacific City and Cloverdale. The Nestucca watershed has an area of 180 square miles and about 350 linear miles of streams. The substrate of the Nestucca Watershed originates form volcanic and sedimentary deposits. The Alsea Basin is located along the central Oregon coast near the town of Waldport. The Alsea River drains a watershed of an area of 344 square miles and about 515 linear miles of streams. The geologic composition of the Alsea Watershed is predominantly marine sediment. Both watersheds contain both public and privately owned land, with landscapes that transition from heavily forested hillsides to open pastures along the lowlands and banks of mainstems and larger order tributaries. Flow regimes in these basins have dramatic intra-annual variation, with peak winter flows generally exceeding summer low flows by two orders of magnitude.
The Nestucca and Alsea Basins are noted for their winter steelhead fisheries. Both
basins support intense fisheries for returning adults during the period of November through March. Both fisheries are supported to a large degree from hatchery programs. To date, these programs rely on broodstocks that have been cultured at hatchery facilities in each basin for over 30 years.
METHODS
We used a stratified random sampling design to estimate the spatial distribution and abundance of winter steelhead redds in the Alsea and Nestucca Basins. Sampling strata consisted of mainstem stream reaches and tributary reaches. The tributary stratum consisted of the extent of coho spawning in the basin as developed through the methods described in Jacobs and Nickelson (1998). The mainstem stratum consisted of the remainder of each watershed downstream of coho spawning habitat but upstream from the head of tidal influence. The resulting stream network coverage that was used for selecting survey sites was based on 1:100,000 digital maps that were enhanced to include known spawning streams not included in the 1:100,000 stream layer. Survey site selection followed the procedure described in Stevens (2002), with the sampling rate set to achieve a target precision of the overall population estimate within approximately + 30%.

2
Elk Cree k
Bea r Cr eek
Eas t Beaver
C
re ek
Moo
n Cree k
Nes
tucc a
River
Te stament Cr ee k
Hor
n C
ree
k
Pow
der C
r e
ek
Th ree Rivers
Buel
ah C
reek
Cle ar Cree k
Bea
r C
re
ek
L i ttle Nestucca Ri ver
Horse Creek
Go
ld C ree k
North
For k
Alsea
River
Dr ift C
r ee k
Sli ck Cre ek
Fall Creek
Alsea R iv er
Eck man C
reek
Crooke
d Cre
ek
Al sea R iver Honey Grov e C reek
Can
a l C
reek
Sout h Fork Al sea River
Lobste r CreekFive Riv ers
Buc
k Cr
eek
Pre
ache
r C
r e
ek
Alsea Basin
Figure 1. Map of the Nestucca and Alsea Basins.
Nestucca Basin

3
We used cumulative redd counts as our metric of spawner abundance. Survey sites were repeatedly walked or floated throughout the spawning season to count redds. Individual redds were marked to avoid being recounted during subsequent surveys. Methods of redd identification are described in Susac and Jacobs (1998). In addition to counting redds, surveyors also counted live adults. When possible, counts of live adults were recorded as adipose fin-clipped or un-clipped. Fin-clip ratios were used to estimate the presence of hatchery fish among natural spawners. All winter steelhead released from coastal hatcheries receive an adipose fin-clip.
RESULTS Spawning Timing
Surveys were initiated in the Nestucca Basin during the first week of January and continued through the end of May. Steelhead spawning activity was observed throughout this four-month period and peaked in mid April (Figure 2). Figure 2 also shows the cumulative percent of steelhead redds observed at weekly intervals. Half of the spawning activity occurred prior to the first week of April and 85% of spawning was complete by the end of April.
1 /1 /0 2 2 /1 /0 2 3 /1 /0 2 4 /1 /0 2 5 /1 /0 2 6 /1 /0 2
Tota
l Red
ds
0
1 0 0
2 0 0
3 0 0
4 0 0
5 0 0
Cum
mul
ativ
e R
edds
(%)
0
2 0
4 0
6 0
8 0
1 0 0
T o ta l R e d d s C u m m a ltiv e R e d d s
1 /1 /0 2 2 /1 /0 2 3 /1 /0 2 4 /1 /0 2 5 /1 /0 2 6 /1 /0 2
Tota
l Red
ds
0
2 0
4 0
6 0
8 0
1 0 0C
umm
ulat
ive
Red
ds (%
)
0
2 0
4 0
6 0
8 0
1 0 0
N e s tu c c a
A ls e a
Figure 2. Number and cumulative frequency of new winter steelhead redds observed each week on random spawning surveys in the Nestucca and Alsea River Basins, 2002.

4
Surveys were initiated in the Alsea Basin during the first week of January and continued through the end of May. Steelhead spawning activity was observed from the week ending January 21 through the last week in April. Two distinct peaks in spawning activity were observed. The first peak occurred during mid-February and the second was in mid-March. Half of the spawning activity occurred prior to the second week of March and 85% of spawning was complete by the first week of April.
Detection of Hatchery Strays
Surveyors observed 597 live adult steelhead during spawning surveys in the Nestucca Basin in 2002. Of these fish, 151 were seen clearly enough to detect the presence or absence of adipose fin-clips. Eight fin-clipped fish (5.0%) were observed. A total of 20 dead steelhead were collected on the spawning grounds. Only one (5.0%) fin-marked adult was found. The rate was similar to the 4.0% observed in 2001 (Susac and Jacobs 2002). These results indicate that most of natural spawning of winter steelhead in the Nestucca Basin is from wild origin adults.
The conclusion that most natural spawners in the Nestucca Basin in 2002 are wild fish is
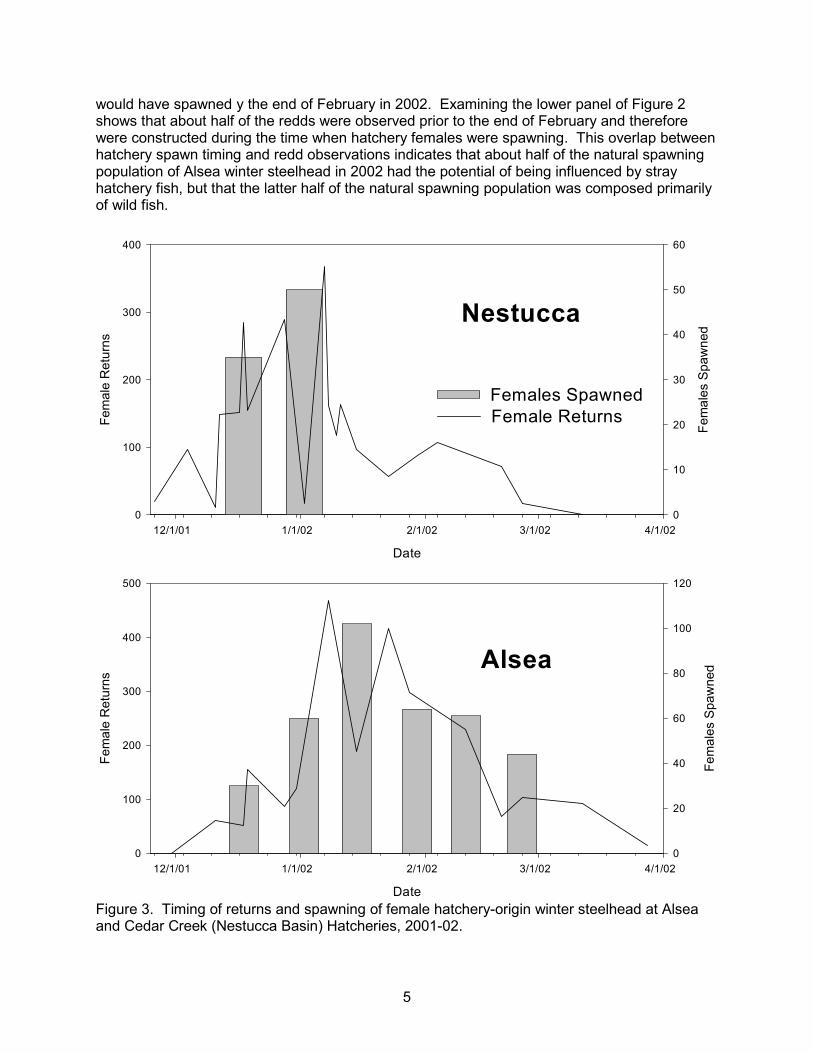
further supported by comparing data obtained from hatchery returns and spawning timing to the timing of redd observations. In 2001-02, returning adult female winter steehead were captured at Cedar Creek Hatchery’s collection facility from late November to the first week of March (Figure 3). Returns peaked in early January, with over 90% of the females returning by the first week of February. Although, at this facility, fish are not spawned throughout the run, the close correspondence between capture and spawn timing (see Figure 3) indicates that returning females are sexually mature and that capture timing generally reflects spawn timing. Given this, it appears that most spawning of hatchery origin winter steelhead is completed by early February. In contrast, in natural spawning areas only about 10% of the redds were observed by early February. Thus, it appears that there are few unspawned hatchery fish available during the time period when most natural spawning of Nestucca winter steelhead occurs.
Surveyors observed 238 live adult steelhead during spawning surveys in the Alsea Basin
in 2002. Of these fish, 55 were seen clearly enough to detect the presence or absence of adipose fin-clips. Four fin-clipped fish (7.3%) were observed. A total of 17 dead steelhead were collected on the spawning grounds. Ten (58.8%) fin-marked adult were found. Nine of the fin-clipped adults were found in the lowest survey segment on Mill Creek that ends at the mouth of Beaty Creek. These carcasses probably originated from Alsea hatchery steelhead carcasses. The carcasses were placed in the lower section of Beaty Creek as part of an environmental enrichment program. Seventy-three hatchery fin-marked carcasses were placed on 12/23/01 and 64 were placed on 2/2/01 (Robert Buckman, Oregon Department of Fish and Wildlife Mid Coast District Biologist, personal communication on 4/11/03). This leaves a total of one non-placed fin-marked carcass and seven unmarked carcasses for a stray rate 12.5% compared with the aforementioned 7.3% for the live observations. These ratios are not significantly different than is expected from random chance (P=0.520).
Unlike in the Nestucca Basin, there was considerable overlap between the spawning
timing of female steelhead returning to Alsea hatchery and the period when redds were observed in the Alsea Basin. Female steelhead returned to Alsea Hatchery during December through mid-March (Figure 3). Spawning took place throughout all but the tail ends of this period, indicating that females entered the hatchery when they were close to sexual maturity. Given this relationship, it is likely that the vast majority of hatchery-origin female steelhead
5
would have spawned y the end of February in 2002. Examining the lower panel of Figure 2 shows that about half of the redds were observed prior to the end of February and therefore were constructed during the time when hatchery females were spawning. This overlap between hatchery spawn timing and redd observations indicates that about half of the natural spawning population of Alsea winter steelhead in 2002 had the potential of being influenced by stray hatchery fish, but that the latter half of the natural spawning population was composed primarily of wild fish.
Date
12/1/01 1/1/02 2/1/02 3/1/02 4/1/02
Fem
ales
Spa
wne
d
0
10
20
30
40
50
60
Fem
ale
Ret
urns
0
100
200
300
400
Date
12/1/01 1/1/02 2/1/02 3/1/02 4/1/02
Fem
ales
Spa
wne
d
0
20
40
60
80
100
120
Fem
ale
Ret
urns
0
100
200
300
400
500
Females Spawned Female Returns
Nestucca
Alsea
Figure 3. Timing of returns and spawning of female hatchery-origin winter steelhead at Alsea and Cedar Creek (Nestucca Basin) Hatcheries, 2001-02.

6
Spawning Distribution
Spawning was well distributed throughout the Nestucca Basin. Redds were observed at 38 of the 40 sites that were surveyed (Figure 4). Of the sites that contained redds, densities ranged from 3 to 342 redds per mile. Redd densities exceeded 20 redds per mile in 29 of the sites surveyed. Redds were observed in all of the mainstem sites that were surveyed. In the mainstem Nestucca River, redds were observed downstream to the mouth of Three Rivers. As with the 2001 surveys, the highest redd densities generally occurred in the upper mainstem areas. Among the tributaries, highest redd densities were observed in East Beaver and Elk Creeks.
Spawning was also distributed throughout the Alsea basin, however a higher portion of
surveys contained few or no redds at all. Redds were observed in 17 of the 23 tributary sites and 11 of the 22 large water sites (Figure 5). Of the tributary sites that contained redds, density ranged from 2 to 38 redds per mile and averaged 13 redds per mile. For the large water surveys, densities raged from 0.7 to 64 redds per mile and averaged 8 redds per mile. Redd densities exceeded 10 redds per mile in 16 of the 45 sites surveyed. Highest redd densities occurred in Drift Creek Subbasin.
Redd Abundance
Overall, we conducted 40 surveys to estimate redd abundance in the Nestucca River Basin (Table 1). This sample size equated to an overall sampling rate of 20% of the sampling frame. Summary statistics for individual survey sites are listed in Appendix Table A-1. We estimated a total of 10,723 winter steelhead redds. The 95% confidence interval was within + 20% and met our target level for the precision for the estimate. Redd abundance was higher in the tributary stratum than in the mainstem stratum. In the Alsea Basin, we conducted 45 surveys to estimate redd abundance (Table 1). We sampled roughly 10% of the tributary spawning habitat and 25% of the mainstem or large water habitat. Summary statistics for individual survey sites are listed in Appendix Table A-2. We estimated a total of 3,058 winter steelhead redds for the Alsea River Basin in 2002. The 95% confidence interval of + 28% met our target level for precision. The vast majority of redds occurred in the tributary stratum.

7
Elk CreekBear Creek
East Be aver
Creek
Moo
n Cree k
Nes
tucc a
River
Testament Cre e k
Hor
n C
reek
Pow der C
r eek
Three Rivers
Buela
h Cr
eek
Clear Cree k
Bea
r C
reek
L it tle Nestucca Riv er
#S
#S
#S
#S#S
r
#S#S
#S
#S#S
#S
#S
#S#S#S
#S#S
#S #S#S#S
#S
#S
#S
#S#S#S
#S#S
#S
#S
#S
#Sr
#S#S#S#S
10 0 10 MilesStreamsSpawning Distribution
Redd Density (Redds / Mile)r 0#S 0.1 - 5#S 6 - 10#S 11 - 20#S 21 - 50#S 51 - 80#S 81 - 150
#S 151 - 200
N
EW
S
Figure 4. Density of winter steelhead redds observed at randomly selected survey sites in the Nestucca Basin, 2002.

8
#S#S#S
#S
#S #S
r
#S
r
r
rr
#S
r
r#S
#S
#S
#S
#Sr
#S
#S#S
#S#S
r rr
r#S
#S
r
#S#S
r
r
#S#S
r
#S
#S#S
r
Horse Creek
Go
ld C
reek
N orth
For k
Alsea
River
Drift C
reek
Sli ck Cr eek
Fall Cree
k
Alsea River
Ec kman C
reek
Croo
k ed
Cree
k
Alse a River Honey Grove Cr eek
Cana
l Cre
ek
Sout h Fork Al sea River
Lobste r Cree kFive R
ivers
Buck
C
r e ek
Prea
cher
Creek
10 0 10 MilesStreamsSpawning Distribution
Redd Density r 0#S 0.1 - 5#S 6 - 10#S 11 - 20#S 21 - 50#S 51 - 80
N
EW
S
Figure 5. Density of winter steelhead redds observed at randomly selected survey sites in the Alsea Basin, 2002.

9
Table 1. Estimates of winter steelhead redd abundance in the Nestucca and Alsea River Basins, 2002. Estimates are derived from counts on randomly selected spawning surveys.
Survey Effort Redds
Stratum Spawning
Miles N Miles Estimate 95% Confidence
Interval
Nestucca Basin
Tributaries 163 19 19.8 7,994 1,860 Mainstem 47 21 22.2 2,729 959 Total 210 40 42.0 10,723 2,093
Alsea Basin
Tributaries 239 23 21.9 3,250 1,141 Mainstem 85 22 23.3 666 321 Total 324 45 45.2 3,917 1,185
DISCUSSION
Redd counts can be used to approximate the size of the spawning run in the Nestucca and Alsea Basins. The accuracy of these estimates is dependent on the suitability of applying redd-to-adult relationships observed at calibration sites in other coastal basins to the redd counts in the Nestucca and Alsea Basins. The accuracy of these run-size estimates is also dependent on the reliability of using redd counts as a measure of spawning escapement. We have been evaluating the relationship between redd counts and winter steelhead spawner abundance over the last five years and have found a significant correlation (Jacobs et al. 2002). The relationship between adult abundance and redd counts (Figure 6) is strong (R2=0.97, P< 0.001), suggesting that redd counts are a good indicator of run-size over a range of runs sizes from 35 to 2,131 fish.
Applying the relationship displayed in Figure 6 to our estimates of redd abundance yields
resulting estimates of 11,500 and 4,200 naturally spawning steelhead in the Nestucca and Alsea Basins for 2002, respectively. Removing the portions of these runs that spawn during the same period when hatchery fish are being spawned can be used to make a conservative estimate of the portion of these populations that are derived from natural production. As stated on page 6, roughly 90% and 50% of the redds occurred after the completion of spawning by hatchery fish in the Nestucca and Alsea Basins, respectively. Applying these proportions yields 10,400 natural adult steelhead spawners in the Nestucca Basin and 2,100 in the Alsea Basin. These estimates of natural production assume that all redds observed during the period when hatchery fish spawn were constructed by hatchery-produced females. However, observations of fin-marks on live spawners near redds indicate that naturally produced fish also spawn during this time period. Thus, the true estimate of natural produced spawners for each basin probably lies somewhere between the estimates of total abundance and the adjusted values.

10
y = 1.068x + 61.824R2 = 0.97p<0.001
0
500
1000
1500
2000
2500
0 500 1000 1500 2000Redds Observed
Adu
lt St
eelh
ead
Figure 6. Relationships between adult winter steelhead abundance and redd counts above Oregon coastal calibration sites in 1998, 1999, 2000, 2001 and 2002.
Employing the same procedure described above to the number of redds estimated in the
Nestucca Basin in 2001 (Susac and Jacobs 2002) yields a population estimate of 8,000 adult spawners. Like 2002, we felt that few hatchery fish contributed to the magnitude of this estimate because of the late timing that redds were observed and because few fin marked spawners were observed.
Results from our sampling in 2002 indicate that the Nestucca Basin was more productive
than the Alsea Basin. Redd densities in the Nestucca Basin averaged over four times higher than those in the Alsea Basin. This comparison is based on the estimated number of total redds in each basin. This disparity in spawner density between the two river systems would even be greater if redd estimates were adjusted to remove hatchery-origin spawners. Possible reasons for the higher productivity of the Nestucca Basin may include better freshwater rearing habitat or better near-shore marine survival.
Wild broodstock collection records indicate that in 2002, 77 wild adult steelhead were
captured to use as broodstock in the Nestucca Basin and that 42 wild adult steelhead were used for broodstock in the Alsea Basin. Relative to our conservative estimates of wild spawner abundance in each basin, broodstock collections comprised less than 3% of each population. At this rate, these programs had insignificant impacts on natural seeding.
Care must be used in interpreting population status from a limited time series of data.
Little data exist on long-term variation in run-size for Oregon Coastal winter steelhead, however long-term data are available from counts at Willamette Falls and at Winchester Dam on the North Umpqua River. Figure 7 shows the counts at these sites expressed as proportions of the

11
long-term (1950-2001) average. In both river basins, returns in 2002 were well above average. If the underlying natural factors influencing the overall abundance of Nestucca and Alsea River natural winter steelhead are similar to those in the Willamette and North Umpqua Rivers, then returns in 2002 should be viewed as above average relative to long-term abundances. Given the high degree of interannual variability that is present in these populations, status would be best determined over at least one brood cycle (4-5 years).
-
100
200
300
50 54 58 62 66 70 74 78 82 86 90 94 98 02
Perc
ent o
f lon
g te
rm a
vera
ge
WillametteN.Umpqua
Figure 7. Annual passage counts of winter steelhead at Willamette Falls, Willamette River and Winchester Dam, North Umpqua River expressed as proportion of long-term average, 1950-2002.
ACKNOWLEDGEMENTS We would like to thank field biologists Jeff Johnson and Dave Stewart who conducted the spawning surveys in the Nestucca Basin, and Eric Brown and Dave Herring for conducting the spawning surveys in the Alsea Basin. This report would not be possible without their diligence and hard work. Tom Nickelson provided expert administrative and editorial assistance.

12
REFERENCES Jacobs, S.E. and T.E. Nickelson. 1998. Use of Stratified Random Sampling to Estimate the
Abundance of Oregon Coastal Coho Salmon. Oregon Department of Fish and Wildlife, Final Reports (Fish) Project # F-145-R-09, Portland.
Jacobs S., J. Firman, G. Susac, E. Brown, B. Riggers and K. Tempel 2000. Status of Oregon
coastal stocks of anadromous salmonids. Monitoring Program Report Number OPSW-ODFW-2000-3, Oregon Department of Fish and Wildlife, Portland, Oregon.
Jacobs S., J. Firman, and G. Susac 2001. Status of Oregon coastal stocks of anadromous
salmonids, 1999-2000; Monitoring Program Report Number OPSW-ODFW-2001-3, Oregon Department of Fish and Wildlife, Portland, Oregon
Jacobs S., J. Firman, G. Susac, D. Stewart and J. Weybright 2002. Status of Oregon coastal
stocks of anadromous salmonids, 2000-2001 and 2001-2002; Monitoring Program Report Number OPSW-ODFW-2002-3, Oregon Department of Fish and Wildlife, Portland, Oregon
Stevens, D.L. 2002. Sampling design and statistical analysis methods for integrated biological
and physical monitoring of Oregon streams. OPSW-ODFW-2002-07, Oregon Department of Fish and Wildlife, Portland, Oregon
Susac, G.L., and S.E. Jacobs. 1998. Evaluation of Spawning Ground Surveys for Indexing the
Abundance of Adult Winter Steelhead in Oregon Coastal Basins. Annual Progress Report , Oregon Department of Fish and Wildlife, Portland, Oregon.
Susac, G.L., and S.E. Jacobs. 2001. Assessment of the status of Nestucca winter steelhead.
Annual Progress Report, Oregon Department of Fish and Wildlife, Portland, OR. Report available at http://osu.orst.edu/Dept/ODFW/spawn/index.htm
13
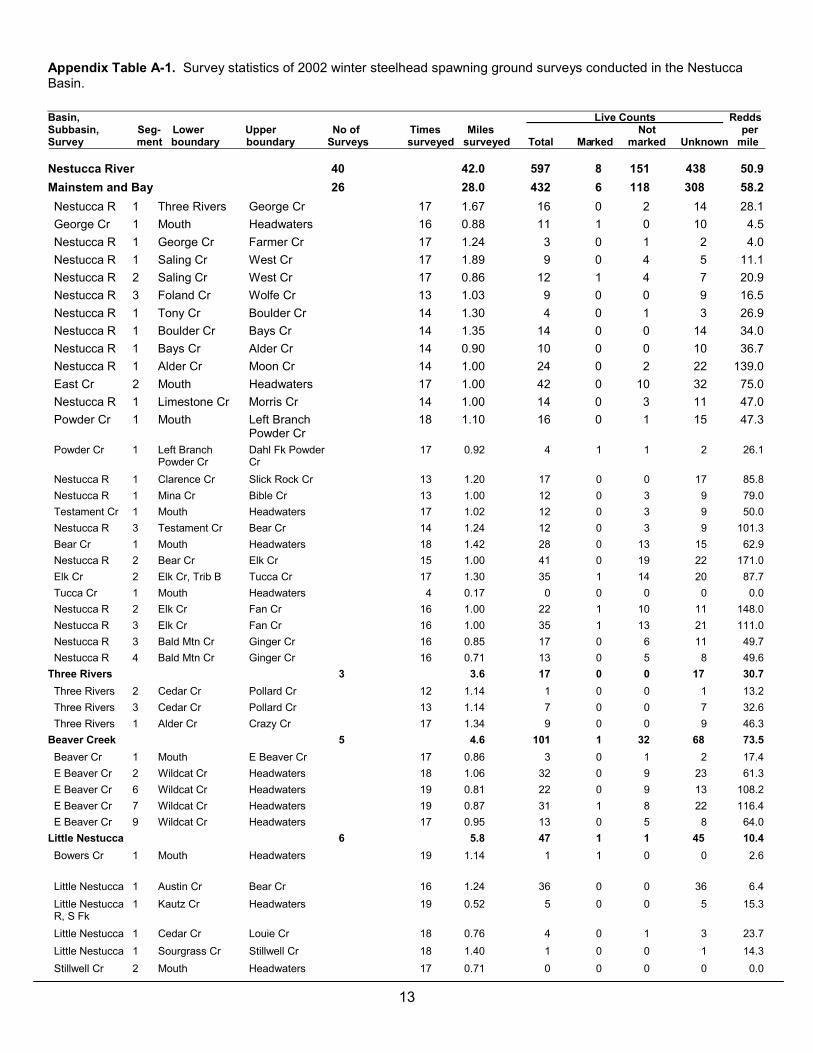
Appendix Table A-1. Survey statistics of 2002 winter steelhead spawning ground surveys conducted in the Nestucca Basin.
Basin, Live Counts Redds Subbasin, Seg- Lower Upper No of Times Miles Not per Survey ment boundary boundary Surveys surveyed surveyed Total Marked marked Unknown mile
Nestucca River 40 42.0 597 8 151 438 50.9 Mainstem and Bay 26 28.0 432 6 118 308 58.2 Nestucca R 1 Three Rivers George Cr 17 1.67 16 0 2 14 28.1 George Cr 1 Mouth Headwaters 16 0.88 11 1 0 10 4.5 Nestucca R 1 George Cr Farmer Cr 17 1.24 3 0 1 2 4.0 Nestucca R 1 Saling Cr West Cr 17 1.89 9 0 4 5 11.1 Nestucca R 2 Saling Cr West Cr 17 0.86 12 1 4 7 20.9 Nestucca R 3 Foland Cr Wolfe Cr 13 1.03 9 0 0 9 16.5 Nestucca R 1 Tony Cr Boulder Cr 14 1.30 4 0 1 3 26.9 Nestucca R 1 Boulder Cr Bays Cr 14 1.35 14 0 0 14 34.0 Nestucca R 1 Bays Cr Alder Cr 14 0.90 10 0 0 10 36.7 Nestucca R 1 Alder Cr Moon Cr 14 1.00 24 0 2 22 139.0 East Cr 2 Mouth Headwaters 17 1.00 42 0 10 32 75.0 Nestucca R 1 Limestone Cr Morris Cr 14 1.00 14 0 3 11 47.0 Powder Cr 1 Mouth Left Branch 18 1.10 16 0 1 15 47.3 Powder Cr Powder Cr 1 Left Branch Dahl Fk Powder 17 0.92 4 1 1 2 26.1 Powder Cr Cr Nestucca R 1 Clarence Cr Slick Rock Cr 13 1.20 17 0 0 17 85.8 Nestucca R 1 Mina Cr Bible Cr 13 1.00 12 0 3 9 79.0 Testament Cr 1 Mouth Headwaters 17 1.02 12 0 3 9 50.0 Nestucca R 3 Testament Cr Bear Cr 14 1.24 12 0 3 9 101.3 Bear Cr 1 Mouth Headwaters 18 1.42 28 0 13 15 62.9 Nestucca R 2 Bear Cr Elk Cr 15 1.00 41 0 19 22 171.0 Elk Cr 2 Elk Cr, Trib B Tucca Cr 17 1.30 35 1 14 20 87.7 Tucca Cr 1 Mouth Headwaters 4 0.17 0 0 0 0 0.0 Nestucca R 2 Elk Cr Fan Cr 16 1.00 22 1 10 11 148.0 Nestucca R 3 Elk Cr Fan Cr 16 1.00 35 1 13 21 111.0 Nestucca R 3 Bald Mtn Cr Ginger Cr 16 0.85 17 0 6 11 49.7 Nestucca R 4 Bald Mtn Cr Ginger Cr 16 0.71 13 0 5 8 49.6 Three Rivers 3 3.6 17 0 0 17 30.7 Three Rivers 2 Cedar Cr Pollard Cr 12 1.14 1 0 0 1 13.2 Three Rivers 3 Cedar Cr Pollard Cr 13 1.14 7 0 0 7 32.6 Three Rivers 1 Alder Cr Crazy Cr 17 1.34 9 0 0 9 46.3 Beaver Creek 5 4.6 101 1 32 68 73.5 Beaver Cr 1 Mouth E Beaver Cr 17 0.86 3 0 1 2 17.4 E Beaver Cr 2 Wildcat Cr Headwaters 18 1.06 32 0 9 23 61.3 E Beaver Cr 6 Wildcat Cr Headwaters 19 0.81 22 0 9 13 108.2 E Beaver Cr 7 Wildcat Cr Headwaters 19 0.87 31 1 8 22 116.4 E Beaver Cr 9 Wildcat Cr Headwaters 17 0.95 13 0 5 8 64.0 Little Nestucca 6 5.8 47 1 1 45 10.4 Bowers Cr 1 Mouth Headwaters 19 1.14 1 1 0 0 2.6 Little Nestucca 1 Austin Cr Bear Cr 16 1.24 36 0 0 36 6.4 Little Nestucca 1 Kautz Cr Headwaters 19 0.52 5 0 0 5 15.3 R, S Fk Little Nestucca 1 Cedar Cr Louie Cr 18 0.76 4 0 1 3 23.7 Little Nestucca 1 Sourgrass Cr Stillwell Cr 18 1.40 1 0 0 1 14.3 Stillwell Cr 2 Mouth Headwaters 17 0.71 0 0 0 0 0.0

14
Appendix Table A-2. Survey statistics of 2002 winter steelhead spawning ground surveys conducted in the Alsea Basin.
Basin, Live Counts Redds Subbasin, Seg- Lower Upper No of Times Miles Not per Survey ment boundary boundary Surveys surveyed surveyed Total Marked marked Unknown mile
Alsea River 45 45.2 238 4 51 183 10.7 Mainstem And Bay 19 18.1 48 1 15 32 3.8 Southworth Cr 1 Mouth Headwaters 9 1.14 6 0 3 3 4.4 Sudan Cr 1 Mouth Oxstable Cr 10 0.38 0 0 0 0 18.2 Bear Cr 2 Mouth Headwaters 8 1.14 2 0 2 0 0.0 Skinner Cr 1 Mouth Headwaters 9 0.81 2 0 1 1 4.9 Alsea R 2 Mill Cr Hatchery Cr 1 1.20 0 0 0 0 0.0 Hatchery Cr 1 Mouth Headwaters 9 0.49 1 0 0 1 0.0 Alsea R 1 Slide Cr Scott Cr 11 0.70 2 0 0 2 0.0 Alsea R 3 Scott Cr Brush Cr 11 0.85 5 0 0 5 0.0 Grass Cr 2 Mouth Grass Cr, 16 1.03 8 0 2 6 16.5 Meadow Fk Alsea R 1 Five Rivers Cedar Cr 10 1.40 2 0 0 2 0.0 Cow Cr 1 Mouth Headwaters 14 0.81 0 0 0 0 0.0 Alsea R 1 Cow Cr Fall Cr 11 0.81 1 0 0 1 0.0 Alsea R 1 Digger Cr Benner Cr 11 1.00 2 0 1 1 0.0 Alsea R 2 Digger Cr Benner Cr 11 1.40 0 0 0 0 0.7 Alsea R 3 Benner Cr Sulmon Cr 11 1.30 0 0 0 0 1.5 Alsea R 1 Narrow Cr Schoolhouse Cr 11 1.40 2 0 0 2 0.0 Mill Cr 1 Mouth Beaty Cr 16 0.69 2 0 0 2 13.0 Mill Cr 1 Beaty Cr Forks 16 1.40 13 1 6 6 12.9 Alsea R 2 Mill Cr Roberts Cr 8 0.20 0 0 0 0 0.0 Drift Creek 4 5.5 76 0 9 67 40.2 Drift Cr 1 Ellen Cr Cougar Cr 14 1.60 22 0 1 21 53.7 Drift Cr 1 Cougar Cr Boulder Cr 14 1.80 28 0 5 23 36.1 Drift Cr 2 Boulder Cr Slickrock Cr 14 1.00 24 0 1 23 64.0 Horse Cr 1 Deer Cr Headwaters 13 1.15 2 0 2 0 7.0 Five Rivers 14 14.6 73 2 20 51 11.9 Five Rivers 1 Elk Cr Lobster Cr 12 1.30 3 0 0 3 0.0 Lobster Cr 1 Taylor Cr Crooked Cr 15 0.50 0 0 0 0 0.0 Lobster Cr 2 Camp Cr Wilkinson Cr 15 1.10 6 0 0 6 4.5 Little Lobster Cr 2 Mouth Briar Cr 16 1.59 1 0 0 1 1.9 Lobster Cr 1 Preacher Cr Trib S, Lobster 14 1.11 0 0 0 0 6.3 Lobster Cr 2 Bear Cr Lobster Cr, E Fk 18 1.30 23 0 5 18 36.9 Five Rivers 1 Cascade Cr Cherry Cr 14 1.40 0 0 0 0 0.7 Five Rivers 2 Cascade Cr Cherry Cr 14 1.40 5 0 0 5 0.0 Buck Cr 2 Wilson Cr Bear Cr 9 0.60 3 1 1 1 18.4 Buck Cr 3 Bear Cr Trib A 10 1.03 5 0 0 5 17.5 Buck Cr 1 Trib A Headwaters 10 0.49 4 0 2 2 10.2 Five Rivers 1 Alder Cr Crazy Cr 13 1.00 2 0 0 2 5.0 Green R 1 Green R, E Fk Headwaters 16 1.02 8 0 6 2 26.5 Five Rivers 2 Summers Cr Lord Cr 17 0.75 13 1 6 6 38.7 North Fork 3 2.7 38 1 6 31 21.6 Hayden Cr 1 Mouth Headwaters 15 1.12 0 0 0 0 0.0 Crooked Cr 2 Baker Cr Ernest Cr 16 0.44 9 1 2 6 29.5 Crooked Cr 1 Ernest Cr Zahn Cr 16 1.14 29 0 4 25 35.2 South Fork 5 4.2 3 0 1 2 3.3 Swamp Cr 1 Swamp Cr, E Fk Headwaters 16 0.92 0 0 0 0 0.0 Alsea R, S Fk 1 Bummer Cr Headrick Cr 11 0.50 1 0 0 1 4.0 Alsea R, S Fk 1 Rock Cr Blackberry Cr 10 0.30 0 0 0 0 10.0 Alsea R, S Fk 1 Blackberry Cr Trout Cr 10 1.10 2 0 1 1 2.7 Trout Cr 2 Mouth Headwaters 8 1.35 0 0 0 0 0.0