assessment of the torsion effect on buildings under ... · pdf fileassessment of the torsion...
TRANSCRIPT
583 Dr. Dushyanth Veerendra Babu, Dr. Babitha Rani.H, Pavan Siva Kumar.Ch.
International Journal of Engineering Technology Science and ResearchIJETSR
www.ijetsr.comISSN 2394 – 3386Volume 4, Issue 9
September 2017
Assessment of the Torsion Effect on Buildings under LateralSeismic Ground Motion.
Dr. Dushyanth Veerendra Babu, Dr. Babitha Rani.H, Pavan Siva Kumar.Ch.Department of Civil Engineering, SET, Jain University, India.
ABSTRACTReinforced concrete framed buildings are adequate for resisting both the vertical and horizontal loads acting on them.However, when the buildings are in either ’C’ or ‘L’ or ‘V’ etc., shapes the torsion develops in the building which doesnot contribute to the safety of buildings during the earthquakes. These practical difficulties call for introduction of shearwalls. In this paper, we are discussing about the appropriate location for shear wall to reduce the Torsion forces. It isworth noting that the severe damage occurred during the Michoacán Earthquake, Mexico, 1985, showed the importanceof torsional effects and pointed out the need to understand the problem and improve the design requirements [1].
Observation of damage after earthquakes has shown that torsional vibration of buildings, induced by lateralseismic ground motion, may cause serious distress in a structure, sometimes leading to its collapse. Most seismic codesinclude provisions for design against seismic torsion. The code provisions are specified in terms of design eccentricitiesthat depend on the relative stiffness of the lateral load-resisting elements. Also, the allocation of strength among thelateral load-resisting elements is related to the stiffness of such elements. The current practice is to determine thestiffness of an element from its given geometry. Recent studies have, however, shown that in reinforced concretestructures, the stiffness does not depend on geometry alone, but is strongly related to the strength of the element.Consequently, the conventional method of design of concrete structures for seismic torsion in which the stiffness of anelement is considered as being independent of strength needs to be reviewed.
INTRODUCTIONShear walls in plan, may be deep straight walls or angular, U-shaped or box shaped in plan, around stairs orlifts or toilets, where there will be no architectural difficulty in extending them throughout the height of thebuilding. It is worth noting that the severe damage occurred during the Michoacán Earthquake, Mexico, 1985,showed the importance of torsional effects and pointed out the need to understand the problem and improvethe design requirements [1].
Care shall be taken to have a symmetrical configuration of plan in walls should get enough vertical load fromfloors, for which reason, nearby columns should be omitted and load taken to the shear walls by means longspan beams if required. In the last four decades, numerous researchers have conducted extensive studies toinvestigate the torsional response of asymmetric buildings considering elastic and inelastic behavior [2].Despite this effort, design provisions include in most of the seismic codes [3] In the last decade, there hasbeen a renovated interest in the evaluation of the torsional effect in building subjected to earthquakes based onthe need to revise and improve torsional provisions [4, 5]. Paulay [6, 7, 8, 9] Crisafulli and Formica [10]conducted a large parametric study in which simple asymmetric buildings where analyzed using static linearanalysis and applying usual torsional provisions included in seismic codes.In a number of building structures, the center of rigidity does not coincide with the center of mass. As aconsequence, during an earthquake, lateral base motion induces torsional vibrations in the structure.Furthermore, an increase of the final strength eccentricity was observed in some cases, which is obviously anunfavorable condition. Other researchers have continued the investigation of this topic [11, 12, 13].
BASE SHEARS & ADDITIONAL FORCES DUE TO TORSIONStatic and Dynamic Properties of the building:Building DescriptionThe proposed construction to be carried out as a L-Shaped IT building consisting of G+4 floors. The structureis planned to be reinforced concrete1

584 Dr. Dushyanth Veerendra Babu, Dr. Babitha Rani.H, Pavan Siva Kumar.Ch.
International Journal of Engineering Technology Science and ResearchIJETSR
www.ijetsr.comISSN 2394 – 3386Volume 4, Issue 9
September 2017
Structural ModelingThe superstructure will be modeled using standard software, E-Tabs as a space frame with a grid of columnsin the vertical direction, interconnected with beam members in the orthogonal directions at each floor level.The nodes (the meeting points of beams with beams and beams with columns) will be treated as rigid jointsdue to monolithic construction. The end nodes at the bottom of the model will be modeled as fixed supportsdue to rigid connection of the columns with footings at the foundation level. The columns will also beinterconnected at the plinth beams to increase the stability of the structure, wherever necessary. All slabs aremodeled as membrane/shell elements wherever necessary.
Geometry of the BuildingMinimum width of column (least lateral dimension) : 300mm
Minimum width of main beams : 300mm
Column pedestal will be provided as per the design requirement.
Design LoadsService Loads
The following service loads are expected to act on the structure during its intended life and they areconsidered as follows with reference to relevant codes1) Dead Loads [as per IS 1875 (part-1) 1987]
Dead loads of all the materials used in the construction will be considered as follows:i) Reinforced concrete members 25 KN/m3
(Slabs, beams and columns)ii) Plain concrete members 24 KN/m3iii) Brick walls with solid Fly Ash Bricks 22 KN/m3iv) Floor finishes (on an average;
Could vary depending on actual flooring) 1.5 KN/m3v) Roof finishes (on an average;
Could vary depending on actual finishes) 2.5 KN/m3vi) Built in partitions 1.0 KN/m3vii) Others (as required)2) Imposed loads [as per IS 875 (part-2)-1987]Refer Annexure-A for details of Imposed loads at different levels as per occupancy requirements)3) Earthquake loads [as per IS 1893 (part-1)-2002]
Refer Annexure- A for details
3.2 Application of the loads on the modelThe dead loads of all the reinforced concrete members will be given as self-weights of the members; all thefloor loads expressed as load per square area will be applied as distributed floor loads onto the supportingbeams as per Clause 24.5 of IS 456: 2000, all wall loads will be applied as uniformly distributed load per unitlength onto the supporting beams; the wind and earthquake loads will be applied as lateral loads at each floorlevel.
3.3 Design loads and Load combinationsTaking into consideration the probability of various loads acting together during the construction stage andafter occupation, and their severity in the internal stresses and deformations, the structure will be analyzed.As per Clause 18.2.1 of IS 456; 2000 the Limit state method of design will be followed for the design of allthe structural members. As per this method, the design loads will be arrived at using partial safety factors forvarious load combinations as per table 18 of IS 456: 2000
585 Dr. Dushyanth Veerendra Babu, Dr. Babitha Rani.H, Pavan Siva Kumar.Ch.
International Journal of Engineering Technology Science and ResearchIJETSR
www.ijetsr.comISSN 2394 – 3386Volume 4, Issue 9
September 2017
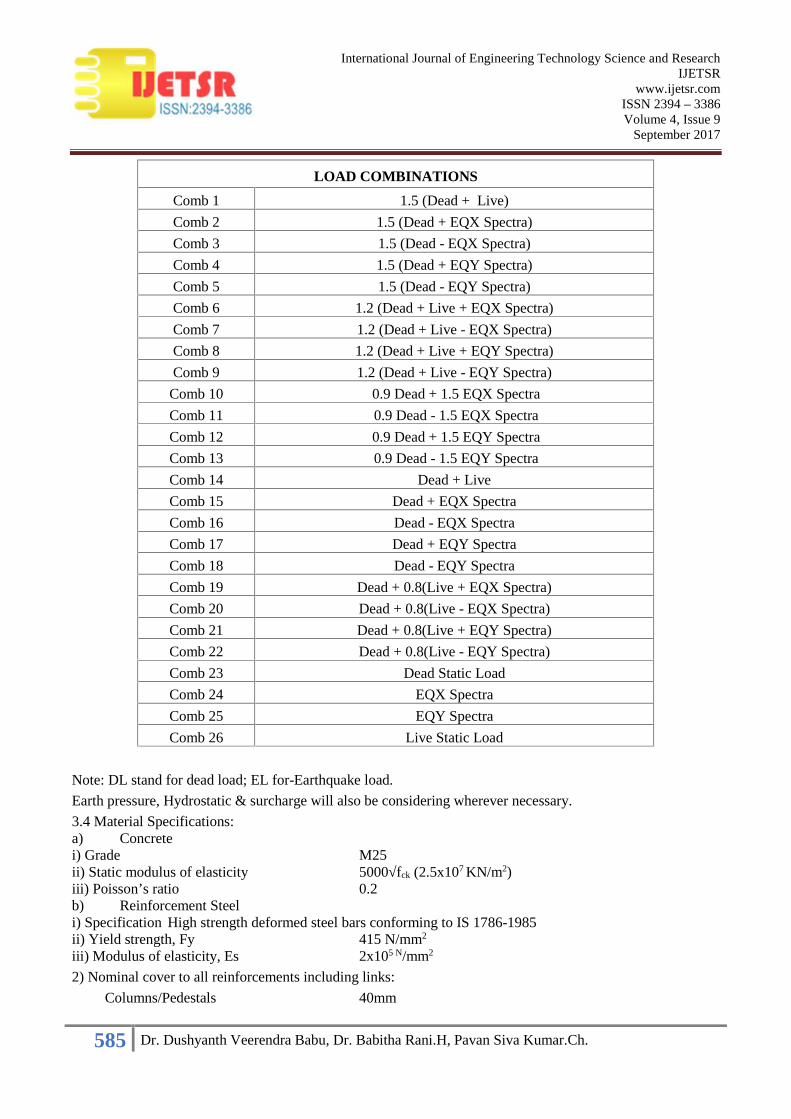
LOAD COMBINATIONS
Comb 1 1.5 (Dead + Live)
Comb 2 1.5 (Dead + EQX Spectra)
Comb 3 1.5 (Dead - EQX Spectra)
Comb 4 1.5 (Dead + EQY Spectra)
Comb 5 1.5 (Dead - EQY Spectra)
Comb 6 1.2 (Dead + Live + EQX Spectra)
Comb 7 1.2 (Dead + Live - EQX Spectra)
Comb 8 1.2 (Dead + Live + EQY Spectra)
Comb 9 1.2 (Dead + Live - EQY Spectra)
Comb 10 0.9 Dead + 1.5 EQX Spectra
Comb 11 0.9 Dead - 1.5 EQX Spectra
Comb 12 0.9 Dead + 1.5 EQY Spectra
Comb 13 0.9 Dead - 1.5 EQY Spectra
Comb 14 Dead + Live
Comb 15 Dead + EQX Spectra
Comb 16 Dead - EQX Spectra
Comb 17 Dead + EQY Spectra
Comb 18 Dead - EQY Spectra
Comb 19 Dead + 0.8(Live + EQX Spectra)
Comb 20 Dead + 0.8(Live - EQX Spectra)
Comb 21 Dead + 0.8(Live + EQY Spectra)
Comb 22 Dead + 0.8(Live - EQY Spectra)
Comb 23 Dead Static Load
Comb 24 EQX Spectra
Comb 25 EQY Spectra
Comb 26 Live Static Load
Note: DL stand for dead load; EL for-Earthquake load.
Earth pressure, Hydrostatic & surcharge will also be considering wherever necessary.
3.4 Material Specifications:a) Concretei) Grade M25ii) Static modulus of elasticity 5000√fck (2.5x10⁷ KN/m2)iii) Poisson’s ratio 0.2b) Reinforcement Steeli) Specification High strength deformed steel bars conforming to IS 1786-1985ii) Yield strength, Fy 415 N/mm2
iii) Modulus of elasticity, Es 2x10⁵ N/mm2
2) Nominal cover to all reinforcements including links:
Columns/Pedestals 40mm
586 Dr. Dushyanth Veerendra Babu, Dr. Babitha Rani.H, Pavan Siva Kumar.Ch.
International Journal of Engineering Technology Science and ResearchIJETSR
www.ijetsr.comISSN 2394 – 3386Volume 4, Issue 9
September 2017
Beams 30mm
Floor and roof slabs 25mm
RC walls 25mm
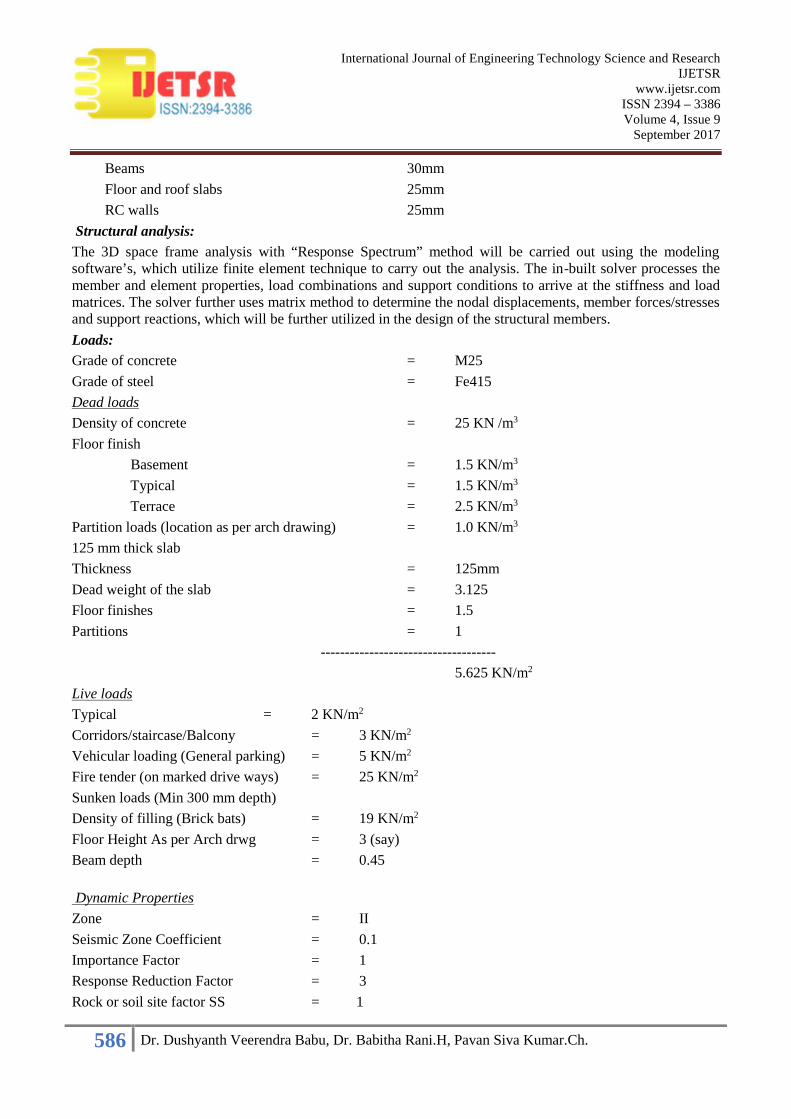
Structural analysis:The 3D space frame analysis with “Response Spectrum” method will be carried out using the modelingsoftware’s, which utilize finite element technique to carry out the analysis. The in-built solver processes themember and element properties, load combinations and support conditions to arrive at the stiffness and loadmatrices. The solver further uses matrix method to determine the nodal displacements, member forces/stressesand support reactions, which will be further utilized in the design of the structural members.
Loads:Grade of concrete = M25
Grade of steel = Fe415
Dead loads
Density of concrete = 25 KN /m3
Floor finish
Basement = 1.5 KN/m3
Typical = 1.5 KN/m3
Terrace = 2.5 KN/m3
Partition loads (location as per arch drawing) = 1.0 KN/m3
125 mm thick slab
Thickness = 125mm
Dead weight of the slab = 3.125
Floor finishes = 1.5
Partitions = 1
------------------------------------
5.625 KN/m2
Live loads
Typical = 2 KN/m2
Corridors/staircase/Balcony = 3 KN/m2
Vehicular loading (General parking) = 5 KN/m2
Fire tender (on marked drive ways) = 25 KN/m2
Sunken loads (Min 300 mm depth)
Density of filling (Brick bats) = 19 KN/m2
Floor Height As per Arch drwg = 3 (say)
Beam depth = 0.45
Dynamic Properties
Zone = II
Seismic Zone Coefficient = 0.1
Importance Factor = 1
Response Reduction Factor = 3
Rock or soil site factor SS = 1
587 Dr. Dushyanth Veerendra Babu, Dr. Babitha Rani.H, Pavan Siva Kumar.Ch.
International Journal of Engineering Technology Science and ResearchIJETSR
www.ijetsr.comISSN 2394 – 3386Volume 4, Issue 9
September 2017
Type of structure ST = 1
Damping ratio = 0.05
Time period =Calculate Optional time period of structure in X-direction
Height of the building = h= ly = 15 m
Fundamental Natural period Ta = 0.075h0.75
Stair case loads
Floor finishes = 1.5 KN/m3
Live load = 3 KN/m3
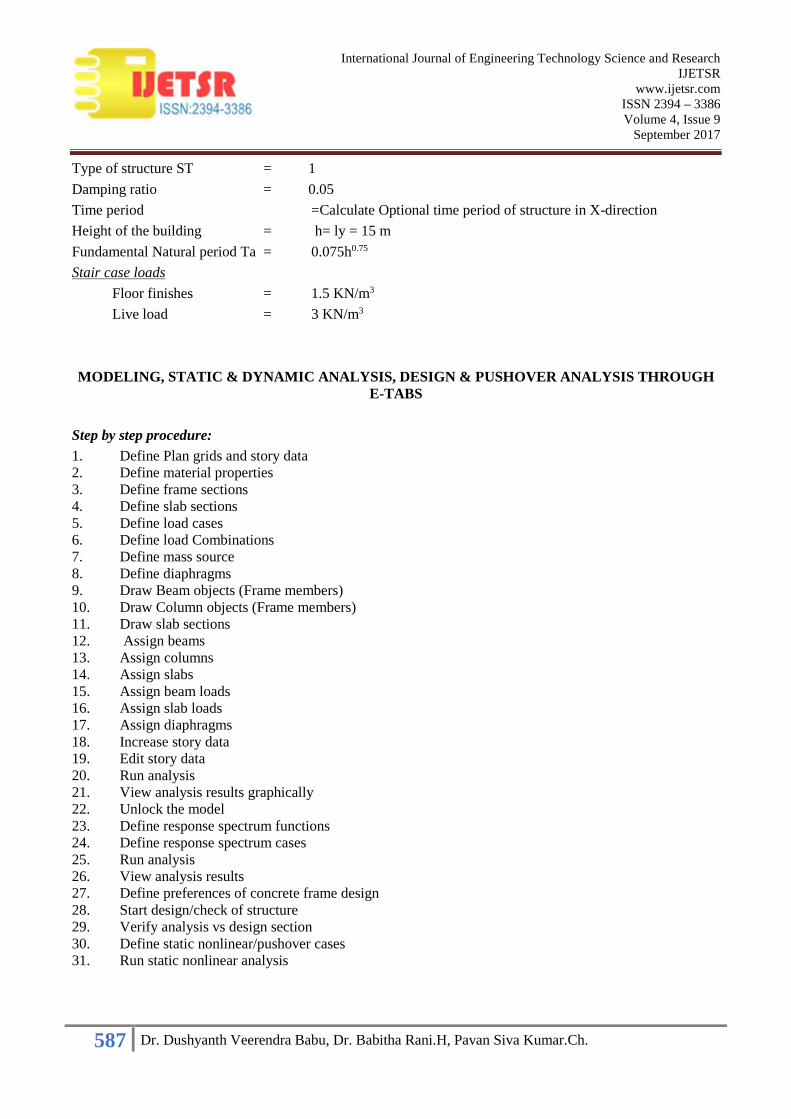
MODELING, STATIC & DYNAMIC ANALYSIS, DESIGN & PUSHOVER ANALYSIS THROUGHE-TABS
Step by step procedure:1. Define Plan grids and story data2. Define material properties3. Define frame sections4. Define slab sections5. Define load cases6. Define load Combinations7. Define mass source8. Define diaphragms9. Draw Beam objects (Frame members)10. Draw Column objects (Frame members)11. Draw slab sections12. Assign beams13. Assign columns14. Assign slabs15. Assign beam loads16. Assign slab loads17. Assign diaphragms18. Increase story data19. Edit story data20. Run analysis21. View analysis results graphically22. Unlock the model23. Define response spectrum functions24. Define response spectrum cases25. Run analysis26. View analysis results27. Define preferences of concrete frame design28. Start design/check of structure29. Verify analysis vs design section30. Define static nonlinear/pushover cases31. Run static nonlinear analysis
588 Dr. Dushyanth Veerendra Babu, Dr. Babitha Rani.H, Pavan Siva Kumar.Ch.
International Journal of Engineering Technology Science and ResearchIJETSR
www.ijetsr.comISSN 2394 – 3386Volume 4, Issue 9
September 2017
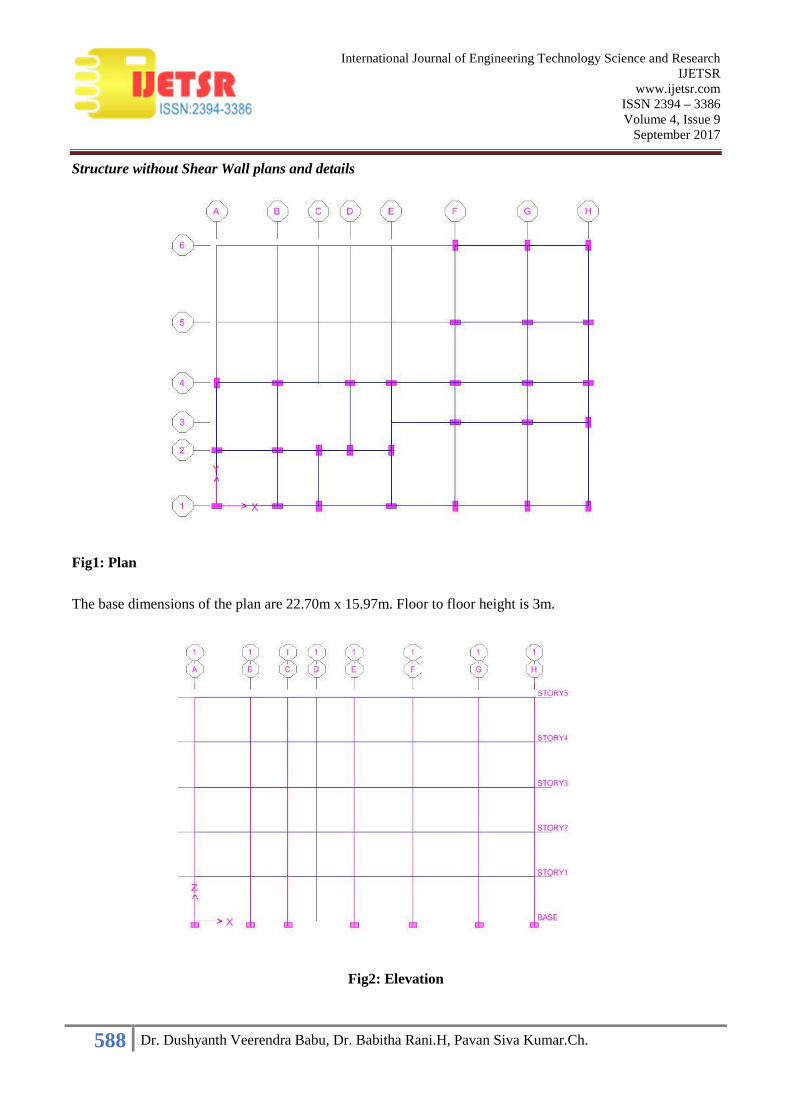
Structure without Shear Wall plans and details
Fig1: Plan
The base dimensions of the plan are 22.70m x 15.97m. Floor to floor height is 3m.
Fig2: Elevation
589 Dr. Dushyanth Veerendra Babu, Dr. Babitha Rani.H, Pavan Siva Kumar.Ch.
International Journal of Engineering Technology Science and ResearchIJETSR
www.ijetsr.comISSN 2394 – 3386Volume 4, Issue 9
September 2017
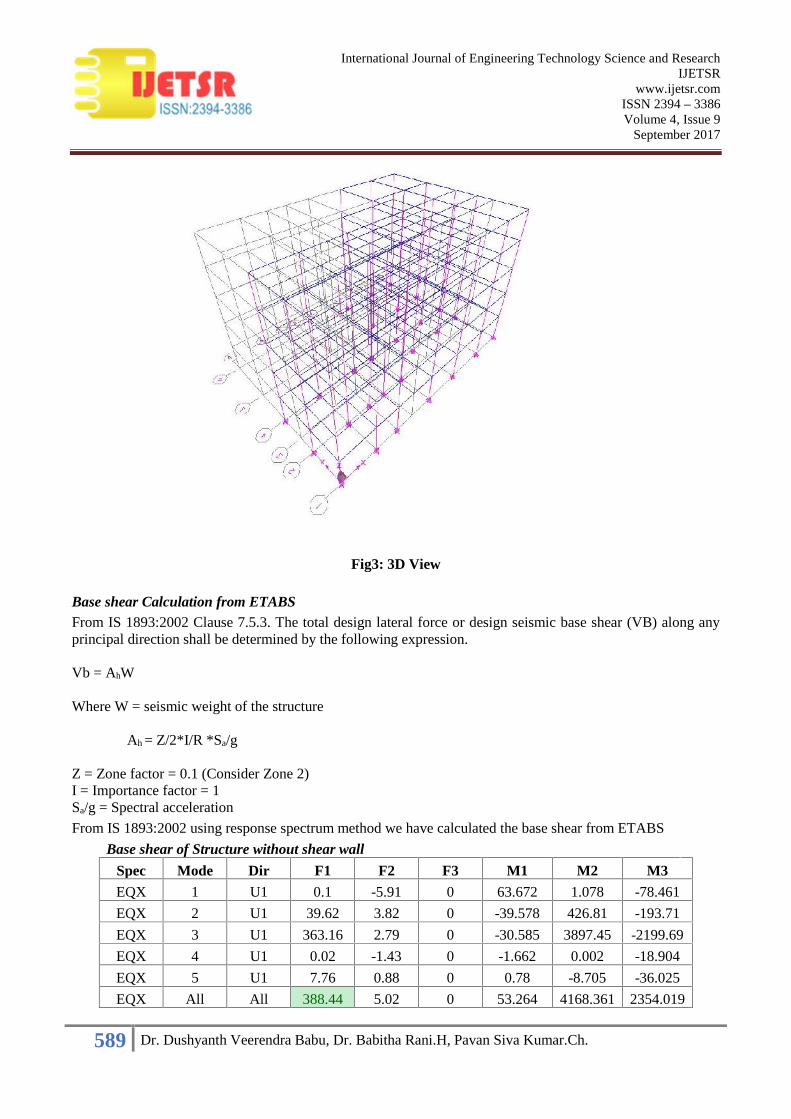
Fig3: 3D View
Base shear Calculation from ETABSFrom IS 1893:2002 Clause 7.5.3. The total design lateral force or design seismic base shear (VB) along anyprincipal direction shall be determined by the following expression.
Vb = AhW
Where W = seismic weight of the structure
Ah = Z/2*I/R *Sa/g
Z = Zone factor = 0.1 (Consider Zone 2)I = Importance factor = 1Sa/g = Spectral acceleration
From IS 1893:2002 using response spectrum method we have calculated the base shear from ETABS
Base shear of Structure without shear wall
Spec Mode Dir F1 F2 F3 M1 M2 M3
EQX 1 U1 0.1 -5.91 0 63.672 1.078 -78.461
EQX 2 U1 39.62 3.82 0 -39.578 426.81 -193.71
EQX 3 U1 363.16 2.79 0 -30.585 3897.45 -2199.69
EQX 4 U1 0.02 -1.43 0 -1.662 0.002 -18.904
EQX 5 U1 7.76 0.88 0 0.78 -8.705 -36.025
EQX All All 388.44 5.02 0 53.264 4168.361 2354.019
590 Dr. Dushyanth Veerendra Babu, Dr. Babitha Rani.H, Pavan Siva Kumar.Ch.
International Journal of Engineering Technology Science and ResearchIJETSR
www.ijetsr.comISSN 2394 – 3386Volume 4, Issue 9
September 2017
Spec Mode Dir F1 F2 F3 M1 M2 M3
EQY 1 U2 -5.91 352.87 0 -3799.38 -64.313 4681.838
EQY 2 U2 3.82 0.37 0 -3.815 41.138 -18.671
EQY 3 U2 2.79 0.02 0 -0.235 29.891 -16.87
EQY 4 U2 -1.43 95.73 0 110.867 -0.123 1261.266
EQY 5 U2 0.88 0.1 0 0.088 -0.987 -4.083
EQY All All 5.02 366.45 0 3803.357 53.4 4835.466
From the table, we can compute the total base shear in X and Y- Direction
Base shear along X- direction = 388.44 KN/m
Base shear along Y -direction = 366.45 KN/m
Base shear Distribution to floorsFrom IS 1893:2002 Clause 7.7 Distribution of Design Force is Vertical Distribution of Base Shear to DifferentFloor Levels The design base shear (V~) computed in 7.5.3 shall be distributed along the height of thebuilding as per the following expression:
2
1
2
jj
n
j
iiBi
hW
hWVQ
Story Height Σ (Wj * Hj2)from IS 1893
Qi = Vb * (Wi*Hi2)/Σ (Wj * Hj2)STORY5 15 141193.89 162.88
STORY4 12 104278.9248 120.30
STORY3 9 58656.8952 67.67
STORY2 6 26069.7312 30.07
STORY1 3 6517.4328 7.52
336716.874 388.44
Stiffness is computed for each column in one particular frame, by adding the all column stiffness in thecorresponding frame will give the frame stiffness.
Lateral load distribution to framesLet us consider Eqx force which is acting on the 1st floor will be distributed to all frames in x- directionconsidering the corresponding stiffness. By using the formula Eqx* K/ ∑K, earthquake force can bedistributed along all the frames. From the above results, we can observe that distributed force is maximum forsome frames. We can reduce the distributed forces by adding the shear walls where the force will bemaximum. Frame A, B and M are having more distribution force along the X-direction.So, we can reduce theforce by adding the shear wall in frame E and G since the lateral forces were less in those frames.

591 Dr. Dushyanth Veerendra Babu, Dr. Babitha Rani.H, Pavan Siva Kumar.Ch.
International Journal of Engineering Technology Science and ResearchIJETSR
www.ijetsr.comISSN 2394 – 3386Volume 4, Issue 9
September 2017
Structure without wall _ Calculation of lateral load distribution on frames in X direction
FRAME A B C D E F G H SUM
TOTALSTIFFNESS
(K frame)90000 45000 120000 75000 90000 165000 165000 210000 960000
1st floorEqx 7.52
1st floorDistribution
of forceKA/ΣK * Eqx
(KN)
0.71 0.35 0.94 0.59 0.71 1.29 1.29 1.65 7.52
2nd floorEqx
30.07
2 nd floorDistribution
of forceKA/ΣK * Eqx
(KN)
2.82 1.41 3.76 2.35 2.82 5.17 5.17 6.58 30.07
3rd floorEqx 67.67
3 rd floorDistribution
of forceKA/ΣK * Eqx
(KN)
6.34 3.17 8.46 5.29 6.34 11.63 11.63 14.80 67.67
4 th floorEqx 120.30
4 th floorDistribution
of forceKA/ΣK * Eqx
(KN)
11.28 5.64 15.04 9.40 11.28 20.68 20.68 26.32 120.30
5 th floorEqx 162.88
5th floorDistribution
of forceKA/ΣK * Eqx
(KN)
15.27 7.64 20.36 12.73 15.27 28.00 28.00 35.63 162.88
Calculation of Center of mass and Center of stiffness (Center of mass from ETABS)Center of mass = ∑Mi x ai x Yi / ∑Mi x ai
Where M = mass
A = area

592 Dr. Dushyanth Veerendra Babu, Dr. Babitha Rani.H, Pavan Siva Kumar.Ch.
International Journal of Engineering Technology Science and ResearchIJETSR
www.ijetsr.comISSN 2394 – 3386Volume 4, Issue 9
September 2017
Y = centroidal distance.Story Diaphragm Mass X Mass Y XCM YCM
STORY5 D1 627.5284 627.5284 13.223 6.179
STORY4 D1 724.1592 724.1592 13.142 6.15
STORY3 D1 724.1592 724.1592 13.142 6.15
STORY2 D1 724.1592 724.1592 13.142 6.15
STORY1 D1 724.1592 724.1592 13.142 6.15
3524.165 TONNS35241.65 NEWTONS
Location of center of mass = (13.142, 6.15)
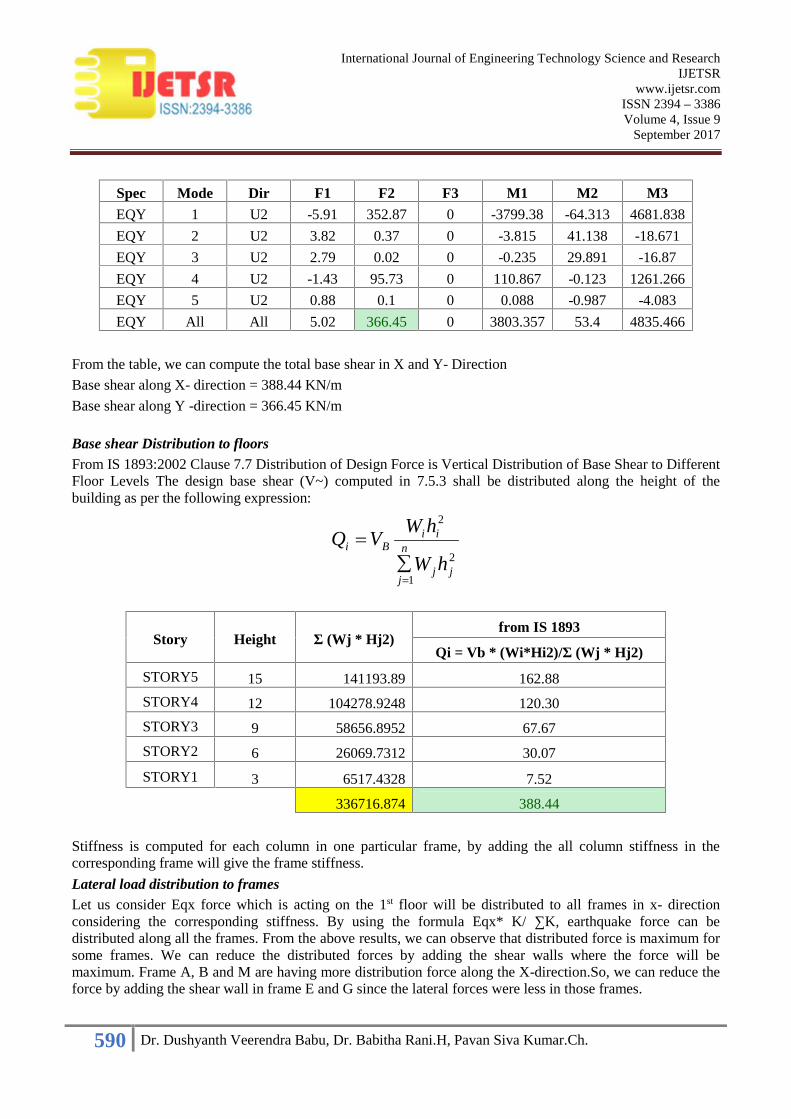
Center of stiffness: STIFFNESS IN X-DIRECTION
h=3 E=5000*sqrt(fck)=25000SOFTCOPYGRID LINE
DATACOLUMN TYPE
COLUMN SIZEI = bd3/12 mm4 K = 12 * E* I / h 3
BREADTH(b) LENGTH(d)
1A C1 600 300 1350000000 150001B C1 600 300 1350000000 150001C C2 300 600 5400000000 600001E C1 600 300 1350000000 150001F C2 300 600 5400000000 600001G C2 300 600 5400000000 600001H C2 300 600 5400000000 60000
2850002A C1 600 300 1350000000 150002B C1 600 300 1350000000 150002C C2 300 600 5400000000 600002D C2 300 600 5400000000 600002E C2 300 600 5400000000 60000
2100003F C1 600 300 1350000000 150003G C1 600 300 1350000000 150003H C2 300 600 5400000000 60000
900004A C2 300 600 5400000000 600004B C1 600 300 1350000000 150004D C1 600 300 1350000000 150004E C1 600 300 1350000000 150004F C1 600 300 1350000000 150004G C1 600 300 1350000000 150004H C1 600 300 1350000000 15000
1500005F C1 600 300 1350000000 150005G C1 600 300 1350000000 150005H C1 600 300 1350000000 15000
450006F C2 300 600 5400000000 600006G C2 300 600 5400000000 600006H C2 300 600 5400000000 60000
180000
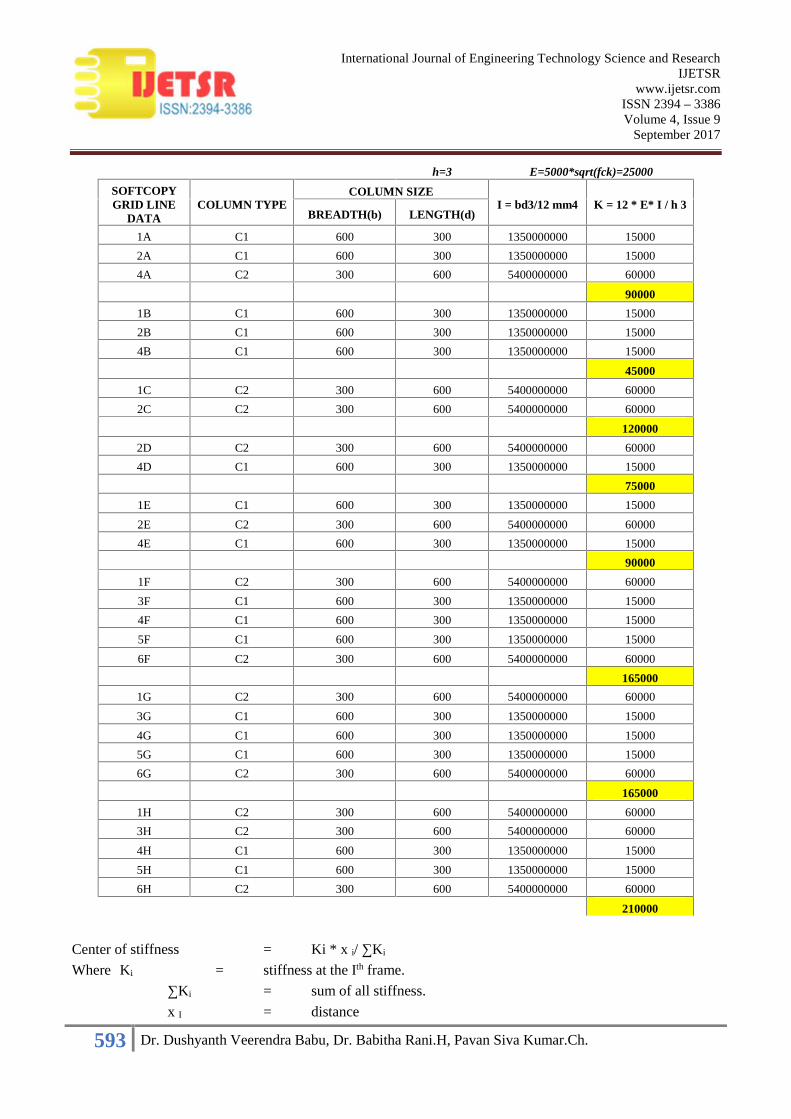
STIFFNESS IN Y-DIRECTION
593 Dr. Dushyanth Veerendra Babu, Dr. Babitha Rani.H, Pavan Siva Kumar.Ch.
International Journal of Engineering Technology Science and ResearchIJETSR
www.ijetsr.comISSN 2394 – 3386Volume 4, Issue 9
September 2017
h=3 E=5000*sqrt(fck)=25000
SOFTCOPYGRID LINE
DATACOLUMN TYPE
COLUMN SIZEI = bd3/12 mm4 K = 12 * E* I / h 3
BREADTH(b) LENGTH(d)
1A C1 600 300 1350000000 15000
2A C1 600 300 1350000000 15000
4A C2 300 600 5400000000 60000
90000
1B C1 600 300 1350000000 15000
2B C1 600 300 1350000000 15000
4B C1 600 300 1350000000 15000
45000
1C C2 300 600 5400000000 60000
2C C2 300 600 5400000000 60000
120000
2D C2 300 600 5400000000 60000
4D C1 600 300 1350000000 15000
75000
1E C1 600 300 1350000000 15000
2E C2 300 600 5400000000 60000
4E C1 600 300 1350000000 15000
90000
1F C2 300 600 5400000000 60000
3F C1 600 300 1350000000 15000
4F C1 600 300 1350000000 15000
5F C1 600 300 1350000000 15000
6F C2 300 600 5400000000 60000
165000
1G C2 300 600 5400000000 60000
3G C1 600 300 1350000000 15000
4G C1 600 300 1350000000 15000
5G C1 600 300 1350000000 15000
6G C2 300 600 5400000000 60000
165000
1H C2 300 600 5400000000 60000
3H C2 300 600 5400000000 60000
4H C1 600 300 1350000000 15000
5H C1 600 300 1350000000 15000
6H C2 300 600 5400000000 60000
210000
Center of stiffness = Ki * x i/ ∑Ki
Where Ki = stiffness at the Ith frame.
∑Ki = sum of all stiffness.
x I = distance
594 Dr. Dushyanth Veerendra Babu, Dr. Babitha Rani.H, Pavan Siva Kumar.Ch.
International Journal of Engineering Technology Science and ResearchIJETSR
www.ijetsr.comISSN 2394 – 3386Volume 4, Issue 9
September 2017
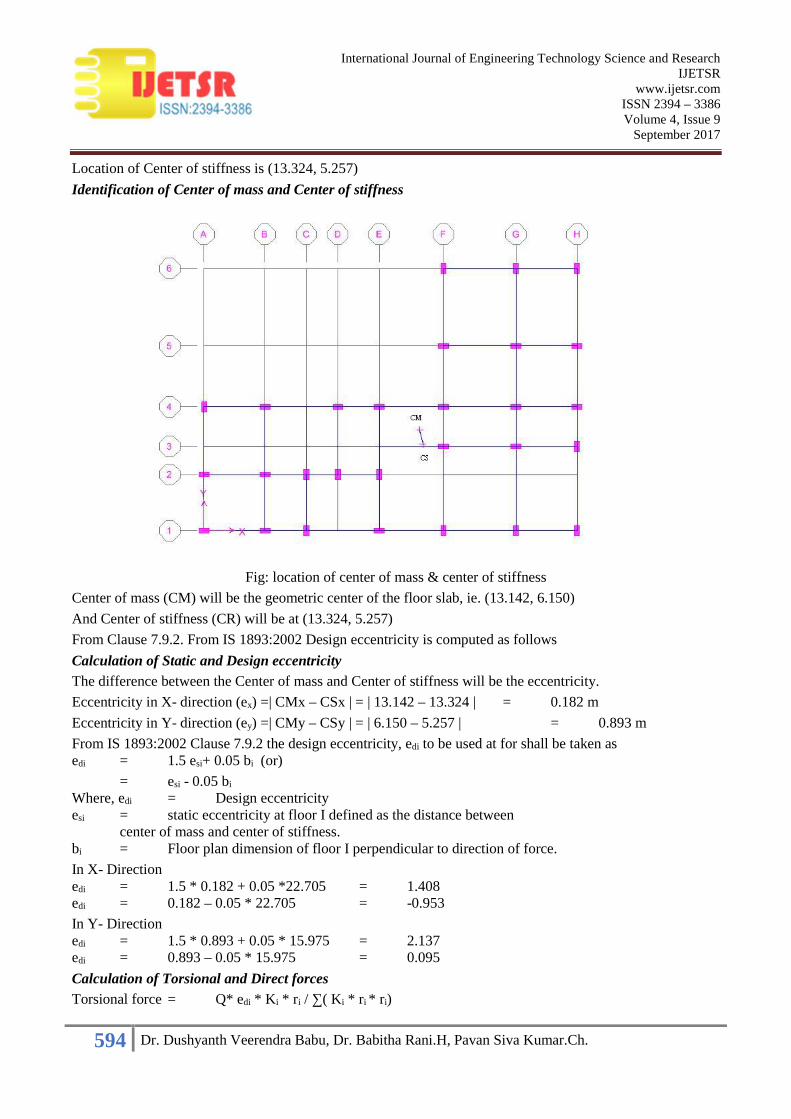
Location of Center of stiffness is (13.324, 5.257)
Identification of Center of mass and Center of stiffness
Fig: location of center of mass & center of stiffness
Center of mass (CM) will be the geometric center of the floor slab, ie. (13.142, 6.150)
And Center of stiffness (CR) will be at (13.324, 5.257)
From Clause 7.9.2. From IS 1893:2002 Design eccentricity is computed as follows
Calculation of Static and Design eccentricityThe difference between the Center of mass and Center of stiffness will be the eccentricity.
Eccentricity in X- direction (ex) =| CMx – CSx | = | 13.142 – 13.324 | = 0.182 m
Eccentricity in Y- direction (ey) =| CMy – CSy | = | 6.150 – 5.257 | = 0.893 m
From IS 1893:2002 Clause 7.9.2 the design eccentricity, edi to be used at for shall be taken asedi = 1.5 esi+ 0.05 bi (or)
= esi - 0.05 bi
Where, edi = Design eccentricityesi = static eccentricity at floor I defined as the distance between
center of mass and center of stiffness.bi = Floor plan dimension of floor I perpendicular to direction of force.
In X- Directionedi = 1.5 * 0.182 + 0.05 *22.705 = 1.408edi = 0.182 – 0.05 * 22.705 = -0.953
In Y- Directionedi = 1.5 * 0.893 + 0.05 * 15.975 = 2.137edi = 0.893 – 0.05 * 15.975 = 0.095
Calculation of Torsional and Direct forcesTorsional force = Q* edi * Ki * ri / ∑( Ki * ri * ri)
595 Dr. Dushyanth Veerendra Babu, Dr. Babitha Rani.H, Pavan Siva Kumar.Ch.
International Journal of Engineering Technology Science and ResearchIJETSR
www.ijetsr.comISSN 2394 – 3386Volume 4, Issue 9
September 2017
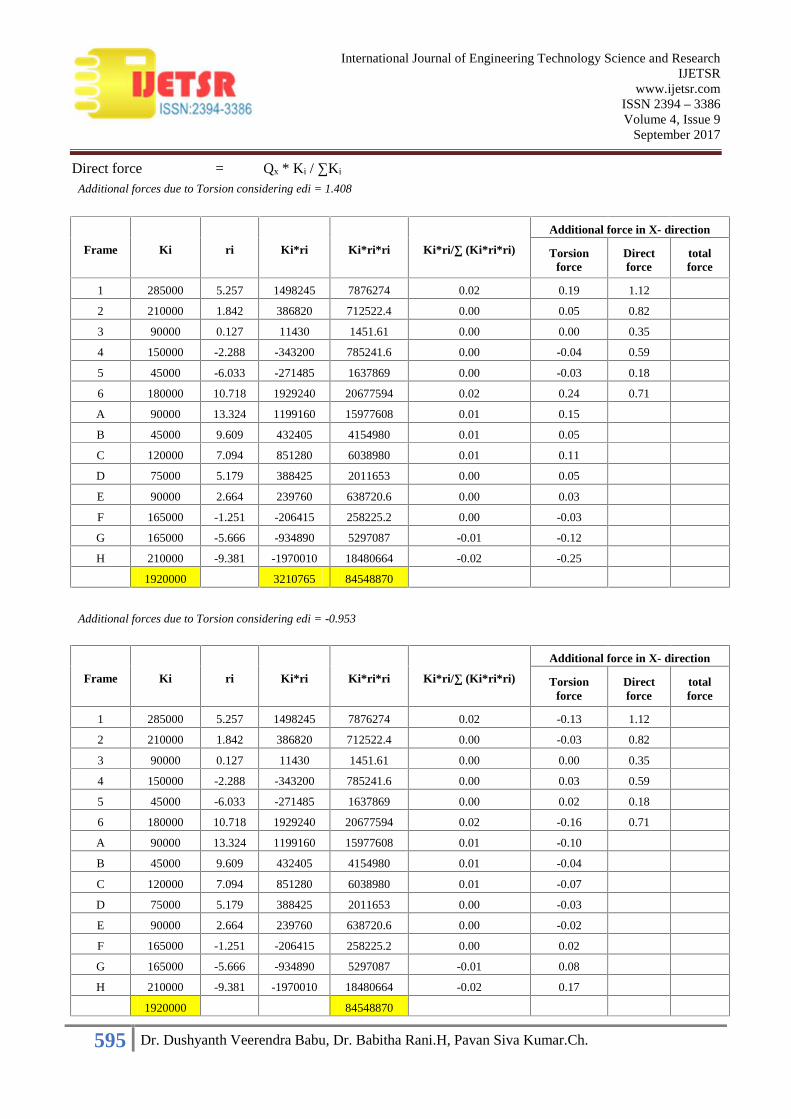
Direct force = Qx * Ki / ∑Ki
Additional forces due to Torsion considering edi = 1.408
Frame Ki ri Ki*ri Ki*ri*ri Ki*ri/∑ (Ki*ri*ri)Additional force in X- direction
Torsionforce
Directforce
totalforce
1 285000 5.257 1498245 7876274 0.02 0.19 1.12
2 210000 1.842 386820 712522.4 0.00 0.05 0.82
3 90000 0.127 11430 1451.61 0.00 0.00 0.35
4 150000 -2.288 -343200 785241.6 0.00 -0.04 0.59
5 45000 -6.033 -271485 1637869 0.00 -0.03 0.18
6 180000 10.718 1929240 20677594 0.02 0.24 0.71
A 90000 13.324 1199160 15977608 0.01 0.15
B 45000 9.609 432405 4154980 0.01 0.05
C 120000 7.094 851280 6038980 0.01 0.11
D 75000 5.179 388425 2011653 0.00 0.05
E 90000 2.664 239760 638720.6 0.00 0.03
F 165000 -1.251 -206415 258225.2 0.00 -0.03
G 165000 -5.666 -934890 5297087 -0.01 -0.12
H 210000 -9.381 -1970010 18480664 -0.02 -0.25
1920000 3210765 84548870
Additional forces due to Torsion considering edi = -0.953
Frame Ki ri Ki*ri Ki*ri*ri Ki*ri/∑ (Ki*ri*ri)Additional force in X- direction
Torsionforce
Directforce
totalforce
1 285000 5.257 1498245 7876274 0.02 -0.13 1.12
2 210000 1.842 386820 712522.4 0.00 -0.03 0.82
3 90000 0.127 11430 1451.61 0.00 0.00 0.35
4 150000 -2.288 -343200 785241.6 0.00 0.03 0.59
5 45000 -6.033 -271485 1637869 0.00 0.02 0.18
6 180000 10.718 1929240 20677594 0.02 -0.16 0.71
A 90000 13.324 1199160 15977608 0.01 -0.10
B 45000 9.609 432405 4154980 0.01 -0.04
C 120000 7.094 851280 6038980 0.01 -0.07
D 75000 5.179 388425 2011653 0.00 -0.03
E 90000 2.664 239760 638720.6 0.00 -0.02
F 165000 -1.251 -206415 258225.2 0.00 0.02
G 165000 -5.666 -934890 5297087 -0.01 0.08
H 210000 -9.381 -1970010 18480664 -0.02 0.17
1920000 84548870

596 Dr. Dushyanth Veerendra Babu, Dr. Babitha Rani.H, Pavan Siva Kumar.Ch.
International Journal of Engineering Technology Science and ResearchIJETSR
www.ijetsr.comISSN 2394 – 3386Volume 4, Issue 9
September 2017
SHEAR WALLSShear walls are vertical elements of the horizontal force resisting system. When shear walls are designed andconstructed properly, they will have the strength and stiffness to resist the horizontal forces. Reinforcedconcrete framed buildings are adequate for resisting the both the vertical and horizontal loads acting on them.
TYPES OF SHEAR WALLSDeep Straight walls or angular, U shaped and Box shaped walls.
To form an effective box structure, equal length shear walls should be placed symmetrically on all fourexterior walls of the building. Shear walls should be added to the building interior when the exterior wallscannot provide sufficient strength and stiffness or when the allowable span-width ratio for the floor or roofdiaphragm is exceeded. For subfloors with conventional diagonal sheathing, the span-width ratio is 3:1. Thismeans that a 25-foot wide building with this subfloor will not require interior shear walls until its lengthexceeds 75 feet unless the strength or stiffness of the exterior shear walls are inadequate.
WHAT TYPES OF FORCES DO SHEAR WALLS RESIST?Shear walls resist two types of forces: shear forces and uplift forces. Connections to the structure abovetransfer horizontal forces to the shear wall. This transfer creates shear forces throughout the height of the wallbetween the top and bottom shear wall connections.
Initial location for shear wall to reduce torsion
Fig : Shear wall location and plans
Lateral force reduction in shear wall building
597 Dr. Dushyanth Veerendra Babu, Dr. Babitha Rani.H, Pavan Siva Kumar.Ch.
International Journal of Engineering Technology Science and ResearchIJETSR
www.ijetsr.comISSN 2394 – 3386Volume 4, Issue 9
September 2017
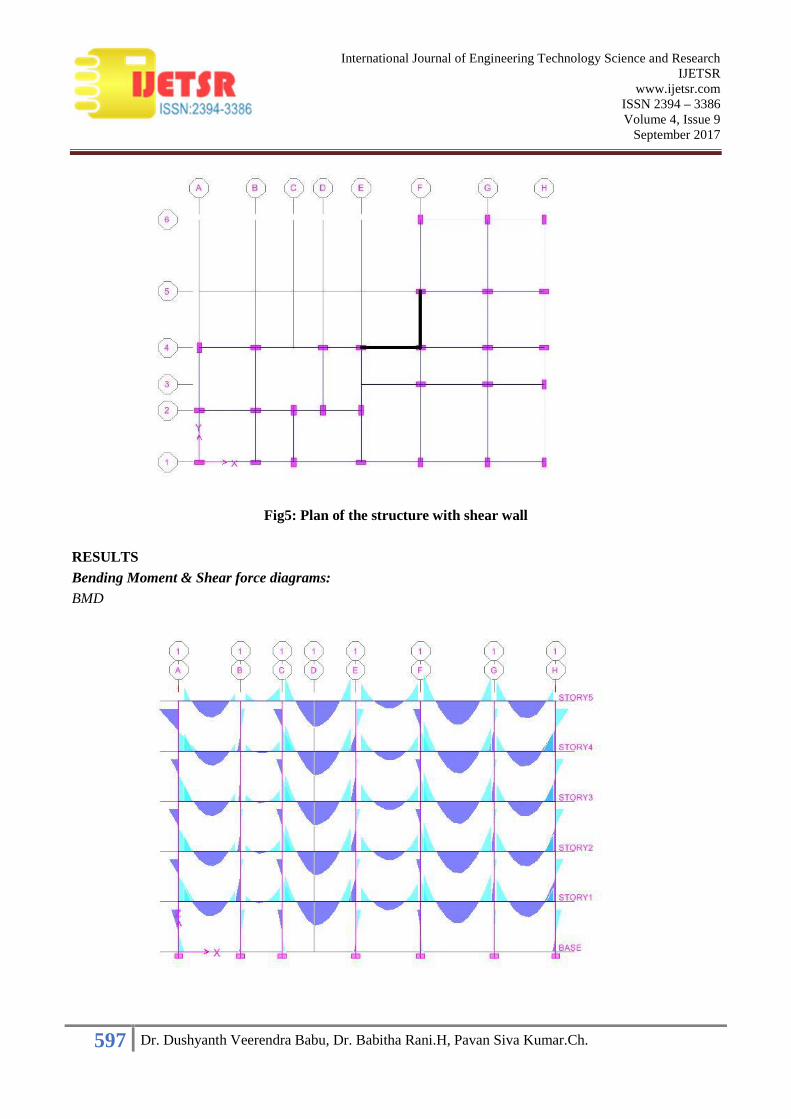
Fig5: Plan of the structure with shear wall
RESULTSBending Moment & Shear force diagrams:BMD
598 Dr. Dushyanth Veerendra Babu, Dr. Babitha Rani.H, Pavan Siva Kumar.Ch.
International Journal of Engineering Technology Science and ResearchIJETSR
www.ijetsr.comISSN 2394 – 3386Volume 4, Issue 9
September 2017
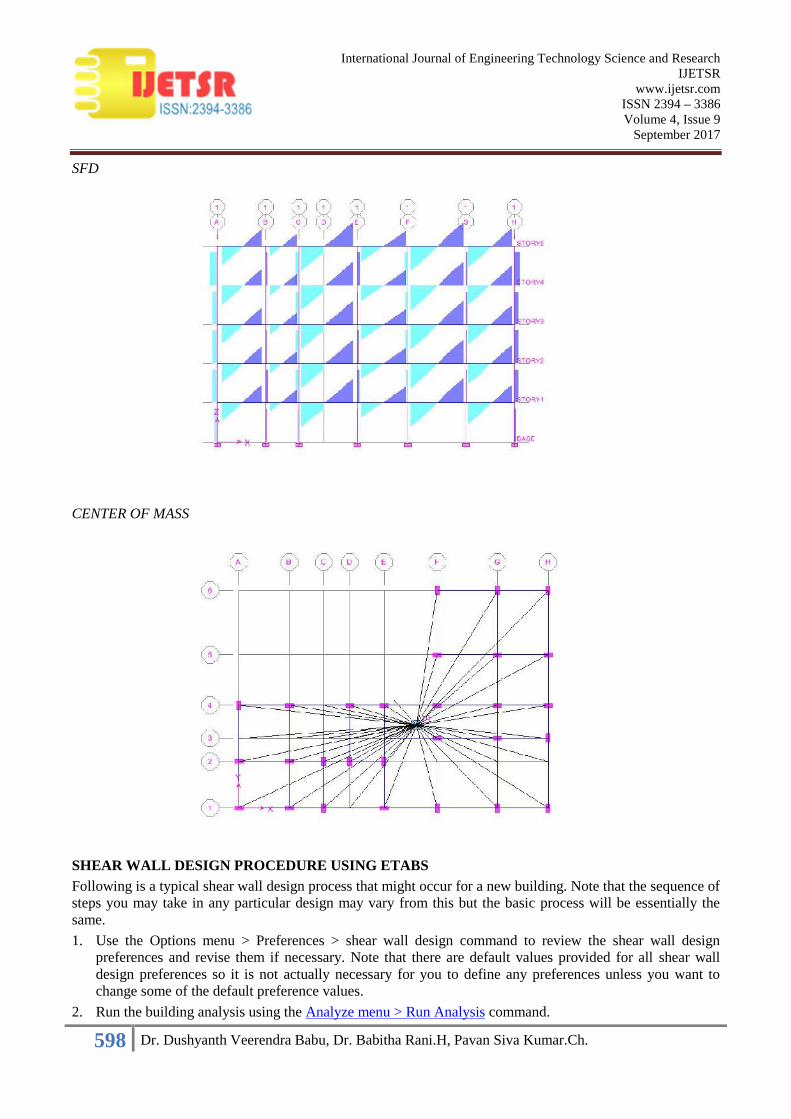
SFD
CENTER OF MASS
SHEAR WALL DESIGN PROCEDURE USING ETABSFollowing is a typical shear wall design process that might occur for a new building. Note that the sequence ofsteps you may take in any particular design may vary from this but the basic process will be essentially thesame.
1. Use the Options menu > Preferences > shear wall design command to review the shear wall designpreferences and revise them if necessary. Note that there are default values provided for all shear walldesign preferences so it is not actually necessary for you to define any preferences unless you want tochange some of the default preference values.
2. Run the building analysis using the Analyze menu > Run Analysis command.

599 Dr. Dushyanth Veerendra Babu, Dr. Babitha Rani.H, Pavan Siva Kumar.Ch.
International Journal of Engineering Technology Science and ResearchIJETSR
www.ijetsr.comISSN 2394 – 3386Volume 4, Issue 9
September 2017
3. Assign the wall pier and wall spandrel labels. Use the Assign menu > Frame/Line > Pier Label, the Assignmenu > Shell/Area > Pier Label, the Assign menu > Frame/Line > Spandrel Label, and the Assign menu >Shell/Area > Spandrel Label commands to do this. Note that the labels can be assigned before or after theanalysis is run.
5. Assign shear wall overwrites, if needed, using the Design menu > shear wall design > View/Revise PierOverwrites and the Design menu > shear wall design > View/Revise Spandrel Overwrites commands.Note that you must select piers or spandrels first before using these commands. Also note that there aredefault values provided for all pier and spandrel design overwrites so it is not actually necessary for you todefine any overwrites unless you want to change some of the default overwrite values. Note that theoverwrites can be assigned before or after the analysis is run.
6. If you want to use any design load combinations other than the default ones created by ETABS for yourshear wall design, click the Design menu > shear Wall Design > Select Design Combo command. Notethat you must have already created your own design combos by clicking the Define menu > LoadCombinations command.
7. Click the Design menu >shear Wall Design > Start Design/Check of Structure command to run the shearwall design.
8. Review the shear wall design results. To do this you might do one of the following:
a. Click the Design menu > Shear Wall Design > Display Design Info command to display designinformation on the model.
b. Right click on a pier or spandrel while the design results are displayed on it to enter the interactive walldesign mode. Note that while you are in this mode you can revise overwrites and immediately see the newdesign results.
If you are not currently displaying design results, click the Design menu > shear Wall Design > InteractiveWall Design command and then right click a pier or spandrel to enter the interactive design mode for thatelement.
c. Use the File menu > Print Tables > Shear Wall Design command to print shear wall design data. If youselect a few piers or spandrels before using this command, data is printed only for the selected elements.
9. If desired, revise the wall pier and/or spandrel overwrites, rerun the shear wall design, and review theresults again. Repeat this step as many times as needed.
10. If desired, create wall pier check sections with user-defined (actual) reinforcing specified for the wallpiers using the Section Designer utility. Use the Design menu > Shear Wall Design > Define General PierSections command to define the sections in Section Designer. Use the Design menu > Shear Wall Design> Assign Pier Section Type command to assign the sections to the piers; be sure to indicate that thereinforcing is to be checked by checking the Reinforcement to Be Checked check box. Rerun the designand verify that the actual flexural reinforcing provided is adequate.
11. Assign these check sections to the piers, change the pier mode from Design to Check, and rerun thedesign. Verify that the actual flexural reinforcing provided is adequate.
12. If necessary, revise the geometry or reinforcing and rerun the design.
13. Print or display selected shear wall design results if desired.
Note: Shear wall design is performed as an iterative process. You can change your wall design dimensionsand reinforcing during the design process without rerunning the analysis. However, you always want to besure that your final design is based on analysis properties (wall dimensions) that are consistent with yourdesign (actual) wall dimensions.
600 Dr. Dushyanth Veerendra Babu, Dr. Babitha Rani.H, Pavan Siva Kumar.Ch.
International Journal of Engineering Technology Science and ResearchIJETSR
www.ijetsr.comISSN 2394 – 3386Volume 4, Issue 9
September 2017
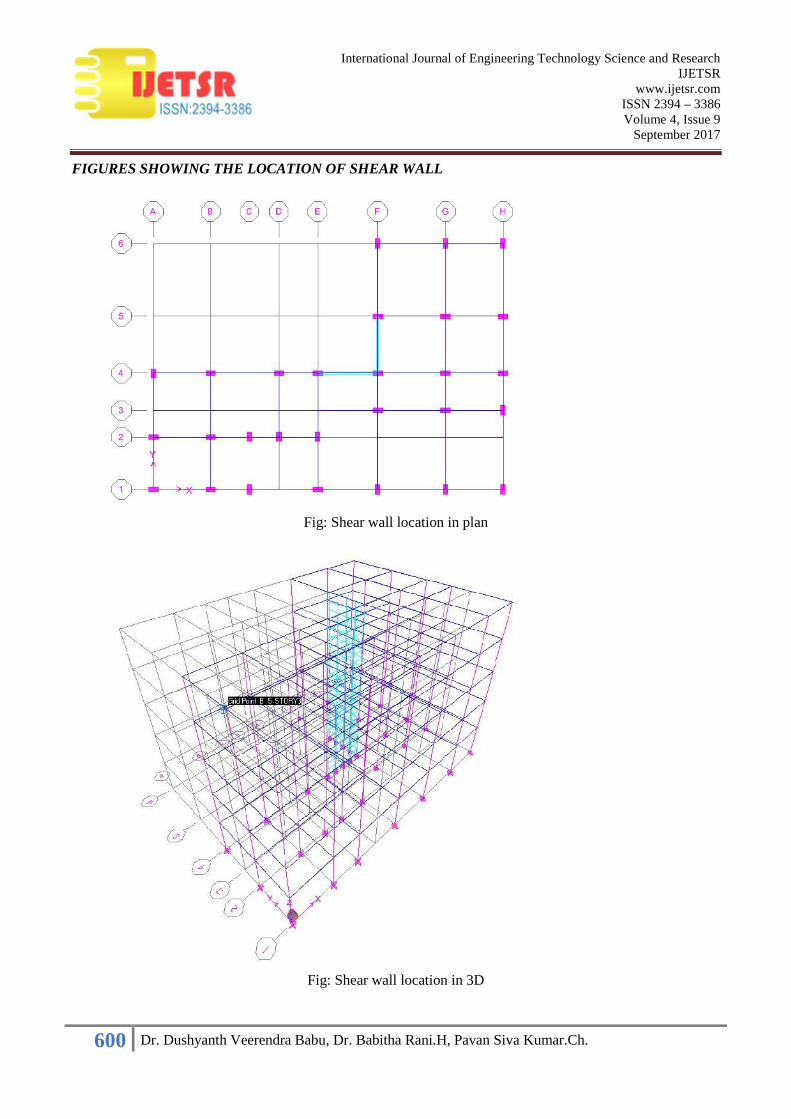
FIGURES SHOWING THE LOCATION OF SHEAR WALL
Fig: Shear wall location in plan
Fig: Shear wall location in 3D
601 Dr. Dushyanth Veerendra Babu, Dr. Babitha Rani.H, Pavan Siva Kumar.Ch.
International Journal of Engineering Technology Science and ResearchIJETSR
www.ijetsr.comISSN 2394 – 3386Volume 4, Issue 9
September 2017
At each floor
16d@corners(0.031)
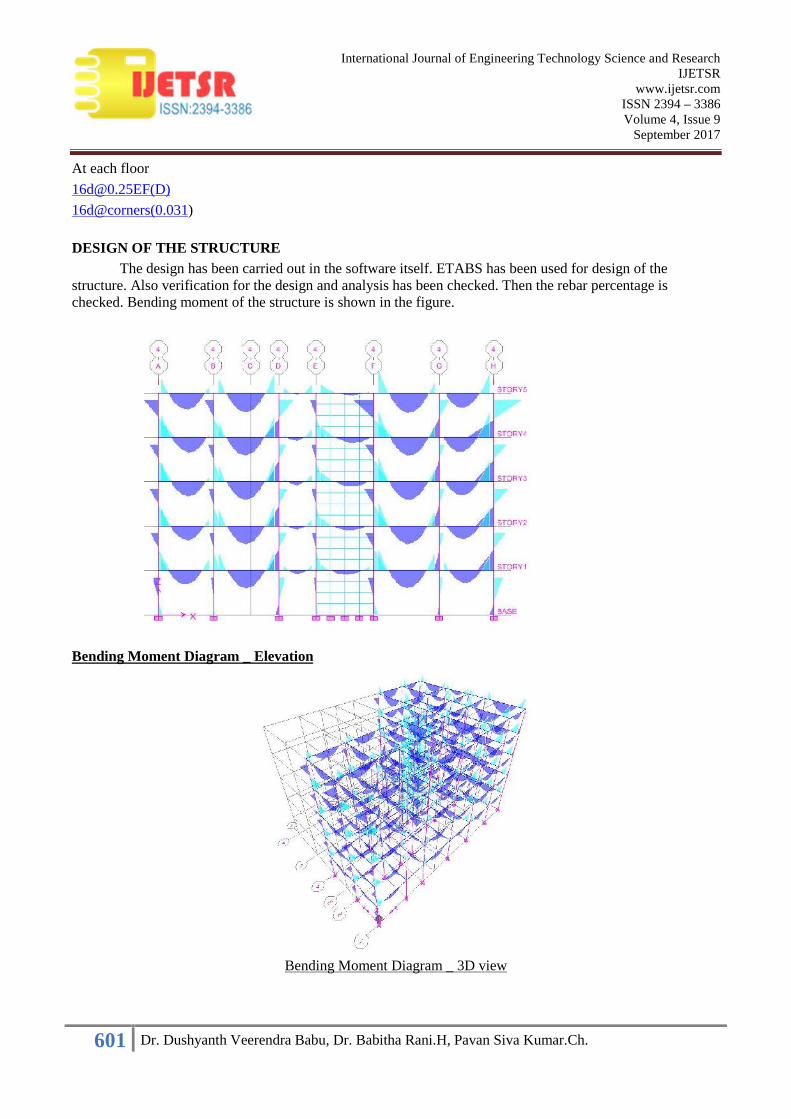
DESIGN OF THE STRUCTUREThe design has been carried out in the software itself. ETABS has been used for design of the
structure. Also verification for the design and analysis has been checked. Then the rebar percentage ischecked. Bending moment of the structure is shown in the figure.
Bending Moment Diagram _ Elevation
Bending Moment Diagram _ 3D view
602 Dr. Dushyanth Veerendra Babu, Dr. Babitha Rani.H, Pavan Siva Kumar.Ch.
International Journal of Engineering Technology Science and ResearchIJETSR
www.ijetsr.comISSN 2394 – 3386Volume 4, Issue 9
September 2017
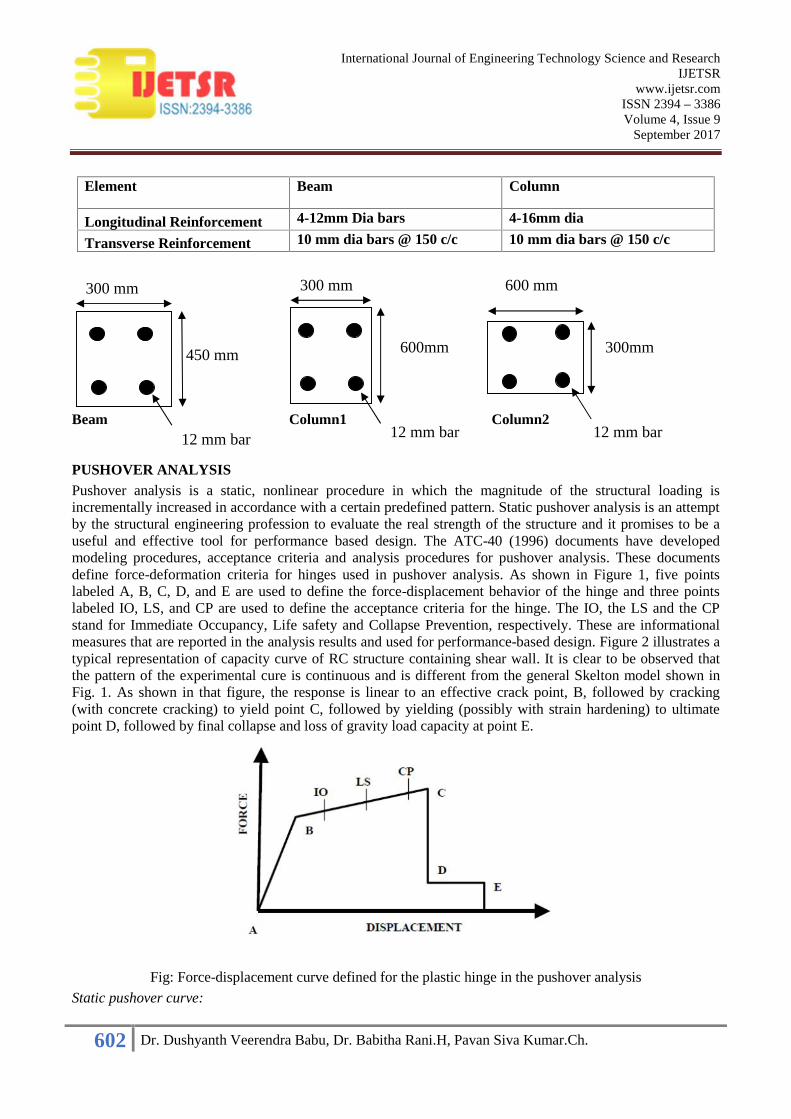
Element Beam Column
Longitudinal Reinforcement 4-12mm Dia bars 4-16mm dia
Transverse Reinforcement 10 mm dia bars @ 150 c/c 10 mm dia bars @ 150 c/c
Beam Column1 Column2
PUSHOVER ANALYSISPushover analysis is a static, nonlinear procedure in which the magnitude of the structural loading isincrementally increased in accordance with a certain predefined pattern. Static pushover analysis is an attemptby the structural engineering profession to evaluate the real strength of the structure and it promises to be auseful and effective tool for performance based design. The ATC-40 (1996) documents have developedmodeling procedures, acceptance criteria and analysis procedures for pushover analysis. These documentsdefine force-deformation criteria for hinges used in pushover analysis. As shown in Figure 1, five pointslabeled A, B, C, D, and E are used to define the force-displacement behavior of the hinge and three pointslabeled IO, LS, and CP are used to define the acceptance criteria for the hinge. The IO, the LS and the CPstand for Immediate Occupancy, Life safety and Collapse Prevention, respectively. These are informationalmeasures that are reported in the analysis results and used for performance-based design. Figure 2 illustrates atypical representation of capacity curve of RC structure containing shear wall. It is clear to be observed thatthe pattern of the experimental cure is continuous and is different from the general Skelton model shown inFig. 1. As shown in that figure, the response is linear to an effective crack point, B, followed by cracking(with concrete cracking) to yield point C, followed by yielding (possibly with strain hardening) to ultimatepoint D, followed by final collapse and loss of gravity load capacity at point E.
Fig: Force-displacement curve defined for the plastic hinge in the pushover analysis
Static pushover curve:
12 mm bar
450 mm
300 mm
12 mm bar
600 mm
300mm
12 mm bar
300 mm
600mm

603 Dr. Dushyanth Veerendra Babu, Dr. Babitha Rani.H, Pavan Siva Kumar.Ch.
International Journal of Engineering Technology Science and ResearchIJETSR
www.ijetsr.comISSN 2394 – 3386Volume 4, Issue 9
September 2017
..
ETABS Hinges Results
STEP DISPLACEMENTBASE
FORCEA-B
B-IO
IO-LS
LS-CP
CP-C
C-D D-E >E TOTAL
0 0 0.0000 571 1 0 0 0 0 0 0 572
1 0.0091 1516.7551 531 35 6 0 0 0 0 0 572
2 0.0239 3190.8799 497 42 33 0 0 0 0 0 572
3 0.0347 3712.8330 468 37 16 46 0 5 0 0 572
4 0.0677 4479.9106 468 37 16 46 0 2 3 0 572
5 0.0528 1989.9036 572 0 0 0 0 0 0 0 572
CONCLUSIONSIn the structure without shear wall the lateral forces are high. To reduce the lateral forces, shear walls areadded which results reduction of lateral forces in all frames except shear wall frames. And the appropriatelocation for the shear walls where the lateral forces are maximum in the frames there we can add the shearwalls to reduce the forces in all frames. Therefore, we can choose the appropriate location for the shear wallsin the less lateral forces frames.
REFERENCES1. Rosenblueth, E. and Meli, R. L. "The 1985 Earthquake: Causes and Effects in Mexico City". Concrete International,
1986, pp. 23-35.
2. Chandler, A. M., Xiao-Nian Duan and Rutemberg, A. "Seismic Torsional Response: Assumptions, Controversiesand Research Progress". European Earthquake Engineering, 1996, Vol. 1, pp. 37-51.
3. Regulations for Seismic Design. A World List – 1996. International Association for Earthquake Engineering.
4. Bertero, R. D., “Inelastic Torsion for Preliminary Design”. Journal of Structural Engineering, ASCE, 1995, Vol.121, No. 8, pp. 1183-1189.
5. Humar, J. and Kumar, P. “A New Look at the Torsion Design Provisions in Seismic Building Code”. Proceedings ofthe 12th World Conference on Earthquake Engineering, Auckland, New Zealand, 2000.
604 Dr. Dushyanth Veerendra Babu, Dr. Babitha Rani.H, Pavan Siva Kumar.Ch.
International Journal of Engineering Technology Science and ResearchIJETSR
www.ijetsr.comISSN 2394 – 3386Volume 4, Issue 9
September 2017
6. Paulay, T. "Seismic Design for Torsional Response of Ductile Buildings". Bulletin of the New Zealand NationalSociety for Earthquake Engineering, 1996, Vol. 29, No. 3, pp. 178-198.
7. Paulay, T. "Seismic Torsional Effects on Ductile Structural Wall Systems". Journal of the Earthquake Engineering,1997, Vol. 1, No. 4.
8. Paulay, T. "A Review of Code Provisions for Torsional Seismic Effects in Buildings". Bulletin of the New ZealandNational Society for Earthquake Engineering, 1997, Vol. 30, No. 3, pp. 252-263.
9. Paulay, T. “Are Existing Seismic Torsion Provisions Achieving the Design Aims?”. Earthquake Spectra, 1997, Vol.13, No. 2, pp. 259-280.
10. Crisafulli, F. J. and Formica, R. A. “Efectos de Torsión en el diseño sismorresistente de estructuras. Una revisióncrítica”. Proceedings of the 2do Congreso Iberoamericano de Ingeniería Sísmica, Madrid, España, 2001.
11. Castillo, R., Carr, A. J. and Restrepo, J. I. “The rotation of asymmetric plan structures”. Proceedings of Conferenceof the New Zealand Society for Earthquake Engineering, 2001.
12. Torrisi, G. and Crisafulli, F. “Efectos de irregularidades estructurales en la respuesta sísmica”. Proceedings of theXI Seminario Iberoamericano de Ingeniería Sísmica. Mendoza, Argentina, 2003.
13. Farah, R. M., Torsional Response of Ductile Wall Systems Under Seismic Attack. Thesis for the degree of Masterof Science. University of California, San Diego, 1997.