asset allocation update
TRANSCRIPT

Equity Research
13 October 2004Global
Investment Strategy
Global equity strategy Why we remain neutral of equities Between late July and late-August, we lifted our equity weightings to benchmark. What would it take for us to reduce our weightings from here? We would look for the following:
1. Bond yields rising to 4.6% (US 10-year Treasuries) – At this level, equities would no longer look cheap against bonds. Currently, we find on our DDM model that the US equity risk premium is 3.8% (after adjusting the 3 to 5-year forward consensus earnings growth estimate of 12% p.a. to what we see as a more realistic expectation of 6.4% p.a.) against a long-run average of 3.4%.
2. ISM new orders rolling over to 50 – On our model, a lower level of ISM new orders requires a higher warranted US equity risk premium. Currently, our model of the warranted equity risk premium (which relies on three inputs: corporate credit spreads, VIX and macro momentum) suggests that the risk premium should be 3.5%. If ISM new orders rolls over to 50, then we estimate the required risk premium rises to 4% (we assume ISM new orders troughs at 55). Interestingly, the ratio of equity-to-bond returns in the US coincides with the trough that we forecast in lead indicators (see page 5).
3. Corporates becoming net sellers – Currently, corporates are a small net-buyer of equities. The sell signal is between US$2bn-4bn a week of selling.
4. Positive investor sentiment returns – Three out of six of our sentiment indicators are still pessimistic (global risk appetite, the implied volatility skew and inflows into US aggressive growth funds). Normally, a market peak sees five out of six sentiment indicators becoming ‘optimistic’ (for example, in March).
Fundamentally, we stick to neutral, selling into strength, since we find that if we put the same growth assumption in the bond market as in the equity market, then fair value for the S&P 500 (on an average equity risk premium) is 1,100 (this has been our end-2004 target since October 2003). We forecast just 2% US corporate profits growth for 2005 with the profit share of GDP now close to record highs.
The biggest risk to this view is that we hit supply-side constraints on oil and thus both oil prices and the growth slowdown are worse than we expected.
Another reason for relative caution is that some of our tactical signals are mixed: excess liquidity is at a three-year low; normally equities trough closer to the trough in lead indicators; there was never capitulation at the market low in mid-August; and the technical picture is mixed (see page 8).
If we could take the US out of the global picture, we would be overweight equities. In our view, bond yields (ex Japan) are less overvalued, the profit share of GDP is lower, and equity valuations are less demanding.
On bonds, we remain 5% underweight: capitulation has taken place (speculative net-shorts have fully covered); bonds have completely decoupled from cyclicals and metals prices; most fair value models point to a 4.5%+ US 10-year Treasury bond yield. Can the US consumer really stall out on zero real short rates when the UK consumer (who has more debt) required 4% real short rates?
FOR IMPORTANT DISCLOSURE INFORMATION relating to analyst certification, please refer to the Disclosure Appendix. For information relating to the Firm’s rating system, valuation methods and potential conflicts of interest regarding companies that are the subject of this report, please visit www.csfb.com/researchdisclosures or call +1 (877) 291-2683. U.S. Regulatory Disclosure: CSFB does and seeks to do business with companies covered in its research reports. As a result, investors should be aware that the Firm may have a conflict of interest that could affect the objectivity of this report. Investors should consider this report as only a single factor in making their investment decision.
research team
Andrew Garthwaite 44 20 7883 6477 [email protected]
Jonathan Morton 44 20 7883 8273 [email protected]
Richard Woolhouse 44 20 7883 6481 [email protected]
Jonathan White 44 20 7883 6484 [email protected]
Marina Pronina 44 20 7883 6476 [email protected]
Global equity strategy 13 October 2004
2
Why we remain neutral of equities Back at the end of August, we raised our tactical equity weightings to benchmark and targeted a near term market rally of 5% or so but thought it unlikely that the S&P 500 would meaningfully break above 1,150 (see A tactical bounce in equities?, dated 02 September 2004).
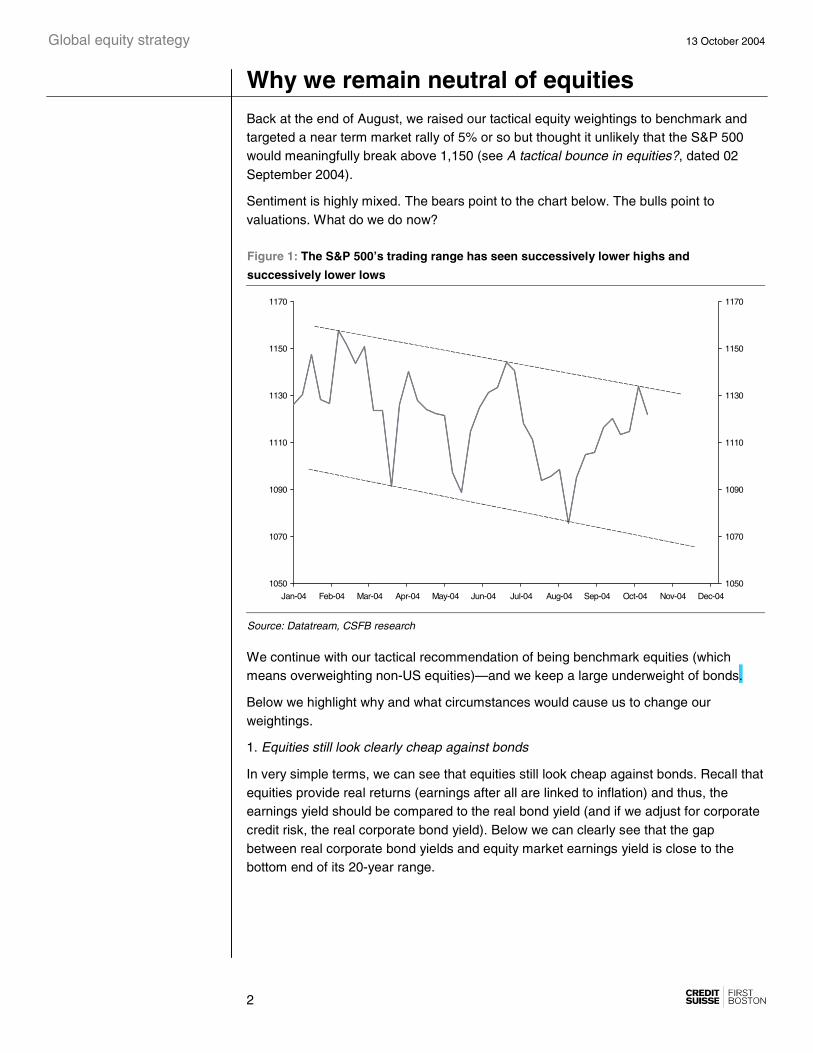
Sentiment is highly mixed. The bears point to the chart below. The bulls point to valuations. What do we do now?
Figure 1: The S&P 500’s trading range has seen successively lower highs and
successively lower lows
1050
1070
1090
1110
1130
1150
1170
Jan-04 Feb-04 Mar-04 Apr-04 May-04 Jun-04 Jul-04 Aug-04 Sep-04 Oct-04 Nov-04 Dec-04
1050
1070
1090
1110
1130
1150
1170
Source: Datatream, CSFB research
We continue with our tactical recommendation of being benchmark equities (which means overweighting non-US equities)—and we keep a large underweight of bonds.
Below we highlight why and what circumstances would cause us to change our weightings.
1. Equities still look clearly cheap against bonds
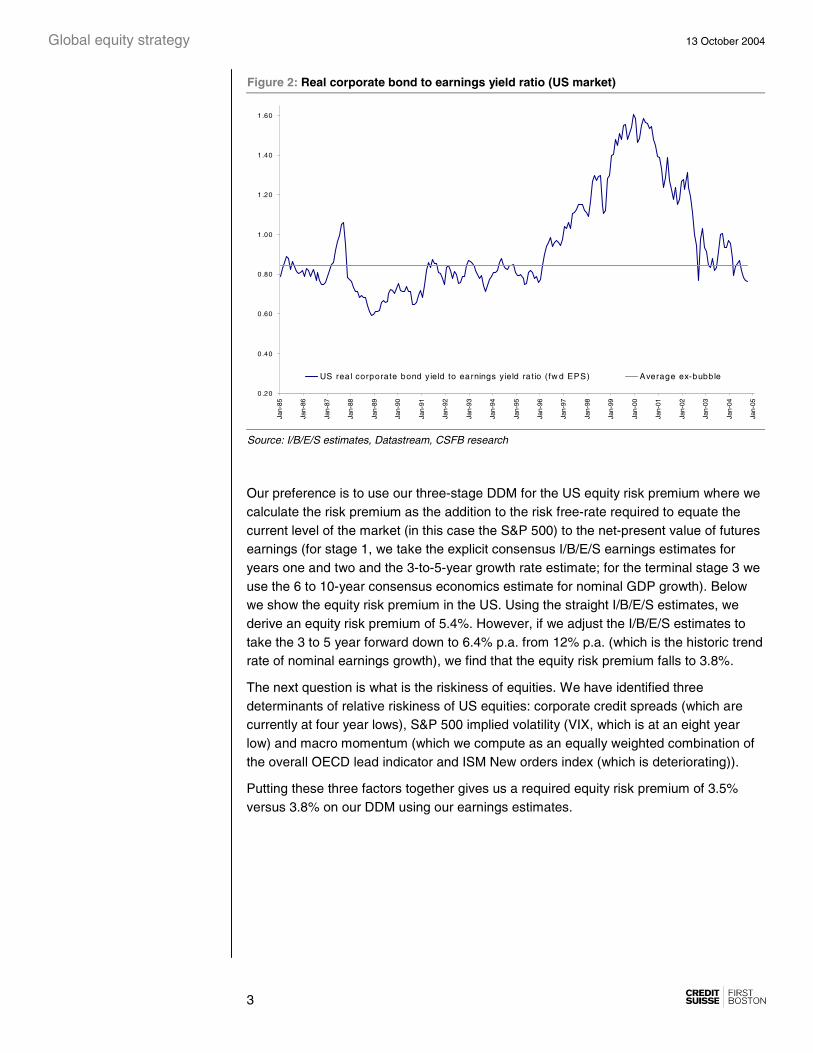
In very simple terms, we can see that equities still look cheap against bonds. Recall that equities provide real returns (earnings after all are linked to inflation) and thus, the earnings yield should be compared to the real bond yield (and if we adjust for corporate credit risk, the real corporate bond yield). Below we can clearly see that the gap between real corporate bond yields and equity market earnings yield is close to the bottom end of its 20-year range.
Global equity strategy 13 October 2004
3
Figure 2: Real corporate bond to earnings yield ratio (US market)
0 .20
0 .40
0 .60
0 .80
1 .00
1 .20
1 .40
1 .60
Jan-
85
Jan-
86
Jan-
87
Jan-
88
Jan-
89
Jan-
90
Jan-
91
Jan-
92
Jan-
93
Jan-
94
Jan-
95
Jan-
96
Jan-
97
Jan-
98
Jan-
99
Jan-
00
Jan-
01
Jan-
02
Jan-
03
Jan-
04
Jan-
05
US real corporate bond y ield to earnings yield ratio (fw d EPS) Average ex-bubble
Source: I/B/E/S estimates, Datastream, CSFB research
Our preference is to use our three-stage DDM for the US equity risk premium where we calculate the risk premium as the addition to the risk free-rate required to equate the current level of the market (in this case the S&P 500) to the net-present value of futures earnings (for stage 1, we take the explicit consensus I/B/E/S earnings estimates for years one and two and the 3-to-5-year growth rate estimate; for the terminal stage 3 we use the 6 to 10-year consensus economics estimate for nominal GDP growth). Below we show the equity risk premium in the US. Using the straight I/B/E/S estimates, we derive an equity risk premium of 5.4%. However, if we adjust the I/B/E/S estimates to take the 3 to 5 year forward down to 6.4% p.a. from 12% p.a. (which is the historic trend rate of nominal earnings growth), we find that the equity risk premium falls to 3.8%.
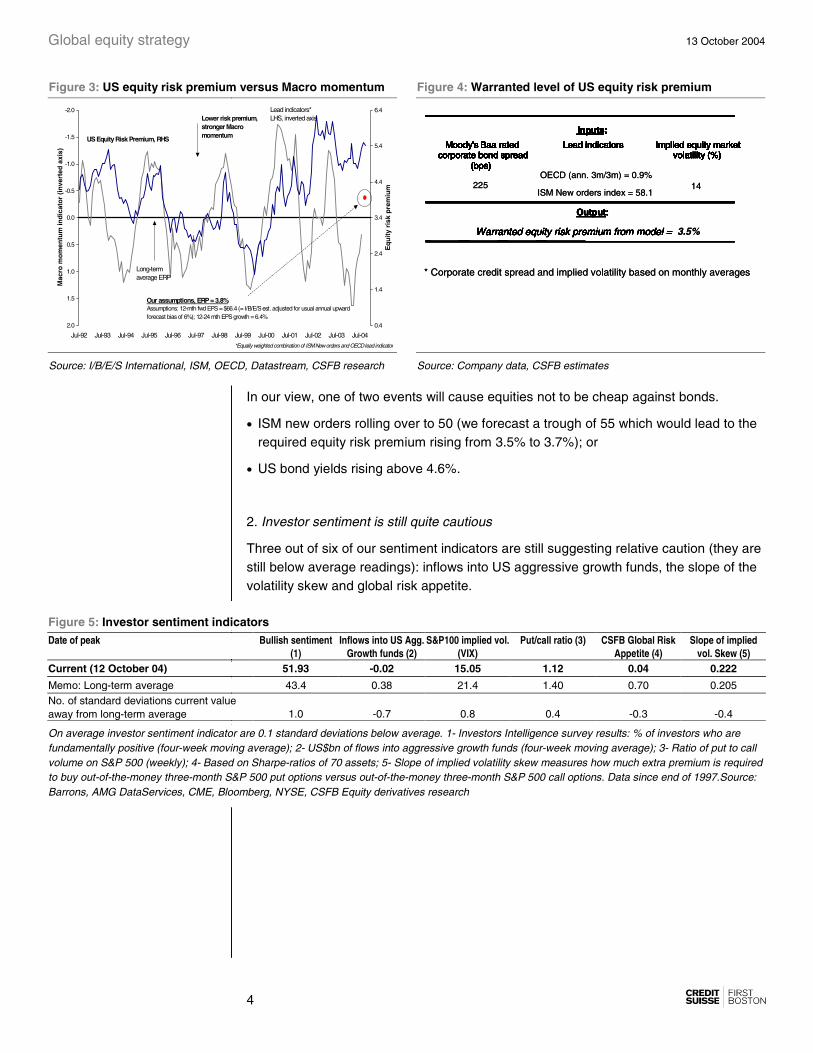
The next question is what is the riskiness of equities. We have identified three determinants of relative riskiness of US equities: corporate credit spreads (which are currently at four year lows), S&P 500 implied volatility (VIX, which is at an eight year low) and macro momentum (which we compute as an equally weighted combination of the overall OECD lead indicator and ISM New orders index (which is deteriorating)).
Putting these three factors together gives us a required equity risk premium of 3.5% versus 3.8% on our DDM using our earnings estimates.
Global equity strategy 13 October 2004
4
Figure 3: US equity risk premium versus Macro momentum Figure 4: Warranted level of US equity risk premium
-2.0
-1.5
-1.0
-0.5
0.0
0.5
1.0
1.5
2.0
Jul-92 Jul-93 Jul-94 Jul-95 Jul-96 Jul-97 Jul-98 Jul-99 Jul-00 Jul-01 Jul-02 Jul-03 Jul-04
Mac
ro m
om
entu
m in
dic
ato
r (i
nve
rted
axi
s)
0.4
1.4
2.4
3.4
4.4
5.4
6.4
Eq
uit
y ri
sk p
rem
ium
Our assumptions, ERP = 3.8%Assumptions: 12-mth fwd EPS = $66.4 (= I/B/E/S est. adjusted for usual annual upward forecast bias of 6%); 12-24 mth EPS growth = 6.4%
Lead indicators*LHS, inverted axis
US Equity Risk Premium, RHS
Long-term average ERP
Lower risk premium, stronger Macro momentum
*Equally weighted combination of ISM New orders and OECD lead indicator
* Corporate credit spread and implied volatility based on monthly averages
Inputs:
Moody's Baa rated corporate bond spread
(bps)
Lead indicators Implied equity market volatility (%)
ISM New orders index = 58.1
Output:
Warranted equity risk premium from model = 3.5%
225 14
Inputs:
Moody's Baa rated corporate bond spread
(bps)
Lead indicators Implied equity market volatility (%)
OECD (ann. 3m/3m) = 0.9%
Inputs:
Moody's Baa rated corporate bond spread
(bps)
Lead indicators Implied equity market volatility (%)
Output:
Warranted equity risk premium from model =
Inputs:
Moody's Baa rated corporate bond spread
(bps)
Lead indicators Implied equity market volatility (%)
Inputs:
Moody's Baa rated corporate bond spread
(bps)
Lead indicators Implied equity market volatility (%)
Output:
Warranted equity risk premium from model =
Inputs:
Moody's Baa rated corporate bond spread
(bps)
Lead indicators Implied equity market volatility (%)
Inputs:
Moody's Baa rated corporate bond spread
(bps)
Lead indicators Implied equity market volatility (%)
Output:
Warranted equity risk premium from model =
Inputs:
Moody's Baa rated corporate bond spread
(bps)
Lead indicators Implied equity market volatility (%)
Source: I/B/E/S International, ISM, OECD, Datastream, CSFB research Source: Company data, CSFB estimates
In our view, one of two events will cause equities not to be cheap against bonds.
• ISM new orders rolling over to 50 (we forecast a trough of 55 which would lead to the required equity risk premium rising from 3.5% to 3.7%); or
• US bond yields rising above 4.6%.
2. Investor sentiment is still quite cautious
Three out of six of our sentiment indicators are still suggesting relative caution (they are still below average readings): inflows into US aggressive growth funds, the slope of the volatility skew and global risk appetite.
Figure 5: Investor sentiment indicators Date of peak Bullish sentiment
(1) Inflows into US Agg.
Growth funds (2) S&P100 implied vol.
(VIX) Put/call ratio (3) CSFB Global Risk
Appetite (4) Slope of implied
vol. Skew (5) Current (12 October 04) 51.93 -0.02 15.05 1.12 0.04 0.222
Memo: Long-term average 43.4 0.38 21.4 1.40 0.70 0.205 No. of standard deviations current value away from long-term average 1.0 -0.7 0.8 0.4 -0.3 -0.4
On average investor sentiment indicator are 0.1 standard deviations below average. 1- Investors Intelligence survey results: % of investors who are fundamentally positive (four-week moving average); 2- US$bn of flows into aggressive growth funds (four-week moving average); 3- Ratio of put to call volume on S&P 500 (weekly); 4- Based on Sharpe-ratios of 70 assets; 5- Slope of implied volatility skew measures how much extra premium is required to buy out-of-the-money three-month S&P 500 put options versus out-of-the-money three-month S&P 500 call options. Data since end of 1997.Source: Barrons, AMG DataServices, CME, Bloomberg, NYSE, CSFB Equity derivatives research

Global equity strategy 13 October 2004
5
3. Equities to bond performance consistent with our forecast for lead indicators.
Normally the ratio of equity-to-bond total returns closely follows the rate of change in lead indicators.
Figure 6: S&P 500 relative to US 10-year bond returns versus the OECD lead indicator
-50
-40
-30
-20
-10
0
10
20
30
40
50
Dec-88 Jan-91 Jan-93 Feb-95 Mar-97 Mar-99 Apr-01 May-03 May-05
Eq
uit
y/b
on
d (
yoy%
)
-6.000
-4.000
-2.000
0.000
2.000
4.000
6.000
8.000
OE
CD
(yo
y%)
Source: Datastream, OECD, CSFB research
Normally, equities trough a couple of months ahead of the trough in lead indicators (see section below on page 9).
What seems to have happened this time is that equities have been more anticipatory and anticipated the roll-over in lead indicators earlier. If our estimates are right we have already seen the appropriate underperformance of equities vis-à-vis bonds.
Why only neutral as opposed to overweight equities:
The main issue as always is the US. There are two overriding concerns that we have:
First, that the growth assumption in the bond market is inconsistent with the growth assumption in the equity market.
If we put bond yields back to a level consistent with our terminal growth assumption (and that means 5%) then we estimate fair value for equities is approximately 1,100 (S&P 500) assuming an average equity risk premium.
Figure 7: Implied level of S&P 500 on normalised bond yield and earnings assumptions
Nominal bond yield = terminal growth rate = 5%
Equity risk premium reverts back to long-term average = 3.4%
2004E EPS = I/B/E/S estimate = US$71.2
Implied level of S&P 500 = 1,090
Source: CSFB estimates
Global equity strategy 13 October 2004
6
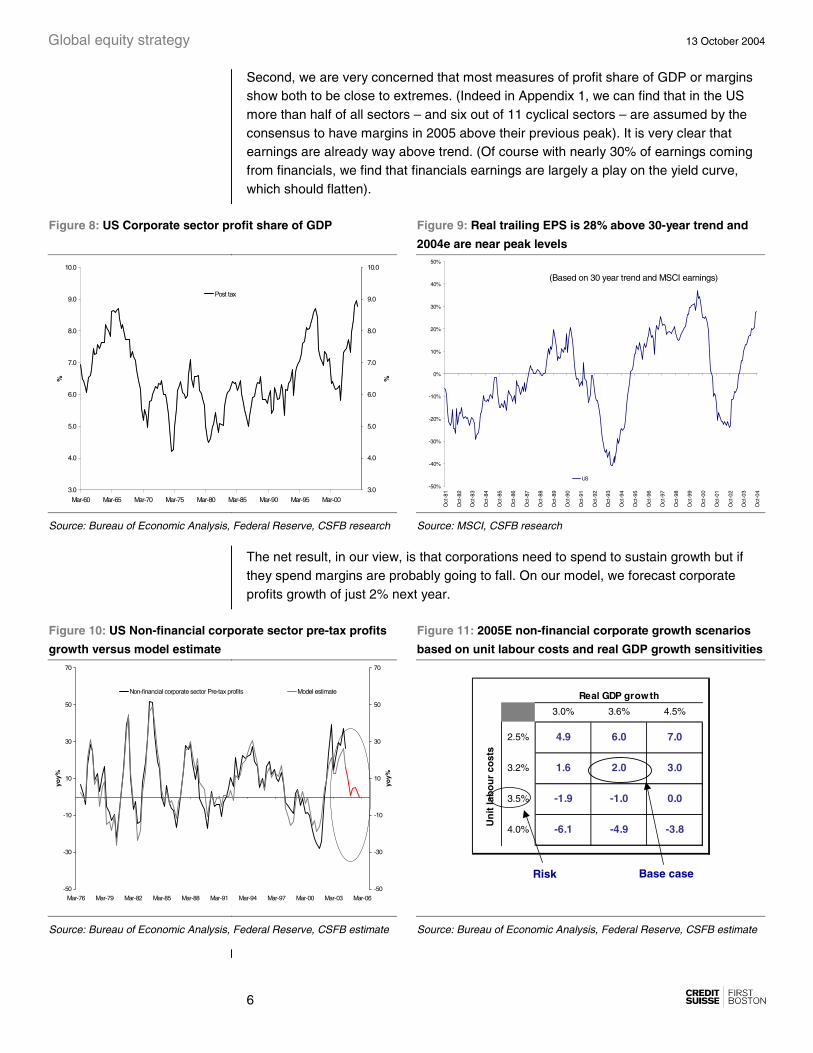
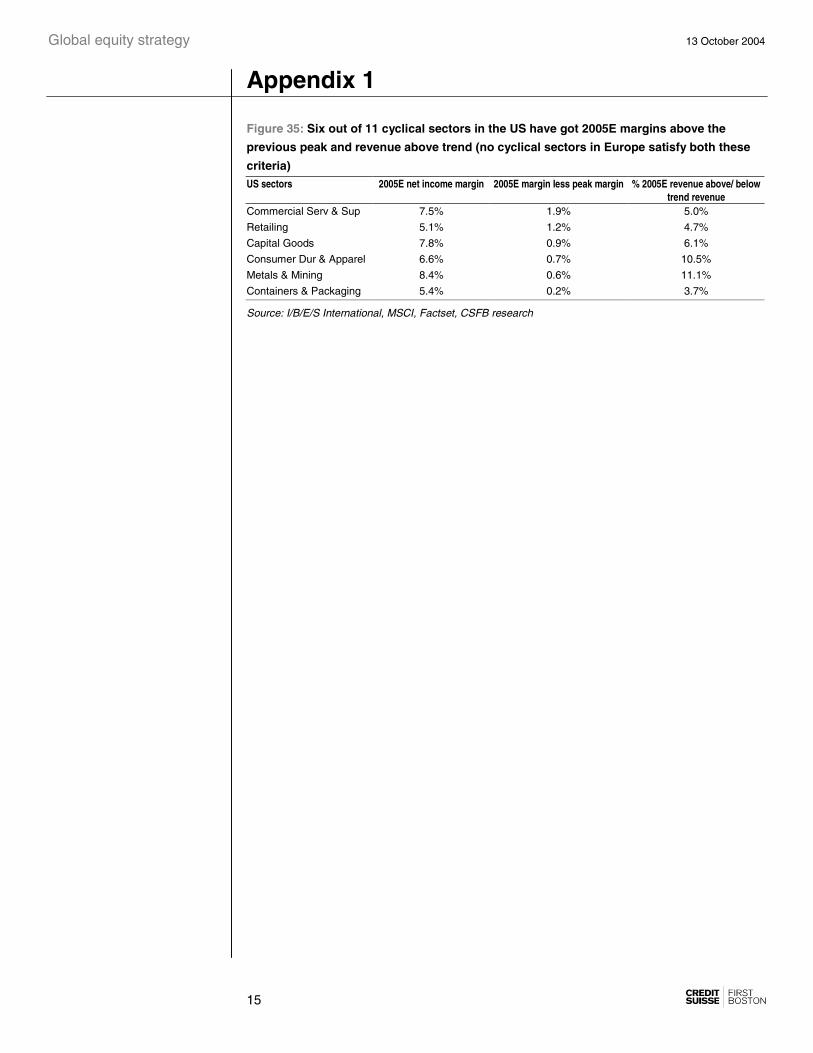
Second, we are very concerned that most measures of profit share of GDP or margins show both to be close to extremes. (Indeed in Appendix 1, we can find that in the US more than half of all sectors – and six out of 11 cyclical sectors – are assumed by the consensus to have margins in 2005 above their previous peak). It is very clear that earnings are already way above trend. (Of course with nearly 30% of earnings coming from financials, we find that financials earnings are largely a play on the yield curve, which should flatten).
Figure 8: US Corporate sector profit share of GDP Figure 9: Real trailing EPS is 28% above 30-year trend and
2004e are near peak levels
3.0
4.0
5.0
6.0
7.0
8.0
9.0
10.0
Mar-60 Mar-65 Mar-70 Mar-75 Mar-80 Mar-85 Mar-90 Mar-95 Mar-00
%
3.0
4.0
5.0
6.0
7.0
8.0
9.0
10.0
%
Post tax
-50%
-40%
-30%
-20%
-10%
0%
10%
20%
30%
40%
50%
Oct
-81
Oct
-82
Oct
-83
Oct
-84
Oct
-85
Oct
-86
Oct
-87
Oct
-88
Oct
-89
Oct
-90
Oct
-91
Oct
-92
Oct
-93
Oct
-94
Oct
-95
Oct
-96
Oct
-97
Oct
-98
Oct
-99
Oct
-00
Oct
-01
Oct
-02
Oct
-03
Oct
-04
US
(Based on 30 year trend and MSCI earnings)
-50%
-40%
-30%
-20%
-10%
0%
10%
20%
30%
40%
50%
Oct
-81
Oct
-82
Oct
-83
Oct
-84
Oct
-85
Oct
-86
Oct
-87
Oct
-88
Oct
-89
Oct
-90
Oct
-91
Oct
-92
Oct
-93
Oct
-94
Oct
-95
Oct
-96
Oct
-97
Oct
-98
Oct
-99
Oct
-00
Oct
-01
Oct
-02
Oct
-03
Oct
-04
US
(Based on 30 year trend and MSCI earnings)
Source: Bureau of Economic Analysis, Federal Reserve, CSFB research Source: MSCI, CSFB research
The net result, in our view, is that corporations need to spend to sustain growth but if they spend margins are probably going to fall. On our model, we forecast corporate profits growth of just 2% next year.
Figure 10: US Non-financial corporate sector pre-tax profits
growth versus model estimate
Figure 11: 2005E non-financial corporate growth scenarios
based on unit labour costs and real GDP growth sensitivities
-50
-30
-10
10
30
50
70
Mar-76 Mar-79 Mar-82 Mar-85 Mar-88 Mar-91 Mar-94 Mar-97 Mar-00 Mar-03 Mar-06
yoy%
-50
-30
-10
10
30
50
70
yoy%
Non-financial corporate sector Pre-tax profits Model estimate
3.0% 3.6% 4.5%
2.5% 4.9 6.0 7.0
3.2% 1.6 2.0 3.0
3.5% -1.9 -1.0 0.0
4.0% -6.1 -4.9 -3.8
Real GDP growth
Un
it la
bo
ur
cost
s
Base caseRisk
Source: Bureau of Economic Analysis, Federal Reserve, CSFB estimate Source: Bureau of Economic Analysis, Federal Reserve, CSFB estimate
Global equity strategy 13 October 2004
7
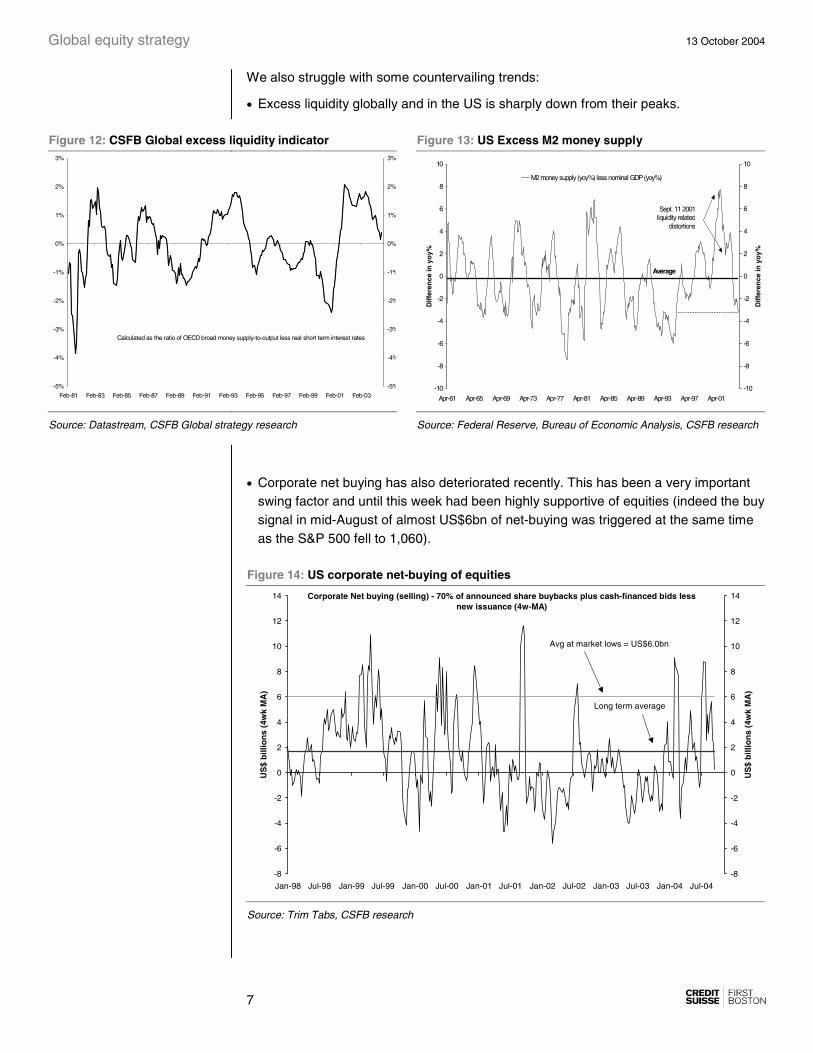
We also struggle with some countervailing trends:
• Excess liquidity globally and in the US is sharply down from their peaks.
Figure 12: CSFB Global excess liquidity indicator Figure 13: US Excess M2 money supply
-5%
-4%
-3%
-2%
-1%
0%
1%
2%
3%
Feb-81 Feb-83 Feb-85 Feb-87 Feb-89 Feb-91 Feb-93 Feb-95 Feb-97 Feb-99 Feb-01 Feb-03-5%
-4%
-3%
-2%
-1%
0%
1%
2%
3%
Calculated as the ratio of OECD broad money supply-to-output less real short term interest rates
-10
-8
-6
-4
-2
0
2
4
6
8
10
Apr-61 Apr-65 Apr-69 Apr-73 Apr-77 Apr-81 Apr-85 Apr-89 Apr-93 Apr-97 Apr-01
Dif
fere
nce
in y
oy%
-10
-8
-6
-4
-2
0
2
4
6
8
10
Dif
fere
nce
in y
oy%
M2 money supply (yoy%) less nominal GDP (yoy%)
Average
Sept. 11 2001 liquidity related
distortions
Source: Datastream, CSFB Global strategy research Source: Federal Reserve, Bureau of Economic Analysis, CSFB research
• Corporate net buying has also deteriorated recently. This has been a very important swing factor and until this week had been highly supportive of equities (indeed the buy signal in mid-August of almost US$6bn of net-buying was triggered at the same time as the S&P 500 fell to 1,060).
Figure 14: US corporate net-buying of equities
Corporate Net buying (selling) - 70% of announced share buybacks plus cash-financed bids less new issuance (4w-MA)
-8
-6
-4
-2
0
2
4
6
8
10
12
14
Jan-98 Jul-98 Jan-99 Jul-99 Jan-00 Jul-00 Jan-01 Jul-01 Jan-02 Jul-02 Jan-03 Jul-03 Jan-04 Jul-04
US
$ b
illio
ns
(4w
k M
A)
-8
-6
-4
-2
0
2
4
6
8
10
12
14
US
$ b
illio
ns
(4w
k M
A)
Long term average
Avg at market lows = US$6.0bn
Source: Trim Tabs, CSFB research

Global equity strategy 13 October 2004
8
• Normally, a tight trading range for the S&P 500 has been followed by a break-down rather than a break-up
Figure 15: S&P 500 index breakouts from trading ranges
have usually been to the downside
Figure 16: S&P 500 index breakouts from trading ranges
have usually been to the downside
-6%
-4%
-2%
0%
2%
4%
6%
8%
10%
12%
1 5 9 13 17 21 25 29 33 37 41 45 49 53 57 61 65 69
Number of weeks
% c
hg
rel
. to
sta
rt o
f tr
adin
g r
ang
e
-6%
-4%
-2%
0%
2%
4%
6%
8%
10%
12%
% c
hg
rel
. to
sta
rt o
f tr
adin
g r
ang
e
Sept 80 to Aug 81 Apr 83 to Feb 84 Jul 89 to Aug 90
Dec 91 to Nov 92 Nov 99 to Oct 00 Dec 03 to current
Start End # of wks Direction of breakout
Sep-80 Aug-81 49 Downward
Apr-83 Feb-84 41 Downward
Jul-89 Aug-90 58 Downward
Dec-91 Nov-92 47 Upward
Nov-99 Oct-00 50 Downward
Present episode
Dec-03 Current 42.2 ?
Source: Datastream, CSFB research Source: Datastream, CSFB research
Additionally, we would note that thus far this year, the S&P 500 has achieved successively lower highs and successively lower lows. The only slight positive has been a general improvement in breadth.
Figure 17: The S&P 500’s trading range has seen
successively lower highs and successively lower lows
Figure 18: Market breadth (200 day moving average of
advances less declines) is still positive
1050
1070
1090
1110
1130
1150
1170
Jan-04 Feb-04 Mar-04 Apr-04 May-04 Jun-04 Jul-04 Aug-04 Sep-04 Oct-04 Nov-04 Dec-04
1050
1070
1090
1110
1130
1150
1170
1.9
2.1
2.3
2.5
2.7
2.9
3.1
3.3
Oct
-80
Oct
-81
Oct
-82
Oct
-83
Oct
-84
Oct
-85
Oct
-86
Oct
-87
Oct
-88
Oct
-89
Oct
-90
Oct
-91
Oct
-92
Oct
-93
Oct
-94
Oct
-95
Oct
-96
Oct
-97
Oct
-98
Oct
-99
Oct
-00
Oct
-01
Oct
-02
Oct
-03
Oct
-04
90
100
110
120
130
140
150
160
S&P500 (log) S&P cummulative advance-decline 200 day moving average (rhs)
Source: Datastream, CSFB research Source: Datastream, CSFB research
• We never saw capitulation at the market low. For example, at previous market lows, CSFB’s Global risk appetite indicator has been in sharply negative territory as opposed to relatively neutral levels as occurred on this occasion.

Global equity strategy 13 October 2004
9
Figure 19: Global risk appetite indicator
-8.00
-6.00
-4.00
-2.00
0.00
2.00
4.00
6.00
8.00
10.00
12.00
Jan-
81
Jan-
83
Jan-
85
Jan-
87
Jan-
89
Jan-
91
Jan-
93
Jan-
95
Jan-
97
Jan-
99
Jan-
01
Jan-
03
P revious market lows =
Source: Datastream, CSFB Global Strategy research
• And finally, as we stated above, normally equities have troughed a couple of months ahead of the trough in ISM or quarterly annualised lead indicators. We suspect that lead indicators measured on this basis may trough closer to January/February.
Figure 20: The S&P 500 troughs on average two-months
prior to a trough in the OECD lead indicator (on a quarterly
annualised basis)
Figure 21: The S&P 500 troughs on average one-month prior
to the trough in the ISM New orders index
Trough in OECD Lead indicator (3mth/3mth%)
Trough in S&P 500Number of months
gap% chg in S&P
500 next 3mths
Jun-82 Jul-82 1 22%
Aug-84 Jul-84 -1 10%
Jan-88 Nov-87 -2 15%
Nov-90 Oct-90 -1 12%
Oct-92 n/a n.a n.a
Apr-95 Dec-94 -4 9%
Oct-98 Aug-98 -2 20%
Mar-01 n/a n.a n.a
Oct-02 Sep-02 -1 8%Average -2 14%
Trough in ISM index Trough in S&P 500 Number of months gap
% chg in S&P 500 next 3mths
Nov-81 Jul-82 9 22%
Sep-84 Jul-84 -2 10%
Jan-91 Oct-90 -3 12%
Jun-95 Dec-94 -7 9%
Nov-98 Aug-98 -3 20%
Jan-01 n.a n.a n.a
Oct-02 Sep-02 -1 8%
Apr-03 Mar-03 -1 14%
Average -1 13%
Source: OECD, Datastream, CSFB research Source: Institute of Supply Managers, Datastream, CSFB research

Global equity strategy 13 October 2004
10
What about bonds? We would remain 5% underweight of bonds, highlighting five important developments:
(i) Investor sentiment has clearly turned. For example, the speculative net-short positions in CBOT Treasury bond futures (that existed since March) have now fully reversed.
Figure 22: Speculative net-positions in CBOT 10-year Treasury futures
-250
-200
-150
-100
-50
0
50
100
150
Jan-97 Mar-94 Apr-95 Jun-96 Aug-97 Oct-98 Nov-99 Jan-01 Mar-02 May-03 Jul-04
Net
-co
ntr
acts
(00
0's)
-250
-200
-150
-100
-50
0
50
100
150
Net
-co
ntr
acts
(00
0's)
Source: Commodity Futures Trading Commission, CSFB research
(ii) Our models for real and nominal 10-year US Treasury bond yields continue to suggest that at current levels, yields are clearly overvalued. (Our model for nominal yields suggests fair-value is 4.9% assuming a 2% Fed Funds rate by year-end).
Figure 23: Real US 10-year Treasury bond yield versus model estimate
Figure 24: Nominal US 10-year Treasury bond yield versus Model estimate
-2.0
0.0
2.0
4.0
6.0
8.0
10.0
Jun-66 Jun-71 Jun-76 Jun-81 Jun-86 Jun-91 Jun-96 Jun-01
%
-2.0
0.0
2.0
4.0
6.0
8.0
10.0
%
Real bond yield (based on core PCE deflator)
Model estimate
10-year TIP yield
2
3
4
5
6
7
8
9
10
Jan-88 Jul-89 Jan-91 Jul-92 Jan-94 Jul-95 Jan-97 Jul-98 Jan-00 Jul-01 Jan-03 Jul-04
%
2
3
4
5
6
7
8
9
10
%
10-year US Treasury bond yield Estimated fair value
Fair-value profile assuming core CPI rises to 2% and a Fed Funds rate of 2% by end 2004
Source: ISM, BLS, BEA, Federal Reserve, CSFB research Source: ISM, BLS, Federal Reserve, CSFB research

Global equity strategy 13 October 2004
11
(iii) Cyclicals appear to be clearly saying something completely different about global growth than bond yields.
Figure 25: Global cyclicals relative to defensives versus 10-year US bond yield
3.0
3.5
4.0
4.5
5.0
5.5
6.0
6.5
7.0
7.5
Jan-97 Jan-98 Jan-99 Jan-00 Jan-01 Jan-02 Jan-03 Jan-04 Jan-05
Yie
ld (
%)
0.40
0.45
0.50
0.55
0.60
0.65
0.70
0.75
0.80
0.85
0.90
Pri
ce r
elat
ive
10y US Treasury bond yield (%), LHS
Cyclicals/defensives price relative, RHS
Breakdown in usual relationship
Source: Datastream, CSFB research
(iv) As are metals prices.
Figure 26: Metal prices versus 10-year US bond yield
40
60
80
100
120
140
160
Oct
-86
Apr
-87
Oct
-87
Apr
-88
Oct
-88
Apr
-89
Oct
-89
Apr
-90
Oct
-90
Apr
-91
Oct
-91
Apr
-92
Oct
-92
Apr
-93
Oct
-93
Apr
-94
Oct
-94
Apr
-95
Oct
-95
Apr
-96
Oct
-96
Apr
-97
Oct
-97
Apr
-98
Oct
-98
Apr
-99
Oct
-99
Apr
-00
Oct
-00
Apr
-01
Oct
-01
Apr
-02
Oct
-02
Apr
-03
Oct
-03
Apr
-04
Oct
-04
3
4
5
6
7
8
9
10
11
12
13
Economist Commodity Inds/Metals ($ price index) - LHS US 10-year bond yield - RHS
Source: Datastream, CSFB research

Global equity strategy 13 October 2004
12
(v) Finally, we do think that growth may undergo a mild reacceleration given the following:
• Chinese growth is muddling along (for example, industrial production is still growing at double-digit year on year rate and retail sales growth is at a seven-year high). We continue to believe that growth in China will not decelerate sharply until there is either a major current account deficit or a significant non-food inflation problem
Figure 27: Chinese industrial production growth (yoy%) Figure 28: Chinese retail sales growth (yoy%)
5
7
9
11
13
15
17
19
21
23
25
Jan-
95
Jun-
95
Nov
-95
Apr
-96
Sep
-96
Feb
-97
Jul-9
7
Dec
-97
May
-98
Oct
-98
Mar
-99
Aug
-99
Jan-
00
Jun-
00
Nov
-00
Apr
-01
Sep
-01
Feb
-02
Jul-0
2
Dec
-02
May
-03
Oct
-03
Mar
-04
Aug
-04
Industrial production (% yoy)
0
5
10
15
20
25
30
35
40
45
Jan-
94
Sep
-94
May
-95
Jan-
96
Sep
-96
May
-97
Jan-
98
Sep
-98
May
-99
Jan-
00
Sep
-00
May
-01
Jan-
02
Sep
-02
May
-03
Jan-
04
Sep
-04
Retail sales (% yoy)
Source: National Statistics Bureau, CSFB research Source: National Statistics Bureau, CSFB research
• The best proxies we use for US nonfarm payroll growth (initial jobless claims and the ISM employment indices) indicate that job growth should reaccelerate to around 200,000 per month from a three-month moving average of 103,000 (and a 12-month average of 142,000).
Figure 29: US Initial jobless claims versus Change in Non-
farm payrolls
Figure 30: ISM Non-manufacturing employment index versus
Change in services payrolls
260
310
360
410
460
510
Dec-85 Sep-88 Jun-91 Mar-94 Dec-96 Aug-99 May-02 Feb-05
Job
less
cla
ims
(000
s) In
vert
ed a
xis
-400
-300
-200
-100
0
100
200
300
400
Pay
olls
(00
0s)
Initial jobless claims, 000s (4wk MA), LHS inverted axis
Change in NF payrolls, 000s RHS
40
42
44
46
48
50
52
54
56
58
60
Jan-97 Oct-97 Jul-98 Apr-99 Jan-00 Oct-00 Jul-01 Apr-02 Jan-03 Oct-03 Jul-04
ISM
ind
ex
-300
-200
-100
0
100
200
300
400
Ch
ang
e in
pay
rolls
(00
0's)
ISM Non-manufacturing Employment index (LHS)
Change in private sector Services payrolls, 3MMAV (RHS)
Source: Bureau of Labour Statistics, CSFB research Source: Bureau of Labour Statistics, CSFB research

Global equity strategy 13 October 2004
13
• Long-cycle capital spending in the US is now recovering, after lagging short-cycle spend (as is traditionally the case).
Figure 31: US long-cycle versus short-cycle capex (yoy%)
-20%
-10%
0%
10%
20%
30%
40%
'61 '64 '67 '70 '73 '76 '79 '82 '85 '88 '91 '94 '97 '00 '03-20%
-10%
0%
10%
20%
30%
40%
short-life assets(< 5 years economic life)
long-life assets(>10 years economic life)
Source: Bureau of Economic Analysis, CSFB research
• Finally, we are seeing a tepid recovery in both the European and Japanese consumer.
Figure 32: Euro area retail sales (including autos) versus real
consumption
Figure 33: Japanese Consumer confidence has risen
strongly and should allow some re-acceleration in
household spending
-2
-1
0
1
2
3
4
5
Jan-81 Jan-83 Jan-85 Jan-87 Jan-89 Jan-91 Jan-93 Jan-95 Jan-97 Jan-99 Jan-01 Jan-03
yoy%
(3M
MA
V)
-4
-3
-2
-1
0
1
2
3
4
5
6
yoy%
(3M
MA
V)
Euro area retail sales incl autos (yoy%, 3MMAV), RHS
Real consumption (yoy%, 3MMAV), LHS
-5
-3
-1
1
3
5
7
Nov-01 Mar-02 Jul-02 Nov-02 Mar-03 Jul-03 Nov-03 Mar-04 Jul-04
Sp
end
ing
(yo
y%)
35
37
39
41
43
45
47
49
51
Co
nfi
den
ce in
dex
Houshold spending yoy% 3MMAV (LHS) Overall consumer confidence (RHS)
Source: Eurostat, CSFB research Source: Cabinet Office, CSFB estimates

Global equity strategy 13 October 2004
14
Figure 34: Recommended asset allocation (%) Benchmark weight Recommended weight
Equities 60 60
Bonds 30 25
Cash 10 15
Source: CSFB estimates
Global equity strategy 13 October 2004
15
Appendix 1
Figure 35: Six out of 11 cyclical sectors in the US have got 2005E margins above the
previous peak and revenue above trend (no cyclical sectors in Europe satisfy both these
criteria) US sectors 2005E net income margin 2005E margin less peak margin % 2005E revenue above/ below
trend revenue Commercial Serv & Sup 7.5% 1.9% 5.0%
Retailing 5.1% 1.2% 4.7%
Capital Goods 7.8% 0.9% 6.1%
Consumer Dur & Apparel 6.6% 0.7% 10.5%
Metals & Mining 8.4% 0.6% 11.1%
Containers & Packaging 5.4% 0.2% 3.7%
Source: I/B/E/S International, MSCI, Factset, CSFB research
Global equity strategy 13 October 2004
16
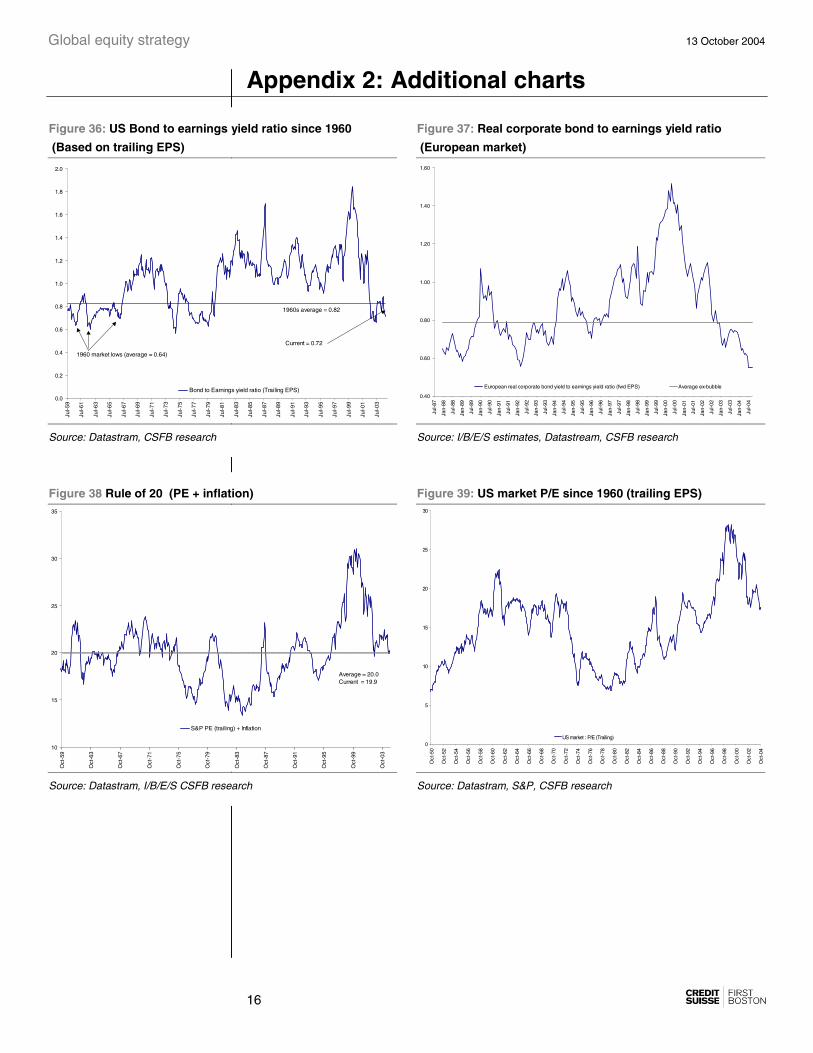
Appendix 2: Additional charts
Figure 36: US Bond to earnings yield ratio since 1960
(Based on trailing EPS)
Figure 37: Real corporate bond to earnings yield ratio
(European market)
0.0
0.2
0.4
0.6
0.8
1.0
1.2
1.4
1.6
1.8
2.0
Jul-5
9
Jul-6
1
Jul-6
3
Jul-6
5
Jul-6
7
Jul-6
9
Jul-7
1
Jul-7
3
Jul-7
5
Jul-7
7
Jul-7
9
Jul-8
1
Jul-8
3
Jul-8
5
Jul-8
7
Jul-8
9
Jul-9
1
Jul-9
3
Jul-9
5
Jul-9
7
Jul-9
9
Jul-0
1
Jul-0
3
Bond to Earnings yield ratio (Trailing EPS)
1960s average = 0.82
1960 market lows (average = 0.64)
Current = 0.72
0.40
0.60
0.80
1.00
1.20
1.40
1.60
Jul-8
7
Jan-
88
Jul-8
8
Jan-
89
Jul-8
9
Jan-
90
Jul-9
0
Jan-
91
Jul-9
1
Jan-
92
Jul-9
2
Jan-
93
Jul-9
3
Jan-
94
Jul-9
4
Jan-
95
Jul-9
5
Jan-
96
Jul-9
6
Jan-
97
Jul-9
7
Jan-
98
Jul-9
8
Jan-
99
Jul-9
9
Jan-
00
Jul-0
0
Jan-
01
Jul-0
1
Jan-
02
Jul-0
2
Jan-
03
Jul-0
3
Jan-
04
Jul-0
4
European real corporate bond yield to earnings yield ratio (fwd EPS) Average ex-bubble
Source: Datastram, CSFB research Source: I/B/E/S estimates, Datastream, CSFB research
Figure 38 Rule of 20 (PE + inflation) Figure 39: US market P/E since 1960 (trailing EPS)
10
15
20
25
30
35
Oct
-59
Oct
-63
Oct
-67
Oct
-71
Oct
-75
Oct
-79
Oct
-83
Oct
-87
Oct
-91
Oct
-95
Oct
-99
Oct
-03
S&P PE (trailing) + Inflation
Average = 20.0Current = 19.9
0
5
10
15
20
25
30
Oct
-50
Oct
-52
Oct
-54
Oct
-56
Oct
-58
Oct
-60
Oct
-62
Oct
-64
Oct
-66
Oct
-68
Oct
-70
Oct
-72
Oct
-74
Oct
-76
Oct
-78
Oct
-80
Oct
-82
Oct
-84
Oct
-86
Oct
-88
Oct
-90
Oct
-92
Oct
-94
Oct
-96
Oct
-98
Oct
-00
Oct
-02
Oct
-04
US market : P/E (Trailing)
Source: Datastram, I/B/E/S CSFB research Source: Datastram, S&P, CSFB research
Global equity strategy 13 October 2004
17
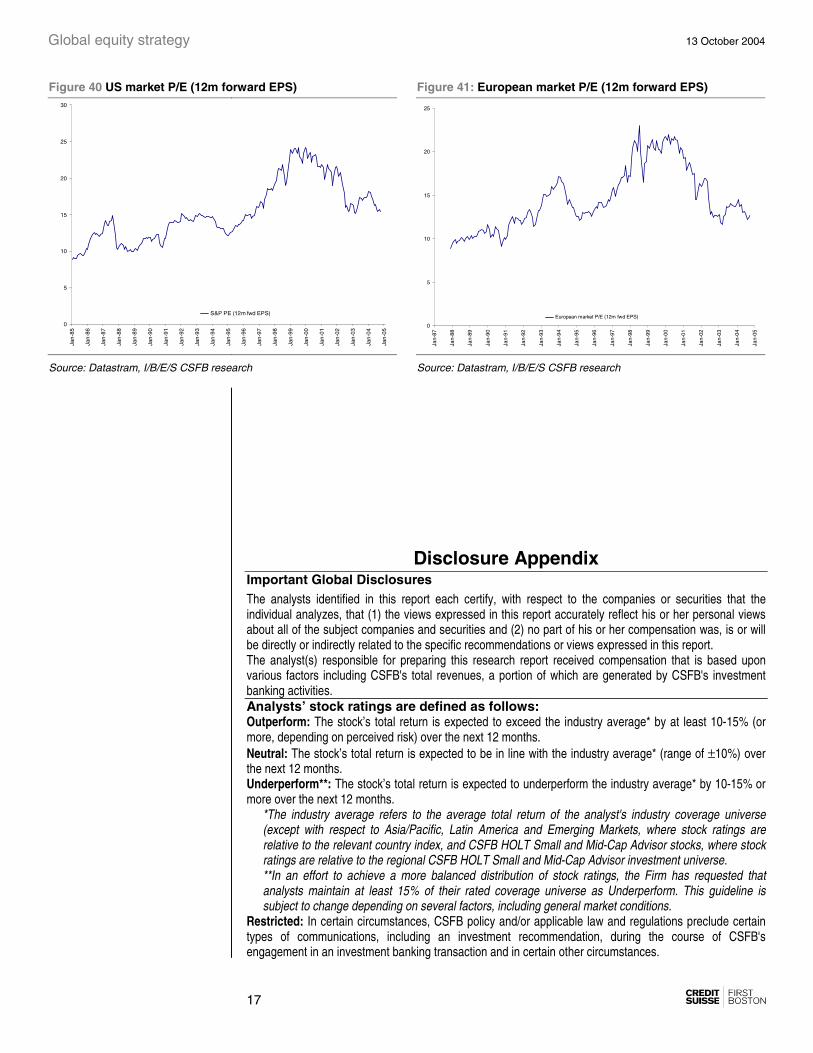
Figure 40 US market P/E (12m forward EPS) Figure 41: European market P/E (12m forward EPS)
0
5
10
15
20
25
30
Jan-
85
Jan-
86
Jan-
87
Jan-
88
Jan-
89
Jan-
90
Jan-
91
Jan-
92
Jan-
93
Jan-
94
Jan-
95
Jan-
96
Jan-
97
Jan-
98
Jan-
99
Jan-
00
Jan-
01
Jan-
02
Jan-
03
Jan-
04
Jan-
05
S&P PE (12m fwd EPS)
0
5
10
15
20
25
Jan-
87
Jan-
88
Jan-
89
Jan-
90
Jan-
91
Jan-
92
Jan-
93
Jan-
94
Jan-
95
Jan-
96
Jan-
97
Jan-
98
Jan-
99
Jan-
00
Jan-
01
Jan-
02
Jan-
03
Jan-
04
Jan-
05
European market P/E (12m fwd EPS)
Source: Datastram, I/B/E/S CSFB research Source: Datastram, I/B/E/S CSFB research
Disclosure Appendix Important Global Disclosures The analysts identified in this report each certify, with respect to the companies or securities that the individual analyzes, that (1) the views expressed in this report accurately reflect his or her personal views about all of the subject companies and securities and (2) no part of his or her compensation was, is or will be directly or indirectly related to the specific recommendations or views expressed in this report. The analyst(s) responsible for preparing this research report received compensation that is based upon various factors including CSFB's total revenues, a portion of which are generated by CSFB's investment banking activities. Analysts’ stock ratings are defined as follows: Outperform: The stock’s total return is expected to exceed the industry average* by at least 10-15% (or more, depending on perceived risk) over the next 12 months. Neutral: The stock’s total return is expected to be in line with the industry average* (range of ±10%) over the next 12 months. Underperform**: The stock’s total return is expected to underperform the industry average* by 10-15% or more over the next 12 months.
*The industry average refers to the average total return of the analyst's industry coverage universe (except with respect to Asia/Pacific, Latin America and Emerging Markets, where stock ratings are relative to the relevant country index, and CSFB HOLT Small and Mid-Cap Advisor stocks, where stock ratings are relative to the regional CSFB HOLT Small and Mid-Cap Advisor investment universe. **In an effort to achieve a more balanced distribution of stock ratings, the Firm has requested that analysts maintain at least 15% of their rated coverage universe as Underperform. This guideline is subject to change depending on several factors, including general market conditions.
Restricted: In certain circumstances, CSFB policy and/or applicable law and regulations preclude certain types of communications, including an investment recommendation, during the course of CSFB's engagement in an investment banking transaction and in certain other circumstances.
Global equity strategy 13 October 2004
18
Volatility Indicator [V]: A stock is defined as volatile if the stock price has moved up or down by 20% or more in a month in at least 8 of the past 24 months or the analyst expects significant volatility going forward. All CSFB HOLT Small and Mid-Cap Advisor stocks are automatically rated volatile. All IPO stocks are automatically rated volatile within the first 12 months of trading.
Analysts’ coverage universe weightings are defined as follows*: Overweight: Industry expected to outperform the relevant broad market benchmark over the next 12 months. Market Weight: Industry expected to perform in-line with the relevant broad market benchmark over the next 12 months. Underweight: Industry expected to underperform the relevant broad market benchmark over the next 12 months. *CSFB HOLT Small and Mid-Cap Advisor stocks do not have coverage universe weightings. CSFB’s distribution of stock ratings (and banking clients) is:
Global Ratings Distribution Outperform/Buy* 39% (56% banking clients) Neutral/Hold* 43% (55% banking clients) Underperform/Sell* 16% (49% banking clients) Restricted 2%
*For purposes of the NYSE and NASD ratings distribution disclosure requirements, our stock ratings of Outperform, Neutral, and Underperform most closely correspond to Buy, Hold, and Sell, respectively; however, the meanings are not the same, as our stock ratings are determined on a relative basis. (Please refer to definitions above.) An investor's decision to buy or sell a security should be based on investment objectives, current holdings, and other individual factors.
Important Canadian Disclosures Restrictions on certain Canadian securities are indicated by the following abbreviations: NVS--Non-Voting shares; RVS--Restricted Voting Shares; SVS--Subordinate Voting Shares. Individuals receiving this report from a Canadian investment dealer that is not affiliated with CSFB should be advised that this report may not contain regulatory disclosures the non-affiliated Canadian investment dealer would be required to make if this were its own report. For Credit Suisse First Boston Canada Inc.'s policies and procedures regarding the dissemination of equity research, please visit http://www.csfb.com/legal_terms/canada_research_policy.shtml. Important CSFB HOLT Disclosures With respect to the analysis in this report based on the CSFB HOLT methodology, CSFB certifies that (1) the views expressed in this report accurately reflect the CSFB HOLT methodology and (2) no part of the Firm’s compensation was, is, or will be directly related to the specific views disclosed in this report. The CSFB HOLT methodology does not assign ratings to a security. It is an analytical tool that involves use of a set of proprietary quantitative algorithms and warranted value calculations, collectively called the CSFB HOLT valuation model, that are consistently applied to all the companies included in its database. Third-party data (including consensus earnings estimates) are systematically translated into a number of default variables and incorporated into the algorithms available in the CSFB HOLT valuation model. The source financial statement, pricing, and earnings data provided by outside data vendors are subject to quality control and may also be adjusted to more closely measure the underlying economics of firm performance. These adjustments provide consistency when analyzing a single company across time, or analyzing multiple companies across industries or national borders. The default scenario that is produced by the CSFB HOLT valuation model establishes the baseline valuation for a security, and a user then may adjust the default variables to produce alternative scenarios, any of which could occur. Additional information about the CSFB HOLT methodology is available on request. The CSFB HOLT methodology does not assign a price target to a security. The default scenario that is produced by the CSFB HOLT valuation model establishes a warranted price for a security, and as the third-party data are updated, the warranted price may also change. The default variables may also be adjusted to produce alternative warranted prices, any of which could occur. Additional information about the CSFB HOLT methodology is available on request. Important MSCI Disclosures The MSCI sourced information is the exclusive property of Morgan Stanley Capital International Inc. (MSCI). Without prior written permission of MSCI, this information and any other MSCI intellectual property may not be reproduced, re-disseminated or used to create any financial products, including any indices. This information is provided on an “as is” basis. The user assumes the entire risk of any use made of this information. MSCI, its affiliates and any third party involved in, or related to, computing or compiling the

Global equity strategy 13 October 2004
19
information hereby expressly disclaim all warranties of originality, accuracy, completeness, merchantability or fitness for a particular purpose with respect to any of this information. Without limiting any of the foregoing, in no event shall MSCI, any of its affiliates or any third party involved in, or related to, computing or compiling the information have any liability for any damages of any kind. MSCI, Morgan Stanley Capital International and the MSCI indexes are services marks of MSCI and its affiliates.
The Global Industry Classification Standard (GICS) was developed by and is the exclusive property of Morgan Stanley Capital International Inc. and Standard & Poor’s. GICS is a service mark of MSCI and S&P and has been licensed for use by CSFB. For disclosure information on other companies mentioned in this report, please visit the website at www.csfb.com/researchdisclosures or call +1 (877) 291-2683. Disclaimers continue on next page.

Asset allocation update.doc
Disclaimers This report is not directed to, or intended for distribution to or use by, any person or entity who is a citizen or resident of or located in any locality, state, country or other jurisdiction where such distribution, publication, availability or use would be contrary to law or regulation or which would subject Credit Suisse First Boston or its subsidiaries or affiliates (collectively "CSFB") to any registration or licensing requirement within such jurisdiction. All material presented in this report, unless specifically indicated otherwise, is under copyright to CSFB. None of the material, nor its content, nor any copy of it, may be altered in any way, transmitted to, copied or distributed to any other party, without the prior express written permission of CSFB. All trademarks, service marks and logos used in this report are trademarks or service marks or registered trademarks or service marks of CSFB. The information, tools and material presented in this report are provided to you for information purposes only and are not to be used or considered as an offer or the solicitation of an offer to sell or to buy or subscribe for securities or other financial instruments. CSFB may not have taken any steps to ensure that the securities referred to in this report are suitable for any particular investor. CSFB will not treat recipients as its customers by virtue of their receiving the report. The investments or services contained or referred to in this report may not be suitable for you and it is recommended that you consult an independent investment advisor if you are in doubt about such investments or investment services. Nothing in this report constitutes investment, legal, accounting or tax advice or a representation that any investment or strategy is suitable or appropriate to your individual circumstances or otherwise constitutes a personal recommendation to you. CSFB does not offer advice on the tax consequences of investment and you are advised to contact an independent tax adviser. Please note in particular that the bases and levels of taxation may change. CSFB believes the information and opinions in the Disclosure Appendix of this report are accurate and complete. Information and opinions presented in the other sections of the report were obtained or derived from sources CSFB believes are reliable, but CSFB makes no representations as to their accuracy or completeness. Additional information is available upon request. CSFB accepts no liability for loss arising from the use of the material presented in this report, except that this exclusion of liability does not apply to the extent that liability arises under specific statutes or regulations applicable to CSFB. This report is not to be relied upon in substitution for the exercise of independent judgment. CSFB may have issued, and may in the future issue, a trading call regarding this security. Trading calls are short term trading opportunities based on market events and catalysts, while stock ratings reflect investment recommendations based on expected total return over a 12-month period relative to the relevant coverage universe. Because trading calls and stock ratings reflect different assumptions and analytical methods, trading calls may differ directionally from the stock rating. In addition, CSFB may have issued, and may in the future issue, other reports that are inconsistent with, and reach different conclusions from, the information presented in this report. Those reports reflect the different assumptions, views and analytical methods of the analysts who prepared them and CSFB is under no obligation to ensure that such other reports are brought to the attention of any recipient of this report. CSFB and its affiliate companies are involved in many businesses that relate to companies mentioned in this report. These businesses include specialized trading, risk arbitrage, market making, and other proprietary trading. CSFB may, to the extent permitted by law, act upon or use the information or opinions presented herein, or the research or analysis on which they are based, before the material is published. Past performance should not be taken as an indication or guarantee of future performance, and no representation or warranty, express or implied, is made regarding future performance. Information, opinions and estimates contained in this report reflect a judgement at its original date of publication by CSFB and are subject to change without notice. The price, value of and income from any of the securities or financial instruments mentioned in this report can fall as well as rise. The value of securities and financial instruments is subject to exchange rate fluctuation that may have a positive or adverse effect on the price or income of such securities or financial instruments. Investors in securities such as ADR’s, the values of which are influenced by currency volatility, effectively assume this risk. Structured securities are complex instruments, typically involve a high degree of risk and are intended for sale only to sophisticated investors who are capable of understanding and assuming the risks involved. The market value of any structured security may be affected by changes in economic, financial and political factors (including, but not limited to, spot and forward interest and exchange rates), time to maturity, market conditions and volatility, and the credit quality of any issuer or reference issuer. Any investor interested in purchasing a structured product should conduct their own investigation and analysis of the product and consult with their own professional advisers as to the risks involved in making such a purchase. Some investments discussed in this report have a high level of volatility. High volatility investments may experience sudden and large falls in their value causing losses when that investment is realised. Those losses may equal your original investment. Indeed, in the case of some investments the potential losses may exceed the amount of initial investment, in such circumstances you may be required to pay more money to support those losses. Income yields from investments may fluctuate and, in consequence, initial capital paid to make the investment may be used as part of that income yield. Some investments may not be readily realisable and it may be difficult to sell or realise those investments, similarly it may prove difficult for you to obtain reliable information about the value, or risks, to which such an investment is exposed. This report may provide the addresses of, or contain hyperlinks to, websites. Except to the extent to which the report refers to CSFB’s own website material, CSFB has not reviewed the linked site and takes no responsibility for the content contained therein. Such address or hyperlink (including addresses or hyperlinks to CSFB’s own website material) is provided solely for your convenience and information and the content of the linked site does not in any way form part of this document. Accessing such website or following such link through this report or CSFB’s website shall be at your own risk. This report is issued and distributed in Europe (except Switzerland) by Credit Suisse First Boston (Europe) Limited, One Cabot Square, London E14 4QJ, England, which is regulated in the United Kingdom by The Financial Services Authority (“FSA”). This report is being distributed in the United States by Credit Suisse First Boston LLC; in Switzerland by Credit Suisse First Boston; in Canada by Credit Suisse First Boston Canada Inc.; in Brazil by Banco de Investimentos Credit Suisse Boston S.A.; in Japan by Credit Suisse First Boston Securities (Japan) Limited; elsewhere in Asia/Pacific by whichever of the following is the appropriately authorised entity in the relevant jurisdiction: Credit Suisse First Boston (Hong Kong) Limited, Credit Suisse First Boston Australia Equities Limited, Credit Suisse First Boston (Thailand) Limited, CSFB Research (Malaysia) Sdn Bhd, Credit Suisse First Boston Singapore Branch and elsewhere in the world by the relevant authorised affiliate of the above. Research on Taiwanese securities produced by Credit Suisse First Boston, Taipei Branch has been prepared by a registered Senior Business Person. In jurisdictions where CSFB is not already registered or licensed to trade in securities, transactions will only be effected in accordance with applicable securities legislation, which will vary from jurisdiction to jurisdiction and may require that the trade be made in accordance with applicable exemptions from registration or licensing requirements. Non-U.S. customers wishing to effect a transaction should contact a CSFB entity in their local jurisdiction unless governing law permits otherwise. U.S. customers wishing to effect a transaction should do so only by contacting a representative at Credit Suisse First Boston LLC in the U.S. Please note that this report was originally prepared and issued by CSFB for distribution to their market professional and institutional investor customers. Recipients who are not market professional or institutional investor customers of CSFB should seek the advice of their independent financial advisor prior to taking any investment decision based on this report or for any necessary explanation of its contents. This research may relate to investments or services of a person outside of the UK or to other matters which are not regulated by the FSA or in respect of which the protections of the FSA for private customers and/or the UK compensation scheme may not be available, and further details as to where this may be the case are available upon request in respect of this report. Copyright Credit Suisse First Boston, and its subsidiaries and affiliates, 2004. All rights reserved.
ASIA/PACIFIC: +852 2101-6000 EUROPE: +44 (20) 7888-8888 UNITED STATES OF AMERICA: +1 (212) 325-2000